NatureScot Research Report 1373 - 2023 South Arran dive survey: infaunal and PSA analyses of diver-collected sediment samples from the South Arran MPA
Published: 2025
Authors: Ellen Purdue, Søren Pears and Tim Worsfold (APEM Ltd).
Cite as: Purdue, E., Pears, S., and Worsfold, T. 2025. 2023 South Arran dive survey: infaunal and PSA analyses of diver-collected sediment samples from the South Arran MPA. NatureScot Research Report 1373.
Keywords
Marine Protected Area; South Arran; marine survey; maerl beds; seagrass beds; seabed habitats; infauna; Particle Size Analysis; Priority Marine Feature
Background
The South Arran Marine Protected Area (MPA) was designated in 2014 by the Scottish Government as one of a network of 247 MPAs in Scottish waters, with fisheries management measures coming into force in 2016. Between 27th of August to 31st of August 2023 a survey commissioned by NatureScot was carried out at the South Arran MPA. A total of eighteen diver core samples were collected from six locations within the MPA, five of which were previously sampled in 2014, to determine the current condition and distribution of the maerl, coarse sediment and seagrass habitats.
APEM Ltd were commissioned to carry out analysis of the macrobenthic and Particle Size Analysis (PSA) samples and report on the findings, including the assignment of biotopes to the samples.
Main findings
- Six monitoring sites within and around the South Arran MPA were surveyed using diver operated sediment cores for infaunal analysis, PSA and TOC. Five of the sites were within the MPA boundary (four within maerl beds, one within a seagrass bed) and were previously surveyed in 2014; the sixth site (Merkland Point) targeted a maerl bed outside the MPA boundary and was not sampled during the previous survey.
- The maerl bed samples were assigned to two main biotopes (MB3222; SS.SMp.Mrl.Lgla and MC3212; cf. SS.SCS.CCS.MedLumVen) based on the dominant infaunal taxa and substrate types, but in reality, these habitats will overlap and may also be intermediate with adjacent macrophyte-dominated habitats.
- The seagrass bed samples had lower numbers of taxa than the maerl and coarse sediment sites and were considered to belong to an impoverished variant of the fine muddy sand habitat MB5236; cf. SS.SSa.IMuSa.FfabMag but should be considered intermediate with the seagrass biotope MB5223, SS.SMp.SSgr.Zmar and may also overlap with infralittoral sand habitats (MB523; SS.SSa.IFiSa).
- The four maerl bed sites within the South Arran MPA boundary appear to have increased in diversity compared with data collected from the same monitoring sites in 2014 (SAR01_HI22, SAR02_HIN02, SAR04_HIN04 and SAR06_LBN). An analysis of change between 2014 and 2023 based on results of diver-based MNCR phase II surveys is reported by Doggett et al. (2025).
- Two non-native species were recorded in the South Arran samples: the tetrasporophyte phase of the algae Bonnemaisonia hamifera was found in nine samples from four monitoring sites and one individual of the polychaete Goniadella gracilis was found in one sample. B. hamifera was also identified by divers during the survey, along with the siphoned Japan weed (Dasysiphonia japonica; Doggett et al., 2025).
Abbreviations
Cf. Used as a prefix to a JNCC biotope code to indicate that the habitat differs from the standard JNCC biotope description in Connor et al., 2004)
Community of Arran Seabed Trust (COAST)
Covariance (CV)
Drop-down Video (DDV)
European Nature Information System (EUNIS)
Industrial Denatured Alcohol (IDA)
Joint Nature Conservation Committee (JNCC)
Kenneth Pye Associates Ltd (KPAL)
Loss on Ignition (LOI)
Marine Nature Conservation Review (MNCR)
Marine Protected Area (MPA)
Multi-Dimensional Scaling (MDS)
National Museums Scotland (NMS)
Northeast Atlantic Marine Biological Quality Control (NMBAQC)
No Take Zone (NTZ)
Particle Size Analysis (PSA)
Scottish Natural Heritage (SNH)
Total Organic Carbon (TOC)
Introduction
The South Arran Marine Protected Area (MPA) was designated in 2014 by the Scottish Government as one of a network of 33 new MPAs in Scottish waters.
A diver survey was carried out in August 2023 to inform a condition assessment of three of the Scottish Priority Marine Features (PMF) for which the South Arran MPA was designated: maerl beds, maerl or coarse shell gravel with burrowing sea cucumbers and seagrass beds. These PMFs also constitute the sandbank sub features ‘seagrass beds’ and ‘maerl beds’ of the Annex I habitat ‘Sandbanks which are slightly covered by sea water all the time’. At the time of designation, the South Arran maerl beds were deemed to be in an unfavourable condition based on available evidence and were therefore assigned a ‘recover’ conservation objective (Marine Scotland, 2014). Two previous monitoring surveys were carried out in 2014 and 2015 (Mercer et al., 2018).
Six sampling locations were surveyed with diver cores within and around the MPA. Five of the sites were within the MPA boundary (four within maerl beds, one within a seagrass bed) and were previously surveyed in a 2014; the sixth site (Merkland Point) targeted a maerl bed outside the MPA boundary and was not sampled during the previous survey.
Methods
Sample collection
The survey work was completed between the 27th and 31st of August 2023 by divers using the vessel ‘RV COAST Explorer’, operated by the Community of Arran Seabed Trust (COAST). A total of eighteen infaunal samples and six PSA samples were collected from six monitoring sites. Full details of each sampling site are listed in Table 1 and the positions are mapped in Figure 1. Five of the monitoring sites (SAR01_HI22, SAR02_HIN02, SAR03_MLP, SAR04_HIN04 and SAR06_LBN) targeted maerl bed habitats whilst the sixth (SAR07_WBZ) located in Whiting Bay targeted seagrass bed habitat. At each location, three 10 cm diameter cores were driven into the sediment to a minimum depth of 20 cm before being securely capped and retained for infaunal sediment analysis. A fourth core was collected and subsampled for PSA.
Table 1. Details of diver core monitoring sites targeted during the 2023 Arran survey.
Site label | Previous label | Dive site name | Latitude | Longitude | Depth (m) | Date surveyed |
|---|---|---|---|---|---|---|
SAR01 | HI22 | Holy Isle south | 55.51069 | -5.06223 | 10.1 | 27/08/2023 |
SAR02 | HIN02 | Holy Isle north | 55.53564 | -5.07231 | 10.5 | 27/08/2023 |
SAR03 | MLP | Merkland Point | 55.61590 | -5.12654 | 13 | 28/08/2023 |
SAR04 | HIN04 | Holy Isle north | 55.53867 | -5.07758 | 10 | 29/08/2023 |
SAR06 | LBN | Lamlash Bay north | 55.54604 | -5.08872 | 14.9 | 31/08/2023 |
SAR07 | WBZ | Whiting Bay | 55.49753 | -5.08788 | 6.5 | 31/08/2023 |
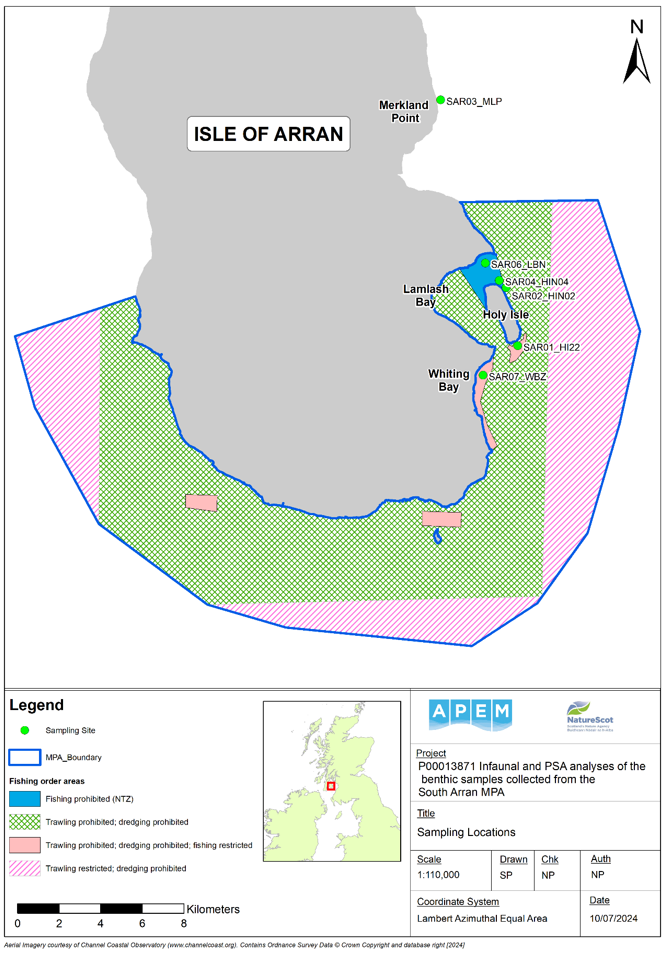
Figure 1. Map showing the six monitoring sites surveyed in 2023 in relation to the South Arran Marine Protected Area (MPA) boundary and fishing order areas.
Click for a full description
Map of South Arran with six monitoring sites from which diver cores were collected marked in light green. No cores were possible at site SAR05 due to the presence of only a thin veneer of sediment over hard substrate.
SAR01_HI22 (Holy Isle south)
SAR02_HIN02 (Holy Isle north, outside the No Take Zone)
SAR03_MLP (Merkland Point (outside the MPA boundary))
SAR04_HIN04 (Holy Isle north, inside the No Take Zone)
SAR06_LBN (Lamlash Bay north)
SAR07_WBZ (Whiting Bay seagrass bed)
A polygon representing the boundary of the South Arran Marine Protected Area (MPA) is shown as a dark blue boundary. Fishing order areas are represented by shaded polygons: solid light blue shading denotes ‘fishing prohibited’; green cross-hatching denotes ‘trawling and dredging prohibited’; pale pink shading denotes ‘trawling and dredging prohibited and fishing restricted’; and dark pink diagonal shading denotes ‘trawling restricted and dredging prohibited’.
Particle size analysis
PSA samples were analysed by Kenneth Pye Associates Limited (KPAL), in accordance with NMBAQC Guidelines for PSA for Supporting Biological Analysis (Mason, 2016) to provide data over the complete particle size range allowing determination of the gravel to sand plus mud ratio. Material less than 1.0 mm fraction was analysed via laser diffraction (size range 0.04 µm to 1.0 mm).
Dry sieving was performed in accordance with BS 1377 (1990), BS 410 (2000) and ISO 3310 (2000). Only 2% deviation is accepted between the starting weight and the final post dry sieving weight. Re-weighing and, if necessary, re-sieving was undertaken if the acceptable deviation was exceeded.
Accuracy and precision checks were conducted on nests of dry sieves which were checked on first use and at intervals of approximately 6 months by sieving a certified/traceable polydisperse reference standard (glass beads) and a laboratory reference sample (a well-characterized natural quartz sand).
Laser diffraction was performed in accordance with BS/ISO 13320 (2009). Laser Instrument accuracy and reproducibility is assessed at least at weekly to monthly intervals, depending on instrument usage. Three measurement runs of each of two Coulter certified reference materials (GB500, nominal 500 µm glass beads; and L300, nominal 0.3 µm polystyrene latex) are performed and results for each compared to the respective certified assay sheet. All results should fall within the stated range for the mean value and standard deviation given on the assay certificate. Instrument precision is assessed at the start and at the end of each daily period of operation, or at the start and end of each batch of samples. On each occasion, three measurement runs of a KPAL standard reference material (nominal 500-750 µm glass beads) are performed. Unimodal distribution must be achieved, with a covariance (CV) in the D50 of less than 3 % and a CV in the D10 and D90 parameters of less than 5 % (ISO 13320). The difference between the two average D50 values measured at the start and end of the period of operation should not be greater than 3 %. The difference between the average D10 and D90 values should not be greater than 6 %.
Triplicate measurement runs were also performed in a similar manner on a randomly selected sample from the Arran dive core PSA samples (in this case a sample collected from site SAR02_HIN02) to quantify the instrument measurement repeatability on the unknown sample type (which may be worse than for well-sorted spherical glass beads of uniform composition). For the remaining sediment analysis, one sub-sample from each (thoroughly mixed and homogenised) sediment sample was analysed.
Macrobenthic analysis
Samples were processed according to APEM’s standard operating procedure for marine benthic sample analysis and in compliance with the Northeast Atlantic Marine Biological Analytical Quality Control (NMBAQC) Scheme’s Processing Requirement Protocol (Worsfold et al. 2010).
The benthic core samples were sieved in a fume cupboard over a 1 mm mesh, using sieves certified as conforming to BS410 standard and ISO3310-1, to standardise the sizes of organisms recorded. To improve sorting efficiency, light organic matter and biota were floated off (or elutriated) and sorted separately; samples were then sieved through a stack of 4.0 mm, 2.0 mm and 1.0 mm mesh sieves (fractionation).
Sorting trays were used to examine the larger fractions (retained on meshes greater than 2 mm), with each tray sorted by hand in a methodical manner. The finer fractions were sorted under a stereomicroscope. All biota were extracted and transferred to 70 % industrial denatured alcohol (IDA). Specimens were then identified and enumerated, where applicable. It was not necessary to subsample any of the samples from the South Arran survey.
Taxa were identified to the lowest practicable taxonomic level, using appropriate literature. In most cases, the literature used was as compiled for UK marine biota for the NMBAQC scheme (Worsfold et al. 2020). For some groups (e.g. sponges, nemerteans and nematodes), higher taxonomic levels were used due to the widely acknowledged lack of appropriate identification tools for these groups. Where appropriate, specimens were compared with material maintained within the laboratory reference collection. Nomenclature generally followed the World Register of Marine Species (WoRMS, 2024) and taxon names were reviewed using the WoRMS ‘Match Taxa’ tool to ensure that all naming was current; exceptions to WoRMS nomenclature were made where more recent revisions were known to supersede WoRMS and to standardise names to exclude subgenera and subspecies.
Biomass (wet weight in grams to 4 decimal places) was measured for all countable taxa (total biomass for all specimens of the taxon). Animals were blotted dry before transfer to a tared balance. Taxa weighing less than 0.0001 g were given a nominal weight of 0.0001 g. Completely sessile (barnacles, ascidians, cnidarians and non-countable taxa) taxa were not weighed.
Analysis of the infaunal samples also included the assessment of live maerl fragments. Fragments were removed during the initial sorting process and measured. During the sieve fractionation process described above, maerl fragments larger than 4 mm were separated from the residues and examined before the maximum length of each piece was recorded. A maximum of 50 fragments of maerl were measured for each sample recorded as containing live maerl. It is difficult to assess live maerl fragments in the less than 4 mm fraction so only those retained in the 4 mm fraction were included in the results.
All samples were subject to internal quality assurance procedures. The residues from each sample were secondarily checked by another analyst. The identity of each recorded taxon was secondarily checked by another analyst.
One lot (all specimens from a particular sample) of each recorded taxon was prepared as part of a voucher reference collection supplied to National Museums Scotland (NMS). After selection of NMS voucher material, further examples of each taxon were retained for inclusion in the APEM in-house reference collection. The remainder of the material was retained in vials with taxa combined for each sample.
All data records were checked to ensure accuracy and avoid transcription errors. The entire dataset was then reviewed by a senior taxonomist and anomalous records reviewed. After subsequent changes were made to the database, data were re-exported to ensure consistency between data supplied externally with that held on the APEM database.
Analysis of total organic carbon (TOC) was carried out to quantify the level of organic material within the substrate. TOC was calculated using a loss on ignition (LOI) method. An aliquot of dried and ground sample was weighed, heated in a furnace to the required temperature which was maintained for 4 hours. Samples were weighed again when cooled. The organic carbon content is estimated from the loss in mass. The total loss in mass was calculated and reported as a percentage of the original mass of sample.
Statistical analysis
Calculation of univariate diversity indices (e.g. numbers of taxa, density, diversity, evenness) and multivariate analyses (e.g. Cluster Analysis, MDS), were carried out using PRIMER version 6.1.15 (Clarke & Gorley 2006, Clarke & Warwick 2001).
The DIVERSE component of Primer was used to calculate the following univariate statistics for each sample: total number of taxa (S) and individuals (N), Margalef’s index (d: species richness), Pielou’s index (J′: evenness), Shannon-Wiener (H'(loge), diversity) and Simpson’s dominance index (1-λ‘). In the interest of consistency, colonial taxa such as bryozoans and hydroids only recorded as qualitative ‘presence/absence’ were included when calculating the total number of taxa but excluded from calculation of the total number of individuals and other diversity indices and from the multivariate analyses.
Prior to calculation of Bray-Curtis similarity between samples the data were square-root transformed to down weight the effects of a small number of numerically dominant taxa (Clarke and Warwick, 2001).
Hierarchical cluster analysis was carried out on a Bray-Curtis similarity matrix of the macrobenthic abundance data in order to visualise the biological similarity between samples. The similarity profile (SIMPROF) test was carried out as part of the clustering routine in order to distinguish clusters of samples that cannot be statistically differentiated at the 5 % significance level.
Non-metric multi-dimensional scaling (MDS) was used to further visually explore the relationships between samples. The analysis used the same square-root transformed Bray-Curtis similarity matrix as the hierarchical clustering process described above.
The ‘similarity percentages’ (SIMPER) routine analysis was carried out between cluster groups identified by the SIMPROF test to examine which taxa had the highest contributions to within-group similarity and between-group dissimilarity for each pairing of SIMPROF cluster groups.
Biotope assignment
For each sample, a biotope was assigned based upon faunal composition and sediment type, following the EUNIS (2022) and JNCC shallow water (Connor et al. 2004) classifications. Where the sample differed from the standard JNCC biotope description a cf. prefix was added to the JNCC biotope code.
Results
Particle size analysis
The full results of PSA are provided in Annex 1. The spatial distribution of sediment types is illustrated in Figure 2, which highlights bulk sediment classes (% of gravel, sand and mud) and the results are summarised in the chart in Figure 3.
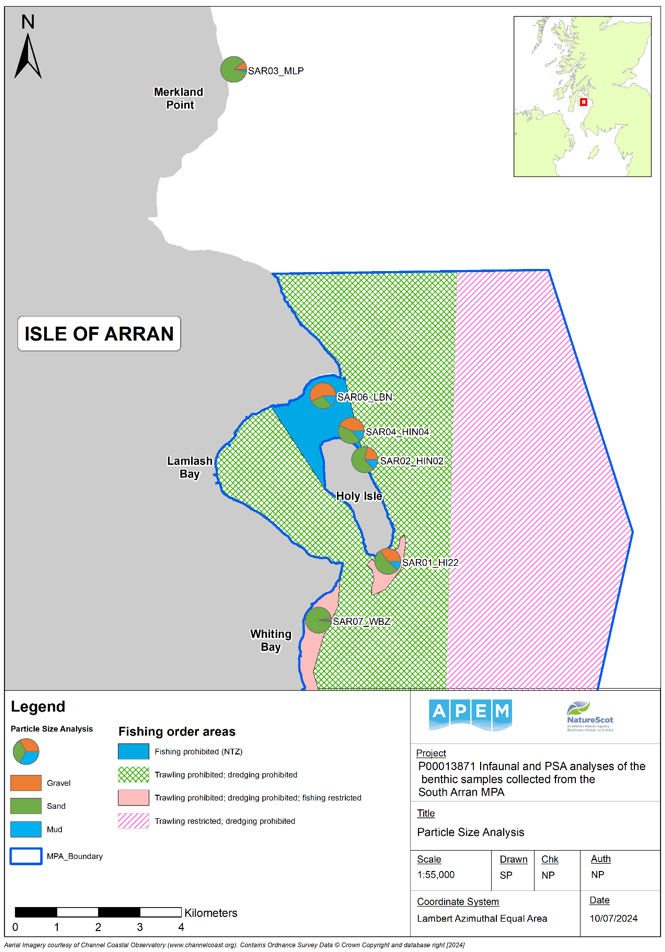
Figure 2. Map showing summary Particle Size Analysis (PSA) bulk size categories for each monitoring site.
Click for a full description
Map of South Arran with pie charts colour-coded for the proportion of each main sediment fraction: proportion of gravel (orange); proportion of sand (green); and the proportion of mud (blue). No cores were possible at site SAR05 due to the presence of only a thin veneer of sediment over hard substrate.
SAR01_HI22 (gravel: 35.09%; sand: 53.55%; mud: 11.63%)
SAR02_HIN02 (gravel: 21.86%; sand: 64.53%; mud: 13.60%)
SAR03_MLP (gravel: 10.5%; sand: 86.70%; mud: 2.80%)
SAR04_HIN04 (gravel: 43.44%; sand: 43.06%; mud: 13.50%)
SAR06_LBN (gravel: 57.41%; sand: 28.34%; mud: 14.26%)
SAR07_WB2 (gravel: 2.69%; sand: 94.87%; mud: 2.44%)
A polygon representing the boundary of the South Arran Marine Protected Area (MPA) is shown in pale blue. Fishing order areas are represented by shaded polygons: solid light blue shading denotes ‘fishing prohibited’; green cross-hatching denotes ‘trawling and dredging prohibited’; pale pink shading denotes ‘trawling and dredging prohibited and fishing restricted’; and dark pink diagonal shading denotes ‘trawling restricted and dredging prohibited’.
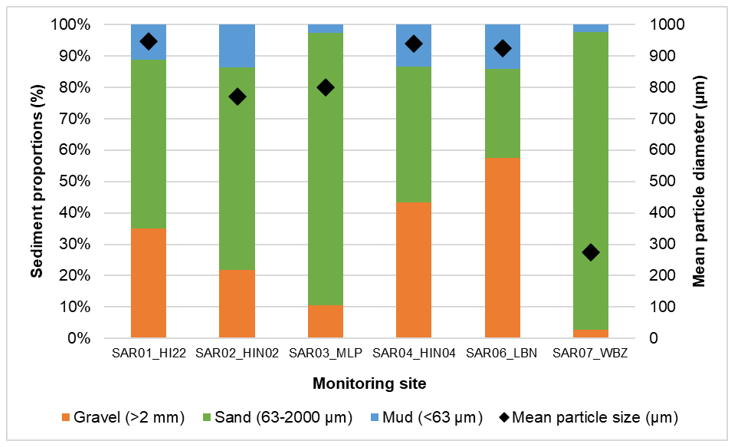
Figure 3. Combination chart with stacked columns showing the proportions of mud, sand and gravel at each site on the left axis. Black diamonds indicate mean particle diameter (µm) for each site (right axis).
Click for a full description
A combination chart of Particle Size Analysis (PSA) data for each of the six monitoring sites at South Arran. Stacked columns are colour-coded for the proportion of each main sediment fraction: proportion of gravel (orange); proportion of sand (green); and the proportion of mud (blue) with a scale on the left Y axis. The mean particle size diameter in µm for each site is overlaid as black diamonds with values on the right Y axis.
The substrata of the five maerl sites were predominantly poorly sorted muddy sandy gravels or gravelly sands. Gravel content was quite variable between sites but was highest at the Lamlash Bay site SAR06_LBN (57.41 %) and lowest at the Merkland Point site SAR03_MLP (10.50 %). The analysis only measures the proportion of particles in each size class and does not distinguish between maerl-derived gravel and shell/mineral derived gravel. However, in the visual descriptions provided by the laboratory, maerl fragments were noted in all five of the maerl site samples and shell fragments were also observed in samples SAR03_MLP, SAR04_HIN04 and SAR06_LBN. Mud content was generally low at all five of these sites, ranging from 2.80 % to 14.26 %, with the highest proportion recorded at SAR06_LBN and the lowest at SAR03_MLP. The proportion of sand varied considerably between sites but was highest at SAR03_MLP (86.70 %) and lowest at SAR06_LBN (28.34 %).
The seagrass bed site SAR07_WBZ was composed primarily of moderately sorted medium and fine sands, with the total proportion of sand accounting for 94.87 % of the sample. The visual description of this sample noted the presence of shell fragments in the sample, which would account for the 2.69 % gravel proportion at this site.
Table 2. Total Organic Carbon (TOC) estimations as Loss on Ignition (LOI) weight loss.
| Monitoring site | Loss on ignition % weight loss |
|---|---|
| SAR01_HI22 | 4.62 |
| SAR02_HIN02 | 6.09 |
| SAR03_MLP | 1.28 |
| SAR04_HIN04 | 6.42 |
| SAR06_LBN | 6.93 |
| SAR07_WBZ | 0.97 |
The estimated TOC results from each of the PSA samples are presented in Table 2. Of the maerl bed sites, SAR02_HIN02, SAR04_HIN04 and SAR06_LBN had the highest LOI values, with more than 6 % LOI at all three locations. The lowest value was recorded in the Merkland Point sample SAR03_MLP (1.28 %). Organic material within the sediments is an important food source, particularly for meiofaunal organisms which, in turn, sustain larger organisms (Krumins et al., 2013). However, a high organic content may cause oxygen depletion and lead to a reduction in species richness and abundance.
The TOC results for the Whiting Bay seagrass site SAR07_WBZ was lower than any of the maerl sites, with an LOI value of 0.97 %.
Macrobenthic analysis
The full macrobenthic data matrix is presented in Annex 1. The top 10 most abundant taxa recorded in the 2023 cores from the five maerl sites are presented in Table 3. Of the countable taxa found, the polychaete Mediomastus fragilis had the highest total abundance with 113 individuals, and a mean abundance of 7.53 per sample. This taxon was also the most frequently recorded, occurring in all 15 maerl samples. Nematodes and juvenile Amphiriudae were the next most abundant taxa, with total abundances of 106 and 90 individuals, respectively. Both taxa occurred in 10 samples, representing 67 % of the samples collected.
Table 3. The top 10 most abundant countable taxa in the five maerl sites in decreasing order of total abundance.
| Taxon name | Total abundance | Mean abundance per sample | Cumulative % abundance | No. samples | % of samples |
|---|---|---|---|---|---|
| Mediomastus fragilis | 113 | 7.53 | 8.93 | 15 | 100 |
| Nematoda | 106 | 7.07 | 17.30 | 10 | 67 |
| Amphiuridae juvenile | 90 | 6.00 | 24.41 | 10 | 67 |
| Polyophthalmus pictus | 75 | 5.00 | 30.33 | 11 | 73 |
| Leptochiton cancellatus | 75 | 5.00 | 36.26 | 9 | 60 |
| Gouldia minima | 64 | 4.27 | 41.31 | 9 | 60 |
| Aonides paucibranchiata | 46 | 3.07 | 44.94 | 10 | 67 |
| Spirobranchus triqueter | 32 | 2.13 | 47.47 | 8 | 53 |
| Serpulidae | 30 | 2.00 | 49.84 | 8 | 53 |
| Polygordius | 26 | 1.73 | 51.90 | 6 | 40 |
The top 10 most frequently occurring qualitative taxa recorded at the five maerl sites are presented in Table 4. Of the non-countable taxa found, the maerl species Lithothamnion glaciale and the tetrasporophyte growth form of Bonnemaisonia hamifera were the most frequently recorded, both occurring in 9 samples, accounting for 60 % of the samples collected.
Table 4. The top 10 most frequently occurring qualitative taxa in the five maerl sites in decreasing order of frequency.
| Taxon name | Number of samples | % of samples |
|---|---|---|
| Lithothamnion glaciale | 9 | 60 |
| Bonnemaisonia hamifera tetrasporophyte | 9 | 60 |
| Plocamium | 6 | 40 |
| Corallinaceae | 5 | 33 |
| Symphyocladiella parasitica | 5 | 33 |
| Phyllophora | 4 | 27 |
| Polysiphonia | 4 | 27 |
| Sycon | 4 | 27 |
| Scrupocellaria scruposa | 4 | 27 |
| Palmaria palmata | 4 | 27 |
The top 10 most abundant taxa recorded from the seagrass bed site SAR07_WBZ are presented in Table 5. At this site the gastropod Rissoa lilacina was the most abundant taxon, occurring in all three cores with a total of 20 individuals. The bivalve Fabulina fabula was the second most abundant species, with a total of 7 individuals, followed by the horseshoe worm Phoronis with 6 individuals, both of which were also found in all three cores.
Table 5. The top 10 most abundant countable taxa recorded in the seagrass site SAR07_WBZ in decreasing order of total abundance.
| Taxon name | Total abundance | Mean abundance per sample | Cumulative % abundance | No. samples | % of samples |
|---|---|---|---|---|---|
| Rissoa lilacina | 20 | 6.67 | 25.64 | 3 | 100 |
| Fabulina fabula | 7 | 2.33 | 34.62 | 3 | 100 |
| Phoronis | 6 | 2.00 | 42.31 | 3 | 100 |
| Magelona filiformis | 4 | 1.33 | 47.44 | 2 | 67 |
| Nemertea | 3 | 1 | 51.28 | 1 | 33 |
| Thracia juvenile | 3 | 1 | 55.13 | 2 | 67 |
| Spio decorata | 3 | 1 | 58.97 | 2 | 67 |
| Spio symphyta | 3 | 1 | 62.82 | 2 | 67 |
| Lacuna vincta | 3 | 1 | 66.67 | 2 | 67 |
| Chamelea striatula | 3 | 1 | 70.51 | 2 | 67 |
Only eight non-countable taxa were recorded at the seagrass bed site SAR07_WBZ and these are presented in Table 6 in decreasing order of frequency. The most frequently recorded species was the bryozoan Celleporella hyalina, which was recorded in all three cores. Corallinaceae and Animalia eggs were each recorded in two of three cores. The record of Phymatolithon calcareum was from a single piece of live maerl recorded in sample SAR07_02_WBZ, but since no dead mearl was recorded in these cores, this is likely the result of cross-contamination during field sieving of the samples.
Table 6. The 8 qualitative taxa recorded at the seagrass site SAR07_WBZ in decreasing order of frequency. * = Likely cross-contamination during in-field sieving, as no dead fragments were found in the sample.
| Taxon name | Number of samples | % of samples |
|---|---|---|
| Celleporella hyalina | 3 | 100 |
| Corallinaceae | 2 | 67 |
| Animalia eggs | 2 | 67 |
| Phymatolithon calcareum* | 1 | 33 |
| Electra pilosa | 1 | 33 |
| Oscillatoria | 1 | 33 |
| Gracilaria | 1 | 33 |
| Polysiphonia | 1 | 33 |
Maerl measurements
Eight samples contained no fragments of live maerl in the 4 mm fraction examined. The measurements for those samples containing live maerl fragments are presented in Table 7. The three samples from the Lamlash Bay maerl bed (SAR06_LBN) contained the highest number of live maerl fragments, with a total of 48 in each sample. The Lamlash Bay site also had the highest proportion of live maerl recorded in the MNCR Phase II dive survey (Doggett et al., 2025). The Holy Isle north sample SAR02_03_HIN02 and the Holy Isle south sample SAR01_02_HI22 each contained only a single live maerl fragment. The Whiting Bay seagrass bed sample SAR07_02_WBZ also contained a single live maerl fragment. However, as described above, no dead maerl fragments were recorded from the seagrass bed samples, so it is likely that this fragment resulted from cross-contamination during sieving of the samples in the field.
Table 7. Live maerl fragment measurement data, listing total number of fragments, maximum length, minimum length and mean length of fragments for samples in which live maerl was recorded. * = Likely cross-contamination during in-field sieving, as no dead fragments were found in the sample.
Sample | No. of fragments | Maximum length (mm) | Minimum length (mm) | Mean length (mm) |
|---|---|---|---|---|
| SAR01_02_HI22 | 1 | 8 | 8 | 8 |
| SAR01_03_HI22 | 5 | 11 | 6 | 9.2 |
| SAR02_03_HIN02 | 1 | 8 | 8 | 8 |
| SAR04_01_HIN04 | 5 | 18 | 7 | 10 |
| SAR04_02_HIN04 | 9 | 10 | 4 | 6.89 |
| SAR04_03_HIN04 | 6 | 16 | 6 | 9.17 |
| SAR06_01_LBN | 48 | 34 | 8 | 18.06 |
| SAR06_02_LBN | 48 | 40 | 11 | 18.04 |
| SAR06_03_LBN | 48 | 29 | 6 | 14.23 |
| SAR07_02_WBZ | 1* | 9 | 9 | 9 |
Univariate analysis
The univariate diversity indices for each sample are presented in Table 8. Holy Island south sample SAR01_02_HI22 had the highest overall total abundance of 57 taxa, resulting in this sample also having the highest value of Margalef’s Species Richness (9.12). The lowest total abundance of 17 taxa and Margalef’s Species Richness (d) value of 3.99 were both recorded for the Whiting Bay sample SAR07_01_WBZ. SAR02_03_HIN02 had the largest number of individuals, with 201 per sample. Pielou’s eveness (J’) was highest in sample SAR07_02_WBZ with a value of 0.99 and lowest in sample SAR04_02_HIN04 with a score of 0.77. SAR06_03_LBN had the highest Shannon-Wiener diversity (H’(loge)) score of 3.23. The lowest value of Shannon-Wiener diversity (H’(loge)) was recorded in samples SAR07_01_WBZ and SAR07_02_WBZ which both had a value of 2.37.
Samples SAR02_03_HIN02, SAR01_01_HI22 and SAR01_02_HI22 had considerably higher values of total biomass than the other samples, with weights of 33.88 g, 32.36 g and 24.14 g, respectively. This was due to the presence of single large adult bivalves in each sample, with Polititapes rhomboides in samples SAR01_01_HI22 and SAR01_02_HI22 and Arcopagia crassa in sample SAR02_03_HIN02.
Table 8. Univariate diversity indices for each sample.
| Sample | Total no. of taxa per sample | Total no. individuals per sample | Total biomass per sample (g) | Margalef’s species richness (d) | Pielou’s evenness (J’) | Shannon-Wiener diversity (H’(loge)) |
|---|---|---|---|---|---|---|
| SAR01_01_HI22 | 30 | 78 | 24.14 | 6.66 | 0.88 | 3.01 |
| SAR01_02_HI22 | 57 | 173 | 32.36 | 9.12 | 0.83 | 3.21 |
| SAR01_03_HI22 | 43 | 123 | 11.33 | 7.69 | 0.82 | 2.99 |
| SAR02_01_HIN02 | 40 | 71 | 0.68 | 7.27 | 0.84 | 2.91 |
| SAR02_02_HIN02 | 43 | 88 | 2.05 | 7.15 | 0.86 | 3.02 |
| SAR02_03_HIN02 | 43 | 201 | 33.88 | 6.98 | 0.83 | 3.00 |
| SAR03_01_MLP | 30 | 39 | 0.92 | 5.73 | 0.93 | 2.87 |
| SAR03_02_MLP | 30 | 47 | 0.95 | 4.68 | 0.87 | 2.55 |
| SAR03_03_MLP | 20 | 33 | 0.35 | 4.29 | 0.89 | 2.48 |
| SAR04_01_HIN04 | 47 | 83 | 2.17 | 7.92 | 0.89 | 3.21 |
| SAR04_02_HIN04 | 29 | 78 | 1.24 | 5.51 | 0.77 | 2.47 |
| SAR04_03_HIN04 | 32 | 88 | 2.68 | 6.70 | 0.90 | 3.11 |
| SAR06_01_LBN | 33 | 62 | 0.57 | 5.82 | 0.90 | 2.90 |
| SAR06_02_LBN | 32 | 43 | 3.36 | 6.12 | 0.94 | 2.98 |
| SAR06_03_LBN | 42 | 58 | 0.30 | 7.14 | 0.95 | 3.23 |
| SAR07_01_WBZ | 17 | 26 | 0.21 | 3.99 | 0.90 | 2.37 |
| SAR07_02_WBZ | 19 | 12 | 0.32 | 4.02 | 0.99 | 2.37 |
| SAR07_03_WBZ | 18 | 40 | 5.16 | 4.34 | 0.89 | 2.51 |
| Max | 57 | 201 | 33.88 | 9.12 | 0.99 | 3.23 |
| Min | 17 | 12 | 0.21 | 3.99 | 0.77 | 2.37 |
| Mean | 33.61 | 74.61 | 6.81 | 6.17 | 0.88 | 2.84 |
Multivariate analysis
The results of SIMPROF cluster analysis on square-root transformed infaunal abundance data for each sample are presented in Figure 4. Samples connected by black lines denote significant structure within the group to that point and samples that cannot be significantly differentiated at the 95 % confidence interval are connected by red lines on the dendrogram. The SIMPROF test identified 6 cluster groups that were considered significantly distinct from one-another, three of which comprised single samples. The results of SIMPER analysis carried out to identify the taxa responsible for within-group similarity for each SIMPROF group and dissimilarity between groups are presented in Table 9.
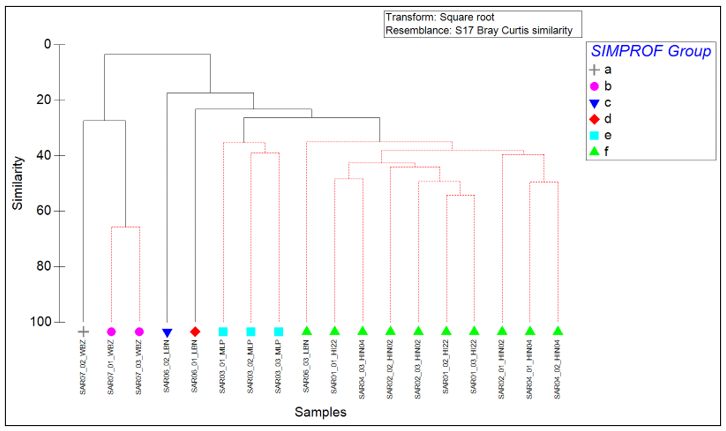
Figure 4. SIMPROF Cluster dendrogram of Bray-Curtis similarity between square-root transformed macrobenthic data for each replicate.
Click for a full description
Cluster dendrogram showing the Bray-Curtis similarity relationship between each infaunal sample based on square-root transformed data. Samples connected by black lines denote significant structure within the group to that point and red lines connect samples that cannot be significantly differentiated at the 95% confidence interval. Six significant groups of samples were identified by the SIMPROF routine, and these are distinguished by different coloured symbols: Group A (grey cross), Group B (pink circle), Group C (dark blue inverted triangle), Group D (red diamond), Group E (pale blue square) and Group F (green triangle).
Table 9. SIMPER showing the top 90 % of taxa contributing to within-group similarity for each SIMPROF group.
SIMPROF group | Species | Mean abund. | Mean similarity | Sim/SD | Contrib. | Cumul. |
|---|---|---|---|---|---|---|
| Group a SAR07_02_WBZ | Less than two samples in group | - | - | - | - | - |
| Group b (65.70) SAR07_01_WBZ SAR07_03_WBZ | Rissoa lilacina | 3.05 | 12.52 | - | 19.05 | 19.05 |
- | Magelona filiformis | 1.41 | 6.69 | - | 10.18 | 29.23 |
- | Fabulina fabula | 1.57 | 6.69 | - | 10.18 | 39.42 |
- | Phoronis | 1.57 | 6.69 | - | 10.18 | 49.6 |
- | Spio decorata | 1.21 | 4.73 | - | 7.2 | 56.8 |
- | Owenia | 1 | 4.73 | - | 7.2 | 64 |
- | Aoridae (female) | 1 | 4.73 | - | 7.2 | 71.2 |
- | Lacuna vincta | 1.21 | 4.73 | - | 7.2 | 78.4 |
- | Kurtiella bidentata | 1 | 4.73 | - | 7.2 | 85.6 |
- | Chamelea striatula | 1.21 | 4.73 | - | 7.2 | 92.8 |
| Group c SAR06_02_LBN | Less than two samples in group | - | - | - | - | - |
| Group d SAR06_01_LBN | Less than two samples in group | - | - | - | - | - |
| Group e (36.57) SAR03_01_MLP SAR03_02_MLP SAR03_03_MLP | Mediomastus fragilis | 2.65 | 8.81 |
| 24.09 | 24.09 |
- | Aonides paucibranchiata | 2.3 | 8.49 | 14.9 | 23.21 | 47.3 |
- | Glycera lapidum (aggregate) | 1.87 | 5.96 | 6.23 | 16.29 | 63.59 |
- | Nematoda | 0.94 | 1.94 | 20.06 | 5.31 | 68.9 |
- | Aponuphis bilineata | 1.14 | 1.94 | 0.58 | 5.31 | 74.21 |
- | Golfingia elongata | 1.05 | 1.71 | 0.58 | 4.69 | 78.89 |
- | Psamathe fusca | 0.67 | 1.37 | 0.58 | 3.75 | 82.64 |
- | Nemertea | 0.67 | 1.36 | 0.58 | 3.71 | 86.35 |
- | Urothoe marina | 1.15 | 1.36 | 0.58 | 3.71 | 90.06 |
| Group f (40.07) SAR01_01_HI22 SAR01_02_HI22 SAR01_03_HI22 SAR02_01_HIN02 SAR02_02_HIN02 SAR02_03_HIN02 SAR04_01_HIN04 SAR04_02_HIN04 SAR04_03_HIN04 SAR06_03_LBN | Amphiuridae (juvenile) | 2.79 | 4.04 | 3.72 | 10.08 | 10.08 |
- | Mediomastus fragilis | 2.68 | 3.98 | 2.68 | 9.92 | 20 |
- | Polyophthalmus pictus | 2.3 | 2.86 | 1.43 | 7.14 | 27.14 |
- | Leptochiton cancellatus | 2.24 | 2.33 | 1.37 | 5.81 | 32.95 |
- | Nematoda | 2.51 | 2.28 | 1.04 | 5.69 | 38.64 |
- | Gouldia minima | 2.08 | 2.23 | 1.12 | 5.57 | 44.21 |
- | Pholoe baltica (sensu Petersen) | 1.21 | 1.94 | 1.78 | 4.84 | 49.05 |
- | Aonides paucibranchiata | 1.37 | 1.36 | 0.87 | 3.4 | 52.45 |
- | Harmothoe impar_aggregate | 0.91 | 1.26 | 1.23 | 3.15 | 55.6 |
- | Pholoe inornata (sensu Petersen) | 1.2 | 1.21 | 0.86 | 3.03 | 58.62 |
- | Lysidice unicornis | 1.17 | 1.16 | 0.88 | 2.9 | 61.52 |
- | Nemertea | 0.92 | 0.99 | 0.92 | 2.48 | 64 |
- | Echinocyamus pusillus | 0.78 | 0.98 | 0.9 | 2.45 | 66.45 |
- | Spirobranchus triqueter | 1.16 | 0.97 | 0.85 | 2.41 | 68.86 |
- | Polygordius | 1.18 | 0.91 | 0.67 | 2.27 | 71.12 |
- | Serpulidae | 1.05 | 0.8 | 0.65 | 1.99 | 73.11 |
- | Psamathe fusca | 0.86 | 0.78 | 0.65 | 1.94 | 75.05 |
- | Glycera lapidum (aggregate) | 0.8 | 0.71 | 0.68 | 1.77 | 76.82 |
- | Pista mediterranea | 0.71 | 0.7 | 0.68 | 1.74 | 78.57 |
- | Hydroides norvegica | 0.91 | 0.7 | 0.68 | 1.74 | 80.31 |
- | Polycirrus | 0.62 | 0.52 | 0.5 | 1.29 | 81.6 |
- | Moerella donacina | 0.61 | 0.51 | 0.52 | 1.28 | 82.88 |
- | Parvicardium scabrum | 0.66 | 0.49 | 0.51 | 1.22 | 84.1 |
- | Eteone longa_aggregate | 0.5 | 0.47 | 0.53 | 1.18 | 85.28 |
- | Neoamphitrite figulus | 0.58 | 0.43 | 0.51 | 1.07 | 86.35 |
- | Thracia (juvenile) | 0.61 | 0.31 | 0.37 | 0.77 | 87.12 |
- | Lysianassa plumosa | 0.54 | 0.3 | 0.38 | 0.74 | 87.86 |
- | Leptochiton asellus | 0.55 | 0.28 | 0.38 | 0.7 | 88.57 |
- | Sphaerodorum gracilis | 0.54 | 0.28 | 0.38 | 0.7 | 89.26 |
- | Dexamine spinosa | 0.4 | 0.28 | 0.39 | 0.69 | 89.95 |
- | Malmgrenia ljungmani | 0.48 | 0.27 | 0.37 | 0.67 | 90.63 |
Groups A and B showed distinct separation from the other clusters, splitting from groups C to F at 3.48 % similarity, indicating a large difference in species assemblages between samples beyond this split. Group A consisted of only one sample (SAR07_02_WBZ), separating from Group B at 27.39 % similarity. Group B consisting of two samples from the same site (SAR07_01_WBZ and SAR07_03_WBZ). The main differences between the two groups were the lower abundance of the gastropod Rissoa lilacina in group A compared to group B, and the absence of the polychaetes Spio decorata and Magelona filiformis and the molluscs Lacuna vincta, Chamelea striatula and Thracia (juvenile) from Group A; all of which were present in Group B.
Groups C to F had higher taxonomic diversity than groups A and B. Groups C and D each comprised only single samples (SAR06_02_LBN and SAR06_01_LBN, respectively), separating from groups E and F at a similarity of 17.28 % and 23.24 % respectively. The gastropod Alvania beanii and decapod Galathea intermedia juvenile were found in group D but not group C and contributed the largest amount to the dissimilarity between these two groups.
Groups E and F were the two largest groups, with Group E comprising all three samples from the Merkland Point site (SAR03_MLP), and Group F including the remaining 10 samples, including all three samples from each of sites SAR01_HI22, SAR02_HIN02 and SAR04_HIN04 along with sample SAR06_03_LBN from Lamlash Bay. These two groups separated from one-another at a similarity of 26.16 %. The dissimilarity between these groups was influenced by small abundance differences across a wide range of taxa. Juvenile Amphiuridae contributed the highest percentage of to the overall dissimilarity between the two groups, being recorded in every sample in Group F and absent from samples in Group E.
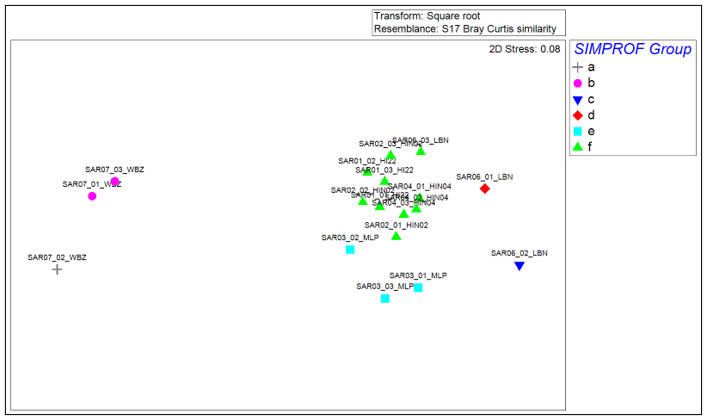
Figure 5. Non-metric multi-dimensional scaling (MDS) plot of Bray-Curtis similarity between square-root transformed macrobenthic data for each replicate.
Click for a full description
Non-metric Multi-dimensional Scaling (MDS) provides a two-dimensional representation of the higher dimensional relationship between each pairing of samples and is based on the same square-root transformed Bray-Curtis similarity matrix as the hierarchical clustering process. The stress value indicates how accurate the two-dimensional representation is of the higher dimensional relationship, with values closer to zero indicating a more accurate representation. The symbology of the points is complementary to the cluster dendrogram, with samples from each SIMPROF cluster group distinguished by different coloured symbols: Group A (grey cross), Group B (pink circle), Group C (dark blue inverted triangle), Group D (red diamond), Group E (pale blue square) and Group F (green triangle).
The MDS plot for square-root transformed abundance data for each sample is shown in Figure 5. The stress value of 0.08 is low, indicating a good representative two-dimensional picture of the higher dimensional relationships between samples.
The spread of points on the MDS plot corresponds well with the separation of samples seen in the cluster dendrogram, with groups A and B widely separated from groups C to F. The samples within group F are grouped relatively closely together, suggesting high within-group similarity. Group E shows a slightly greater spread of points than group F, suggesting slightly more heterogeneity between samples within the former group. Groups C and D are positioned away from groups E and F, consistent with their separate cluster grouping in the dendrogram (Figure 4).
Biotope assignments
A summary of the biotope assignments for each sample and SIMPROF cluster group is presented in Table 10 and the spatial distribution of biotopes is mapped in Figure 6. Groups A and B included all three replicates from the Whiting Bay seagrass site (SAR07_WBZ). Whilst they were grouped separately in the SIMPROF cluster, both were characterised by the bivalve Fabulina fabula in a predominantly sandy substrate and were assigned to an impoverished variant of the habitat ‘Fabulina fabula and Magelona mirabilis with venerid bivalves and amphipods in Atlantic infralittoral compacted fine muddy sand’ (MB5236; cf. SS.SSa.IMuSa.FfabMag). Both groups C and D had high numbers of live maerl fragments and were characterised by epifaunal taxa including the maerl species Lithothamnion glaciale and Phymatolithon calcareum. In the laboratory analysis these species names were used to distinguish specimens with distinct differences in colour and thallus morphology but may represent a more diverse range of species. Simon-Nutbrown (in prep.) has identified a range of maerl species in Scotland based on genetic analysis. These two samples were assigned to the biotope ‘Lithothamnionglaciale maerl beds in tide-swept variable salinity Atlantic infralittoral gravel’ (MB3222; SS.SMp.Mrl.Lgla). Groups E and F were characterised by the polychaete Mediomastus fragilis and both had a variety of epifaunal taxa present. These two groups were considered to be a shallow water variant of the habitat ‘Mediomastus fragilis, Lumbrineris spp. and venerid bivalves in Atlantic circalittoral coarse sand or gravel’ (MC3212; cf. SS.SCS.CCS.MedLumVen) but were considered to be likely to be intermediate with other maerl or macrophyte dominated habitats. Where differences were found between cores from the same transect, results are likely a reflection that some transects were sloping and sediment composition changed with depth, as described in Doggett et al. (2025), and cores were collected at different locations along the transects.
Table 10. Information on which biotopes were assigned to each sample and their associated cluster groupings. Details EUNIS 2022 codes and names, JNCC codes and MNCR phase II biotope codes (from Doggett et al., 2025).
Cluster group | Samples | EUNIS (2022) habitat | JNCC Code (Connor et al., 2004) | MNCR phase II biotope codes |
|---|---|---|---|---|
A | SAR07_02_WBZ | MB5236: Fabulina fabula and Magelona mirabilis with venerid bivalves and amphipods in Atlantic infralittoral compacted fine muddy sand | cf. SS.SSa.IMuSa.FfabMag | MB5223 (SS.SMp.SSgr.Zmar) |
B | SAR07_01_WBZ SAR07_03_WBZ | MB5236: Fabulina fabula and Magelona mirabilis with venerid bivalves and amphipods in Atlantic infralittoral compacted fine muddy sand | cf. SS.SSa.IMuSa.FfabMag | MB5223 (SS.SMp.SSgr.Zmar) |
C | SAR06_02_LBN | MB3222: Lithothamnion glaciale maerl beds in tide-swept variable salinity Atlantic infralittoral gravel | SS.SMp.Mrl.Lgla | MB3222 (SS.SMp.Mrl.Lgla) |
D | SAR06_01_LBN | MB3222: Lithothamnion glaciale maerl beds in tide-swept variable salinity Atlantic infralittoral gravel | SS.SMp.Mrl.Lgla | MB3222 (SS.SMp.Mrl.Lgla) |
E | SAR03_01_MLP SAR03_02_MLP SAR03_03_MLP | MC3212: Mediomastus fragilis, Lumbrineris spp. and venerid bivalves in Atlantic circalittoral coarse sand or gravel | cf. SS.SCS.CCS.MedLumVen | MB5211; (SS.SMp.KSwSS.SlatR.Sa) |
F | SAR01_01_HI22 SAR01_02_HI22 SAR01_03_HI22 SAR02_01_HIN02 SAR02_02_HIN02 SAR02_03_HIN02 SAR04_01_HIN04 SAR04_02_HIN04 SAR04_03_HIN04 SAR06_03_LBN | MC3212: Mediomastus fragilis, Lumbrineris spp. and venerid bivalves in Atlantic circalittoral coarse sand or gravel | cf. SS.SCS.CCS.MedLumVen | SAR01 & SAR02: MB32112 (SS.SMp.KSwSS.SlatR.Gv); SAR04: MB5211 (SS.SMp.KSwSS.SlatR.Sa); SAR06: MB3222 (SS.SMp.Mrl.Lgla) |
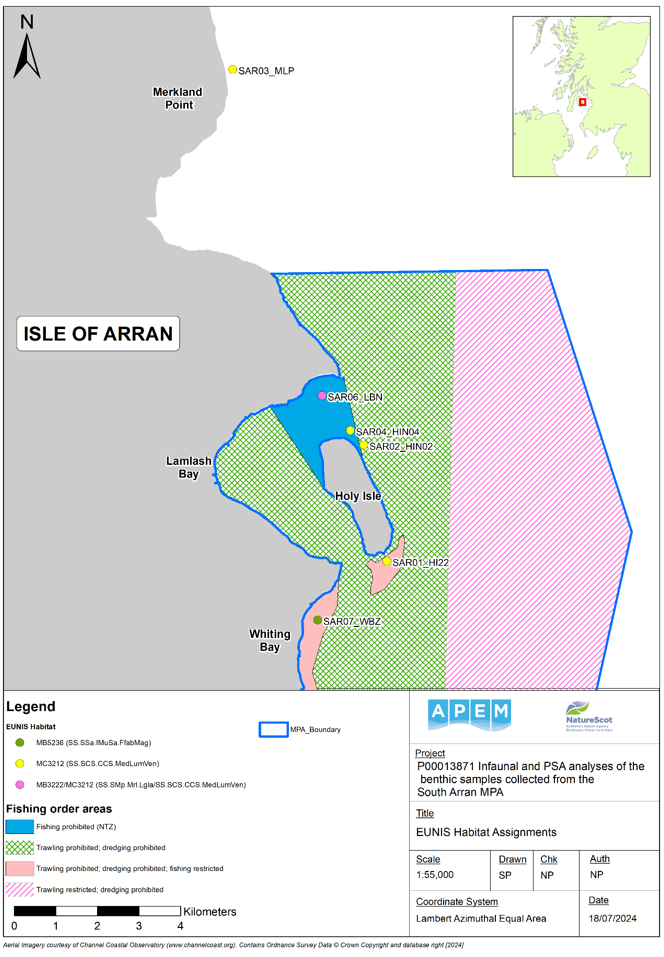
Figure 6. Map showing the distribution of biotopes assigned to each monitoring site using both EUNIS (2022) and JNCC (Connor et al., 2004) habitat codes.
Click for a full description
Map of South Arran showing the biotope assignments attributed to each of the six monitoring stations:
Points marked in green denote an impoverished variant of ‘Fabulina fabula and Magelona mirabilis with venerid bivalves and amphipods in Atlantic infralittoral compacted fine muddy sand’ (MB5236; cf. SS.SSa.IMuSa.FfabMag), which is considered intermediate with the seagrass habitat ‘Zostera marina/angustifolia beds on Atlantic infralittoral clean or muddy sand’ (MB5223, SS.SMp.SSgr.Zmar).
Points marked in yellow denote a variant of ‘Mediomastus fragilis, Lumbrineris spp. and venerid bivalves in Atlantic circalittoral coarse sand or gravel’ (MC3212; cf. SS.SCS.CCS.MedLumVen).
Points marked in pink denote a combination of ‘Lithothamnion glaciale maerl beds in tide-swept variable salinity Atlantic infralittoral gravel’ (MB3222; SS.SMp.Mrl.Lgla) and a variant of ‘Mediomastus fragilis, Lumbrineris spp. and venerid bivalves in Atlantic circalittoral coarse sand or gravel’ (MC3212; cf. SS.SCS.CCS.MedLumVen).
A polygon representing the boundary of the South Arran Marine Protected Area (MPA) is shown in pale blue. Fishing order areas are represented by shaded polygons: solid light blue shading denotes ‘fishing prohibited’; green cross-hatching denotes ‘trawling and dredging prohibited’; pale pink shading denotes ‘trawling and dredging prohibited and fishing restricted’; and dark pink diagonal shading denotes ‘trawling restricted and dredging prohibited’.
Non-native species
The tetrasporophyte phase of Bonnemaisonia hamifera (previously considered to be a separate species Trailliella intricata), native to Japan was recorded in 9 samples collected from 4 of the monitoring sites (SAR01_HI22, SAR02_HIN02, SAR03_MLP & SAR06_LBN). This species has been previously recorded from seagrass beds in north-west Scotland (James, 2004) and the maerl beds in the Sound of Barra (Bunker et al., 2015).
One individual of the polychaete species Goniadella gracilis, native to South Africa and the northeastern USA, was found in sample SAR02_03_HIN02 from the Holy Island north (outside the NTZ) site. This species has previously been recorded all around the coast of Scotland, with 36 occurrences in data from benthic surveys in Scottish waters between 1993 and 2018 (NatureScot, 2023).
Discussion
The samples from the Whiting Bay seagrass bed were considered to belong to an impoverished variant of the EUNIS habitat ‘Fabulina fabula and Magelona mirabilis with venerid bivalves and amphipods in Atlantic infralittoral compacted fine muddy sand’ (MB5236; cf. SS.SSa.IMuSa.FfabMag) based on the infaunal and particle size data. The lower diversity and increased abundance of gastropods in these samples compared to the standard descriptions (EUNIS, 2022; Connor et al., 2004) is likely due to the presence of seagrass on the wider seabed from which the cores were collected and the habitat should therefore be considered as intermediate with the seagrass habitat ‘Zostera marina/angustifolia beds on Atlantic infralittoral clean or muddy sand’ (MB5223, SS.SMp.SSgr.Zmar), which was the biotope assigned based on Marine Nature Conservation Review (MNCR) style phase II survey and photo quadrat data (Doggett et al., 2025) comparable to those collected in the 2014 survey (Mercer et al., 2018). The biotope may also overlap with ‘Faunal communities of full salinity Atlantic infralittoral sand’ habitats (MB523; SS.SSa.IFiSa).
The maerl site samples within the MPA boundary appear to exhibit less between-site variability than observed during the 2014 survey (Mercer et al., 2018). In the 2014 data the Lamlash Bay samples clustered separately from the other sites, most of the replicates from the two Holy Isle north sites clustered together, and all the Holy Isle south replicates clustered together. In the 2023 data samples from all three Holy Isle sites clustered together in a single group along with one replicate from the Lamlash Bay site.
Two of the samples with the highest numbers of live maerl fragments in the current study (SAR06_01_LBN and SAR06_02_LBN from Lamlash Bay) did not group with any other samples in the SIMPROF test and were both assigned to the maerl biotope ‘Lithothamnion glaciale maerl beds in tide-swept variable salinity Atlantic infralittoral gravel’ (MB3222; SS.SMp.Mrl.Lgla). However, since this habitat is primarily defined by epifaunal species, the infauna is not well described (EUNIS, 2022; Connor et al., 2004). The third replicate sample from this site (SAR06_03_LBN) had the same number of live maerl fragments as the other two replicates from site SAR06 but was grouped with the coarse sediment samples from other sites in the SIMPROF routine based on the similarity of the infaunal composition and was therefore assigned to the coarse sediment biotope MC3212/SS.SCS.CCS.MedLumVen. The similarity in abundance of live maerl fragments contrasted with the differences in infaunal composition between these three replicates and suggests the two habitats are intermediate with one-another. Doggett et al. (2025) assigned samples from site SAR06_LBN to the MB3222/SS.SMp.Mrl.Lgla biotope based on the MNCR phase II survey data. This site had the highest proportion of live maerl recorded in both the 2014 and 2023 MNCR phase II surveys.
All three replicates from the Merkland Point site (SAR03_MLP) clustered together into SIMPROF group E and all the samples from the Holy Isle north and south sites (SAR01_HI22, SAR02_HIN02 and SAR04_HIN04) clustered together into group F, along with sample SAR06_03_LBN from the Lamlash Bay site. Both these groups were were assigned to the habitat ‘Mediomastus fragilis, Lumbrineris spp. and venerid bivalves in Atlantic circalittoral coarse sand or gravel’ (MC3212; cf. SS.SCS.CCS.MedLumVen). However, the group E and F infaunal samples differed from the standard descriptions (EUNIS, 2022; Connor et al., 2004) in that one of the characterising taxa, Lumbrineris spp., was either present only in low abundance or was entirely absent. There were also high abundances of the chiton Leptochiton cancellatus and the polychaete Polyophthalmus pictus, neither of which are mentioned as characterising species in the standard biotope descriptions, and it is possible the South Arran samples represent a shallow water variant of this habitat and are intermediate with adjacent macrophyte-dominated habitats. Fragments of dead maerl were recorded in the substrata of all of 15 of the maerl bed samples and as described above, replicates from the Lamlash Bay site were split between the coarse sediment and maerl biotope. The MNCR phase II survey results (Doggett et al. (2025) classified sites SAR01_HI22 and SAR02_HIN02 as ‘Saccharina latissima and robust red algae on infralittoral gravel and pebbles’ (MB32112; SS.SMp.KSwSS.SlatR.Gv) and sites SAR03_MLP and SAR04_HIN as ‘Saccharina latissima and filamentous red algae on infralittoral sand’ (MB5211; SS.SMp.KSwSS.SlatR.Sa).
The infaunal samples collected from the Whiting Bay seagrass beds had distinctly lower diversity and abundances than the maerl sites. This is unsurprising given the different habitat types being targeted and in particular the three-dimensional structure of maerl habitats providing attachment points for epifaunal species such as algae, bryozoa and hydroids in addition to supporting a diverse range of infauna (Birkett et al., 1998), whereas the seagrass bed was predominantly sand with a minimal epifaunal component. The Merkland Point core samples (SAR03_MLP) had a lower mean number of taxa (26.7) than the maerl sites within the MPA boundary, which ranged between 35.7 and 43.3.
Comparison of the univariate characteristics of the maerl bed sites sampled in both 2023 and 2014 (Mercer et al., 2018) shows an apparent increase in taxonomic diversity at all four sites. The Holy Isle south site (SAR01_HI22) had the lowest mean number of taxa in the 2014 data (25), whereas in 2023 this site had the highest mean number of taxa (43.3). The Holy Isle north site outside the NTZ (no mobile gear permitted; SAR02_HIN02) had an average of 26 taxa in the 2014 data, which had increased to 42 in the 2023 data. The Holy Isle north site inside the NTZ (SAR04_HIN04) had the highest mean number of taxa in 2014 (32), which had increased slightly to 36 in the 2023 data. These three sites all had corresponding increases in values of Margalef’s species richness and Shannon-Wiener diversity (H’(loge)) values. The Lamlash Bay site (SAR06_LBN) had an average of 30 taxa in the 2014 survey, which had increased to 35.7 in 2023, although Margalef’s species richness and Shannon-Wiener diversity were both slightly lower at this site in 2023 compared to 2014. However, the MNCR phase II survey suggested few differences in the characteristic data at each site, with ~180 taxa recorded across maerl sites in both years, when comparing data collected in 2014 (Mercer et al., 2018) to those collected in 2023 (Doggett et al., 2025).
The invasive red algal species Bonnemaisonia hamifera was recorded in its tetrasporophyte phase at four of the monitoring sites (two of the sites around Holy Isle, Lamlash Bay and Merkland Point). This species is native to Japan and was first recorded in the United Kingdon on the Isle of Wight in 1890 (Farnham, 1980). The tetrasporophyte Trailliella phase has been recorded throughout the North Sea, growing subtidally in Scotland and eastern England, and from northern Norway to France (Maggs & Stegenga, 1999). It has been previously recorded from seagrass beds in north-west Scotland (James, 2004) and the maerl beds in the Sound of Barra (Bunker et al., 2015). This species was recorded from the Pladda, Holy Isle and Lamlash Bay sites during the 2014 surveys, where its abundance was recorded as ‘rare’ in Pladda and the Holy Isle sites, but ‘superabundant’ in the Lamlash Bay maerl bed (Mercer et al., 2018). Whilst this species was not quantified in the infaunal core samples, the 2023 MNCR phase II dive survey (Doggett et al., 2025) recorded it as ‘occasional’ at the Holy Isle North Site (SAR01_HI22), ‘frequent’ at both Holy Isle south sites and the Merkland Point site (SAR02_HIN02, SAR04_HIN04 and SAR03_MLP) and ‘common’ at the Lamlash Bay site (SAR06_LBN).
A single individual of the non-native polychaete Goniadella gracilis was also recorded in sample SAR02_03, located to the north of Holy Isle, outside the NTZ. This species is native to South Africa and northeastern USA and was first recorded from Liverpool in 1970 (Walker, 1972). It has since become widespread in sandy gravel in the southern Irish Sea (Mackie, Oliver & Rees, 1995) and there were 36 occurrences of this taxon in data from benthic surveys in Scottish waters between 1993 and 2018 (NatureScot, 2023). It was not recorded during the 2014 survey of the South Arran MPA (Mercer et al., 2018).
Conclusion
Analysis of benthic core data showed that diversity of maerl bed sites within the South Arran MPA was higher than that observed at the Merkland Point site located to the north of the MPA. The maerl bed sites within the MPA appear to have increased in diversity compared with data collected from the same monitoring sites in 2014 (Mercer et al., 2018). Lower numbers of taxa and individuals were also recorded at a site located in the Whiting Bay seagrass bed within the MPA boundary, where the sediment comprised predominantly sand. An analysis of change between 2014 and 2023 based on results of diver-based MNCR phase II surveys and quadrat imagery is reported by Doggett et al. (2025).
References
Birkett, D.A., Maggs, C.A., Dring, M.J. 1998. Maerl (volume V). An overview of dynamic and sensitivity characteristics for conservation management of marine SACs. Scottish Association for Marine Science. (UK Marine SACs Project). 116 pp.
Bunker, F.StP.D., Mercer, T.M., Howson, C.M., Moore, J.M., Diaz, P., Maggs, C.A. & Kamphausen, L. 2018. Site condition monitoring of maerl beds and seagrass beds in the Sound of Barra SAC 2015 – diving survey. Scottish Natural Heritage Research Report 924.
Clarke, K.R. and Warwick, R.M., 2001. Change in Marine Communities: An Approach to Statistical Analysis and Interpretation: 2nd edition. Plymouth: PRIMER-E.
Clarke, K.R. and Gorley, R.N. 2006. PRIMER v6: User manual/tutorial. Plymouth: PRIMER-E.
Connor, D.W., Allen, J.H., Golding, N., Howell, K.L., Lieberknecht, L.M., Northen, K.O. & Reker, J.B. 2004. The Marine Habitat Classification for Britain and Ireland Version 04.05. JNCC, Peterborough, ISBN 1 861 07561 8. In: JNCC, 2022. The Marine Habitat Classification for Britain and Ireland Version 22.04
Doggett, M., Baldock, L. and Owen, N. 2025. 2023 South Arran dive survey: comparison with imagery data from 2014 and recommendations for monitoring method optimisation. NatureScot Research Report 1372.
Farnham, W. F., 1980. Studies on aliens in the marine flora of southern England. In: J. H. Price, D. E. G. Irvine & W. F. Farnham, eds. The shore environment, vol. 2. Ecosystems. London: Academic Press, 875-914.
James, B. 2004. North-west Scotland subtidal seagrass bed survey 2004. Scottish Natural Heritage Commissioned Report No. 076 (ROAME No. F04LB05).
Krumins, J.A., van Oevelen, D., Bezemer, T.M., De Deyn, G.B., Hol, W.H.G., van Donk, E., de Boer, W., de Ruiter, P.C., Middelburg, J.J., Monroy, F., Soetaert, K., Thébault, E., van de Koppel, J., van Veen, J.A., Viketoft, M. & van der Putten, W.H. 2013. Soil and Freshwater and Marine Sediment Food Webs: Their Structure and Function. BioScience 63(1), 35–42.
Mackie, A.S.Y., Oliver, P.G., & Rees, I.S. 1995. Benthic biodiversity in the southern Irish Sea. Studies in marine biodiversity and systematics from the National Museum of Wales. Biomôr Reports, 1: 263 pp.
Maggs, C.A. & Stegenga, H. 1999. Red algal exotics on North Sea coasts. Helgoland Marine Research, 52, 243-258.
Marine Scotland, 2014. 2014 Consultation on the Management of Inshore Special Areas of Conservation and Marine Protected Areas Approaches
Mason, C. 2016. NMBAQC's Best Practice Guidance. Particle Size Analysis (PSA) for Supporting Biological Analysis. National Marine Biological AQC Coordinating Committee, 84pp, First published 2011, updated March 2022.
Mercer, T., Kamphausen, L., Moore, J., Bunker, F., Archer Thompson, J. & Howson, C. 2018. South Arran MPA diver survey of maerl beds, kelp and seaweed communities on sublittoral sediment, and seagrass beds 2014. Scottish Natural Heritage Research Report No. 882.
Walker, A.J.M. 1972. Goniadella gracilis, a polychaete new to British seas. Marine Biology, 14: 85-87.
NatureScot, 2023. Species data for Scottish waters held and managed by Scottish Natural Heritage, derived from benthic surveys 1993 to 2018
WoRMS Editorial Board, 2024. World Register of Marine Species
Worsfold, T.M., Hall, D.J. & O'Reilly, M. ed. 2010. Guidelines for processing marine macrobenthic invertebrate samples: a Processing Requirements Protocol: Version 1.0, June 2010. Unicomarine Report NMBAQCMbPRP to the NMBAQC Committee. 33pp.