NatureScot Research Report 1355 - A summary of surface motion remote sensing methods for the monitoring of peatland
Published: 2025
Authors: Emily Mitchell (2), Chris Fallaize (2), Ian Dryden (2), Andrew V Bradley (1), David J Large (3), Roxane Andersen (4) and Chris Marshall (4)
(1) Nottingham Geospatial Institute, University of Nottingham, 30 Triumph Road, Lenton, Nottingham, UK, NG7 2TU
(2) School of Mathematical Sciences, University of Nottingham, Nottingham NG7 2RD, UK
(3) Dept. of Chemical and Environmental Engineering, University of Nottingham, Coates Building, Nottingham, UK, NG7 2RD
(4) Environmental Research Institute, University of the Highlands and Islands, Castle Street, Thurso, UK, KW14 7JD
Cite as: Mitchell, E., Fallaize, C., Dryden, I., Bradley, A.V., Large, D.J., Andersen, R., and Marshall, C. 2025. A summary of surface motion remote sensing. NatureScot Research Report 1355.
Contents
- Keywords
- Background
- Main findings
- Acknowledgements
- Abbreviations
- Introduction
- Method developments since September 2022
- Overview of methods
- Change detection case studies
- References
- Annex 1 – Commentary on Dalchork restoration areas
- Annex 2 – Definitions of restoration techniques used
Keywords
bog breathing; surface motion; InSAR; peatland condition; monitoring; change detection; probability
Background
The purpose of this report is to present a suite of methods and products for landscape scale assessment of peatland condition that can contribute to the sustainable management and restoration of peatland habitats. The outputs will also allow for the reporting of condition at the local, regional and national scales. The methods all use satellite measures of peatland surface motion (or ‘bog breathing’) to determine peatland condition and generate maps and summaries of peatland condition and change in peatland condition.
Peatland surface motion is a sensitive indicator of peatland condition and resilience (Howie and Hebda, 2018; Waddington, 2010; Loisel and Gallego-Sala, 2022). It is a mechanical response to changes in water storage that is determined by a range of peatland properties including softness/stiffness, water table depth, plant functional type, land use history and topography. It also provides a measure of the ability of a peatland surface to rise and fall with the water table and hence minimise the risk posed by drought and fire.
This method provides measures of condition based on ground motion that results from the combined effects of ecology, hydrology and mechanics. This view of condition is a different view to that provided solely by ecological or hydrological measures. It is a view that provides new information about the behaviour of the peatland that enhances our understanding of peatland function and is complementary to ecological and hydrological measures of condition. Importantly it does not replace detailed assessment of peatland ecology or hydrology condition should specific measures of these parameters be required.
Previous work in peer reviewed publications (Alshammari et al., 2018; Alshammari et al., 2020; Bradley et al., 2022; Islam et al., 2022; Marshall et al., 2022) and NatureScot Research Reports (Marshall et al., 2021; Bradley et al., 2025) has demonstrated that measures of peatland condition can be derived from surface motion over large areas at up to 20 m spatial resolution from satellite radar data using an interferometric synthetic aperture radar (InSAR) technique. These methods have been developed via funding from University of Nottingham, NERC (NE/P014100/1; NE/T010118/1; NE/T006528/1), Leverhulme Research Leadership Award (RL-2019-002), Peatland ACTION and Forestry and Land Scotland. Much of this research has been supported by RSPB, Plantlife, as well as individual landowners, Highland Rewilding (Bunloit Estate) and Welbeck Estate.
The evolution of these methods is as follows. Using the novel InSAR methods developed by fellow academic Andrew Sowter, David Large developed the initial concept of using InSAR signals for peatland monitoring. These initial concepts were explored at an international workshop held in 2016 funded by the University of Nottingham and held at the Environmental Research Institute in Thurso. Following this workshop the then PhD student Lubna Alshammari demonstrated the first evidence of a systematic relationship between the nature of the InSAR signal and peatland condition (Alshammari et al., 2018; Alshammari et al., 2020). Simultaneously the first in a series of NERC grants was secured jointly between Roxane Andersen, Stuart Marsh and David Large to develop with postdoctoral researchers, Andrew Bradley and Chris Marshall, field validation and signal analysis techniques required to enable condition classification from the InSAR signal (Bradley et al., 2022; Marshall et al., 2022). The condition classification method developed at this stage is referred to as the Key Metrics Method. Towards the end of this period of development the first work was undertaken for NatureScot illustrating the potential of the Key Metrics Method over selected sites in Scotland (Marshall et al., 2021) and then subsequently applied to the Cairnsmore National Nature Reserve (Bradley et al., 2025). Cairnsmore was chosen as its Molinia dominated degraded peatlands were very different to those of the Flow Country where the Key Metrics Method was initially developed. Although the Key Metrics Method was functional it was complex to apply and lacked a strong statistical basis. To address this David Large and Roxane Andersen secured further NERC funding via the Landscape Decisions Programme to work alongside University of Nottingham statisticians Ian Dryden, Chris Fallaize and postdoctoral researchers Emily Mitchell and Andrew Bradley to develop a new Object Oriented Data Analysis (OODA) framework (a statistical machine learning approach) to analyse the data. This method was applied to both Cairnsmore and the Flow Country (Mitchell et al., 2024) where it was shown to be statistically robust and objective. At the same time a companion method for detecting change in the trend of a time series was developed and is detailed in this report. The method is considered valuable as it provides a measure of whether peatland is responding to interventions irrespective of whether there is a substantive change in condition. Both the change detection and OODA condition mapping methods are readily applied over large areas and were finally used to undertake a large area mapping exercise (Large et al., 2025a).
Alongside the development of these condition mapping techniques an entirely different technique was developed, using the same InSAR data, to assess landslide susceptibility (Islam et al., 2022; Large et al., 2025b).
The methods have now reached a point of development where they can be automated for large area deployment, integration with other datasets and large-scale testing against a spectrum of known conditions. This report summarises the status of these methods and introduces the new additional method of change detection.
Main findings
- Three methods have been developed to deliver the following products from the same surface motion data:
- Change detection maps that capture the timing, extent, direction and magnitude of change in peatland condition.
- Maps and summary data of peatland condition.
- Probability maps that capture the continuum of peatland condition.
- Landslide susceptibility maps – results are provided in a separate report (Large et al., 2025b).
- All methods have been validated with ground truth data.
- Computer code has been generated for all methods and they are now ready for large area deployment.
- Contextual data e.g. management history, is required to enable interpretation of trajectories of change.
- The success of the restoration work is dependent on the net balance between positive and negative change and is not a linear process under variable weather conditions.
- Different restoration techniques show a marked difference in the balance between positive and negative change, with wave damming being least prone to negative change.
Acknowledgements
The work was funded by NatureScot Peatland ACTION and the Natural Environment Research Council, Landscape Decisions Grant NE/T010118/1. We would like to acknowledge the NatureScot Peatland ACTION Data and Evidence team for supporting this research. We thank ScottishPower Renewables for the provision of spatial data of the peatland restoration work undertaken at Whitelee Windfarm. Roxane Andersen acknowledges funding from The Leverhulme Trust (RL-2019-002).
Abbreviations
Advanced Pixel System using Intermittent Baseline Subset (APSIS)
British Geological Survey (BGS)
Interferometric Synthetic Aperture Radar (InSAR)
Natural Environment Research Council (NERC)
Object Oriented Data Analysis (OODA)
The International Union for Conservation of Nature (IUCN)
Introduction
Since 2017 the University of Nottingham and the University of the Highlands and Islands with support from Forestry and Land Scotland and NatureScot Peatland ACTION have been developing objective methods that utilise peatland surface motion to produce a range of products to assess peatland condition at scale. This aimed to support monitoring and reporting on the outcomes of the large investments being made in peatland restoration in Scotland and to evaluate the impact of other land use developments on peatland condition (e.g. renewable energy).
The scale and ambition of this investment requires efficient and cost-effective methods for large area reporting of peatland condition. Reporting is required to inform peatland restoration priorities, quantify outcomes from investment, and identify and minimise risks. The methods detailed here have been designed to support this reporting requirement by providing objective and quantitative measures of peatland condition and change in condition.
Optical remote sensing methods for the analysis of peatland functions have been developed (Lees et al., 2018) over many years. However, the measures derived from optical imagery, although providing a valuable indicator of ecosystem health, have not proved sufficiently sensitive to spatial and temporal changes in peatland condition. Frequent cloud cover also results in a discontinuous and mosaicked optical record. In this respect the use of satellite radar is a distinct advantage as the measures are regular and unaffected by cloud cover.
Methods using backscattered synthetic aperture radar have also been developed (Lees et al., 2021; Toca et al., 2022) to quantify water table depths but struggle to provide significantly improved sensitivity to peatland condition when compared to optical methods (Räsänen, Tolvanen and Kareksela, 2022).
Surface motion, as measured by interferometric synthetic aperture radar, is sensitive to changes in the ecological and hydrological state of the peat observed on the ground (Alshammari et al., 2020; Bradley et al., 2022; Marshall et al., 2022). The reason for this is that surface motion is a direct and rapid response to changes in water storage and therefore displays a strong response to wetting and drying that precedes changes in plant functional type (Mahdiyasa et al., 2023). For example, following rewetting, swelling of the peat and a reduction in the rate of subsidence will occur before changes in vegetation.
Surface motion measures therefore add a new dimension to the analysis of peat condition over time by providing measures of the physical behaviour of the peat that are unobtainable by other remote sensing methods. Long term trends indicate whether peat is subsiding, stable or growing. Seasonal amplitudes indicate the softness, water table fluctuation and hence resilience of the peat. Timing of seasonal peaks indicate the water storage capacity and sites of water accumulation within a landscape.
This report summarises the available methods of surface motion analysis, their products and validation status. All methods use time series of surface motion generated using the APSIS InSAR technique (Sowter et al., 2013; Sowter et al., 2016, Bradley et al., 2022).
The surface motion analysis methods covered in this report are:
- Change detection method that quantifies the timing, magnitude and extent of change in condition over a site and is suited to reporting the outcome of restoration work or evaluating the impact of infrastructure development on peat.
- Condition mapping methods that use the characteristics of seasonal surface oscillations to quantify peatland condition for baseline assessment, strategic planning, and generation of comparative summary statistics. These methods are:
- Key metrics method modified after Bradley et al. (2022).
- Probability method that better captures the continuum in peatland condition than the discrete classification used for condition mapping (Mitchell et al., 2024).
Change detection and probability methods have been formulated on a strong statistical basis and are ready for large scale deployment and integration with other techniques and datasets. In the future the sensitivity of surface motion measures could be combined with the knowledge obtained from measures of landcover, emissions data and other observations to improve and tailor classifications.
Method developments since September 2022
- Following the report “Analysis of an InSAR “bog breathing” based classification of peatland condition relative to field observations in Cairnsmore NNR” (Bradley et al., 2025) the method for classifying peatland was iteratively refined by reference to the Flow Country to improve the classification’s general application to peatland across Scotland. When the classification scheme developed for Cairnsmore was applied to the Flow Country, it was deduced that dry weather induced high rates of subsidence causing areas of soft peat in good condition to be classed as being in poor condition. This was inappropriate as the known condition and dynamic nature of the peat surface indicated that despite subsiding during the period of observation the peatland surface could maintain its position relative to the water table. The resultant adjustment to the classification scheme involved a revision of the boundary between peat in good condition (blue) and peat that is degrading (black) (Figure 13). The revised classification now recognises that peatland displaying high amplitude seasonal surface motion could display subsidence over multiple years on account of dry weather while maintaining good condition.
- Numerical modelling, using the M-Peat model (Mahdiyasa et al., 2022) that simultaneously models the response of ecology, hydrology and peat physical properties, was undertaken for the relationship between amplitude and peat condition to better understand our interpretation (Mahdiyasa et al., 2023). This confirmed that soft, sphagnum-rich peatland should have a delayed peak timing relative to stiffer shrubbier peatland.
- Data filtering to isolate signals within the time series was improved for all methods by applying a tuneable spline method. This is a marked computational improvement on previous methods (Bradley et al., 2022).
- Development of the Object Oriented Data Analysis (OODA) method for analysis of peat condition and condition probability was completed as part of the NERC Landscape Decisions Programme (Mitchell et al., 2024). This is important as the newer OODA methods are more easily automated and statistically robust. OODA is an advanced branch of statistics that provides a framework for analysis (Marron and Dryden, 2021). The method itself involves several complex steps combined in a single OODA framework. These steps include how the measures of condition are extracted from the time series. To summarise, the time series is treated as an object and each object belongs to a pixel. The object is a mathematical functional representation of the time series that is compared to a template function to derive the measures of condition. The measures of condition are then processed and clustered.
- A change detection pilot study was undertaken on the Camilty forest to bog restoration site in West Lothian which generated the basis of a method capable of quantifying spatial and temporal change in response to restoration work. This method enables quantification of positive (e.g. recovery post restoration) or negative (e.g. degradation on account of drainage) change.
Overview of methods
Code has been developed for all the key computational steps, but this does not remove the need for manual checking of the data at various stages in the process to check underlying data quality.
Methods and example outputs are illustrated in the following sections. Descriptions focus on the principles and the interpretation of the outputs rather than the detailed methodology.
Change detection
This method assesses positive or negative change in trend (Figure 1) over a given period in the InSAR time series of surface motion. This can be used to track the success or failure of an intervention which alters the surface motion of the peat. For example, rewetting should slow or reverse the rate of subsidence of the peat surface and may initiate more pronounced (higher amplitude) seasonal surface oscillations. InSAR observations capture this change (Figure 2) and therefore enable analysis of the magnitude of the change, the timing of the change and whether it is a positive or negative change from a peatland condition perspective.
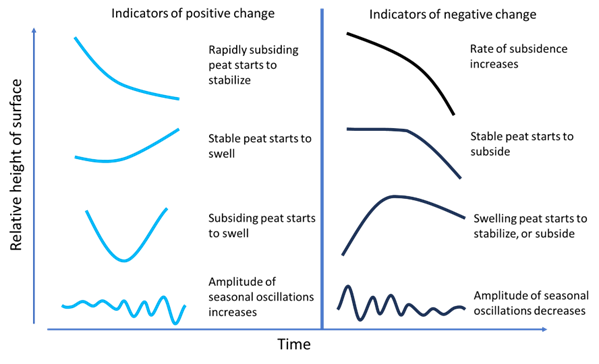
Figure 1: Illustration of positive and negative change in schematic examples of time series.
Click for a full description
Illustration of positive and negative change in schematic examples of time series plotted with respect to time on the x-axis and relative height of the peat surface on the y-axis. Indicators of positive change are shown on the left and include:
- Rapidly subsiding peat starts to stabilise.
- Stable peat starts to swell.
- Subsiding peat starts to swell.
- Amplitude of seasonal oscillation increases over time.
Indicators of negative change are shown on the right and include:
- Rate of subsidence increases.
- Stable peat starts to subside.
- Swelling peat starts to stabilise or subside.
- Amplitude of seasonal oscillations decreases over time.
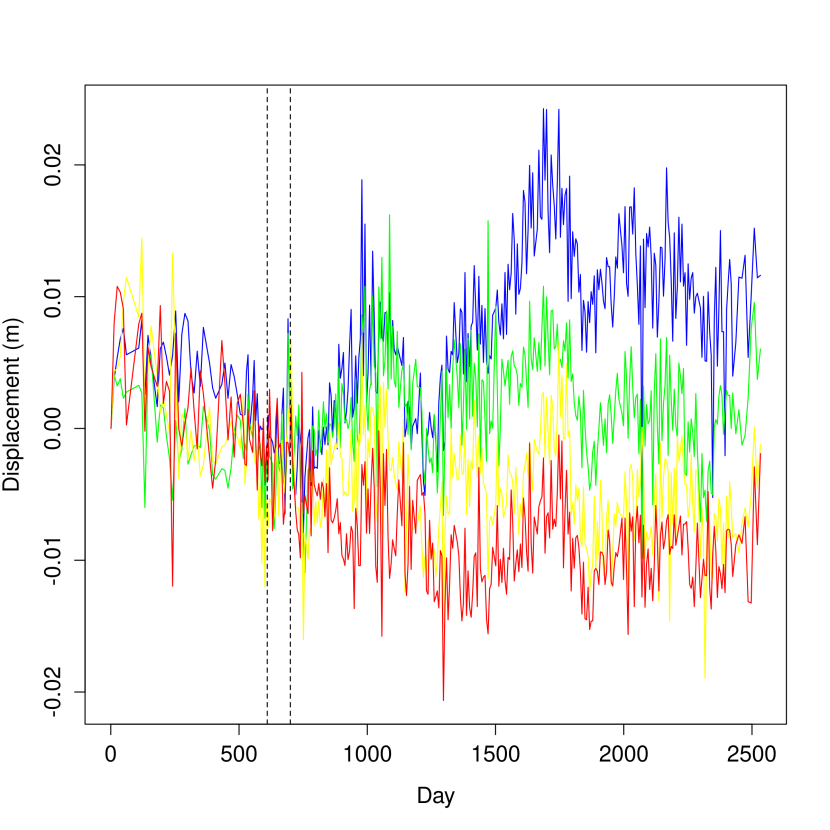
Figure 2: Four example time series that illustrate the full range of time series behaviour encountered in response to restoration at the Camilty study site. The period of restoration work is bounded by vertical dashed lines.
Click for a full description
An example illustrating the response of InSAR time series to restoration of the Camilty site in West Lothian. X-axis is time in days and the y-axis displacement in metres. The period of restoration work is bounded by vertical dashed lines. The different coloured time series are examples that illustrate the full range of time series behaviour encountered within the Camilty site. All the time series change following restoration work. The uppermost time series display rapid swelling and onset of high amplitude seasonal oscillations. The lowermost time series display a delayed decline in the rate of subsidence and low amplitude seasonal oscillations. Other time series are intermediate examples.
When interpreting change, it is important to be clear on what it means in relation to condition. For example, a positive change means that the peatland is evolving in a direction that could lead in due course to a better overall condition. An example of such a change would be a transition from subsiding to swelling on account of rewetting. A positive change does not imply the peatland is in good condition, it only implies that a positive change in the trend has occurred that may in time lead to better condition. Analysis of change must therefore be accompanied by an analysis of condition if the state of the peat is to be understood.
Areas that are degrading e.g. undergoing constant subsidence, at a relatively uniform rate, are also changing in so much as they are losing carbon and water. However, this type of continued, steady change will be represented in the condition class (degraded class) as it is not necessarily represented by a change in the behaviour of the time series.
Method
InSAR time series of surface motion was purchased from Terra Motion for an area of c.13,000 km2, approximately half of which covers the Midland Valley and half the Flow Country and part of the Northern Highlands. The time series data was generated from Sentinel-1 imagery. Within each 20 x 20 km tile, time series are provided representing the change in surface motion over time within each, approximately, 20 x 20 m pixel. This is a higher resolution than the 90 x 80 m pixel resolution used in previous work with Sentinel-1 data (e.g. Bradley et al., 2022), but the InSAR processing method used to generate the data is identical. Higher resolution analysis was chosen as this was considered more appropriate relative to the scale of typical restoration projects without being unmanageable from a data handling perspective.
The time series data is for the period 11th May 2015 to 8th January 2023. The following study areas were chosen for demonstration of the change detection technique:
- Whitelee Windfarm development, an area that was previously predominantly forested peatland.
- Dalchork, an area of forest to bog restoration.
The purpose of the analysis performed in this report is to illustrate what can be achieved using change detection with example outputs. Taking each time series, corresponding to each 20 x 20 m pixel, one at a time, the approach is to first determine the magnitude of change and whether it is positive or negative. A percentile-based classification is then used to classify the magnitude and direction of change relative to all other measures of change (one per 20 x 20 m pixel) within the study area. Data is reported for the area defined as containing peat in the Carbon and Peatland 2016 map layer (NatureScot, 2016). Classes 1, 2, 3 and 5 were used as they are identified as containing predominantly peat or peaty soils. It should be noted that Class 5 covers areas identified as peat soil but not containing peatland vegetation, and in many cases may cover areas of forestry on peat soil.
Change detection based on trend alone
Change according to trend is measured by taking the difference between the average gradients of a smoothed trend function (Mitchell et al., 2024.) through the surface motion time series for two, time windows of interest. If the trends have roughly the same gradient within each of the windows, change would be close to zero. In the extreme case, if the trend of the surface motion time series within the first window was rapidly increasing, suggesting an accumulation or swelling of the peat, whilst the latter window rapidly declines, suggesting the peat is now actively degrading, this would indicate a large negative change. Therefore, the magnitude of the change detection measure will capture the extent to which the trends differ between time windows. The change detection measure is computed for each pixel individually and then combined to classify change relative to other pixels within the study area.
The distribution of change detection measures within each study area is a smooth normal distribution. Change is classified based on percentiles: large positive change and large negative changes lying beyond the 90th and 10th percentiles respectively, slight positive and slight negative change lying in the 80-90th and 10-20th percentile range and the remainder in the 20-80th percentile classed as not significant change. The reason for choosing this range is to focus on extremes that are more likely the result of management intervention (e.g. restoration activity) and to avoid changes that are a subtle consequence of natural processes. The chosen percentile ranges are based on trial and error noting the range in which management related change are best expressed. The values are readily adapted to suit the purpose and on sites where subtle changes may be expected different percentile ranges may be appropriate. However, to enable comparability between areas, consistency is key.
Change detection is expressed in two different formats:
- Change between the periods 2015-2019 vs 2019-2023. This comparison is of two complete four-year periods with a slight overlap (Feb. to May) in 2019. This provides a measure of longer-term hotspots of change.
- Year on year change, comparing 2015/16 to 2016/17, 2016/17 to 2017/18, 2017/18 to 2018/19 etc. This approach only compares complete years starting 5th May 2015 or in other words complete annual hydrological cycles. So, no comparison is made to 2022/23 as the data for 2023 ends in January.
Change detection case studies
Two sites were chosen as case studies, the Whitelee Windfarm and the Dalchork, Forestry and Land Scotland restoration site (Figure 3). See Annex 2 for definitions of the peatland restoration techniques used at these sites.

Figure 3: Map showing the location of the Whitelee Windfarm and Dalchork.
Click for a full description
Whitelee Windfarm
The chosen windfarm study area is the large Whitelee Windfarm, on Eaglesham Moor, south of East Kilbride (Figure 4). Whitelee Windfarm was developed in two phases in 2009 and 2014 and so predates the InSAR data therefore change that is directly due to these activities may not be observed. Peatland restoration has occurred on the site since 2010, and data was provided to the authors with respect to location, year and restoration method. Overall change and sequential annual change were determined for the site. Examples of how this data can be interpreted in the context of restoration activities is illustrated below. Detailed analysis of the entire site is beyond the scope of this report.
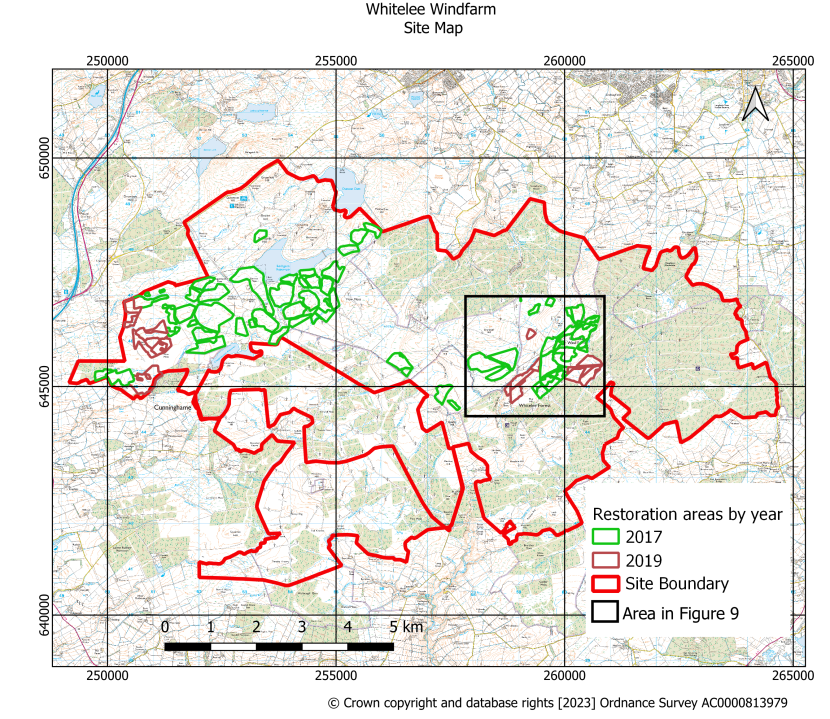
Figure 4: Map of the Whitelee Windfarm study area illustrating areas restored in 2017 and 2019 and the area assessed for sequential change in Figure 9.
Click for a full description
Discussion
Overall change
Overall change across the whole site (Figure 5) indicates that most negative change is associated with removal of forestry in areas for which no restoration is reported. Positive change is often associated with areas of peatland restoration, particularly in the western part of the site where the predominant restoration technique was ground smoothing of previously afforested areas. Other areas of positive change appear to be associated with young forest stands and may indicate that such plantations are prone to swelling or consolidation, which could result in a decrease in the rate of subsidence. Proper evaluation of the underlying reasons for the association with young plantations would require knowledge of site management.

Figure 5: Overall change map of the Whitelee Windfarm.
Click for a full description
To examine restoration progress, the percentage of the land area undergoing positive or negative change, classified as lying beyond the 80th and 20th percentiles respectively (Figure 6), was determined and plotted relative to year of restoration and with respect to the restoration methods used in each year (Figures 6, 7 and 8)
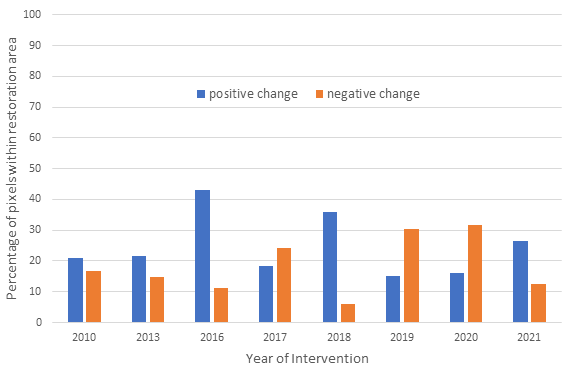
Figure 6: Graph illustrating the percentage of pixels, within Whitelee Windfarm restoration areas, showing a positive or negative trajectory of change by year of intervention. Change is based on comparing the period 2015 - 2019 to 2019 - 2023.
Click for a full description
Bar graph illustrating the percentage of pixels, within the areas of restoration, showing a positive or negative trajectory of change by year of intervention. Data is from Whitelee Windfarm and change is based on comparing the period 2015 to 2019 to the period 2019 to 2023. Percentage of pixels is given on the y-axis and year of intervention on the x-axis.
Areas showing little significant change predominate on all restoration sites. Restoration sites restored prior to 2017 display a balance towards positive change with less than 20% of their area undergoing negative change (Figure 6). There is a particularly strong bias towards positive change on sites restored in 2016 (Figure 6). Sites restored in 2017 have a slight bias towards negative change (Figure 6). Sites restored in 2018 and 2021 have a strong bias towards positive change with very little negative change (Figure 6). In 2019 and 2020 the bias is towards negative change (Figure 6).
A possible reason as to why restoration work undertaken in 2016, 2018 and 2021 is more prone to positive change is the methods used (Figure 7) in those years. A large percentage of the area in 2016 was subject to cross track and wave damming, whilst in 2018 only wave damming was deployed and in 2021 a large percentage of the area was subject to both ground smoothing and cross track restoration. These methods appear to result in more positive restoration trajectories than ground-smoothing alone as carried out in 2019 and 2020 (Figure 7). Overall greater amounts of negative change in the more recent forest to bog restoration sites is to be expected as in the first few years after clearing it is likely the relatively bare surface would continue to have a “degraded” time series due to high levels of evaporation, and only once a good cover of bog type vegetation is present would the surface potentially start to show positive signs of recovery (McKee, pers. comm.).

Figure 7: Graph illustrating the percentage of pixels, within the areas of restoration, showing a positive trajectory of change by restoration method and year of intervention. Data is from Whitelee Windfarm.
Click for a full description
Bar graph illustrating the percentage of pixels, within the areas of restoration, showing a positive trajectory of change by restoration method and year of intervention. Data is from Whitelee Windfarm and change is based on comparing the period 2015 to 2019 to the period 2019 to 2023. Percentage of pixels is given on the y-axis and year of intervention on the x-axis.
A general observation is that interventions using wave-damming and cross tracking display greater amounts of positive change than ground-smoothing.
In terms of capacity of the methods to prevent negative trajectories (Figure 8), ground smoothing with cross tracking, and wave damming with cross tracking, appear to be least susceptible to negative change.

Figure 8: Graph illustrating the percentage of pixels, within the areas of restoration, showing a negative trajectory of change by restoration method and year of intervention. Data is from Whitelee Windfarm.
Click for a full description
Bar graph illustrating the percentage of pixels, within the areas of restoration, showing a negative trajectory of change by restoration method and year of intervention. Data is from Whitelee Windfarm and change is based on comparing the period 2015 to 2019 to the period 2019 to 2023. Percentage of pixels is given on the y-axis and year of intervention on the x-axis. Note that the areas restored by cross track and wave-damming in 2016 displayed little or no negative change.
A general observation is that interventions using wave-damming and cross tracking typically display less negative change than ground-smoothing.
Another interpretation is that in comparison to ground smoothing, wave damming is less susceptible to hydrological stress and hence variable weather. In making these interpretations it should be noted that ground smoothing is typical of forest to bog restoration, but wave damming is generally used in open blanket bog and these differences may also influence the outcome.
Sequential annual change
As an example of how year on year change can be monitored, we examined a cluster of areas that were restored in 2017 and 2019 (Figure 9). The 2017 areas were restored by ground smoothing in previously afforested areas, and wave damming in blanket bog areas. The 2019 areas were only restored by ground smoothing.
Areas restored in 2017 by ground smoothing mostly show a negative change in 2017, 2018 and 2020 and marked positive change in 2019 and 2021. By 2021 most of the 2017 areas are showing marked positive change. As the ground smoothing will initially leave a predominantly bare peat surface a rapid improvement in condition is not to be expected, with a positive response more likely to be detected after several years once bog vegetation is established. Areas restored by wave damming in 2017 show some positive change and almost no negative change confirming our previous conclusion.

Figure 9: Sequential annual change over a selected area of Whitelee.
Click for a full description
Sequential annual change over a selected area of Whitelee showing areas restored in 2017 and 2019. The method of restoration used in each area is indicated in the top left map in which GS indicates ground smoothing and WD indicates wave damming.
Areas restored in 2019 are more mixed with either little change or an immediate large negative change in 2019 with lesser areas of negative change in subsequent years. As these areas had all undergone ground-smoothing the absence of an immediate positive response is not unexpected given the intensity of the groundwork and the time that is required for vegetation to return.
The localisation of year-on-year positive and negative change to areas of restoration is because it is in these areas that water is being successfully stored and therefore it is also these areas that will be most prone to weather induced water loss on account of having more evaporation from open water trapped in pools behind peat dams. Overall success of the restoration work is therefore dependent on the net balance between positive and negative change and is not a linear process under variable weather conditions.
Overall change 2015-2019 vs 2019-2023 gives a slightly different picture with 2017 ground smoothing areas (Figure 5) looking particularly negative. The reason for this is almost certainly the difference in the periods of observation with the measure of overall change including the hot dry summer of 2022, whereas the annual change measure does not include data beyond May 2022.
Impact of infrastructure on peat condition
There is a desire to understand the impact of infrastructure, particularly floating roads, on the condition of peat. The concern is that floating roads will compact the peat and disrupt the hydrology, causing upslope areas to wet and downslope areas to dry. Although marked contrasts can be observed either side of roads (e.g. in the vicinity of Laird’s Seat, OS Grid Ref. NS600455) in Whitelee, these contrasts also correspond to areas with different management and restoration histories and the exact position of floating roads that may be of concern is not known nor is the history of road development. This illustrates the importance of contextual information as without it, reliable interpretations of the patterns of change relative to infrastructure development are difficult.
Dalchork
The Dalchork study area is an area (Figure 10) of forest to bog restoration in the Northern Highlands on the northeast bank of Loch Shin that was previously investigated by the authors (Marshall et al., 2021). The site (Figure 10) has seen sustained, multiphase forest to bog restoration over the period of the InSAR data and therefore makes a good test case for change detection with the expectation that change should occur in response to discrete areas of management activity. The site consists of multiple former blocks of forestry and areas that had been drained for forestry, but not planted, most of which have subsequently undergone restoration by a variety of techniques at various times. Although the fine details of these interventions have not been provided to the authors the area presents a complex mosaic of sites many of which were restored during the 2015 to 2023 period of InSAR observation. It therefore makes an ideal area for Forestry and Land Scotland and NatureScot to validate the results of change detection.

Figure 10: Dalchork study area shown within red polygons and the individual restoration sites for which detailed assessment is provided in Annex 1. Note that the site South Corries II ground smoothing is within area 4 and is not shown separately.
Click for a full description

Figure 11: Change detection for the period 2015-2019 vs 2019-2023 within the Dalchork area. Ordnance Survey British National Grid is displayed.
Click for a full description

Figure 12: Pie charts showing overall and sequential change for three example restoration areas in Dalchork. (A) South Corries (restored in year 4), (B) Lub Ruadh IV (restored in year 3), (C) Crask I (restored in year 2, and possibly year 3).
Click for a full description
Pie charts showing overall and sequential change for three example restoration areas in Dalchork. Each chart represents the percentage of the total pixels within each class within the area of restoration (A) South Corries was restored in 2018/19 (year 4) and shows marked negative change following intervention followed by signs of positive change in 2021/22. (B) Lub Ruadh IV was restored in 2017/18 (year 3) and sustained positive change following restoration, and (C) Crask I was restored in year 2, and possibly year 3 and shows a negative response in 2018/19 (yr4), post restoration followed by increasing positive change year on year thereafter. Details are provided in Annex 1. Dark blue and pale blue are used to illustrate positive change exceeding the 90th and 80th percentiles, respectively. Red and orange are used to indicate negative change below the 10th and 20th percentiles respectively.
Discussion
A general observation is that areas of pronounced change (Figure 11) are generally associated with discrete former forest blocks. This suggests that the changes will be linked to specific management activities on the various blocks.
Details of the restoration history were provided by Forestry and Land Scotland for a selection of blocks within the Dalchork area. For each block a pie chart of overall change (2015-19 vs 2019-23) is reported alongside pie charts of sequential annual change (examples given in Figure 12). Most restoration work occurred between 2016/17 and 2018/19. To illustrate the application of change detection alongside condition mapping, an interpretation of each individual sub-site is given in terms of change and a qualitative assessment of condition probabilities for the period 2019/23 (Annex 1).
Notable observations are as follows:
- Negative change is observed on some sites following restoration work (e.g. South Corries III (Figure 12), Loch Fuarlachd, Druim II), presumably on account of the intervention techniques. This was then followed by a sudden shift to positive change.
- Lub Ruadh IV (area 35) (Figure 12), shows an almost instant response to restoration with a subsequent trajectory in favour of positive change.
- Crask 1 (Figure 12) displays a very gradual change post restoration with the balance between negative and positive change gradually shifting from negative to positive over subsequent years.
Discussion of the results of Whitelee and Dalchork
Results from both sites indicate that change detection enables quantification of the response to restoration. Key learning points from these observations are:
- Contextual data e.g. management history, is required to enable interpretation of trajectories of change.
- The success of the restoration work is dependent on the net balance between positive and negative change and is not a linear process under variable weather conditions.
- Different restoration techniques show a marked difference in the balance between positive and negative change with wave damming being least prone to negative change.
Condition mapping methods
Simpler condition mapping methods have been developed here than those initially published in Bradley et al. (2022). Also provided is a clearer understanding of how to interpret the various metrics, limitations, and potentially confounding situations (Table 1). These methods now lend themselves to statistical machine learning and integration with other peatland data sets. Classification schemes (Table 1) can be used for comparison between sites or adapted to understand local variability within a site.
The two new methods for generating condition maps are outlined below and the pros and cons of each method discussed.
The two methods are:
- Key Metrics Method (output is condition class, method requires a degree of oversight and possibly manual adjustment) - (Bradley et al., 2022).
- Condition Probability Method (output is a condition class and an associated probability of this class, this method is more automated) – developed in this work.
Condition classes associated with the two methods are shown in Table 1.
A commentary on each of the outputs and associated methods is provided below.
| Key metric | Interpretation |
|---|---|
| Amplitude of seasonal swelling |
|
| Timing of maximum seasonal swelling |
|
| Multiannual velocity |
|
| Limitations |
|
| Potentially confounding situations |
|
| Class (colour) | Class Description | Example Description | Class (colour) | Class Description | Example Description |
|---|---|---|---|---|---|
1a
| Dynamic surface displaying high amplitude oscillations and mid to late winter peak timing | Near natural sphagnum-rich peatland | 1
| High amplitude seasonal oscillations with stable to rising, potentially oscillatory multiannual trend | Near natural or rewetted peatland with a shallow water table |
1
| Dynamic surface displaying high amplitude oscillations and non-distinctive peak timing | Rewetted, recovering peatland | 1
| High amplitude seasonal oscillations with stable to rising, potentially oscillatory multiannual trend | Near natural or rewetted peatland with a shallow water table |
1b
| Less dynamic peatland often with lower amplitude surface motion and distinct early autumn peak timing | Peatland on steep slopes and well drained margins | 2
| Variable amplitude seasonal oscillations and stable to low amplitude oscillations in the trend | Drier peat with a lower water holding capacity typical of steep slopes and margins |
2
| Stiff consolidated peat, with low amplitude surface movement and velocity close to zero | Naturally drier very stiff, thin peat tending to mineral soil | 2
| Variable amplitude seasonal oscillations and stable to low amplitude oscillations in the trend | Drier peat with a lower water holding capacity typical of steep slopes and margins |
3
| Moderately subsiding | Actively degrading and/or at early stages of recovery from a more degraded state | 3
| Sustained subsidence in the trend possibly at variable rates without evidence of any marked swelling | Actively subsiding and eroding peat e.g. drained peat or peat haggs |
4
| Rapidly subsiding | Actively draining deep peat on account of drains or erosion. e.g. peat haggs. | 3
| Sustained subsidence in the trend possibly at variable rates without evidence of any marked swelling | Actively subsiding and eroding peat e.g. drained peat or peat haggs |


Key Metrics Method
The original method, published in Bradley et al. (2022), was based on three key metrics derived from the InSAR surface motion time series. These key metrics are the multiannual InSAR velocity, the amplitude, and the timing of seasonal peaks. The new Key Metrics Method is based primarily on a quantifiable graphical representation of velocity and amplitude (Figure 13) with the peak timing of the seasonal peak used to further refine the classification of peat in relatively good condition (Table 1, Classes 1, 1a and 1b).
Since submission of the report, “Analysis of an InSAR “bog breathing” based classification of peatland condition relative to field observations in Cairnsmore NNR”, (Bradley et al., 2025) the method has been iteratively refined using known conditions in the Flow Country (Figure 13A) to produce a revised classification scheme (Figure 13B) and then applied to Cairnsmore (Figure 14), Moss of Crombie, the Flow Country and a selection of other sites in the UK. The results from this process are:
- Similar conditions from different sites display similar metrics.
- The revised classification scheme differentiated conditions on all sites.
- Despite short term subsidence on account of weather events (e.g. successive dry years) high amplitudes indicate that the peat is in good condition.
- The classification scheme can be adapted to differentiate conditions in greater detail for example to highlight local variations on an overall degraded site.
- Scatter plots of velocity vs. amplitude can enable comparison of differences in condition between sites.
- The key metrics of velocity and amplitude can be used to measure restoration trajectories and compare the response to different restoration techniques.
Peak timing could also be applied to further refine classes 2, 3 and 4 in the same way as class 1. Class 2 can be sub-divided into a rapidly uplifting stiff class (high velocity and low amplitude) that should correspond to areas likely to be experiencing deep rewetting such as those encountered at the margins of recently blocked, deep drains.
This method could be used for comparison between sites at the national scale to generate summary statistics, plotting of restoration trajectories and consistent condition mapping.
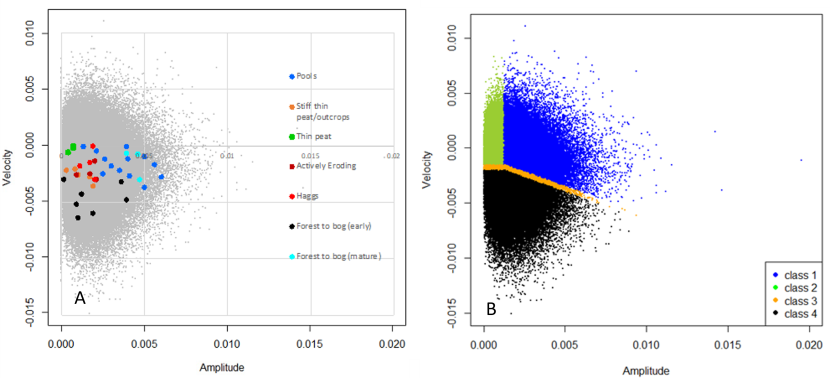
Figure 13. A) Velocity-amplitude plot of the Flow Country key metrics (grey dots) with the position of selected known peatland conditions superimposed, B) peatland condition classification used in the Key Metrics Method.
Click for a full description
A) Velocity-amplitude plot of the Flow Country key metrics (grey dots) with the position of selected known peatland conditions superimposed, B) peatland condition classification used in the Key Metrics Method based on the velocity-amplitude characteristics of known peatland conditions illustrated in A). Class 1 is peat in good condition, class 2 is peat in stiff condition and classes 3 and 4 are both peat in degrading condition. Velocity on the y-axis is given in metres per year and amplitude on the x-axis is in metres.
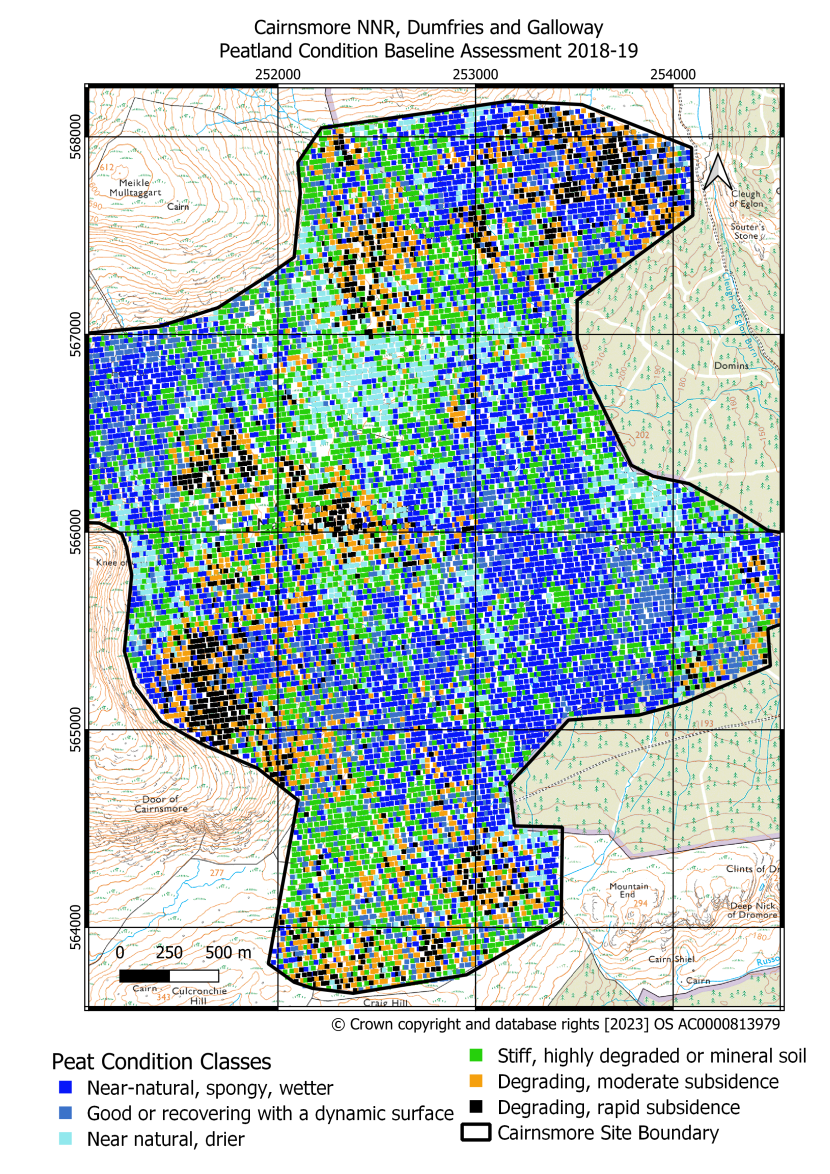
Figure 14: Example classification of the Cairnsmore National Nature Reserve using the revised Key Metrics Method. Classes are described in Table 2. Ordnance Survey British National Grid co-ordinates are displayed.
Click for a full description
Condition Probability Method
The Condition Probability Method is an unsupervised statistically robust Object Oriented Data Analysis (OODA) method (Mitchell et al., 2024) for determining the probability that an area is in each condition class. It is based entirely on the InSAR time series and uses the trend and measures equivalent to the amplitude and timing of the seasonal peaks.
Notable advantages of this method are its statistical basis, and that probability better captures the continuum of peatland conditions than the rigidly defined class boundaries of the Key Metrics Method.
Application of this unsupervised classification to the Cairnsmore NNR (Figures 15, 16 & 17) demonstrates that it illustrates similar spatial patterns to the Key Metrics Method. Proper evaluation of the two methods would require another site visit to systematically gather field data from areas where the classification differs. Further comments on the comparison and validation of these methods are given later in this report (under the Validation section).

Figure 15: Probability map for actively degrading peat in the Cairnsmore National Nature Reserve. Ordnance Survey British National Grid co-ordinates are displayed.
Click for a full description

Figure 16: Probability map for good (or rewetted) peat in the Cairnsmore National Nature Reserve. Ordnance Survey British National Grid co-ordinates are displayed.
Click for a full description
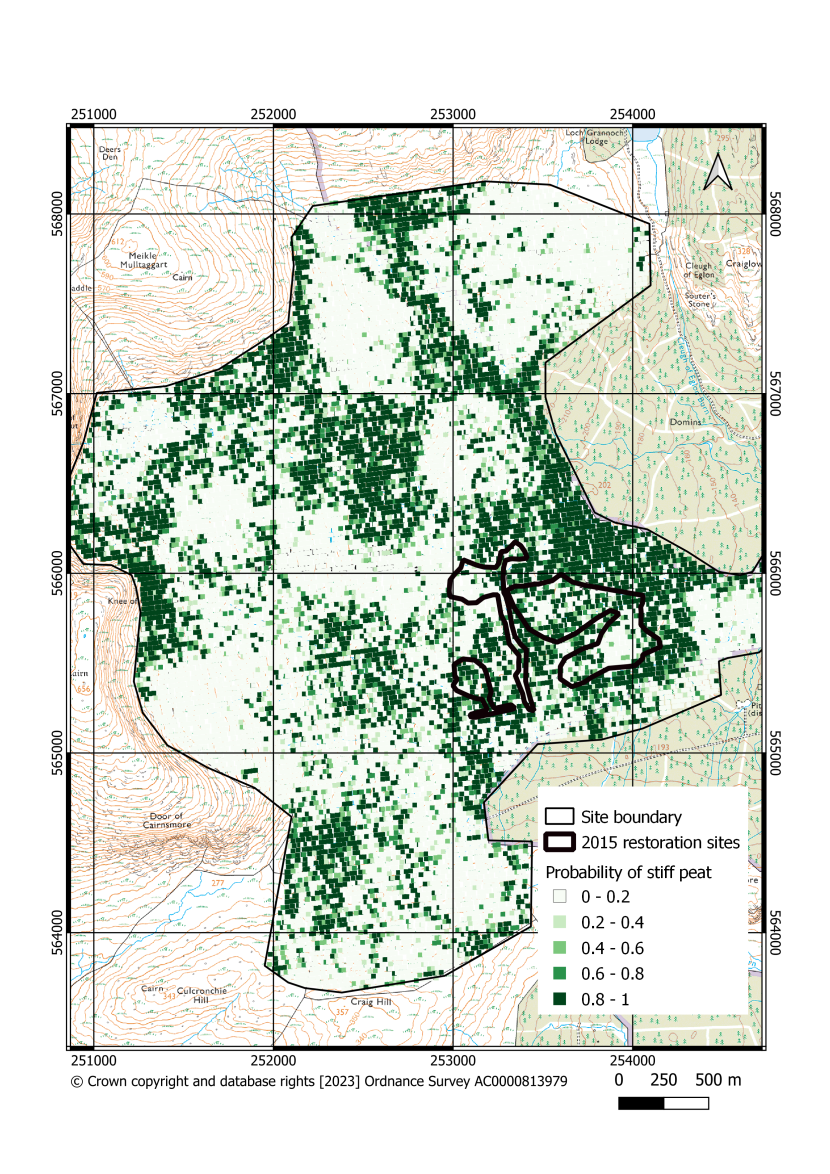
Figure 17: Probability map for stiff (or degraded) peat in the Cairnsmore National Nature Reserve. Ordnance Survey British National Grid co-ordinates are displayed.
Click for a full description
The Condition Probability Method can be used to generate two classified products either maps of the reported probability or maps based on the maximum probability of a given condition in each pixel to produce a condition map that is similar to that generated by the Key Metrics Method (Figure 18). The resulting classification is more definitive than the individual probability maps and conveys similar patterns. However, a level of caution should be exercised as the maximum probability classification does not mean that there is a high probability of the classified condition. For example, a pixel classed as being in a specific condition could have a maximum probability as low as 0.34.
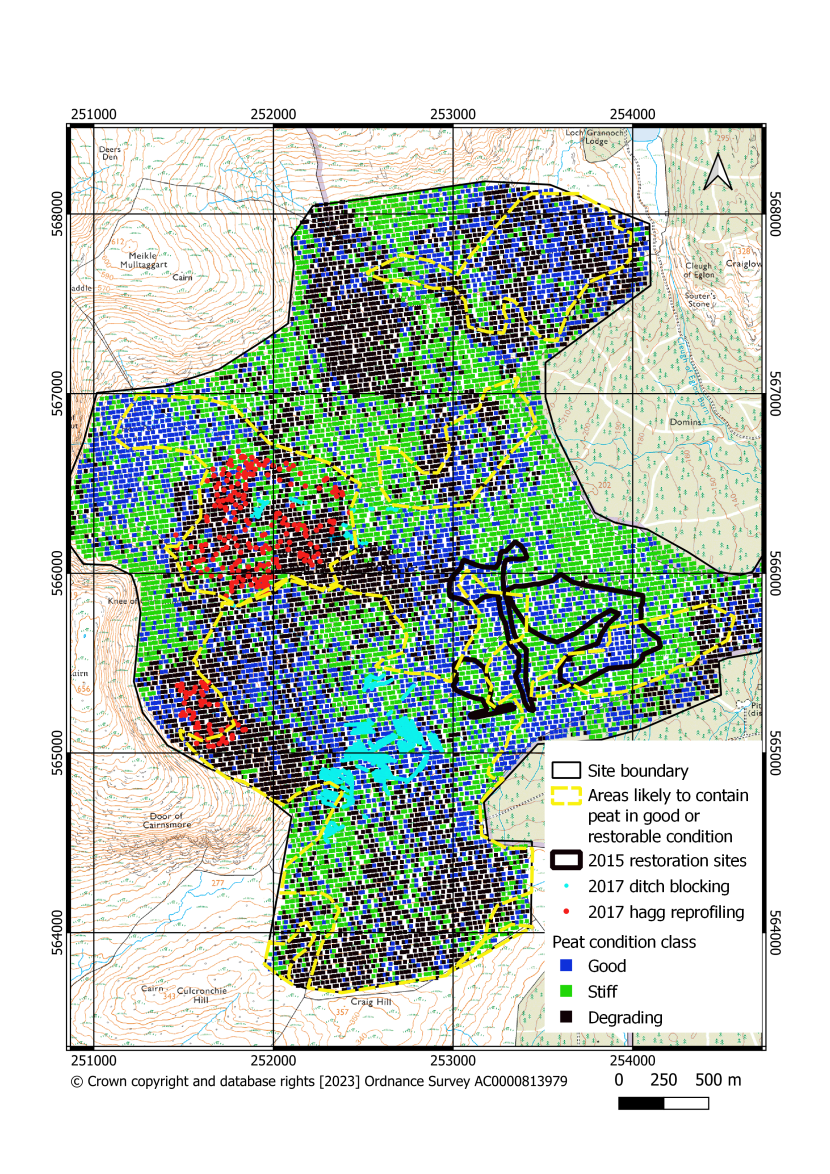
Figure 18: Maximum probability map of all three peat condition classes in the Cairnsmore National Nature Reserve. Classes are described in Table 2. Ordnance Survey British National Grid co-ordinates are displayed.
Click for a full description
Discussion and Comparison of Condition Classification methods
The pros and cons of the two main methods are outlined below.
Key Metrics Method
- Intuitively sensible and easily explained.
- The method uses a single linear velocity value (i.e. a straight line fit to the data) that is determined for the entire period of interest whether appropriate or not, whereas the Probability method benefits from utilising the shape of the trend over time.
- Graphical representation of velocity and amplitude metrics enables comparison of conditions between and within large areas.
- In practice, the method requires existing computational algorithms to identify peaks and troughs which can be unreliable and require some manual checking and input.
- Requires pre-defining a year within which one peak and one trough are expected to occur, but sometimes peaks/troughs can fall outside this due to variability in the timing of seasonal oscillations. Over Cairnsmore, these factors resulted in a loss of 2,000 data points out of 15,000 in some years. Automation of this method is therefore problematic.
Condition Probability Method
- Flexibly detects peaks and avoids the need to define boundaries of a "motion year".
- Utilises an equivalent measure to the amplitude metric.
- Utilises the shape of the trend rather than a multiannual linear velocity metric, and therefore captures information on annual change.
- Reliably captures useful additional information on peak timing.
- The computational algorithms utilised within the method are well understood.
- The statistical basis of the method allows robust probabilistic statements about peat condition to be made.
- The method can be easily automated.
- The method is the basis for statistical machine learning techniques which can incorporate other concomitant information such as remote sensing and field data to further refine and validate statistically robust measures of condition.
Comparison of the results of the condition mapping methods
In the absence of additional field data, the best means of assessing the accuracy is comparison to the following data sources (Figures 19 and 20):
- Areas shown as peat on the 1:50,000 British Geological Survey (BGS) Drift (superficial deposits) map (Armstrong et al., 2016). This information was based on field observation of deep peat soil prior to 1925. Deep eroding peat will have been most obvious to a field geologist.
- Areas on the Carbon and Peatland Map 2016 (NatureScot, 2016) mapped as peatland (i.e. predominantly peat or peaty soil with peatland vegetation); this encompasses classes 1, 2 and 3.
- Mapped areas that have undergone peatland restoration; in this case in 2015 and 2017.
When making this comparison, it should be noted that the 20 m resolution of the maximum probability data appears to be greater than the effective resolution of either the BGS map or the Carbon and Peatland 2016 map.

Figure 19: Comparison of the Maximum probability method condition maps to areas likely to contain peat in good or restorable condition (NatureScot, 2016). Ordnance Survey British National Grid co-ordinates are displayed.
Click for a full description
Comparison of the Maximum probability method condition maps to areas likely to contain peat in good or restorable condition in the Cairnsmore National Nature Reserve. Peat areas were derived from the combination of classes 1,2 and 3 in the Carbon and Peatland 2016 map (NatureScot, 2016). Also shown are areas of peatland restoration activities in 2015 and 2017.
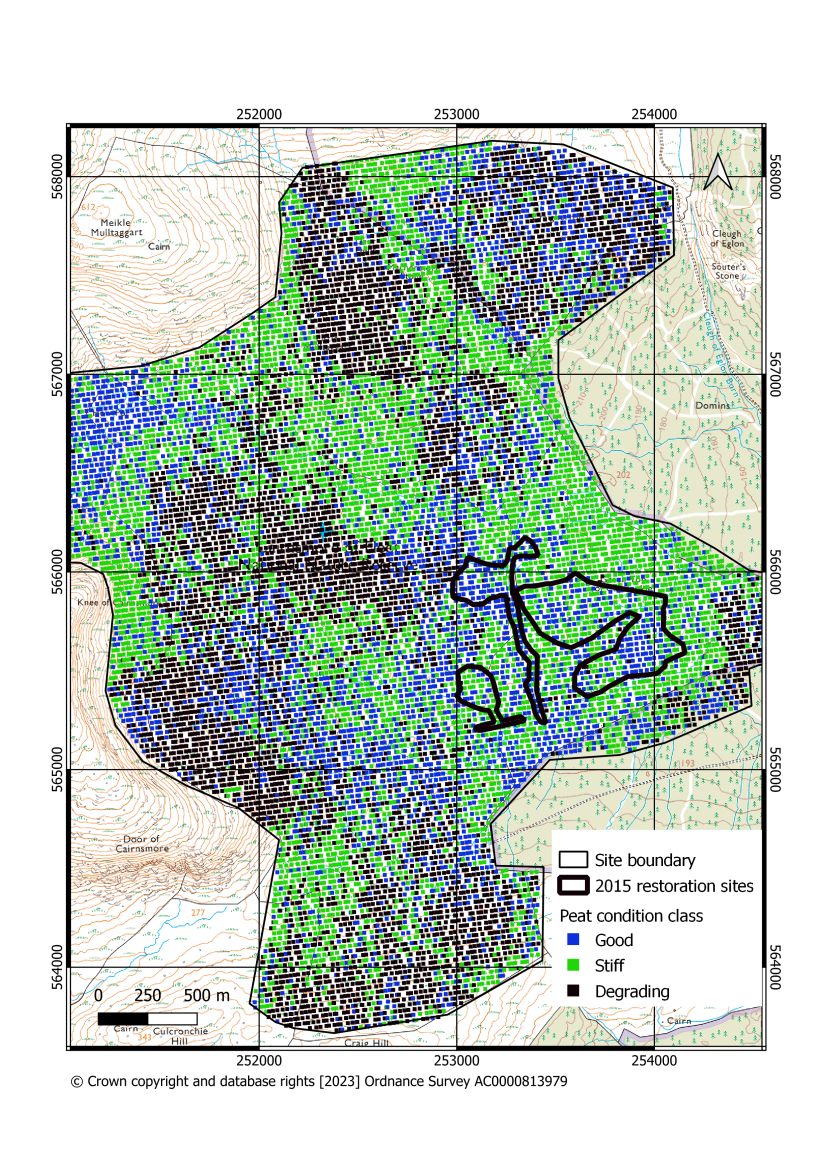
Figure 20: Comparison of the maximum probability method condition maps to areas likely to contain deep peat in the Cairnsmore National Nature Reserve as shown on the British Geological Survey 1:50,000 drift map.
Click for a full description
Comparison of the maximum probability method condition maps to areas likely to contain deep peat as shown on the British Geological Survey 1:50000 drift map. Mapping of the peat areas was undertaken prior to the first publication of a solid and drift map in 1925 and remains unaltered on the 1981 map. Also shown are sites and areas of peatland restoration activity in 2015 and 2017.
Areas mapped as either degrading or in good condition on the maximum probability map display excellent correspondence to the areas indicated as containing peat via the above data sources. Areas mapped as ‘stiff’ correspond to areas where peat is absent in one of the reference peat layers. This would be expected as thinner or discontinuous peats are more likely to be overlooked.
The greatest divergence between the maximum probability map, the BGS and Carbon and Peatland Map 2016 is right in the centre of the area where the maximum probability map predicts peat in either good or degrading condition and other maps indicate no peat or heather moorland on peat. To resolve this would require testing in the field.
The Key Metrics Method identifies similar patterns but with more areas showing peat in either good, recovering or stiff condition than the Probability method. Many areas classed as ‘stiff’ on the maximum probability map that correctly correspond to areas most likely to be non-peatland on the geological and 2016 maps are shown in pale blue (stiffer shrubby peat) or green (stiff to mineral soil) on the Key Metrics map.
Although the Key Metrics Method can be compared to the maximum probability map it cannot be compared to the individual probability maps as the Key Metrics Method is based on hard class boundaries and does not consider gradational or mixed conditions.
In conclusion, the simpler 3 class probability maps and maximum probability maps provide the most consistent and easily understood comparison to the available data on the distribution of peat in the Cairnsmore area. The probability maps also provide a more in-depth view of variation and transition in peatland properties.
Validation
There are three questions with respect to the validation of the InSAR methods for monitoring peatland condition:
- Does the method accurately and/or precisely measure the surface motion of the peatland?
if so,
- Do the characteristics of peatland surface motion relate to the condition of the peat?
and,
- How do the classified characteristics of the peatland surface motion relate to other measures of peatland condition and known changes in condition?
If the answer to questions 1 and 2 is “yes” then the method is undoubtedly capable of providing information on the condition of the peatland. However, only by knowing the answer to question 3 can the methods be put to good use.
With respect to the first of these validation questions, it has now been shown by multiple and independent surveys (Marshall et al., 2022; Alshammari et al., 2018; Hrysiewicz et al., 2023; Tampuu et al., 2020) that the InSAR method provides a precise measure of the surface motion, but that it underestimates the magnitude of the motion. It is therefore precise but inaccurate. Observed signals reliably indicate whether an area is subsiding, stable or growing, and the relative magnitudes of this motion. The observations also show whether one area of peat displays a higher or lower seasonal oscillation amplitude than another. The main limit to these measures is the ambiguity threshold, which is exceeded when the movement between pairs of images exceeds a quarter of a wavelength (>1.39 cm for C-band radar ~5.55 cm wavelength). Movement exceeding 1.39 cm in the 6 or 12 days between successive images used to generate the time series is an extraordinarily high rate of subsidence. Beyond this threshold the method cannot resolve the direction of motion. During the drought of 2018 the ambiguity threshold was briefly exceeded in localised areas of peat in extremely good condition in the centre of the Munsary peatlands (Marshall et al., 2022), but this did not compromise the overall condition classification of this area which was based on multiannual observations (Bradley et al., 2022).
With respect to the second of these validation questions, independent published studies have demonstrated that the surface motion characteristics are related to the condition of the peat as characterised on the ground using more traditional methods such as vegetation-based classification, water level monitoring, management history, etc (Price, 2003; Howie and Hebda, 2018; Morton and Heinemeyer, 2019; Evans et al., 2022). If the InSAR measures are therefore accepted as providing a measure of the surface motion, then the InSAR signals should relate to the condition of the peatland. The reason for this relationship is the well-established coupling between the plant ecology, hydrology and mechanical behaviour of the poroelastic peat (e.g. Ingram, 1983; Almendinger, Almendinger and Glaser, 1986).
With respect to the third validation question, statistical validation of the relationship between the InSAR signal and key metrics methods using a range of approaches has been published for the Flow Country and have included extensive ground truthing (Alshammari et al., 2020, Bradley et al., 2022). Validation methods for the Flow Country were developed in two stages, in both instances using a “blind” validation method where ground-based classification was done in situ without prior knowledge of InSAR-derived classification. First a study was completed using only measures of vegetation type in 10 x 10 m quadrats centred on 22 random InSAR pixels within the Flow Country (Alshammari et al., 2020) and later using measures of land use and land use history, plant functional type, topography, and drainage, with site visits to and data recorded in > 300 discrete landscape “polygons” larger in size (0.3-0.6 km2) (see details in Bradley et al., 2022). Although validation of the probability methods was not undertaken at this time it was applied to the same areas analysed in detail in Bradley et al. (2022), where it reliably reproduced classification of areas known to be in good and degrading conditions (Mitchell et al., 2024). The conclusion from this work was that the classified InSAR signals reliably identify peat in good and degrading condition.
A further advancement of the validation method involved incorporating a measure of softness, a much more direct link to the poroelastic properties of the peat. This was applied to Cairnsmore. However, application to Cairnsmore, as reported (Bradley et al., 2025), did not go to plan due to lack of clarity on field definitions (size of area to look at, differences between stiffness categories, mutually exclusive categories, etc.). Further, it became apparent that the field measures developed largely from the Flow Country research had not been developed to target the narrower range of more degraded and Molinia dominated conditions encountered at Cairnsmore, picked out by the InSAR classification. Consequently, both methods required further amendments. Despite this the linear discriminant analysis applied to the relatively small dataset gathered in the field did indicate that the InSAR separated different conditions (particularly degrading and good conditions) and that both Key Metrics and Probability methods correctly identified the same degrading areas.
Further evidence of the capacity of the methods to differentiate condition is the ability of key metrics (amplitude and velocity) to track and compare restoration trajectories. This work has been presented at the IUCN peatland conference and various workshops and is currently being prepared for publication by Chris Marshall.
While it is easy for field observations to capture extremes it is much harder and time consuming to quantify the subtle and multifaceted changes in condition that determine the InSAR response. Based on walking the land extensively, our observation is that the InSAR is sensitive to a continuum in how the peat responds to changes in water storage. Guidance is therefore required on what condition classes are useful, particularly to guide an appropriate level of additional validation.
The change detection method has not been validated beyond the Camilty case study. In this case study it correctly identified that the 10 ha restoration site that included some 20 of the 50 most changed pixels out of 40,000 pixels within the greater study area, and that all pixels on the site displayed varying degrees of positive change following intervention to restore the site.
In summary,
- Methods reliably separate very good and degrading conditions, as demonstrated by extensive and robust field-based validation.
- Statistical validation has been published in the peer-reviewed literature, with reviewers commending the scale of the ground truthing efforts.
- The ability of condition mapping methods to capture intermediate conditions has not yet been sufficiently validated.
- Comparison of methods at Cairnsmore indicate that the probability methods may better differentiate stiff peat/heath/mineral soil from peat in good condition than the Key Metrics method, but more validation is required.
- To aid further validation, NatureScot need to provide more field data and guidance on what condition classes they would like to validate and what additional validation is required.
Recommended approach for using the condition and change detection methods
We recommend the following general approach:
- Undertake a baseline survey of condition using the Probability Method over a minimum complete three-year period.
- Determine positive (improving) and negative (degrading) change in each period.
- Update the baseline survey using the Probability method at regular intervals to review restoration progress.
This would result in the following outputs:
- Quantified areas of positive and negative change together with maps.
- Condition maps and a quantitative summary of peatland condition in each area.
In combination these outputs should enable quantitative and objective assessment of whether following a positive change (on account of rewetting) a site evolves into a good condition (and vice versa).
The results can be used to:
- Measure success of restoration.
- Assess impact of infrastructure development.
- Assess impact of climate change over long periods.
- Guide restoration strategy through an understanding of what interventions work well.
- Compare outcomes of different restoration methods.
References
Armstrong, R.A., Daley, D.L., Lawley, R., Myers, A.H. & Smith, A., 2016. User Guide for the BGS Geology: 50k dataset (V8). British Geological Survey Open Report, OR/16/46.
Almendinger, J.C., Almendinger, J.E. and Glaser, P.H., 1986. Topographic fluctuations across a spring fen and raised bog in the Lost River peatland, northern Minnesota Journal of Ecology, 74, 393–401.
Alshammari, L., Large, D.J., Boyd, D.S., Sowter, A., Anderson, R., Andersen, R. and Marsh, S., 2018 Long-term peatland condition assessment via surface motion monitoring using the ISBAS DInSAR technique over the flow country, Scotland Remote Sensing, 10(7), 1103.
Alshammari, L., Boyd, D.S., Sowter, A., Marshall, C., Andersen, R., Gilbert, P., Marsh, S. and Large, D.J., 2020. Use of surface motion characteristics determined by InSAR to assess peatland condition Journal of Geophysical Research: Biogeosciences, 125.
Bradley, A.V., Andersen, R., Marshall, C., Sowter, A. and Large, D.J., 2022. Identification of typical ecohydrological behaviours using InSAR allows landscape-scale mapping of peatland condition Earth Surface Dynamics. 10(2), 261-277.
Bradley, A.V., Mitchell, E., Dryden, I., Fallaize, C., Islam T.I, Large, D.J., Andersen, R. and Marshall, C., 2025. Analysis of an InSAR “bog breathing” based classification of peatland condition relative to field observations in Cairnsmore National Nature Reserve NatureScot Research Report 1308.
Evans, C., Artz, R., Burden, A., Clilverd, H., Freeman, B., Heinemeyer, A., Lindsay, R., Morrison, R., Potts, J., Reed, M. and Williamson, J., 2022. Aligning the Peatland Code with the UK peatland inventory Report to Defra and the IUCN Peatland Programme.
Howie, S.A., and Hebda, R.J., 2018. Bog surface oscillation (mire breathing) a useful measure in raised bog restoration Hydrological Processes, 32, 1518-1530.
Hrysiewicz, A., Holohan, E.P., Donohue, S. and Cushnan, H., 2023. SAR and InSAR data linked to soil moisture changes on a temperate raised peatland subjected to a wildfire Remote Sensing of Environment, 29.
Ingram, H.A.P. 1983. Hydrology. in A.J.P. Gore, ed. 1983. Mires: Swamp, Bog, Fen and Moor, vol. 4A, General Studies. New York, Elsevier Science, pp.67–158.
Islam, M.T., Bradley, A.V., Sowter, A., Andersen, R., Marshall, C., Long, M., Bourke, M.C., Connolly, J. and Large, D.J., 2022. Potential use of APSIS-InSAR measures of the range of vertical surface motion to improve hazard assessment of peat landslides Mires and Peat, 28.
Loisel, J. and Gallego-Sala, A., 2022. Ecological resilience of restored peatlands to climate change Communications Earth and Environment, 3, 208.
Large, D.J., Bradley, A.V., Islam, T.I., Mitchell, E., Dryden I., Fallaize, C., Andersen, R. and Marshall, C., 2025a. Application of surface motion remote sensing to quantify the condition and trajectory of change of c.680,000 ha of peatland NatureScot Research Report 1356.
Large, D.J., Bradley, A.V., Islam, T.I., Mitchell, E., Dryden, I., Fallaize, C., Andersen, R. and Marshall, C., 2025b. Use of satellite measures of surface motion to improve the assessment of peat landslide susceptibility NatureScot Research Report 1344.
Lees, K.J., Quaife, T., Artz, R.R.E., Khomik, M. and Clark, J.M., 2018. Potential for using remote sensing to estimate carbon fluxes across northern peatlands – A reviewScience of the Total Environment, 615, 857-874.
Lees, K.J., Artz, R.R.E., Chandler, D., Aspinall, T., Boulton, C.A., Buxton, J., Cowie, N.R. and Lenton, T.M., 2021. Using remote sensing to assess peatland resilience by estimating soil surface moisture and drought recovery Science of the Total Environment, 761.
Mahdiyasa, A.W., Large, D.J., Muljadi, B.P., Icardi, M. and Triantafyllou, S.,2022. MPeat—A fully coupled mechanical-ecohydrological model of peatland development Ecohydrology, 15(1).
Mahdiyasa, A.W., Large, D.J., Muljadi, B.P. and Matteo, I., 2023. Modelling the influence of mechanical-ecohydrological feedback on the nonlinear dynamics of peatlands Ecological Modelling, 478.
Marron, J.S. and Dryden, I.L., 2021. Object Oriented Data Analysis New York: Chapman and Hall/CRC.
Marshall C., Bradley A.V., Andersen, R. and Large D.J., 2021. Using peatland surface motion (bog breathing) to monitor Peatland Action sites NatureScot Research Report 1269.
Marshall C, Sterk, HP, Gilbert, P.J., Andersen, R., Bradley, A.V., Sowter A., Marsh S. and Large, D.J., 2022. Multiscale Variability and the Comparison of Ground and Satellite Radar Based Measures of Peatland Surface Motion for Peatland Monitoring Remote Sensing, 14(2), 336.
McKee, I., 2023. Conversation with David Large regarding recovery of bog after plantation removal (Personal communication).
Mitchell, E.G., Dryden, I.L., Fallaize, C.J., Andersen, R., Bradley, A.V., Large, D.J. and Sowter, A., 2024. Object oriented data analysis of surface motion time series in peatland landscapes Journal of the Royal Statistical Society, Series C.
Morton, P.A. and Heinemeyer, A., 2019. Bog breathing: the extent of peat shrinkage and expansion on blanket bogs in relation to water table, heather management and dominant vegetation and its implications for carbon stock assessments Wetlands Ecology and Management, 27(4), 467-482.
NatureScot, 2016. Carbon and Peatland 2016 map
Price, J.S., 2003. Role and character of seasonal peat soil deformation on the hydrology of undisturbed and cutover peatlands Water Resources Research, 39(9).
Räsänen A., Tolvanen, A. and Kareksela, S., 2022. Monitoring peatland water table depth with optical and radar satellite imagery International Journal of Applied Earth Observation and Geoinformation, 112(2).
Sowter, A., Bateson, L., Strange, P., Ambrose, K. and Syafiudin, Moh.F., 2013. DInSAR estimation of land motion using intermittent coherence with application to the South Derbyshire and Leicestershire coalfields Remote Sensing Letters, 4(10), 979-987.
Sowter, A., Bin Che Amat, M., Cigna, F., Marsh, S., Athab, A. and Alshammari, L., 2016. Mexico City land subsidence in 2014-2015 with Sentinel-1 IW TOPS: Results using the Intermittent SBAS (ISBAS) techniqueInternational Journal of Applied Earth Observation and Geoinformation,52, 230-242.
Tampuu, T., Praks, J., Uiboupin, R. and Kull, A., 2020. Long Term Interferometric Temporal Coherence and DInSAR Phase in Northern Peatlands Remote Sensing, 12,1566.
Toca, L., Morrison, K., Artz, R.R.E., Gimona, A. and Quaife, T., 2022. High resolution C-band SAR backscatter response to peatland water table depth and soil moisture: a laboratory experiment International Journal of Remote Sensing, 43, 5231–5251.
Waddington, J.M., Kellner, E., Strack, M. and Price, J.S., 2010. Differential peat deformation, compressibility, and water storage between peatland microforms: Implications for ecosystem function and development Water Resources Research, 46, W07538.
Annex 1 – Commentary on Dalchork restoration areas
Summary pie charts and commentary on the trajectory of change and condition in individual restoration areas (Figure A1.1) within the Dalchork Site. Pie charts are shown for overall change (2015-19 vs. 2019-23), and sequential annual change. Titles of the sequential pie charts refer to year 1 (2015-16), year 2 (2016-17), year 3 (2017-18), year 4 (2018-19), year 5 (2019-20), year 6 (2020-21) and year 7 (21-22). Each year is defined from May to May. Note that the period over which the overall change is measured is slightly longer and extends to January 2023. Condition is described based on visual assessment of the condition probability maps (Figures. A1.2, A1.3 and A1.4)
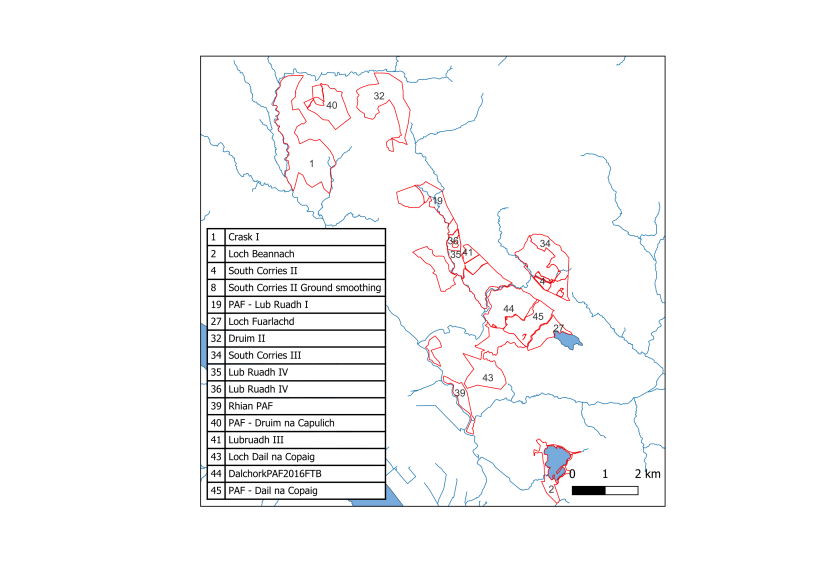
Figure A1.1: Map of Dalchork showing individual restoration sites for which detailed assessment is provided below. Note that area 8 (South Corries II ground smoothing) is within area 4, (South Corries II) and does not show as a separate area.
Click for a full description
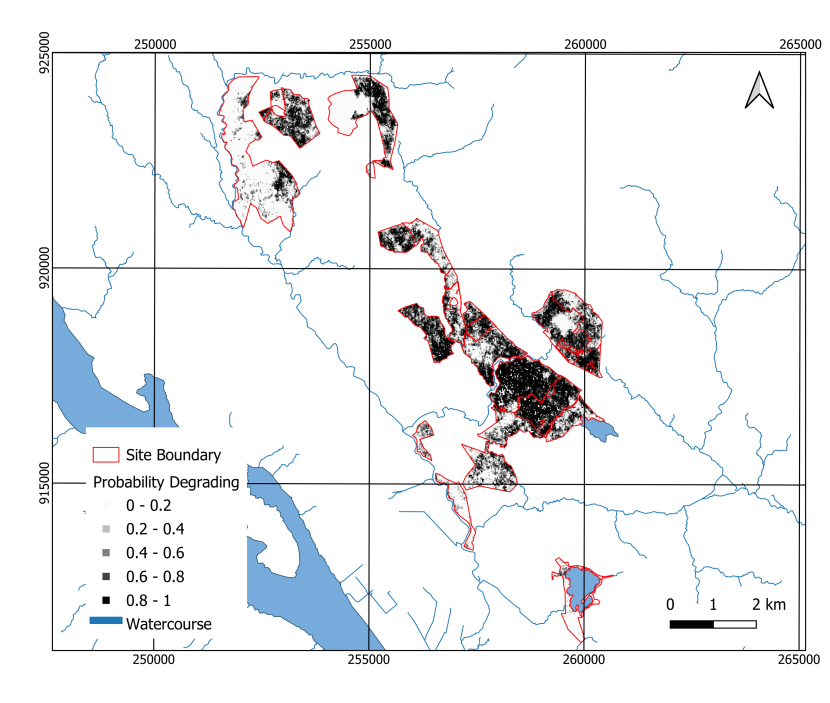
Figure A1.2: Map of Dalchork showing the probability that the peat is in a degrading condition for the period 2019-2023.
Click for a full description
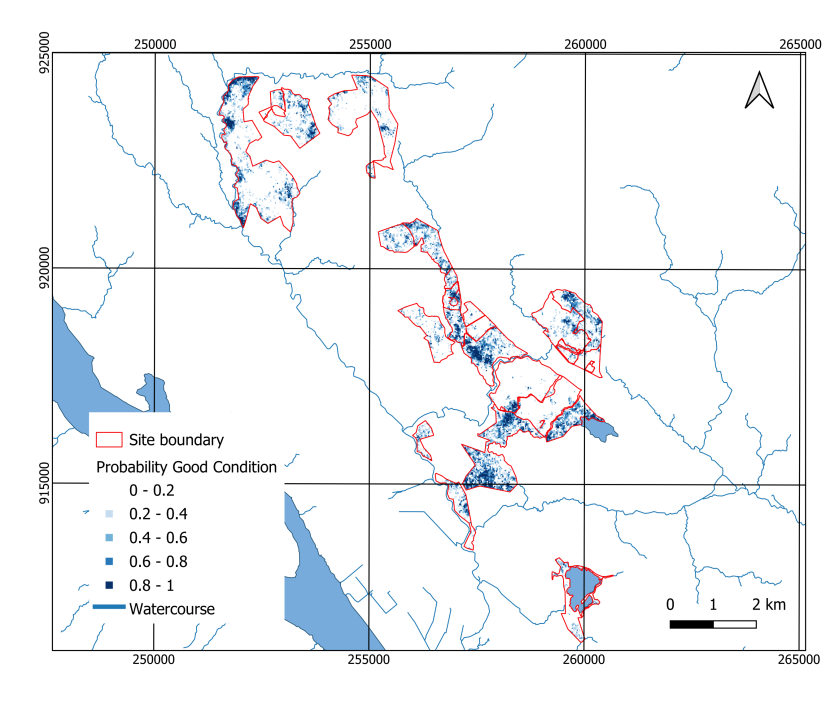
Figure A1.3: Map of Dalchork showing the probability that the peat is in a good condition for the period 2019-2023.
Click for a full description

Figure A1.4: Map of Dalchork showing probability that peat is in a stiff condition for the period 2019-2023
Click for a full description
Site: Crask 1 (Figure A1.5)
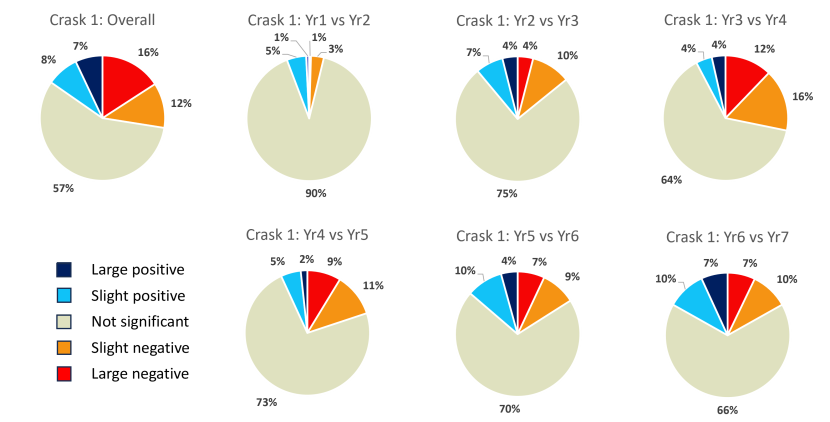
Figure A1.5: Pie charts illustrating overall change and sequential annual change on the Crask 1 site.
Click for a full description
Pie charts illustrating overall change and sequential annual change on the Crask 1 site. Each chart represents the percentage of the total pixels within each class within the area of restoration. Dark blue and pale blue are used to illustrate positive change exceeding the 90th and 80th percentiles respectively. Red and orange are used to indicate negative change below the 10th and 20th percentiles respectively.
A notable observation is the negative response in 2018/19 (yr4), post restoration, with increasing positive change year on year thereafter.
Information provided by FLS: Most of the site was open bog, and peat dams were installed in the drains in 2016/17 (yr2) (although possibly 2017/18, yr3). Afforested areas were felled using the harvesting shears system and then ground smoothed, including all drains being blocked in 2016/17.
Change: Notable negative response in 2018/19 (yr4), post restoration, with increasing positive change year on year thereafter.
Condition 2019-23: Stable, predominantly stiff, with better condition around margins adjacent to watercourses.
Site: Loch Beannach (Figure A1.6)

Figure A1.6: Pie charts illustrating overall change and sequential annual change on the Loch Beannach site.
Click for a full description
Pie charts illustrating overall change and sequential annual change on the Loch Beannach site. Each chart represents the percentage of the total pixels within each class within the area of restoration. Dark blue and pale blue are used to illustrate positive change exceeding the 90th and 80th percentiles respectively. Red and orange are used to indicate negative change below the 10th and 20th percentiles respectively.
A notable observation is the positive response post 2018 drought (yr4) and then 2021/22 (yr7).
Information provided by FLS: Tree regeneration felled from a previously felled area. There has been no re-wetting carried out. Should show some improvement over time.
Change: Positive response post 2018 drought (yr4) and then 2021/22 (yr7).
Condition 2019-23: Better condition in north and south of site and close to the loch. Otherwise predominantly stiff.
Site: South Corries II (Figure A1.7)
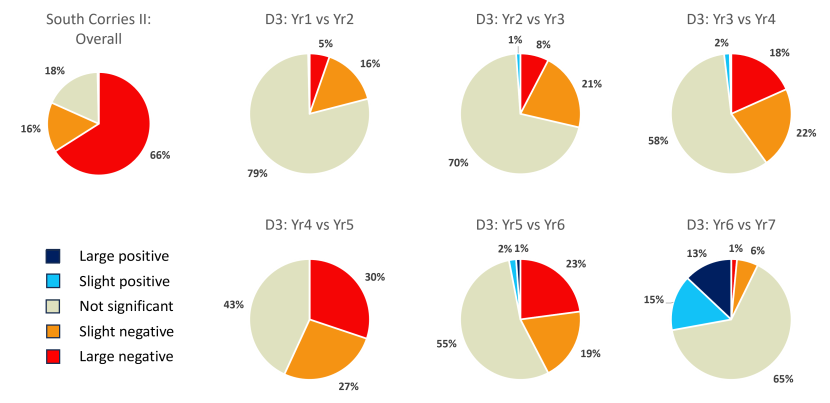
Figure A1.7: Pie charts illustrating overall change and sequential annual change on the South Corries II site.
Click for a full description
Pie charts illustrating overall change and sequential annual change on the South Corries II site. Each chart represents the percentage of the total pixels within each class within the area of restoration. Dark blue and pale blue are used to illustrate positive change exceeding the 90th and 80th percentiles respectively. Red and orange are used to indicate negative change below the 10th and 20th percentiles respectively.
A notable observation is the predominantly negative change most coincident with and following interventions in yr3 and yr4, followed by a large positive change in 2021/22 (yr7).
Information provided by FLS: Felled using harvesting shears system in 2017/18 (yr3) then ground smoothed including drain-blocking in 2018/19 (yr4).
Change: Predominantly negative change most notably coincident with and following interventions in yr3 and yr4, followed by a large positive change in 2021/22 (yr7).
Condition 2019-23: Degrading
Site: PAF Lub Ruadh I (Figure A1.8)
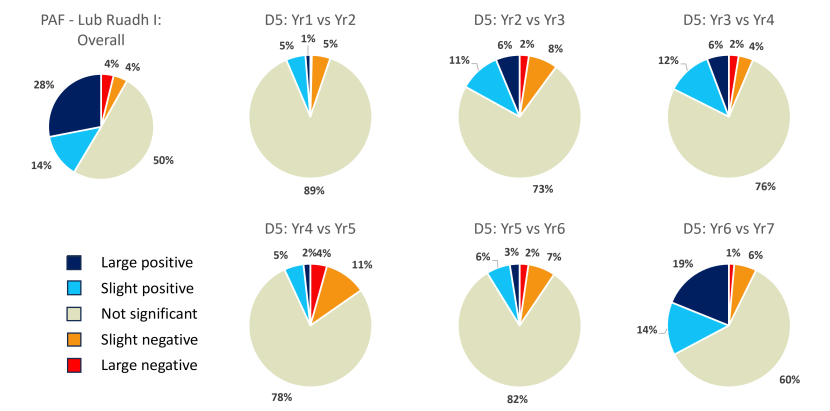
Figure A1.8: Pie charts illustrating overall change and sequential annual change on the PAF Lub Ruadh I site.
Click for a full description
Pie charts illustrating overall change and sequential annual change on the PAF Lub Ruadh I site. Each chart represents the percentage of the total pixels within each class within the area of restoration. Dark blue and pale blue are used to illustrate positive change exceeding the 90th and 80th percentiles respectively. Red and orange are used to indicate negative change below the 10th and 20th percentiles respectively.
A notable observation is the generally positive response with most positive change in 2018/19 (yr4) and again in 2021/22 (yr7).
Information provided by FLS: Furrow and drain blocking in 2017/18 (yr3). It would be good to compare this site with the adjacent mulched area to the southeast.
Change: Generally positive with most positive change in 2018/19 (yr4) and again in 2021/22 (yr7)
Condition 2019-23: Stable, predominantly stiff and good.
Site: Loch Fuarlachd (Figure A1.9)
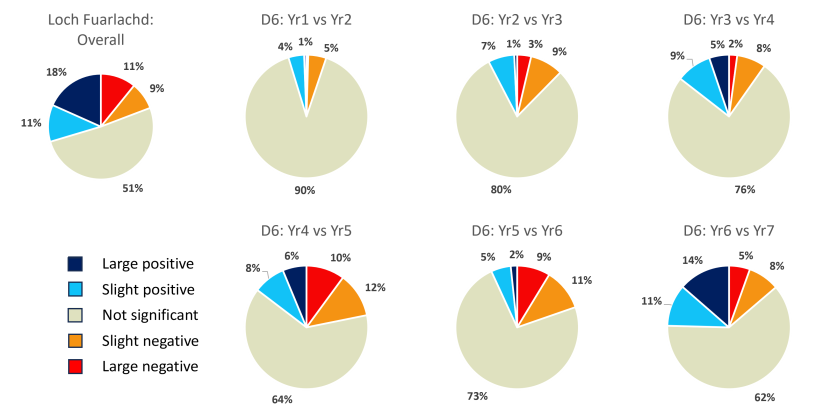
Figure A1.9: Pie charts illustrating overall change and sequential annual change on the Loch Fuarlachd site.
Click for a full description
Pie charts illustrating overall change and sequential annual change on the Loch Fuarlachd site. Each chart represents the percentage of the total pixels within each class within the area of restoration. Dark blue and pale blue are used to illustrate positive change exceeding the 90th and 80th percentiles respectively. Red and orange are used to indicate negative change below the 10th and 20th percentiles respectively.
A notable observation is the overall positive change mostly after ground smoothing in 2018/19 (yr4).
Information provided by FLS: Stump flipped, and ground smoothed in 2018/19 (yr4) after felling year before.
Change: Overall positive change mostly after ground smoothing in 2018/19 (yr4).
Condition 2019-23: Mixed degrading and good. Likely an area that will naturally accumulate water close to the loch.
Site: Druim II (Figure A1.10)
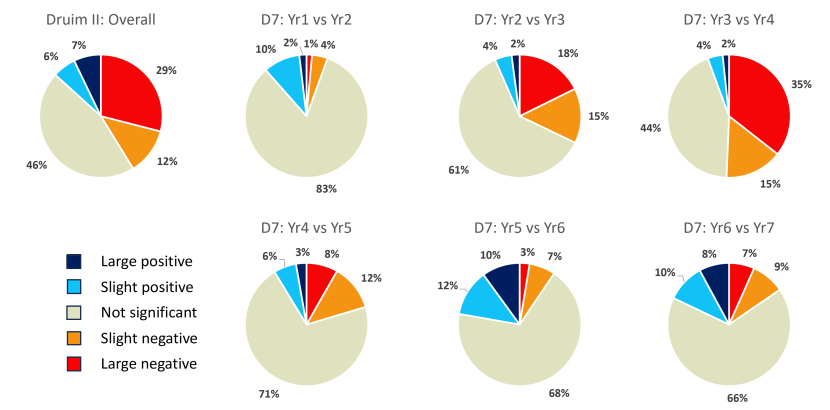
Figure A1.10: Pie charts illustrating overall change and sequential annual change on the Druim II site.
Click for a full description
Pie charts illustrating overall change and sequential annual change on the Druim II site. Each chart represents the percentage of the total pixels within each class within the area of restoration. Dark blue and pale blue are used to illustrate more change exceeding the 90th and 80th percentiles respectively. Red and orange are used to indicate negative change below the 10th and 20th percentiles respectively.
A notable observation is the marked negative change during restoration in 2017/18 (yr3) and the following year, 2018/19 (yr4). This is followed by evidence of an improving trajectory.
Information provided by FLS: Existing open areas were drain blocked in 2017/18 (year 3) on the west side and near the top of the hill. East side had the plantation mulched (wasn't that old) also drain blocked in 2017/18, and some furrow blocking.
Change: Marked negative change during restoration 2017/18 (yr3) and also in the following year 2018/19 (yr4) then evidence of improving trajectory.
Condition 2019-23: Degrading on eastern part of site and stiff on western part of site including the top of hill.
Site: South Corries III (Figure A1.11)

Figure A1.11: Pie charts illustrating overall change and sequential annual change on the South Corries III site.
Click for a full description
Pie charts illustrating overall change and sequential annual change on the South Corries III site. Each chart represents the percentage of the total pixels within each class within the area of restoration. Dark blue and pale blue are used to illustrate positive change exceeding the 90th and 80th percentiles respectively. Red and orange are used to indicate negative change below the 10th and 20th percentiles respectively.
A notable observation is the marked negative change following intervention in 2018/19 (yr4). Signs of positive change in 2021/22.
Information provided by FLS: Shears harvested in 2018/19 (yr4) and then stump flipped and ground smoothed after.
Change: Marked negative change following intervention in 2018/19 (yr4). Sign of positive change in 2021/22.
Condition 2019-23: Predominantly degrading except for notable area in good condition in north of site.
Site: Lub Ruadh IV (north) (Figure A1.12)
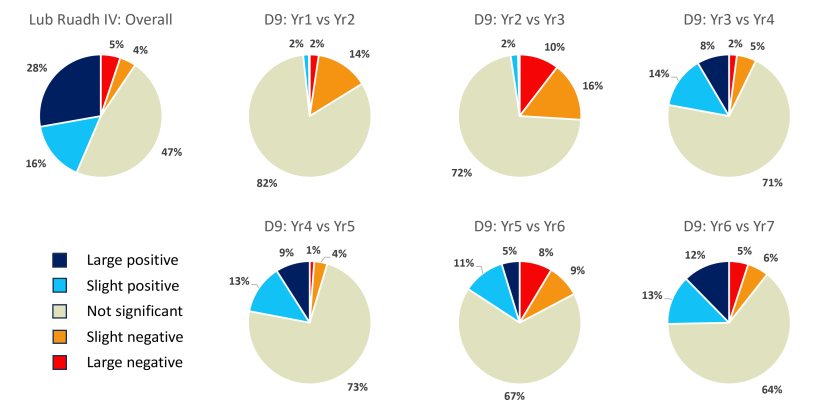
Figure A1.12: Pie charts illustrating overall change and sequential annual change on the Lub Ruadh IV site (area 35 Figure A1.1).
Click for a full description
Pie charts illustrating overall change and sequential annual change on the Lub Ruadh IV site (area 35 Figure A1.1). Each chart represents the percentage of the total pixels within each class within the area of restoration. Dark blue and pale blue are used to illustrate positive change exceeding the 90th and 80th percentiles respectively. Red and orange are used to indicate negative change below the 10th and 20th percentiles respectively.
A notable observation is the sustained positive change following restoration work in 2017/18 (yr3).
Information provided by FLS: Furrow and drain blocking in 2017/18 (yr3). It would be good to compare this site with the adjacent mulched area to the southeast.
Change: Sustained positive change following restoration work in 2017/18 (yr3).
Condition 2019-23: Degrading to good.
Lub Ruadh IV (south) (Figure A1.13)
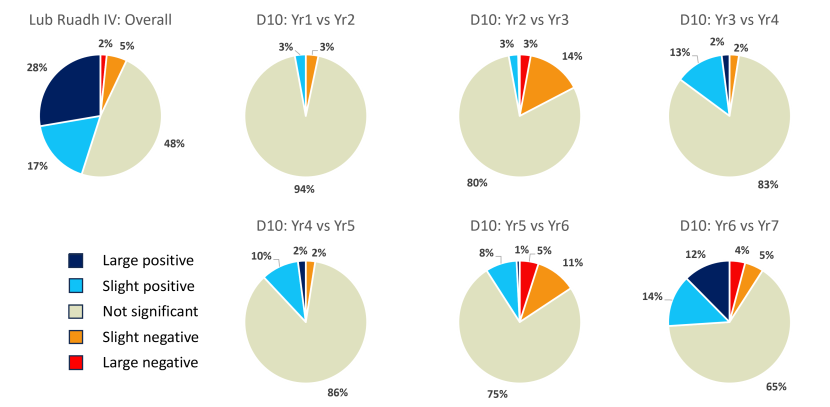
Figure A1.13: Pie charts illustrating overall change and sequential annual change on the Lub Ruadh IV site (area 36 Figure A1.1).
Click for a full description
Pie charts illustrating overall change and sequential annual change on the Lub Ruadh IV site (area 36 Figure A1.1). Each chart represents the percentage of the total pixels within each class within the area of restoration. Dark blue and pale blue are used to illustrate positive change exceeding the 90th and 80th percentiles respectively. Red and orange are used to indicate negative change below the 10th and 20th percentiles respectively.
A notable observation is the sustained slight positive change following restoration work in 2017/18 (yr3), becoming large positive change in 2021/22 (yr7).
Information provided by FLS: Furrow and drain blocking in 2017/18 (yr3). Would be good to compare this site with the adjacent mulched area to the southeast.
Change: Sustained slight positive change following restoration work in 2017/18 (yr3), becoming large positive change in 2021/22(yr7).
Condition 2019-23: Stiff to good. Note isolated remnant of pool system in centre of area.
Site: Rhian PAF (Figure A1.14)
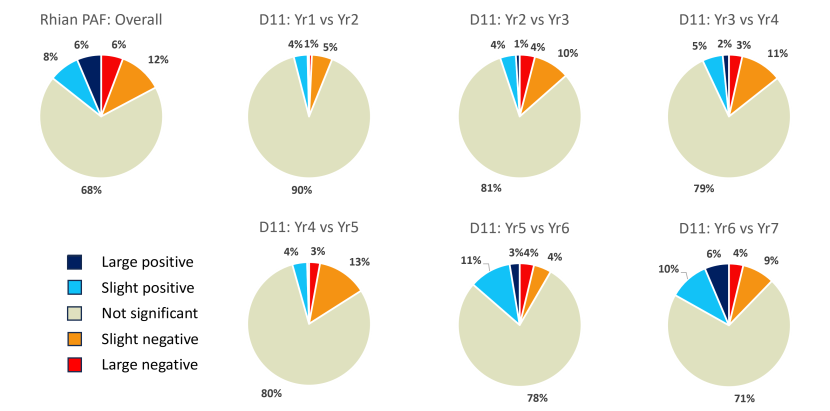
Figure A1.14: Pie charts illustrating overall change and sequential annual change on the Rhian PAF site.
Click for a full description
Pie charts illustrating overall change and sequential annual change on the Rhian PAF site. Each chart represents the percentage of the total pixels within each class within the area of restoration. Dark blue and pale blue are used to illustrate positive change exceeding the 90th and 80th percentiles respectively. Red and orange are used to indicate negative change below the 10th and 20th percentiles respectively.
A notable observation is the increasing proportion of site showing positive change throughout period.
Information provided by FLS: No information.
Change: Increasing proportion of site showing positive change throughout period.
Condition 2019-23: Stiff to good on eastern margin.
Site: Druim na Capulich (Figure A1.15)
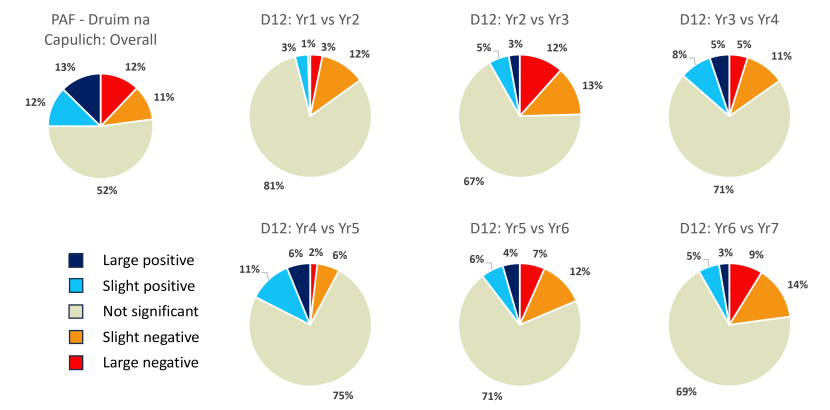
Figure A1.15: Pie charts illustrating overall change and sequential annual change on the Druim na Capulich site.
Click for a full description
Pie charts illustrating overall change and sequential annual change on the Druim na Capulich site. Each chart represents the percentage of the total pixels within each class within the area of restoration. Dark blue and pale blue are used to illustrate positive change exceeding the 90th and 80th percentiles respectively. Red and orange are used to indicate negative change below the 10th and 20th percentiles respectively. Change is variable with no obvious trends.
Information provided by FLS: No information.
Change: Variable with insufficient information provided to enable interpretation.
Condition 2019-23: Predominantly degrading with small areas in good condition.
Site: Lub Ruadh III (Figure A1.16)
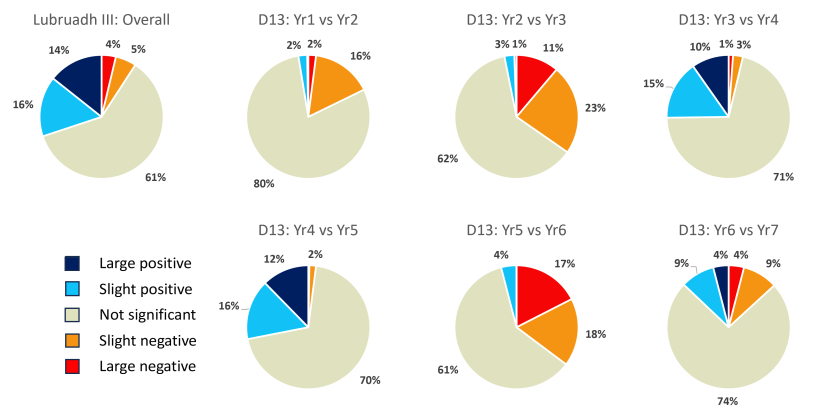
Figure A1.16: Pie charts illustrating overall change and sequential annual change on the Lub Ruadh III site.
Click for a full description
Pie charts illustrating overall change and sequential annual change on the Lub Ruadh III site. Each chart represents the percentage of the total pixels within each class within the area of restoration. Dark blue and pale blue are used to illustrate positive change exceeding the 90th and 80th percentiles respectively. Red and orange are used to indicate negative change below the 10th and 20th percentiles respectively.
Change is variable with notable negative change in 2017/18 (yr3) and 2021/22 (yr6), both drought years, and notable positive change in 2018/19 (yr4) and 2019/20 (yr5).
Information provided by FLS: Unsure as to whether mulched or felled, but definitely drain blocked.
Change: Variable with notable negative change in 2017/18 (yr3) and 2021/22 (yr6), both drought years, and notable positive change in 2018/19 (yr4) and 2019/20 (yr5).
Condition 2019-23: Predominantly degrading.
Site: Loch Dail na Copaig (Figure A1.17)

Figure A1.17: Pie charts illustrating overall change and sequential annual change on the Loch Dail na Copaig site.
Click for a full description
Pie charts illustrating overall change and sequential annual change on the Loch Dail na Copaig site. Each chart represents the percentage of the total pixels within each class within the area of restoration. Dark blue and pale blue are used to illustrate positive change exceeding the 90th and 80th percentiles respectively. Red and orange are used to indicate negative change below the 10th and 20th percentiles respectively.
A notable observation is the negative trajectory after intervention in 2018/19 (yr4) followed by a shift to positive change in 2021/22 (yr7).
Information provided by FLS: Stump flipping, and ground smoothed in 2018/19 (yr4). Quite invasive, very wet after.
Change: Notable negative trajectory after intervention in 2018/19 (yr4) followed by shift to positive change in 2021/22 (yr7). Post intervention negative change may be due to settling.
Condition 2019-23: Good.
Site: Dalchork PAF 2016FTB (Figure A1.18)
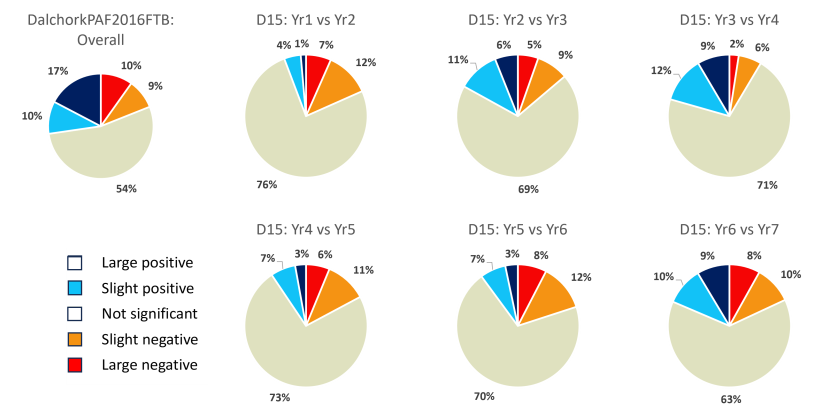
Figure A1.18: Pie charts illustrating overall change and sequential annual change on the Dalchork PAF 2016FTB site.
Click for a full description
Pie charts illustrating overall change and sequential annual change on the Dalchork PAF 2016FTB site. Each chart represents the percentage of the total pixels within each class within the area of restoration. Dark blue and pale blue are used to illustrate positive change exceeding the 90th and 80th percentiles respectively. Red and orange are used to indicate negative change below the 10th and 20th percentiles respectively.
Information provided by FLS: Mostly furrow blocked and drain blocked, but some areas mulched before re-wetting.
Change: Variable with insufficient information provided to enable interpretation.
Condition 2019-23: Degrading.
Site: Dail na Copaig PAF (Figure A1.19)
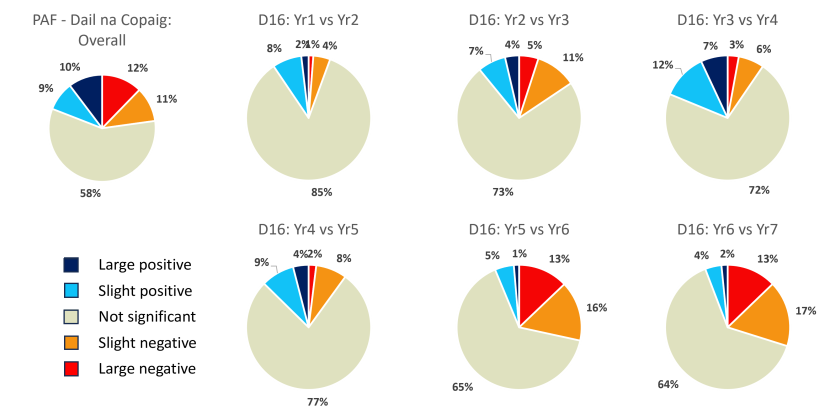
Figure A1.19: Pie charts illustrating overall change and sequential annual change on the Dail na Copaig PAF site.
Click for a full description
Pie charts illustrating overall change and sequential annual change on the Dail na Copaig PAF site. Each chart represents the percentage of the total pixels within each class within the area of restoration. Dark blue and pale blue are used to illustrate positive change exceeding the 90th and 80th percentiles respectively. Red and orange are used to indicate negative change below the 10th and 20th percentiles respectively.
A notable observation is the negative trajectory after intervention in 2018/19 (yr4).
Information provided by FLS: No information provided.
Change: Notable negative trajectory after intervention in 2018/19 (yr4).
Condition 2019-23: Degrading.
Annex 2 – Definitions of restoration techniques used
Ground smoothing - carried out in previously afforested areas with the technique evolving over time. Initially it involved inverting all remaining tree stumps using a low ground pressure excavator and compressing them into furrows, using machine tracking, which simultaneously removed elevated ridges and filled in furrows as well as burying most of the regenerating conifers. Every tree stump was either peeled back or plucked out of the peat prior to inversion. This would have been the technique used in Whitelee Windfarm.
Since 2021, the workflow employed by FLS in North Highland, including Dalchork FLS, has been improved by seeking opportunities to push small stumps into the peat, loosening then sliding medium sized stumps upright and across into the furrow, and only stump flipping the larger stumps. Occasionally larger stumps are left in situ if the peat disturbance would be too great or the peat depth being too shallow to make the bottom of the root plate sit flush with the surrounding peat surface when flipped. In addition, not all the surface is necessarily tracked across; if the machine can reach sideways to treat the stumps as above, it may not track across the whole surface
Cross tracking - carried out in previously afforested areas where very small trees had been present at the time of deforestation. This permits the low ground pressure excavator to be driven over the stumps and to ‘pop’ them down into the peat surface. Plough ridges are also flattened by the process, resulting in a smooth surface but with much less peat disturbance than in the ground-smoothing technique. The technique can also be carried out where slightly larger stumps have had time to decay.
Stump flipping - the process of carefully prying the root plate of a stump off the bog surface and turning it upside down in the adjacent furrow using a toothed excavator bucket.
Harvesting shears system – use of shears (like giant secateurs) to cut trees as low to the ground as possible, leaving just the low stump and root system behind. This enables less damaging stump-flipping to subsequently be undertaken.
Further information is available at:
- Shears harvesting technique YouTube video (NatureScot)
Wave damming - small peat dams created by a digger straddling the drain and pulling the peat in from the sides of the drain to create a dam. Dam spacing is in the region of every 5 to 7 m, which is generally much more frequent than “traditional” peat damming methods. The name of the technique stems from the way the dams are shaped and the high frequency of features, which resembles ripples or small waves in the landscape.
Further information is available at:
- Wave damming and zippering technique YouTube video (The Cairngorms National Park)
- Peatland ACTION guide on artificial drains (NatureScot). See section 4.6 for information on wave dams.
Peat dams – generally larger dams than wave dams constructed by borrowing peat from beside the drain to create the dam. Spacing can be up to 15 m and can result in more pooling of water than with the wave damming approach.
Further information is available at:
- Peatland ACTION guide on artificial drains (NatureScot). See section 4.1 for information on peat dams.
- Peat dams created at Moor Park, Drymen YouTube video (Loch Lomond and Trossachs National Park).
Last updated:
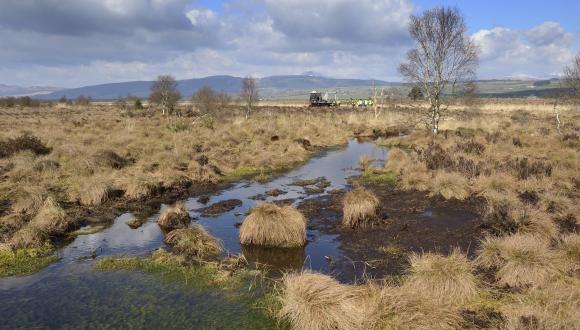
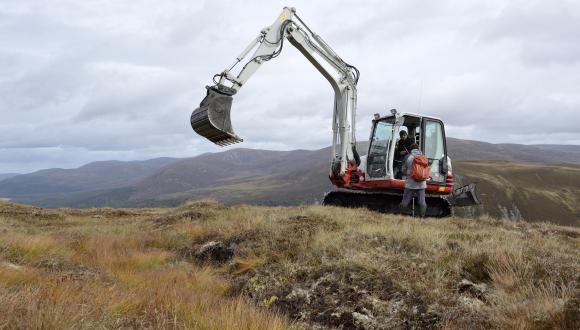


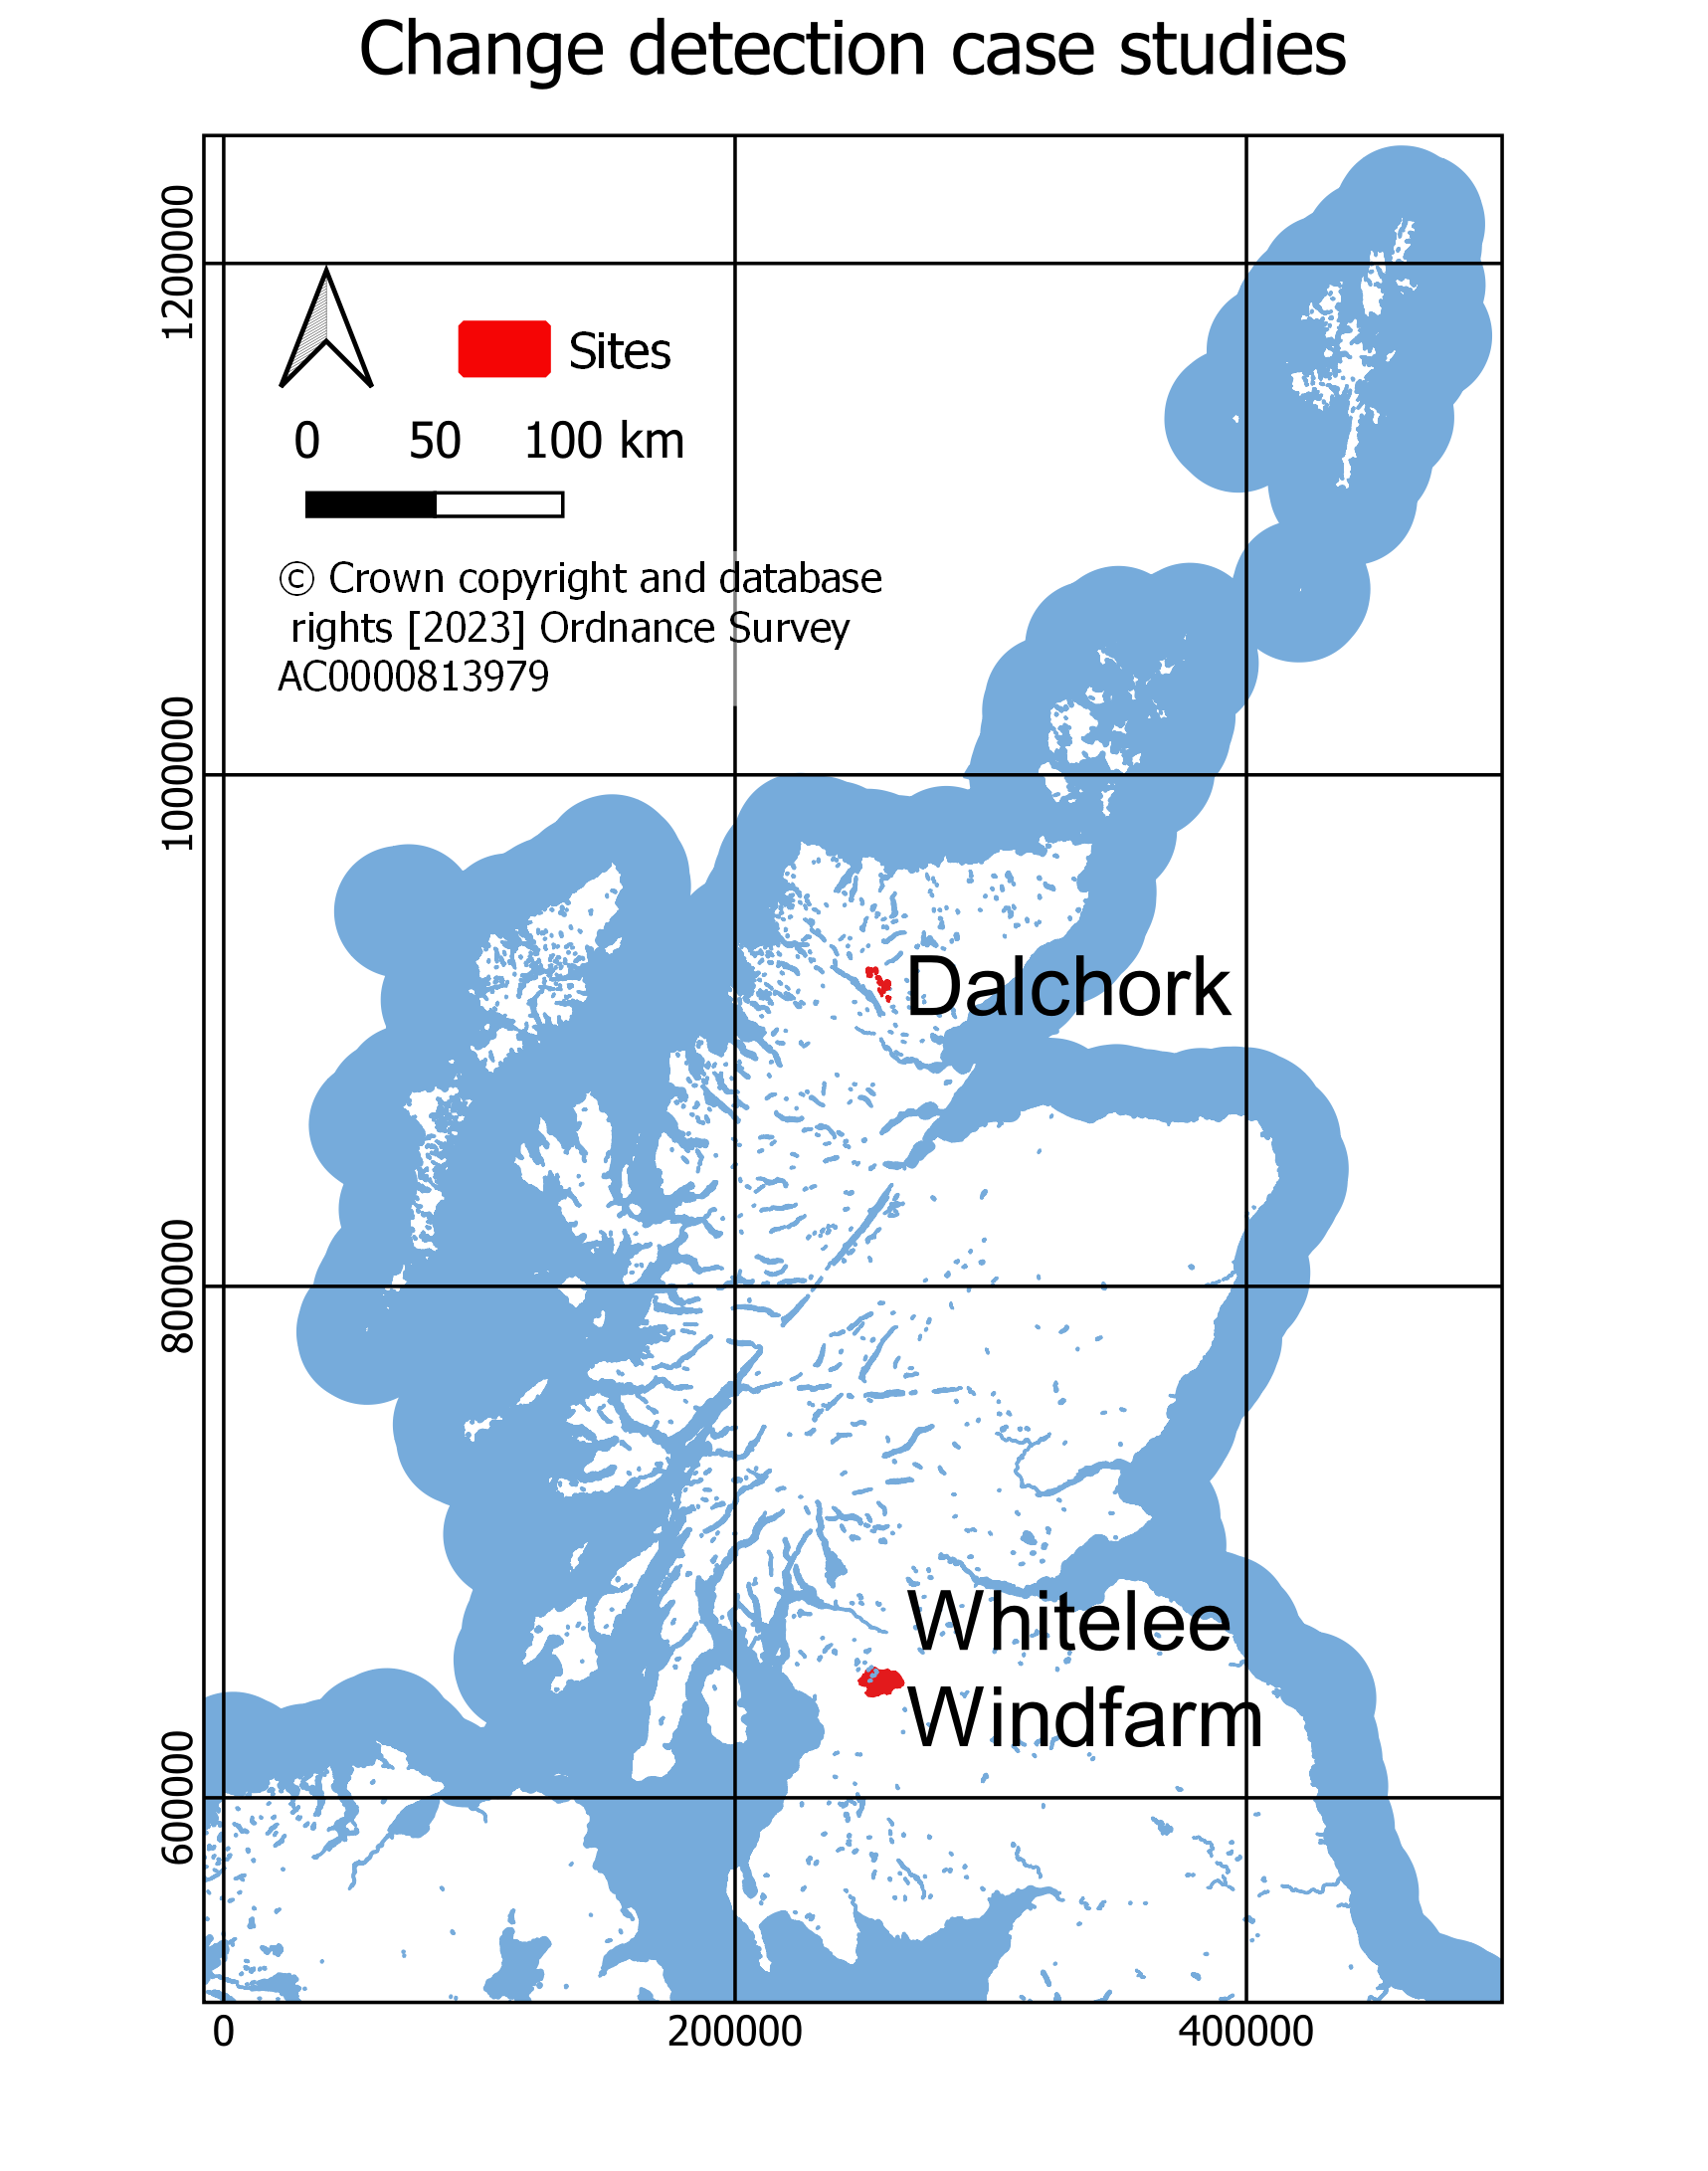
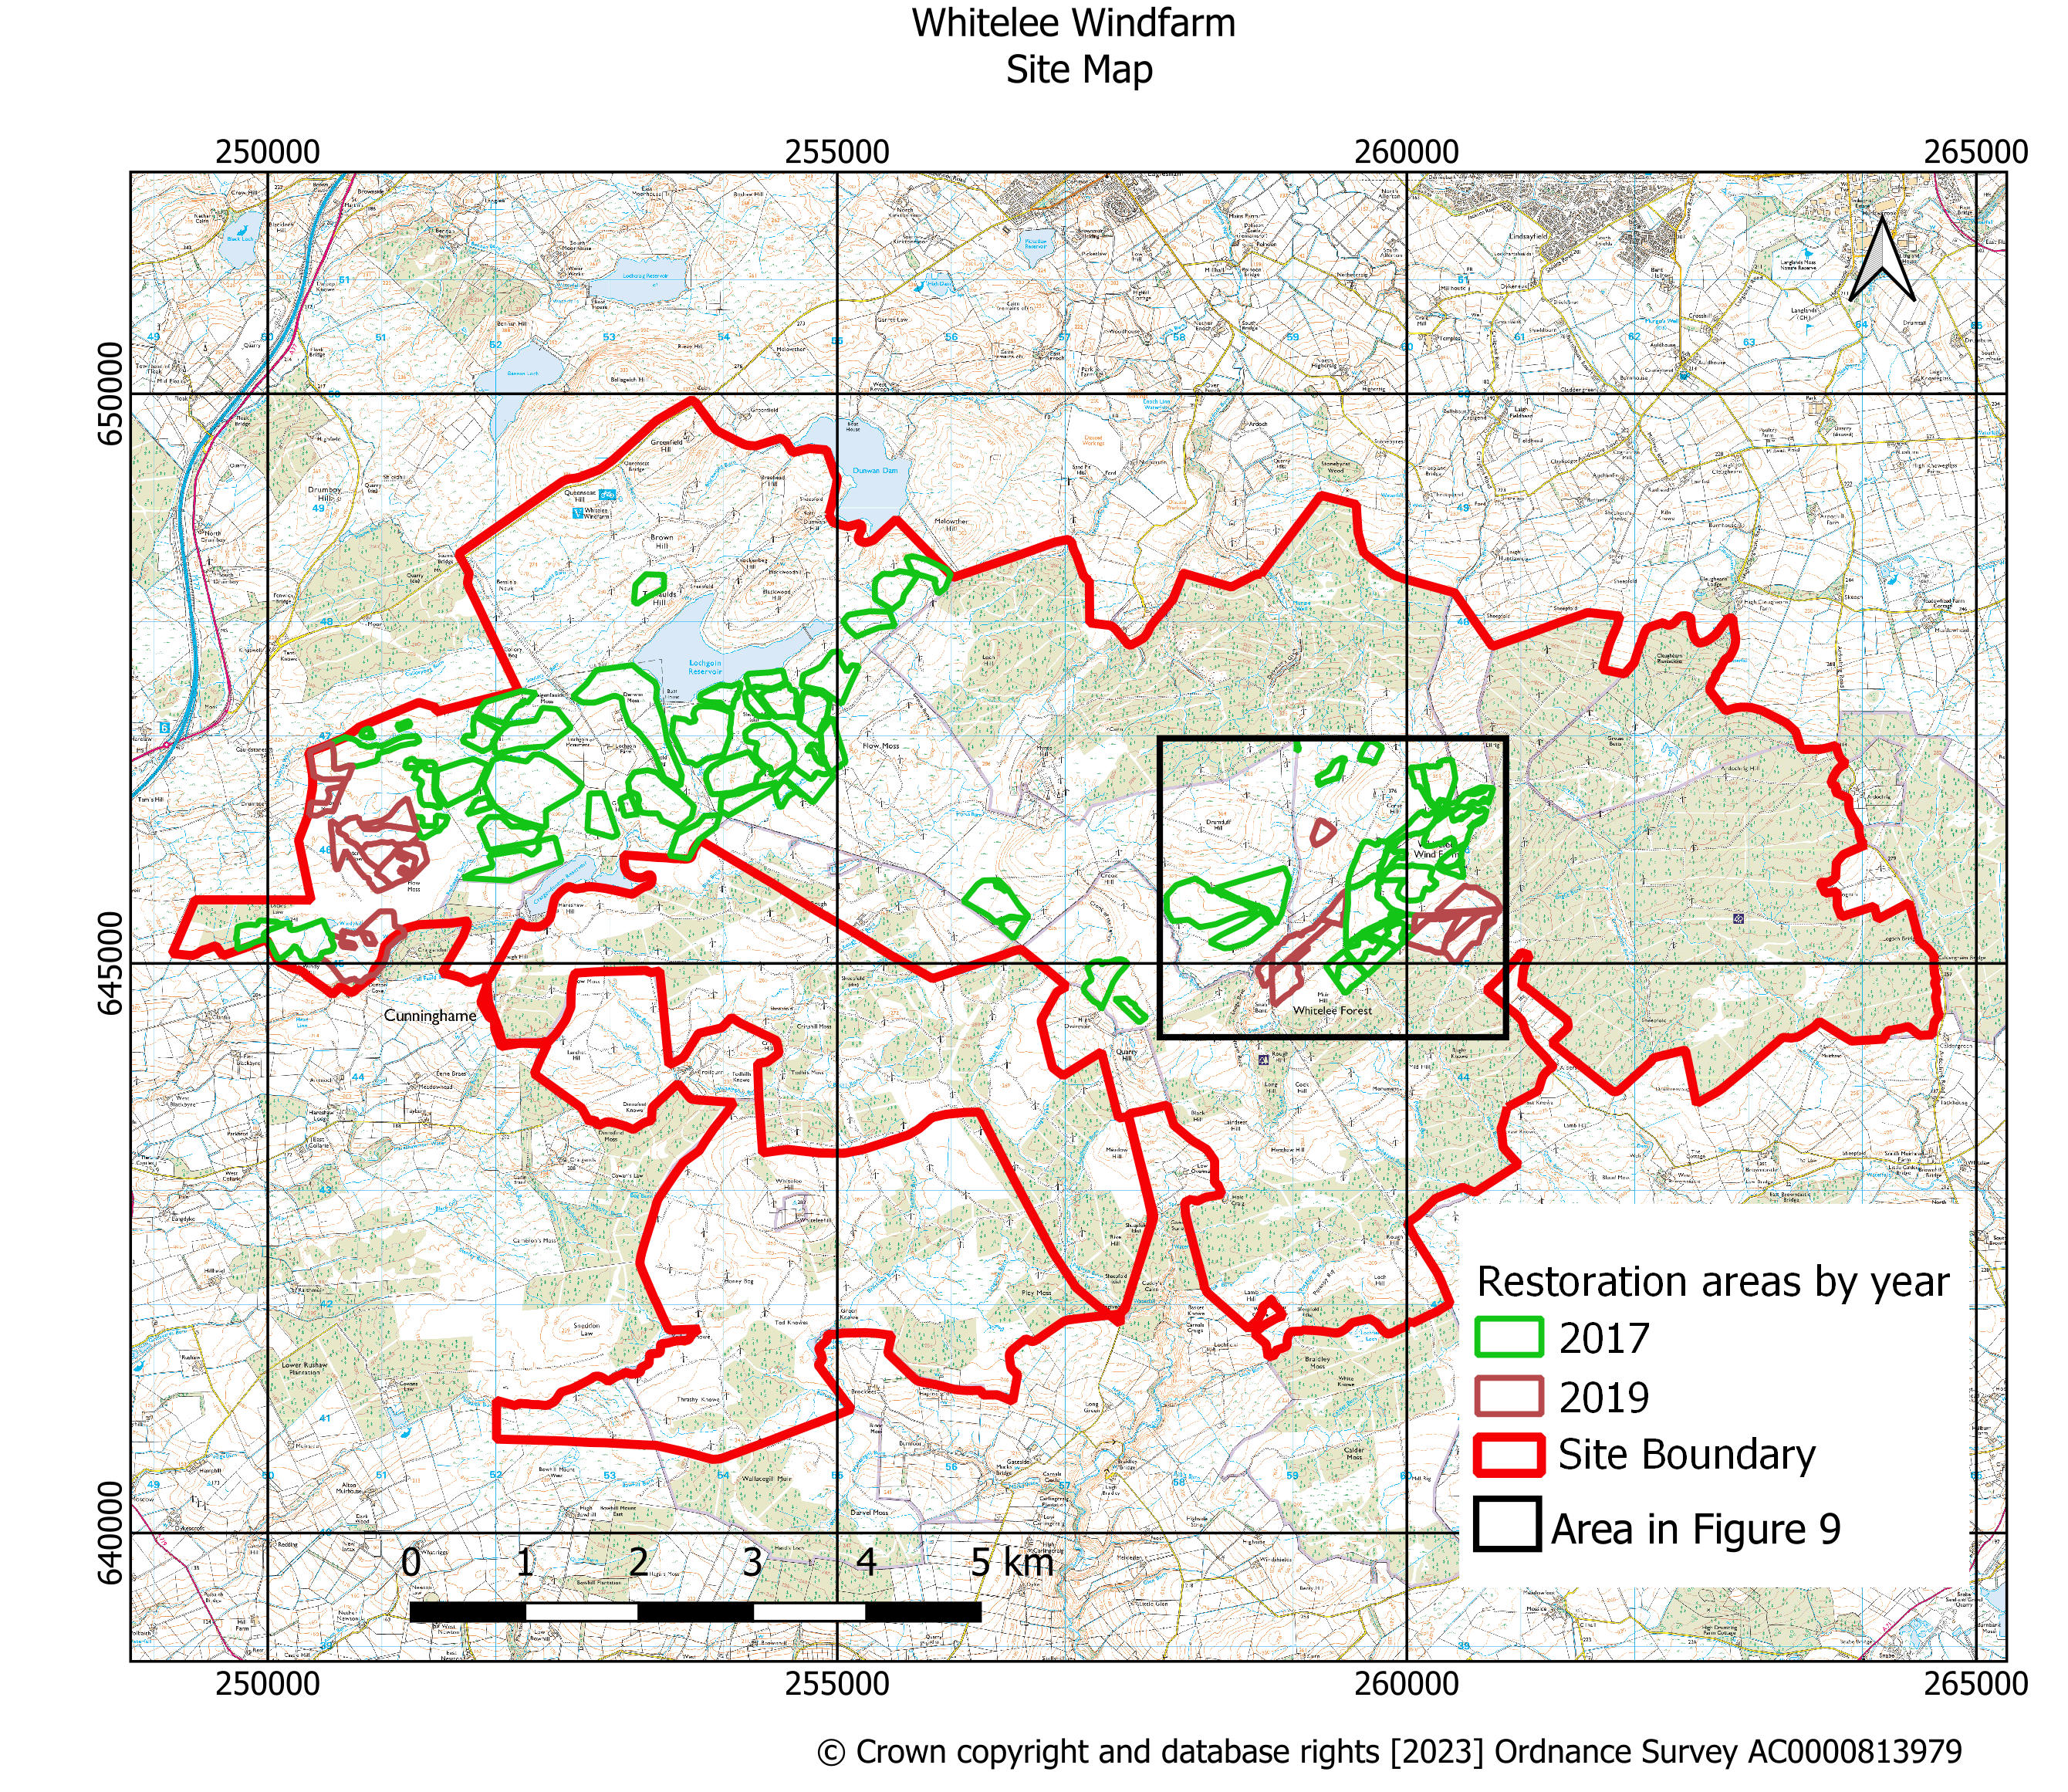
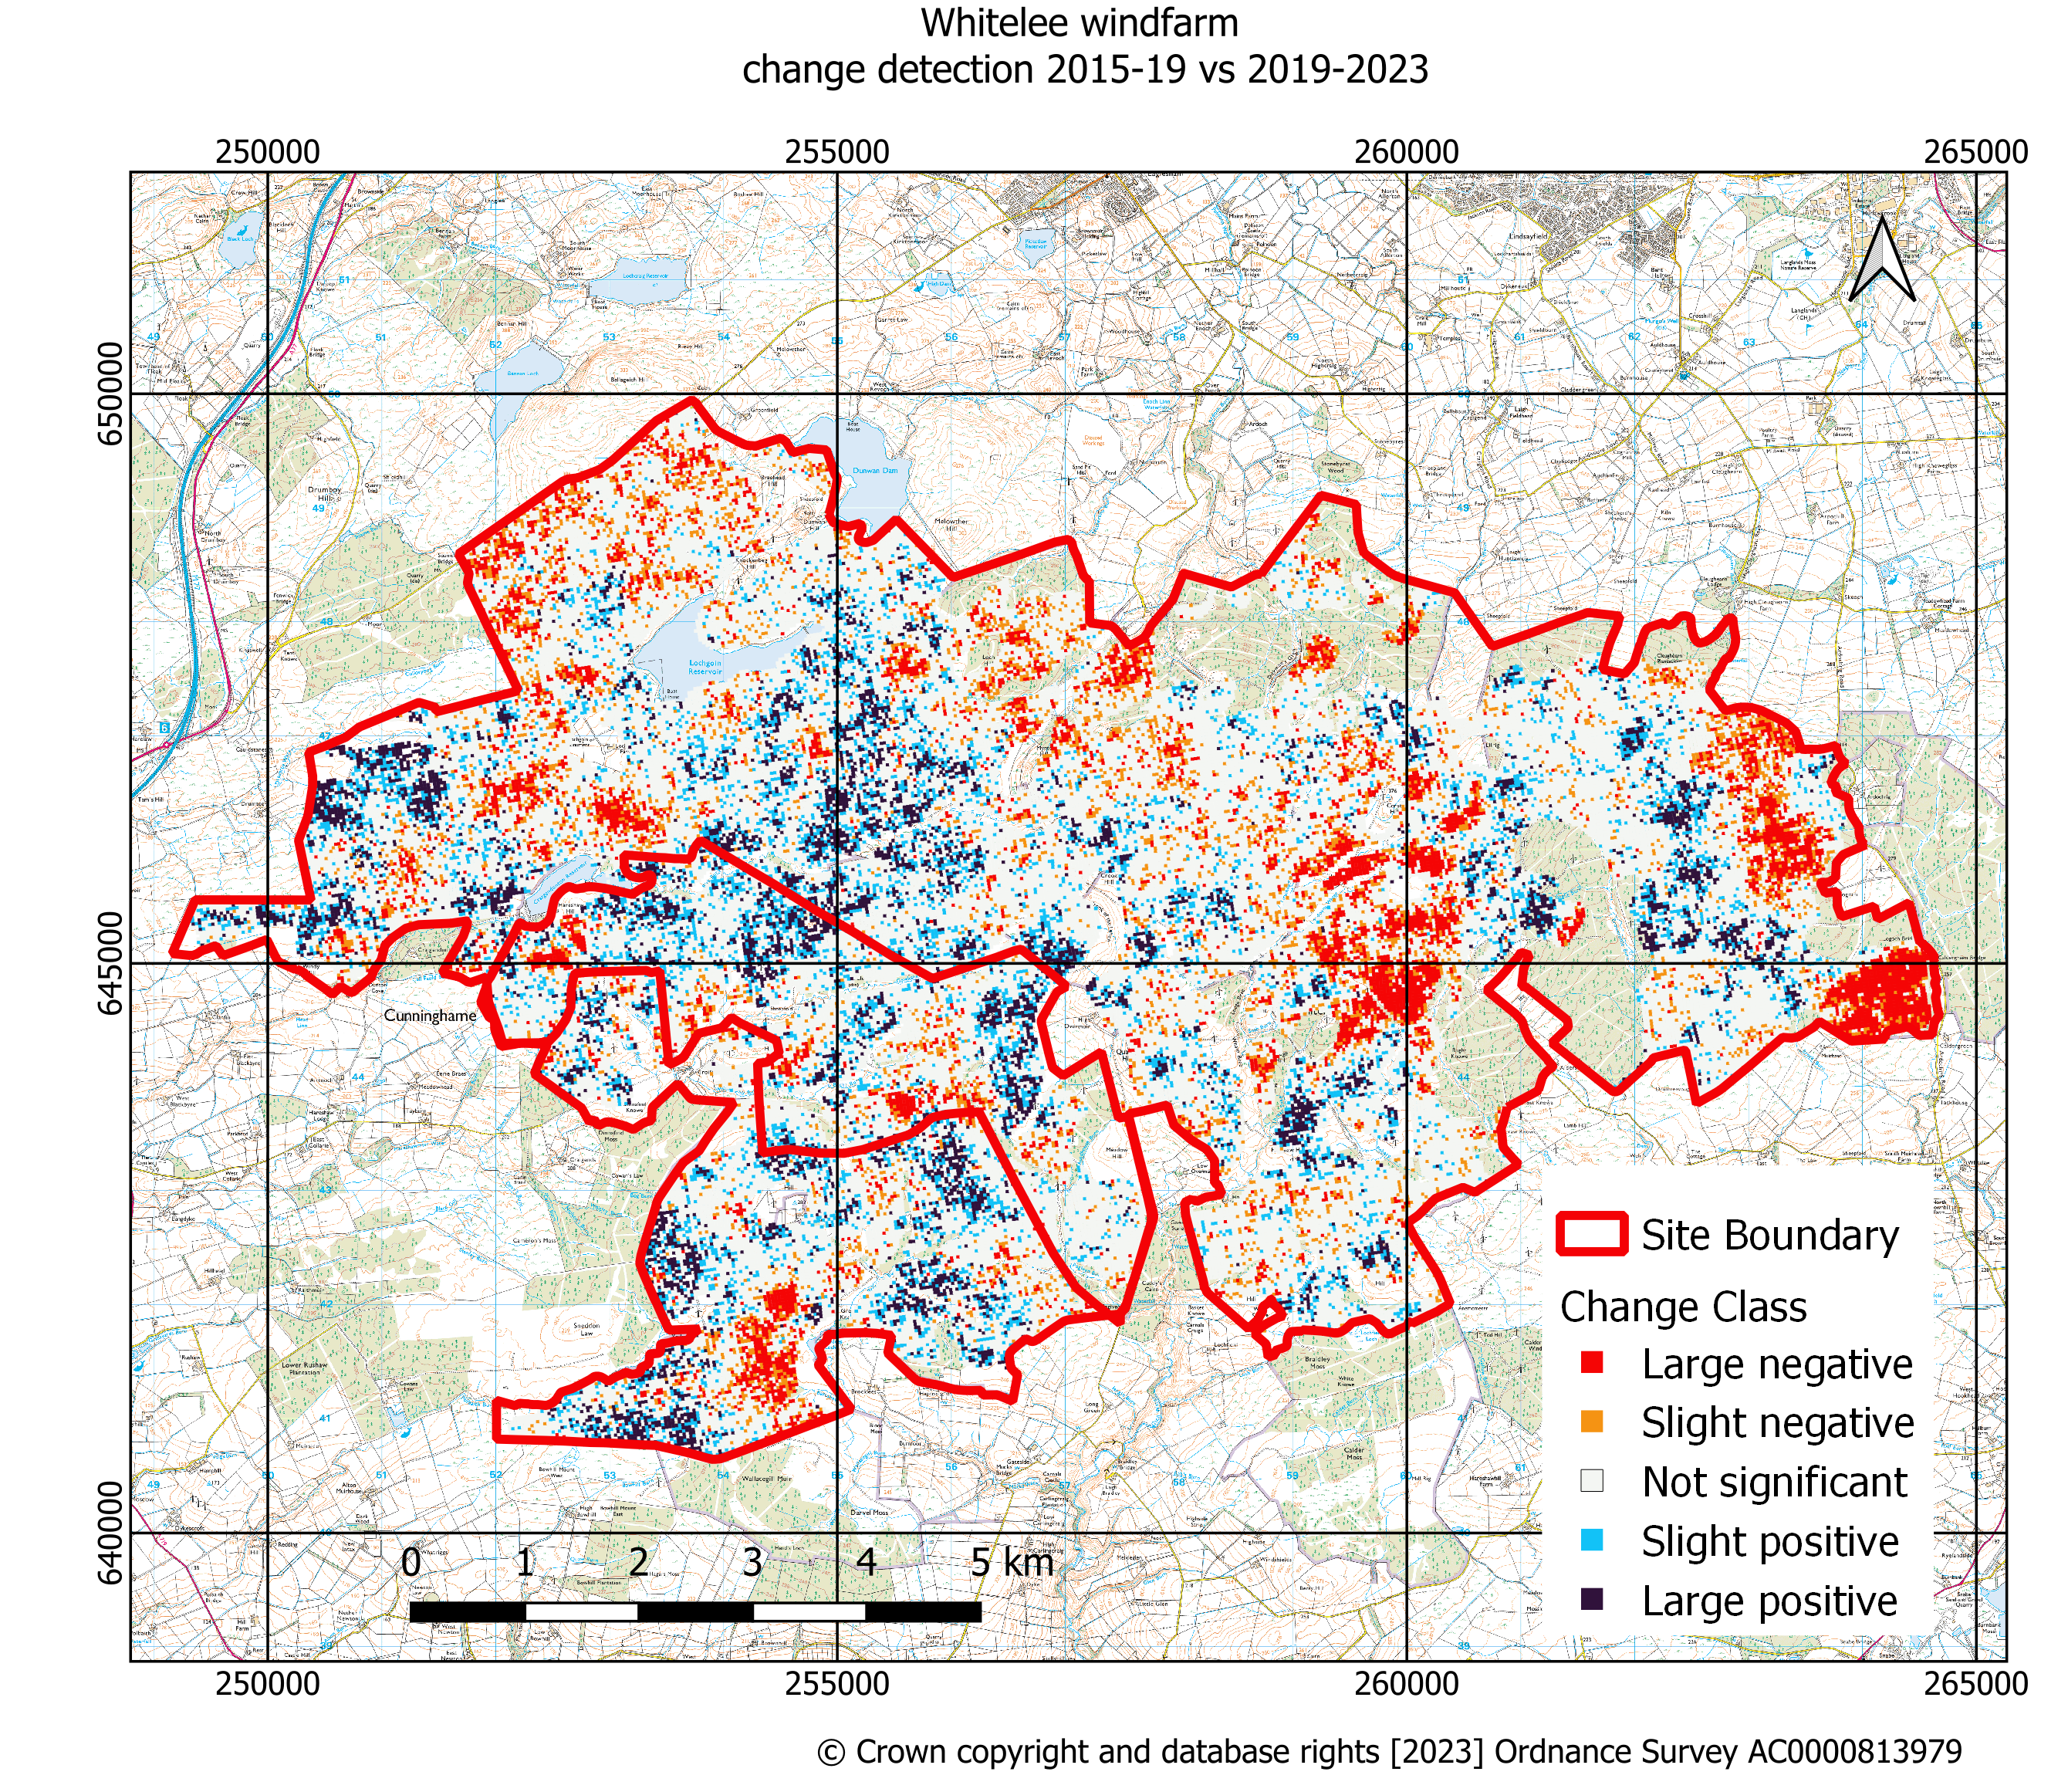
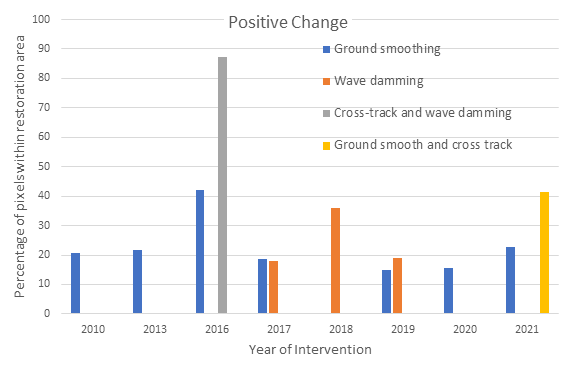
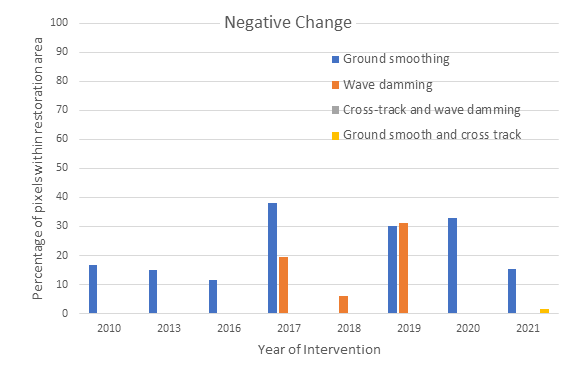
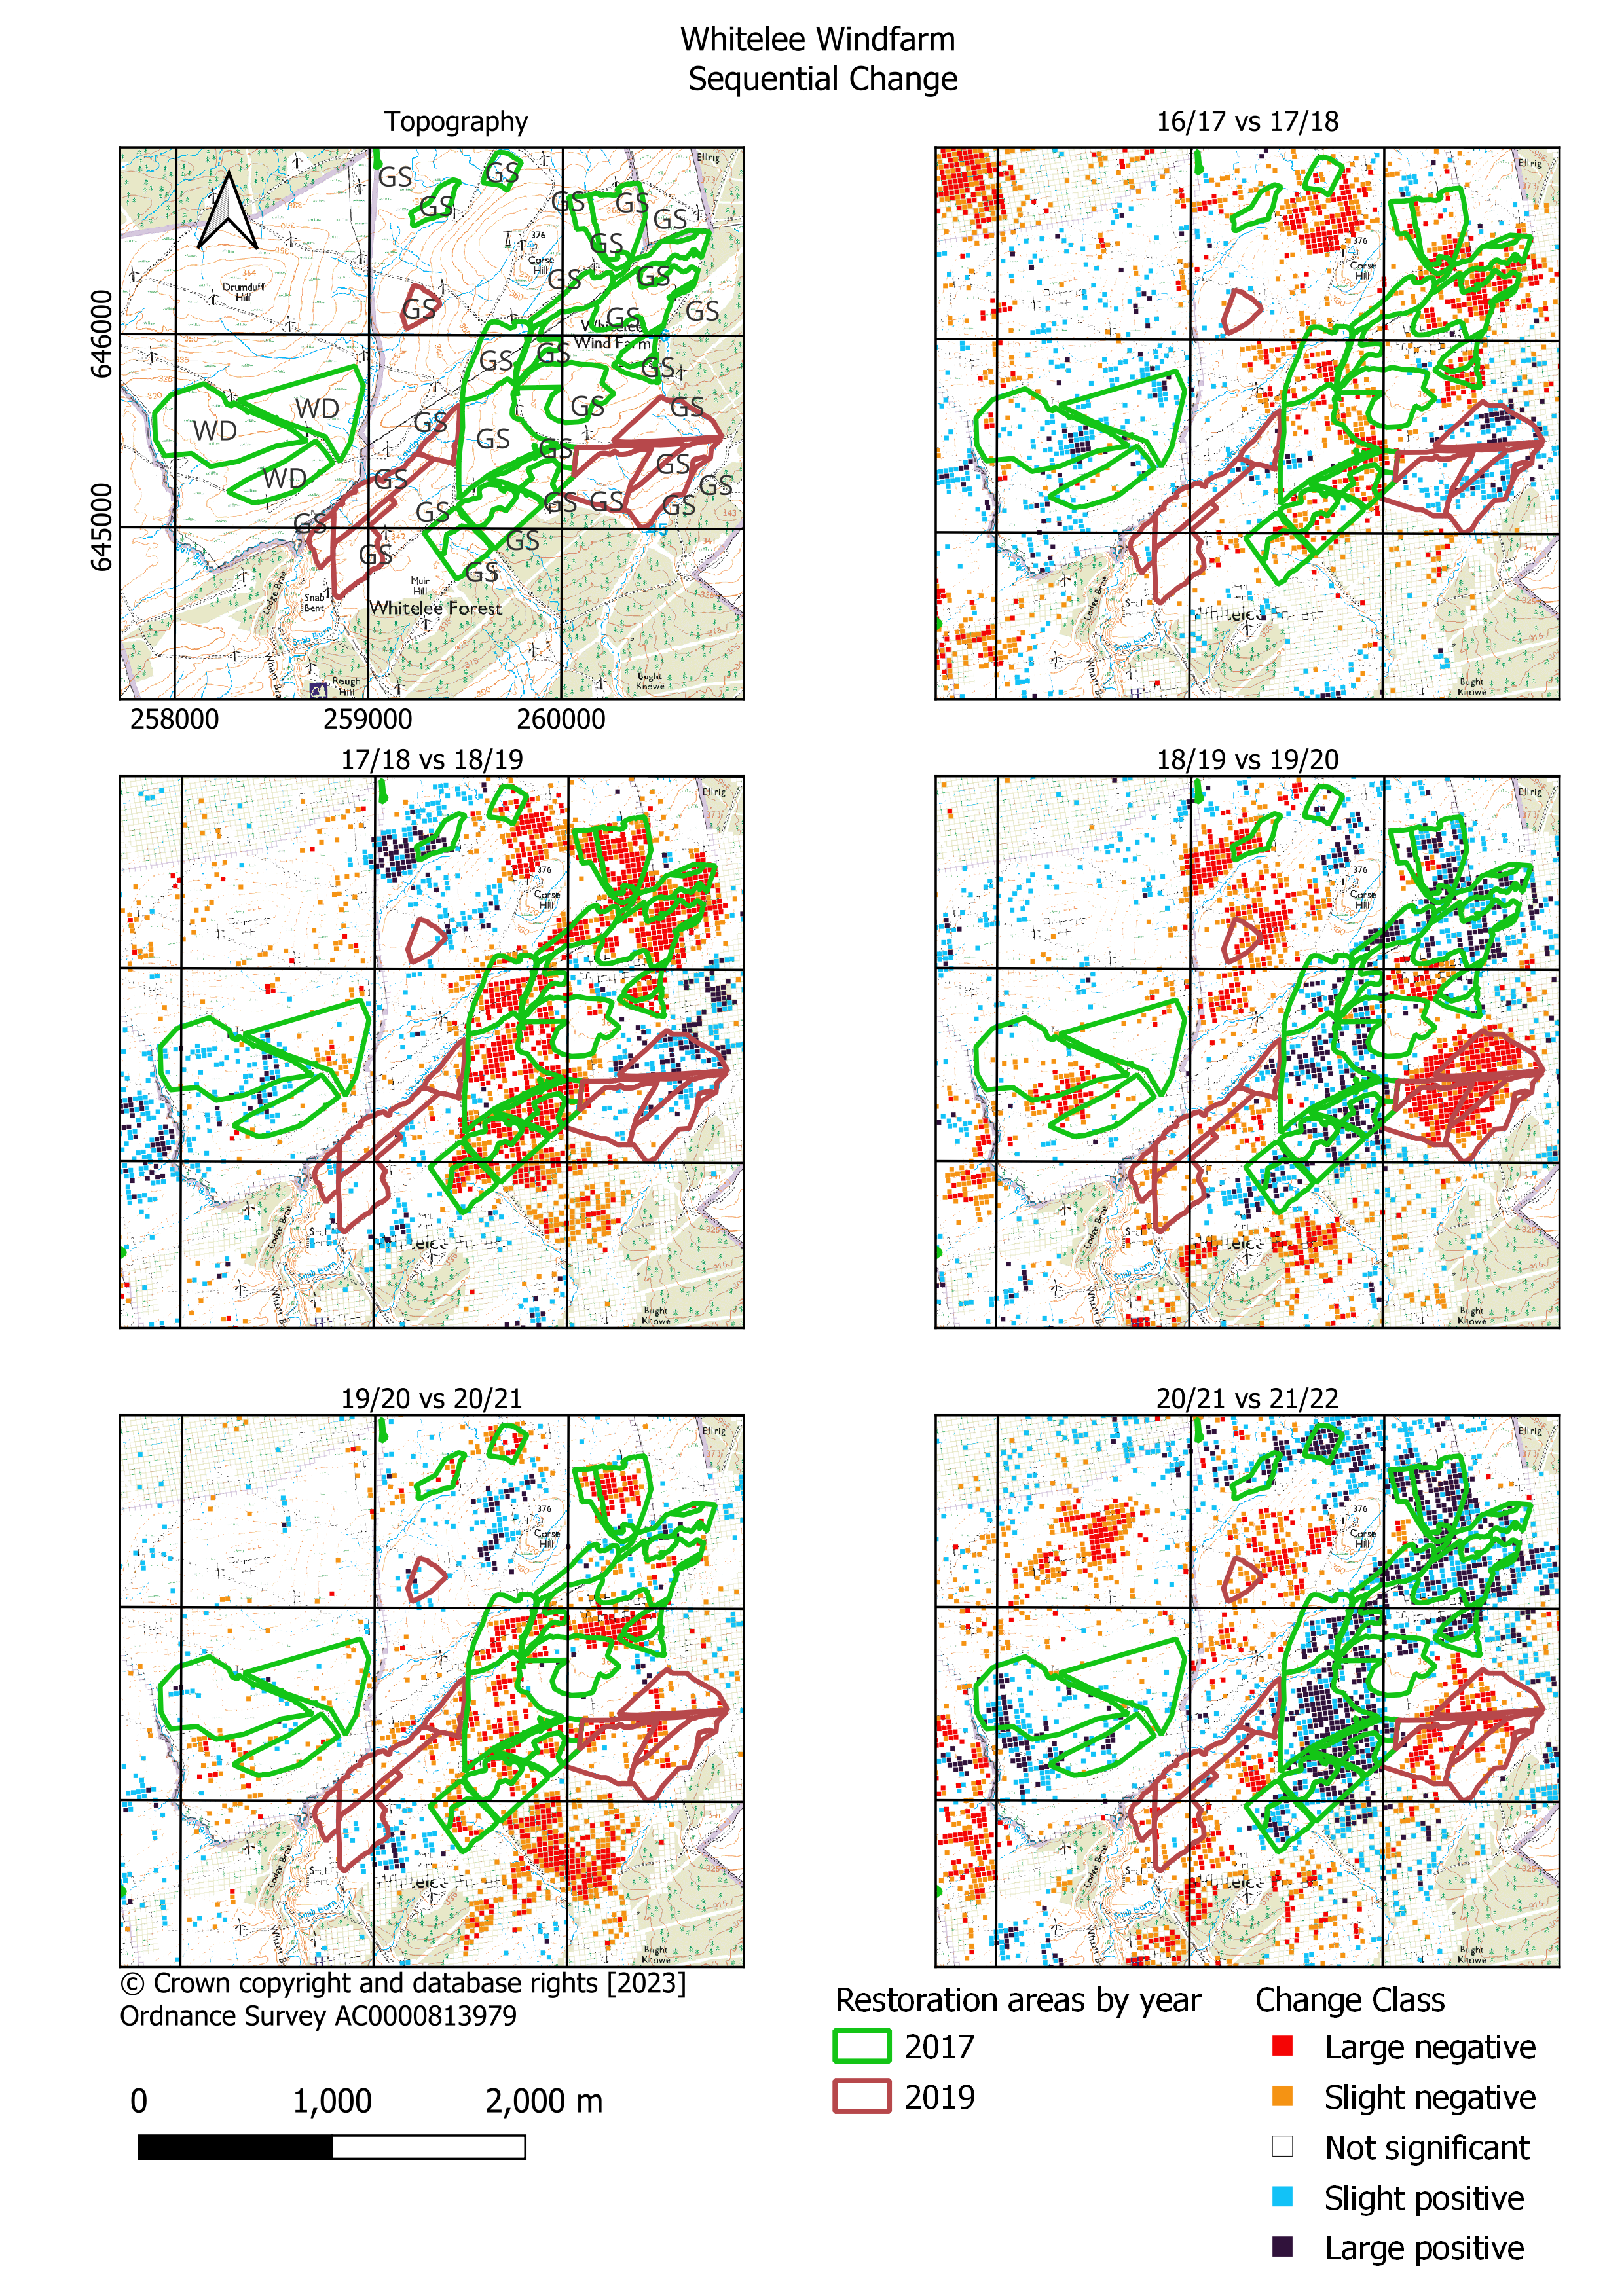
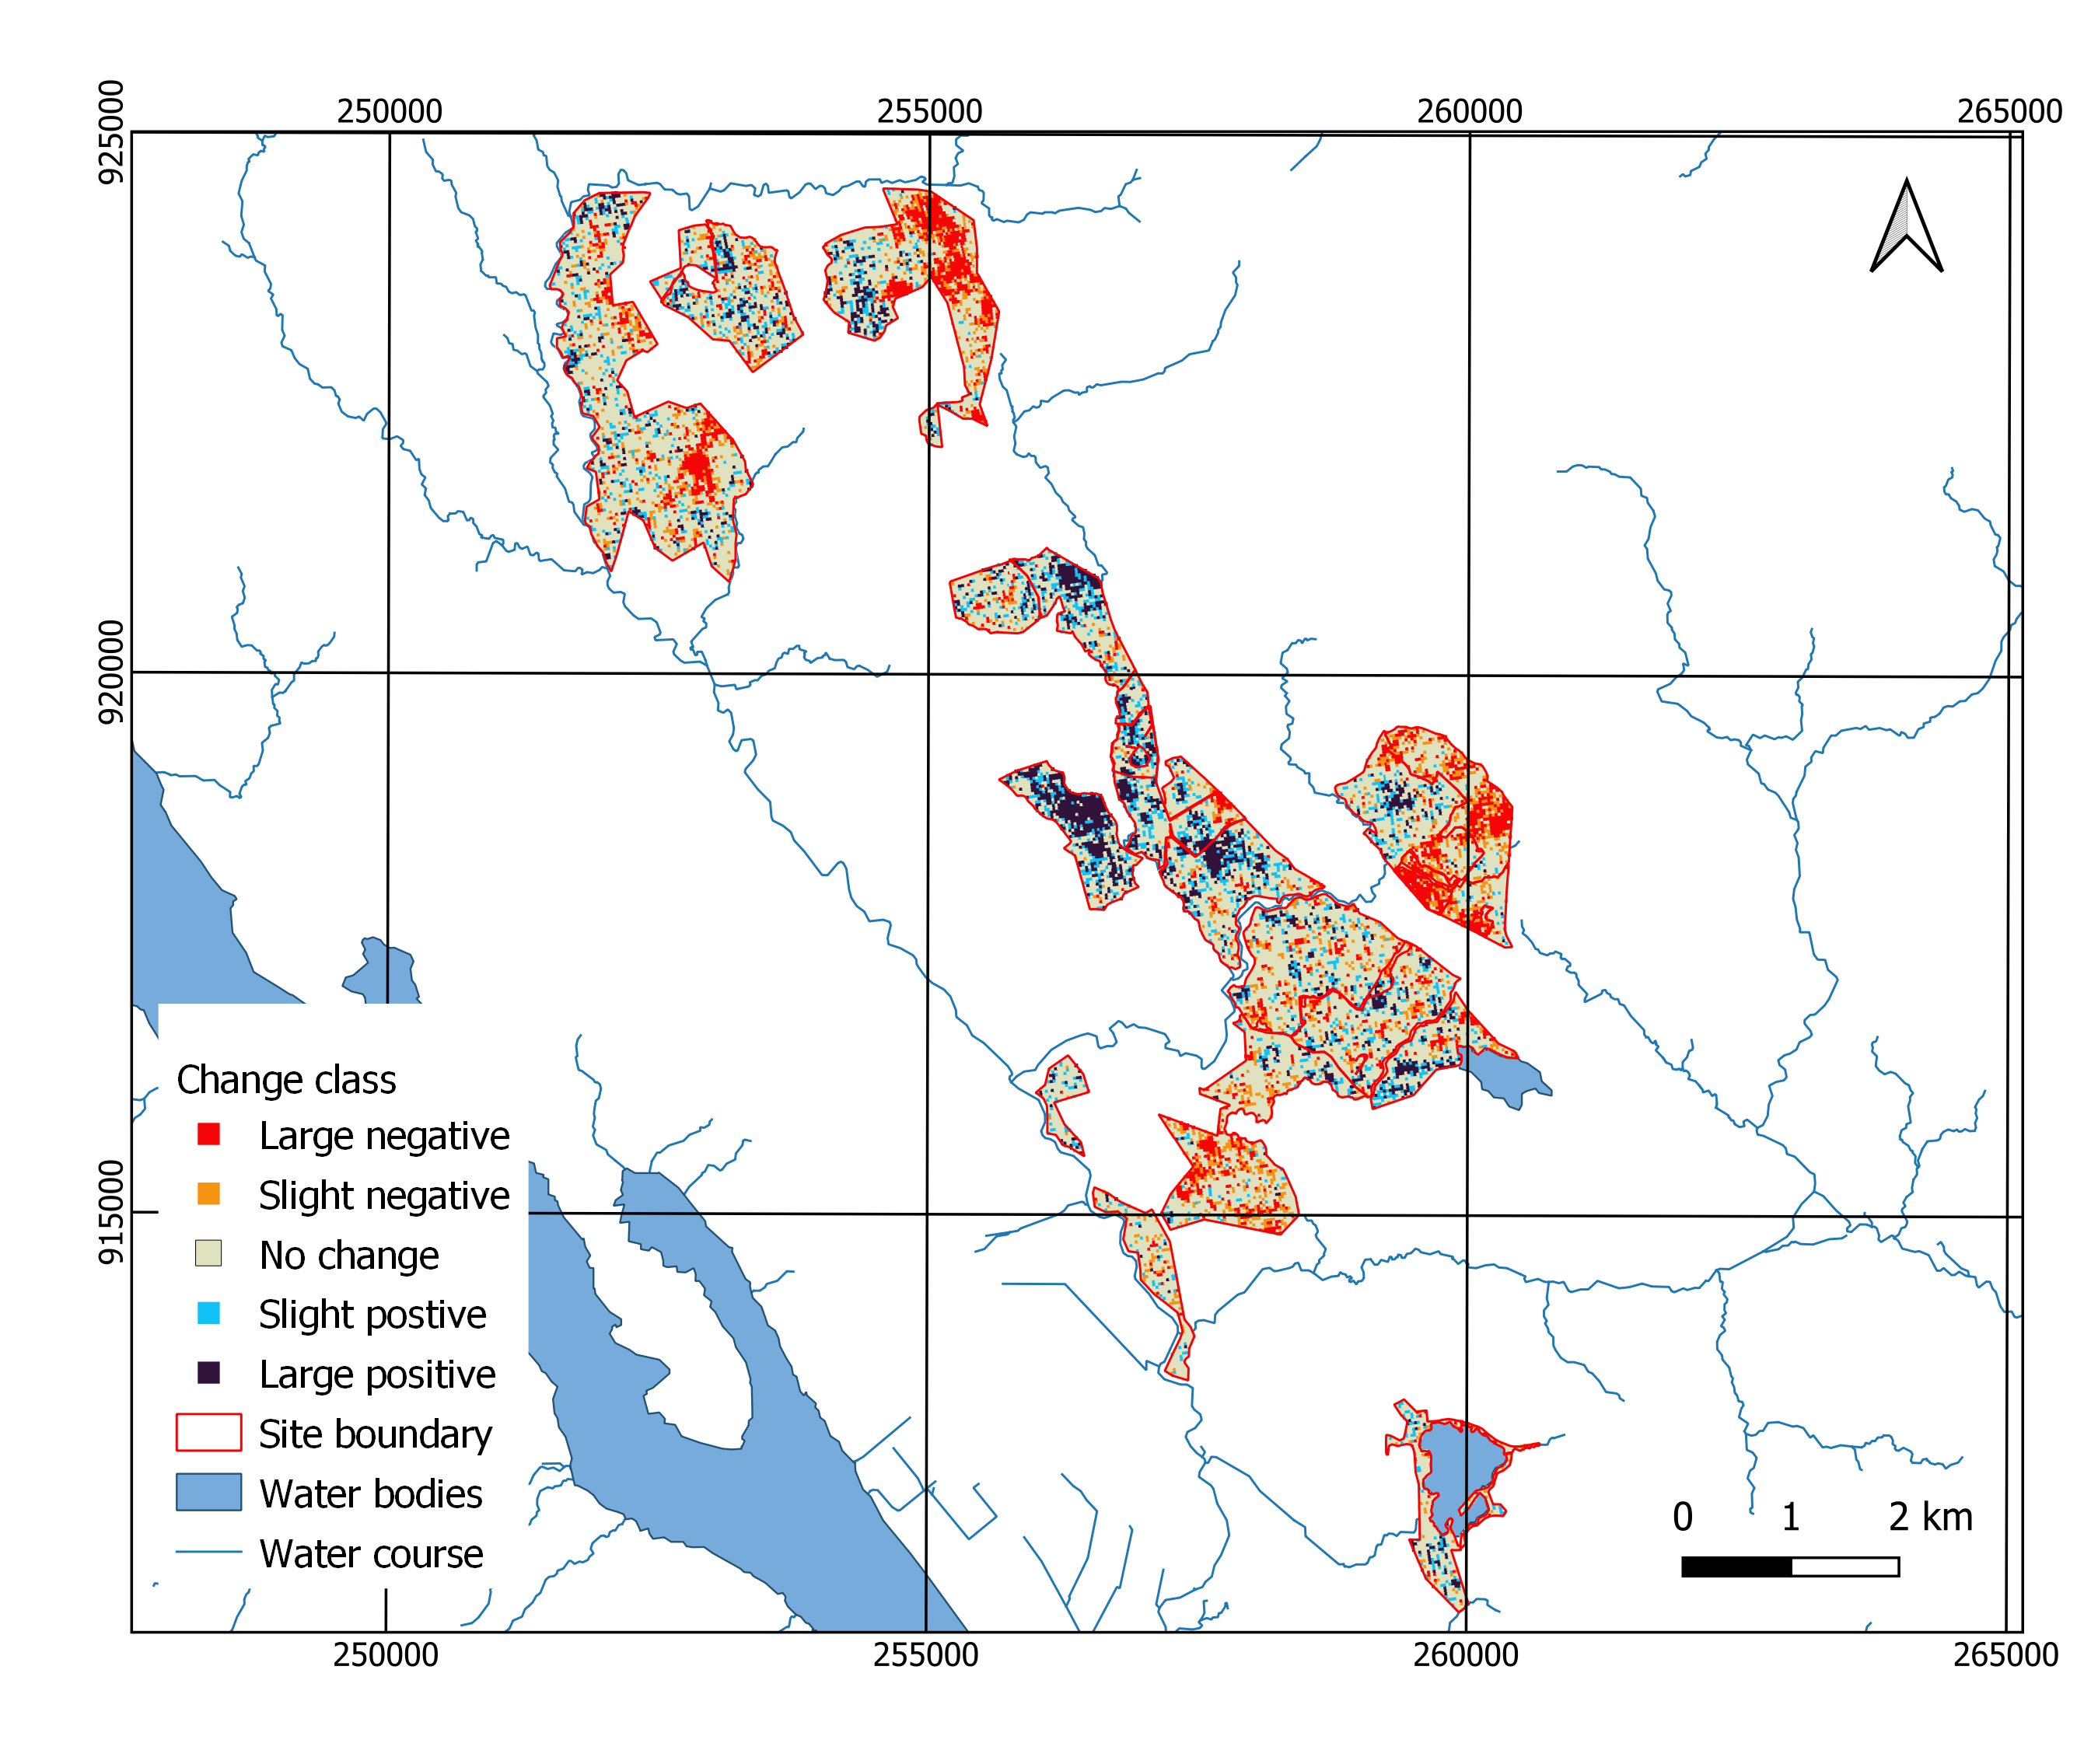
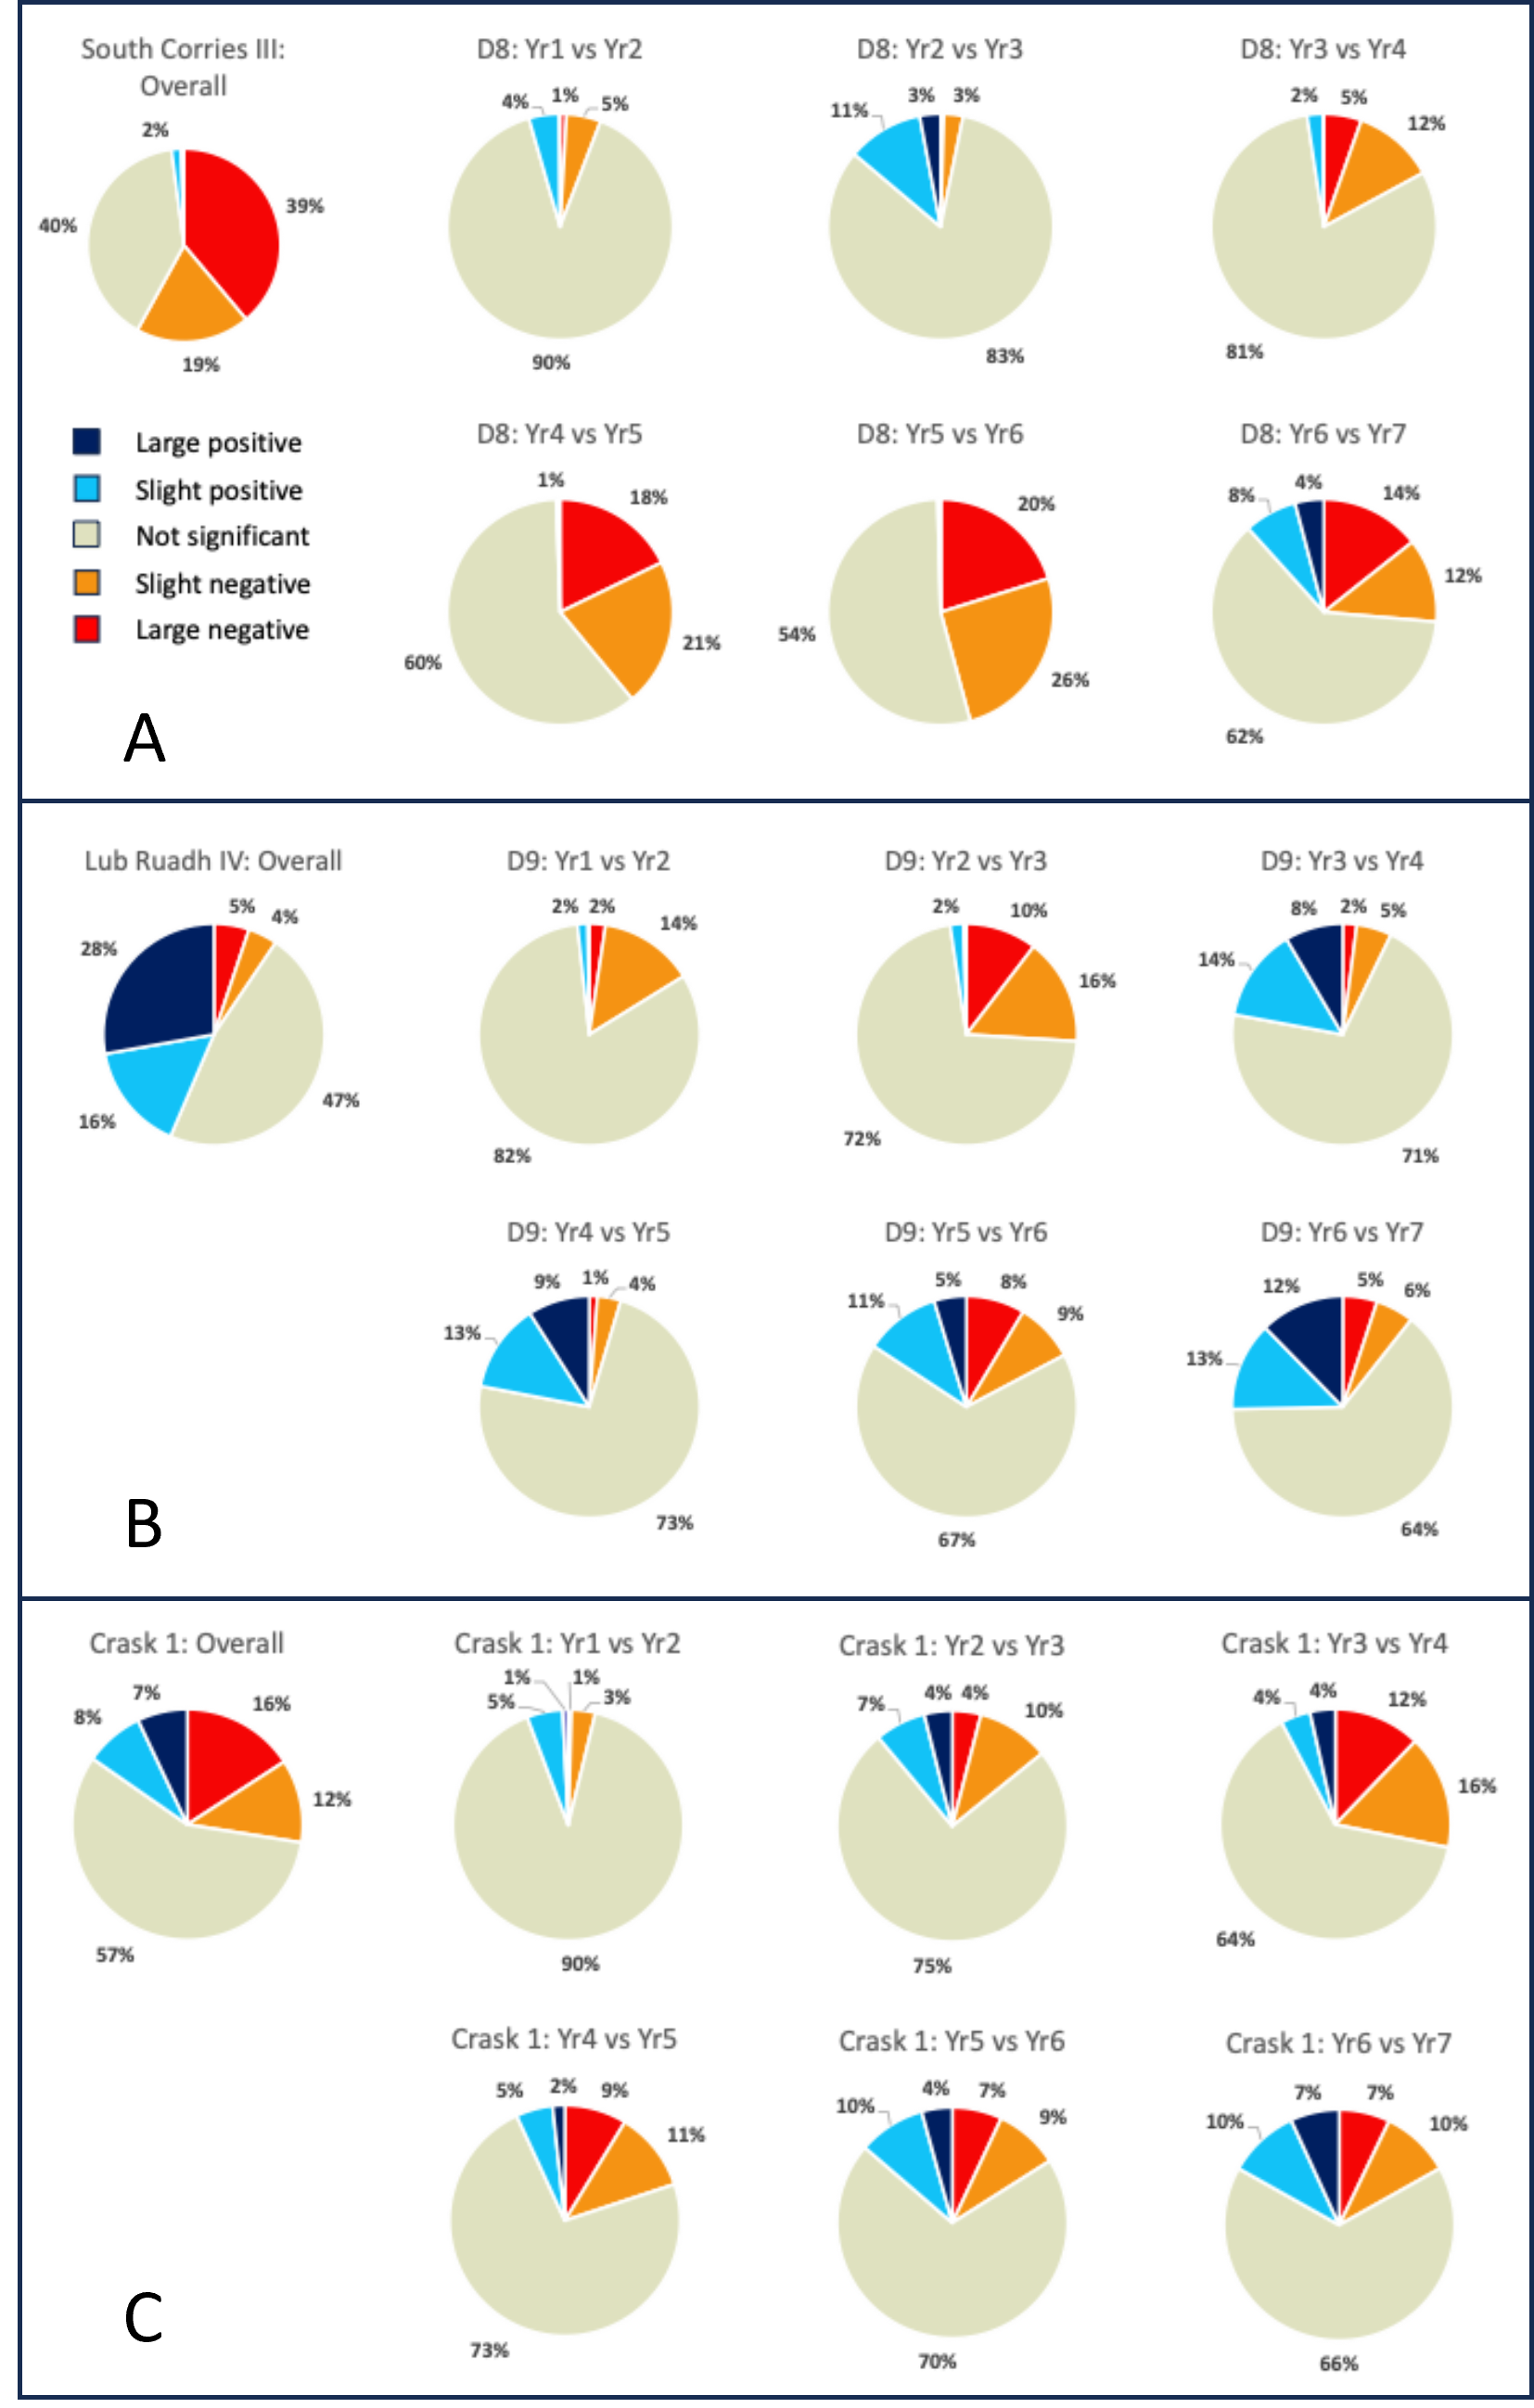
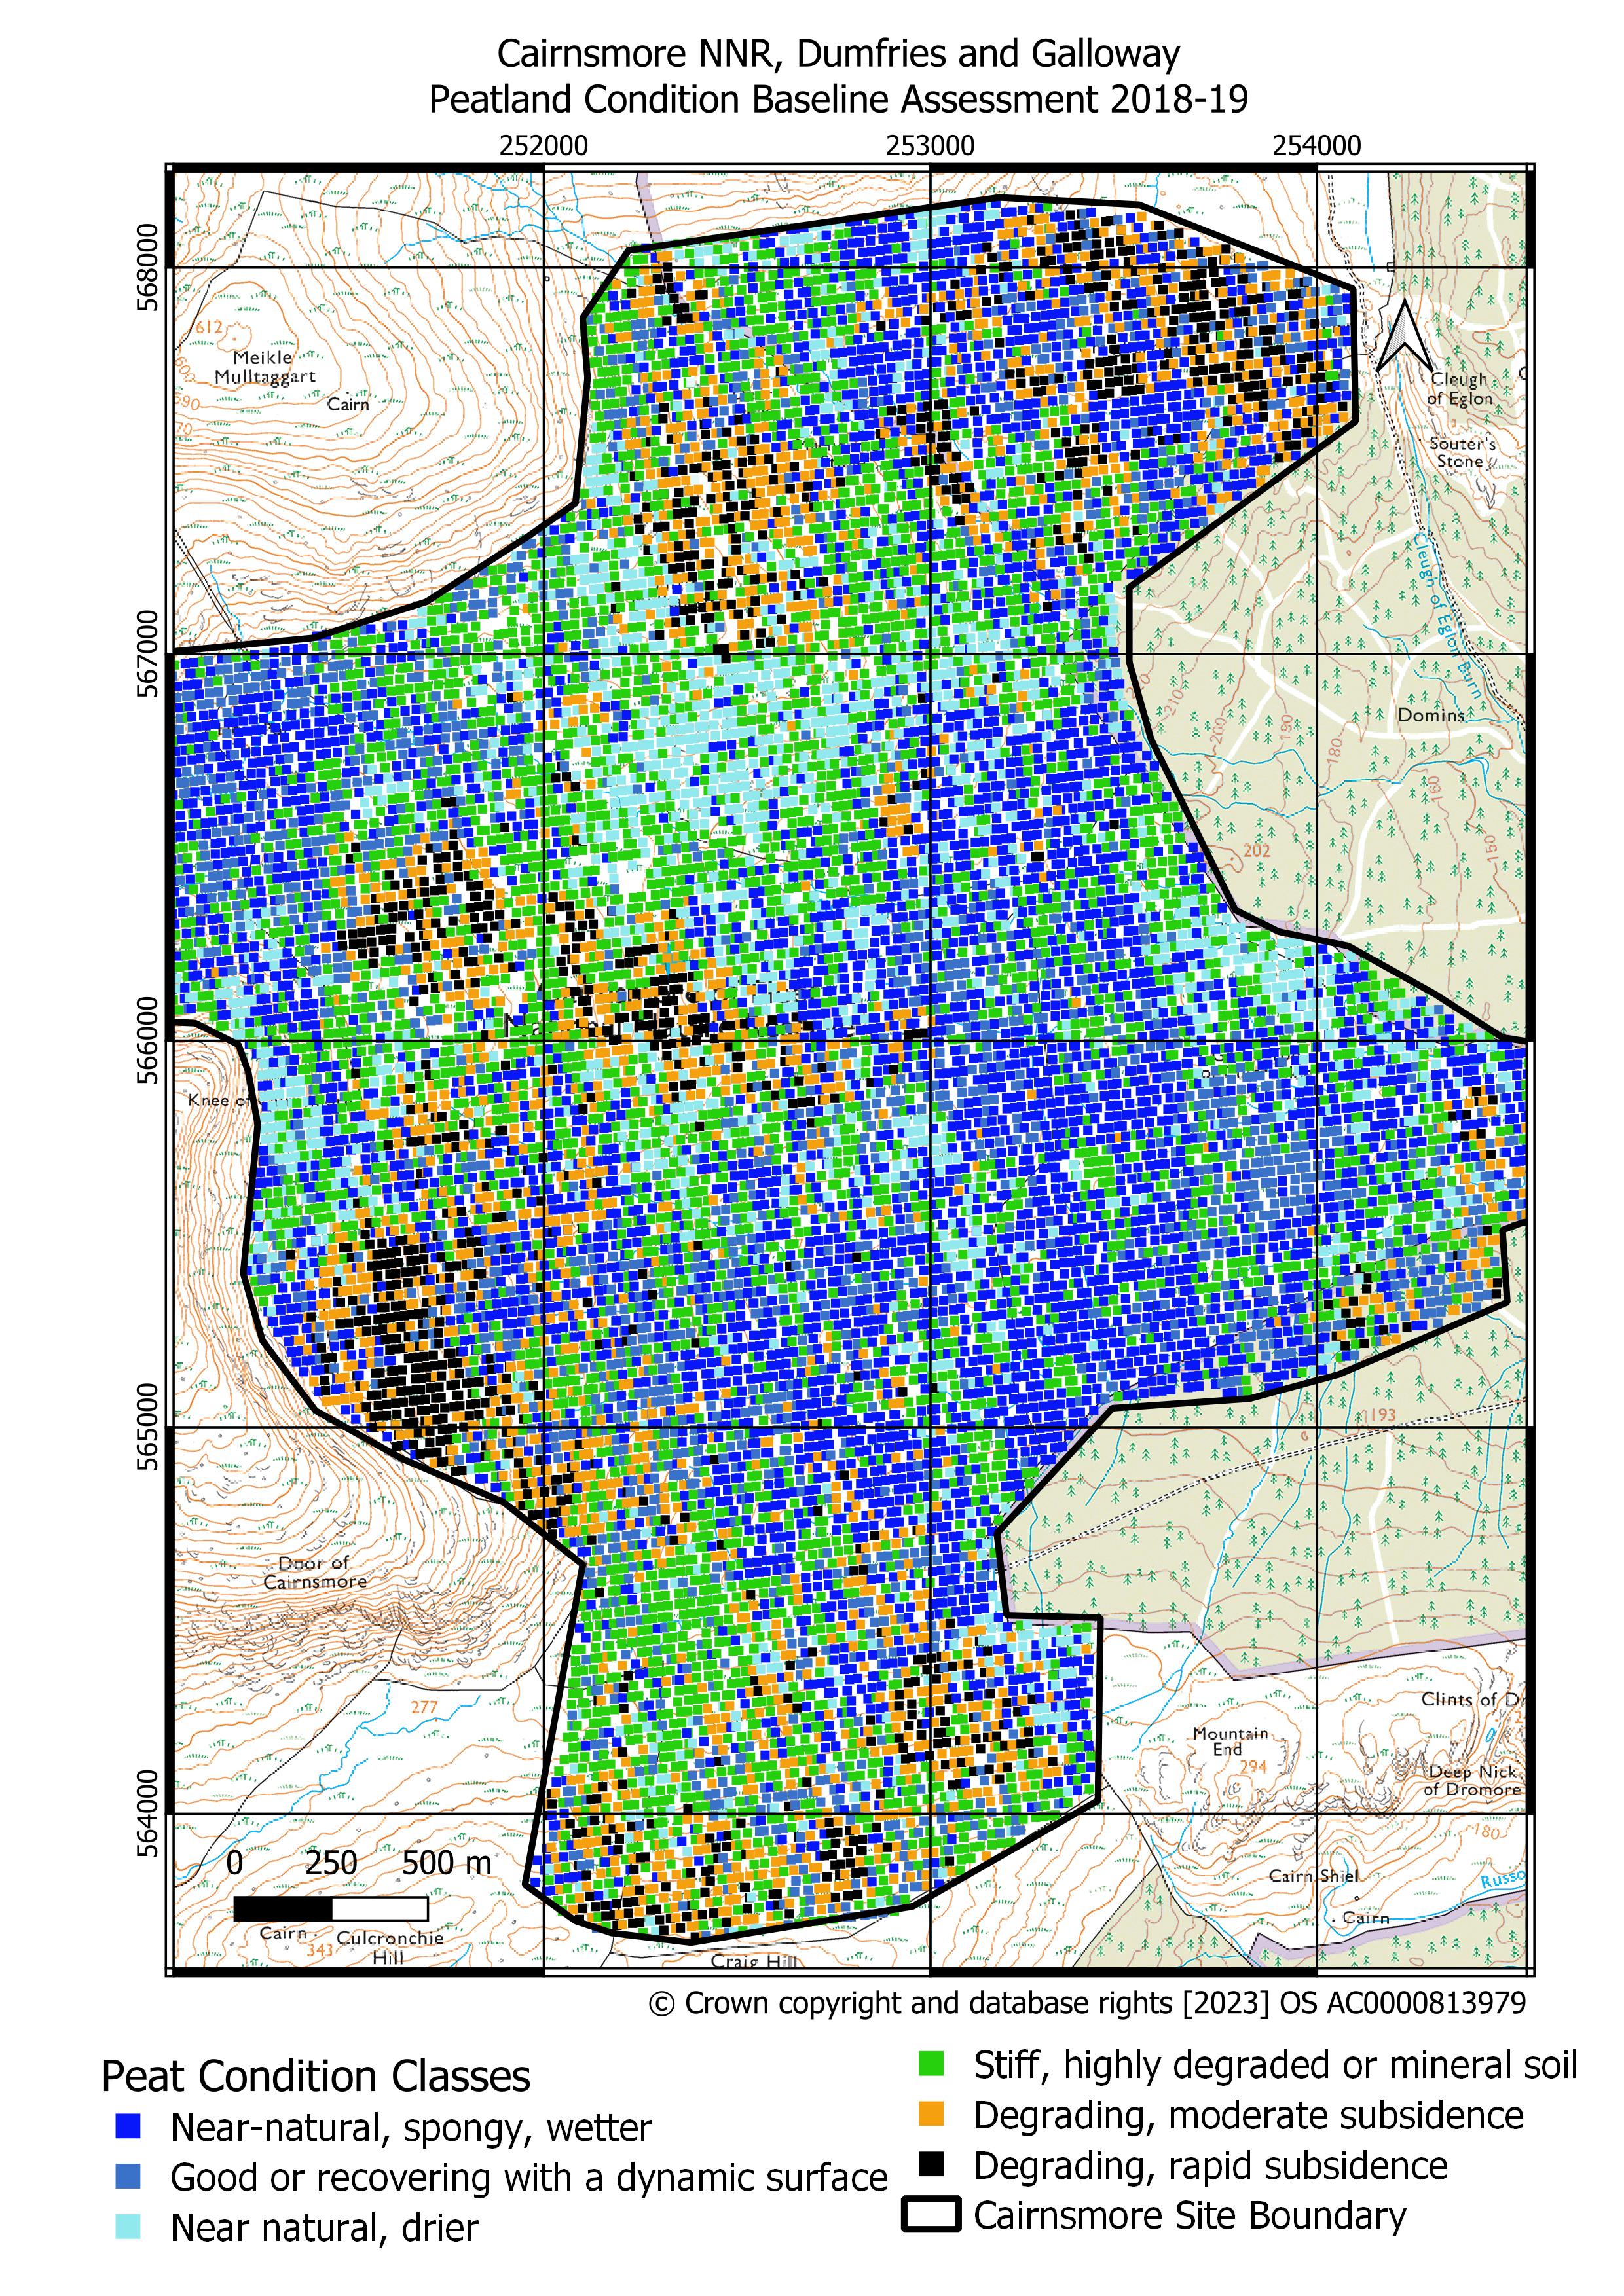
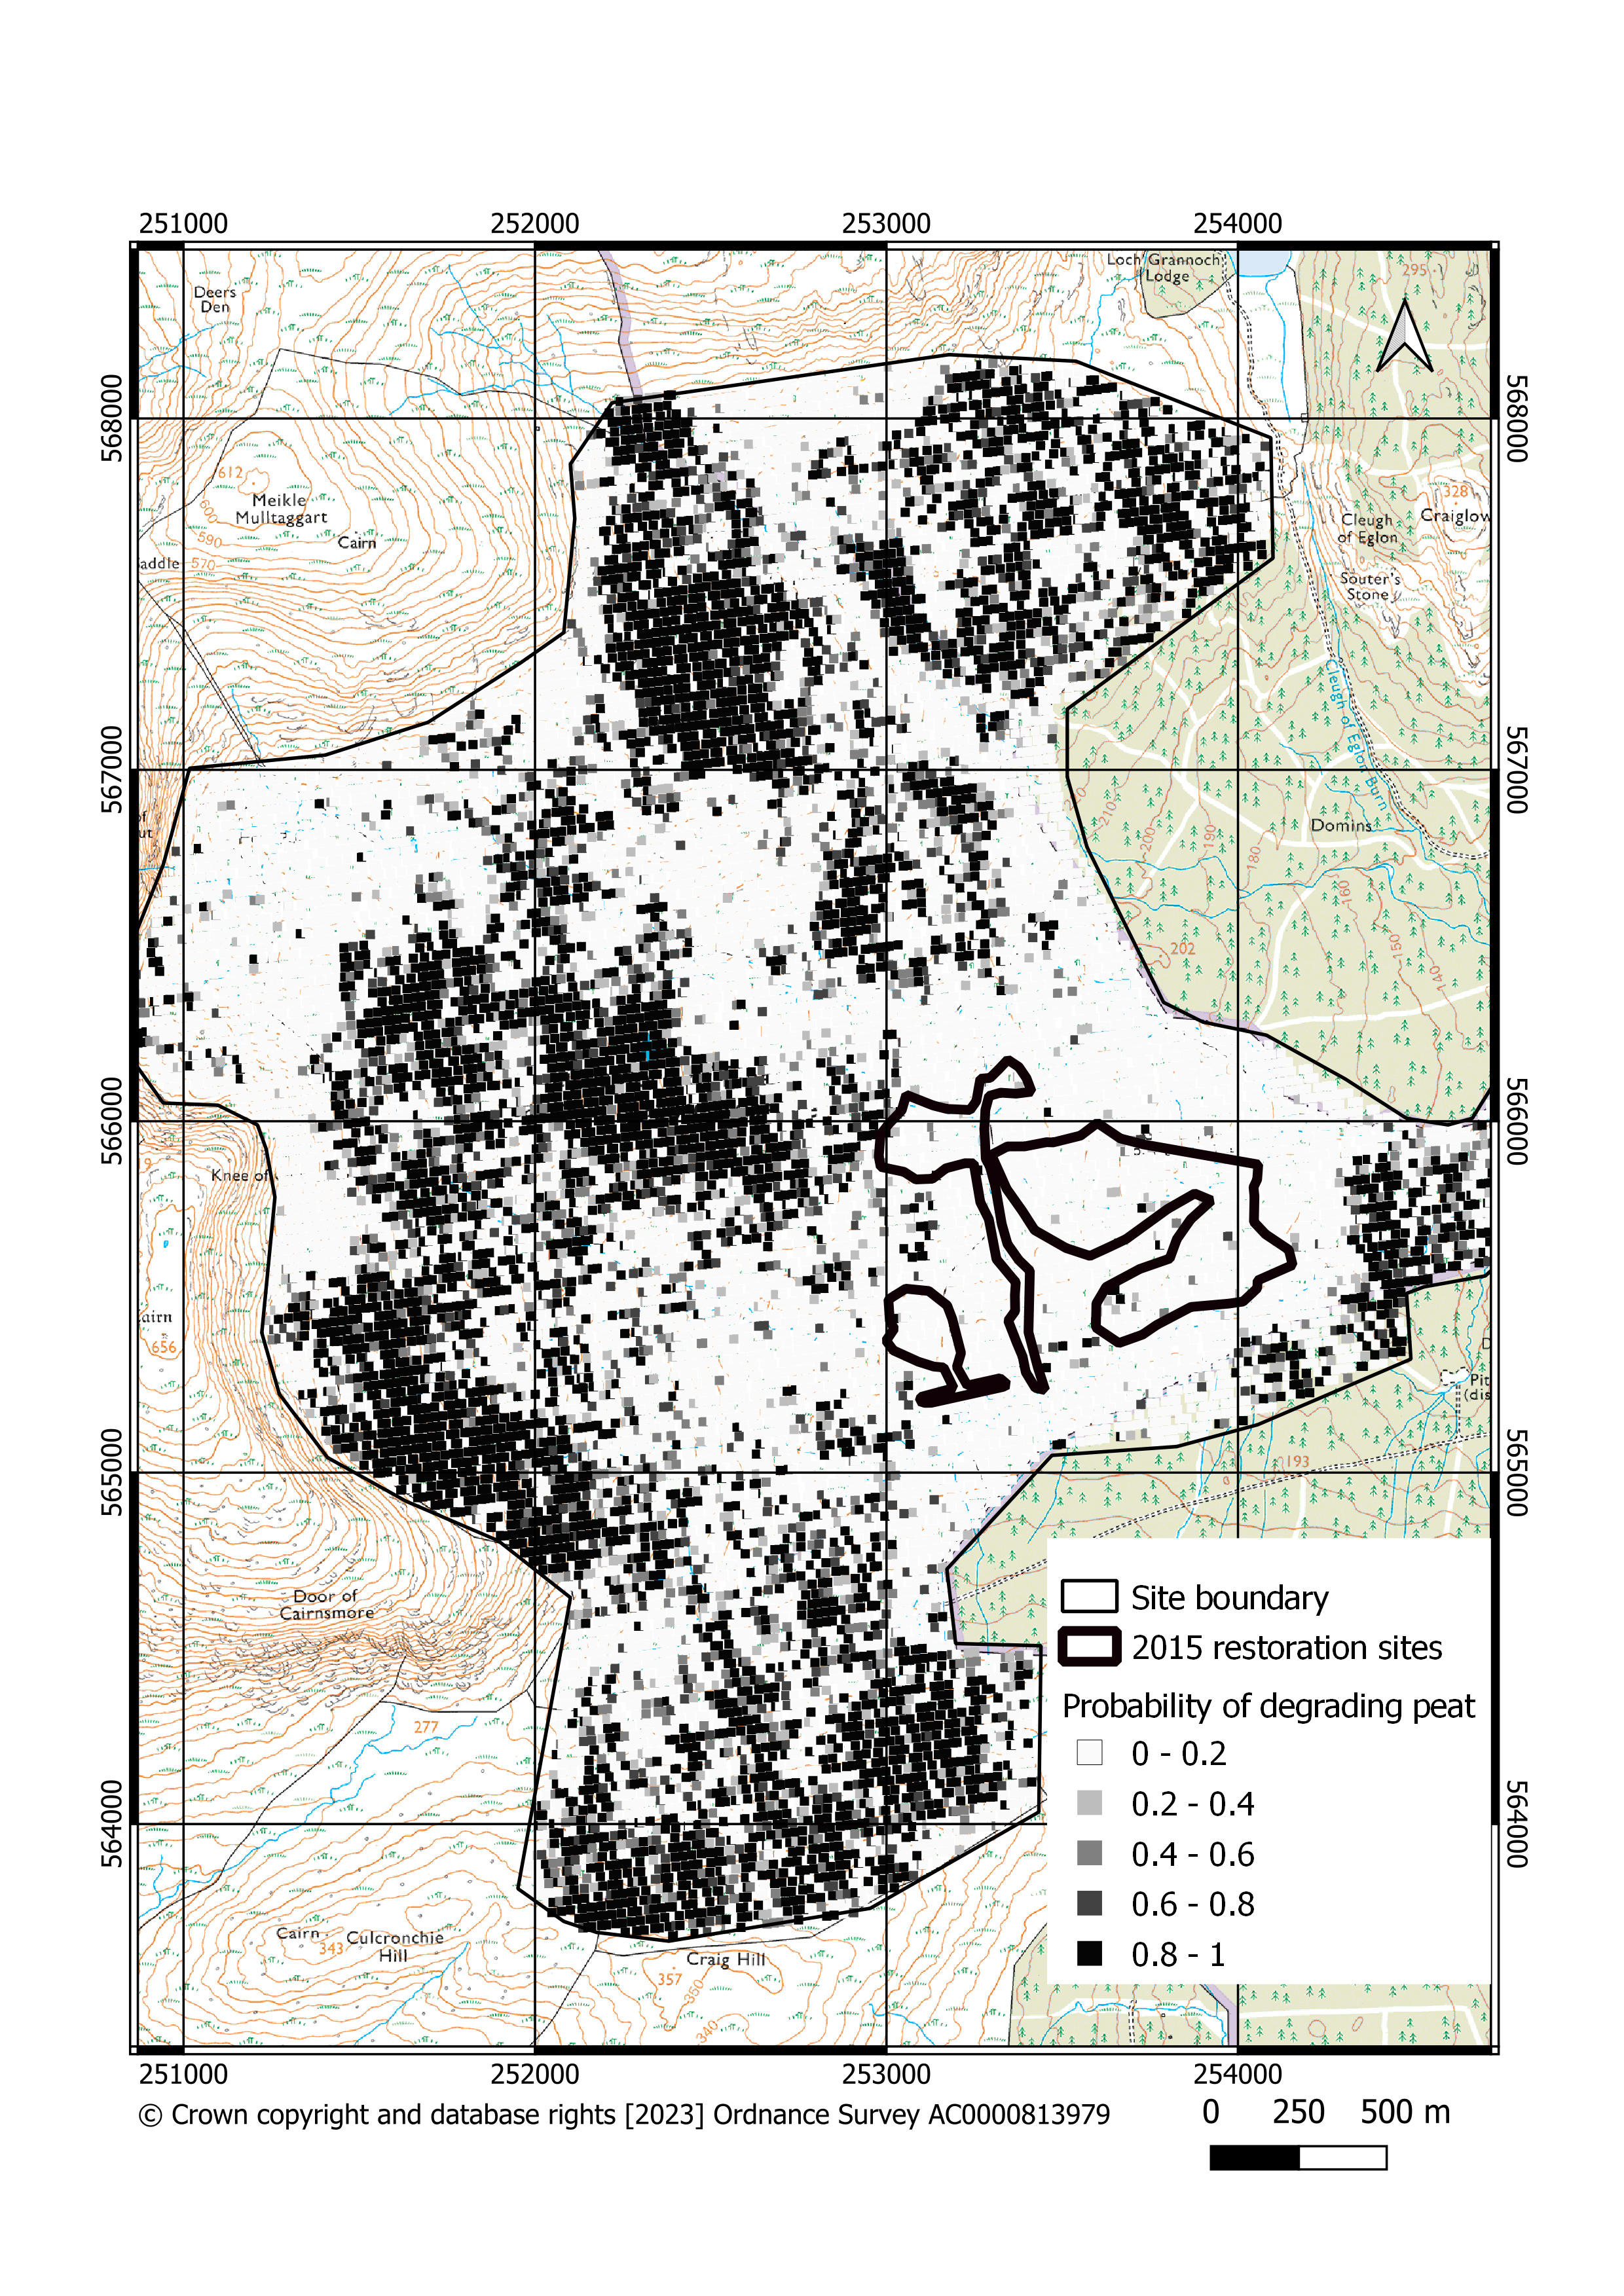
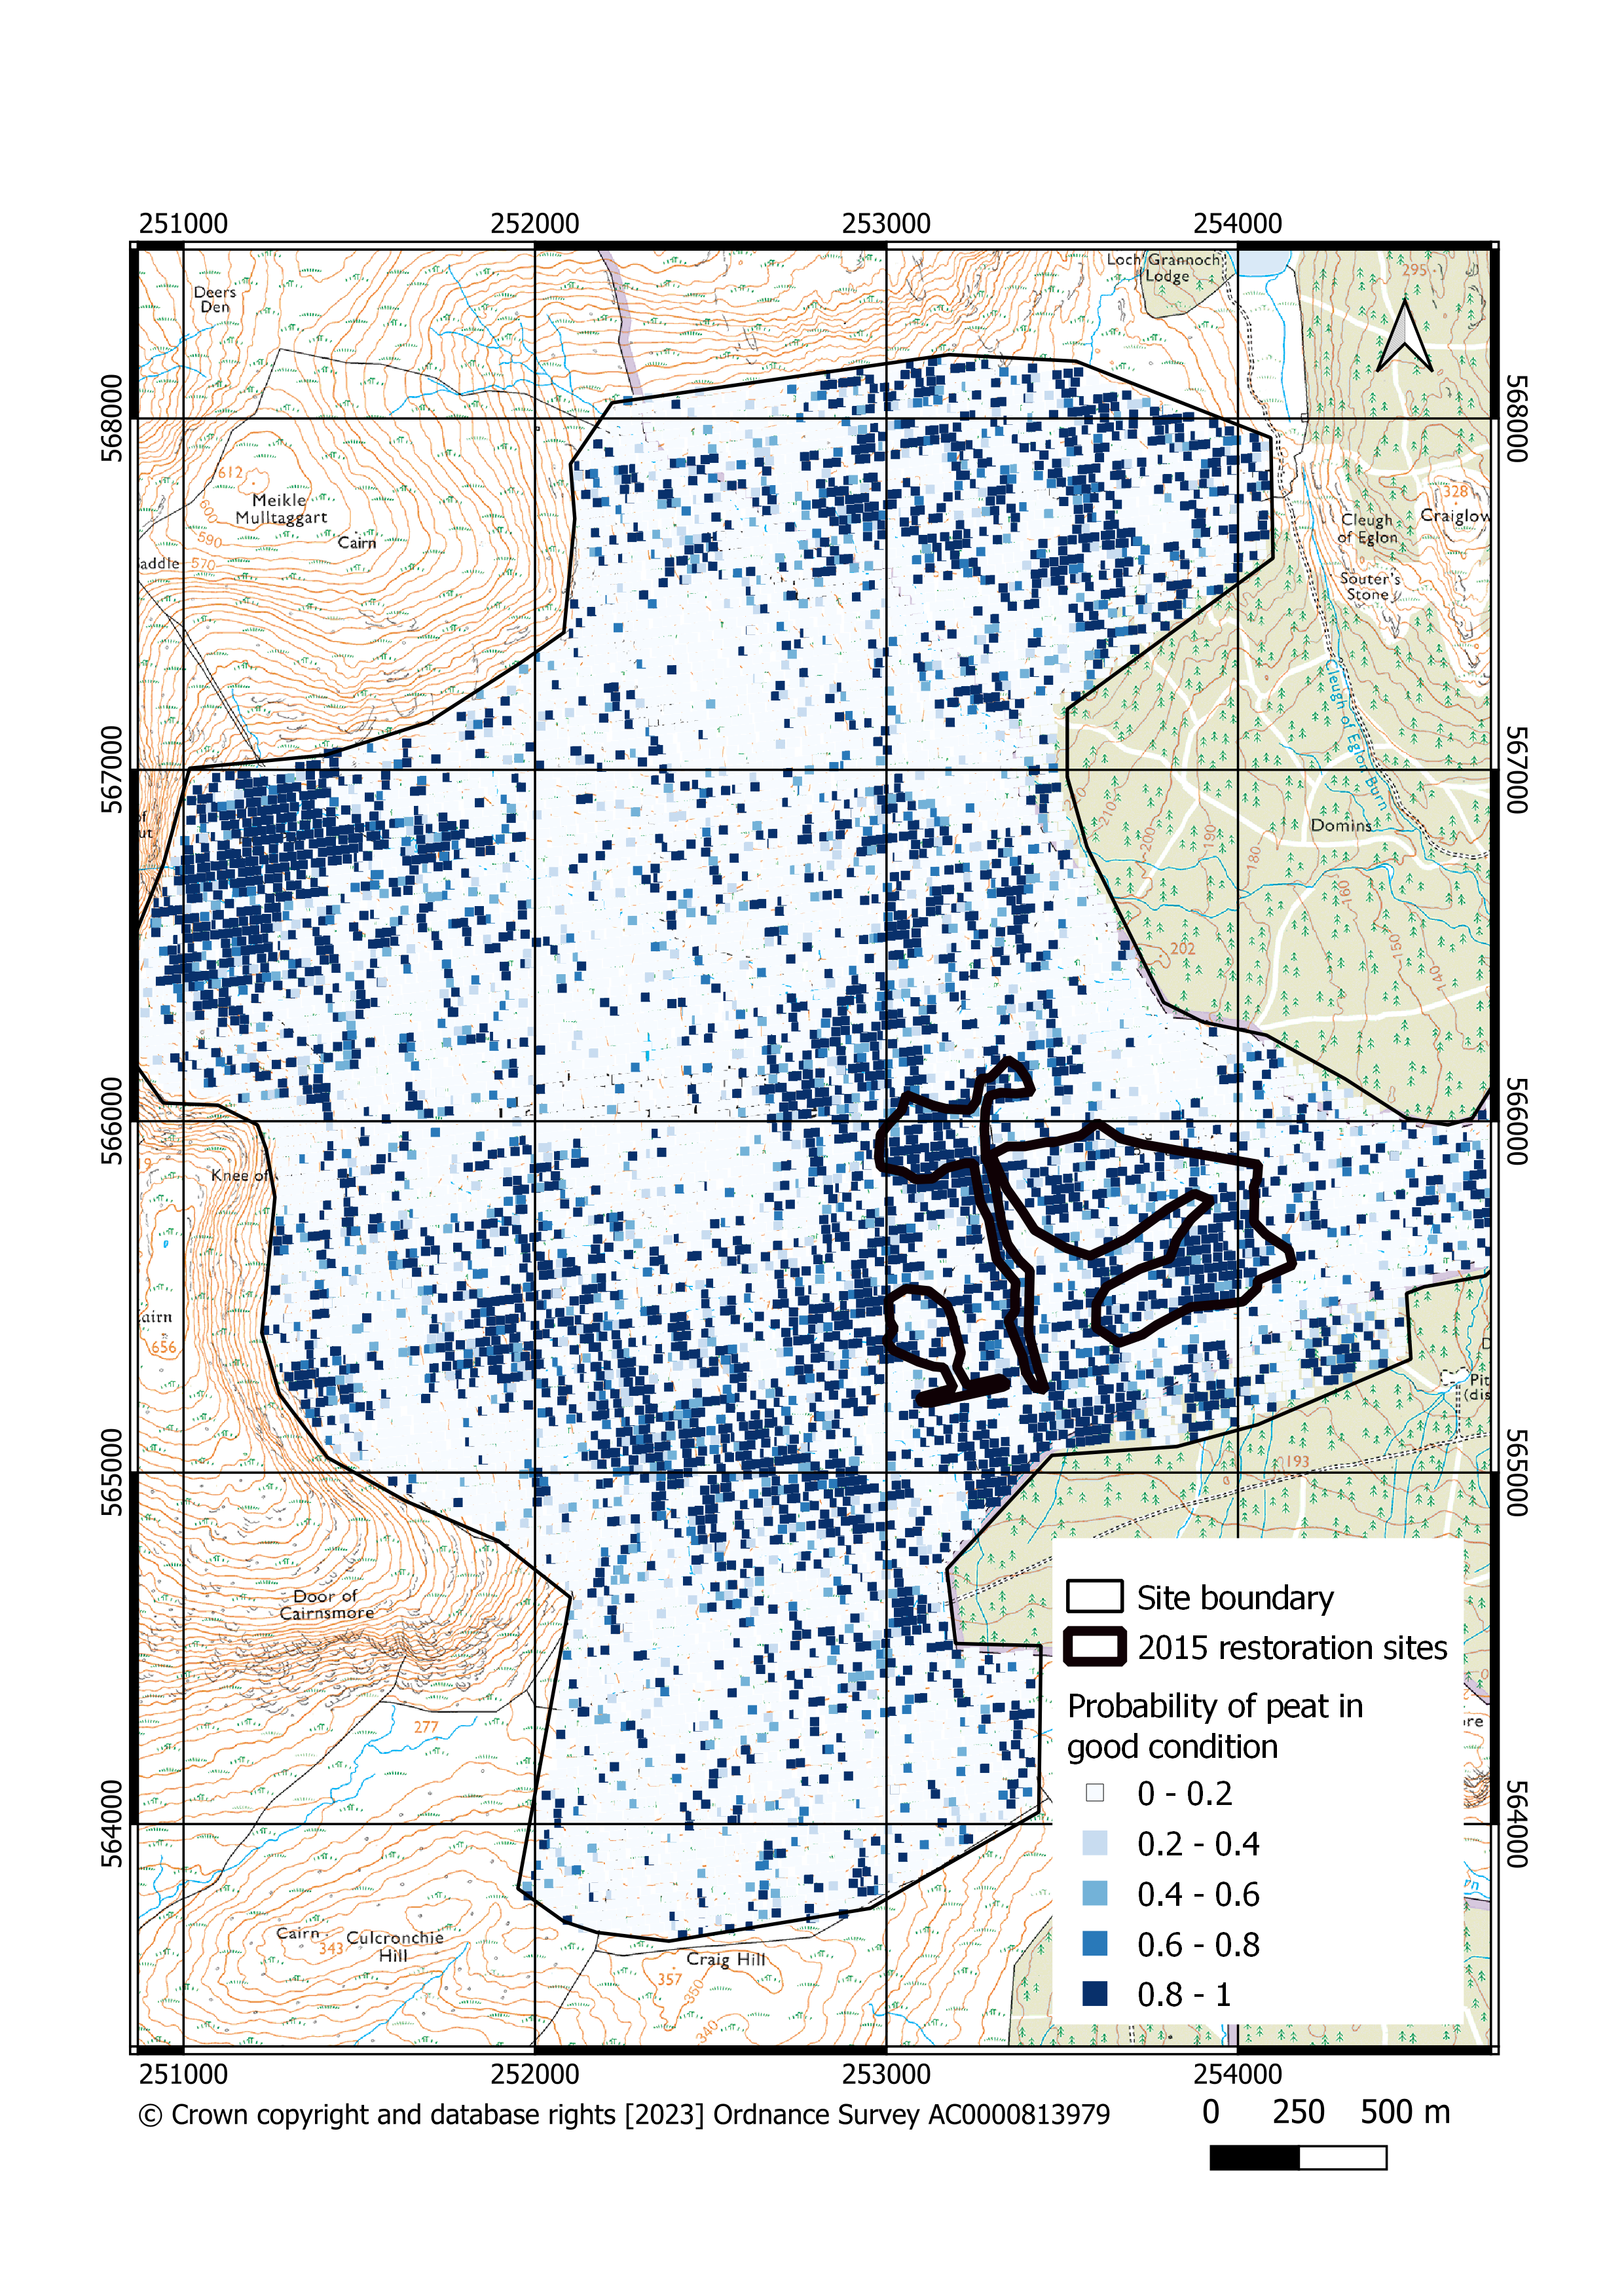
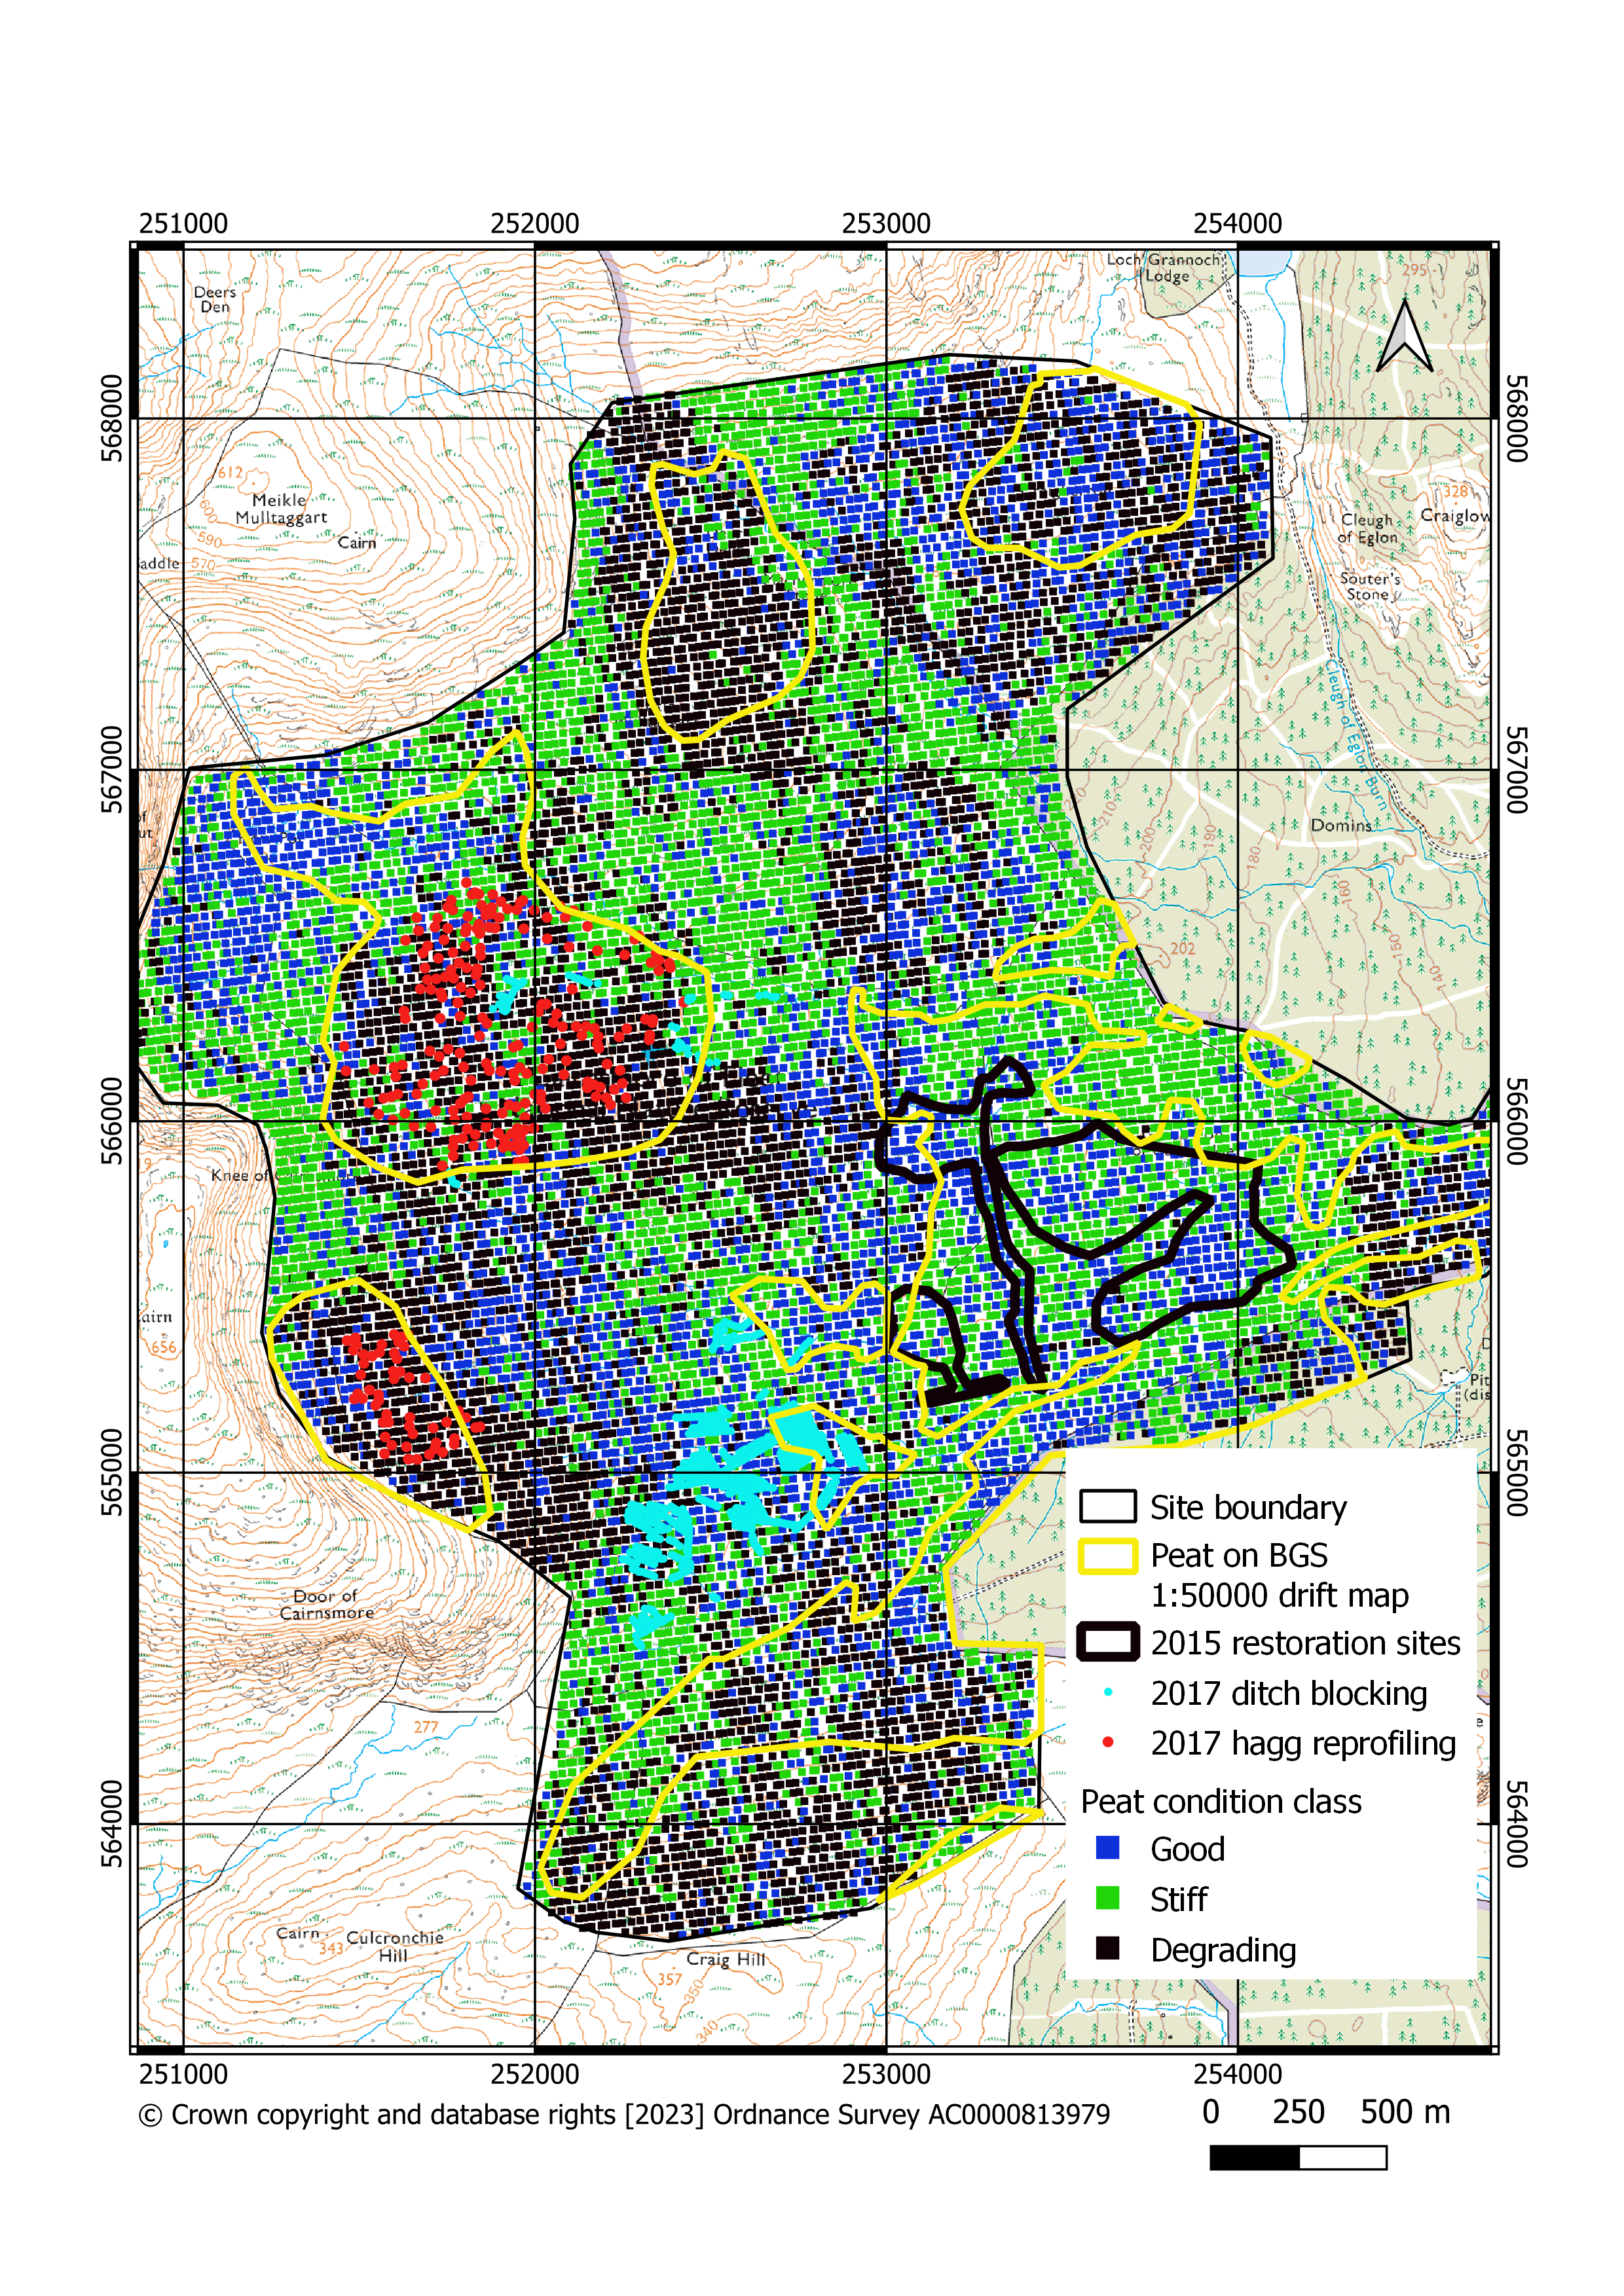
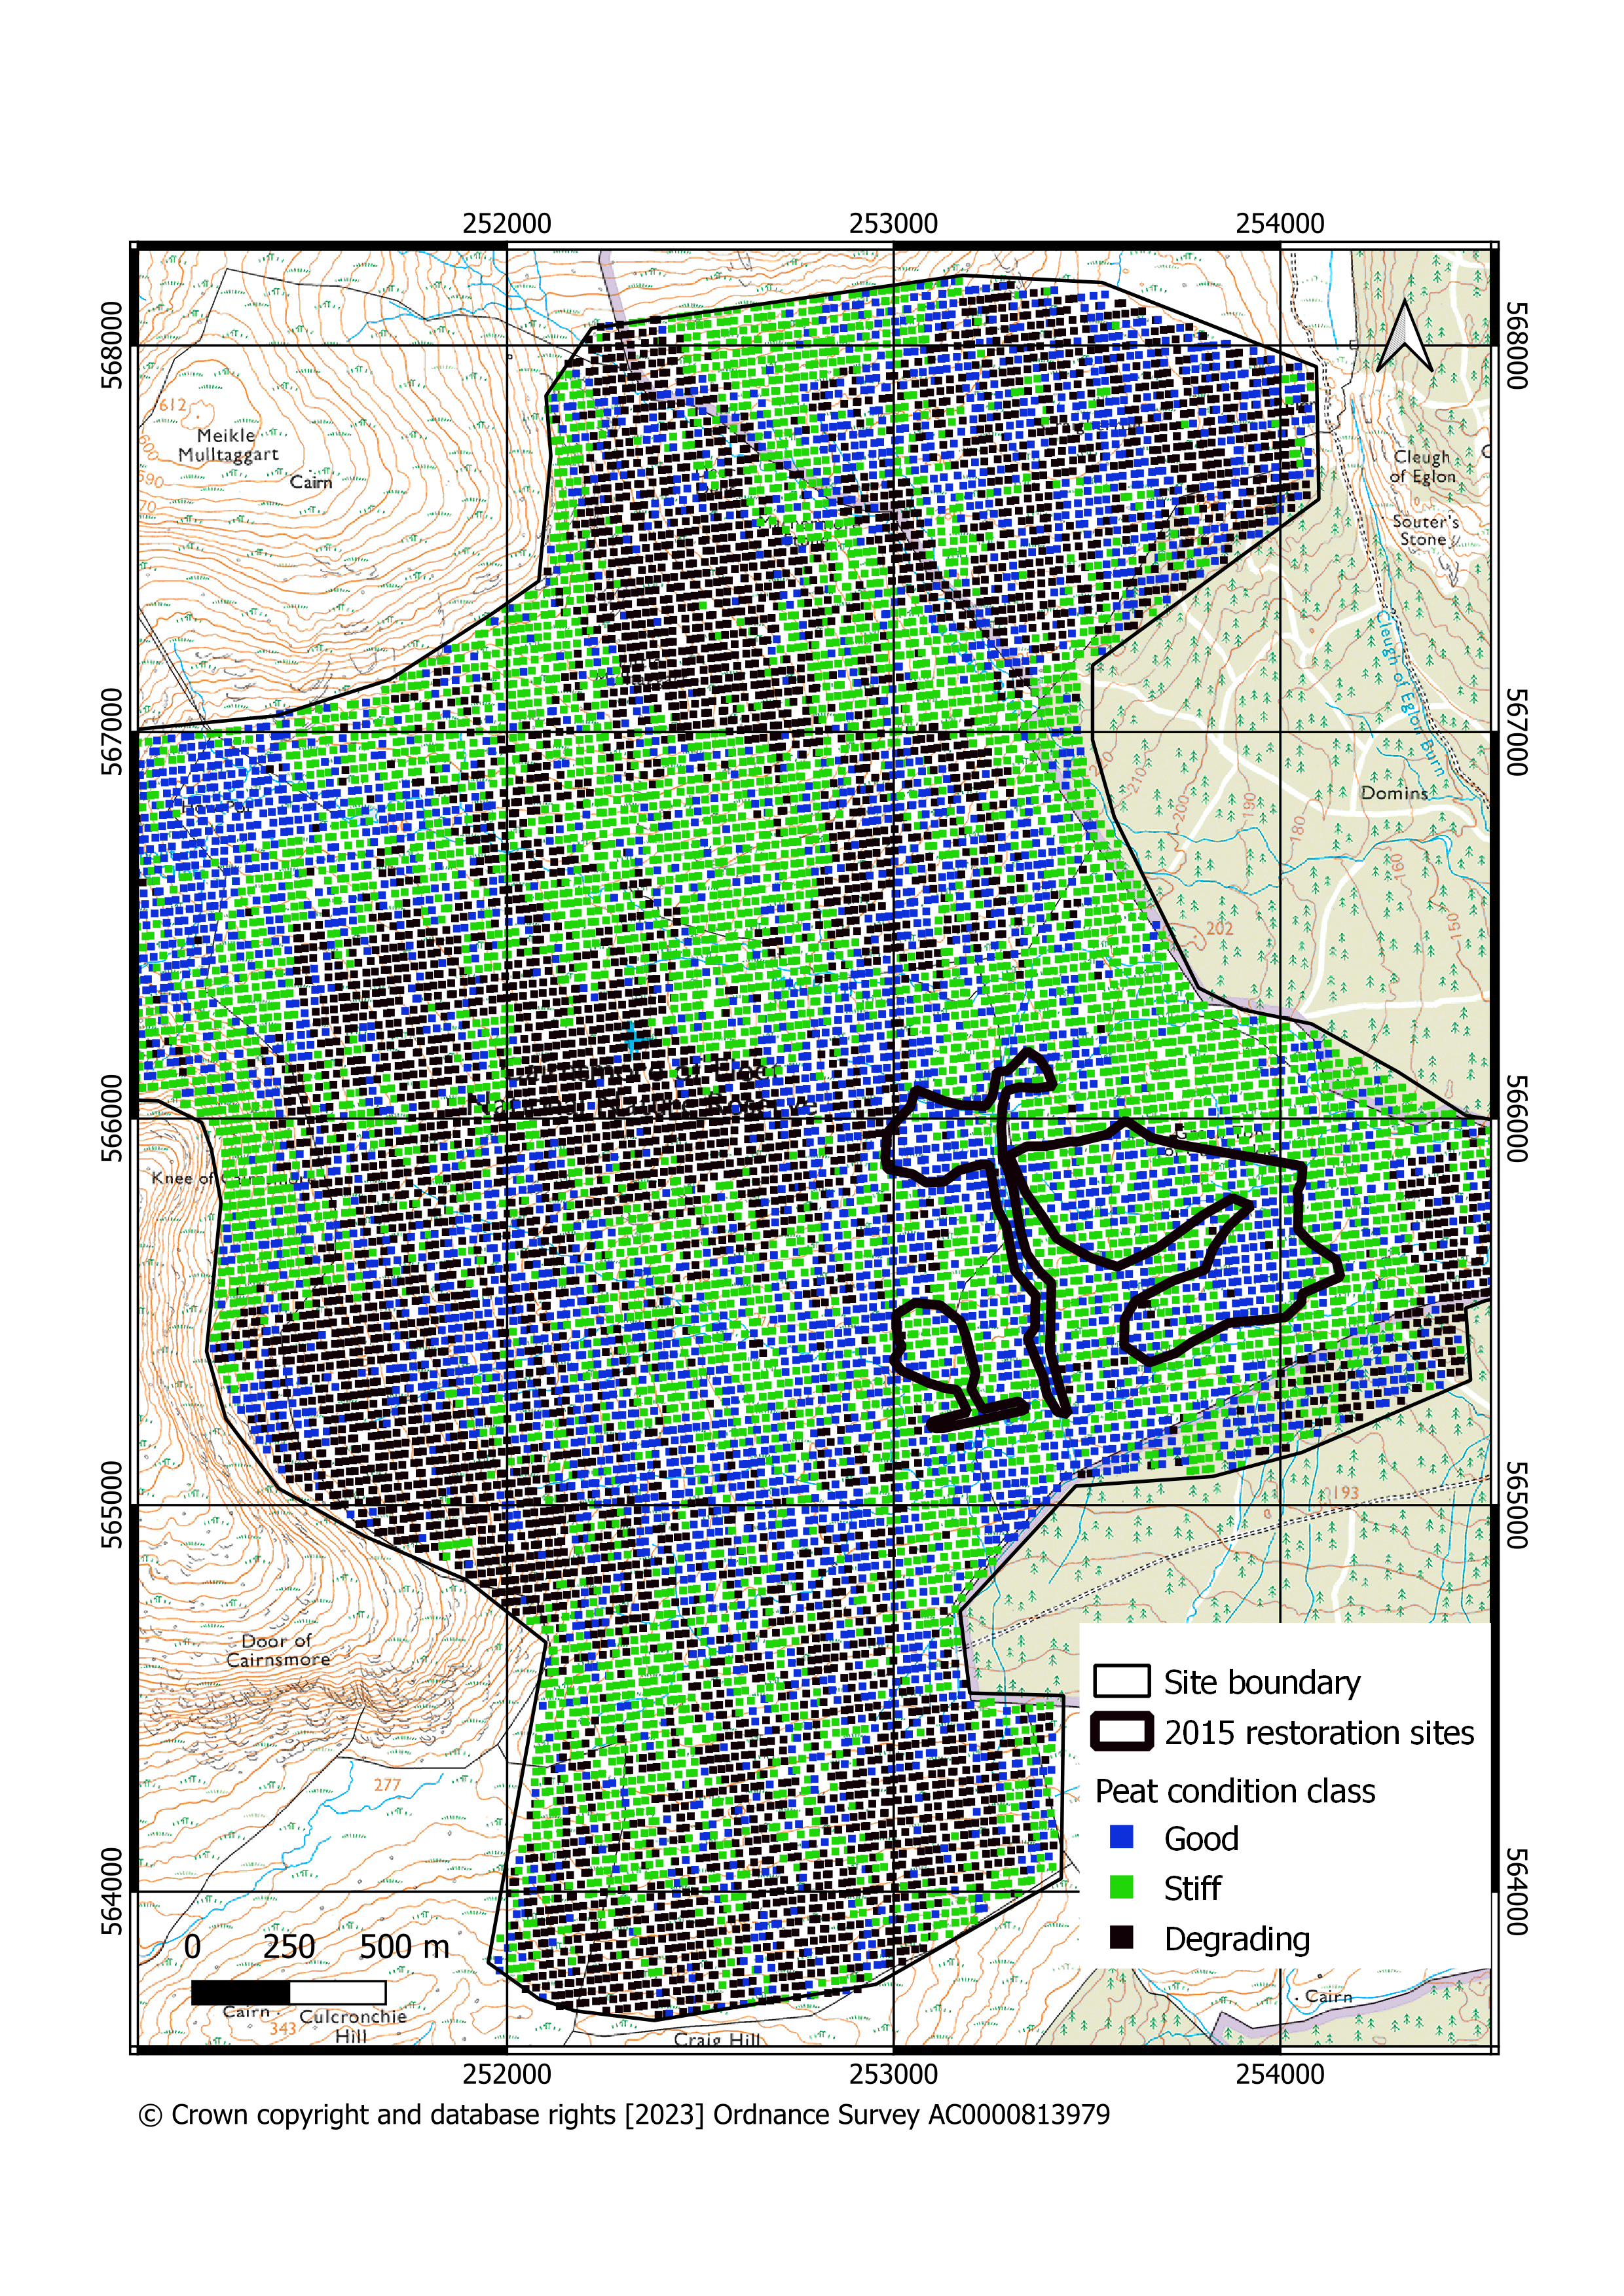
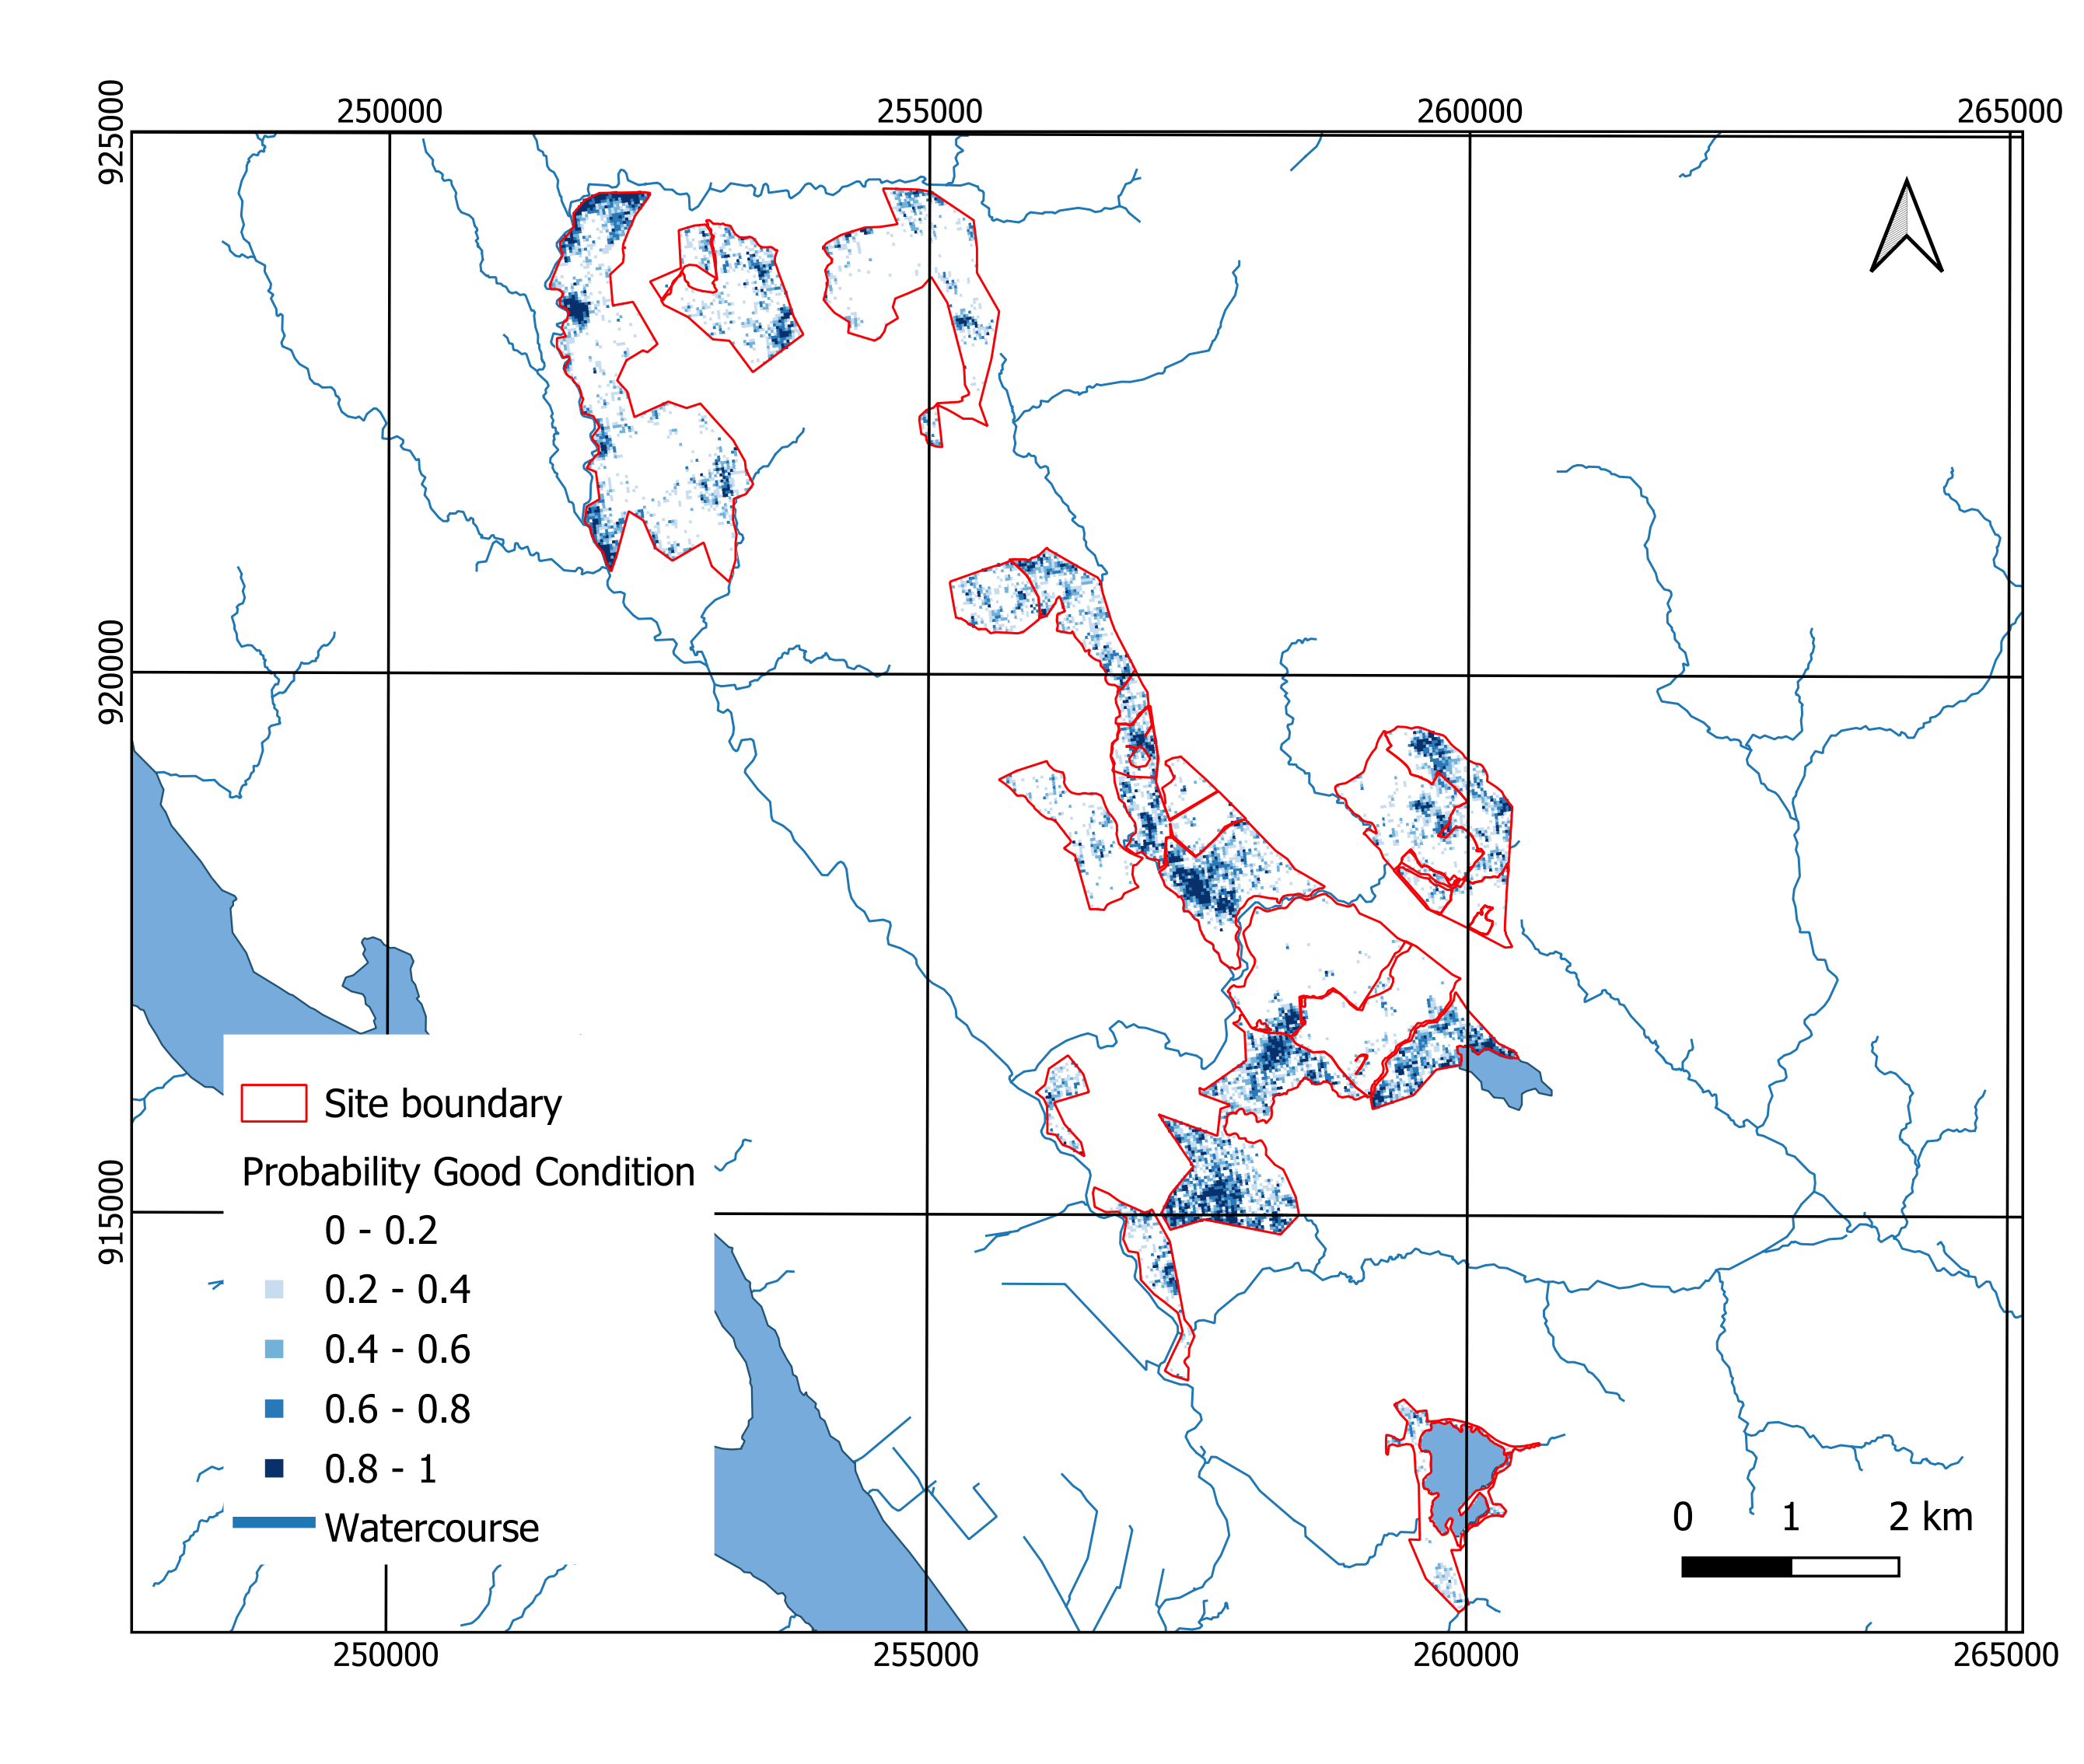
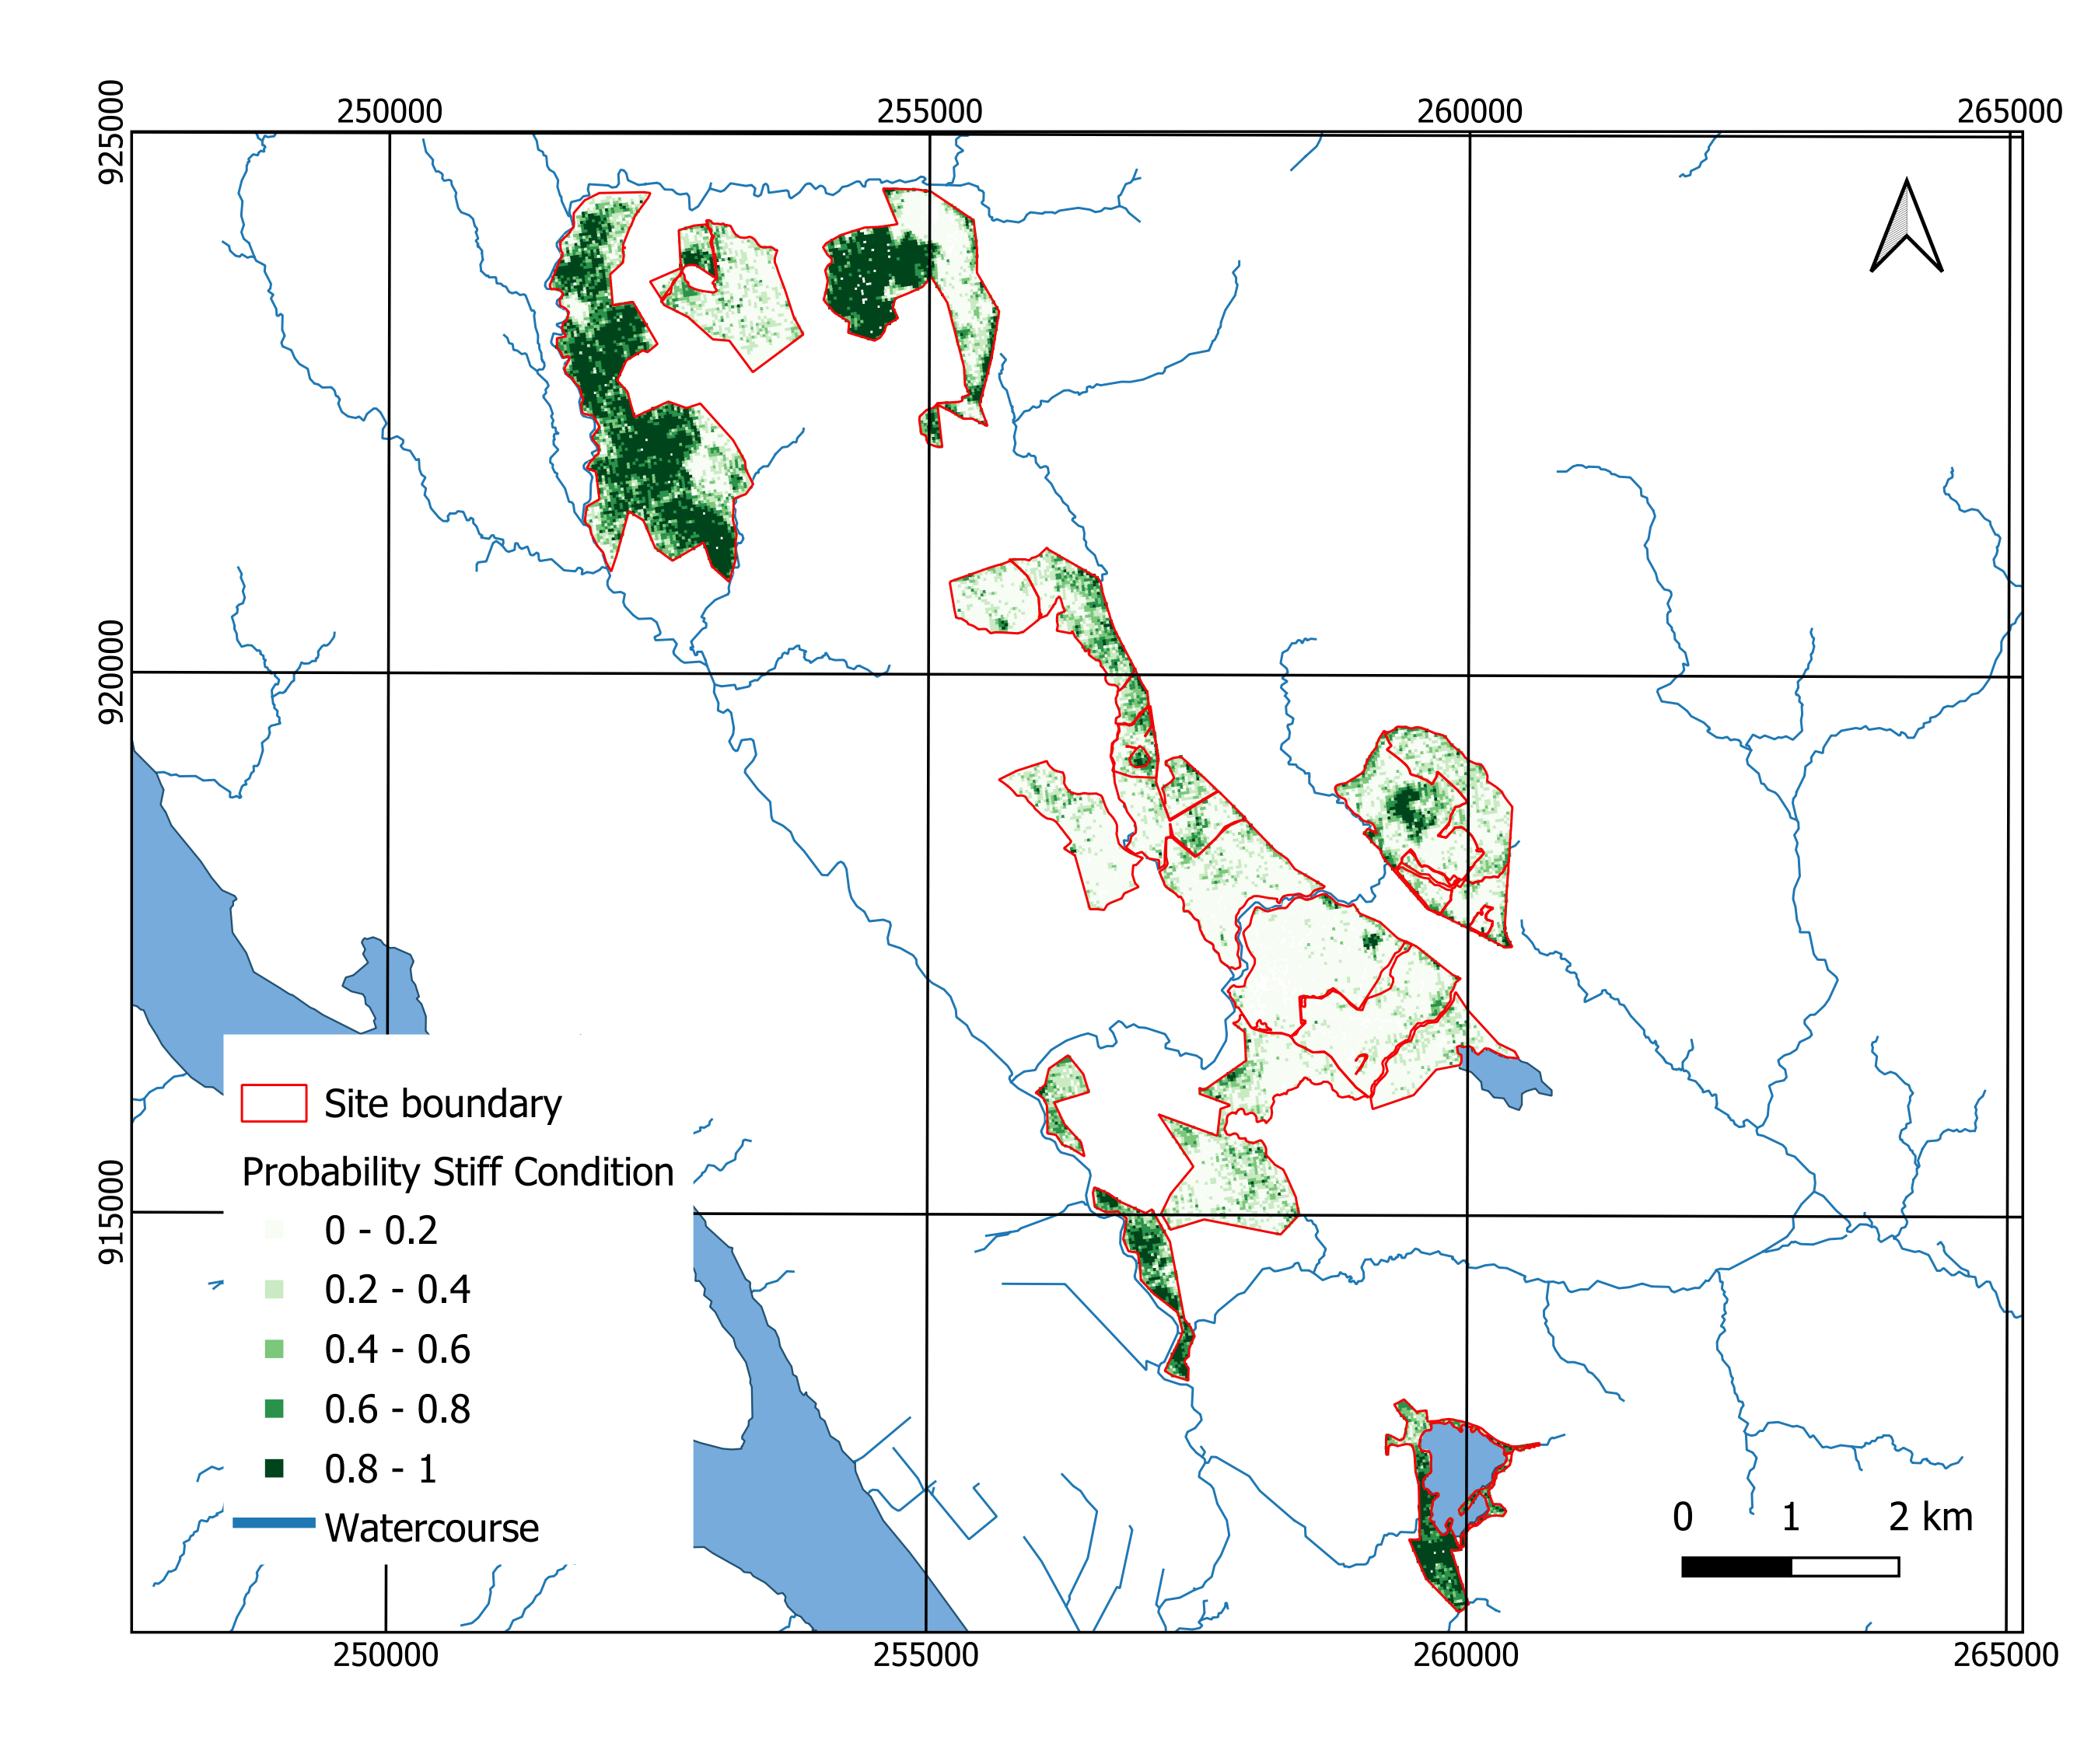
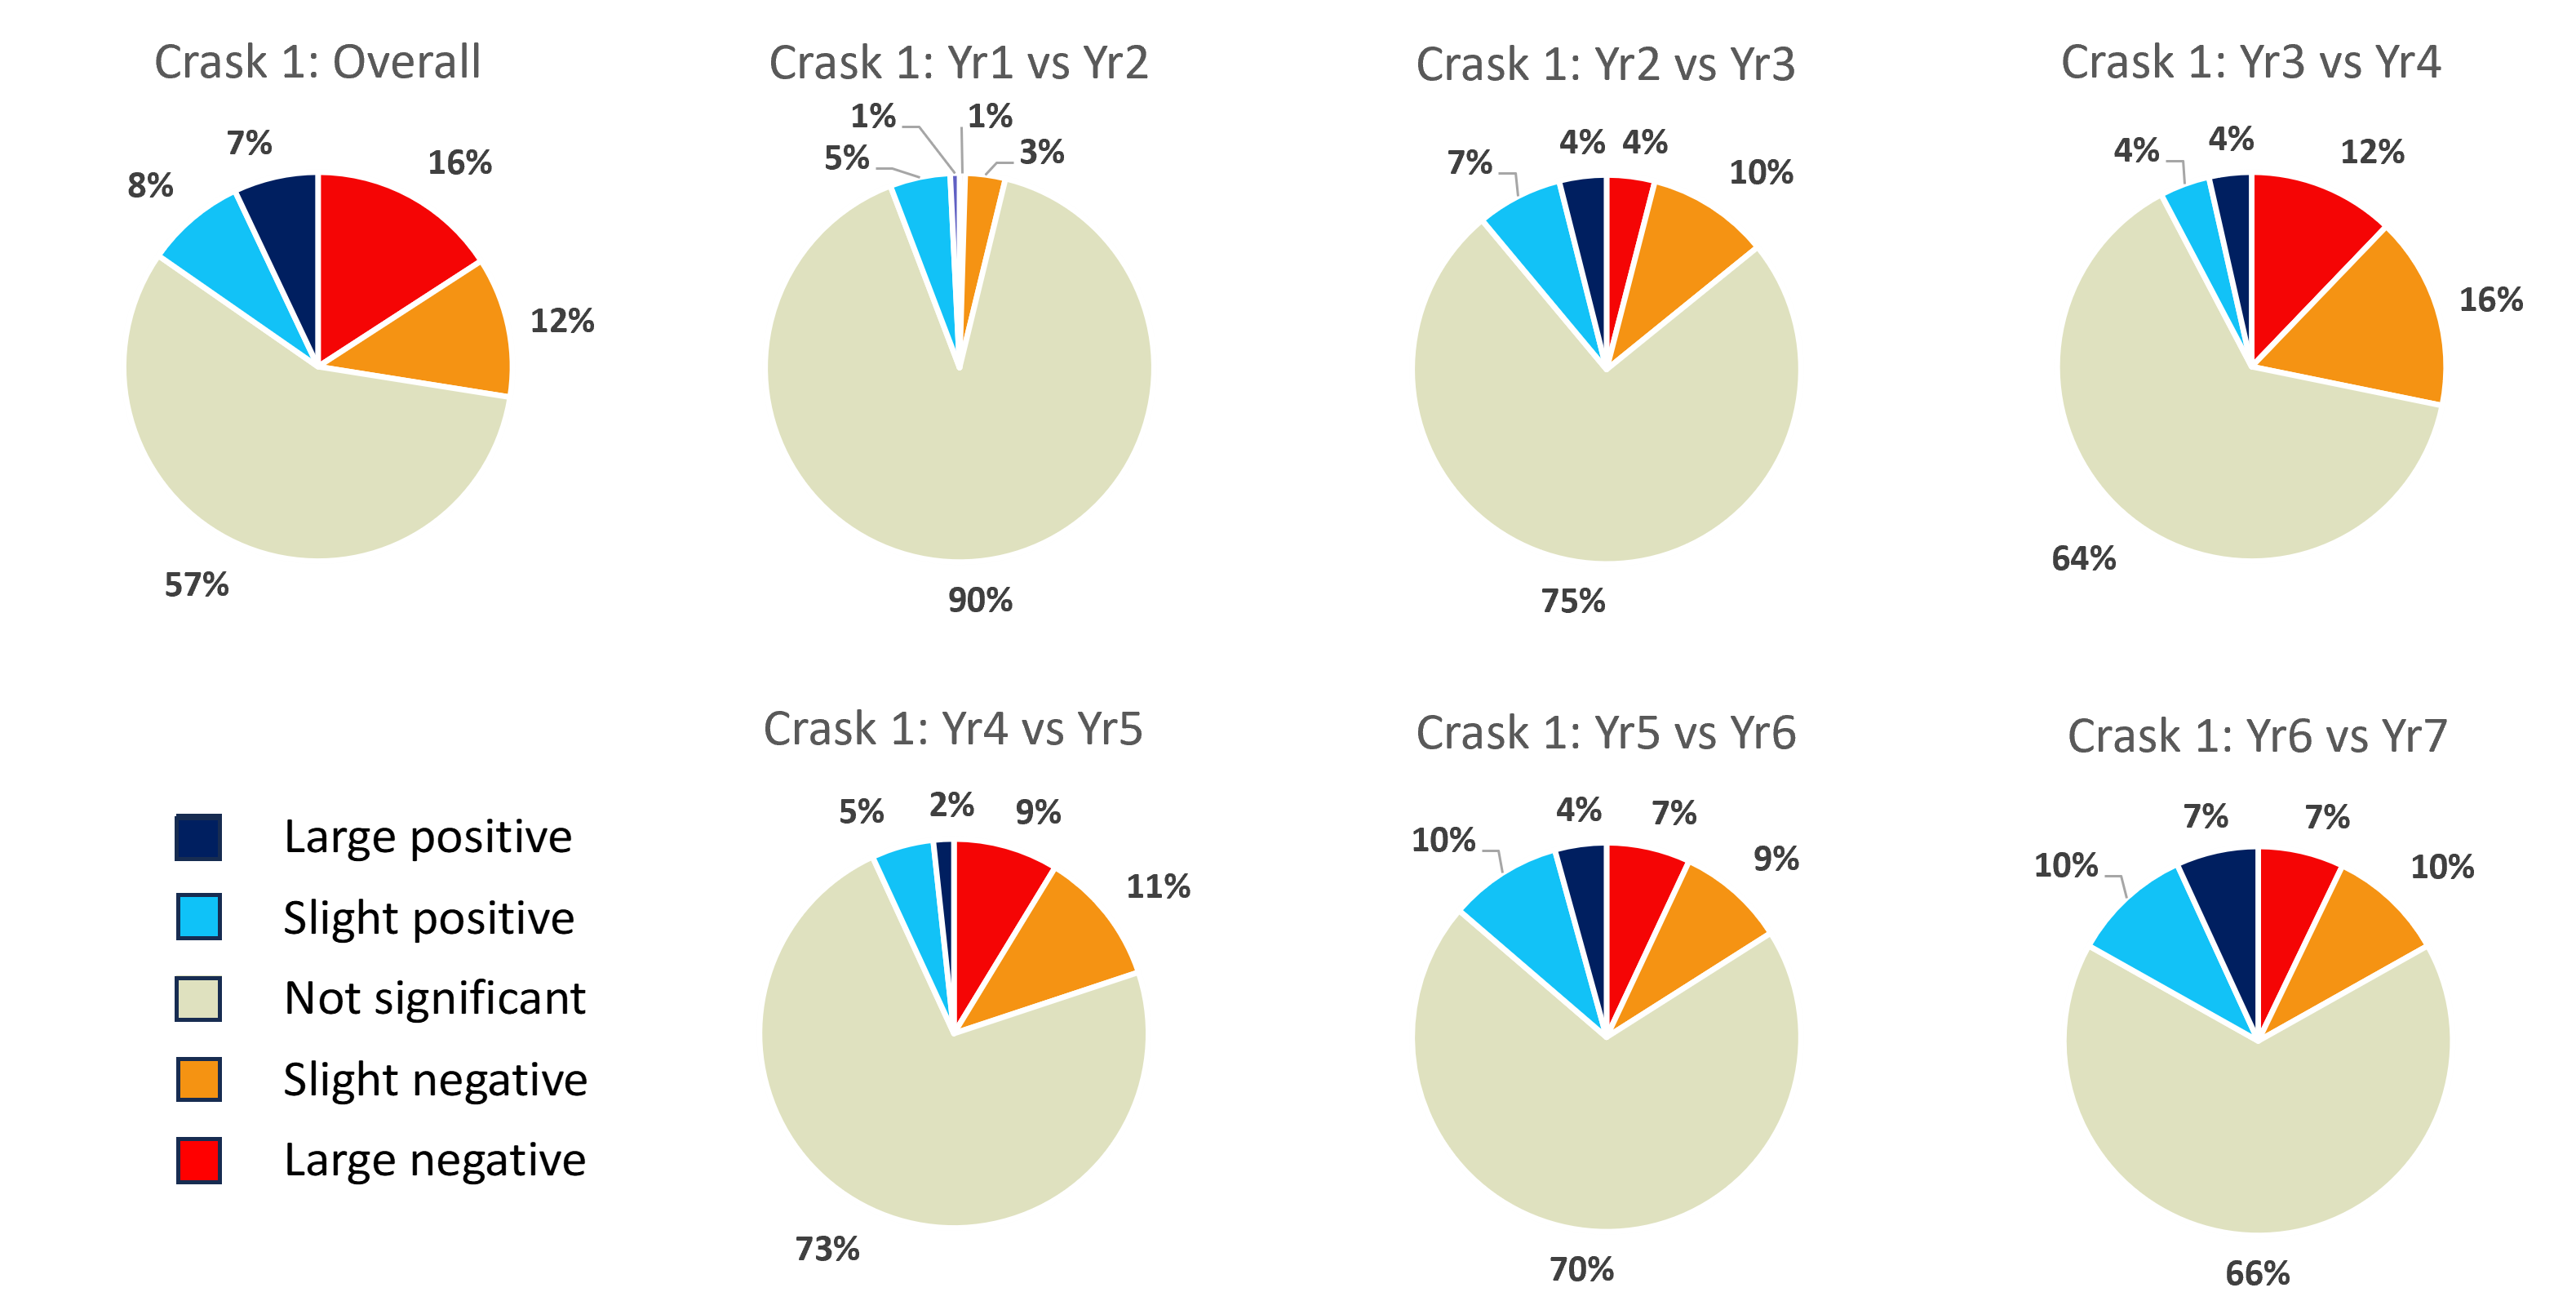
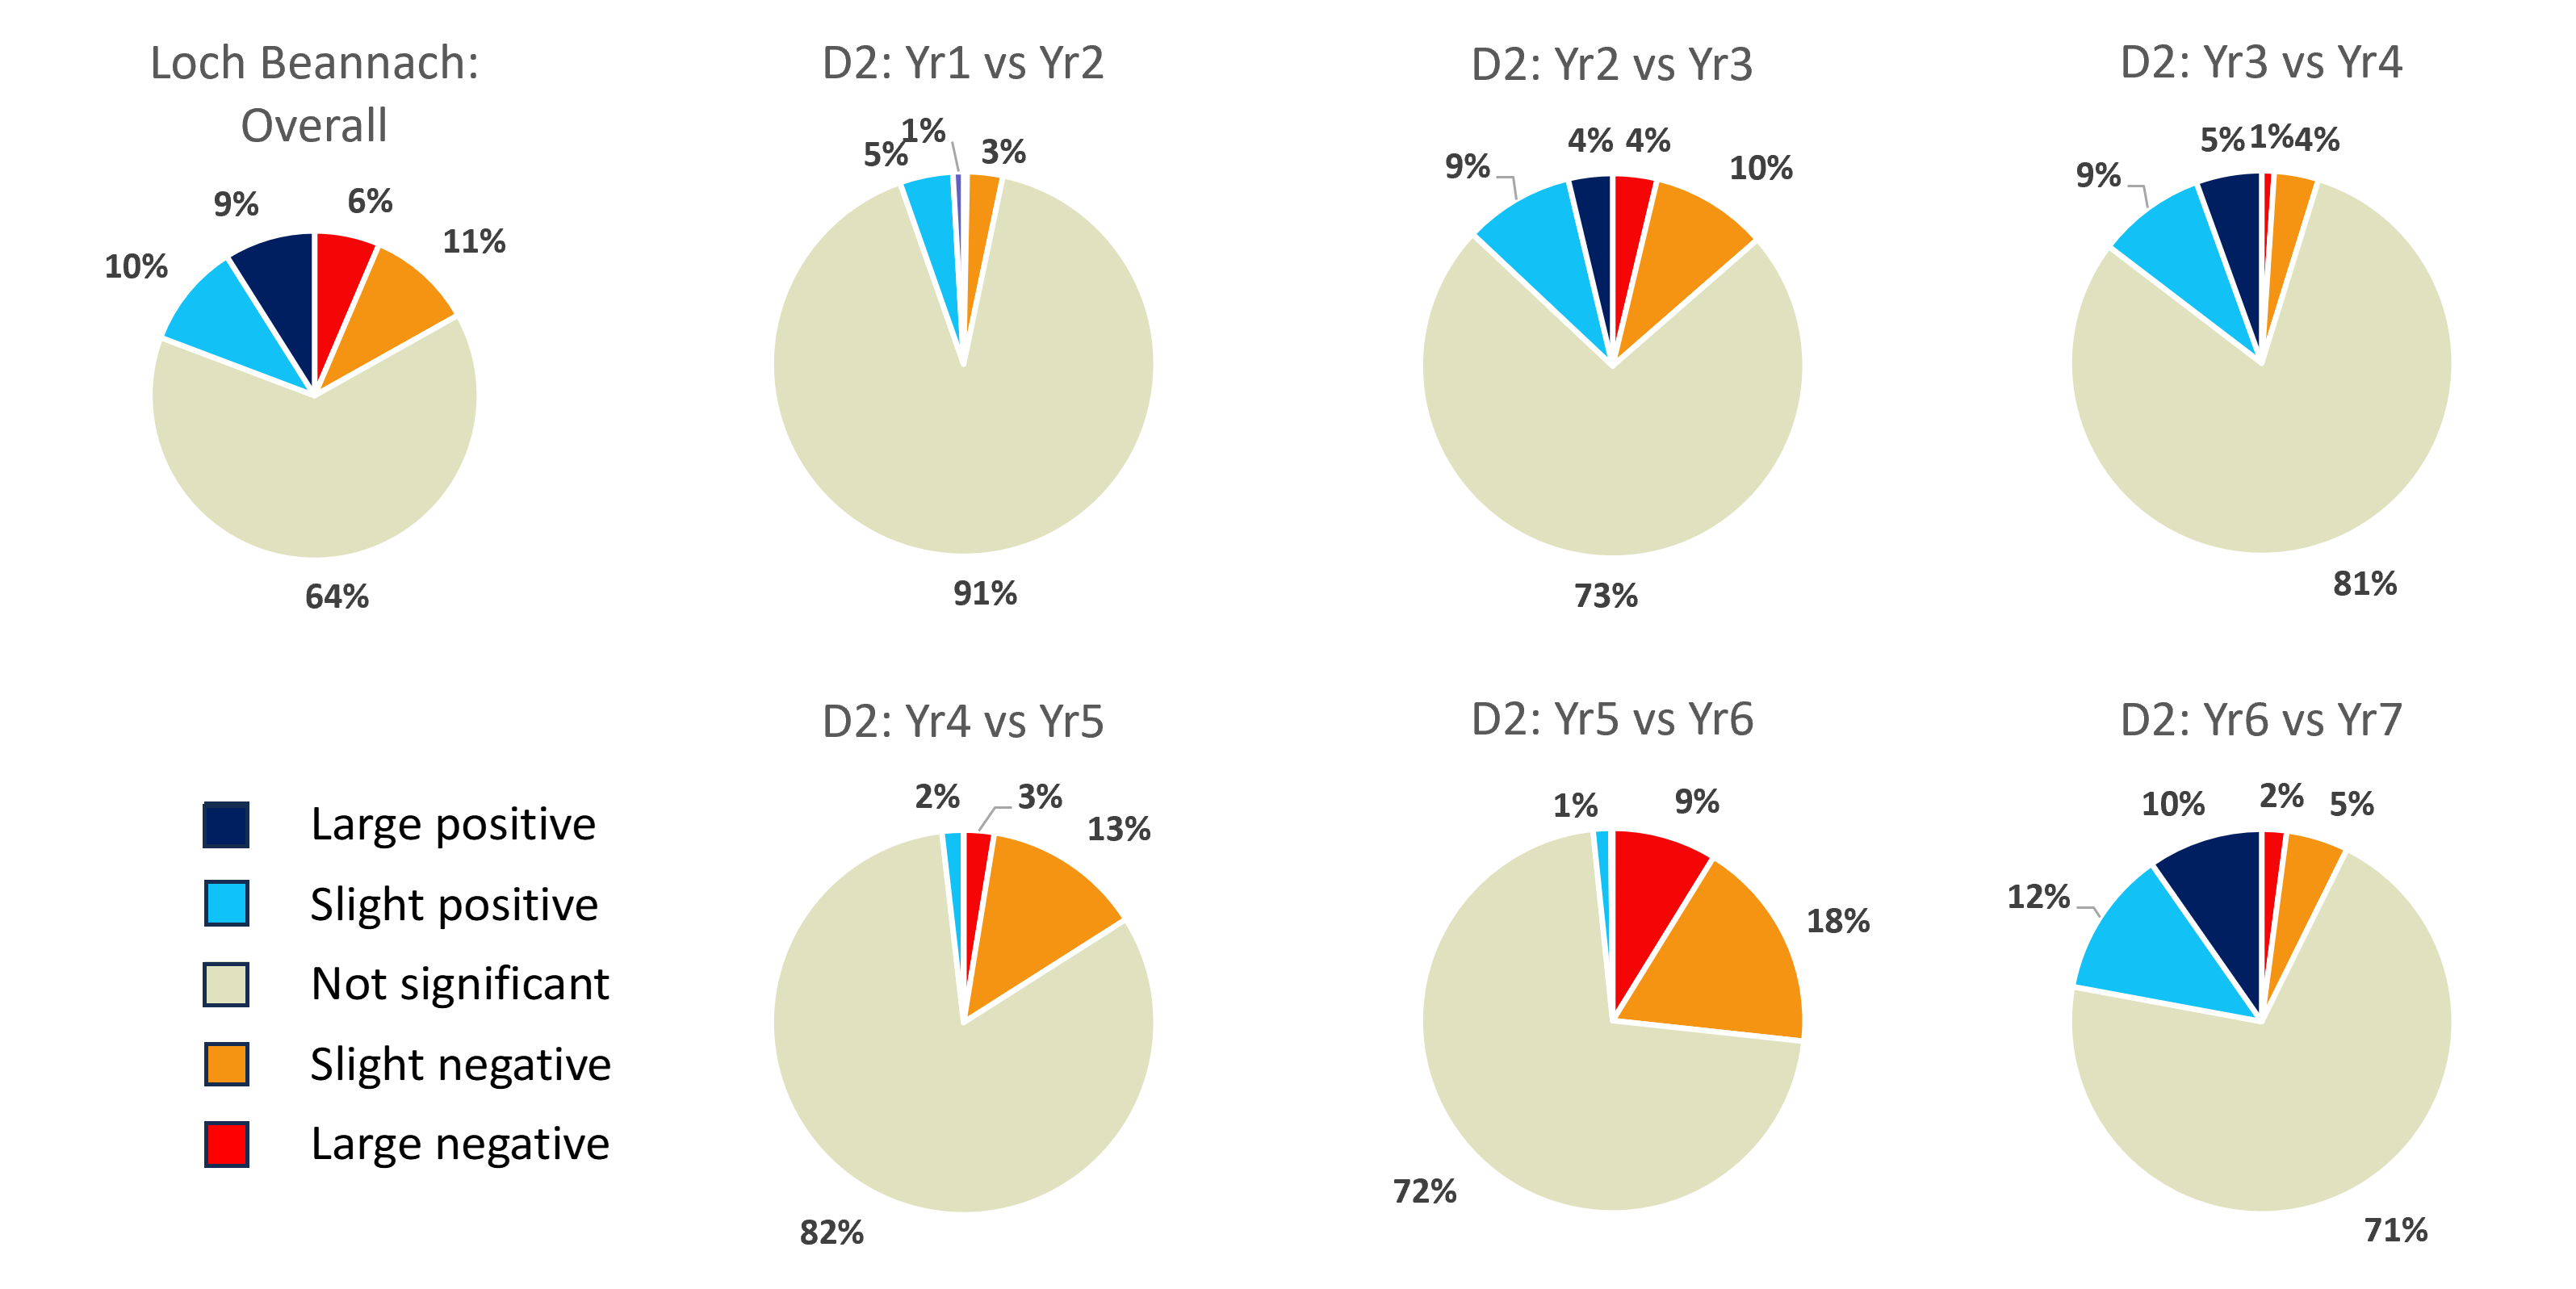
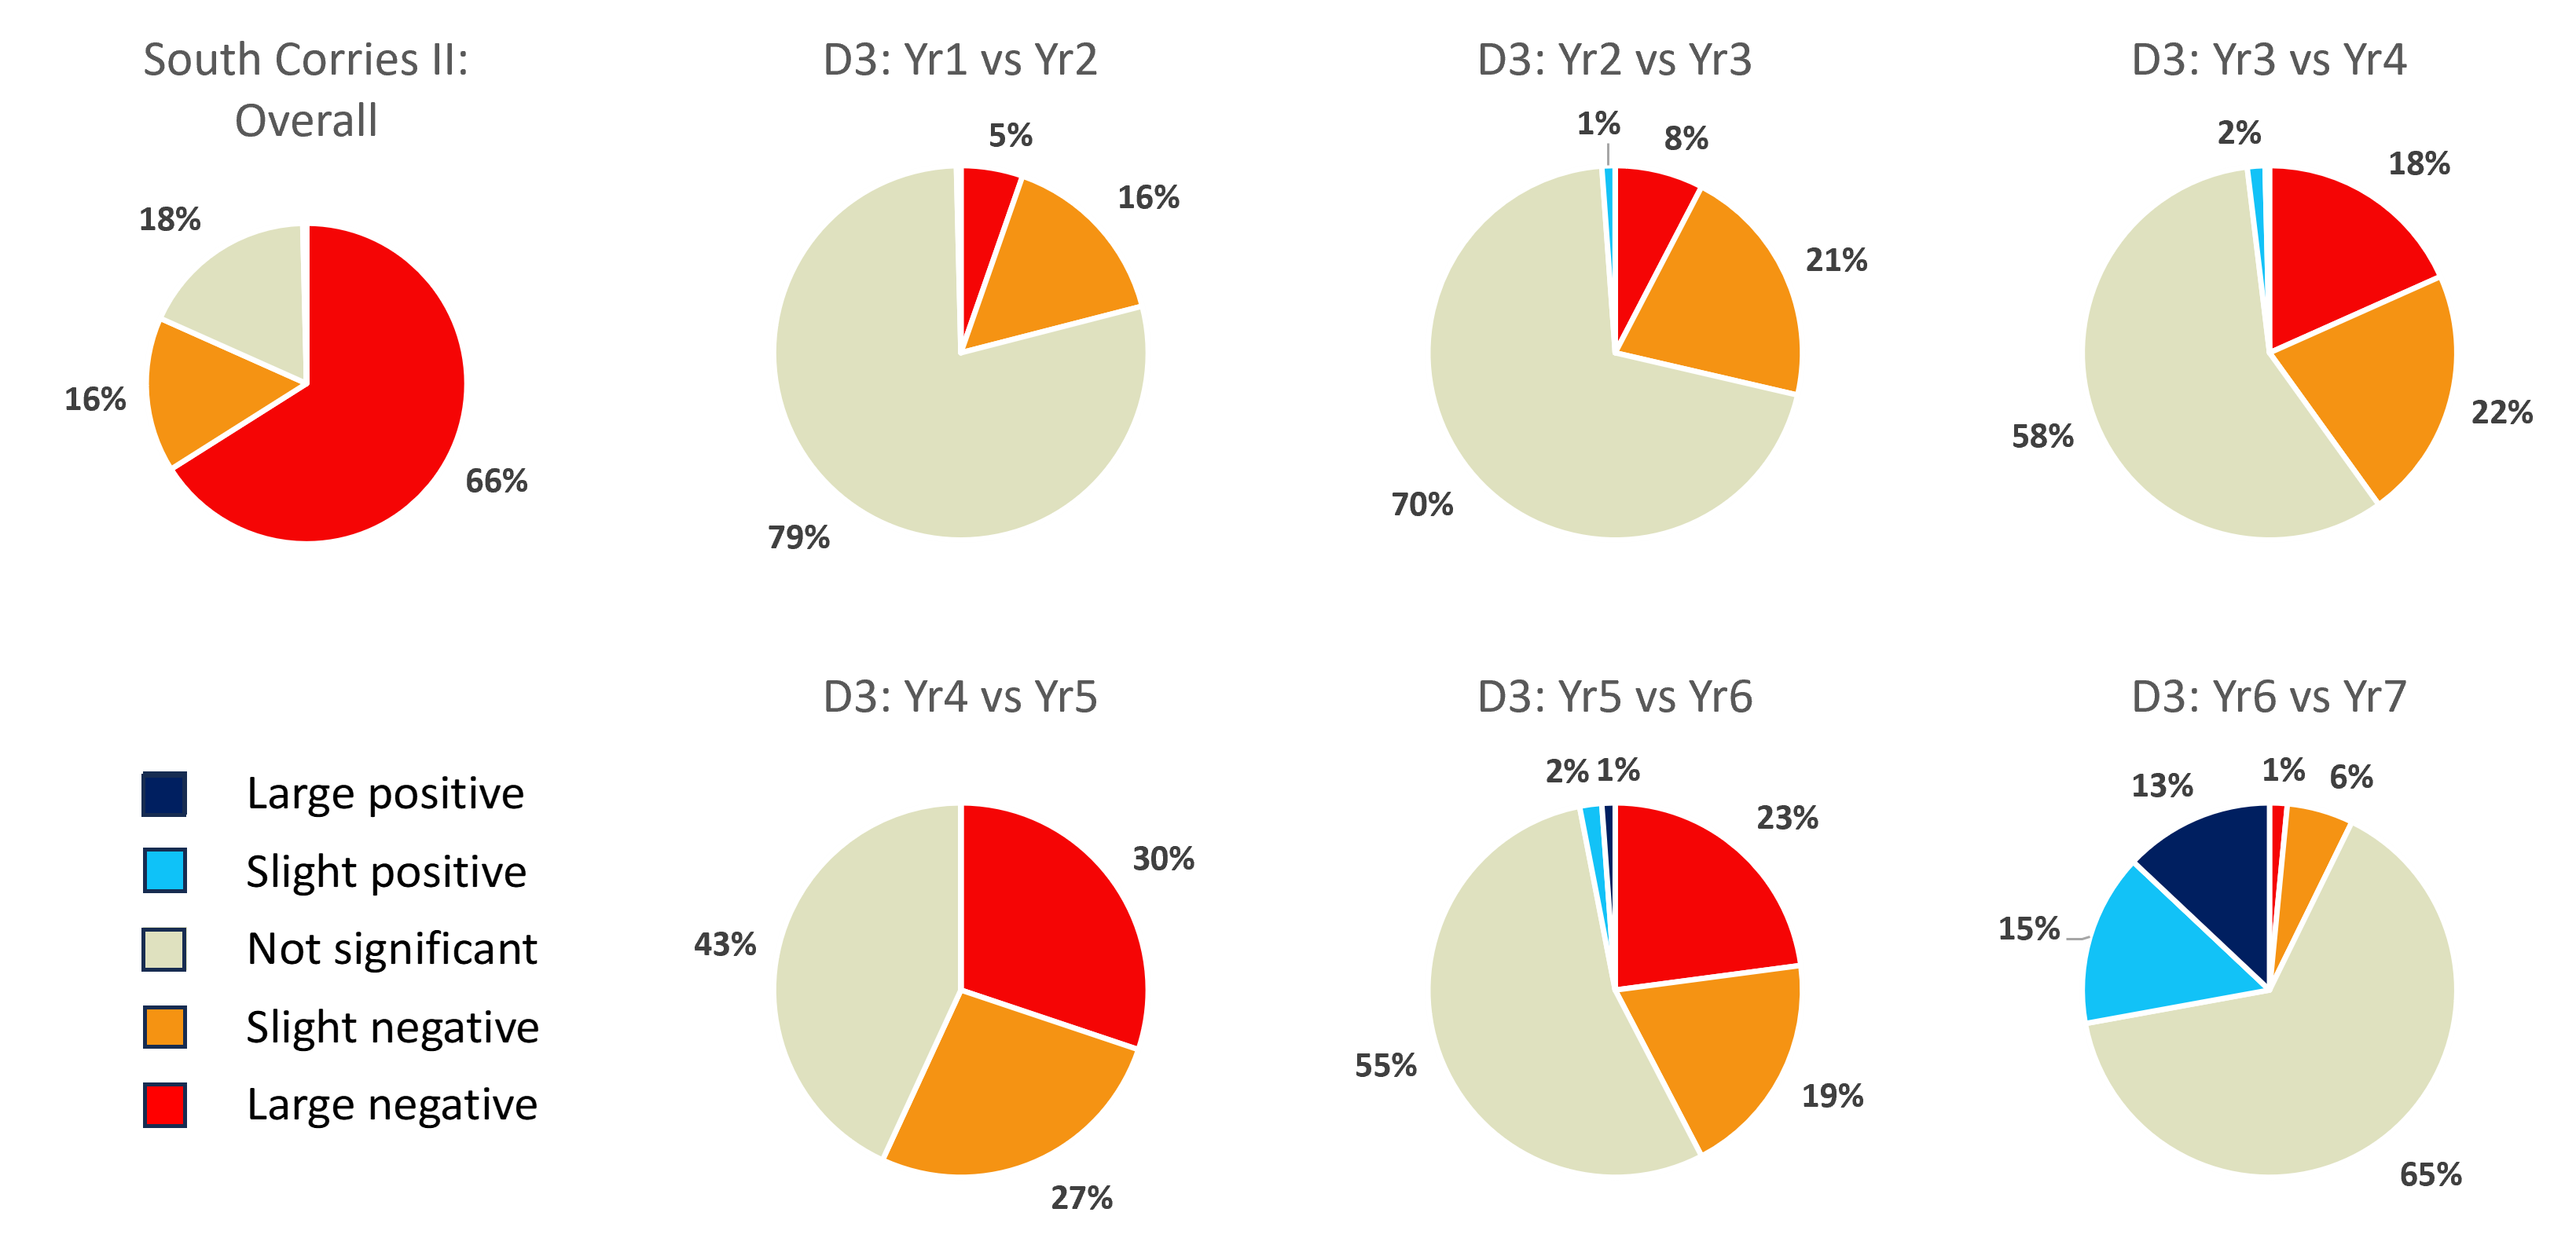
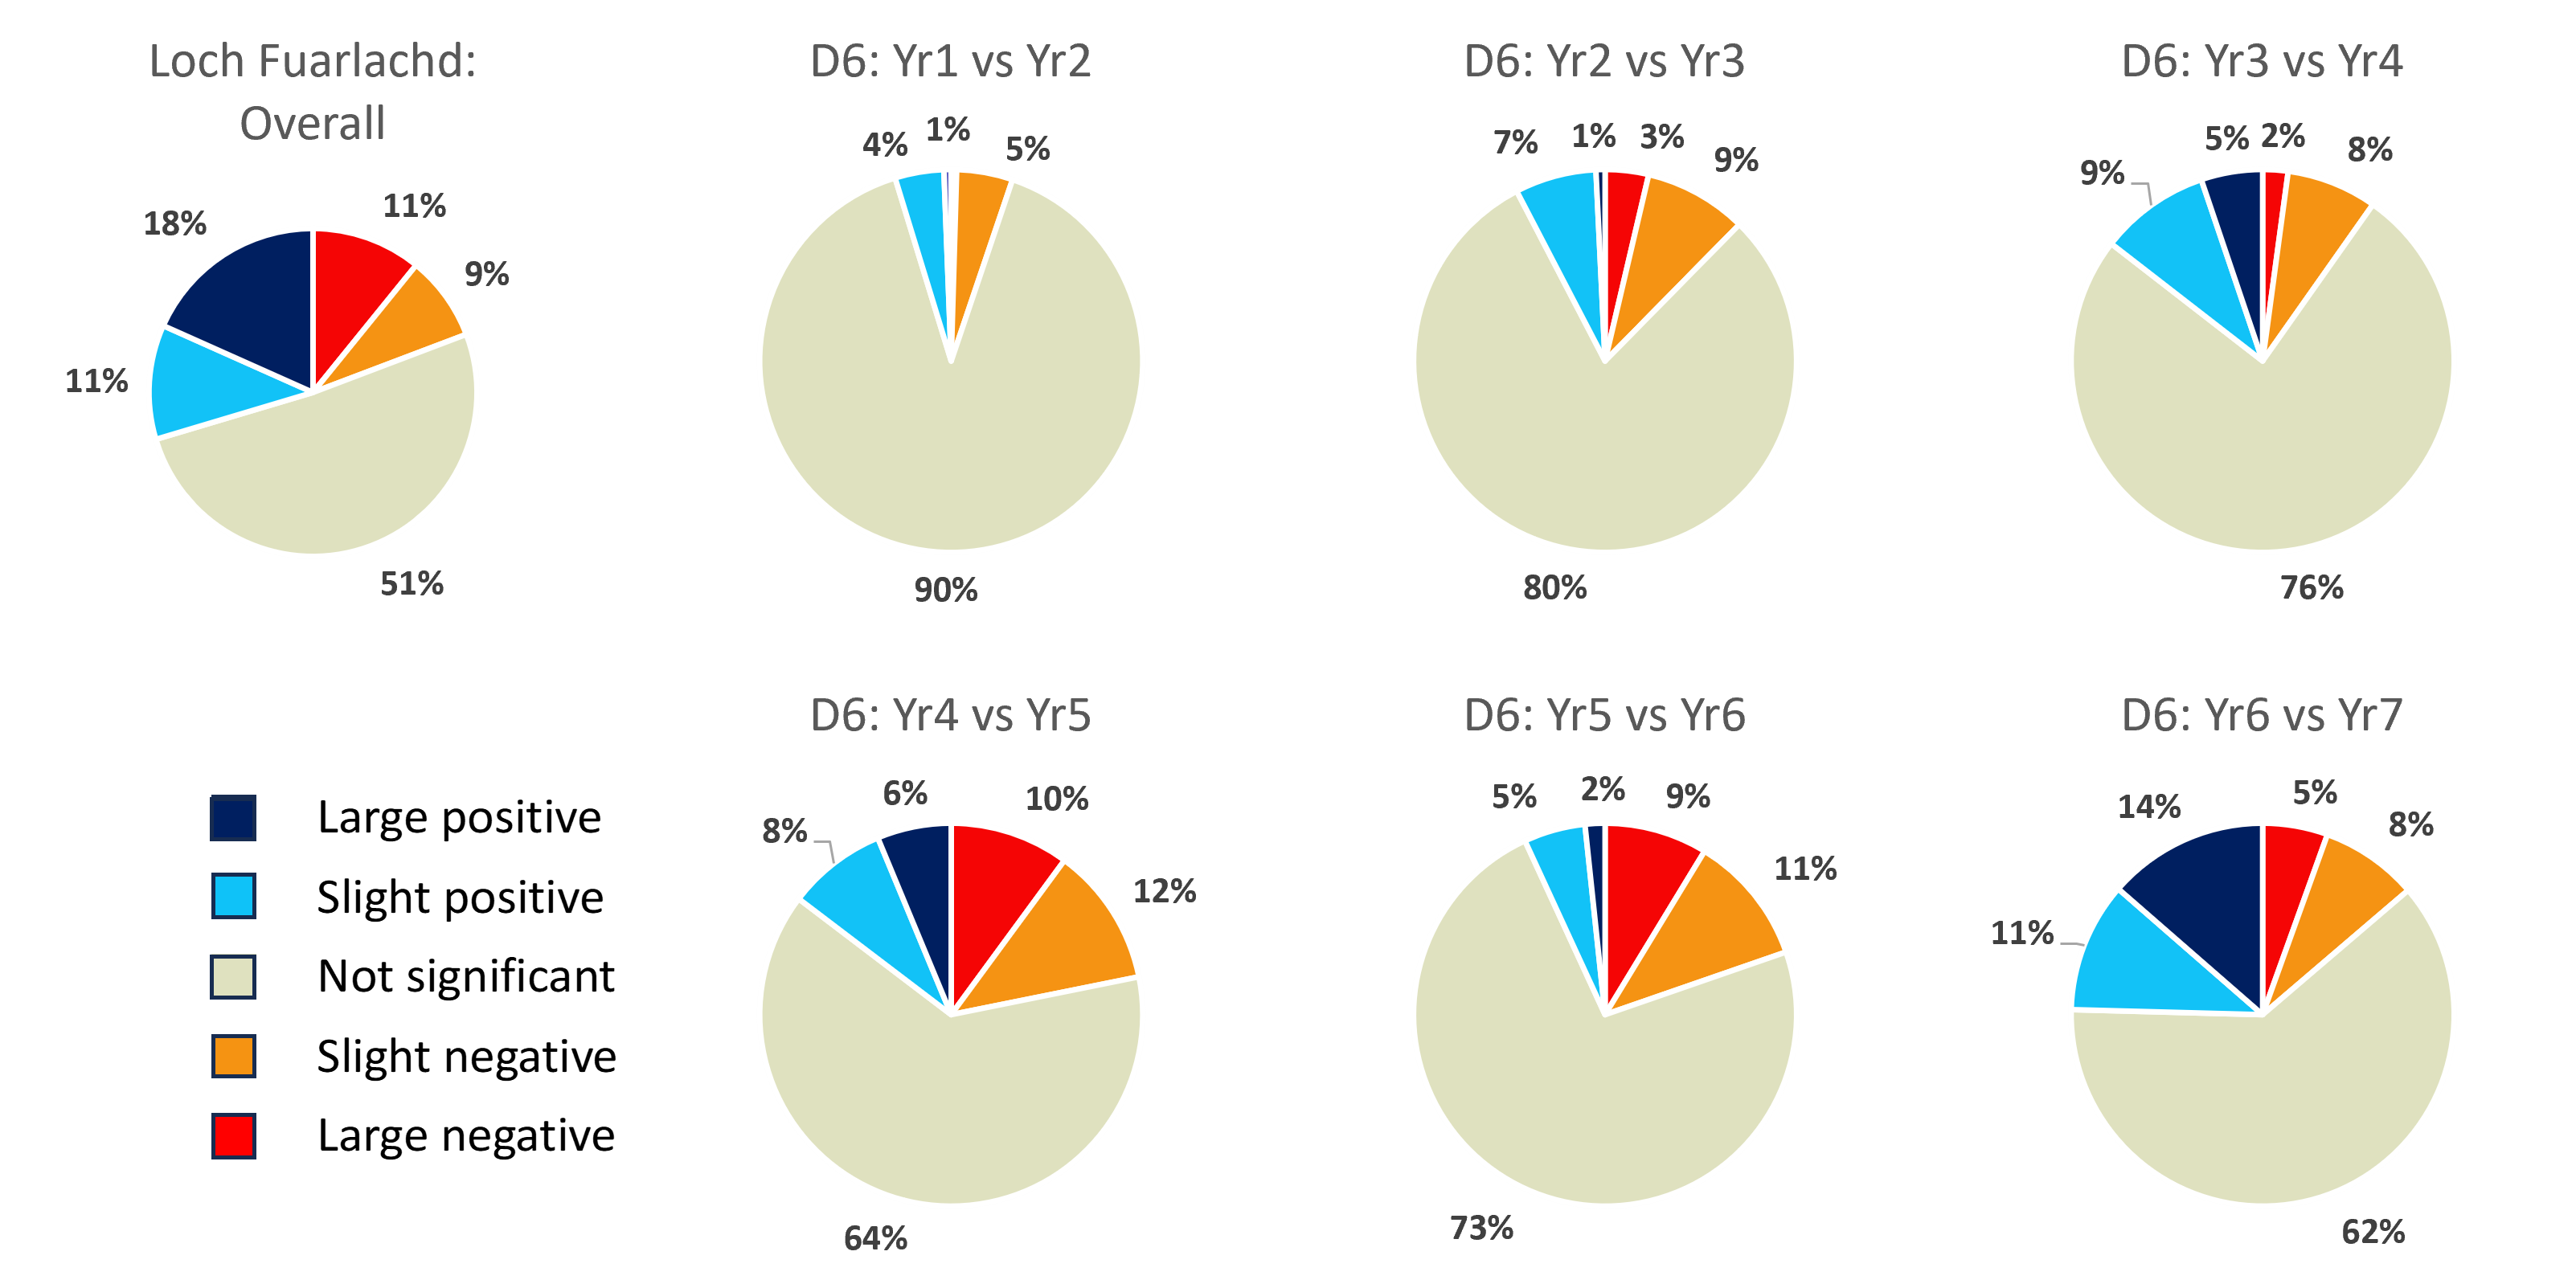
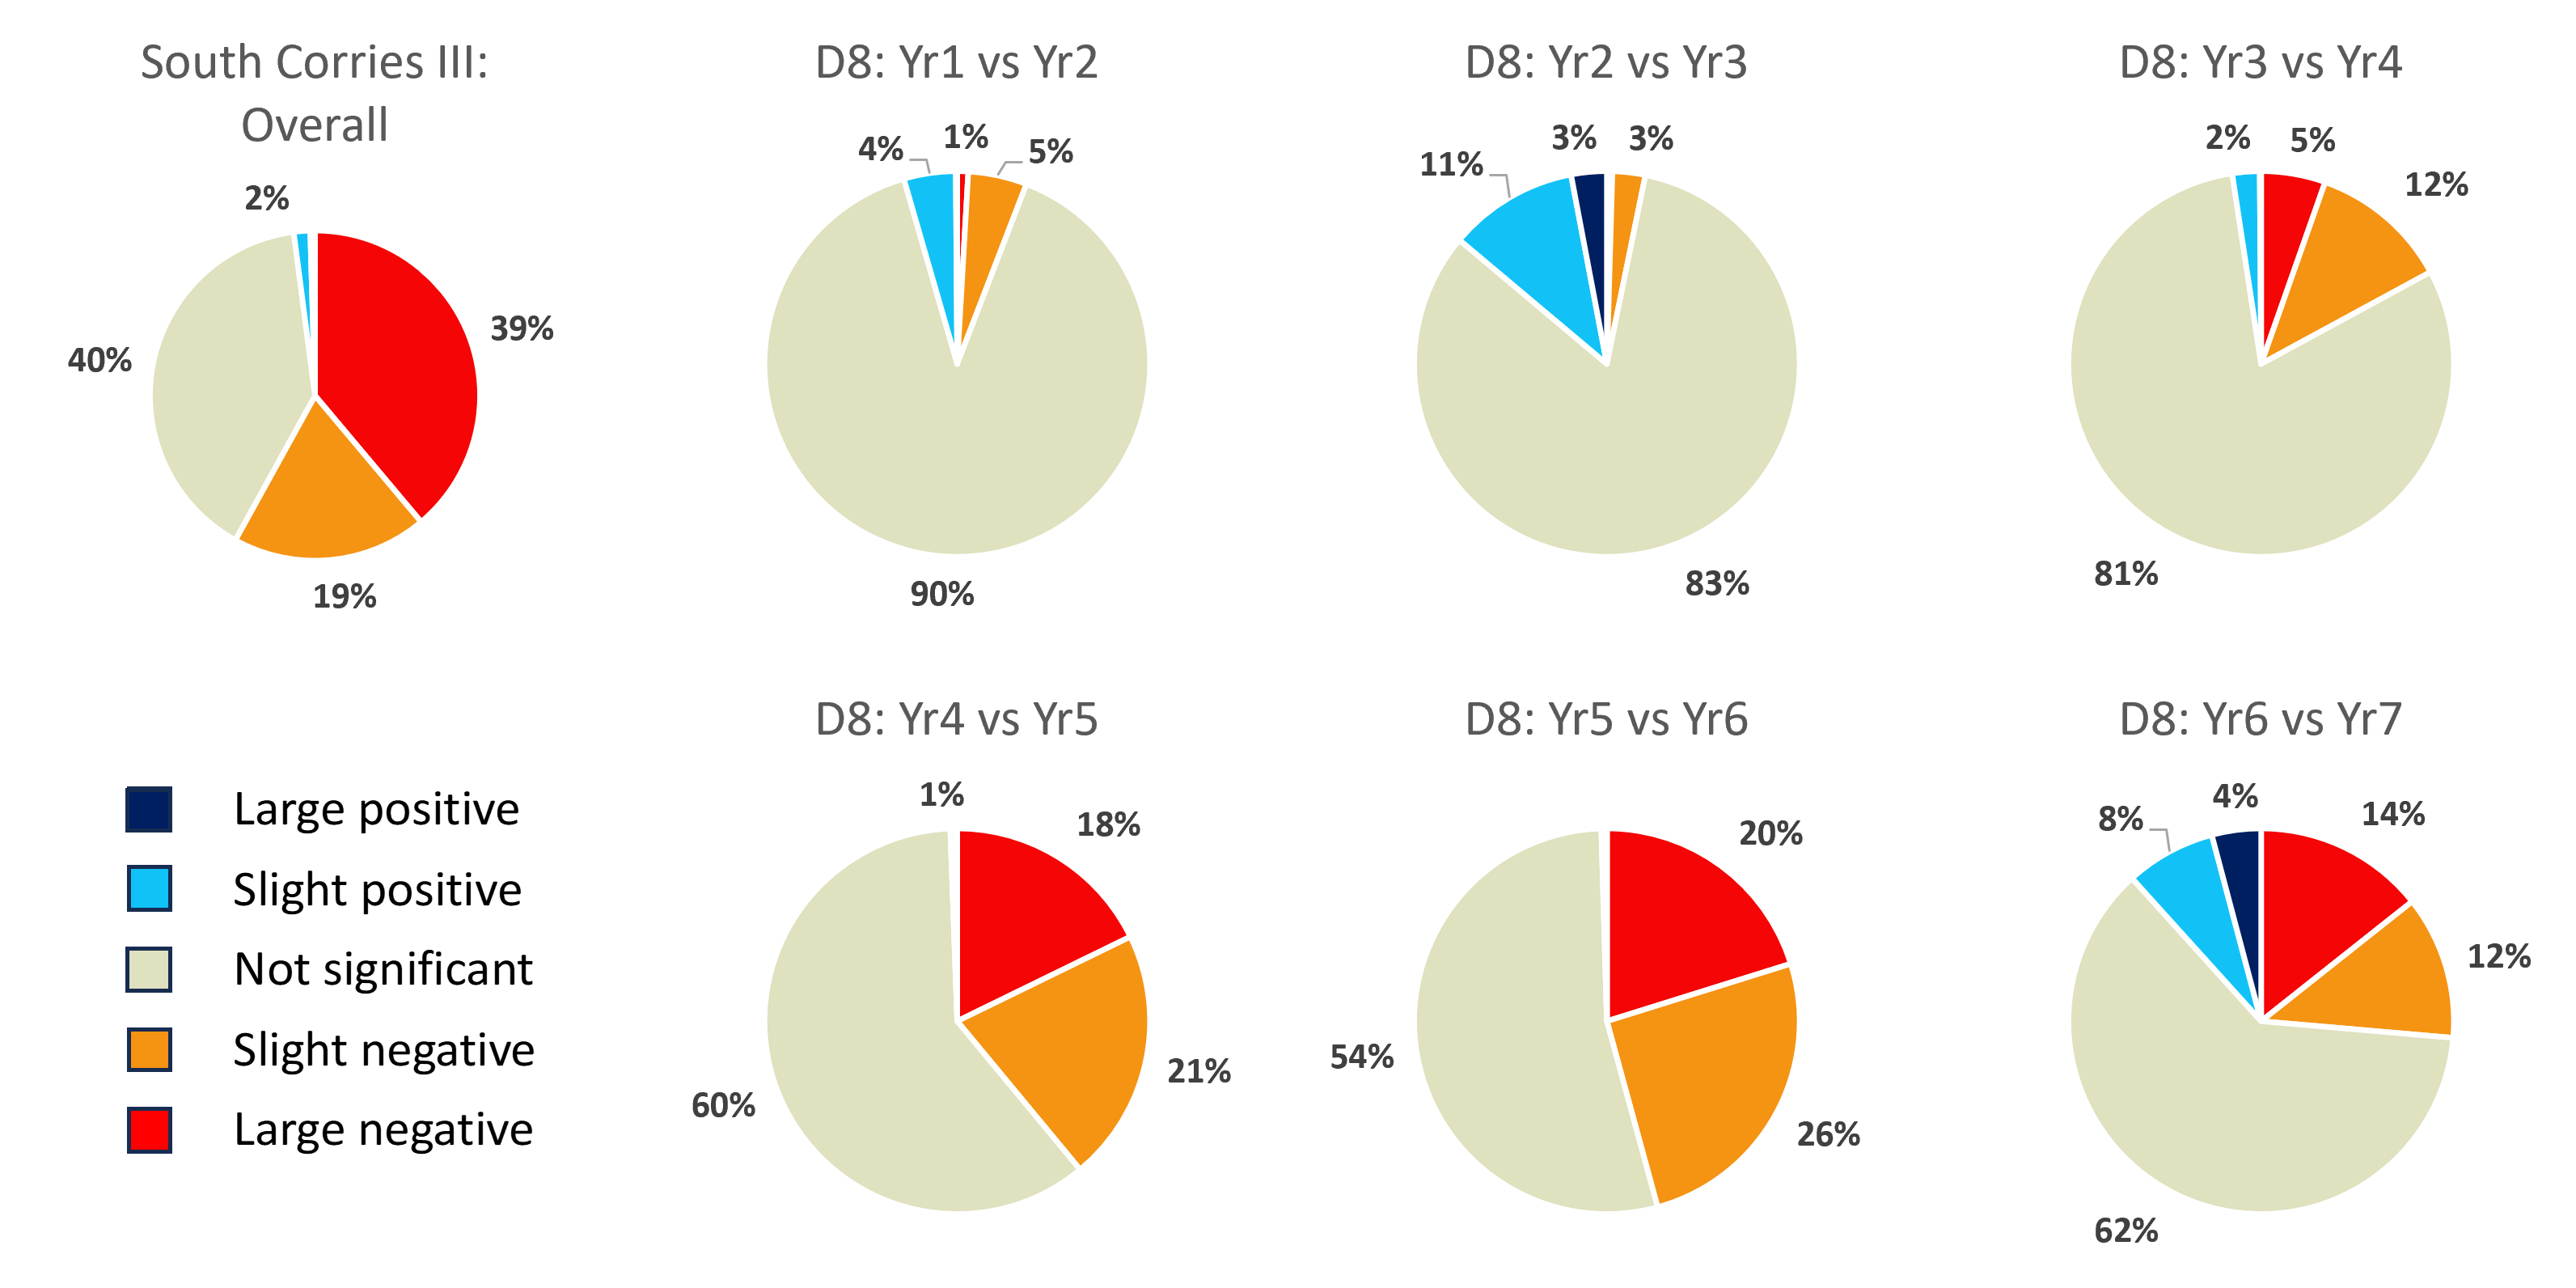
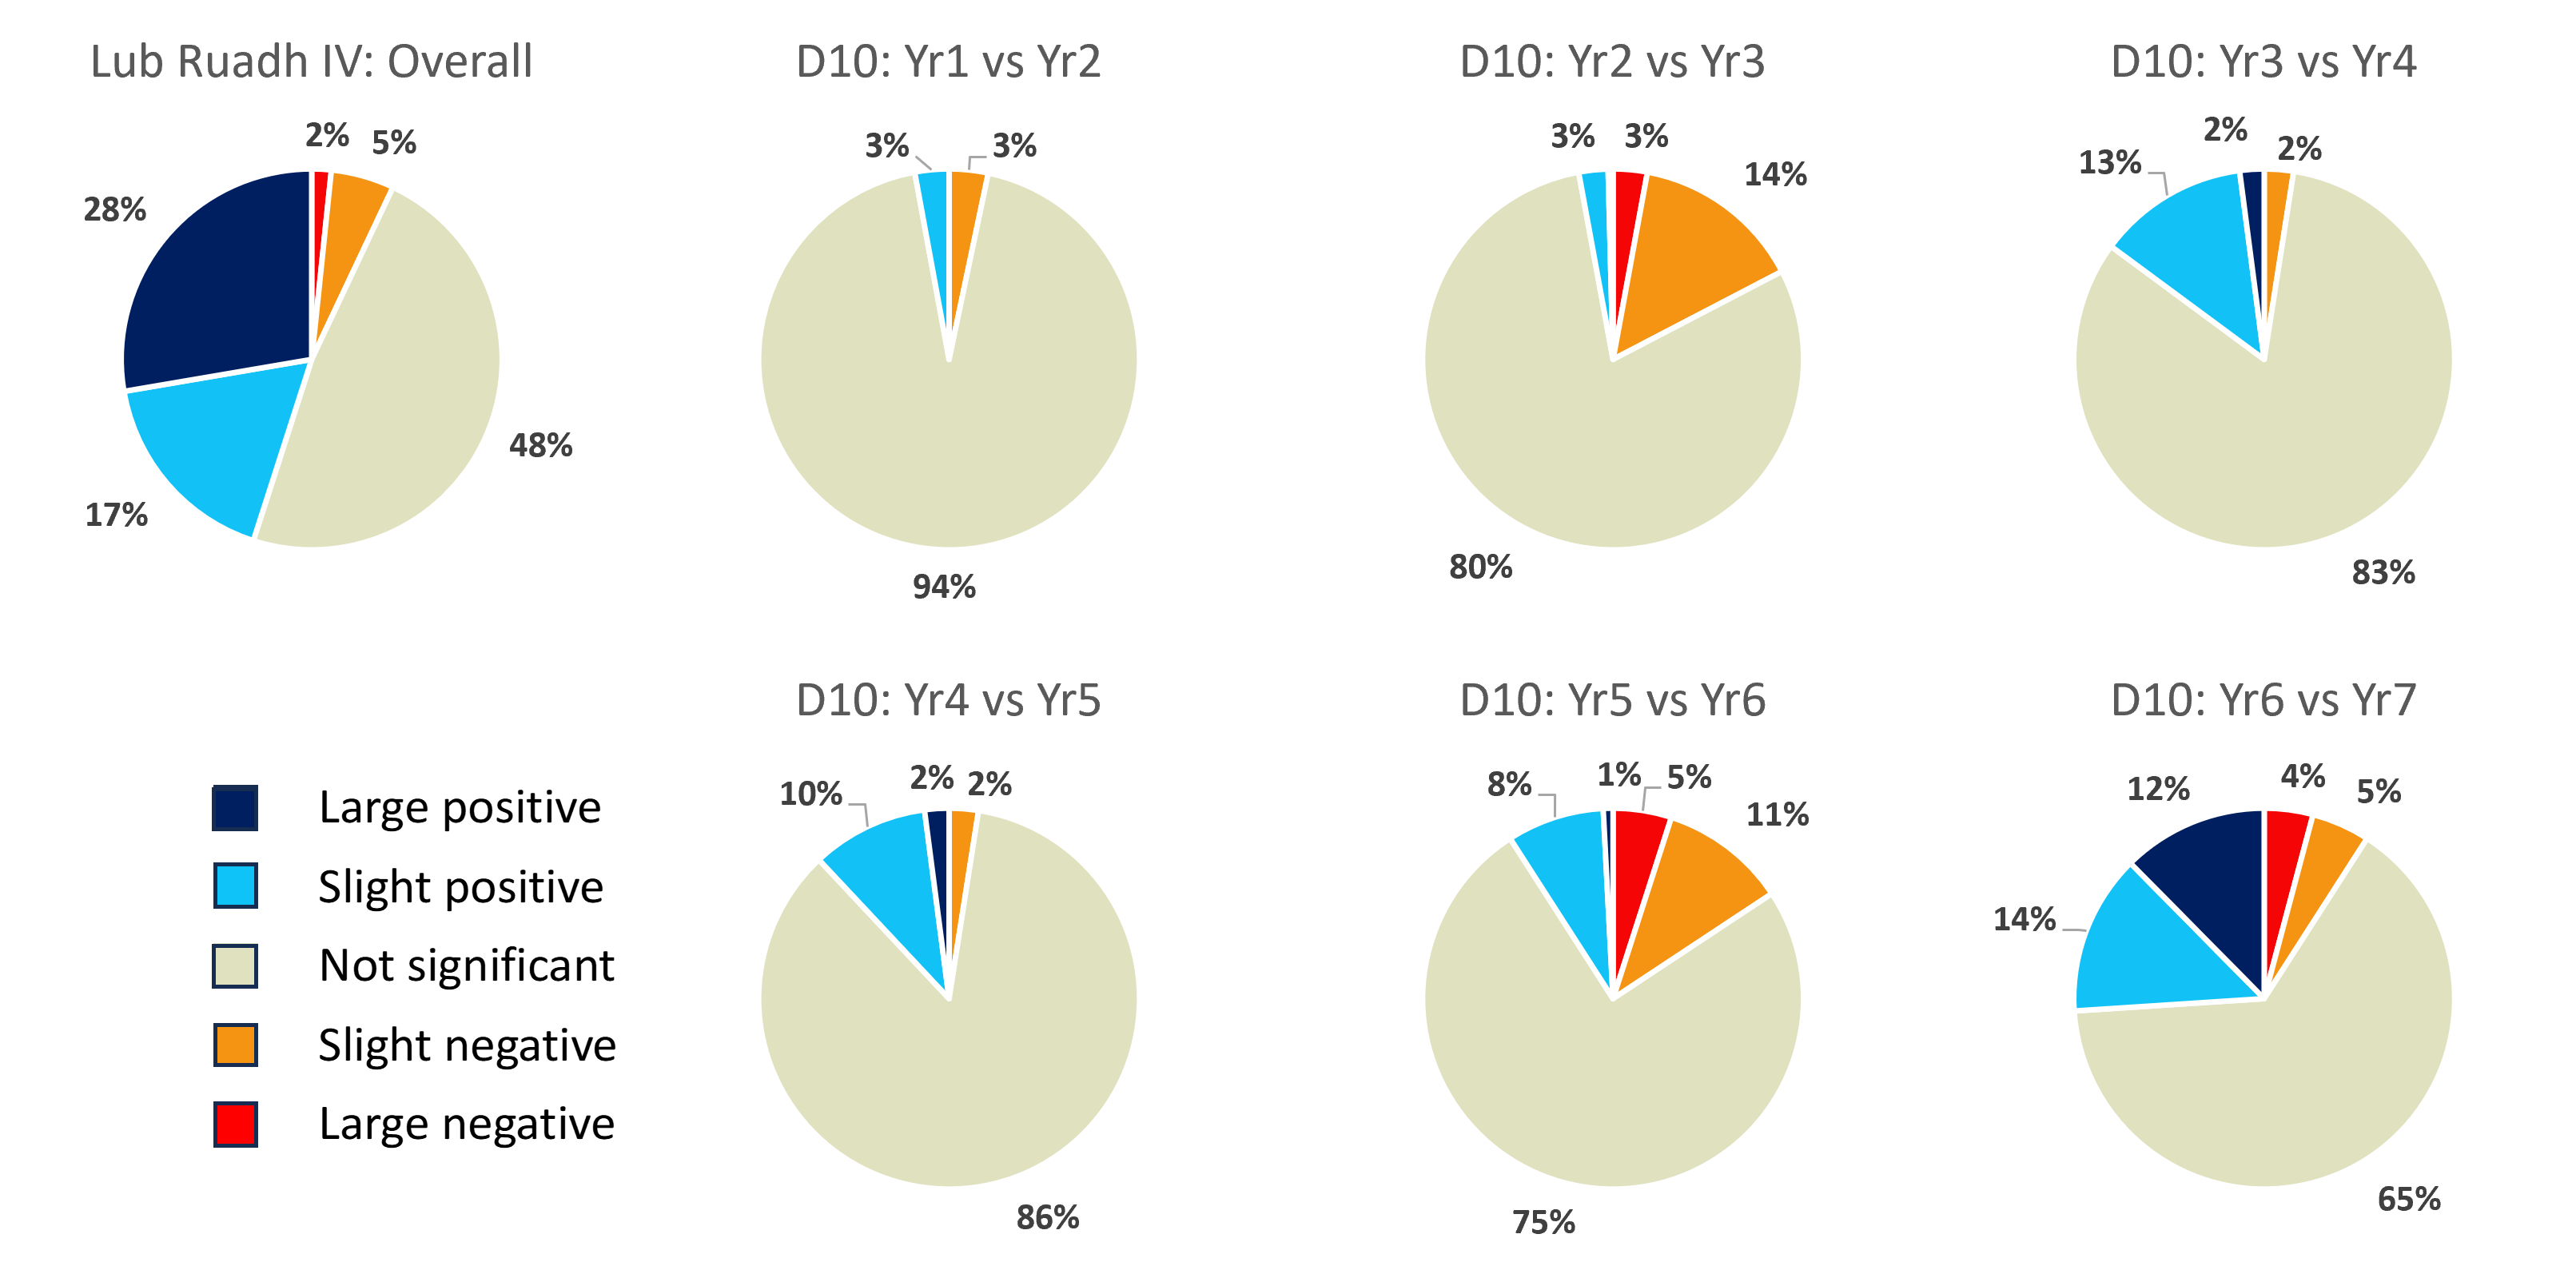
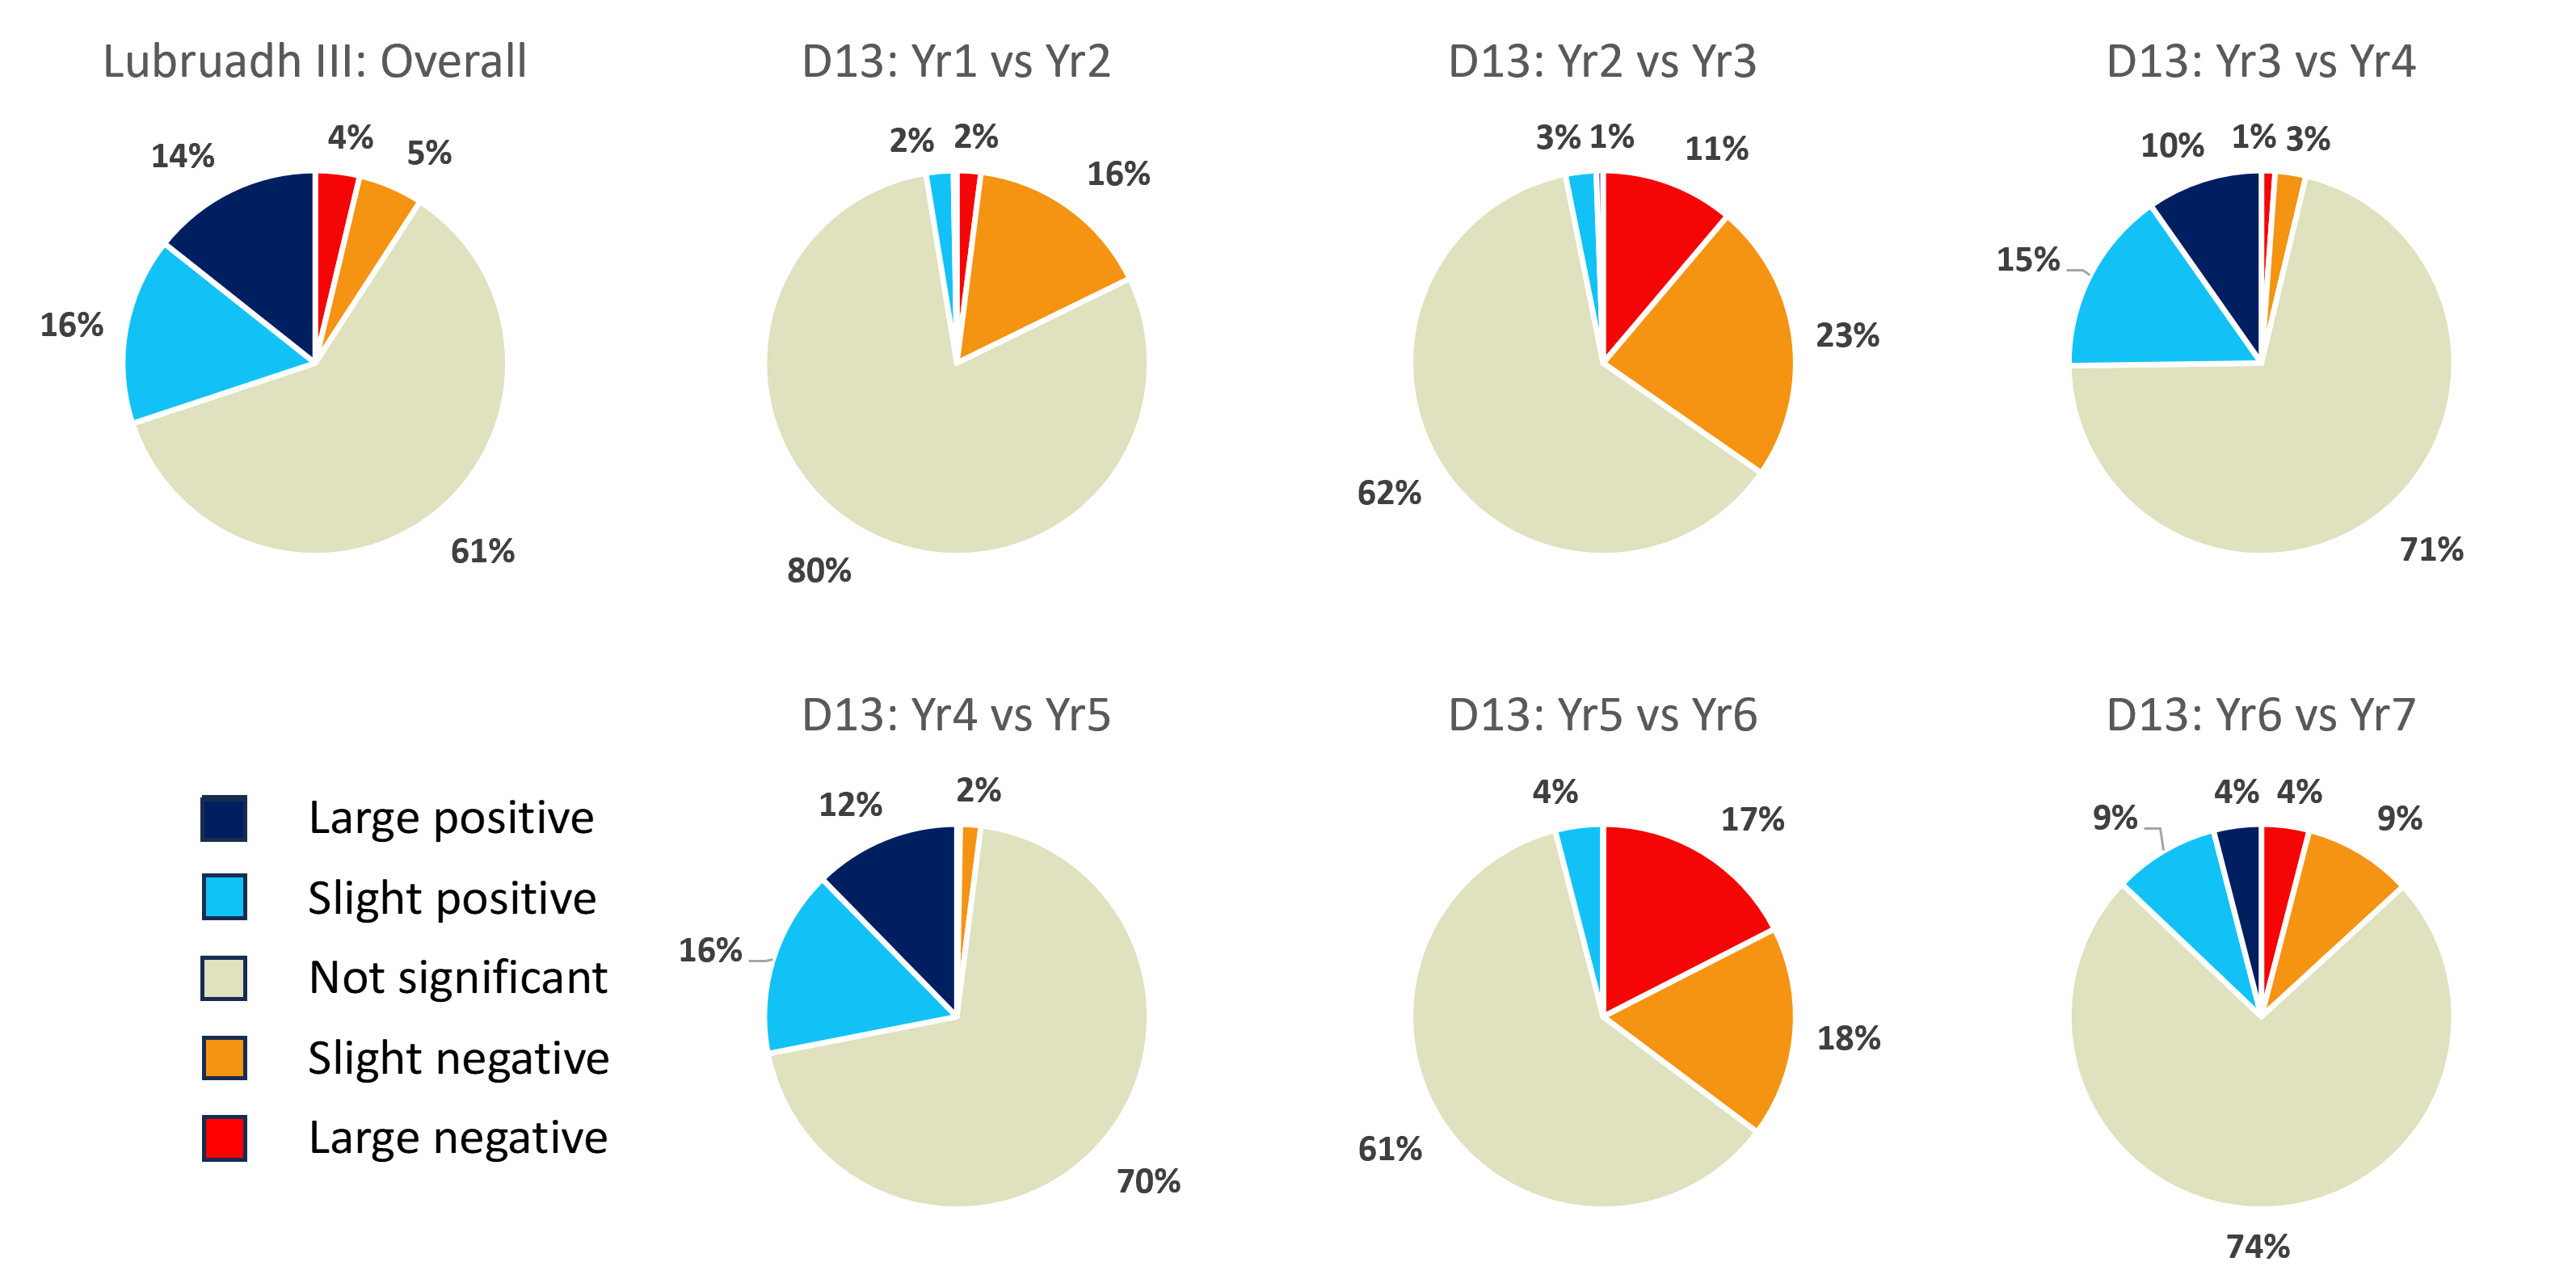
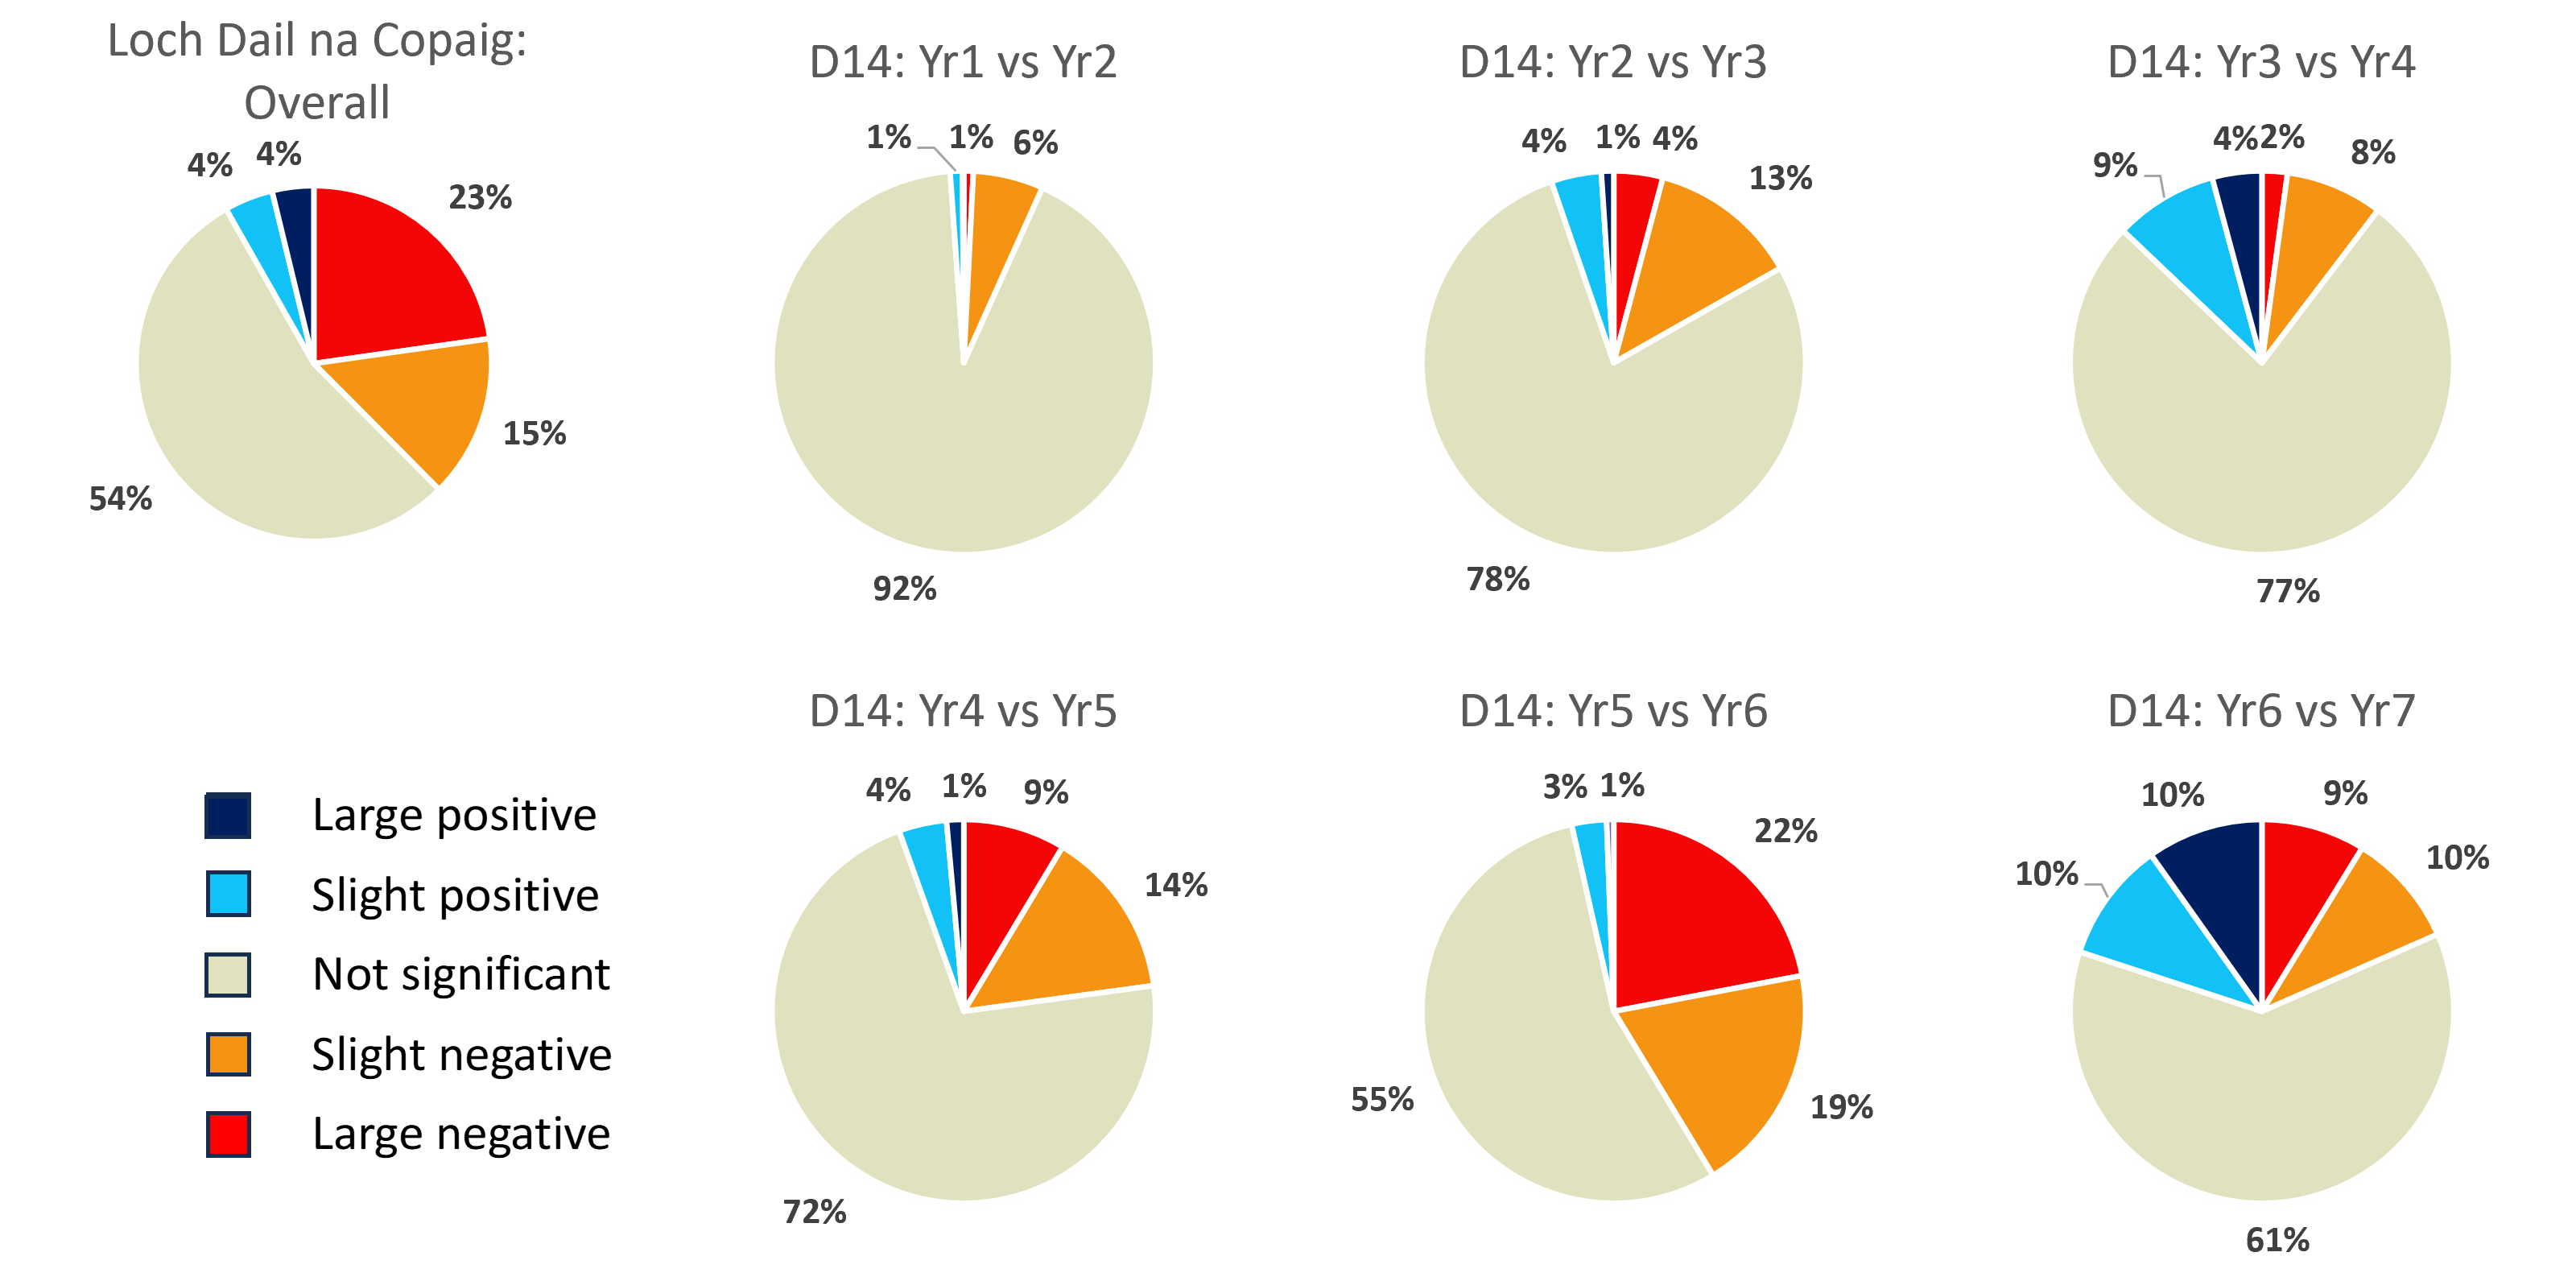
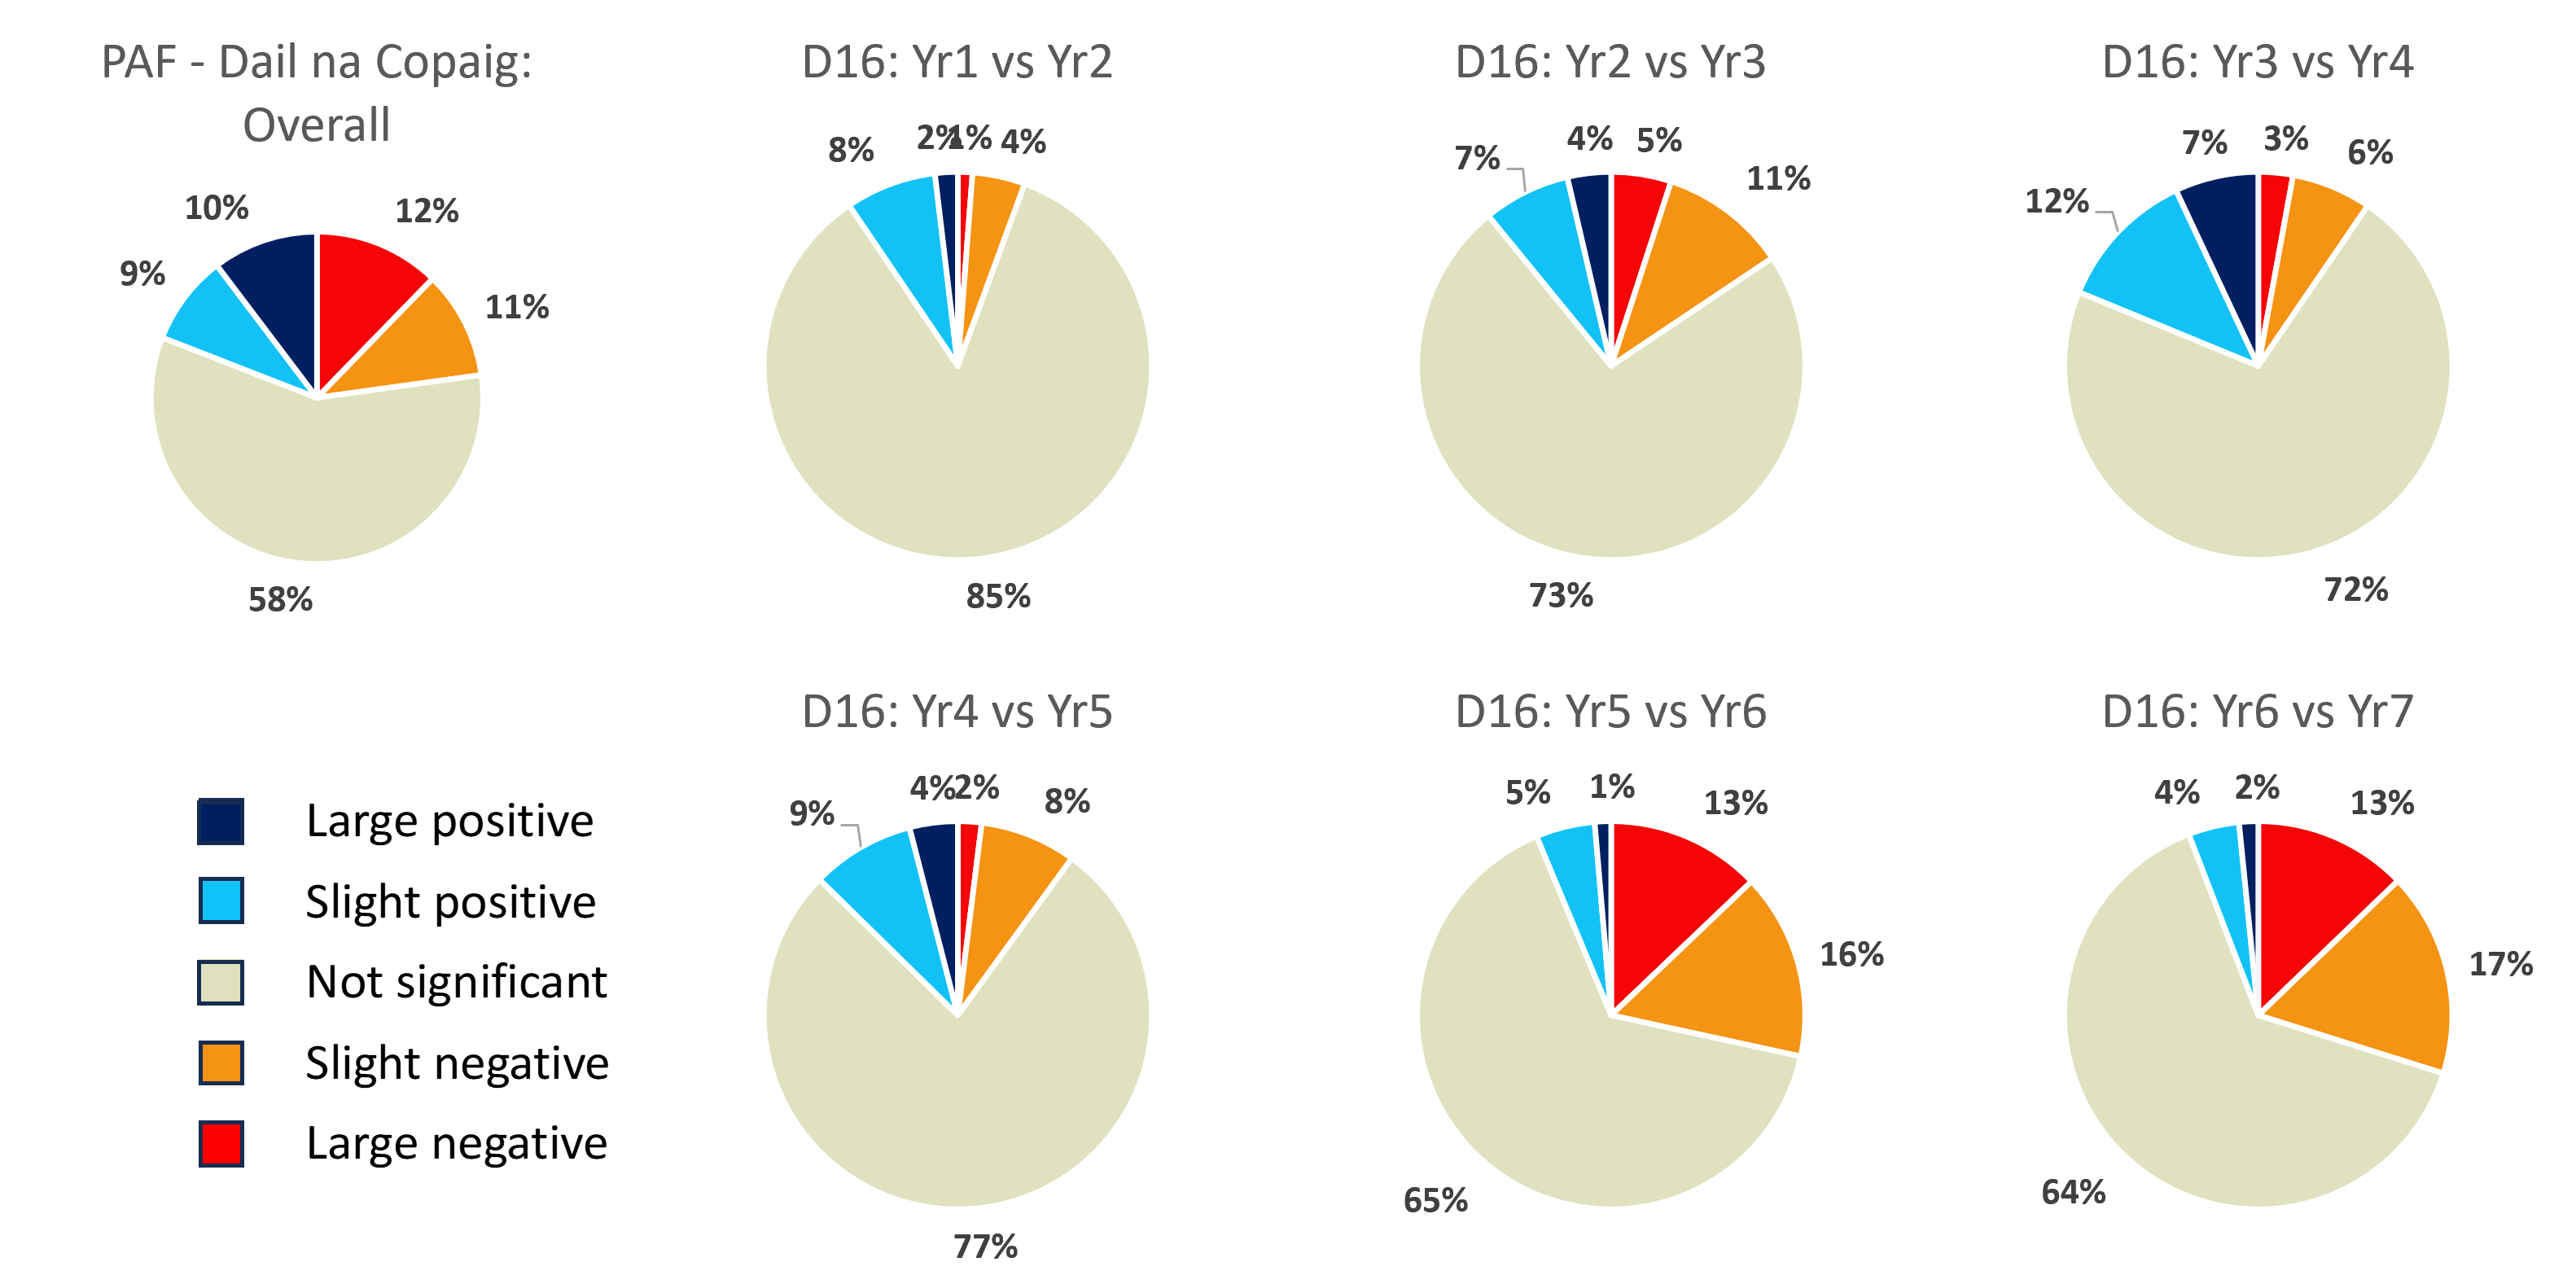