NatureScot Research Report 1269 - Using peatland surface motion (bog breathing) to monitor Peatland Action sites
Year of publication: 2021
Authors: Chris Marshall1&2, Andrew V. Bradley2, Roxane Andersen1, David J. Large3
Cite as: Marshall, C., Bradley, A.V., Andersen, R. and Large, D.J. 2021. Using peatland surface motion (bog breathing) to monitor Peatland Action sites. NatureScot Research Report 1269.
Keywords
peatland; InSAR; surface motion; condition; restoration
Background
Interferometric satellite radar (InSAR) provides a means of measuring peatland surface motion continuously and is not limited by scale or cloud cover. Previous InSAR investigations demonstrate the potential for InSAR to quantify surface motion and hence peatland condition. Time series of peatland surface motion has been related to precipitation, water level and vegetation composition. Validation in the Flow Country during the NERC funded InSAR ToPS project has also shown that ground motion derived from InSAR causally relates to motion on the ground. Using the Intermittent Small Baseline Subset (ISBAS) data processing approach, allows us to gain excellent coverage over forested and rural areas. This is a key step in being able to access the full spatial and temporal coverage of InSAR required to determine continuous characterisation of peatland surface motion.
A reliable national scale approach to measuring peat condition based on InSAR has the potential to provide: a better estimate of the amount and distribution of peatland and associated carbon inventories; a means of assessing the impact of investment in peatland restoration; and the potential to identify areas at high-risk of peat instability, fire and erosion. This project seeks to evaluate these applications over selected peatland sites in Scotland.
Main Findings
- Time series of peatland surface motion can be measured using InSAR
- Peatland surface motion is diagnostic of peatland condition
- Multi-annual velocity, peak timing, and amplitude, determined from the time series, can be used to produce automated peatland condition assessments
- The relative efficacy of different peatland restoration techniques can be quantified using InSAR measures of peatland surface motion.
- Areas with elevated risk of peatland instability can be detected using peatland surface motion.
Acknowledgements
We are grateful for the support of Terra Motion Ltd (Andrew Sowter, Ahmed Athab and David Gee) for supplying APSIS InSAR data processing. We are grateful to Peatland Action / NatureScot and Forestry & Land Scotland (FLS) teams for their support with contextual data and for commissioning this study, with thanks due to May Shirkhorshidi (Peatland Action) and Ian McKee (FLS).
Abbreviations
- Interferometric Satellite Radar (InSAR)
- Differential Interferometric Satellite Radar (DInSAR)
- Natural Environment Research Council (NERC)
- InSAR as a Tool to evaluate Peatland Sensitivity to global change (InSAR ToPS)
- Forestry and Land Scotland (FLS)
- Intermittent Small Baseline Subset (ISBAS)
- Small Baseline Subset (SBAS)
- Singular Spectrum Analysis (SSA)
- Principal Component Analysis (PCA)
-
Advanced Pixel System using Intermittent SBAS (APSIS)
Introduction
The relationship between peat surface motion, or “bog breathing” and condition, reflects the interplay of ecohydrology and peatland mechanics (e.g. Kulezynski, 1949; Baden and Eggelsmann, 1964; Mustonen and Seuna, 1971; Hutchinson, 1980; Kurimo, 1983; Almendinger et al., 1986; Price, 2003; Price and Schlotzhauer, 1999; Fig. 1). Mechanical deformation can modify the ecohydrology of a peatland via compaction, slope failure and pipe formation etc. (Waddington et al., 2010; Waddington et al., 2015). Field observations show peatland surface motion is influenced by water level (Roulet, 1991; Price 2003; Kennedy and Price, 2005, Fritz et al., 2008; Alshammari et al., 2020), vegetation composition (Howie and Hebda, 2018; Alshammari et al., 2020), micro-topography (Waddington et al., 2010), gas emissions (Glaser et al., 2004, Reeve et al., 2013) and land management (Kennedy and Price, 2005). Combined, these suggest peatland surface motion is a sensitive indicator of peatland function at large scale. Unfortunately, the field methods to measure it at a landscape scale are prohibitively difficult and expensive. Consequently, no large-scale surface motion field surveys have been undertaken.
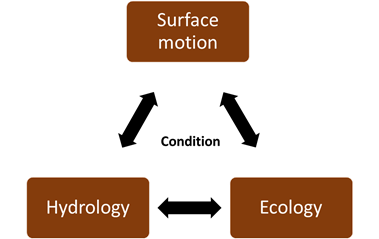
Interferometric satellite radar (InSAR) overcomes the difficulty of field measurements, provides a means of measuring peatland surface motion continuously and is not limited by scale. Previous InSAR investigations (Fiaschi et al., 2019; Tampuu et al., 2020), and localised studies (Alshammari et al., 2018; 2020) demonstrate the potential for InSAR to quantify surface motion and hence peatland condition. Time series of peatland surface motion has been related to precipitation (Fiaschi et al., 2019) water level (Alshammari et al., 2020, Tampuu et al., 2020) and vegetation composition (Alshammari et al., 2020). Validation in the Flow Country during the NERC funded InSAR ToPS project has also shown that ground motion derived from InSAR causally relates to motion on the ground. Using the Intermittent Small Baseline Subset (ISBAS) data processing approach (Sowter et al., 2013), allows us to gain excellent coverage over forested and rural areas. This is a key step in being able to access the full spatial and temporal coverage of InSAR required to determine continuous characterisation of peatland surface motion.
A reliable national scale approach to measuring peat condition based on InSAR has the potential to provide a number of a benefits (Fig. 2);
- A tool which can categorise peatland over large areas should provide a better estimate of the amount and distribution of peatland in each condition class, helping to refine national carbon inventories. It also should provide a quantifiable metric for assessing the impact of investment in peatland restoration through mechanisms such as Peatland Action and the Peatland Code.
- A national scale product should provide a means to inform national and regional strategy regarding peatland such as site selection, intervention evaluation and mandatory reporting (e.g. SSSI). As well as support continued site management.
- To prevent losses, the tool has the potential to identify areas at high-risk areas of peat instability, fire and erosion before catastrophic failure preventing loss of infrastructure or degraded areas contributing disproportionately to water quality issues e.g. coloration. It should also provide a means of determining when further intervention is required or where peatland condition tipping points are breached, requiring urgent action at a restoration site.
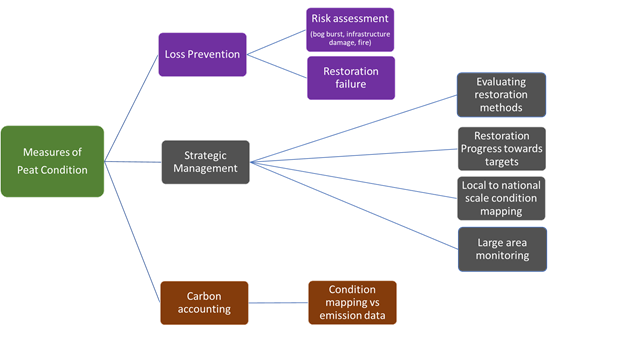
Figure 2. Possible peatland management applications of InSAR measures of peatland condition.
This study tests the feasibility using InSAR measures of surface motion as the basis for a national peat condition monitoring tool. When combined other measures (e.g. visual remote sensing, field observations) this approach should provide a quantitative and sufficiently detailed means of managing Scotland’s peatland at large scale, establishing Scotland as a world leader in peatland monitoring.
Methodology
Site Selection
Peatland Action and Forestry and Land Scotland defined 11 focus areas (Fig.3) covering a range of blanket peatland and raised bog peatland settings. These sites were selected to cover the geographic and climatic range of Scottish peatlands. They also featured a range of restoration types and had varying degrees of available institutional knowledge and contextual data regarding current peat condition.
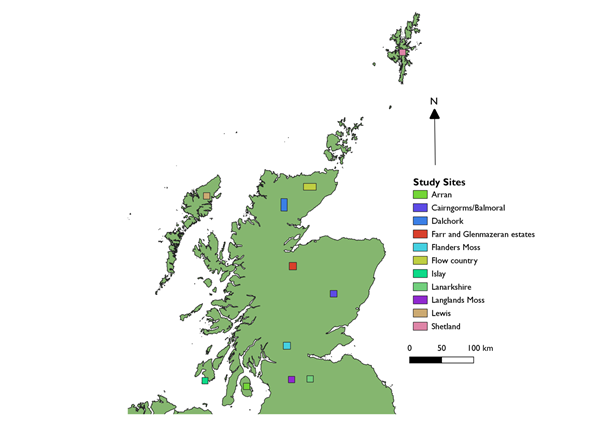
Figure 3. Overview map of project focus sites.
Survey Methodology
To measure surface deformation across the focus sites a multi-stage process was developed building on the APSIS InSAR technique formerly known as the Intermittent Small Baseline Subset technique developed by Sowter et al., (2013) and operated by Terra Motion Ltd (Fig. 4).
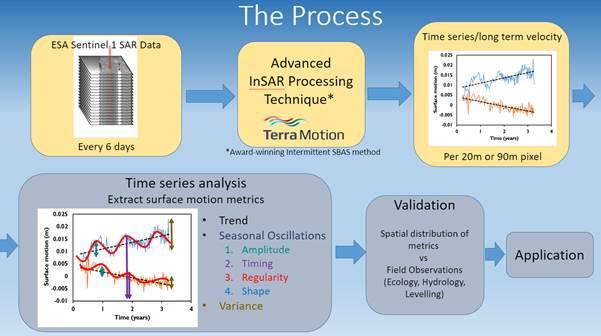
Figure 4. InSAR processing overview showing key processing stages.
ISBAS Processing and Singular spectrum analysis
To measure surface deformation, Sentinel-1A and –1B images from the European Space Agency Copernicus Open Access Hub were acquired. Satellite interferometry was applied to images gathered every 6 to 12 days between 12/03/2015 and 21/02/20 using the ISBAS DInSAR technique (Sowter et al., 2013). The ISBAS technique is an adapted version of the established low-resolution SBAS DInSAR time series algorithm (Bateson et al., 2015; Cigna and Sowter, 2017). It was designed to improve the density and spatial distribution of survey points to return measurements in vegetated areas, where DInSAR processing algorithms habitually struggle due to incoherence (Osmanoğlu et al., 2016; Gong et al., 2016). The ISBAS algorithm is implemented using Terra Motion Ltd’s in-house Punnet software, which covers all aspects of processing from the co-registration of SLC data to the generation of time series (Sowter et al., 2016). Phase unwrapping was implemented using an in-house implementation of the statistical-cost, network-flow algorithm (SNAPHU) (Chen and Zebker, 2001). The products used for this project were:
- A 2-year (Dec 2016- Dec 2018) 20 x 20m pixel high resolution linear motion product (long-term trend) covering the UK produced by Terra Motion Ltd
- An almost 5 year (March 2015 to Feb 2020) 80 x 90m pixel resolution linear motion product (long-term trend) covering the focus sites.
- A motion time series of average velocity (m y-1) sampled every 6 – 12 days for each georeferenced pixel location at approximately 80 x 90 m resolution.
All Terra Motion Ltd products and software were provided to the University of Nottingham on the basis that they may only be used for research and development.
Data were processed over the focus sites, after masking out, non-peat, surface water bodies and the sea. Sentinel-1A was joined by Sentinel 1B after the first two years of the mission (2014-16) to gather images every 6 days over the UK. After ISBAS, time series of peatland surface motion detect the seasonal expansion and contraction (or bog breathing) as annual oscillations in relative height.
Each motion time series was processed to describe the characteristics of the surface motion using the R programming environment (R Core Team, 2013). The data was organised into an equal time interval sequence, equivalent to the longest interval of Sentinel-1 images (12 days). Any data that fell between 12 days was excluded (this step will be less of a necessity as the Sentinel archive accumulates). Outliers were re-estimated using the R ‘tsclean’ function (Box and Cox, 1964), from R package ‘Forecast’ (Hyndman, 2020). Gaps were filled with a linear interpolation using the R ‘approx’ function (Becker et al., 1988) from R ‘stats’ package (R Core Team 2020) after ‘spline’ methods were found to produce contradictory results across the largest gaps (during 2015) when considering adjacent time series. At this stage long-term metrics were extracted from the complete time series and stored as an attribute for each pixel location. Singular spectrum analysis (SSA) using the software ‘k-spectra’ (Ghil et al., 2002) was applied to extract the cyclical seasonal trend from the 3-year time series. The open source R-package, RSSA may also be used for this purpose but was not tested during this investigation. Covariance was calculated, after channel reduction by Principal Component Analysis (PCA) analysis, using a moving window long enough to capture annual cycles using the statistical test of Vauthard and Ghil (1989). We calculated the first 10 PCA channels and 20 eigenvalues to find the significant components. In the first reconstruction, components 1 to 6 were selected, followed by a second reconstruction using component 6 to remove residual trends causing interference on the annual cycle. This extracted roughly 29% of the variance of the original time series, the other 71% representing longer term trends (interannual climate variations) or high frequency sub-3-month oscillations due to signal noise from the data processing and individual precipitation events. The resulting cleaned, detrended and reconstructed time series were then used to classify peatland condition manually and automatically over sites of interest.
Three time series characteristics were chosen to quantify the peatland condition. These three key variables are:
- The timing of the annual seasonal maxima, corresponding to the timing of maximum seasonal water level in the peatland which relates to plant functional type, evapotranspiration and pore structure (Alshammari et al., 2020);
- The multi annual long-term vertical velocity of the surface which is an indicator of changes in the mass (mainly water and carbon) and is the measure of surface motion most widely used to measure peatland subsidence and degradation (Roulet et al., 1991, Sloan et al., 2018);
- The amplitude of the seasonal peak in surface motion relative which is an indicator of the elastic capacity of the peat to respond to water storage (Waddington et al., 2010; Waddington et al., 2015).
Manual Classification
A first step towards an automated peatland condition product is to examine the characteristics of the time series manually. This was achieved by comparing areas with good contextual peat condition data with adjacent ‘near-natural’ sites visually for trends within three peatland surface motion parameters, peak timing, long-term trend and amplitude (Fig.5). This provides a conceptual bridge between contextual ground data and a future automated peatland condition product. It also provides additional validation of the accuracy of an automated method at key sites. It is expected that within the Scottish context the fundamental controls upon peatland surface motion characteristics should be relatively constant over areas with similar climate. Characteristic surface motion parameters and associated peatland condition classes were determined for Dalchork due to the availability of field data and used to produce condition classes using the approach outlined in Fig. 5. Application of these classes were then used on focus sites at Forsinard, Flanders Moss, South Lanarkshire, East Kilbride, Arran, and Islay.
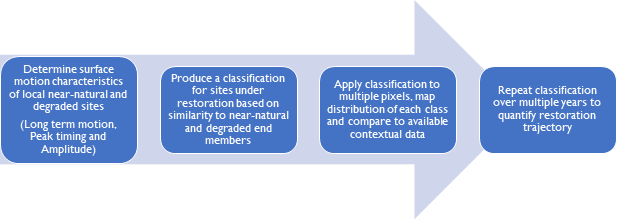
An image of an arrow from left to right showing text boxes:
1. Determine surface motion characteristics of local near-natural and degraded sites (Long term motion, Peak timing and Amplitude).
2. Produce a classification for sites under restoration based on similarity to near-natural and degraded end members.
3. Apply classification to multiple pixels, map distribution of each class and compare to available contextual data.
4. Repeat classification over multiple years to quantify restoration trajectory.
Manual Peat Condition Classification Scheme
A manual classification scheme was developed at Dalchork by examining time series of near-natural and degraded endmembers. These consisted of:
- A wetter end member comprising low density peat, with high water tables, sometimes with pools which are dominated by Sphagnum species, and form the central parts of the peatland system showing high amplitude peaks in winter, and a positive trend.
- A drier shrub-dominated end-member which is characteristic of denser peat usually found at the margins of the peatland expanse adjacent to natural drainage, showing moderate amplitude peaks in autumn and a neutral-positive trend.
- A degraded end member showing a strong subsidence trend lacking any seasonal oscillations of the peat surface and associated with recently felled or unrestored sites.
Restored sites showed a trajectory away from the degraded end member time series characteristics towards either the wetter or drier end member. Comparing restored sites with the endmembers defined in the previous sections allowed the restored sites to be grouped into 4 condition classes visually (Table 1).
Table 1 - Manual Peatland Condition Classification and associated expected ground description
| InSAR Class | Surface Motion Characteristics - Velocity | Surface Motion Characteristics – Amplitude | Surface Motion Characteristics – Timing | Condition | Ground Description |
|---|---|---|---|---|---|
|
1 |
negative |
none |
none |
Degraded |
Bare peat, drained, low water level. On slopes: active erosion, gullys. On flatter grounds: scrub species or grass/rushes, signs of heavy grazing by sheep. |
|
2 |
negative |
low |
either |
Early rewetting |
Increased but spatially variable water level, dominance of shrubs (particularly C. vulgaris) and dry-loving species, species assemblages not dominated by bog species, effect of intervention still evident. |
|
3 |
stable |
moderate |
either |
Late rewetting |
Target water level (close to the surface and stable), increased cover of typical bog species, reduction in cover from dry species, effect of intervention still apparent but diminishing. |
|
4a |
positive |
high |
winter |
Near-natural (pools and mesotope centres) |
Similar to nearby sites considered to be in ‘near-natural’ condition. Sphagnum-dominated vegetation cover, sometimes with pools. |
|
4b |
positive |
moderate |
autumn |
Near-natural (margins) |
Similar to nearby sites considered to be in ‘near-natural’ condition. Sedge/shrub co-dominance. |
Measurement and automatic classification of key variables
For automated classification, the seasonal trends were analysed to determine the amplitude and position of the seasonal peak using a peak-find algorithm. This data along with the multiannual velocity of the peat surface was then plotted and examined on a key variable plot. The position of the wet and dry natural endmembers and degraded peat on the plot was then determined and the Euclidian distance from the ideal end members calculated. This distance from end members within this plot space should provide the basis for an automated method for classifying peatland condition over time. To assess the potential of using an automated approach the method, which is still under development, the approach was tested over three forest blocks at the Dalchork site. Future development, now underway, requires the detailed mapping of sites with different ecohydrology, topography and management within the key variable plot, the optimisation of classification thresholds, comparison to the manual classification for multiple sites and double-blind testing against field data.
Data Quality over the Focus Sites
All focus sites have >95% InSAR coverage over peatland in all generated products (Fig. A1-A10) and across all sites several data quality/usability observations were made:
- The higher resolution linear (long-term trend) product (20m pixel resolution) produces better defined boundaries to areas of distinctive surface motion than the lower resolution (80m pixel resolution) product allowing the effect of smaller scale features, such as gully systems and drainage/management boundaries to be identified much more clearly.
- Increased noise was associated with intensive management activities related to arable agriculture, peat extraction and commercial forestry. These areas are also characterised by higher standard errors (as observed by Alshammari et al., 2018)
- Data gaps were commonly associated with either topographic or processing issues.
- Topographic errors were rare and limited to areas of very steep N-S trending valleys. These result from an interruption in line of sight, leading to a radar shadow. This might be resolved by using a different orbit, however in rare cases, areas would have to be monitored using alternative techniques.
- Processing limitations are a feature of the raw dataset. For example, gaps between bursts sometimes coincide with sites of interest. Also stitching different frames together can increase error at the frame margins.
- There were also gaps associated with dense forestry.
Shorter term products are more likely to be impacted by unusual climate events e.g. the 2018 European Drought Event. The effect was particularly pronounced in good condition sites which showed long-term uplift over 5 years but pronounced subsidence over 2 years in which the 2018 drought-dominated. As a result, shorter term averages used in isolation without further contextual data derived from other sources may be misleading particularly when incorporating the effects of extreme climate events.
Site Results
This section presents the key findings and a site overview from each focus site.
Dalchork
The Dalchork site (Fig. 3) is an area of extensive Forest-to-Bog restoration.
Key Findings
- Surface motion characteristics of restoration sites display a clear trajectory towards ‘near-natural’ conditions.
- Sites with lower intensity of intervention (e.g. only drain blocking) have progressed more rapidly than areas with more complex restoration requirements e.g. Forest-to-Bog Restoration.
- Areas of peat instability appear to be associated with areas of higher amplitude.
- Overall, most areas of peatland restoration at Dalchork show improvement compared to adjacent unrestored areas with progress dependent on the intensity of intervention and the starting state e.g. Forested vs open peatland.
Site Summary
Long-term motion (Linear)
Long-term motion trends over the Dalchork focus area (Fig. A1) shows that forestry and former forestry is characterised by higher rates of subsidence compared to adjacent open peatland. The average peatland surface motion measurements for all pixels within a restoration area/management block gives a simple method for comparing progress between sites. As might be expected, sites subject to peatland restoration earlier show the greatest signs of recovery. Another factor is the intensity of the intervention, with open, drained, but unforested sites showing faster progress than Forest-to-Bog sites. Long-term trends appear to be related in part to landscape position with greatest stability over flatter areas such as hill tops, the base of slopes and saddles. The boundary between Forest-to-Bog and open peatland is relatively sharp with a gradual increase in subsidence towards and within 100-200m of former plantation boundaries.
The Crask, Druim and Druim na Capulich sites (Fig. A11) represent a mixture of Forest-to-Bog restoration and drain blocking in open areas and are amongst the earliest peatland restoration at the Dalchork site (pre 2015). Overall, long-term peatland surface motion shows lower rates than observed in adjacent unrestored areas over the past 5 years. Areas of drain blocking in open peatland are often stable or display vertical growth, with some areas indistinguishable from nearby ‘near-natural’ pool systems. Subsidence rates are highest over Forest-to-Bog restoration sites (at -3 to -4mm/yr) but still below that observed in more recently felled blocks. More recently felled sites such as LubRuadh and Dail na Copaig show moderate to high subsidence rates of between -6 to -7 mm/yr. Although high these are still lower than unrestored recently felled areas (-10 mm/yr) and are consistent with early stage recovery in most areas.
Manual Classification of time series characteristics
Manual Classification of the InSAR time series (Fig. 6) of the Crask, Druim and Druim na Capulich sites shows areas of Forest-to-Bog restoration showing a range from Class I (no recovery) to Class 3 (Major Recovery). The degree of recovery appears to be in some respects topographically controlled with areas at the base of slopes and on saddles or peatland plateaus showing more rapid recovery than peatland slopes. Open areas of peatland appear to start in better condition and show evidence of more rapid recovery evidenced by a predominance of class 3 (major recovery) and class 4 (‘near-natural’) pixels. When considered on an annual basis Forest-to-Bog sites show a rapid conversion of Class 1 pixels to Class 2 pixels over the five years. Conversion to higher condition classes is measurable but much slower.

Figure 6. Manual Classification of the Druim na Capulich Focus site on an annual basis 2016-2019 Automatic Classification of timeseries characteristics.
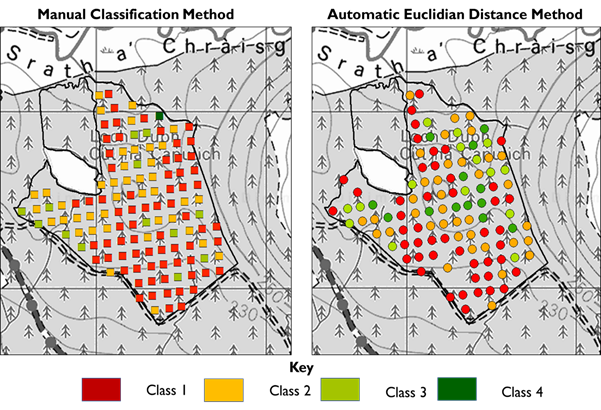
General trends are reproduced although more thorough calibration is required in some areas.
An automatic classification was approximately calibrated using the manual classification at Druim na Capulich (Fig. 7) The results, quantified relative to the Sphagnum Class 4a (Fig. 7), show similar trends to the manual classification. The automated approach identifies more pixels as class 4. This may be due to pessimistic unconscious bias in the manual approach or the exact position of the class boundaries.
Expanding the automatic approach to a larger scale (Fig. 8) shows similarities with the manual approach. Yet, this is dependent on the end member chosen. Using a Sphagnum-dominated Class 4a endmember shows that many sites in northern Dalchork have a positive trajectory towards the Sphagnum-dominated control. Using a shrub-dominated Class 4b end member greatly reduces the number of sites showing a positive trajectory. These are highly localised and appear to be in areas which do not show a positive trajectory towards Sphagnum-dominated time series. These tend to be on peatland margins adjacent to natural drainage. This is encouraging as this is where these types of drier peatland might be expected to form naturally. Using both end members and comparing them provides a means of identifying which end state is favourable at each site and therefore which ecohydrological thresholds to apply to indicate restoration success.
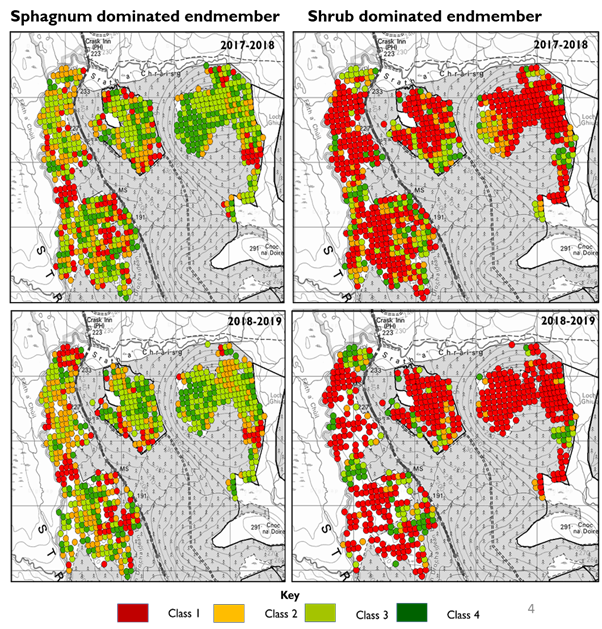
Figure 8. Automatic classification of three management blocks in the northern part of the Dalchork study site based on a Euclidian distance approach from a sphagnum dominated and shrub dominated end member. Class 1 = No progress, Class 2 = Minor progress, Class 3 = Major progress and Class 4 = Near natural conditions. Note that marginal sites trend towards a shrub dominated endmember whilst central sites trend towards a sphagnum dominated one.
Peat Instability
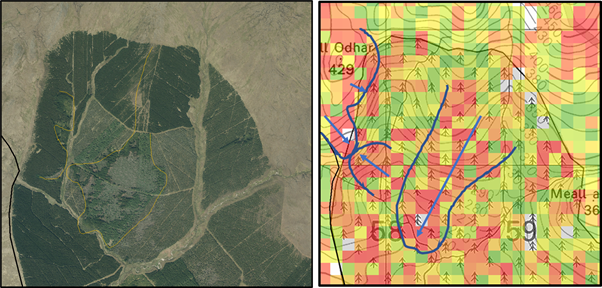
Figure 9. Optical (left) and Radar derived amplitude map of a site of peat instability at Dalchork. Red - high amplitude annual peatland surface motion.
Consideration of satellite imagery over the Dalchork area shows several areas of slope failure over forested areas to the east of the site (Fig. 9). These appear on steep slopes adjacent to drainage. When InSAR-derived peatland surface motion parameters (long-term motion, peak timing, and amplitude) are mapped over these areas, measures of amplitude show close correspondence with the outline of previous areas of slope failure. Amplitude reflects the dynamism of the peat surface and the presence of low-density wet dynamic peat on a steep slope is likely a risk factor.
When expanded across the Dalchork focus site areas (Fig. 10) areas of high amplitude appear to be both topographically and aspect controlled with most situated-on E-NE facing steep slopes. This aspect control reflects the lower evapotranspiration in these areas leading to wetter conditions. Amplitude appears to provide an indicator of peat instability risk, identifying sites where further monitoring might be required. Although not examined here, time series of horizontal motion combined with vertical motion may also provide advanced warning of peat instability events, however this requires further investigation. These areas may also be more prone to windthrow.
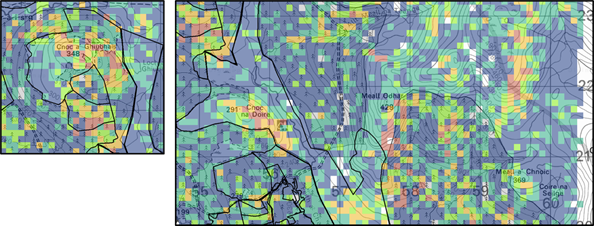
Figure 10. Areas of high amplitude peat surface motion at Dalchork, Red = high amplitude.
Forsinard
Forsinard (Fig. 3) contains extensive mixed areas near-natural, forested and Forest-to-Bog restoration.
Key Findings
- Analysis of 600 management blocks shows a clear restoration trajectory over the past 20 years, with some sites showing a return to growth
- A major shift in intervention type c. 2010 associated with brash removal is reflected in the long-term motion with sites subject to post 2010 restoration techniques recovering up to 8 years faster than earlier restoration sites.
- Most restored sites show favourable condition characteristics relative to unrestored sites.
Site Summary
Long-term motion (Linear)
Peatland surface motion (Fig. A2A, A2B) over the Forsinard estate shows that large areas of the Flow Country are stable or even growing (1-2mm/yr). Areas of recent felling record the highest rates of peat surface subsidence (>10mm/yr to >-10mm/yr). This is followed by areas of Forest-to-Bog restoration which shows a range of subsidence values ranging from near felling (>-10mm/yr) to stability (0 to -2mm/yr). In most cases this reflects a combination of time since intervention and restoration technique. For example, areas of the Dyke forest which have only recently undergone restoration and felling show pronounced subsidence, whereas other areas are almost indistinguishable from surrounding open blanket peatland such as areas of Talaheel and Imrich Forest. Overall long-term motion over the Forsinard Estate shows previously unforested areas to be stable with Forest-to-Bog restoration areas to be at varying stages of restoration progress.
Evaluation of different Interventions
Comparison of the current peat surface (March 2015-Feb 2020) motion trend of peatland surface motion across 600 polygons felled at different times over the past 30 years at the Forsinard Focus site shows a clear trend of increasing stability with time since felling (Fig. 11). There is a clear shift between sites felled pre-2010 and post 2010 with more recent sites apparently showing more rapid progress than earlier sites. This corresponds to a shift in management practise from felling to waste pre 2010 to removal post 2010, triggered by new demand for wood for biomass. Using the rate of subsidence as a measure of recovery post 2010 restoration sites appear to have attained the same level of recovery as pre-2010 restoration and have done so 8 years faster.
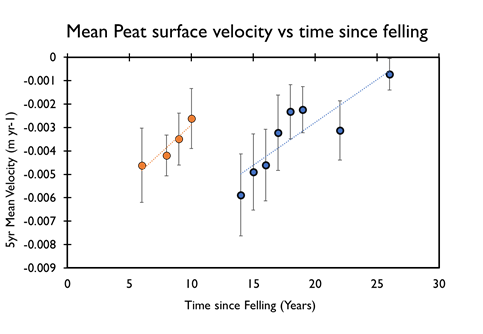
Figure 11. Comparison of time since felling vs 5 year mean surface motion at 600 Forest-to-Bog management blocks across RSPB Forsinard. This shows that the shift from Fell to waste to off-site removal has accelerated restoration by approx. 8 years.
Manual Classification of time series characteristics
Examination of time series from Forsinard show that adjacent ‘near-natural’ sites share many similarities with those at Dalchork, with similar peak timing (Winter peaks associated with pool systems and autumn peaks on slopes and peatland margins), amplitude (high in pool systems, low in degraded areas) and trend (positive in ‘near-natural' settings and increasing subsidence with declining condition). The Forsinard sites show similar restoration trajectories and the Dalchork classification was generally comparable between the two sites. There were slight differences between the two sites, particularly in peak timing which appeared to occur earlier in the winter when compared to the Forsinard Area. This is interpreted to result from the more westerly position of Dalchork on the W-E precipitation gradient, meaning water storage capacity is reached earlier than at Forsinard. Also due to a longer period of restoration, time series from some older Forest-to-Bog sites at Forsinard were displaying more ‘natural’ peatland surface motion characteristics than at Dalchork and the oldest were showing a return to uplift and growth.
Balmoral Estate
The Balmoral Estate Focus Area covers an area of upland blanket peatland with evidence of exposed mineral soil and past heather management.
Key Findings
The Balmoral Estate site appears to display mostly degraded characteristics with small areas of better condition.
- Areas with large amounts of exposed mineral soil show stable characteristics which dominates the signal.
- Areas of heather management (e.g. fire, mowing) appear to be easily delineated from peatland condition parameters particularly by subsidence rate.
Site Summary
Long-term Motion (Linear)
Consideration of the Balmoral focus area (Fig. A3) shows that peatland surface motion to the west of the focus area is characterised by subsidence at around -10mm/yr. The central part of the area is characterised by relative stability with relative rates of motion of around -2mm/yr. Both areas appear degraded on visual imagery however the central area shows greater exposure of mineral soil. Consequently, the stability of this area may reflect either very thin peats or very compacted peats which are not able to compact further, or the signal being dominated by bedrock. Across the area, is a mosaic of stable and subsiding areas, which appear to reflect areas of better condition peatland including an area of restoration. These are surrounded by areas of subsidence which appear to intensify around areas of heather management. Areas of restoration appear to show increased stability over the time compared with adjacent unrestored peatland, which would indicate positive restoration progress. Overall, long-term trends from this focus area shows that large areas are degraded, particularly on slopes with small areas of wetter peat associated with areas of high upland plateau.
Time series characteristics
The Balmoral Focus area shows similar peatland surface motion characteristics to those observed at Dalchork with core areas showing winter peaks, moderate amplitude, and low subsidence. Areas of heather management appear to be easily demarcated using peatland surface motion parameters with peak timing dominated by the drier autumn peak timing.
Farr and Glenmazeran Estate
Key Findings
- Peatland surface motion shows a mosaic of different condition classes with a general trend of improving condition with altitude.
- Marginal peats show the greatest subsidence with areas of heather management particularly prominent.
- Areas with evidence of restoration show reduced subsidence or stability.
Site Summary
Long-term Motion (Linear)
The Farr and Glen Mazeran Estate focus area shows similar trends to the Balmoral site (Fig. A4) and shows the upland area to be a mosaic of moderately subsiding (-3mm/yr) and more stable peatland. This likely reflects a combination of complex underlying topography forming local sub-basins as found in many upland areas and localised management practices. For example, areas of drain blocking show more stable conditions compared to adjacent areas of heather management on the lower slopes of the focus area (10-11mm/yr). These areas are often outside of the peatland extent identified using visual remote sensing methods but appear to have long-term ground motion comparable that of degraded peatland.
Time series characteristics
The Farr and Glen Mazeran Focus area shows similar peatland surface motion characteristics to those observed at Dalchork with core areas showing winter peaks, moderate amplitude, and low subsidence.
Flanders Moss
The Flanders Moss Focus site covers an area of raised peatland subject to extensive peatland restoration.
Key Findings
- Site shows ‘near-natural’ or approaching near-natural conditions across most pixels.
- Remaining areas of degraded peat appear to be related to scrub, or proximity to drainage.
- Most pixels show a trajectory towards better condition classes over the past 5 years.
- More intensive techniques appear to slow restoration progress in the first five years but accelerate progress thereafter.
- The Flanders Moss site switched peak timing following the 2018 drought from more autumn dominated to winter dominated, a sign that the peatland got wetter. This is unexpected and requires further investigation.
Site Summary
Long-term Motion (Linear)
Long-term peatland surface motion over the Flanders Moss focus area (Fig. 12) shows that overall Flanders Moss is in a stable condition. Most areas show particularly strong growth particularly across areas of Forest-to-Bog restoration, showing the positive impact of this intervention. There are some areas of minor subsidence, which roughly conform to areas of small trees and scrub visible on satellite imagery. The easternmost area of scrub corresponds with the approximate location of the peat dome. Subsidence in this area may be in part be due to the historic legacy of marginal drainage and may reflect a positive feedback in which the presence of deeper-rooted vascular plants may prevent full rewetting. Another area of subsidence to the SW of the site corresponds with a previously blocked drainage ditch. This requires investigation and may indicate that the drain blocks in the area require investigation. Overall Flanders Moss appears to show long-term peatland surface motion comparable with stable ‘near-natural' sites illustrating the positive impact of peatland restoration measures.
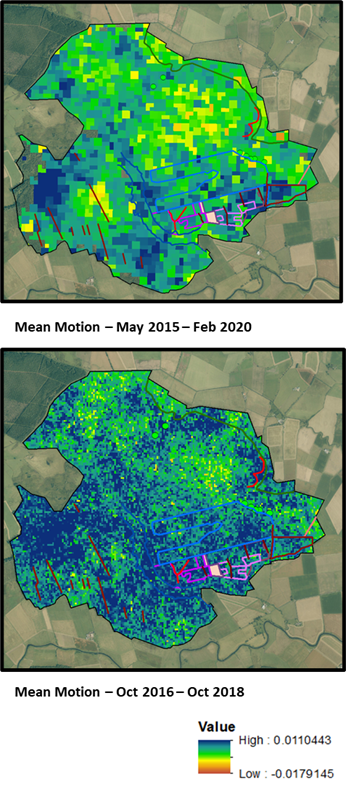
Figure 12. Long term trends in peat surface motion at Flanders Moss (Top) 5 years of data at 80m pixel resolution (03/2015-03/2020) (Bottom) 2 years of data (12/2016-12/2018) at 20m pixel resolution, lines show restoration activities
Time series characteristics
At Flanders Moss different areas show characteristic time series, areas approaching near-natural show clear seasonal surface oscillations and an upward long-term trend. In some areas adjacent to bunds and some drain blocks the rate of uplift is significantly higher than in other sites. This likely represents increased hydrological input or pooling in these areas causing the surface to swell. The effect often dissipates away from the feature. It is also is not observed everywhere, potentially requiring the feature to crosscut perpendicular to the main flow direction to cause this effect. In the lag fen area, amplitude and trend seem to be lower although peatland surface motion characteristics are still evident. In the areas with scrub the long-term trend indicates subsidence but with clear evidence of peatland surface motion indicating that some hydrological function remains.
Application of the manual classification (Fig. 13) showed that during the year June 2018-2019 Flanders moss was dominated by condition class 3 showing major recovery. In fact, many of these were close to class 4 however still showed slight differences in peak timing and amplitude indicating that the hydrology was not entirely natural. There was little to no variation annually indicating that the system was very stable. ‘Near-natural’ sites (class 4) were present and were surrounded by class 3 pixels which were approaching class 4. Areas of class 2 generally showed strong peatland surface motion characteristics but showed a low subsidence trend. These were in areas of scrub identified from aerial photography. These areas of scrub correspond with either former areas of plantation or areas corresponding with the peat dome. The presence of scrub may be inhibiting recovery in these areas by facilitating more efficient evapotranspiration and keeping the area drier than it might otherwise have been. Only 1% of sites showed no evidence of recovery and these were hotspots within areas of subsidence. Most were associated with drainage features, which were either recently blocked or legacy blocking that may have failed.
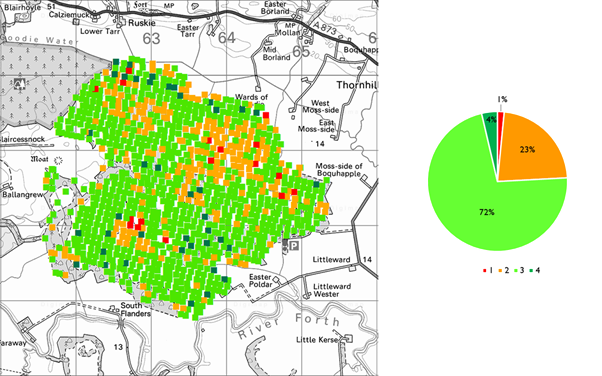
Figure 13. Manual classification of all pixels covering Flanders Moss for the 2018/2019. This site showed very little variation over the past five years on an annual basis - Red = Class 1 (No Recovery), Orange = Class 2 (Minor Recovery), Pale Green = Class 3 (Major Recovery), Dark Green = Class 4 (Near-natural Characteristics). This site shows most sites show characteristics of a hydrologically functioning raised bog.
Unlike the Dalchork site, the Flanders Moss site shows little change over the period examined, indicating that conditions have stabilised or at least the rate of recovery has slowed as condition has improved. This would indicate that the system is stable, although areas with class 2 characteristics may benefit from further targeted intervention.
An interesting feature of the Flanders Moss site is that the peatland surface motion signal shows a more muted response to climatic variations over the five years than is observed at near-natural sites. This resilience to climate change may be a consequence of the intensive management of water levels.
Evaluation of different interventions
Plotting mean long-term motion for polygons with different treatments against time since intervention shows that restoration is not a linear process (Fig. 14). More intensive treatments e.g. stump flipping and grinding at Flanders Moss appear to slow the rate of restoration over the first 5 years post restoration. However, after this, restoration appears to accelerate with significant restoration gains over the next 5 years. This is important to note as sites subject to intensive treatments may appear to be underperforming over the short-term, may show rapid progress over the medium term without any additional intervention required.
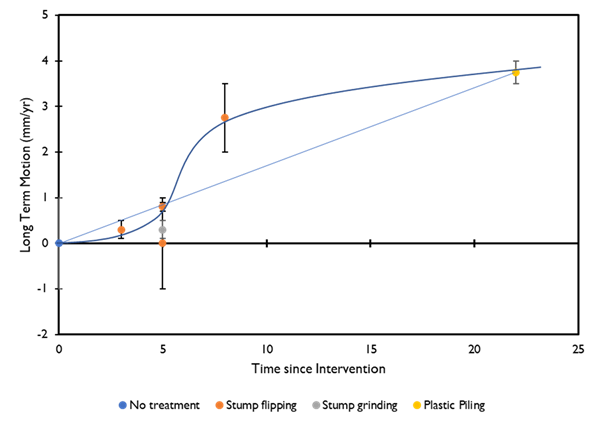
Figure 14. Comparison of Mean Surface Motion vs time since intervention at restoration sites utilising different intervention types at Flanders Moss relative to a no treatment control. No treatment (n = 5), Stump Flipping 8 years (n=2) Stump Flipping 5 years (n=4) Stump Grinding (n=2), Plastic Piling (n=4).
South Lanarkshire
The South Lanarkshire site contains a number of raised bog sites with differing land usages including peat extraction, forestry, and conservation/restoration.
Key Findings
- Area shows a mixture of peatland surface motion characteristics with some areas showing recovery, particularly those with less intensive management.
- The railway cutting at Carnwath Moss appears to have a negative effect upon restoration progress.
- Some areas are affected by burst edge effects which are a feature of the Sentinel-1 dataset meaning some pixels are unreliable.
- Peat Extraction sites generally show a strong negative trend, in peatland surface motion.
Site Summary
Long-term Motion (Linear)
The South Lanarkshire focus area (Fig.A5) covers areas of peat extraction and afforested peatland. Carnwath moss is also dissected by a railway cutting. Areas of older peat extraction in the area show a general subsidence trend during the period examined. The area of current extraction shows a noisier signal but still shows a slight subsidence trend. Previously forested areas of Carnwath moss are generally stable to the east of the railway line. However adjacent to the railway and easternmost margins the peatland shows a clear subsidence trend. To the west of the railway line, the area experienced subsidence over the same period, this may reflect a combination of the legacy of felling on this site and the disruptive effect of the railway on the hydrology of this part of the peatland. The northernmost part of Carnwath moss appears to most stable, likely due to the lack of forestry. Overall Carnwath moss appears to show a patchier recovery compared to Flanders Moss with clear areas of persistent subsidence. This is also characteristic of other peatland sites in the area such as Braehead Moss, Cranley Moss and Ryeflat moss (Fig. A12).
Manual Classification of time series characteristics
At the South Lanarkshire sites (Fig. 15) condition is dominated by condition class 2 and 3 within restoration sites, with areas of Class 1 associated with recent peat extraction or unrestored areas. This shows that the condition of these sites is in general more degraded than Flanders Moss but is showing signs of restoration progress. There are two linear features which crosscut the site approx. E-W which are artefacts of burst edges in the primary satellite data. These produce a series of misleading results which are visually obvious but require contextual information to explain, for example at Ryeflat moss over active peat extraction, a line 2 pixels deep shows odd time series with characteristics of a class 1 but with positive trend. This is unusual and is also not seen within the long-term time series, leading to the conclusion that this is a processing artefact. This may be resolved by processing data from a different orbit.
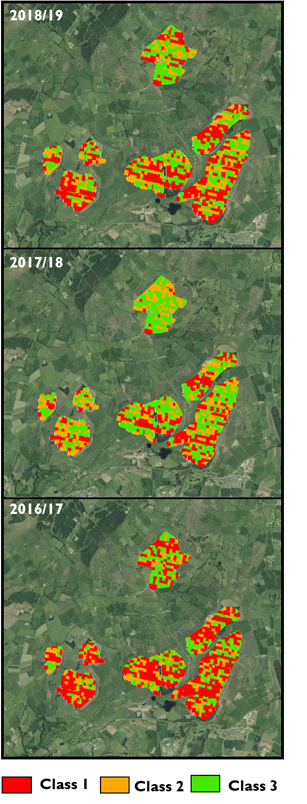
Red = Class 1 (No Recovery), orange = Class 2 (Minor Recovery), Green = Class 3 (Major Recovery).
The maps illustrate a general improvement post 2016/17 and they also show east-west linear features that are an artefact of the InSAR processing.
East Kilbride
The East Kilbride Focus site contains a number of lowland raised bogs subject to restoration, peat extraction and agricultural usage.
Key Findings
- Peatland surface motion trends show a generally degraded trend with subsidence at most sites and limited seasonal peatland surface motion.
- Where present seasonal peatland surface motion is like that seen elsewhere.
- Some core areas are in better condition and show characteristics typical of wetter low-density peat however, these are small in scale.
- Evidence of peats with marginal characteristics (autumn peaks, moderate amplitude, stable) are almost absent in this focus area.
Site Summary
Long-term Motion (Linear)
The East Kilbride focus area (Fig. A6) covers several raised peatlands including Langlands Moss and Blantyre Muir to the north and several peat extractions sites and forested peatlands. Over the period studied the sites display relatively high subsidence rates particularly in areas under restoration such as Langlands. In the recent peat workings subsidence is less pronounced and worked out areas show stability. Older peat workings and forested areas to the south show a lower more diffuse subsidence trend likely reflecting denser more degraded peat. The InSAR-derived ground motion data also indicates that the area of peat to the south was once much larger with the peat areas being joined as one peatland unit.
Manual Classification of time series characteristics
The East Kilbride peatlands tend to show more erratic time series, which are more difficult to classify, but generally, these conform with Class 1 and 2 characteristics with small clusters of better condition peat. These sites also show the most diffuse margins of the raised peatland focus sites with peatland characteristics generally gradually dissipating rather than showing clear marginal conditions. This reflects a fragmentation of the original peat system and the intensity of historic management. Another issue at these sites is the small size of the sites adjacent to quite different land usages, e.g. forested, agricultural. This means that the pixel footprint often covers both restored peatland and agriculture, which leads to a mixed signal at the peatland margin.
Arran
The Arran site contains areas of slope peatland previously subject to drainage and contains areas of restoration.
Key Findings
- Sites are mixed with core areas of stable peatland fringed by marginal areas which show pronounced subsidence.
- Restoration sites appear to show progress with some sites showing characteristics ‘near-natural’ slope peats.
- Peatland surface motion time series characteristics display a similar range to those observed on all other sites, with the exception of peak timing which is slightly advanced compared to more easterly sites.
Site Summary
Long-term Motion (Linear)
Long-term peat surface motion across the Arran focus site (Fig. A7) generally ranges from -2 to -8 mm/yr. Peat surface motion defines core areas of stable peat fringed by areas of increasing subsidence at the peatland margins and adjacent to drainage (natural or anthropic) within both InSAR products. This is to be expected as these areas tend to be more easily accessed and subject to more intensive management.
Areas of low thickness/no peat are characterised as stable. Some areas defined as peatland on the peat extent map show little long-term motion. When these were investigated further using visual imagery these correlate with areas of limited peat thickness with exposed substrate or can be seen to be lacking peatland vegetation. In general, peat surface motion shows diffuse margin to the peatlands on Arran, possibly reflecting a continuum from peat to mineral soil. Peatland Action sites for which peat depth has been given show a mixed signal with subsidence ranging from -3 to -6mm/yr. This would represent moderate to high subsidence rates which would be expected on sites in the early stages of restoration.
Manual Classification of time series characteristics
On Arran, sloping sites, are mostly in class 2 and 3. Peak timing on these sites indicates that they are on a trajectory towards the naturally drier end of the peat spectrum with autumn peaks and lower amplitude seasonal oscillations as would be expected for this landscape setting. Overall examination of long-term motion over the restoration sites on Arran indicate that the Peatland Action sites are showing positive signs of restoration compared to adjacent unrestored sites but show varying degrees of progress towards stabilisation.
Islay
The Islay site contains an area of peatland subject to past drainage and currently under restoration.
Key Findings
- Peatland margins show greater subsidence than more central areas of the peatland.
- Peat surface motion characteristics display a similar range of characteristics to those elsewhere with the exception of peak timing which is slightly advanced compared to more easterly sites.
- Condition is generally degraded although seasonal peat surface motion is still present at most sites.
- Restoration sites are showing progress with the Kinnabus displaying more favourable characteristics.
- Both restoration sites show greatest progress away from the peatland margins.
Site Summary
Long-term Motion (Linear)
On Islay, long-term trends of peat surface motion (and peat distribution) appear to be topographically controlled (Fig. A8). Greatest subsidence is usually observed around peatland margins with areas of stability located in the peatland centre. The Kinnabus site peat surface motion was stable over both observation periods (-2 to +2mm/yr). Whereas, at the shallower Asabus site, peat surface motion is more mixed with areas of rapid subsidence predominating (mean -7mm/yr).
Manual Classification
Classification over the two restoration sites on Islay (Fig. 16) shows that the sites show characteristics in Class 1 and 2 with the southernmost site being in slightly better condition. The best condition pixels are often further from the peatland margins adjacent to sites with more limited evidence of past drainage.
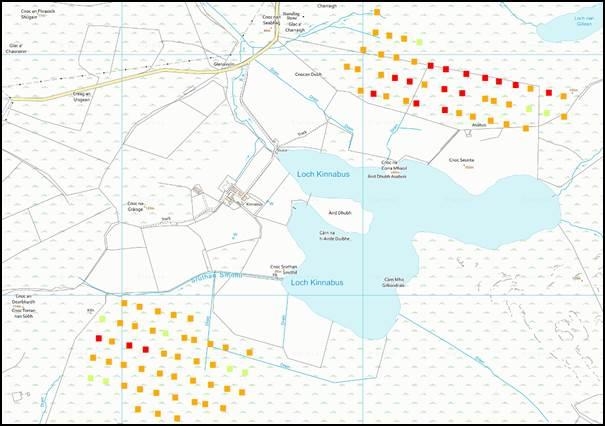
Figure 16. Manual Classification of two peatland restoration sites on Islay for the year 2018/19. Red = Class 1 (No change), Orange = Class 2 (Minor Change), Green = Class 3 (Major Change).
Lewis
The Lewis site contains a large area of blanket peatland with restoration at some sites.
Key Findings
- In Lewis long-term motion trends appear to pick out underlying landscape features and areas of deep peat.
- Areas of forestry and felled forestry show elevated subsidence rates.
- Comparison of trend data from the drought period with longer term data may delineate areas of deep peat.
- Examination of the Loch Orasaigh site shows lower rates of subsidence than adjacent unrestored sites which is indicative of positive progress.
Site Summary
Long-term Motion (Linear)
Detailed examination of the Lewis focus area (Fig. A9) shows a mosaic of high and low subsidence areas following structural and topographic depressions within the landscape. Areas of greatest subsidence appear associated with depressions and low-lying areas adjacent to lochs. Examination of other areas in N. Scotland (Forsinard) shows that during the drought the areas with highest subsidence were either the areas of deepest peat or the most degraded areas. As these areas are associated with pool systems it is likely that these areas of subsidence correspond with areas of deep dynamic peat. This drought effect might be useful for delineating peat thickness. Peats over topographic highs are likely to be thinner or denser and less mechanically responsive to the hydrological drawdown associated with the 2018 drought. This effectively provides a method of determining underlying topography and may give an indication of peat depth. Another observation from this area is that it is classified as almost entirely peat however areas to the SW of the focus area were very stable during the drought period which is characteristic of mineral soils. The Loch Orasaigh Peatland Action site in the SE of the focus area shows evidence of peat cutting (Appendix Fig. 13B). The site is stable to slightly subsiding (-2mm/yr) over the period examined apart from a hot spot to the west of the site (-8mm/yr) which is indicative of positive progress.
Shetland
The Shetland site covers areas of upland blanket peatland including areas of past peat cutting and drainage.
Key Findings
- The Shetland focus site shows peat surface motion (and peat distribution) is highly topographically controlled with more stable peats in upland areas.
- Subsidence is greatest adjacent to natural and manmade drainage.
- Restoration sites show lower subsidence rates than adjacent unrestored peatland.
Site Summary
Long-term Motion (Linear)
Over the Shetland focus area (Fig. A10) ground motion appears to be topographically / structurally controlled by a series of ridges and valleys trending N-S. Areas of greatest peat surface subsidence are located on gentle slopes and at the base of the valleys. These may reflect either areas of deeper, less dense wetter, more mechanically responsive peatland located at hydrologically favourable points in the landscape or proximity to drainage/increased pressure due to accessibility. Over upland areas, InSAR-derived ground motion shows a trend of smaller, highly localised areas of subsiding peatland surrounded by large areas of stable peatland. This likely reflects areas of deep peat infilling depressions within the landscape, surrounded by thin or degraded, denser/compacted peat or peaty soils over topographic highs and areas of drainage. This mosaic can be seen within the peat depth data from the East Kames Peatland Action site in the area with deeper areas surrounded by shallower peat. Areas of deeper peat in the east of the site show greater subsidence values (~-7mm/yr vs. 0 to -2mm/yr) than thinner areas. This site also shows increasing stability to the west of the site, which may be a response to restoration measures, particularly drain blocking by keeping water levels high during the drought period.
Evaluation and Discussion
Suitability of the InSAR products for a national scale peat condition monitoring tool
Linear (Long-term trend in surface motion)
Examination of the focus sites demonstrates that there are several practical considerations when using long-term trends in peat surface motion to examine peatland condition, this shows:
- InSAR coverage using the ISBAS InSAR technique provides almost complete coverage across all focus areas.
- Missing data over peatland is usually associated with either very steep topography (radar shadow), loss of coherence (very dense forestry) or features of the primary dataset e.g. burst edge effects. These represent a small percentage of the process area but if required for specific sites could be partially resolved by processing using a different orbit (e.g. ascending to descending).
- Trends in ground motion are generally comparable over the short-medium term between products covering similar time periods and different spatial scales (20m vs 80m pixel size).
- Deformation is more easily demarcated using a 20m product and may be more useful for determining a rough estimate for the zone of influence of peatland restoration/management e.g. drainage.
- Time period selection is important depending on intended use, shorter 1 to 2 year time series are prone to influence of extreme weather events and therefore c. 5 years will provide a more reliable baseline. However, if the effects of a specific event e.g. drought, is required, a shorter time series might be more appropriate.
- Long-term subsidence trends give a qualitative indication of peatland condition, however sites with similar subsidence may not be in a similar condition and subsidence alone would require local validation to be used more quantitatively.
- Classification and/or interpretation does not require use of thresholds, but thresholds can be applied if rough condition estimates are required.
At a national scale, several observations can be made regarding the behaviour of peatland sites over the past 5 years using long-term trends, these are:
- Long-term trends in peat motion can often delineate areas of long-term peat restoration relative to adjacent ‘unrestored’ sites, usually by showing lower subsidence or stable conditions, however this relatively unsensitive during the early stages of restoration.
- Sites known to be in good condition show stability and sites known to be in degraded condition subsiding.
- The technique is good at detecting ‘hotspots’ of peatland subsidence, indicative of restoration failure (e.g. drain blocks to the SE of Flanders Moss) which may be useful for targeting interventions.
- The 2018 drought had a national effect with both the most degraded and best condition sites showing the greatest subsidence. Good condition sites showed stability over the long-term whereas degraded sites did not. The difference between drought-dominated and longer-term product may be useful for delineating areas of deep peat in good condition.
- Examining time since intervention at Forsinard and Flanders Moss shows a clear trajectory towards peat surface growth over the past twenty years, with more modern techniques showing up to an 8-year improvement in recovery time over older techniques.
Overall, long-term peat surface motion is a quick scoping tool for assessing approximate peatland condition but due to the reasons outlined above is unreliable for more in-depth analysis of peatland condition.
Manual Classification of Peatland surface motion time series
The following conclusions can be made regarding the national scale variability of ‘peatland surface motion’ characteristics examined in this study:
- Peatland surface motion characteristics are generally consistent across all focus sites, with slight shifts in peak timing associated with variations in annual precipitation. Latitudinal temperature differences over Scotland appear not to have a large-scale impact on peatland surface motion characteristics although precipitation gradients cause slight variations in peak timing between east and west.
- Good condition peats are stable or growing and show clear seasonality, with characteristic peak timing and amplitude depending on landscape position.
- Degraded peats show subsidence and little evidence of seasonal cyclicity of the peat surface.
- Sites with a history of restoration show a transitional signal with progress towards ‘near-natural’ end members dependent on time since and intensity of intervention and starting condition.
- Raised peatlands and blanket peatland show similar controls on peatland surface motion, with the greatest difference related to the intensity of previous management rather than intrinsic differences between the different peatland sites.
- Many raised bogs appear to have highly degraded or missing marginal peats which is not often seen in blanket peatland sites. This leads these sites to have diffuse margins with the most degraded showing erratic time series, indicating limited long-term water storage capacity.
- Some open peatland sites with drain blocking (Talaheel, Dalchork, Flanders Moss) appear to have shown greater resistance to the effect of the 2018 drought event than nearby ‘near-natural’ sites which might be a result of greater water storage capacity. This effect may be a short-term effect, which diminishes as restoration progress continues or might represent a permanent stabilisation of the carbon store.
Overall, this indicates that the assumptions regarding peatland surface motion characteristics are relatively universal over Scotland with variation related to water balance and past management intensity. As this study did not cover other peatland types such as fens more validation would be needed to assess these areas.
The manual classification approach can produce annual maps of peatland condition, using a simple classification scheme based on progress towards a near-natural state. These maps appear to make sense, across the focus sites. However, there are issues with the manual approach such as:
- It is very time intensive with 500 pixels for 4 years taking 2-3 hours to complete, with larger areas difficult to complete.
- It is a coarse approach and is dependent on the visibility of general trends. This makes it more difficult where interannual variation is sometimes hard to distinguish due to noisiness of some time series. This creates the potential for bias and misclassification.
Consequently, this makes the manual approach unsuitable for large scale condition mapping and an automated approach desirable. However, the manual approach is still useful as a validation step and a bridge between contextual site data and the results of a future automated product.
Automatic Classification
Automating the manual classification using the Euclidian distance from a desired endmember within a 3D plot of peatland motion characteristics provides the most promising basis for a national scale tool. The test case at Dalchork appears to show similar results to the manual classification approach and provides a quantitative measure of how far along the trajectory towards a desired endmember a pixel has reached in a particular year. This could also be adapted if required to examine progress away from a starting state.
This approach has several advantages such as:
- Much quicker than manual techniques (20-30 mins for focus area vs 3 hours for single polygon).
- Quantitative technique, less room for bias and can compare with near-natural control sites on an annual basis.
- Can work with noisier datasets which are harder to classify.
- Has the potential to compare data with multiple different endmembers or intermediate peatland surface motion states to determine condition class more reliable.
Overall, this approach is promising and could form the basis for a national scale product however further work is required to produce a practical and consistent product, as well as discussions regarding thresholding and definitions of success.
Locating areas of peat instability
Examining peatland surface motion parameters over Dalchork shows that:
- High amplitude shows a close correspondence with areas with past evidence of peat instability.
- These areas appear to be focussed on steep NE-E Facing steep slopes.
Overall, amplitude may provide a means of determining peatland instability risk over a landscape, but further work is required to quantify this. Combining amplitude with time series of E-W horizontal (derived by using ascending and descending orbits over the same area) and vertical motion over areas known to have failed within the Sentinel-1 era may provide a means of identifying early warning signs of large-scale failure.
Conclusions
Future Development
This report demonstrates the potential of peatland surface motion, measured by InSAR to quantify both restoration progress and peatland condition on a local to national scale. However, this report is limited to 10 focus sites using currently available contextual data. To realise this potential will require further development beyond this proof of concept stage. Key steps in this development are:
- Process automation – this would need to be undertaken in conjunction with Peatland Action and other stakeholders to establish a brief for the automated process.
- Double blind testing – using an agreed classification scheme the method and classifications should be tested and refined on Peatland Action sites and other appropriate peatland sites.
- Alignment with recognised peatland classification schemes – several classification schemes are available and appropriate alignment of the surface motion characteristics with these schemes (e.g. Peatland Code) will enable more effective application of this method.
It is likely that this process which requires the gathering of extensive field data and a yet to be specified automated process would take a further 2 to 3 years to complete.
Other applications
In addition to the applications specifically targeted in this report there is the potential for many other applications which are at an earlier stage of development. These are outlined below.
Carbon accounting
InSAR condition classes should be readily calibrated to sites with designated Peatland Code condition categories and their associated emission factors. In principle this should enable high resolution carbon accounting. Current flux tower data is not entirely sufficient for this purpose as it tends to focus on complex site under restoration and does not adequately sample the end member peatland conditions identified by surface motion characteristics. Additional flux data may therefore be required if the method is to realise its full potential. Another approach would be to calibrate the InSAR metrics with water level data and then use established relationships between water level and emissions to provide estimates.
Quantifying fire risk
The NERC Fire Blanket project is currently examining the application of InSAR condition metrics to the 2019 Flow Country Fire in order to understand how prior condition affects A) the risk and intensity of burning and B) rate of recovery post fire. This will provide a first step to understanding how InSAR might be used as a fire risk mitigation tool.
Impact of extreme climate events/climate change
As part of the Leverhulme Research Leadership Award, we will examine how events such as the 2018 drought event affected peatland resilience. This will use InSAR to identify which parts of the landscape are most vulnerable to the effects of extreme events such as droughts and climate change. It will also identify areas where resilience is greater and examine what ecohydrological characteristics characterise these areas. It will also attempt to identify how different peatland restoration techniques contribute to future climate resilience.
Statistical methods to quantify investment outcome
A NERC Landscape Decisions grant is currently developing novel statistical techniques to quantify peatland condition at the landscape scale and place confidence measures on spatial and temporal changes within a landscape. The aim being to be able to say with a known confidence that a given area has changed condition as a consequence of a specific intervention over a specified period. This could provide outputs such as maps showing percentage progress to a defined endpoint and rates of improvement.
Effect of infrastructure design on peatland condition e.g. roads, windfarms etc.
Work has shown that floating roads and infrastructure development can have a negative effect on peatland condition (Clutterbuck et al., 2020). This appears to be related to the orientation of the development relative to flow direction within the peat. This effect replicates detailed ground studies carried out in Canada (Saraswati and Strack, 2019). This has also been observed in the Flow Country (Fig. 17). If this is possible, InSAR may provide a cost-effective means of monitoring the impact of development.
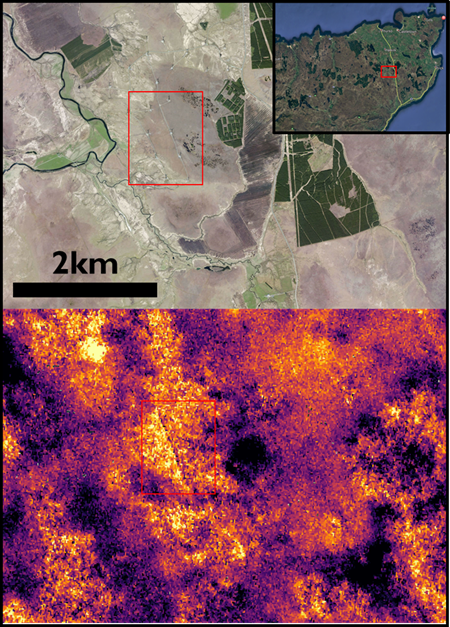
Figure 17. Optical and InSAR image of peat surface motion over the Causeymire Windfarm, showing the impact of a floating road running perpendicular to flow.
Combination with different EO platforms
Although a sensitive and responsive indicator of peatland condition, surface motion is related to both ecology, hydrology, and peat structure. In combination with other EO techniques on appropriate timeframes it has the potential to contribute to a more holistic view of peatland condition, including vegetational change.
Relationship with different soil classification types
This study compares raised and blanket peatland. Other peatland soils are not covered and would benefit from further work examining the effectiveness of InSAR in monitoring motion e.g. fens, flushed vs. unflushed blanket bogs, slope peats. Also, the relationship between shorter term events on parameters such as amplitude and peak timing.
Defining Area of Impact
This study focussed upon the immediate area of intervention, however using the automated approach should be able to determine the area of influence of a particular intervention within a certain setting. This may allow strategic placement of interventions to have maximum impact on restoration progress with least disturbance.
Funding future development
The breadth of applications of potential value to multiple stakeholders means that future development of this technique would be better funded via a consortium of interested parties. This would be a more effective for several reasons: 1) It is more cost effective to process large areas than small area; 2) it would be better to develop a method that aligns with multiple stakeholder needs; 3) development costs would be distributed.
References
Almendinger J.C., Almendinger J.E. and Glaser P.H. 1986. Topographic fluctuations in across a spring fen and raised bog in the Lost River Peatland, northern Minnesota. Journal of Ecology 74, 393-401.
Alshammari L., Large D.J., Boyd, D.S., Sowter S., Anderson R., Andersen R. and Marsh S. 2018. Long-term peatland condition assessment via surface motion monitoring using the ISBAS DInSAR technique over the Flow Country, Scotland. Remote Sensing, 10, 1-24.
Alshammari, L., Boyd, D.S., Sowter, A., Marshall, C., Andersen, R., Gilbert, P., Marsh, S. and Large, D.J. 2020. Use of surface motion characteristics determined by InSAR to assess peatland condition. Journal of Geophysical Research: Biogeosciences, 125.
Bateson, L., Cigna, F., Boon, D. and Sowter, A. 2015. The application of the Intermittent SBAS (ISBAS) InSAR method to the South Wales Coalfield, UK. International Journal of Applied Earth Observation and Geoinformatics, 34, 249-257.
Becker, R.A., Chambers, J.M. and Wilks, A.R. 1988. The New S Language. Wadsworth & Brooks/Cole.
Baden, W., and Eggelsmann, R. 1964. Der Wasserkreislauf eines nordwestdeutschen Hochmoores. Verleg Wasser und Boden, Hamburg, Germany.
Chen, C.W. and Zebker, H.A. 2001. Two-dimensional phase unwrapping with use of statistical models for cost functions in nonlinear optimization, Journal of the Optical Society of America. A, 18, 338-351.
Cigna, F. and Sowter, A. 2017. The relationship between intermittent coherence and precision of ISBAS InSAR ground motion velocities: ERS-1/2 case studies in the UK. Remote Sensing. of the Environment, 202, 177-198.
Clutterbuck, B., Burton, W., Smith, C. and Yarnell, R. W. 2020. Vehicular tracks and the influence of land use and habitat protection in the British uplands. Science of the Total Environment, 737, 140243.
Fiaschi, S., Holohan, E.P., Sheehy, M. and Floris, M. 2019. PS-InSAR Analysis of Sentinel-1 Data for Detecting Ground Motion in Temperate Oceanic Climate Zones: A Case Study in the Republic of Ireland. Remote Sensing 11, 348.
Fritz C., Campbell D.I. and Schipper L.A. 2008. Oscillating peat surface levels in a restiad peatland, New Zealand – magnitude and spatiotemporal variability. Hydrological Processes, 22, 3264-3274.
Ghil M., Allen M.R., Dettinger M.D., Ide K., Kondrashov D., Mann M.E., Robertson A.W., Saunders A., Tian Y., Varadi F. and Yiou P. 2002. Advanced spectral methods for climatic time series. Reviews of Geophysics, 40, 1-40.
Glaser P.H., Chanton J.P., Morin P., Rosenberry D.O., Siegel D.I., Ruud O., Chasar L.I. and Reeve A.S. 2004. Surface deformations as indicators of deep ebullition fluxes in a large northern peatland. Global Biogeochemical Cycles, 18.
Gong, W., Thiele, A., Hinz, S., Meyer, F.J., Hooper, A. and Agram, P.S. 2016. Comparison of small baseline interferometric SAR processors for estimating ground deformation. Remote Sensing, 8, 330.
Howie S.A. and Hebda R.J. 2018. Bog surface oscillation (mire breathing) a useful measure in raised bog restoration. Journal of Hydrological Processes. 32, 1518-1530.
Hutchinson J. N. 1980. The record of peat wasteage in the East Anglian fenlands at Holme Post, 1848-1978 A.D., Journal of Ecology, 68, 229-249.
Hyndman, R., Athanasopoulos G., Bergmeir C., Caceres G., Chhay L., O'Hara-Wild M., Petropoulos F., Razbash S., Wang E., Yasmeen F., R Core Team., Ihaka R, Reid D., Shaub D., Tang Y., and Zhou Z. 2020. Forecast v.8.12’ R package.
Kennedy, G.W., and Price, J.S. 2005. A conceptual model of volume-change controls in the hydrology of cutover peats. Journal of Hydrology, 302, 13-25.
Kulczynski, S. 1949. Peat bogs of Polsie. Memoires de l’Academie Polenaise des Sciences et des Lettres. Class de Sciences Mathematiques et Naturelles. Serie B: Sciences Naturelles. No. 15.
Kurimo, H. 1983. Surface fluctuation in three virgin pine mires in eastern Finland. Silva Fennica, 17, 45-64.
Mustonen, S.E. and Seuna, P. 1971. Metsaojitusksen vaikutuksesta suon hydrologiaan. In: Publication 2, National Board of Waters, Finland, Water Research Institute. pp. 1-63.
Osmanoğlu, B., Sunar, F., Wdowinski, S. and Cabral-Cano, E. 2016. Time series analysis of InSAR data: methods and trends. Journal of Photogrammetry and Remote Sensing, 115, 90-102.
Price, J.S. 2003. Role and character of seasonal peat soil deformation on the hydrology of undisturbed cutover peatlands. Water Resources Research, 39, 1214.
Price, J.S. and Schlotzhauer, S.M. 1999. Importance of shrinkage and compression in determining water storage changes in peat: the case of a mined peatland. Hydrological Processes, 13, 2591-2601.
Price, J.S., Cagampan J. and Kellner, E. 2005. Assessment of peat compressibility: is there an easy way? Hydrological Processes, 19, 3469-3475.
R Core Team. 2013. R: A language and environment for statistical computing. R Foundation for Statistical Computing, Vienna, Austria.
R Core Team. 2020. ‘Stats v3.6.2’ R package.
Reeve A.S., Glaser., P.H., and Rosenberry D.O. 2013. Seasonal changes in peatland surface elevation recorded at GPS stations in the Red Lake Peatlands, northern Minnesota, USA. Journal of Geophysical Research: Biogeosciences, 118, 1616-1626.
Roulet N.T. 1991. Surface level and water table fluctuations in a subarctic fen, Arctic and Alpine Research, 23, 303-310.
Saraswati, S. and Strack, M. 2019. Road Crossings Increase Methane Emissions from Adjacent Peatland. Journal of Geophysical Research: Biogeosciences, 124, 3588-3599.
Sloan, T.J., Payne, R.J., Anderson, A.R., Bain, C., Chapman, S., Cowie, N., Gilbert, P., Lindsay, R., Mauquoy, D., Newton, A.J. and Andersen, R. 2018. Peatland afforestation in the UK and consequences for carbon storage. Mires and Peat, 23, 1-17.
Sowter, A., Bateson, L., Strange, P., Ambrose, K. and Syafiudin, M.F. 2013. DInSAR estimation of land motion using intermittent coherence with application to the South Derbyshire and Leicestershire coalfields. Remote Sensing Letters, 4, 979-987.
Sowter, A., Amat, M.B., Cigna, F., Marsh, S., Athab, A. and Alshammari, L. 2016. Mexico City land subsidence in 2014-2015 with Sentinel-1 IW TOPS: Results using the Intermittent SBAS (ISBAS) technique. International Journal of Applied Earth Observation and Geoinformation, 52, 230-242.
Tampuu T., Praks J., Uiboupin R. and Kull A. 2020. Long-term Interferometric Temporal Coherence and DInSAR Phase in Northern Peatlands. Remote Sensing, 12, 1566.
Vautard, R. and Ghil, M. 1989. Singular spectrum analysis in nonlinear dynamics, with applications to paleoclimatic time series, Physica D, 35, 395-424.
Waddington., J.M., Kellner, E., Strack, M. and Price JS. 2010. Differential peat formation, compressibility, and water storage between peatland microforms: Implications for ecosystem function and development. Water Resources Research, 46.
Waddington, J.M., Morris, P.J., Kettridge, N., Granath, G., Thompson, D.K. and Moore, P.A. 2015. Hydrological feedbacks in northern peatlands. Ecohydrology, 8, 113-127.
Copyright statements for figures
- Figures 1-5, 11, 14: © University of Nottingham.
- Figures 6, 7, 13, 16: © University of Nottingham. Contains NatureScot data. Ordnance Survey basemap from Ordnance Survey Web Map Service (WMS), Scotland, Ordnance Survey, using EDINA Digimap Ordnance Survey Service <http://edina.ac.uk/digimap>, accessed 25th July 2020.
- Figures 8, 10: © University of Nottingham. Contains FLS data. Ordnance Survey basemap from Ordnance Survey Web Map Service (WMS), Scotland, Ordnance Survey, using EDINA Digimap Ordnance Survey Service <http://edina.ac.uk/digimap>, accessed 25th July 2020.
- Figure 9: University of Nottingham. Contains FLS data. Aerial basemap data from © Getmapping Plc Contains OS data © Crown copyright and database right (2010-2019). Ordnance Survey basemap from Ordnance Survey Web Map Service (WMS), Scotland, Ordnance Survey, using EDINA Digimap Ordnance Survey Service <http://edina.ac.uk/digimap>, accessed 25th July 2020.
- Figures 12, 15: © University of Nottingham. Contains NatureScot data. Aerial basemap data from © Getmapping Plc Contains OS data © Crown copyright and database right (2010-2019).
- Figure 17: © University of Nottingham. Aerial basemap data from © Getmapping Plc Contains OS data © Crown copyright and database right (2010-2019).
- Annex Figures A1-A9: © University of Nottingham. Aerial basemap data from © Getmapping Plc Contains OS data © Crown copyright and database right (2010-2019). Data from Carbon and Peatland 2016 map which is based on soil and land cover map data produced by the James Hutton Institute. Used with the permission of The James Hutton Institute. All rights reserved. River Shapefile data derived from © OpenStreetMap contributors. Contains Ordnance Survey data © Crown copyright and database right 2010-19. Licensed as CC BY-SA.
- Annex Figure A10: © University of Nottingham. Aerial basemap data from © Getmapping Plc Contains OS data © Crown copyright and database right (2010-2019). Data from Carbon and Peatland 2016 map which is based on soil and land cover map data produced by the James Hutton Institute. Used with the permission of The James Hutton Institute. All rights reserved.
1 Environmental Research Institute, University of the Highlands and Islands, Castle Street, Thurso, UK, KW14 7JD.
2 Nottingham Geospatial Institute, University of Nottingham, 30 Triumph Road, Lenton, Nottingham, UK, NG7 2TU.
3 Dept of Chemical and Environmental Engineering, University of Nottingham, Coates Building, Nottingham, UK, NG7 2RD.
Annex 1: Mean surface motion Maps for all sites
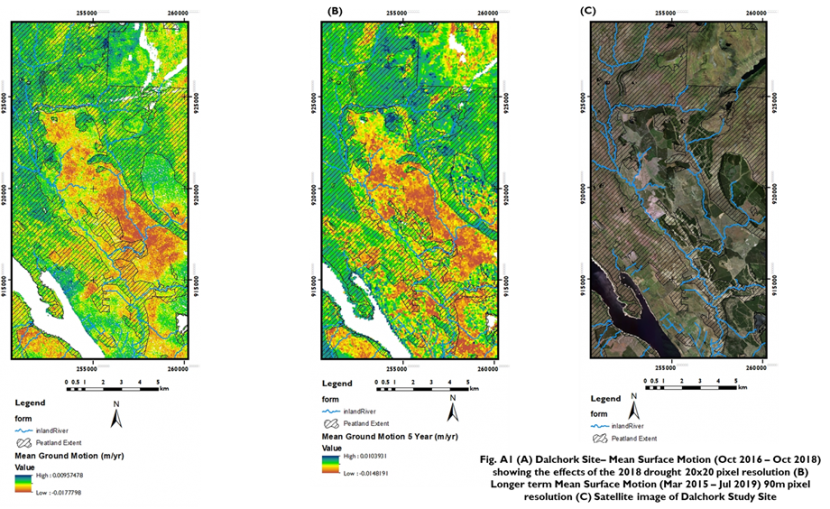
Image 19
Fig. A1 (A) Dalchork Site - Mean Surface Motion (Oct 2016-Oct 2018) showing the effects of the 2018 drought 20x20 pixel resolution (B). Longer term Mean Surface Motion (Mar 2015-Jul 2019) 90m pixel resolution (c) Satellite image of Dalchork Study Site.
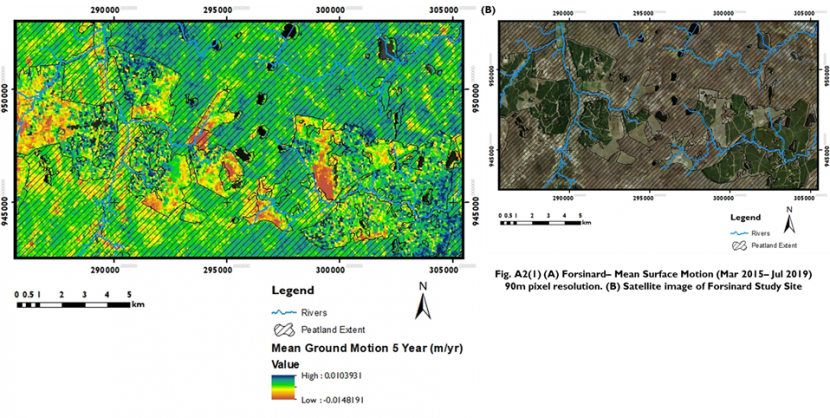
Image 20
Fig. A2(1) (A) Forsinard-Mean Surface Motion (mar 2015-Jul 2019) 90m pixel resolution. (B) Satellite image of Forsinard Study Site
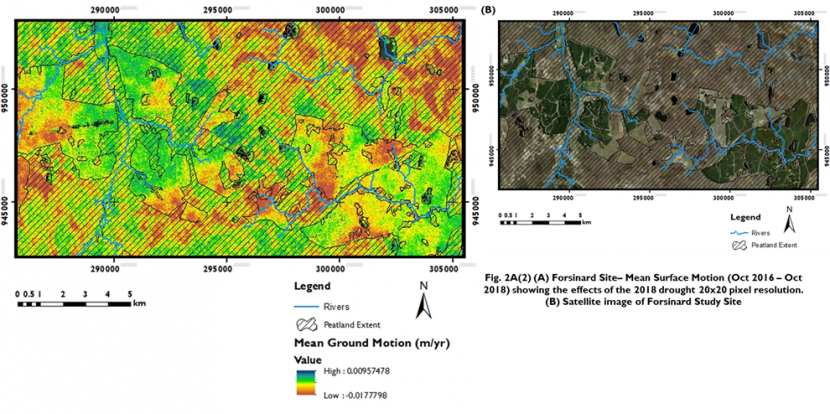
Image 21
Fig. 2A(2) (A) Forsinard Site-Mean Surface Motion (Oct 2016-Oct 2018) showing the effects of the 2018 drought 20x20 pixel resolution. (B) Satellite image of Forsinard Study Site.
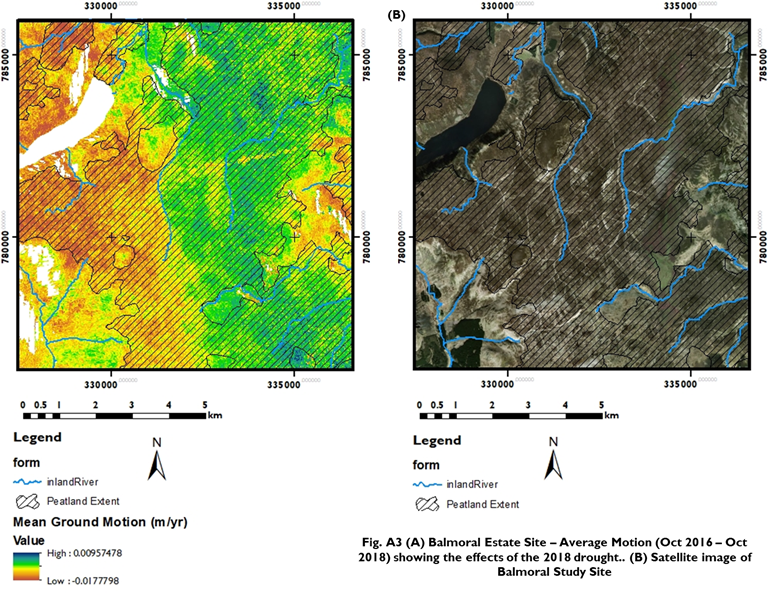
Image 22
Fig. A3(A) Balmoral Estate Site - Average Motion (Oct 2016-Oct2018) showing the effects of the 2018 drought. (B) Satellite image of Balmoral Study Site
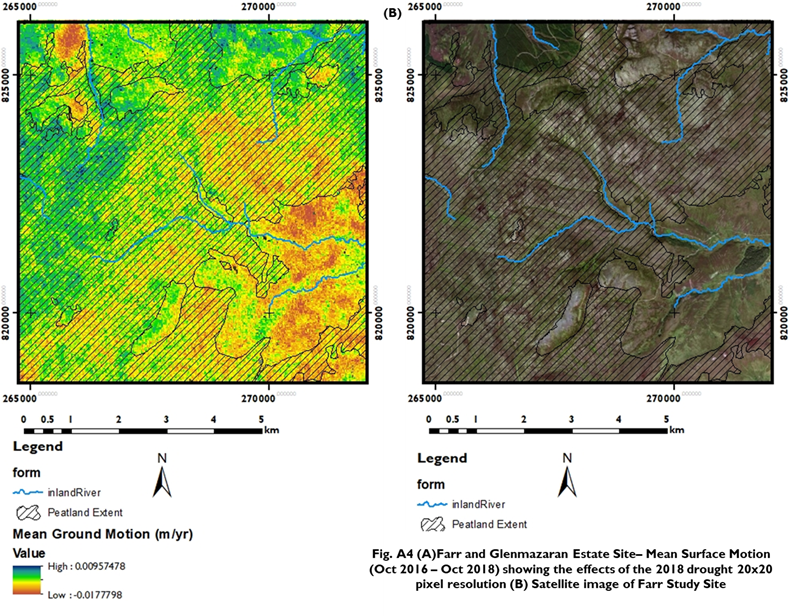
Image 23
Fig. A4(A) Farr and Glenmazaran Estate Site - Mean Surface Motion (Oct 2016-Oct 2018) showing the effects of the 2018 drought 20x20 pixel resolution (B) Satellite image of Farr Study Site.
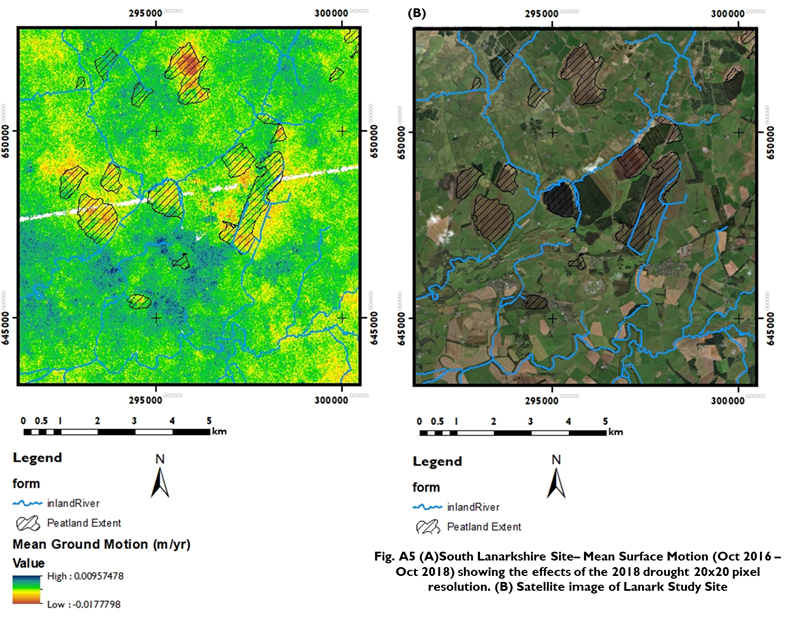
Image 24
Fig. A5(A) South Lanarkshire Site - Mean Surface Motion (Oct 2016-Oct 2018) showing the effects of the 2018 drought 20x20 pixel resolution. (B) Satellite image of Lanark Study Site.
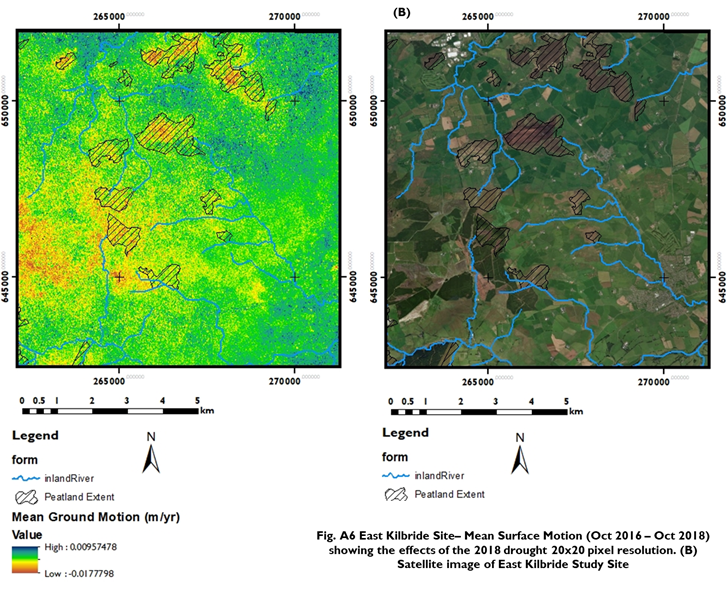
Image 25
Fig. A6 East Kilbride Site - Mean Surface Motion (Oct 2016-Oct 2018) showing the effects of the 2018 drought 20x20 pixel resolution (B) Satellite image of East Kilbride Study Site.
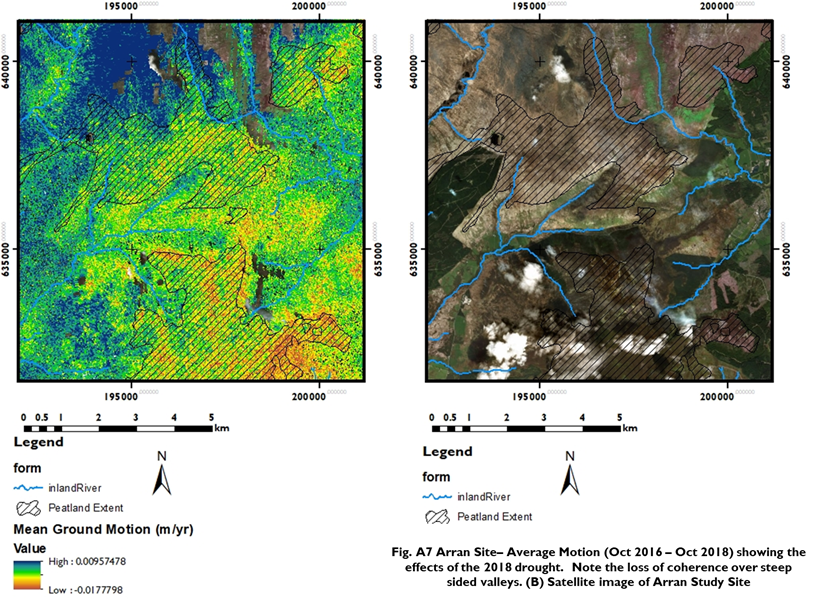
Image 26
Fig A7 Arran Site - Average Motion (Oct 2016-Oct 2018) showing the effects of the 2018 drought. Note the loss of coherence over steep sided valleys. (B) Satellite image of Arran Study Site.
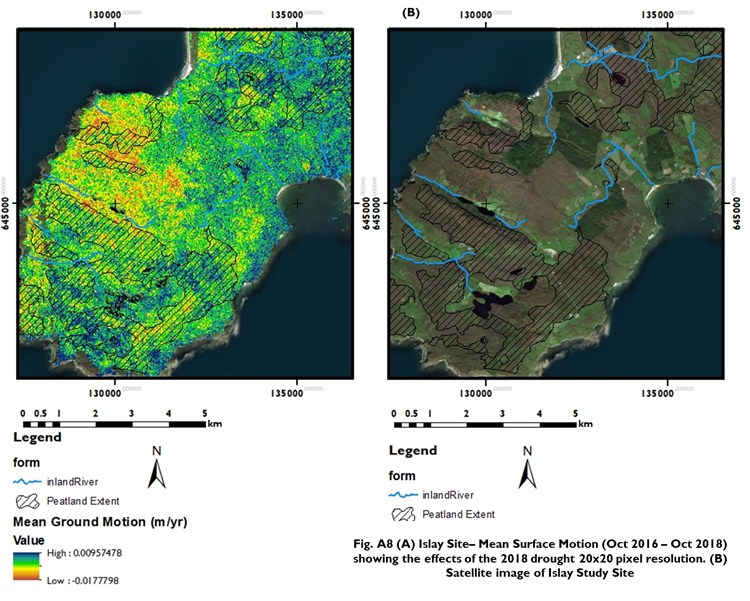
Image 27
Fig. A8(A) Islay Site - Mean Surface Motion (Oct 2016-Oct 2018) showing the effects of 2018 drought 20x20 pixel resolution. (B) Satellite image of Islay Study Site.
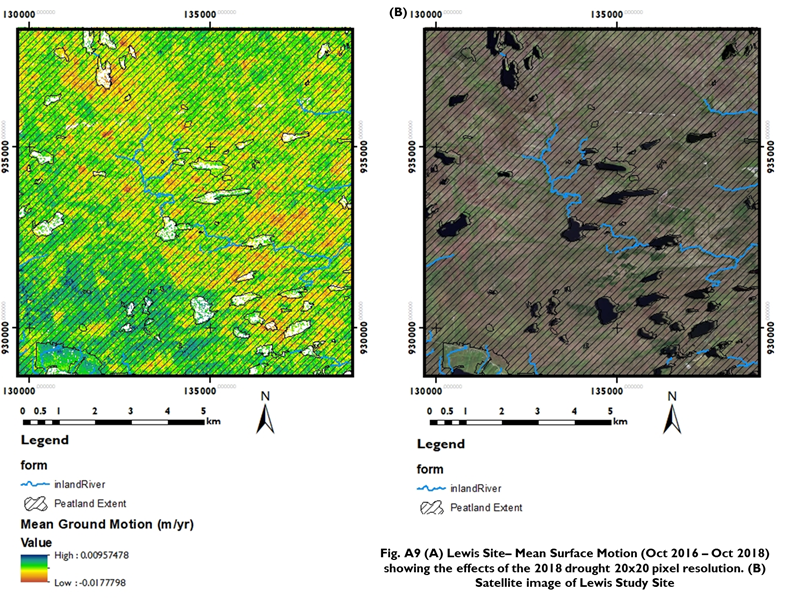
Image 28
Fig. A9(A) Lewis Site - Mean Surface Motion (Oct 2016-Oct 2018) showing the effects of the 2018 drought 20x20 pixel resolution. (B) Satellite image of Lewis Study Site.
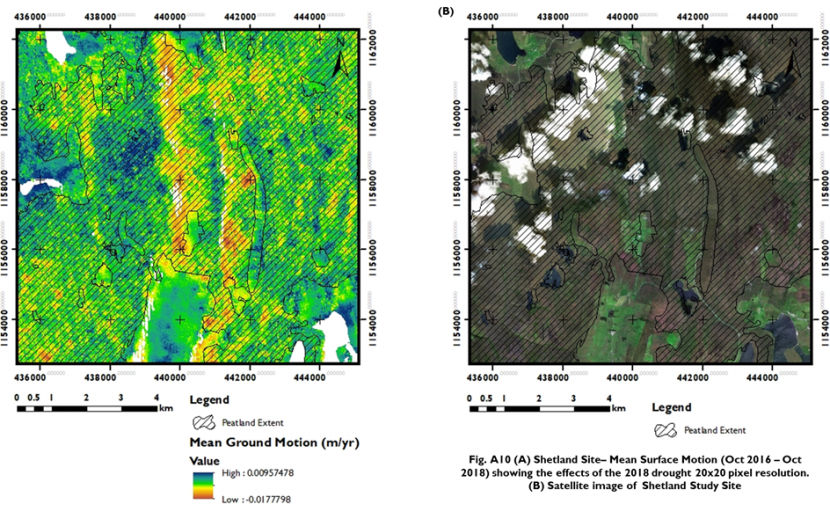
Image 29
Fig. A10 (A) Shetland Site - Mean Surface Motion (Oct 2016-Oct 2018) showing the effects of the 2018 drought 20x20 pixel resolution. (B) Satellite image of Shetland Study Site
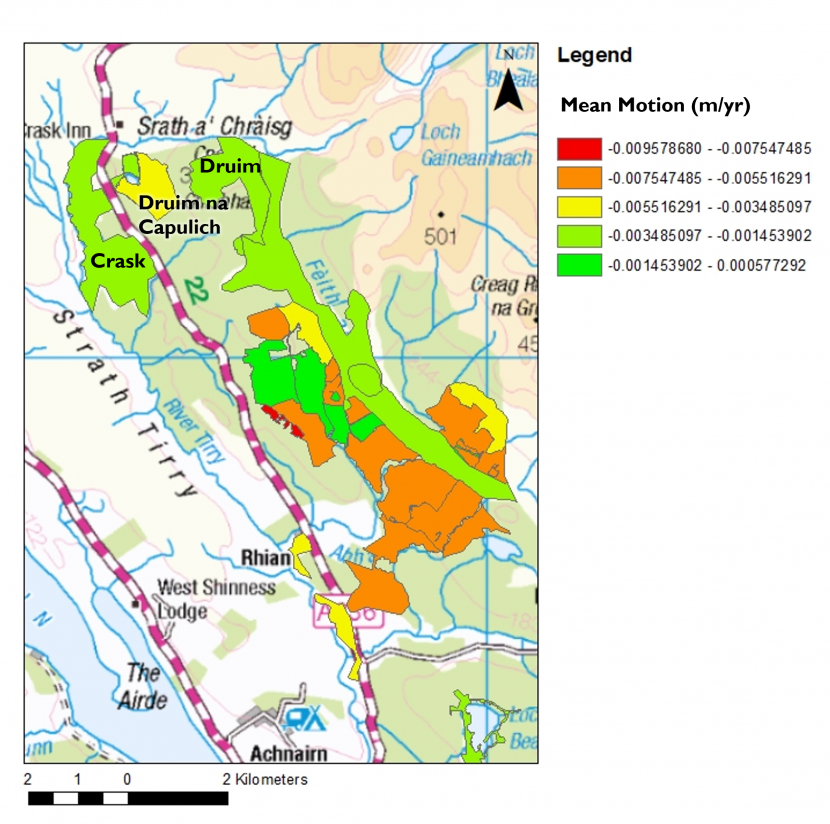
Reproduced by permission of Ordnance Survey on behalf of HMSO. © Crown copyright and database right 2021. All rights reserved. Ordnance Survey Licence number 100017908.
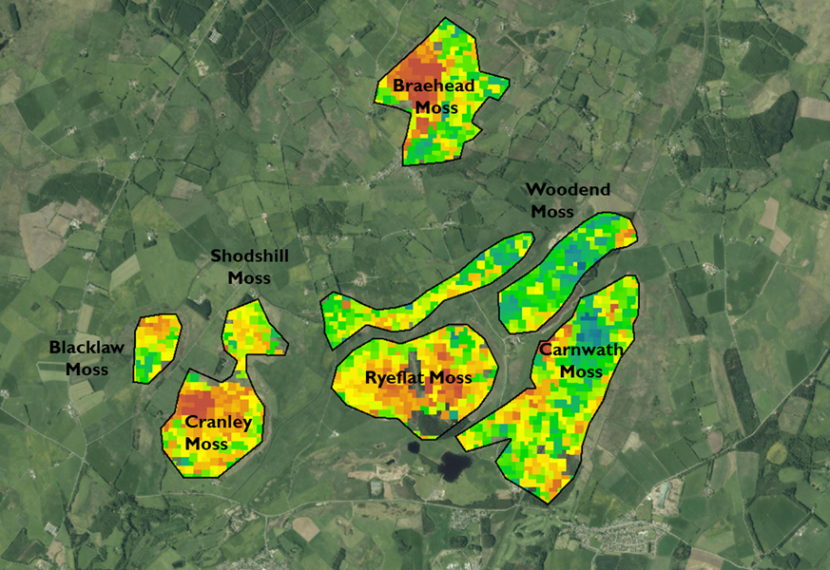
Reproduced by permission of Ordnance Survey on behalf of HMSO. © Crown copyright and database right 2021. All rights reserved. Ordnance Survey Licence number 100017908.
