NatureScot Research Report 1308 - Analysis of an InSAR “bog breathing” based classification of peatland condition relative to field observations in Cairnsmore of Fleet National Nature Reserve
Published: 2025
Authors: Andrew V Bradley (1), Emily Mitchell (2), Ian Dryden (2), Chris Fallaize (2), Md. Tariqul Islam (1), David J Large (3), Roxane Andersen (4) and Chris Marshall (4)
(1) Nottingham Geospatial Institute, University of Nottingham, 30 Triumph Road, Lenton, Nottingham, UK, NG7 2TU
(2) School of Mathematical Sciences, University of Nottingham, Nottingham NG7 2RD, UK
(3) Dept. of Chemical and Environmental Engineering, University of Nottingham, Coates Building, Nottingham, UK, NG7 2RD
(4) Environmental Research Institute, University of the Highlands and Islands, Castle Street, Thurso, UK, KW14 7JD
Cite as: Bradley, A.V., Mitchell, E., Dryden, I., Fallaize, C., Tariqul, M.D., Large, D.J., Andersen, R., and Marshall, C. 2025. Analysis of an InSAR “bog breathing” based classification of peatland condition relative to field observations in Cairnsmore of Fleet National Nature Reserve. NatureScot Research Report 1308.
Contents
- Keywords
- Background
- Main findings
- Acknowledgements
- Abbreviations
- Introduction
- Methods
- Results
- Quantitative comparison
- Discussion and recommendations
- Conclusion
- References
- Annex 1 – Annual classified InSAR condition map of Moss of Crombie
- Annex 2 – Field classification score generator files
- Annex 3 – Annual classified InSAR condition maps of Cairnsmore
- Annex 4 – Field observation data obtained at Cairnsmore
Keywords
Cairnsmore, surface motion, InSAR, validation, peatland condition, monitoring
Background
The purpose of this research is to:
- Develop a field survey method that can be used to test the validity of maps of peatland condition that were created using satellite radar measures of peatland surface motion.
- Test and refine a pre-existing peatland condition classification (Bradley et al., 2022) that was based on the relationship between peatland surface motion and condition observed in the Flow Country.
Peatland surface motion is a sensitive indicator of peatland condition and resilience. It is a mechanical response to changes in water storage that reflect a range of peatland properties including softness/stiffness, water table depth, plant functional type, land use history and topography. It also provides a measure of the ability of a peatland surface to track changes in the water table and hence minimise the risk posed by variable weather patterns and fire.
Previous work for NatureScot (Marshall et al., 2021) demonstrated that high (20 m) resolution maps of peatland condition derived from surface motion, can be created for large areas at low cost from satellite radar data using an interferometric synthetic aperture radar (InSAR) technique. The spatial extent and resolution of the classified data brings with it the need for an appropriate and sustainable validation technique based on easily documented field observations made by an observer walking the land rather than expensive and/or localised field instruments.
Main findings
- Peatland conditions encountered at Cairnsmore of Fleet NNR are more degraded than those in the Flow Country on which the classification and double-blind field validation methods were initially based.
- A revised InSAR classification was created that resolves the degraded range of peat conditions encountered at many peatland sites, including Cairnsmore and the Flow Country.
- This revised classification should be applicable to a wide range of peatlands across Scotland and can be refined using a machine learning approach.
- Separate classifications based on InSAR and field data identified corresponding differences in peatland condition.
- The app used for field classification was positively received, being convenient and user friendly.
- A guide needs to be provided to ensure consistency of field observations recorded using the app.
- Based on feedback and observation a new field classification method is proposed that addresses mutually exclusive inputs and includes co-dominance of species, and more refined observations of erosion, hydrology and peat depth.
- A correspondence between the revised InSAR classification and Tier 2 emission factors is proposed.
- The following future developments of this work are proposed:
- Use a machine learning approach to develop and refine the revised classification scheme using areas of known condition across Scotland.
- Apply the revised classification to a range of Peatland ACTION sites across Scotland.
- Shift the future focus of this work to quantification of change and test statistically robust change detection against areas with a known history of intervention.
- Consider quantifying the relationship between carbon emission factors and InSAR peat condition class.
Acknowledgements
In addition to NatureScot Peatland ACTION funding this work, we would like to acknowledge the NatureScot Peatland ACTION Data and Evidence team for supporting this research. The work was also partly supported by Natural Environment Research Council Grant NE/T010118/1. Roxane Andersen acknowledges funding from The Leverhulme Trust (RL-2019-002). Suzanne McIntyre, Neil McKie, Fraser Wilson from the Cairnsmore NNR, and Henk Pieter Sterk from Peatland ACTION are thanked for assisting with testing the app in the field. Bunloit Estate are thanked for allowing access to their land in order to assist with development of the field assessment tool.
Abbreviations
Application (app)
Interferometric Synthetic Aperture Radar (InSAR)
Linear Discriminant Analysis (LDA)
National Nature Reserve (NNR)
Introduction
As part of the ongoing development of InSAR as a tool for quantifying peatland condition at a national scale the next step was to produce and refine a peatland assessment tool that could be used to validate surface motion derived maps of peatland condition on various Peatland ACTION restoration sites. Three sites were chosen for this purpose, Cairnsmore of Fleet National Nature Reserve (NNR) (Dumfries and Galloway), Moss of Crombie (Aberdeenshire) and the Bunloit Estate (Inverness-shire). Our focus was constrained to Cairnsmore of Fleet NNR (hereafter referred to as Cairnsmore) in Dumfries and Galloway (Figure 1). The Bunloit Estate was visited as part of the development of the field assessment tool as it provided a contrast to the Flow Country, however, as plans for Peatland ACTION work on the site were not confirmed, no classified maps are reported. Classified maps for Moss of Crombie have been produced (Annex 1) but due to COVID restrictions no site visits were undertaken.

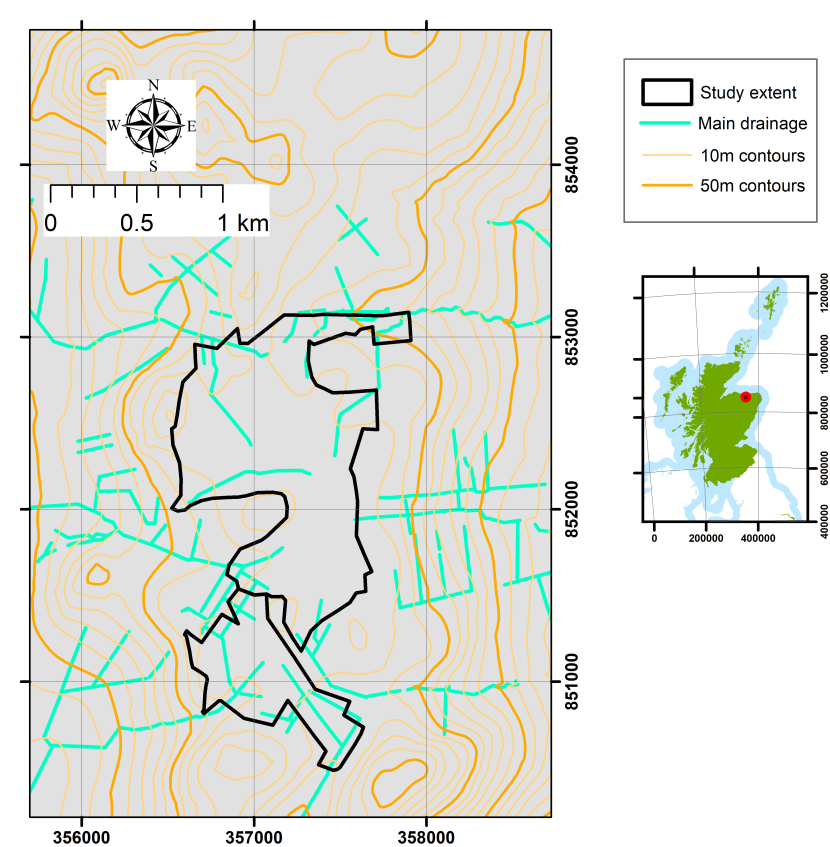
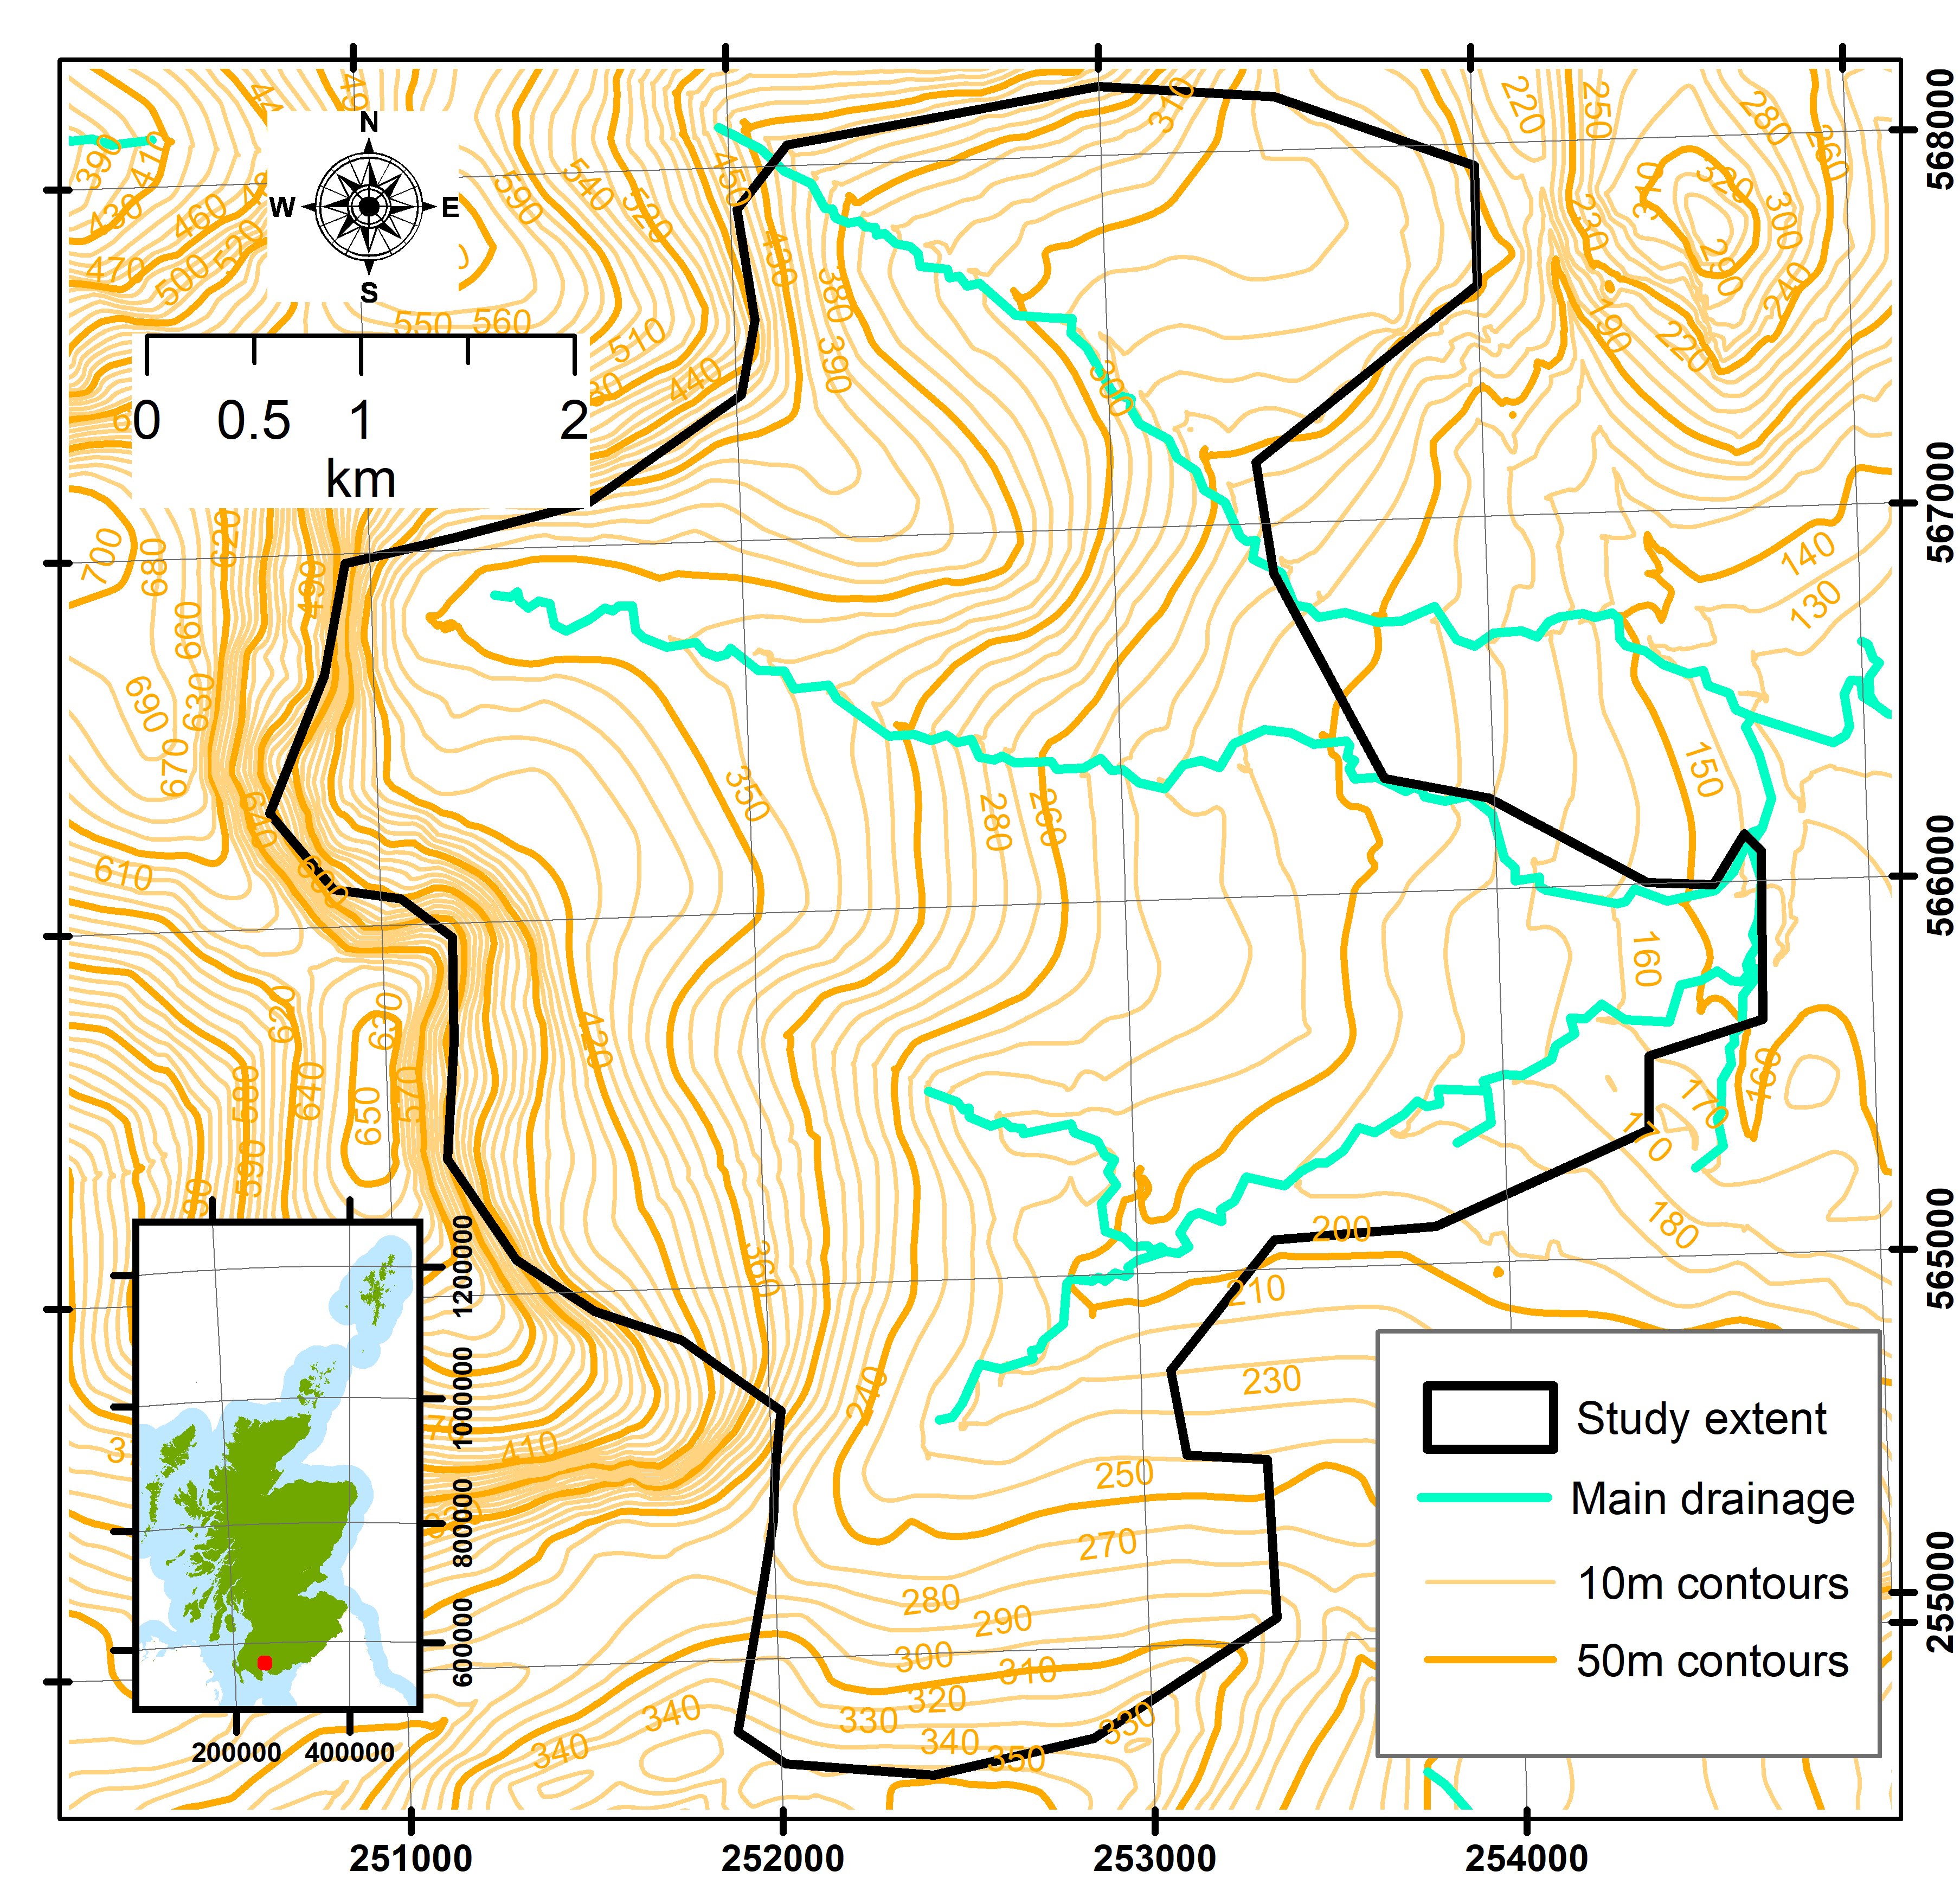
Figure 1: The location (inset) and extent of the Cairnsmore of Fleet study area (© Crown copyright [and database rights] [2023] OS AC0000813979)
Click for a full description
The outline of the Cairnsmore of Fleet study area, surrounding drainage network and contours at 10 and 50 m intervals. Inset is a map of Scotland showing the location of the study area. Co-ordinates are Ordnance Survey British National Grid and are in metres.
Methods
Our approach was to first classify the peatland condition based on the assessment of InSAR time series of surface motion. The InSAR time series were purchased from Terra Motion Ltd who provided data for the site at approximately 20x20 m pixel resolution. This data provides a time series of the average surface motion across the entire pixel measured every 6-12 days depending on the frequency of satellite image acquisition. The surface from which the InSAR scatters is presumed to be the top of the unsaturated layer as virtually no significant penetration is expected into moist peat soils and the above ground vegetation would not contribute to the C-band InSAR signal. We used data for the period 12 November 2015 to 09 December 2021 which gives four complete years of time series data for Moss of Crombie (both 2015-16 and 2020-2021 being incomplete) and three for Cairnsmore (additionally with 2019-20 being incomplete). Key metrics used to classify condition (Table 1), the amplitude of seasonal swelling, the multiannual velocity and the timing of seasonal peaks, were extracted from time series using previously published methods (Bradley et al., 2022). The distribution of these metrics was then compared to the distribution of the same metrics from the Flow Country. This comparison enabled consideration of whether the distribution of metrics in Cairnsmore represented the same range of conditions encountered in the Flow Country, on which the original classification approach was based, and hence whether any adaptation to the classification would be required.
| Key metric | Interpretation |
|---|---|
| Amplitude of seasonal swelling | A measure of the capacity of the peat to swell or shrink in response to seasonal changes in water storage caused by evapotranspiration. More resilient peat in good condition should have a higher amplitude. |
| Timing of maximum seasonal swelling | An indicator of how quickly soil swelling peaks in response to water storage after the growing season. It is influenced by position within a landscape and in the Flow Country is a strong indicator of plant functional type. Sphagnum dominated peat in good condition continues to swell late into the winter as it has the capacity to accumulate more water. Drier denser, better drained shrubbier peat with less water storage capacity tends to peak earlier in the late summer/autumn. |
| Multiannual velocity | A measure of the vertical growth (positive values) or subsidence (negative values) of the peatland surface. Degrading peat will tend to have high negative velocities and near natural peat should have velocities that are close to zero or slightly positive |
To undertake field validation a method was developed based on field knowledge and extensive work in the Flow Country (Bradley et al., 2022; Marshall et al., 2022; Alshammari et al., 2020) and observations on the Bunloit Estate by co-author Andersen. The field validation is based on directed observations of peatland around a sample point through a simple set of questions requiring yes/no answers and operated through a third-party survey application (app), “Input”, that synchronises with the Mergin™ Geodata platform (Mergin, 2022). The reason for selecting this app for field recording was its ease of use and the direct interface with QGIS via the MerginTM plugin which allowed instant mapping of observations both in the field and remotely. The app also enables data to be simultaneously shared and collected by multiple users using a variety of platforms (i.e. Apple ™ and Android ™ devices). Each input category to the app represents an observation of a particular feature or condition and is recorded with either a 1, indicating yes, presence or dominance, or a 0, indicating no, not dominant or absence. Details of the categories and characteristics used in the app are provided below.
Categories, characteristics and criteria used for the field app questionnaire
Peat stiffness categories and associated observation
These relate to how the peat surface feels when walking over it within an area of approximately 20 m around the observation point to relate to InSAR pixel size (Yes = 1, No = 0).
- Spongy - distinct squelching when walking across the surface, with water and vegetation covering the footwear.
- Soft - the surface has a little give when walking over but footwear does not sink through, though there might be some water coming to the surface with each footstep.
- Stiff - the surface is firm when walking over, with no evidence of standing water.
Vegetation categories and associated observation
These relate to the presence of vegetation within an area of approximately 20 m around the observation point. It does not involve looking for individuals but relates to the most dominant groups. (Yes = 1, No = 0)
- Sphagnum - there are distinct and obvious continuous carpets or patches of Sphagnum on the ground and/or in pools.
- Shrubs - there are several ericaceous shrubs (e.g. Calluna vulgaris, Erica tetralix).
- Sedges - there are distinct and obvious patches dominated by sedges (e.g. Eriophorum spp., Carex spp., Trichophorum germanicum).
- Mosses - there are distinct and obvious continuous carpets or patches of non-Sphagnum mosses (e.g. Pleurozium schreberii, Polytrichum commune, Hylocomium splendens, Rhytidiadelphus spp.) on the ground, including underneath shrubs.
- Rushes - there are tussocks of rushes (e.g. Juncus spp.).
- Grasses - there are abundant grasses including e.g. Molinia caerulea, Deschampsia spp., Poa spp., etc.
- Scrub - there are some small trees (<2 m) and/or gorse bushes.
- Conifers - it is a conifer plantation or there are several self-seeded conifers >2 m.
- Bare peat - there are patches and/or continuous areas of bare peat, excluding dried out pools during a drought.
Hydrology categories and associated observation
These relate to features that impact water storage within the vicinity (20 m) of the point. (Yes =1, No = 0).
- Pools - it is a natural pool system.
- Stream - there is a natural stream/river.
- Drains - there are artificial unblocked ditches/drains/furrows. Mutually exclusive with "restoration" and "conservation" from the land use category.
- Erosion - there are signs of erosion, including bare peat, gullying, hags, underlying bedrock exposed.
- Flat - the area is not sloping at all in any direction for at least 20 m.
- Gentle slope - there is a gentle incline.
- Moderate-to-steep slope - there is enough incline for it to be noticeable when walking over 10-20 m.
Land-use categories (including. historical land use) and associated observation
These relate to current land use and/or past land use where they are not mutually exclusive. (Yes = 1, No = 0).
- Peat cutting - evidence of past or active peat cutting (manual).
- Grazing - deer/sheep/cattle droppings, footprints, evidence of grazed vegetation, presence of grazing animals.
- Restoration - evidence of intervention (dams, forestry removal, etc.)
- Windfarm - the site is an active windfarm.
- Burning - evidence of burning (e.g. increased cover of Molinia or Calluna), evidence of burning (charred peat, patterns associated with muirburn).
- Forestry - the site is an active forestry site.
- Conservation - the site is near natural and managed for conservation. Mutually exclusive with restoration, forestry and windfarm.
To classify the field data, each input category is weighted (Annex 2 – Original score generator) based on the perceived and observed correspondence between surface motion and peatland condition in the Flow Country. Scores for each category are added together to calculate a single value. A series of thresholds are applied dividing the data into a classification of peatland condition that could then be represented by colour coding (Table 2). This colour coding then displays on the live interactive maps as the user saves observation points in the app. This classification (Table 2) sought to distinguish the easily observed extremes in peatland condition found within the Flow Country with one endmember corresponding to the wet sphagnum-rich peat associated with pool systems, another endmember corresponding to drier, shrub dominated peatland margins and an endmember corresponding to thin stiff and/or highly degraded peat.
| Condition | Score | Colour |
|---|---|---|
| Spongy, very wet peat, typical of mesotope centres and pool systems. Sphagnum dominant, forming extensive carpets | > 20 |
|
| Soft to Spongy, tending to a near natural wet state, Sphagnum may be present | >15 to 20 |
|
| Stiff to Soft peat tending possibly at early stage of restoration or somewhat degraded | >5 to 15 |
|
| Thin, stiff peat to mineral soil. Highly degraded peat. | >-5 to 5 |
|
| Stiff peat, notably degraded | >-10 to -5 |
|
| Stiff peat typical of near natural mesotope margins adjacent to natural drainage lines, could also be associated with legacy effects of historical burning or grazing | >-30 to -10 |
|


A site visit to Cairnsmore of Fleet National Nature Reserve (NNR) was undertaken at end of March 2022 during which four NatureScot staff who had not viewed the InSAR result were verbally briefed on how to operate the “Input” app and then asked to take recordings from a range of conditions using the app in the field around Cairnsmore NNR. Sampling by the NatureScot staff was therefore blind and judgemental. They did not have access to a copy of Table 1 to which they could refer to once briefed. Simultaneously, four of the authors of this report, who did not know the area, also trialled the app on the Cairnsmore NNR, specifically targeting a range of conditions shown on the InSAR classification. Afterwards, feedback was gathered to enable further refinement of the app and field assessment method.
Finally, the relationship between the InSAR classification and field data was analysed quantitatively and qualitatively. Qualitative comparison of the InSAR classification was also made to land-use, optical imagery, topography, geology and the record of restoration on the site. To assess the usefulness of the field method we considered the relevance of field observations, mutual relationships, contradictions, and influence of the weightings.
After considering the outcomes and observations, a refined classification and field method is proposed that should be widely applicable to blanket bog and lowland raised bog.
Results
InSAR classification of peatland condition
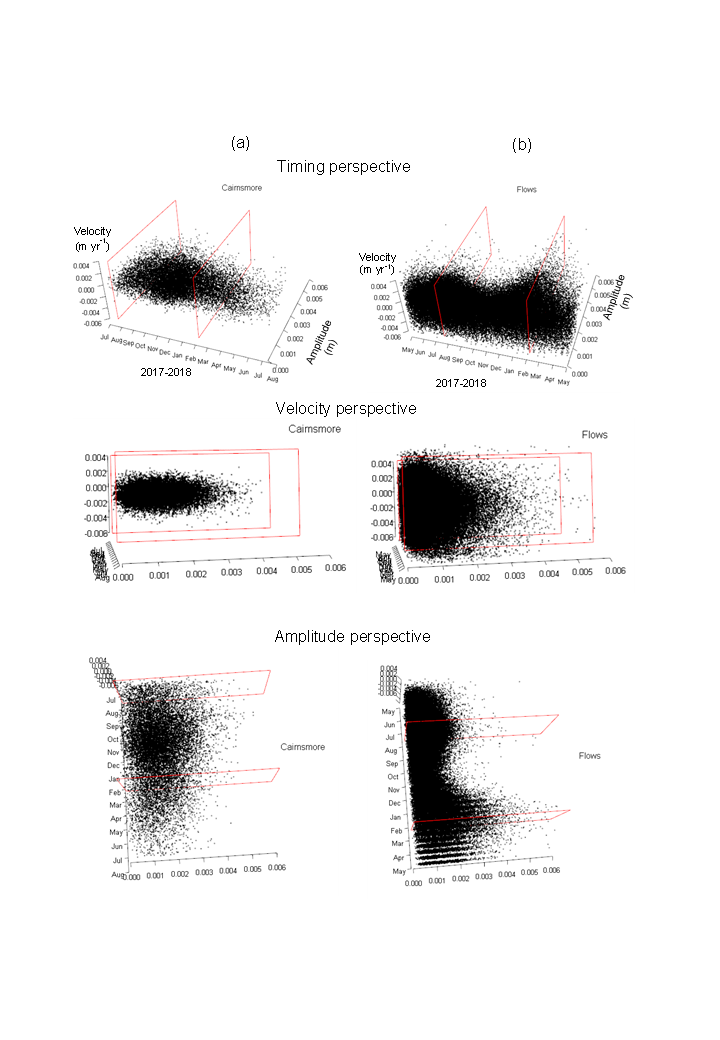
Comparison of the distribution of key variables to those observed in the Flow Country indicates that peatland on Cairnsmore typically has a narrower range of predominantly negative velocities and lower amplitudes than the Flow Country and the distribution of peak timing is not bimodal (Figure 2). This is consistent with the peat at Cairnsmore being more degraded, better drained on account of steeper slopes, transitional (i.e. currently under restoration) and lacking the drier (mesotope margins) and wetter (mesotope centres) near natural endmembers that create the bimodal distribution observed in the Flow Country. This is not surprising as near natural condition classes, particularly those corresponding to the spongy mesotope centres with pool systems found in the Flow Country, are absent from Cairnsmore. It was observed that Cairnsmore typically has steeper slopes, is historically more degraded and is dominated by Molinia caerulea, purple moor grass. So, the challenge at Cairnsmore was to produce a refined classification of a distribution that represents the variation in a more degraded spectrum of peatland conditions and, in particular, identify areas where restoration may be resulting in progress towards an improved condition. It should be noted that although a similar range of degraded conditions is present in the Flow Country, previous work combined this degraded spectrum into an undifferentiated degraded class (Bradley et al., 2022).

Figure 2: A comparison in the timing of the key metrics between (a) Cairnsmore and (b) the Flow Country (labelled Flows) as a 3-d scatterplot orientated from the perspectives of Timing (top), Velocity (middle) and Amplitude (bottom).
Click for a full description
3D scatter plot characteristics of the key metrics in bog breathing season 2017-18 for a) Cairnsmore (n = 15,110) compared to b) sample of the Flow Country (n = 87,531) orientated to show timing (top), velocity (middle) and amplitude (bottom) perspectives. Red guides aligned to the extreme stiff and wet peat conditions in the Flow Country are 23 July 2017 and 08 February 2018, respectively. Annual bog breathing seasons are defined when the lowest frequency of peak times occur in the multiannual data set. This can vary from place to place, hence the breathing season is mid-July in Cairnsmore and early May in the Flow Country. This causes a slight difference in the peak timing axis for the two areas.
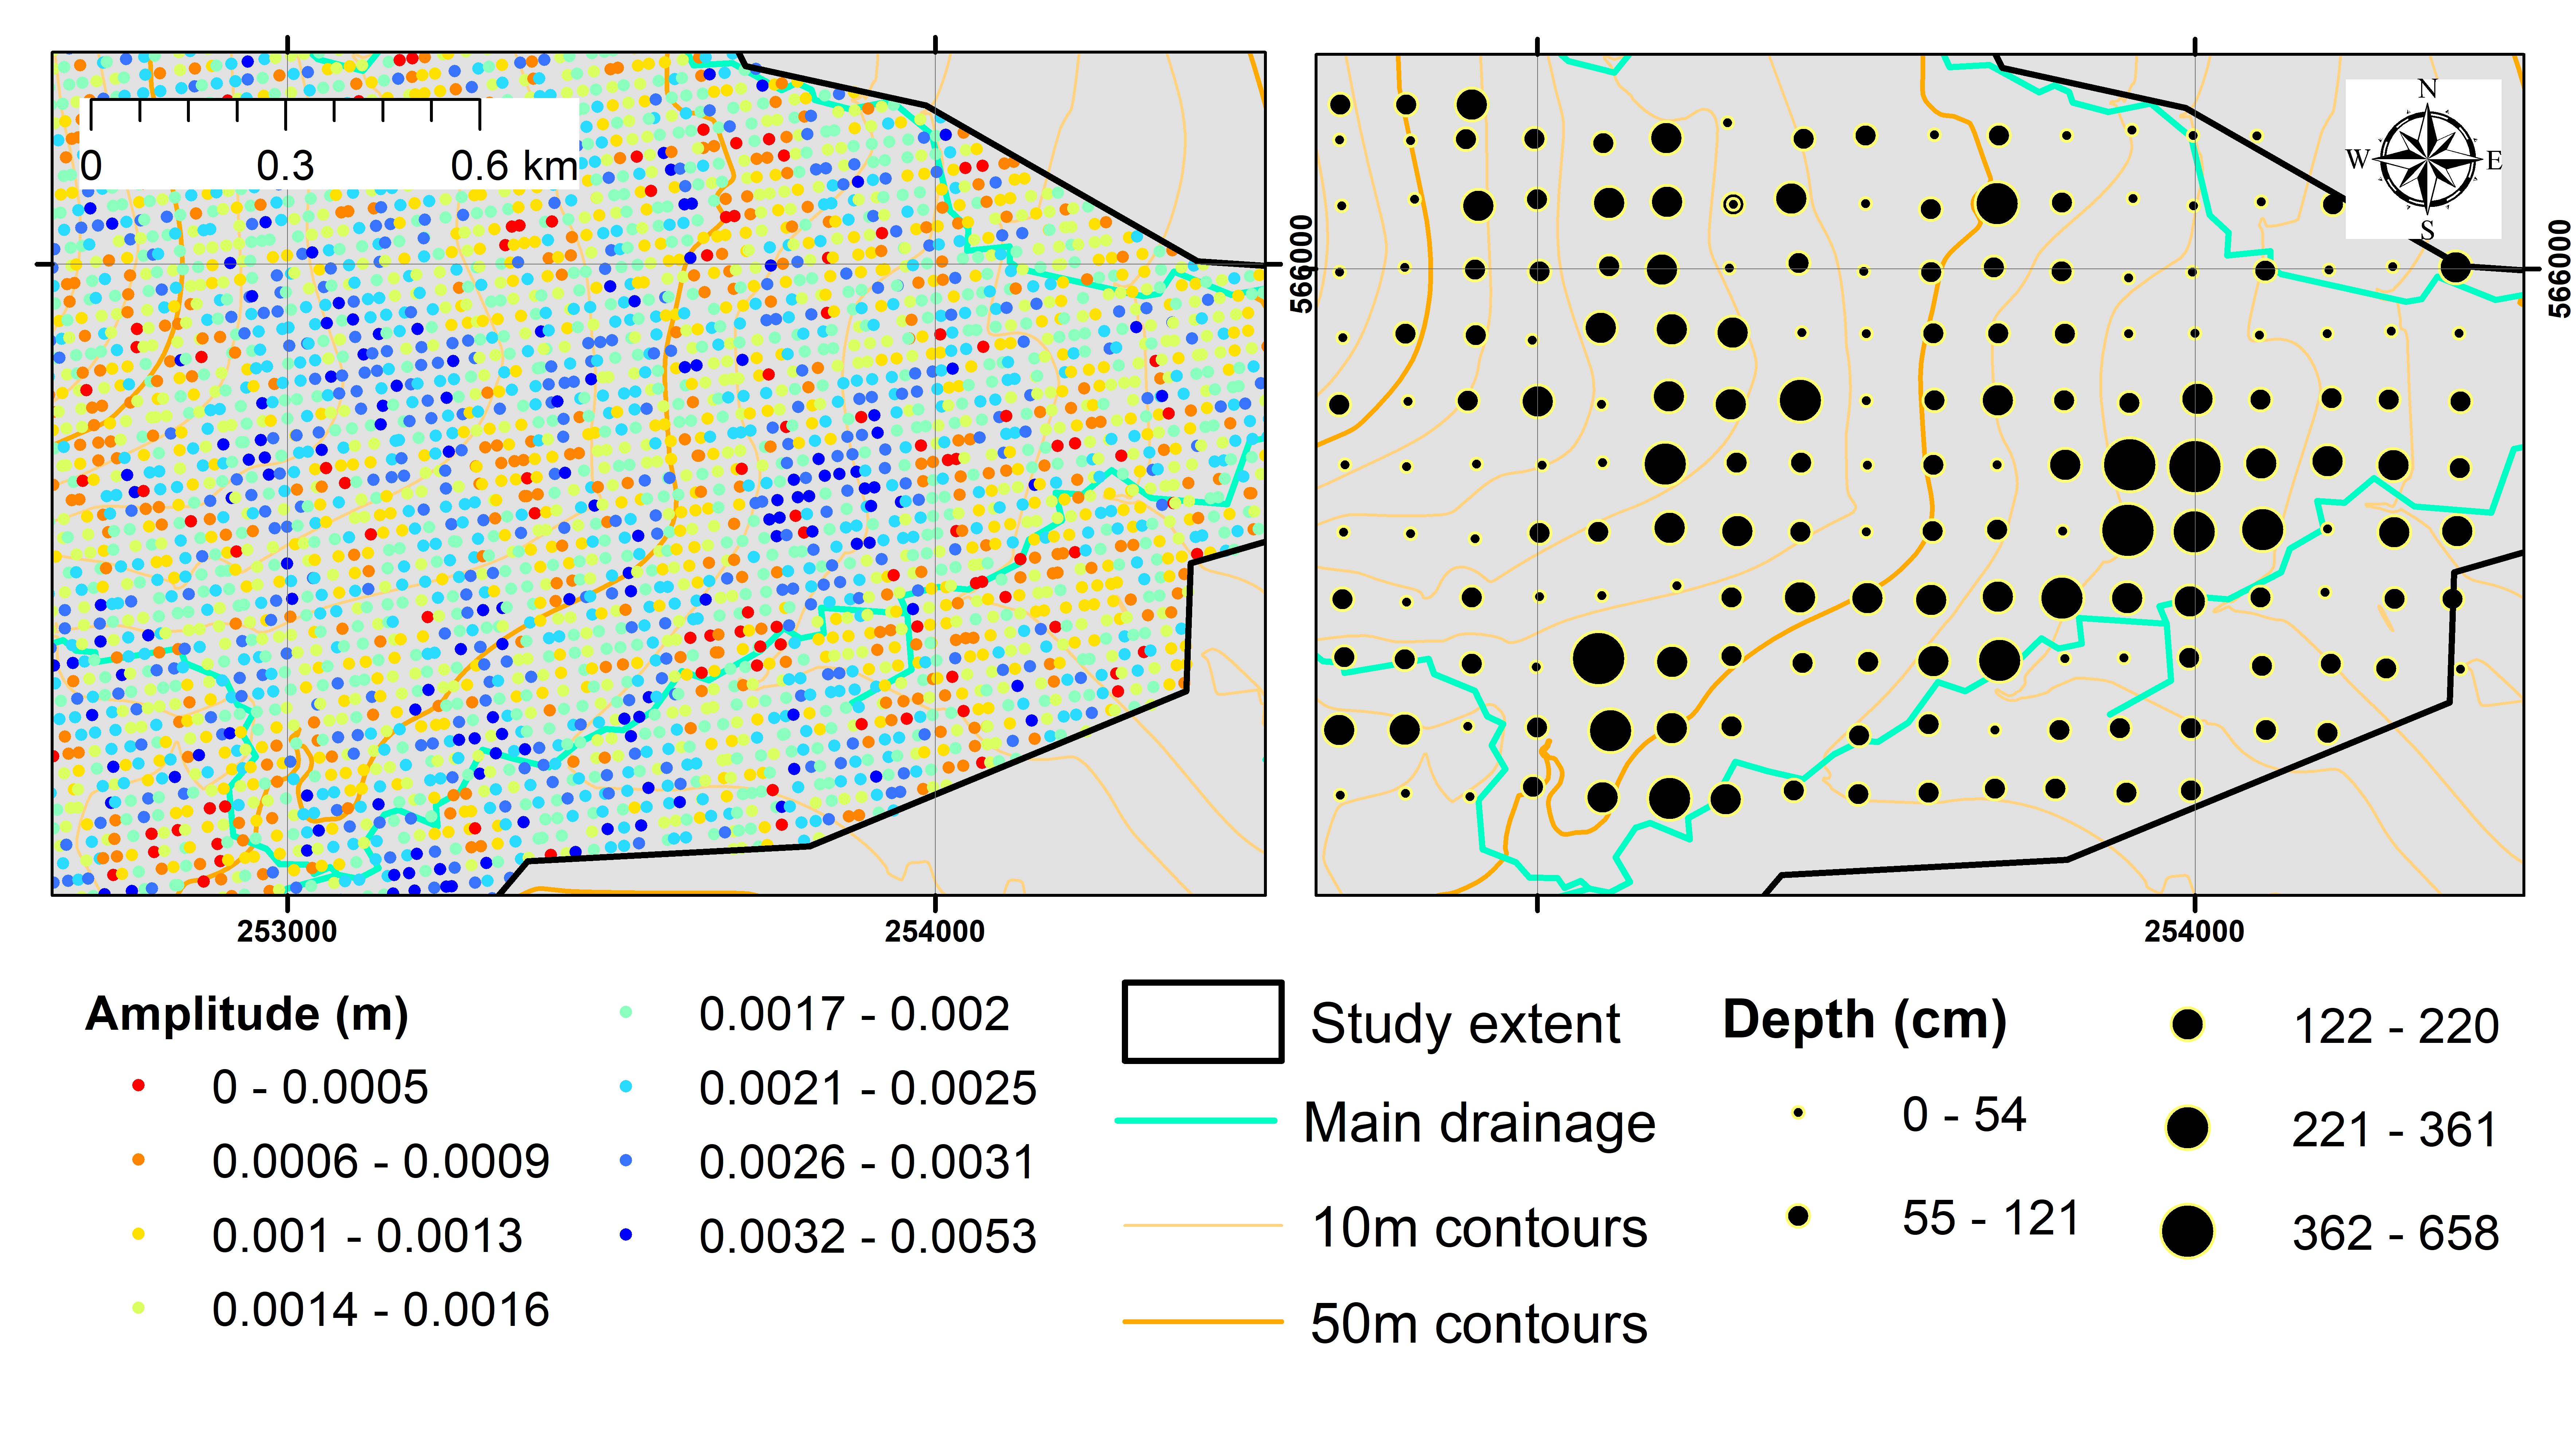
As the distinctive timing that separates extreme conditions in the Flow Country is not apparent in the Cairnsmore data, a new classification was needed based on amplitude and velocity. High amplitudes are expected to correspond to softer, potentially deeper peat soils in better condition, whereas low amplitudes are most likely to be on stiff thin peat or mineral soils. Although a strong correlation between peat depth and amplitude is not expected, peat soils are softer than mineral soils, therefore some correspondence would not be surprising. Evidence for this is the observed spatial correspondence between higher amplitudes and areas mapped as peat by the British Geological Survey or known to have deeper peat soils from a NatureScot field survey (Figure 3).
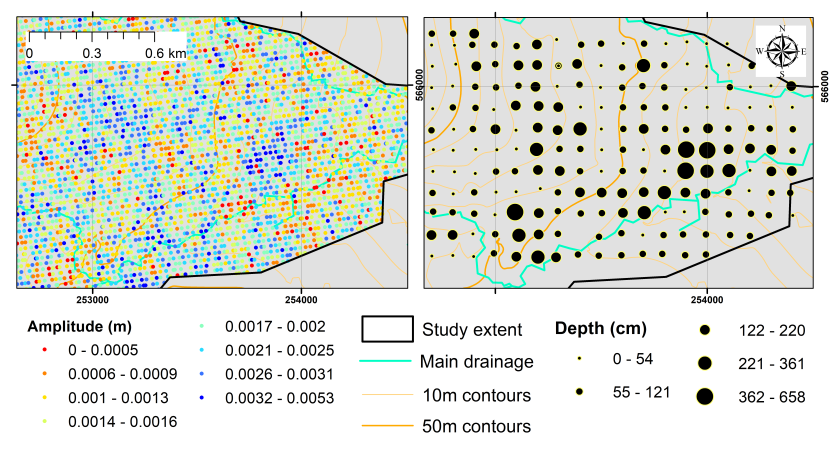
Figure 3: Spatial comparison of (a) InSAR amplitudes (2018-19) with (b) NatureScot peat depths.
Click for a full description
Comparison between maps of a) 2018-19 amplitude (m) derived from InSAR times series and b) peat depths (cm) measured by NatureScot within the Cairnsmore NNR. InSAR pixels are approximately 20 x 20 m and the amplitude represents a spatial average. Peat depth data was obtained as point measures on a 100 x 100 m grid.
Large negative velocities (large rates of subsidence) will correspond to actively degrading peat irrespective of whether the amplitude is high or low and peat in the best condition should have the least negative or potentially positive velocities and higher amplitude. In using velocity to classify the peat it is important to recognise that restoration will initially result in velocities becoming less negative and that velocities are unlikely to become positive until restoration has progressed for many years (Bradley et al., 2022).
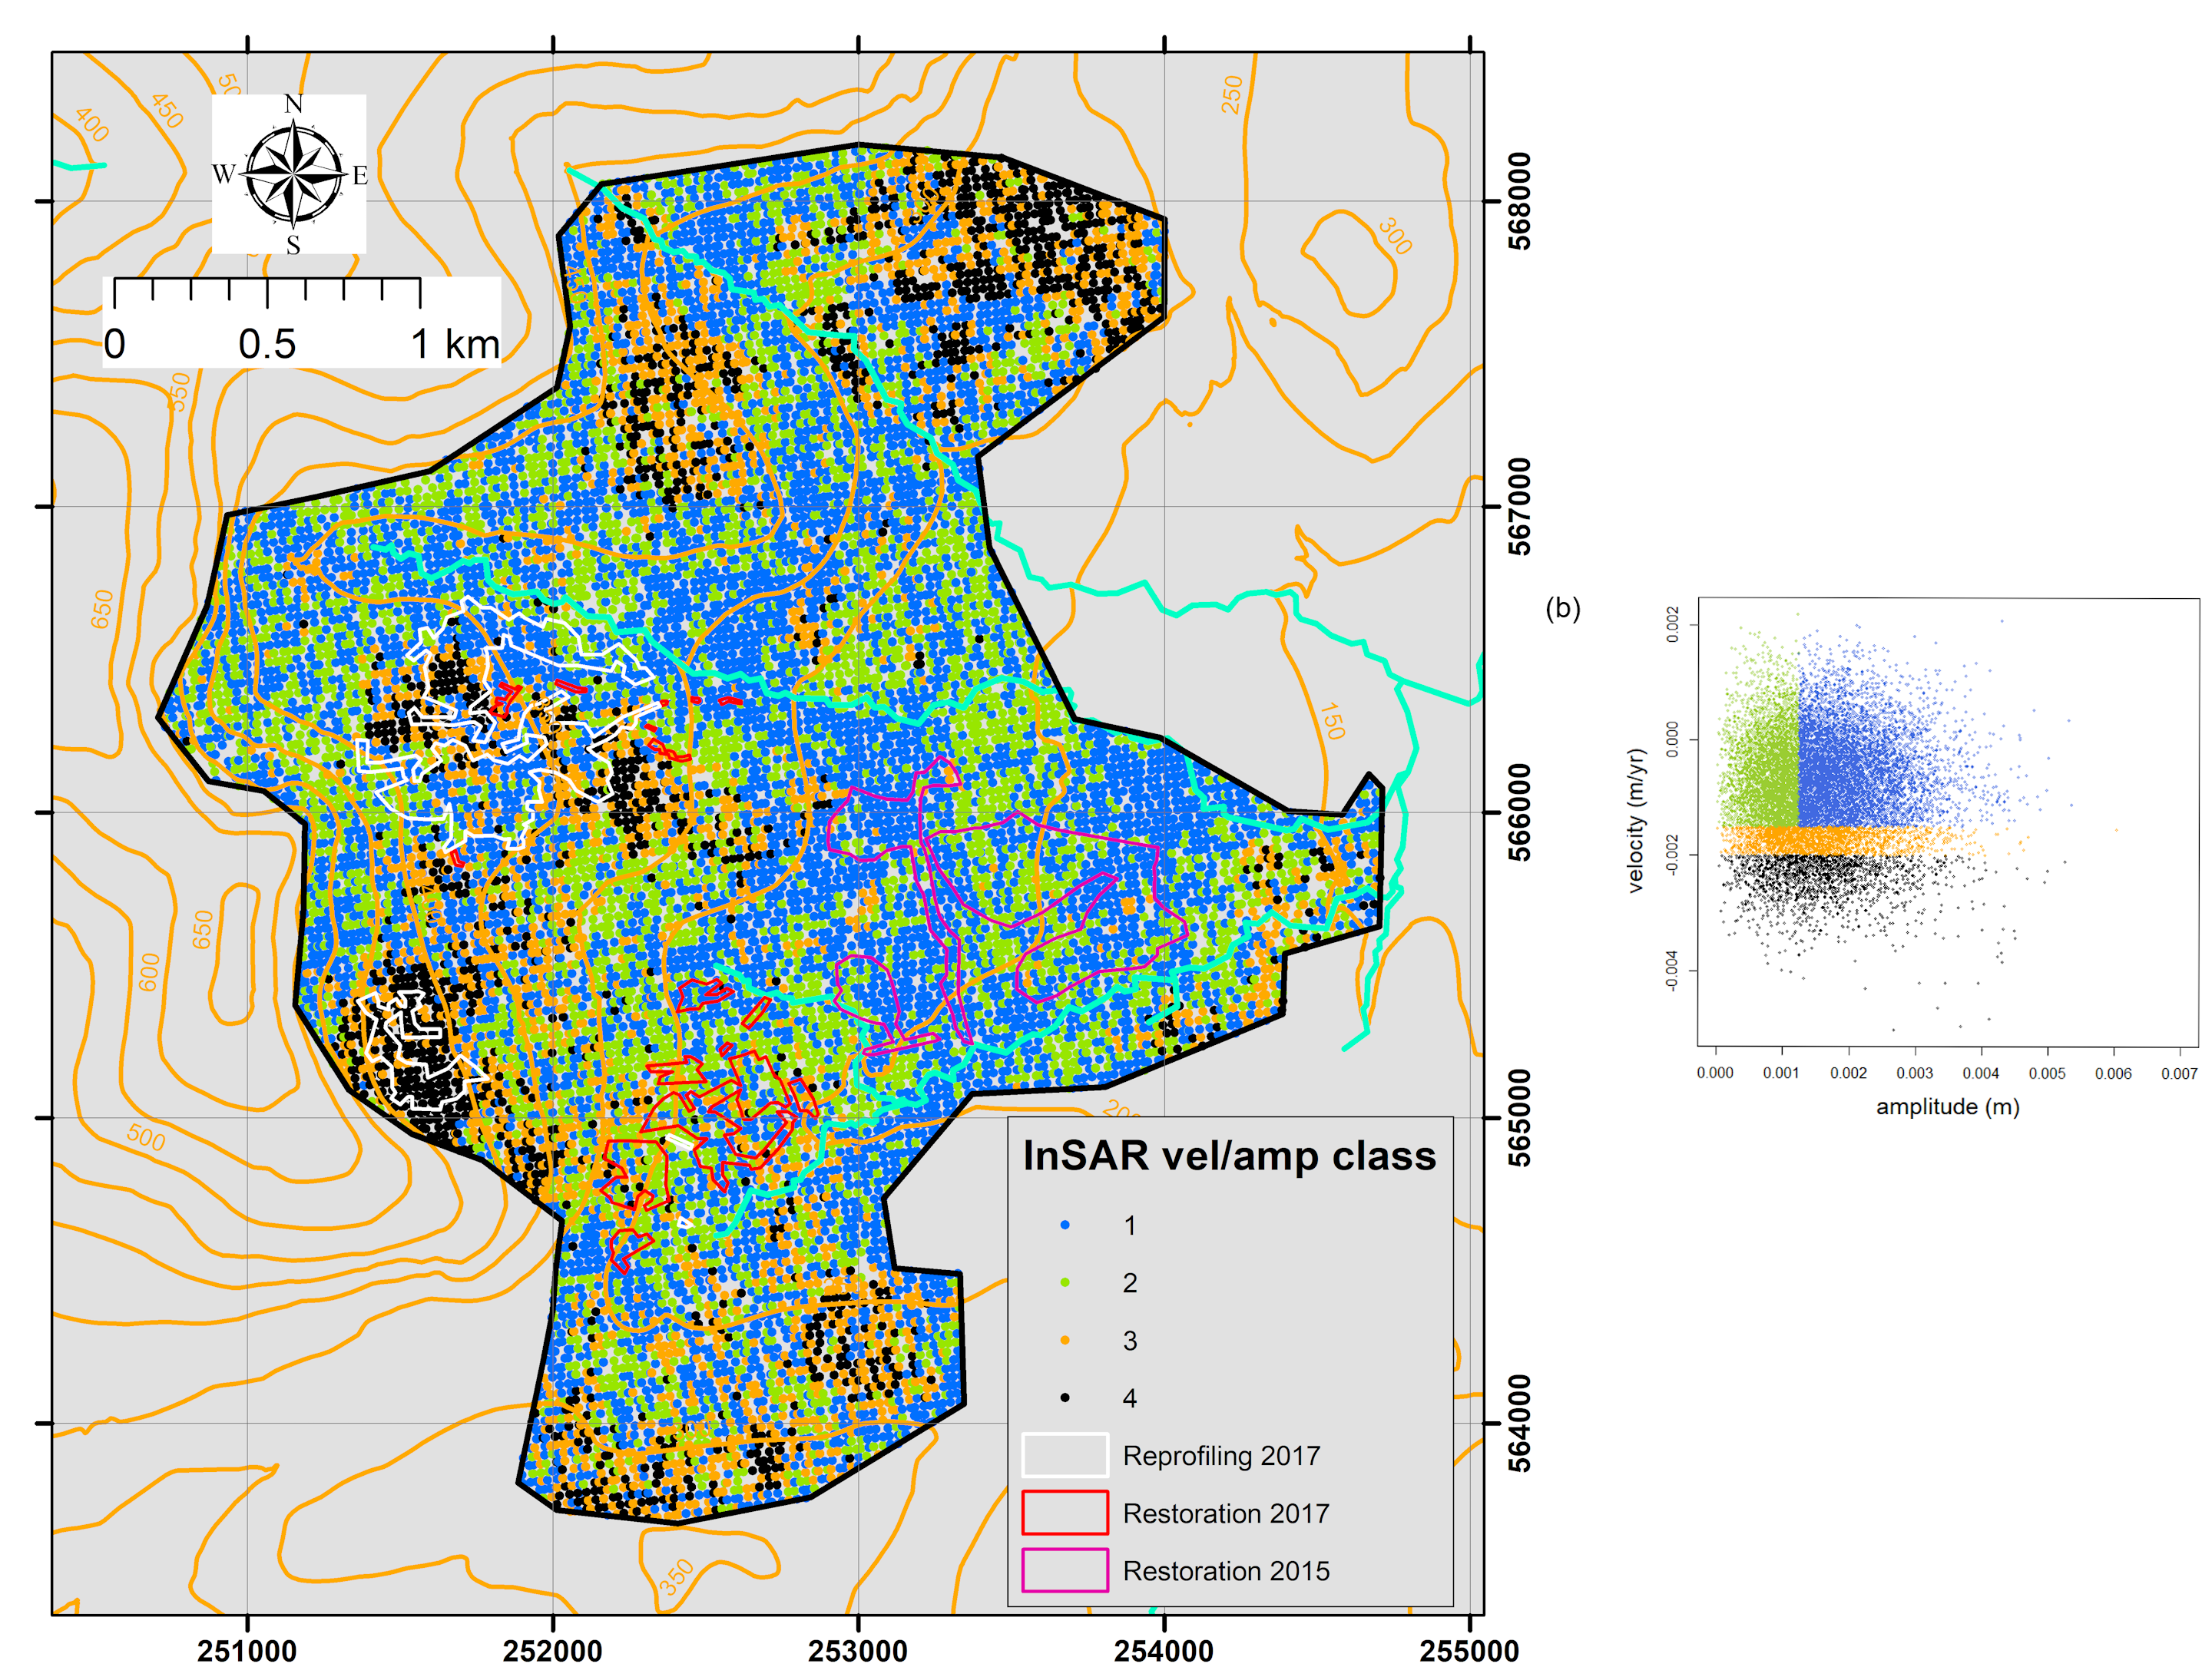
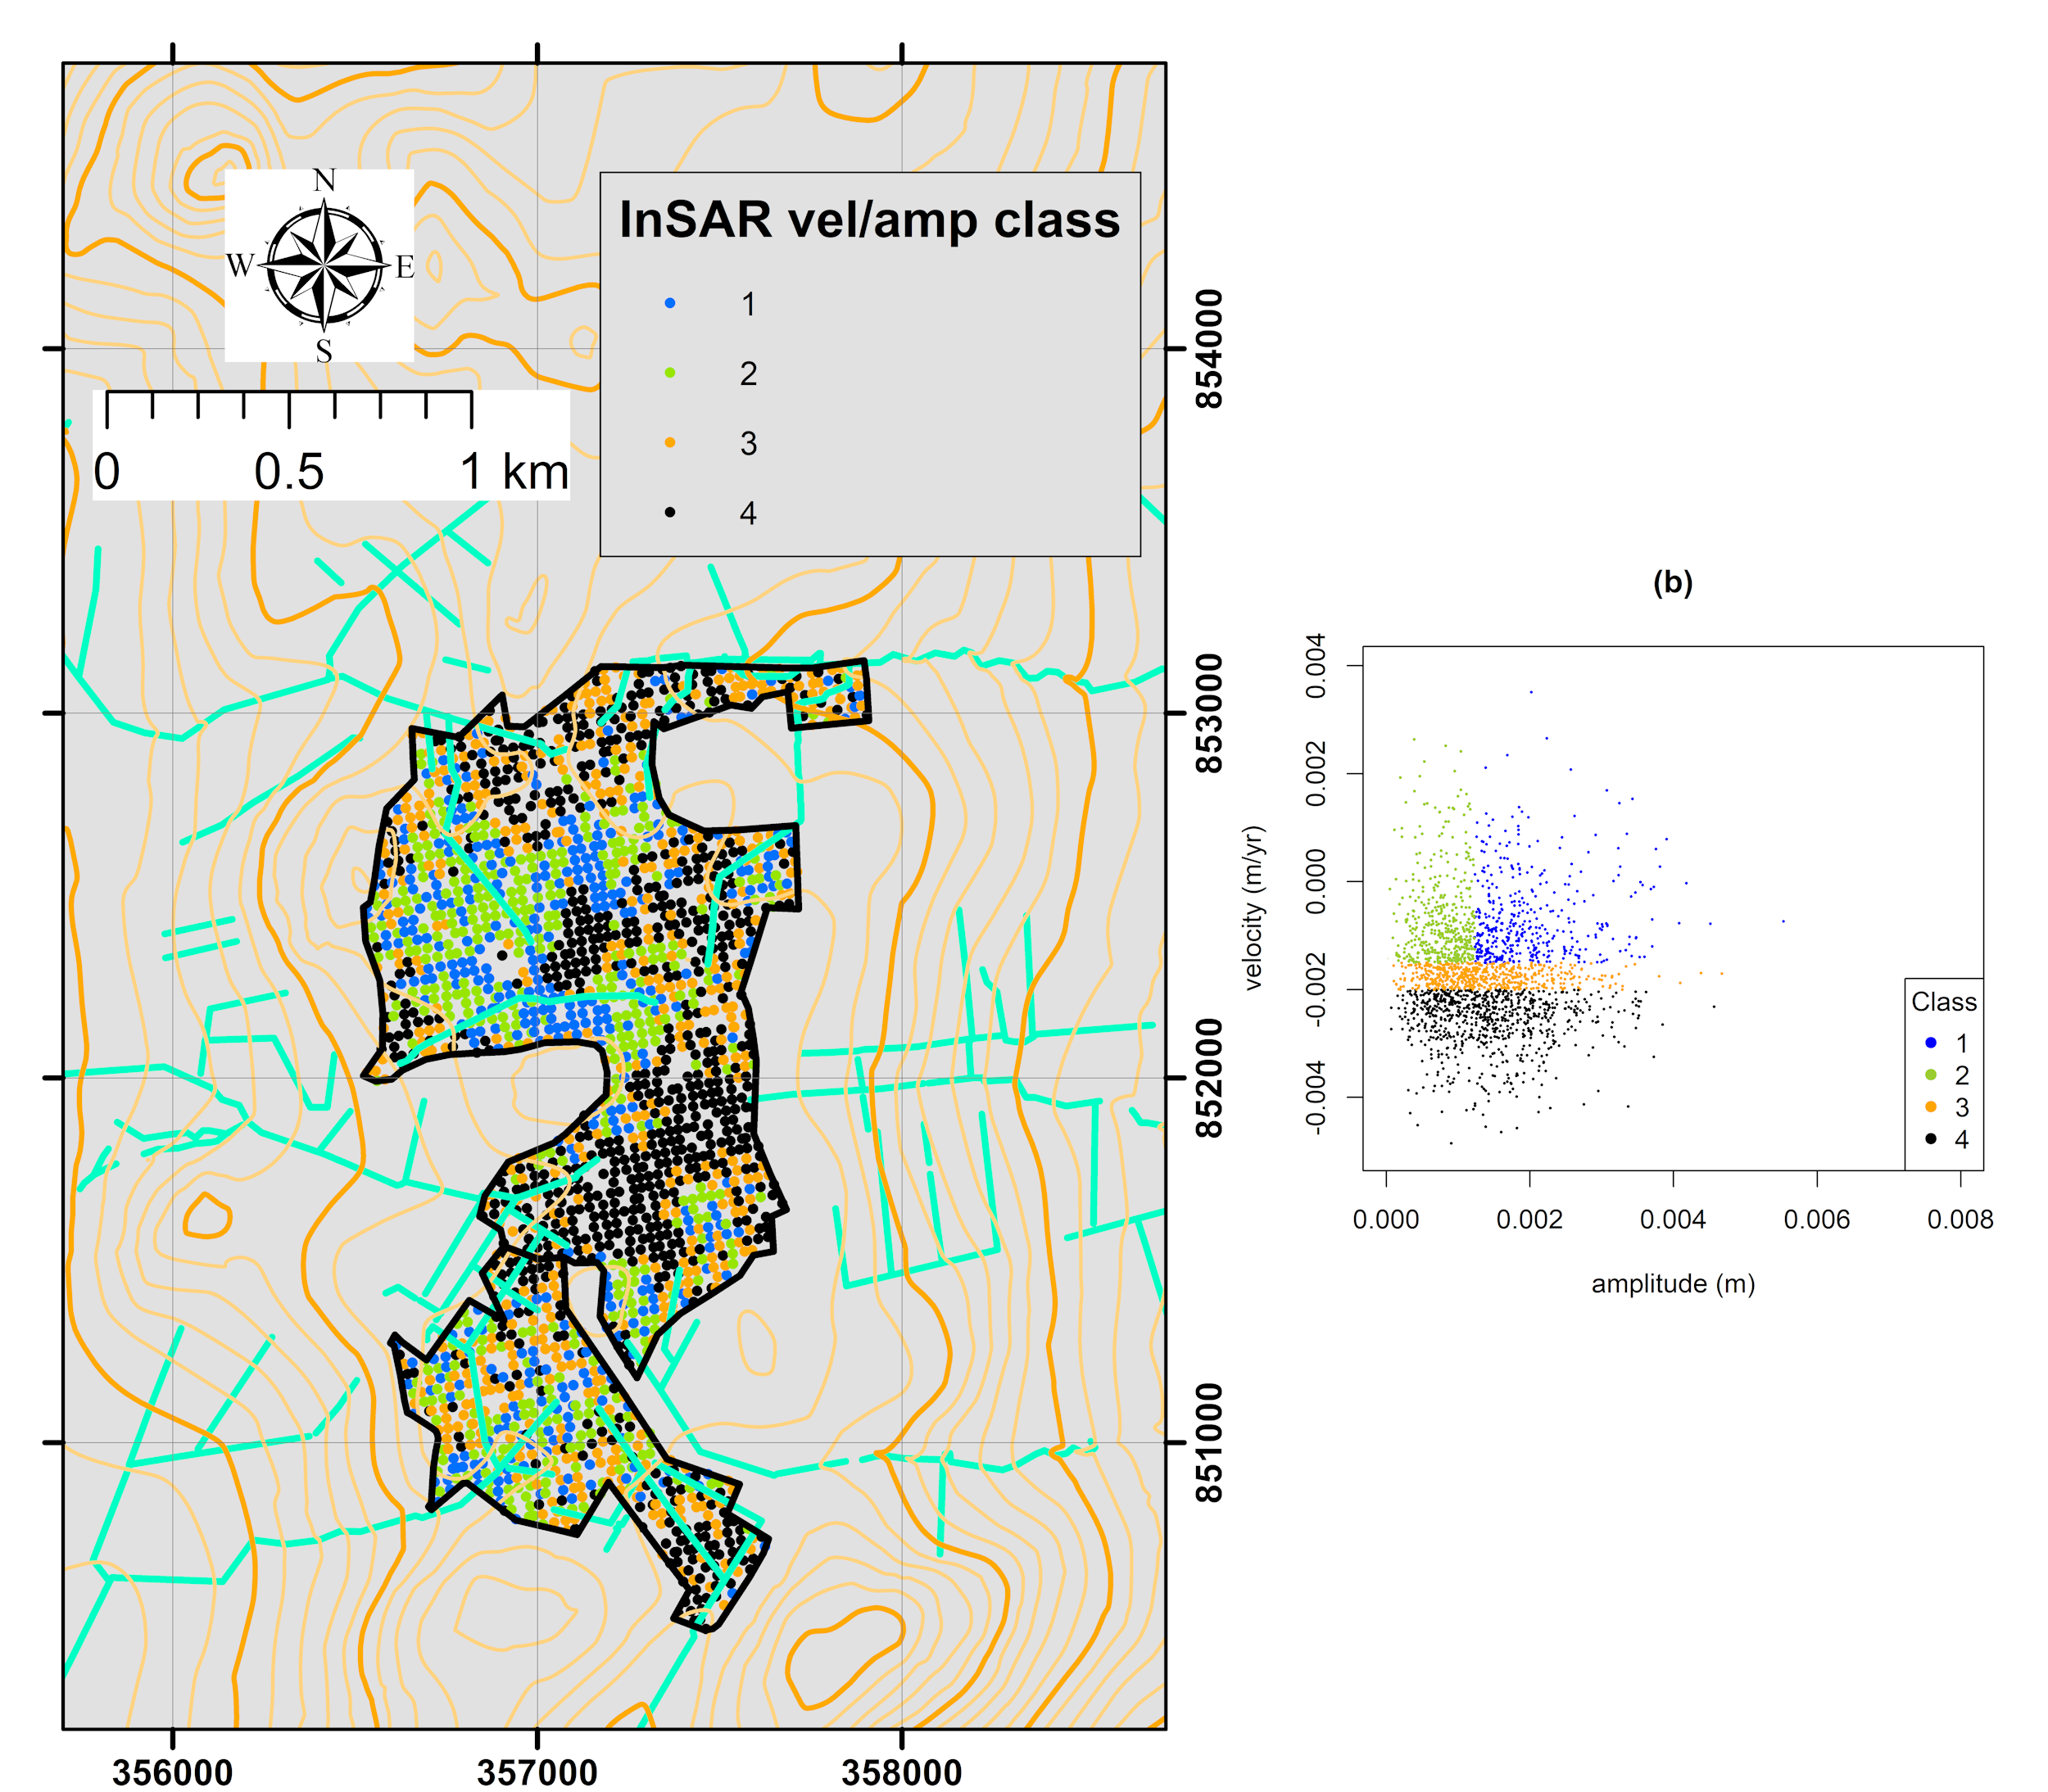
A series of annual condition maps for Cairnsmore (Figure 4a, Annex 3) were produced using thresholds on the velocity and amplitude (Figure 4b) to define four condition classes (Table 3). Note that as only one velocity dataset is available for the entire period, only changes in amplitude (i.e. which results in changes from class 1 to class 2, Figure 4) can be observed between years.
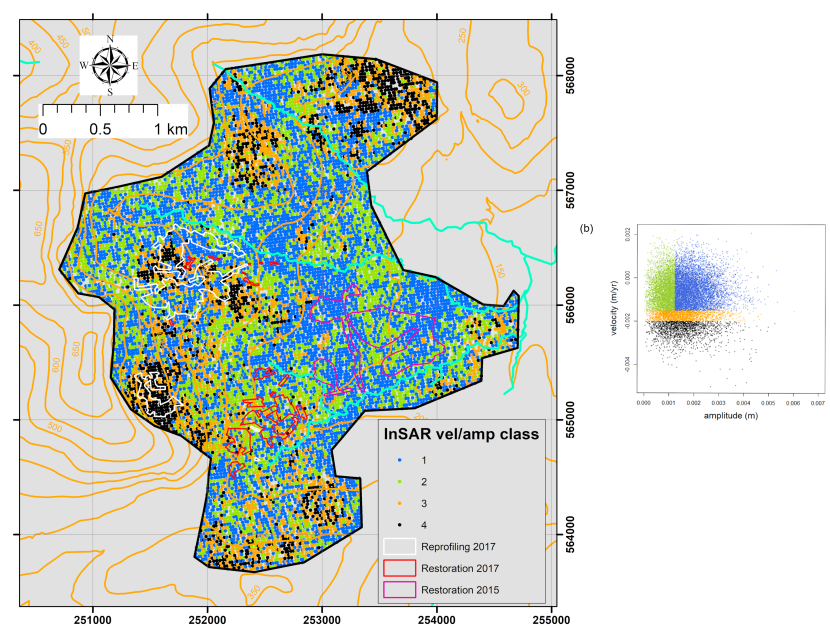
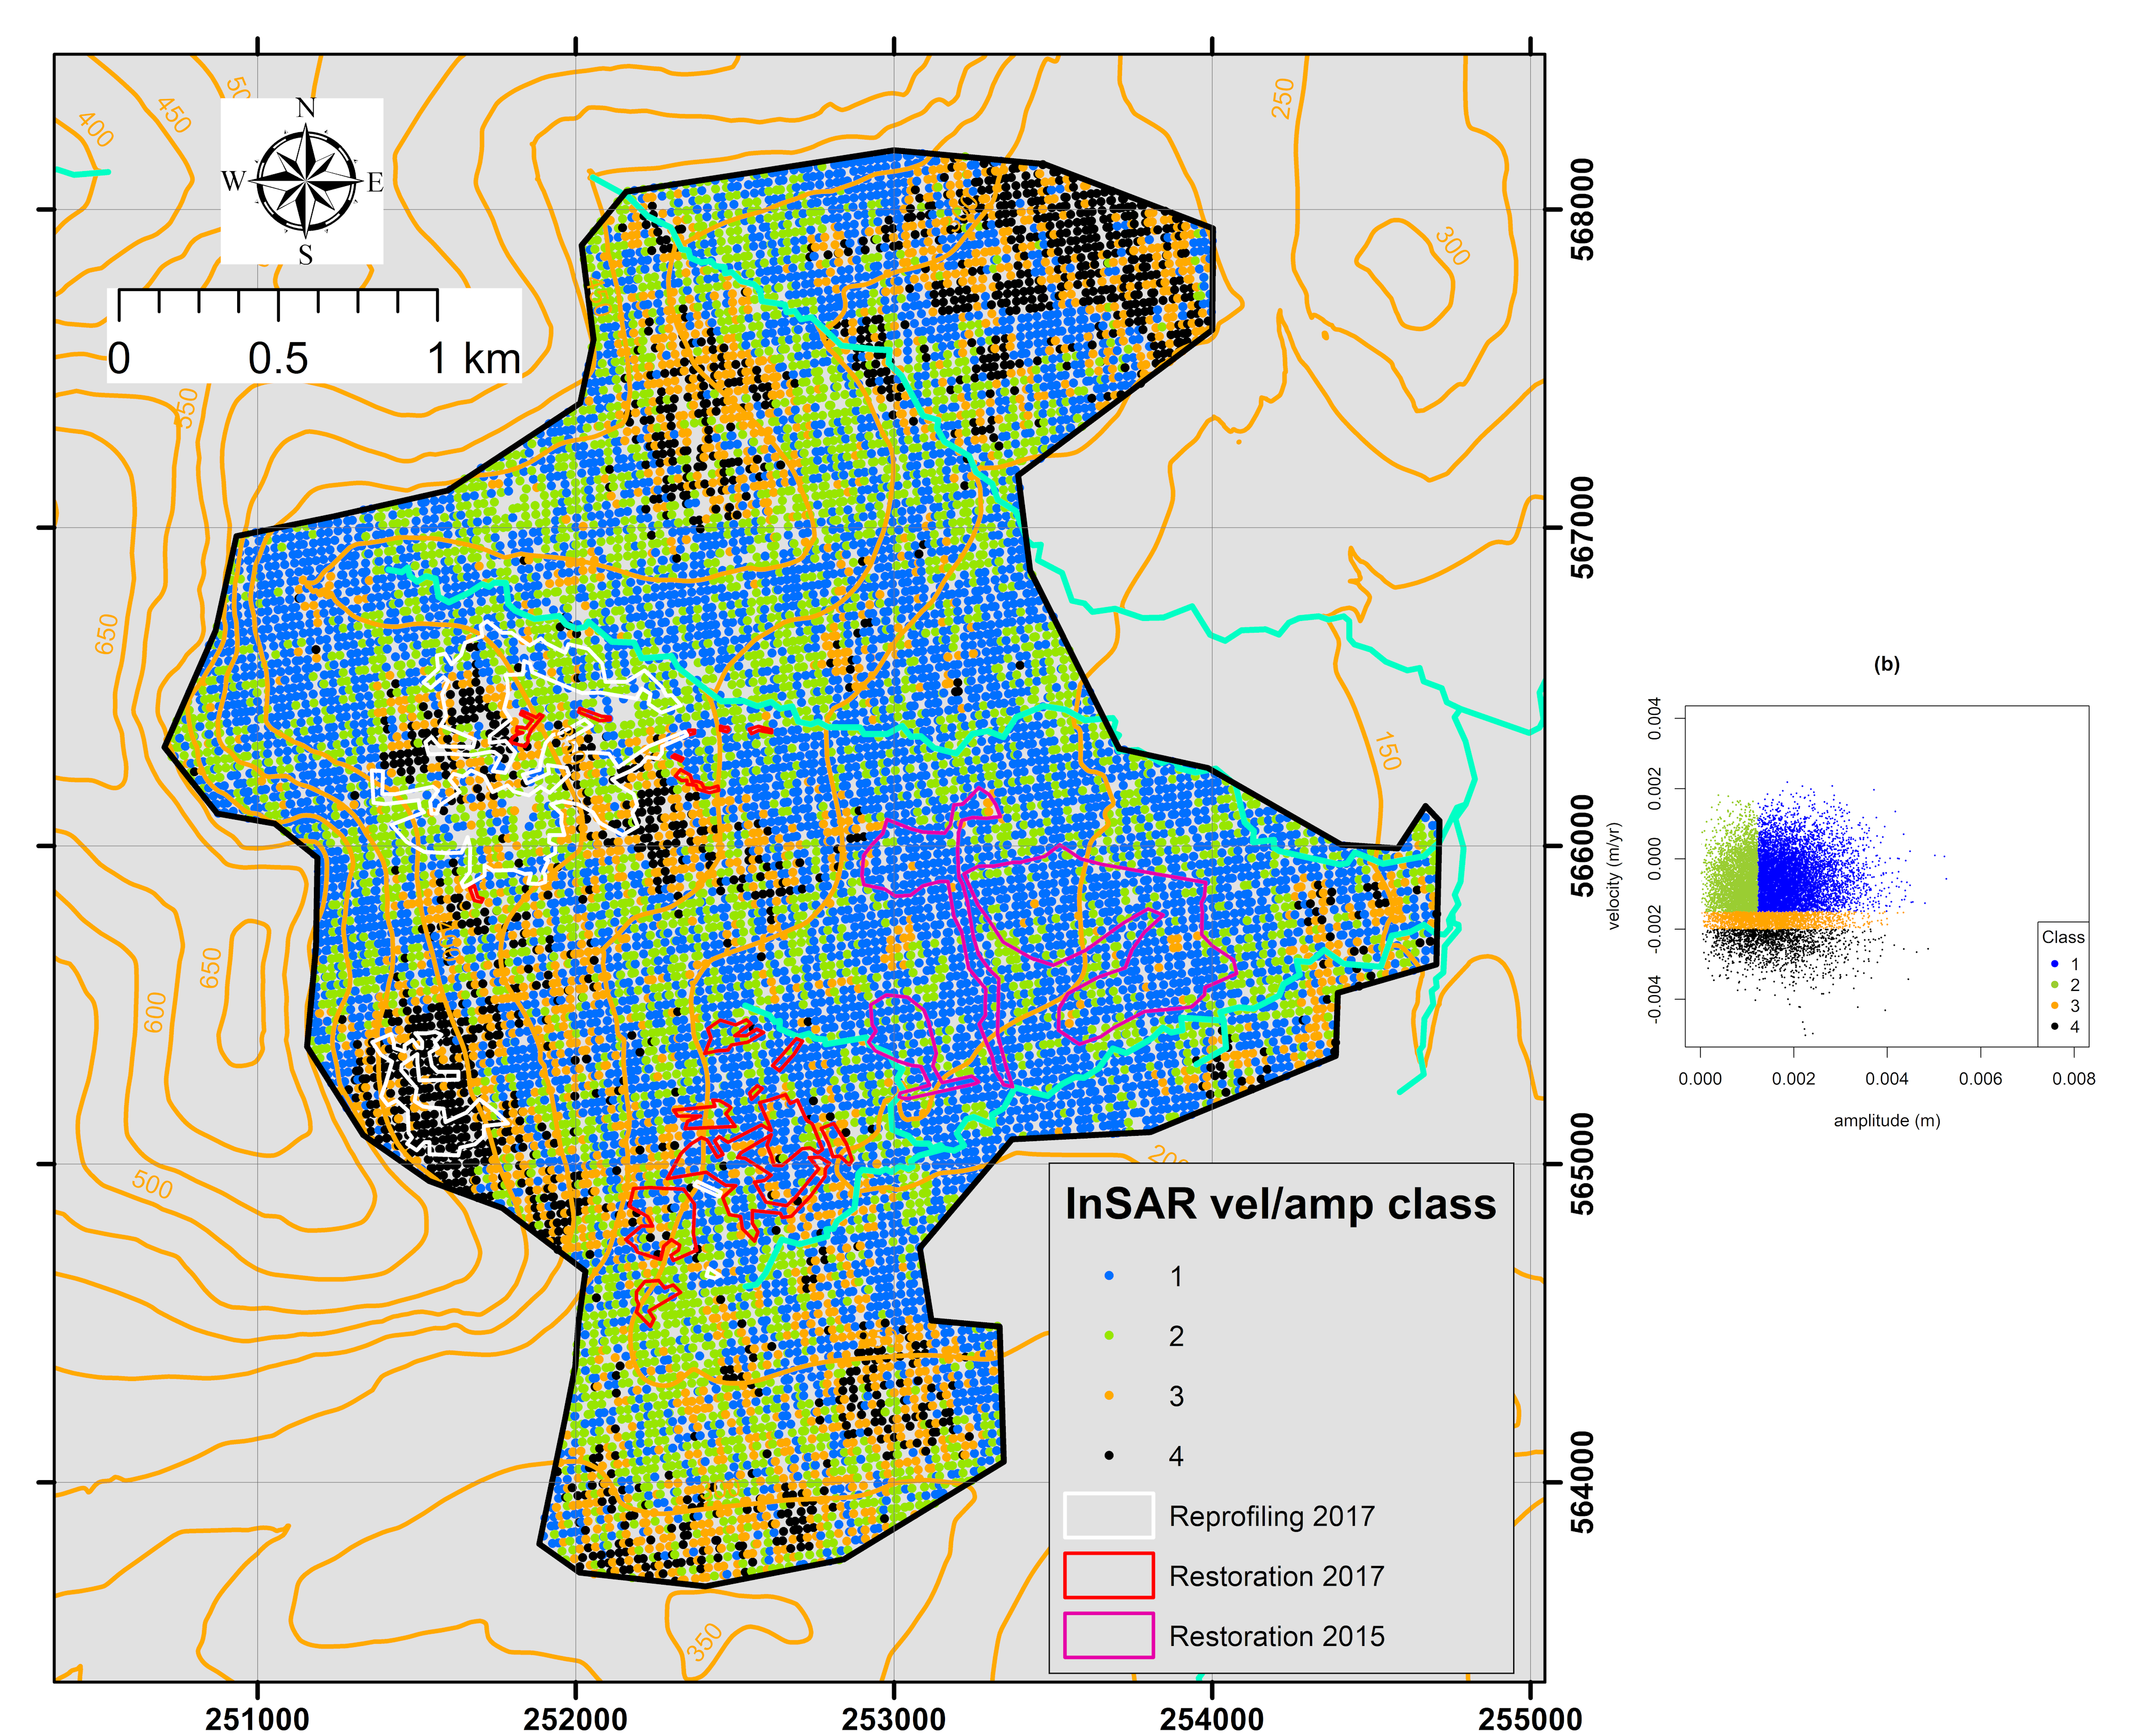
Figure 4: Classified InSAR condition map of the Cairnsmore NNR for 2017-18, showing: (a) spatial distribution of classes 1 to 4 (defined in Table 4), and (b) the amplitude and velocity thresholds used to bound the classes in the distribution.
Click for a full description
Velocity-amplitude classification scheme and classified map of the Cairnsmore National Nature Reserve 2016-17 showing four classes, two actively degrading classes 3 and 4, a stiff class 2 and a soft wet class 1. The boundaries of areas of hag reprofiling in 2017 and restoration by ditch blocking in 2017 and 2015 are overlain.
| Class | Condition | Velocities | Amplitude | Colour |
|---|---|---|---|---|
| 1 | Wet or rewetted peat with a dynamic surface – indicative of significant recovery | Close to zero | High amplitude |
|
| 2 |
| Close to zero | Low amplitude |
|
| 3 | Degrading and/or at early stages of recovery from a more drained/eroded degraded state |
| Variable amplitude |
|
| 4 | Actively draining deep peat on account of drains or erosion, e.g. peat haggs. |
| Variable amplitude |
|


Field measurement of peatland condition
The field validation exercise was designed to gather data on indicators of condition, using the “Input” app and the set of variables considered relevant to the observed surface motion and general condition of the peatland (Table 1). Over two days in March 2022, a total of 73 survey points were collected across Cairnsmore (Figure 5, Annex 4), sampling a range of peat conditions in various topographic settings. Feedback on the convenience of use, data displays, appropriateness of the categories and suggested improvements of the survey app by NatureScot users and the authors was then gathered. The main findings and comments are:
General comments on functioning of the app:
- Easy to use.
- Worked smoothly with QGIS.
- Recording absence of many categories was time consuming so a default “0” setting would mean only having to record presence.
Comments on requested observations:
- Soft versus spongy is somewhat unclear and subjective, and further guidance is necessary.
- It was unclear how bracken should be classified.
- Given the observed abundance of Molinia, better differentiation between grasses should be included.
- An indicator of angle should be given to guide classification of slope.
- Options for note taking and recording images could be included.
- Consider including peat depth.
- Incorporate mutually exclusive combinations to avoid input contradictions (e.g. between drains, conservation, and restoration categories).
- Provide a user guide for reference in the field to avoid misinterpretation of classes e.g. pools is a reference to natural pool systems, not surface water or ponding on account of restoration work.
- Eroded, drained or hags on deep peat need to be differentiated from shallow bare peat and minor surface erosion that lacks deeply incised drains or gullies, possibly using a general geomorphological description e.g. “hag system”.
- It needs to be clear that softness relates both to the give of the surface and the presence of near surface water.
Comments on classified output from the app:
- Classification method and thresholds may need to be revised to differentiate the generally degraded range of conditions observed at Cairnsmore many of which end up in the same class even though they can be differentiated on the ground and using InSAR.
- The flat category seemed to have a disproportionate influence on the classified outcome.
In summary, this trial run of the app indicated that refinement is required to both improve the quality of field observations and to refine observation categories to better differentiate condition. Furthermore, the field observations could not sufficiently differentiate between certain InSAR classes (Figure 4) nor were some of the revised InSAR classes sufficiently sampled in the field (e.g. areas of peat hags)
Qualitative comparison of InSAR to site conditions
The following qualitative observations were made:
- Comparison to areas mapped as peatland on available British Geological Survey maps confirm that the areas mapped as peat on the geological survey map were predominantly classified as peat (classes 1, 3 and 4) in either good condition or poor condition.
- Spatial variation in InSAR classification corresponded to spatial variation in ground conditions observed in the field:
- InSAR class 1 corresponded to wet areas, many of which were restored in 2015.
- InSAR class 2 corresponds to a range of conditions including no-peat, thin peat on slightly steeper ground and peat under restoration.
- InSAR class 3 includes relatively degraded areas and some that had recently undergone restoration work.
- InSAR class 4 corresponds to areas known to have extensive peat hags and associated erosion. This is known both from direct observation, optical imagery on Google Earth and reported areas of hag reprofiling.
- Field observation indicated that none of the areas visited contained the near natural endmembers that were used to devise the initial classification of the field data.
Quantitative comparison
Dataset preparation
Before making a quantitative comparison, several notable issues needed to be considered.
The field classification method, like the original InSAR classification method, was based on the Flow Country where the two extremes of near natural conditions are more widespread. When this approach was applied to Cairnsmore, most areas were classified as degraded and colour-coded as very pale blue to white (Figure 5). While this is correct relative to the Flow Country, it was not useful at separating observable differences on site or when comparing to the revised InSAR classification developed for the Cairnsmore data.

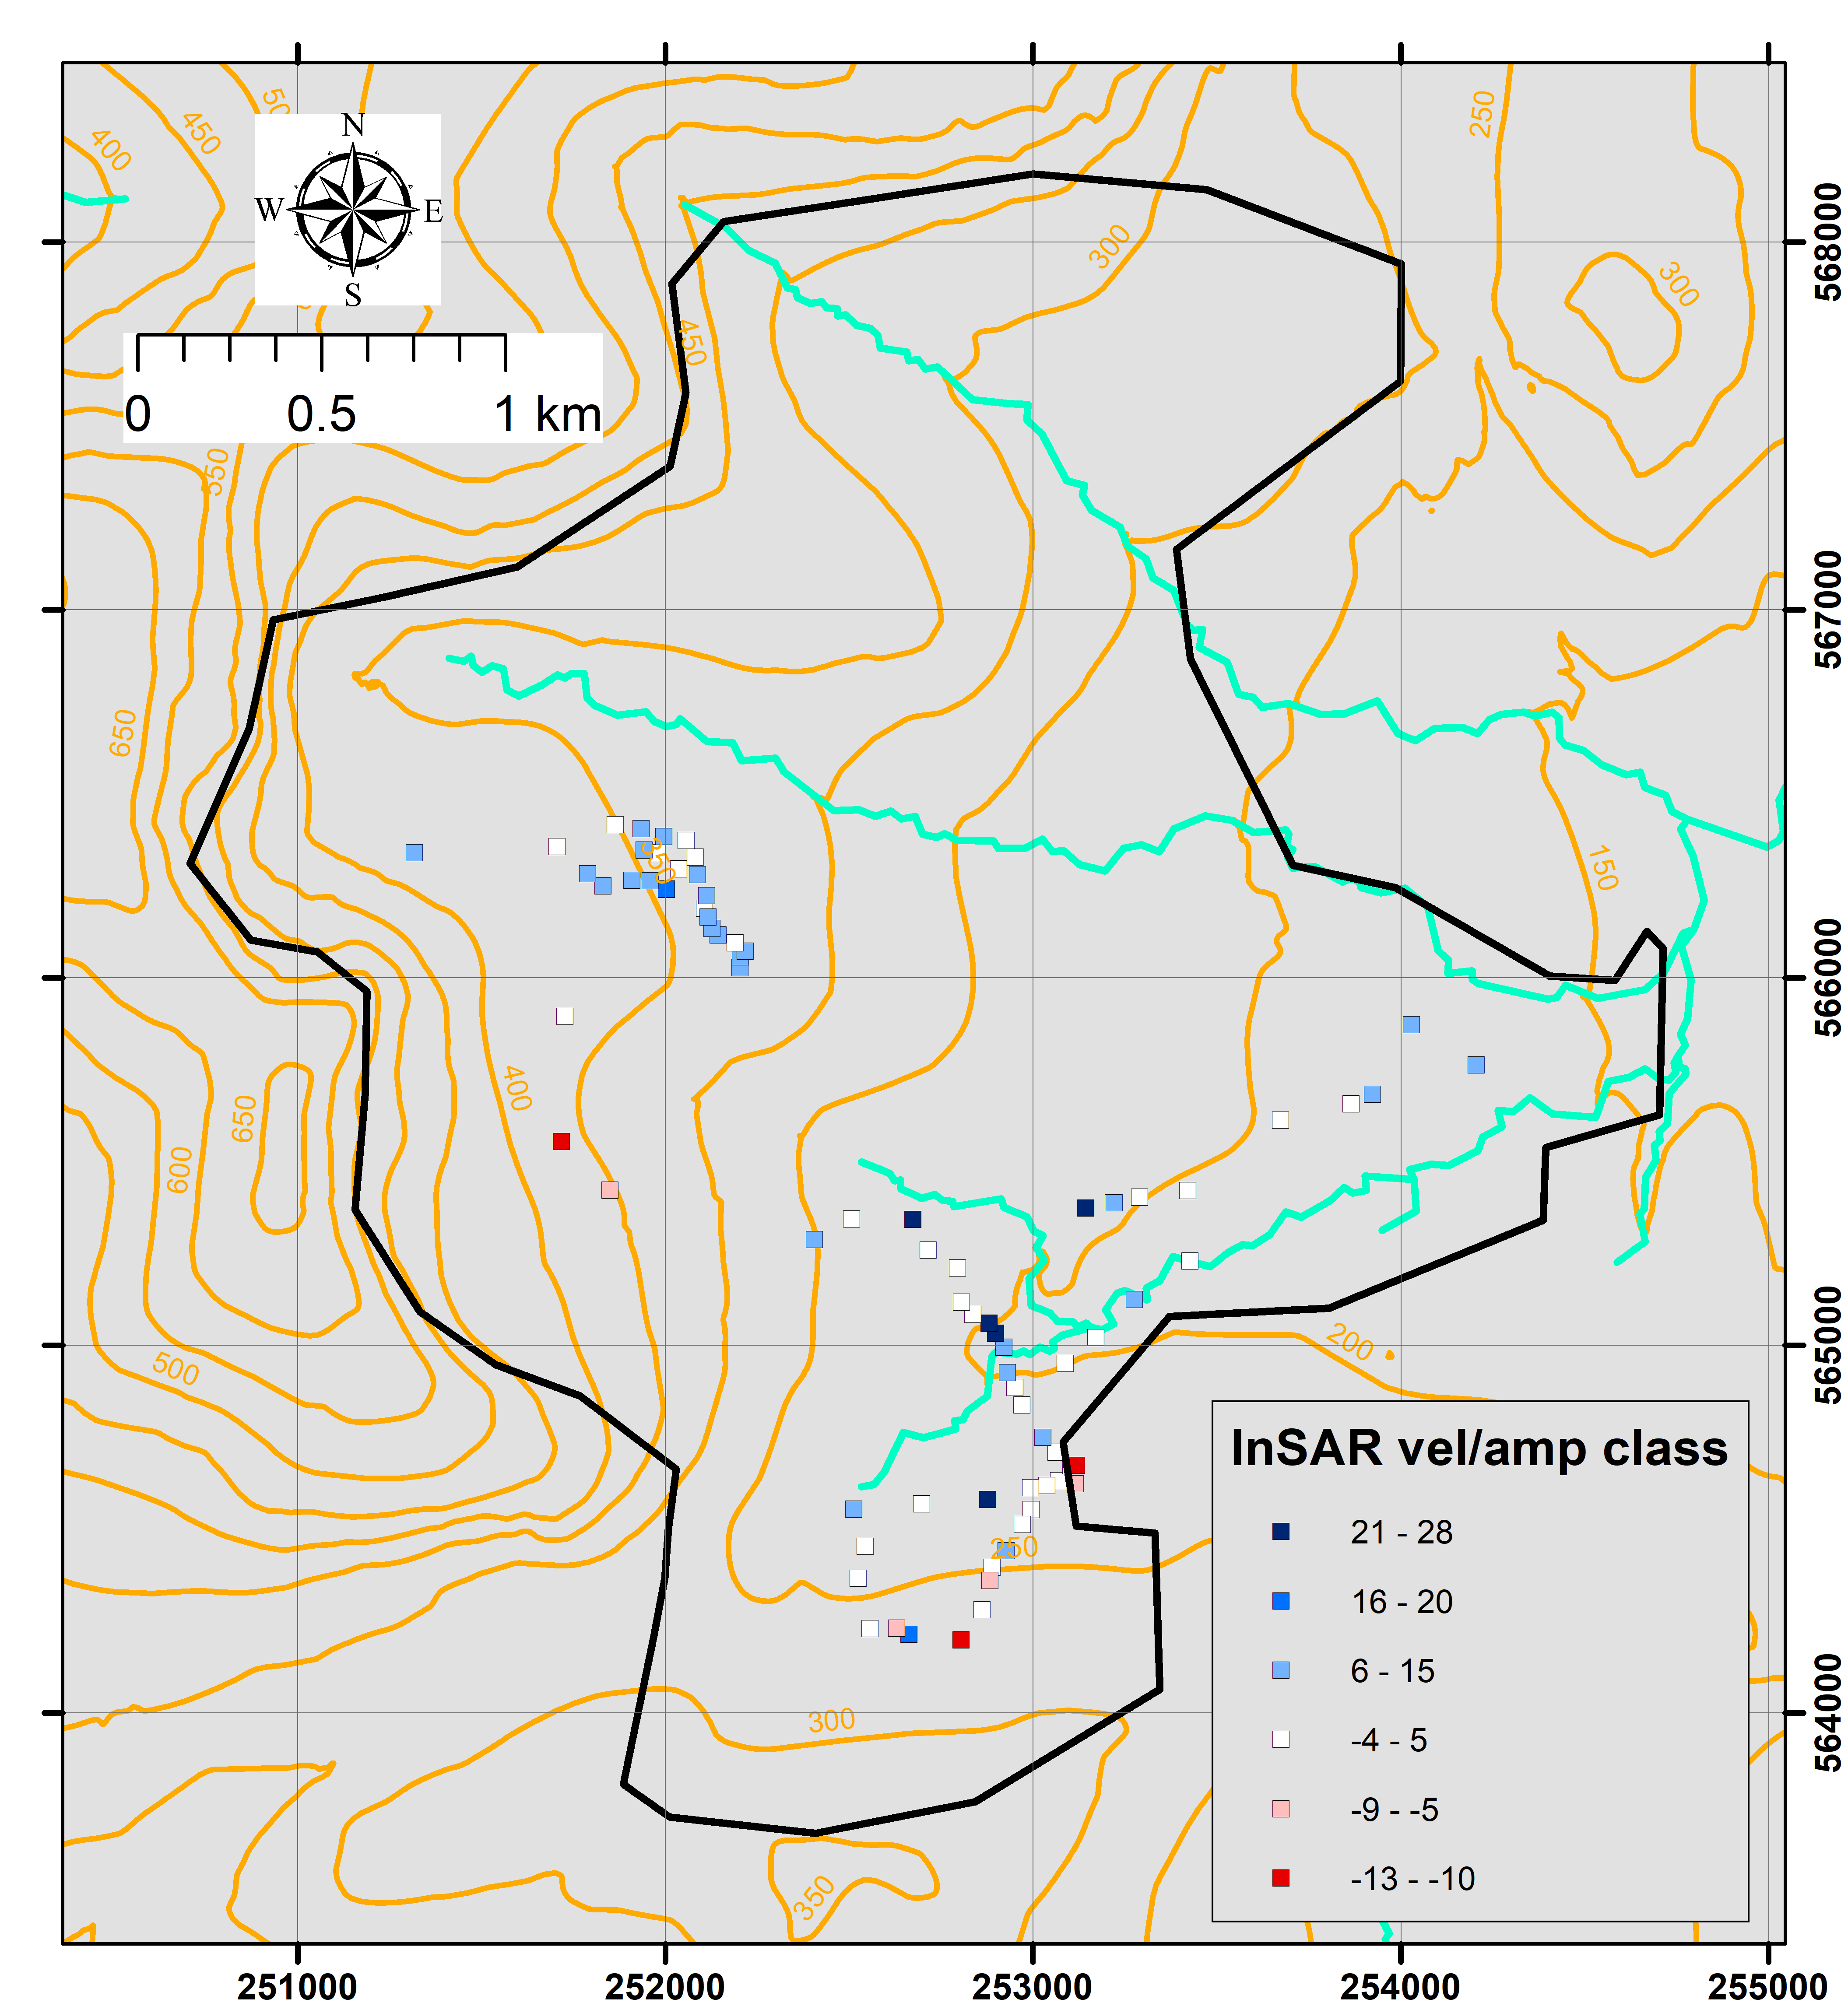
Figure 5: Sample sites and initial classification of condition in Cairnsmore from the field app (see Table 1b for legend condition). For matching InSAR class see Annex 2 Table 1.
Click for a full description
Classification of field app observations scores, 21-26 dark blue, 16-20 mid blue, 6-16 light blue, -4-5 white, -9--5, light red, -13--10 red. High scores and blue colours correspond to peat in a softer and wetter condition, paler colours correspond to peat in a stiffer condition and red colours correspond to peat in a drier condition.
The terrain in Cairnsmore is spatially more variable than the Flow Country. The reason for this is the complex terrain underlying the peat that had resulted from the glacial and post glacial processes that preceded peat deposition. The field observations will reflect this variability within the areas of observation. This makes the area a good test site, as Cairnsmore is far more typical of many upland terrains in Scotland unlike the somewhat subdued terrain of the eastern and central Flow Country.
As a whole, peat condition on the site is more degraded than in the Flow Country, which highlighted the importance of designing a field validation that can better identify differences within a more degraded spectrum of peatland conditions.
Feedback and retrospective analysis of the raw data from the field validation exercise indicated that mutually exclusive contradictions were not properly conveyed in the way the app collected and processed the field data and this needed to be addressed. Therefore, before making a quantitative comparison the following resolutions were made to the data (Annex 4):
- If “restoration” was present, “conservation” could not be present as “conservation” implied presence of near natural conditions (Table 1). Where both had been noted as present by a user, only “restoration” was kept.
- If active “drains” were observed as present, “restoration” or “conservation” could not be observed, as the presence of “drains” contradicts the notion of “restoration” and “conservation” (Table 1). Equally, if “restoration” was observed, “drains” and “conservation” could not also be present. Each instance where more than one of those categories were present, were revised, and only the most appropriate category was checked, with the other two changed to not present.
- If “conservation” is present, “forestry” and “windfarms” could not be present (these management activities are unlikely to sustain near natural conditions as described in the earlier section “Categories, characteristics and criteria used for the field app questionnaire”).
Linear Discriminant Analysis
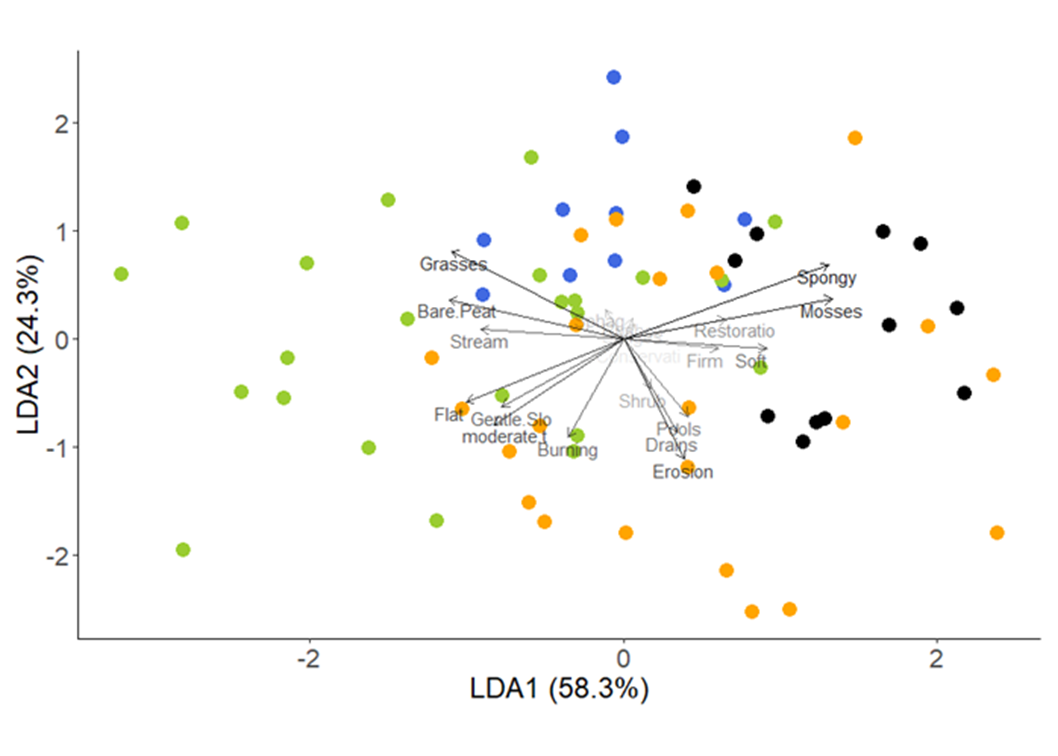
To determine whether the InSAR classes were distinguishable by the variables recorded in the field with the app, we performed a linear discriminant analysis (LDA). LDA is a common technique used for classification or dimension reduction that effectively aims to maximise the distance between the means of two or more classes of objects whilst minimising the within-class variation. In this case, we used the InSAR categories 1 to 4 as a priori classes and applied the LDA to determine which linear combination of features from the field observation best separated them (Figure 6). Prior to the LDA, categories that were recorded as present at all points (“grazing”), absent everywhere (“peat cutting”, “forestry”, “conifers”) or spurious (“windfarm”) were removed from the dataset.
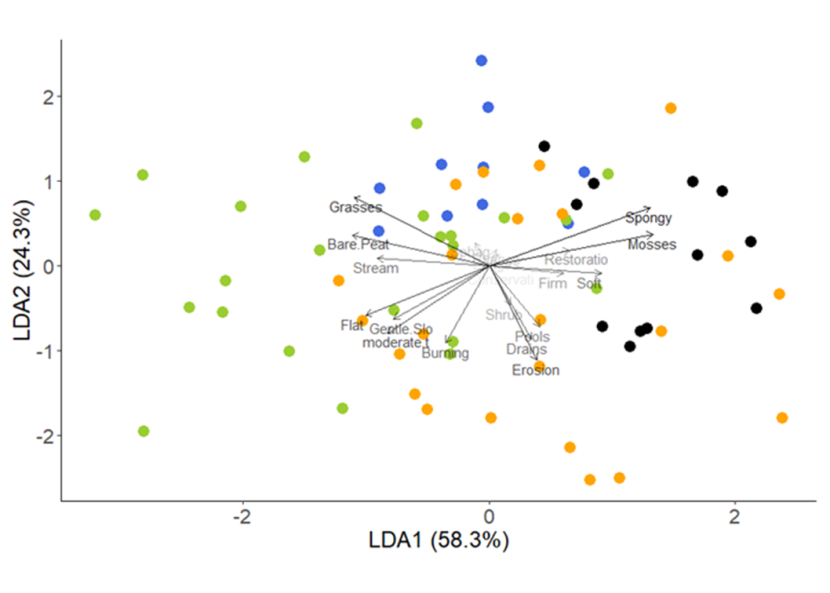
Figure 6: Linear Discriminant Analysis of Cairnsmore field data.
Click for a full description
Biplot of the Linear Discriminant Analysis based on InSAR class and field data. Each dot represents a survey datapoint, with colours corresponding to the InSAR class to which it belongs (Class 1 = blue, Class 2 = green, Class 3 = orange, Class 4 = black), arrows and boldness show the direction and strength of the relationship between each variable and the sites belonging to the different classes.
The LDA indicates that InSAR classes can be differentiated by field observation into distinct but partially overlapping regions, with minimal overlap between classes 1, 2 and 4. In other words, the InSAR classes carry meaning that, despite issues with the data recording, has been captured to some extent by our simple field-based approach. As pools are absent from the area, the recorded pools were generated on account of drain blocking and are mostly associated with our InSAR class 3. Erosion is opposing to class 1 (so likely to be absent from class 1) and associated with class 3, but is undifferentiated from peat hags on deeper peat which spatially associates with class 4. Collection of more appropriate information on the nature of the erosion may address this issue. Non-sphagnum mosses are associated with class 4 and are indicative of drier peat. The presence of burning, Molinia, streams and bare peat tended to be associated with class 2. The association of bare peat (observed as a result of shallow erosion over thin peaty soils) with class 2 is almost certainly because the areas of peat hags were under-recorded.
Bar charts
To complement the LDA, we compared the field characteristics corresponding to each InSAR class using bar charts (Figure 7 a-d and 8). This approach is better suited to our purposes than say a confusion matrix, as both the InSAR classification and field classification methods are new and cover a range of gradational peatland conditions not differentiated in the original classifications based on the Flow Country.
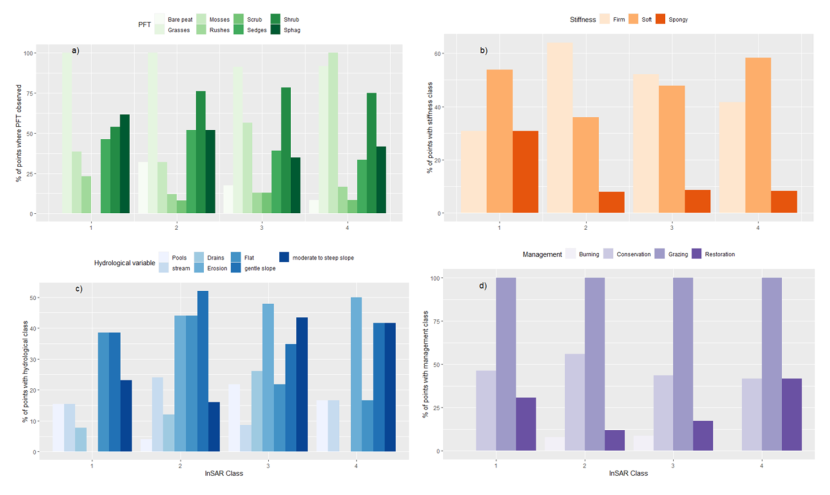
Figure 7: Percentage of field observations in each InSAR class for (a) vegetation (plant functional type), (b) stiffness, (c) hydro-topography, and (d) management categories.
Click for a full description
The bar charts show the percentage of field observations in each InSAR class for (a) vegetation (plant functional type), (b) stiffness, (c) hydro-topography, and (d) management categories. They are described in the following tables below:
a) vegetation
| Class | Sphagnum | Shrub | Sedges | Mosses | Rushes | Grasses | Scrub | Bare peat |
|---|---|---|---|---|---|---|---|---|
Class1 | 62 | 54 | 46 | 38 | 23 | 100 | 0 | 0 |
Class2 | 52 | 68 | 52 | 32 | 12 | 100 | 8 | 32 |
Class3 | 35 | 70 | 39 | 57 | 13 | 91 | 13 | 17 |
Class4 | 42 | 67 | 33 | 100 | 17 | 92 | 8 | 8 |
b) stiffness
| Class | Spongy | Soft | Firm |
|---|---|---|---|
Class1 | 31 | 54 | 31 |
Class2 | 8 | 36 | 64 |
Class3 | 9 | 48 | 52 |
Class4 | 8 | 58 | 42 |
c) hydro-topography
| Class | Pools | Stream | Drains | Erosion | Flat | Gentle Slope | Moderate slope |
|---|---|---|---|---|---|---|---|
Class1 | 15 | 15 | 8 | 0 | 38 | 38 | 23 |
Class2 | 4 | 24 | 12 | 44 | 44 | 52 | 16 |
Class3 | 22 | 9 | 26 | 48 | 22 | 35 | 43 |
Class4 | 17 | 17 | 0 | 50 | 17 | 42 | 42 |
d) management
| Class | Conservation | Grazing | Restoration | Burning |
|---|---|---|---|---|
Class1 | 46 | 100 | 31 | 0 |
Class2 | 56 | 100 | 12 | 8 |
Class3 | 44 | 100 | 17 | 9 |
Class4 | 42 | 100 | 42 | 0 |
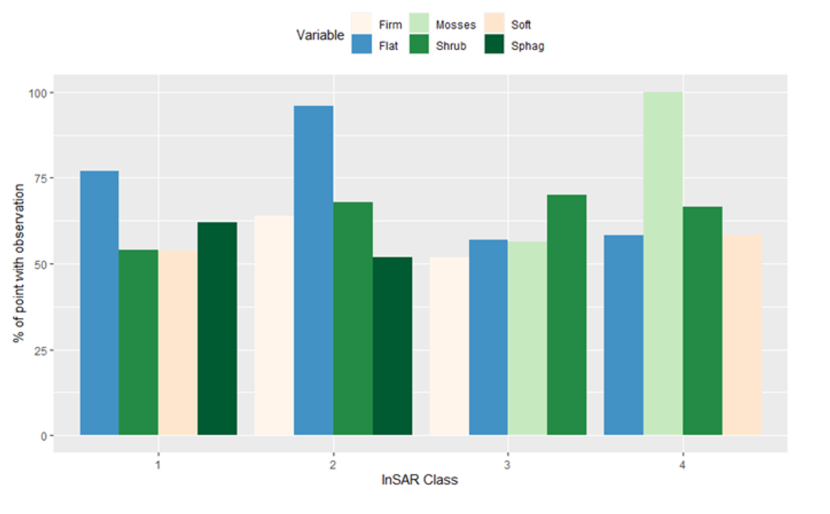
Figure 8: The four most observed field categories (from Figure 7) for each InSAR class.
Click for a full description
A bar chart for each InSAR class 1-4 shows the top four most observed categories by percentage from the field observations. Values are described in the tables below.
| Field category | Observed in class 1 (%) |
|---|---|
| Flat | 77 |
| Sphagnum | 62 |
| Soft | 54 |
| Shrub | 54 |
| Field category | Observed in class 2 (%) |
|---|---|
| Flat | 96 |
| Shrub | 68 |
| Firm | 64 |
| Sphagnum | 52 |
| Field category | Observed in class 3 (%) |
|---|---|
| Shrub | 70 |
| Mosses | 57 |
| Flat | 57 |
| Firm | 52 |
| Field category | Observed in class 4 (%) |
|---|---|
| Mosses | 100 |
| Shrub | 67 |
| Soft | 58 |
| Flat | 58 |
Analysis of the bar charts leads to the following observations:
- InSAR Class 1 is typically observed as being more spongy or soft than any other classes with Sphagnum being more commonly observed. Evidence of erosion or bare peat is not observed. Overall, the observations are consistent with this class being wetter and in a more advanced state of restoration. Better differentiation could be achieved with semi-quantitative (rather than presence absence) categories for the vegetation.
- InSAR Class 2 is typically observed as firmer than any other class and with notably frequent observations of sedge and shrub. It is also more likely to be encountered adjacent to streams and is the class least likely to be observed as under restoration. These observations are consistent with thinner and stiffer mineral (alluvial deposits or glacial till) or peaty soils. The differentiation of this class could be improved by more detailed consideration of specific plant species that are characteristic of mineral rich soil, possibly accounting for differences in underlying geology. Relatively frequent Sphagnum observations may relate to areas of poorly drained thin peat under restoration or spatial variability on poorly drained thin soils.
- InSAR Class 3 is observed as being typically soft or firm with high frequency of shrub and moss. Areas identified as containing pools, which in this area can only be associated with drain blocking, are more frequently observed in class 3 indicating that some of these areas must be under restoration. Overall, the observations are consistent with class 3 representing a range of transitional conditions between class 4 and classes 1 and 2, something that is also demonstrated by its position within the LDA analysis.
- InSAR Class 4 is observed to have a higher frequency of observations of moss and shrub with notably more observations of moss and generally softer conditions than observed in class 3. There is also a higher frequency of observed erosion. This is consistent with deeper, actively degrading peat within hag systems. Specific differentiation of the types of erosion would help separate this class, as may a more detailed quantitative assessment of the dominant vegetation.
General consideration of the usefulness of field observations at differentiating the InSAR classes indicates the following:
- “Grass” and “grazing” are too ubiquitous or insufficiently differentiated in terms of species or intensity to be of use.
- Molinia should be separated from grass to help separate peat and non-peat.
- “Conservation” (recorded everywhere) was not correctly recorded as an indicator of near natural conditions. A better name could be used to avoid confusion with e.g. designation status.
- Semi-quantitative information about vegetation categories (rather than presence-absence) should help pull apart some of the classes, for example by differentiating degraded areas where “Sphagnum” may persist but “shrubs” are dominant (Class 2, 3) from areas where “Sphagnum” is a dominant feature and “shrubs” are present, indicating recovery (Class 1).
- Types of erosion need to be better differentiated, or more consistently reported.
- Analysis would be greatly improved by ensuring a greater sample of observations, specifically within classes 1 and 4.
The overall conclusion of our analysis is that the InSAR classification does successfully help to differentiate a range of ground conditions that are reflected in the field data. However, the collection of field data can be improved to provide a more nuanced view of peatland condition that is better suited to validating the continuum of peatland conditions recognised by the InSAR classes.
Discussion and recommendations
Field observations
Feedback and reflection on the blind testing has been highly productive towards matching what is possible to observe on the ground with the InSAR condition map. From the above analyses we can identify strengths and weaknesses of the current field validation app, in particular the categories, weightings, internal calculation and how user friendly the prototype was.
Our main recommendations for the further development of the app (Section “Proposed categories, characteristics and criteria used for an updated field app questionnaire…) are:
- To remove ambiguities e.g. as it is possible to confuse “conservation” and “restoration” for clarity, “conservation” is renamed as “near natural”.
- To reduce uncertainty and user bias, a pop-up or reference file should be provided in the app.
- As well as the need for differentiating Molinia from other grasses, we found that the binary measure of vegetation dominance for each vegetation category did not describe vegetation co-dominance adequately. This may have led to conflicts in the classification. Following some experimentation, we recommend that all vegetation categories be scored using a semi-quantitative scale with a total maximum of 10 points to be allocated across 10 vegetation classes, based on dominance. Vegetation types that are absent, or where only a few individuals are present, would score 0. As an extreme example, an area entirely dominated by one vegetation type would get a 10 for that vegetation type, and zeros for all other nine vegetation types. We devised some further hypothetical examples of how this would work as it is impossible to determine these proportions from the current data set, unless a return to the field is made (Annex 2 Table 1 and 2).
- We consider that the direction of the weightings is still appropriate (spongy vegetation >0, stiffer vegetation <0) as this differentiates the bimodality in poroelasticity of the near natural endmembers. However, we note that any weightings must show transferability to other peat sites.
- Although it is intuitive that some categories would be mutually exclusive, for example a conservation/near natural site cannot have a windfarm or peat cutting as this is a level of degradation beyond near natural conditions, there is the potential for, and examples of, conflicting selections being made in the app. (see section Comparison to InSAR). To address this, the app should be redesigned to block certain combinations of selections.
- To streamline the input process, blank inputs should be eliminated with a default score.
- Other modifications including Molinia differentiation and peat depth require a definition revision in the app categories.
Proposed categories, characteristics and criteria used for an updated field app questionnaire – version 1.2
Weightings are provided in Annex 2 - Revised field classification score generator file.
Peat stiffness categories and associated observation
These relate to how the peat surface feels when walking over it within an area of approximately 20 m around the observation point to relate to InSAR pixel size - updated to a gradation in values from firm to soft to spongy.
CHANGE made: updated to a gradation in values from firm to soft to spongy.
CHANGE made: all categories are mutually exclusive.
- Spongy - distinct squelching when walking across the surface, with water and vegetation covering the footwear.
- Soft - the surface has a little give when walking over but footwear does not sink through, though there might be some water coming to the surface with each footstep.
- Stiff - the surface is firm when walking over, with no evidence of standing water.
Vegetation categories and associated observation
These relate to the presence of vegetation within an area of approximately 20 m around the observation point. It does not involve looking for individuals but relates to the most dominant groups.
CHANGE made: A total of 10 points must be allocated between all the categories, with more points for the dominant group(s) and 0 points for groups that only have small number of individuals and/or absent.
CHANGE made: Molinia is separated from other grasses on account of the potential for Molinia to be abundant in western sites with high precipitation and it tends to be associated with burning, with other grasses mostly associated with grazing and drainage.
- Sphagnum - there are distinct and obvious continuous carpets or patches of Sphagnum on the ground and/or in pools.
- Shrubs - there are several ericaceous shrubs (e.g. Calluna vulgaris, Erica tetralix).
- Sedges - there are distinct and obvious patches dominated by sedges (e.g. Eriophorum spp., Carex spp., Trichophorum germanicum).
- Mosses - there are distinct and obvious continuous carpets or patches of non-Sphagnum mosses (e.g. Pleurozium schreberii, Polytrichum commune, Hylocomium splendens, Rhytidiadelphus spp.) on the ground, including underneath shrubs.
- Rushes - there are tussocks of rushes (e.g. Juncus spp.).
- CHANGE made: Molinia class added - there is a widespread cover/tussocks of Molinia caerulea.
- CHANGE made: Other grasses class used - there are abundant grasses other than Molinia caerulea such as, Deschampsia spp., Poa spp., etc.
- Scrub - there are some small trees (<2 m) and/or gorse bushes.
- Conifers - it is a conifer plantation or there are several self-seeded conifers >2 m.
- Bare peat - there are patches and/or continuous areas of bare peat, excluding dried out pools during a drought.
Hydrology categories and associated observation
These relate to features that impact water storage within the vicinity (20 m) of the point (Yes =1, No = 0).
CHANGE made: include peat depth approximation.
- Pools - it is a natural pool system.
- Stream - there is a natural stream/river.
- Drains - there are artificial unblocked ditches/drains/furrows. Mutually exclusive with "restoration" and "conservation" from the land use category.
- Erosion - there are signs of erosion, including bare peat, gullying, hags, underlying bedrock exposed.
- Flat - the area is not sloping at all in any direction for at least 20 m.
- Gentle slope - there is a gentle incline.
- Moderate-to-steep slope - there is enough incline for it to be noticeable when walking over 10-20 m.
- CHANGE made: Shallow peat - there are e.g. boulders, rocky outcrops, visible bedrock or other indication that the peat is shallow (<50 cm).
- CHANGE made: Deep peat - there is no indication that the peat is shallow.
Land-use categories (including. historical land use) and associated observation
These relate to current land use and/or past land use where they are not mutually exclusive (Yes = 1, No = 0).
CHANGE made: Near natural class better defined and renamed from Conservation.
- Peat cutting - evidence of past or active peat cutting (manual).
- Grazing - deer/sheep/cattle droppings, footprints, evidence of grazed vegetation, presence of grazing animals.
- Restoration - evidence of intervention (dams, forestry removal, etc.)
- Windfarm - the site is an active windfarm.
- Burning - evidence of burning (e.g. increased cover of Molinia or Calluna), evidence of burning (charred peat, patterns associated with muirburn).
- Forestry - the site is an active forestry site.
- CHANGE made: Near natural (previously Conservation) - the site is near natural and managed for conservation. Mutually exclusive with restoration, forestry and windfarm.
Classification of InSAR data
With respect to the classification of the InSAR data the key requirement is to produce a classification (Table 4) that will work for the majority of peatland types found in Scotland (and throughout the UK).
At the heart of this reconciliation is the interpretation of peak timing and how and when peak timing should be used in the classification. Peak timing may be best interpreted as resulting from processes that are somewhat analogous to those determining the field capacity of soils. In particular, it should give a measure of the time it takes to re-wet the system before gravitational drainage and compaction will effectively limit any further sustained water storage and associated swelling of the peat surface. Steeper and better drained peatlands will reach this capacity sooner. Flatter, poorly drained peatlands with a greater capacity to swell in response to water storage will reach this point later in the year. How long it takes to reach a particular peak timing will be a result of both landscape position, plant functional type and the coupling between the two (i.e. under near natural conditions, flatter wetter areas are more likely to have Sphagnum which in turn has a high capacity for water storage).
In the light of this interpretation, the reasons why peak timing was less useful at Cairnsmore and more useful in Flow Country become obvious. In the Flow Country the landscape is highly modified by the presence of peat, with the sub-peat landscape virtually invisible in many areas. This ‘blanket’ of peat creates a flattened landscape containing pool systems. Additionally, there are zones or margins of better drained peat that can also be considered as near natural environments. When these two near natural environments are combined in the same landscape they generate the bimodal signal such as that found in the Flow Country (Figure 3). At Cairnsmore the peatland is a steeper, better drained, landscape with greater topographic relief. These increased slope gradients dominate the hydrology within the peat, producing typically earlier peak timings (Figure 3) than in the Flow Country.
In the Flow Country the extremes in peak timing distinguish two near natural conditions, one wetter and one drier that both lie within the region defined as class 1 in the Cairnsmore classification scheme. So, to reconcile the classification we propose that this class 1 should be subdivided into early, mid and late peak timing classes or left as a single class as required (Table 4). The advantage of subdividing the class is that, as shown previously (Marshall et al., 2021), the timing can be a powerful indicator of the restoration end point and plant functional type. Although classes 2, 3, and 4 could also be subdivided based on timing, and this may also indicate the likely restoration endpoint and probable trajectory, it would add complexity to the classified map. At this stage, it is not clear as to the benefits of this added complexity.
Restoration trajectories within this classification scheme should move the peatland condition from its pre-restoration condition, class 3 and 4 (Figure 4b), on a trajectory that evolves towards less negative velocities and higher amplitudes, potentially with a shift in timing that would be determined by landscape position. Trajectories within this classification scheme are the basis of change detection methods that are being developed via the NERC Landscape Decisions Programme (Grant NE/T010118/1) and these methods if successful should provide a robust spatial quantification of changing peatland condition across Scotland. An alternative approach to change detection would be to request multiple InSAR measures of annual velocity that can be used to plot trajectories on a plot of velocity vs. amplitude, however our expectation is that it will be possible to determine change from the properties of the InSAR time series alone.
To test the broad applicability of the revised classification scheme, it should be re-applied to the Flow Country and further testing should be undertaken on lowland raised bogs and other peatlands of interest. The application of the revised classification to Moss of Crombie (without the differentiation of class 1) could enable Peatland ACTION to undertake independent testing of the revised classification scheme. It is likely that this iterative approach would result in some further refinements. For example, it is known that the mesotope centres in the Flow Country have tended to subside over the past few years while maintaining their near natural condition and while maintaining the high amplitude behaviour of a near natural and resilient peatland. Therefore, the velocity and amplitude of mesotope centres in known condition would help better constrain the boundary between class 1 and classes 3 and 4 at higher amplitudes.
Finally, an iterative approach to refining the classification demonstrates that this classification system should lend itself to a machine learning approach that uses known conditions to develop the classification. This would also allow the classification to be developed for local, regional and national frameworks. So, for example, peat in good condition may be absent from many restoration areas, yet conditions may vary and known variations in condition can still be used to produce a locally referenced classification, which in turn can be regionally or nationally referenced as required.
| Class | Example Conditions | Velocity | Amplitude | Timing | Colour |
|---|---|---|---|---|---|
| 1a | Near natural wet peatland, very soft, spongy, sphagnum abundant | Average close to zero or positive | High |
|
|
| 1b | Near natural, natural margins and drier near natural peat on slopes | Average close to zero or positive | Moderate |
|
|
| 1 | Peat with a dynamic surface – soft, wet, rewetted | Close to zero | High | Non-specific |
|
| 2 |
| Close to zero | Low
| Not used |
|
| 3 | Actively degrading and/or at early stages of recovery from a more drained/eroded degraded state |
| Not used | Not used |
|
| 4 | Actively draining deep peat on account of drains or erosion. e.g. peat haggs. |
| Not used | Not used |
|

Carbon accounting
A further logical step in the development of the new classification scheme is its relationship to the Tier 2 carbon emission factors for peatland (Evans et al., 2017) and consideration of what additional information that may be required to define the corresponding Tier 2 emission class (Table 5).
| Class | Example Conditions | Emission Class | Additional info | Emission factor tCO2e ha-1 yr-1 |
|---|---|---|---|---|
| 1a | Near natural wet peatland, very soft, spongy, sphagnum abundant | Near naturalT2 | Mesotope centre Sphagnum dominant | 0.01 |
| 1b | Near natural, natural margins and drier near natural peat on slopes | Near drier peatland | Mesotope margin No modification | 0.01 |
| 1 | Peat with a dynamic surface – soft, wet, rewetted | Rewetted bogT2 | In defined area of known rewetting | 0.81
|
| 1 | Peat with a dynamic surface – soft, wet, rewetted | Heather or grass dominated modified bogT2 | Fire or grazing known No restoration or drainage activities | 2.08 |
| 2 | Naturally drier stiff, thin peat or mineral soil or Recovering peat in transition to class 1 | No peatb | Peat thickness below threshold | None |
| 2 | Naturally drier stiff, thin peat or mineral soil or Recovering peat in transition to class 1 | Transitional from drained/eroded to rewetted | In area under restoration in which peat depth is known to exceed required threshold | 0.81 |
| 3 | Actively degrading and/or at early stages of recovery from a more drained/eroded degraded state | Eroded modified bogT2 | Drained, eroded | 4.85 |
| 3 | Actively degrading and/or at early stages of recovery from a more drained/eroded degraded state | Eroded modified bogT2 | Undrained, eroded | 3.55 |
| 3 | Actively degrading and/or at early stages of recovery from a more drained/eroded degraded state | Drained heather or grass dominated modified bog T2 | Drained, not eroded Fire or grazing known | 3.40 |
| 4 | Actively draining deep peat on account of drains or erosion, e.g. peat hags | Eroded modified bogT2 | Drained, eroded | 4.85 |
| 4 | Actively draining deep peat on account of drains or erosion, e.g. peat hags | Eroded modified bogT2 | Undrained, eroded | 3.55 |
| 4 | Actively draining deep peat on account of drains or erosion, e.g. peat hags | Drained heather or grass dominated modified bog T2 | Drained, not eroded Fire or grazing known | 3.40 |
As a result of the simple definitions of the Tier 2 classes very little additional land management information is required to place the InSAR class in a Tier 2 class. However, the range of physical conditions represented by the InSAR signal also highlights that while the Tier 2 classifications may be pragmatic, they encompass a wide range of unresolved and potentially anomalous peatland conditions. For example, there is no consideration for condition trajectories; is it reasonable to recognise that equivalent rates of subsidence could have two different emission factors just because one is naturally drained and other artificially drained? In this respect an interesting exercise would be to map measured emissions onto the InSAR classification scheme and explore whether it would be possible to contour the classification diagram with respect to emission factors.
Conclusion
The revised InSAR classification and field observations for this site provide a view of a continuum of peatland conditions. Differences in the frequency of field observations correspond to differences in the InSAR class and these differences agree with qualitative observations and the InSAR class definitions. Analysis of the field data relative to field observations and InSAR classifications indicates how the field app can be improved to better validate the InSAR classes, resulting in a number of recommendations for app development.
In terms of the next steps our recommendations are to:
- Iterate the development of the revised classification using a machine learning approach.
- Apply the revised classification to a range of Peatland ACTION sites across Scotland.
- Shift the future focus of this work to quantification of change and test statistically robust change detection against areas with a known history of intervention.
- Consider quantifying the relationship between carbon emission factors and InSAR class.
References
Alshammari, L., Boyd, D.S., Sowter, A., Marshall, C., Andersen, R., Gilbert, P., Marsh, S. and Large, D.J., 2020. Use of surface motion characteristics determined by InSAR to assess peatland condition Journal of Geophysical Research: Biogeosciences, 125, e2018JG004953.
Bradley, A.V., Andersen, R., Marshall, C., Sowter, A. and Large, D.J., 2022. Identification of typical ecohydrological behaviours using InSAR allows landscape-scale mapping of peatland condition Earth Surface Dynamics, 10(2), 261-277.
Evans, C., Artz, R., Moxley, J., Smyth, M., Taylor, E., Archer, N., Burden, A., Williamson, J., Donnelly, D., Thomson, A., Buys, G., Malcolm, H., Wilson, D., Renou-Wilson, F. and Potts, J., 2017. Implementation of an Emissions Inventory for UK Peatlands. Report to the Department for Business, Energy & Industrial Strategy Centre for Ecology and Hydrology, Bangor. 88pp.
Marshall, C., Sterk, H.P., Gilbert, P.J., Andersen, R., Bradley, A.V., Sowter, A., Marsh S. and Large, D.J., 2022. Multiscale Variability and the Comparison of Ground and Satellite Radar Based Measures of Peatland Surface Motion for Peatland Monitoring Remote Sensing. 14(2), 336.
Marshall C., Bradley, A.V., Andersen, R. and Large, D.J., 2021. Using peatland surface motion (bog breathing) to monitor Peatland ACTION sites NatureScot Research Report 1269.
MERGIN, 2022. Mergin maps
QGIS, 2022. QGIS Geographic Information System QGIS Association.
Annex 1 – Annual classified InSAR condition map of Moss of Crombie
The location (right) and extent of the Moss of Crombie area (© Crown copyright [and database rights] [2023] OS AC0000813979)
Click for a full description
The outline of the Moss of Crombie area, surrounding drainage network and contours at 10 and 50 m intervals. On the right is a map of Scotland showing the location of the study area. Co-ordinates are in Ordnance Survey British National Grid and are in metres.
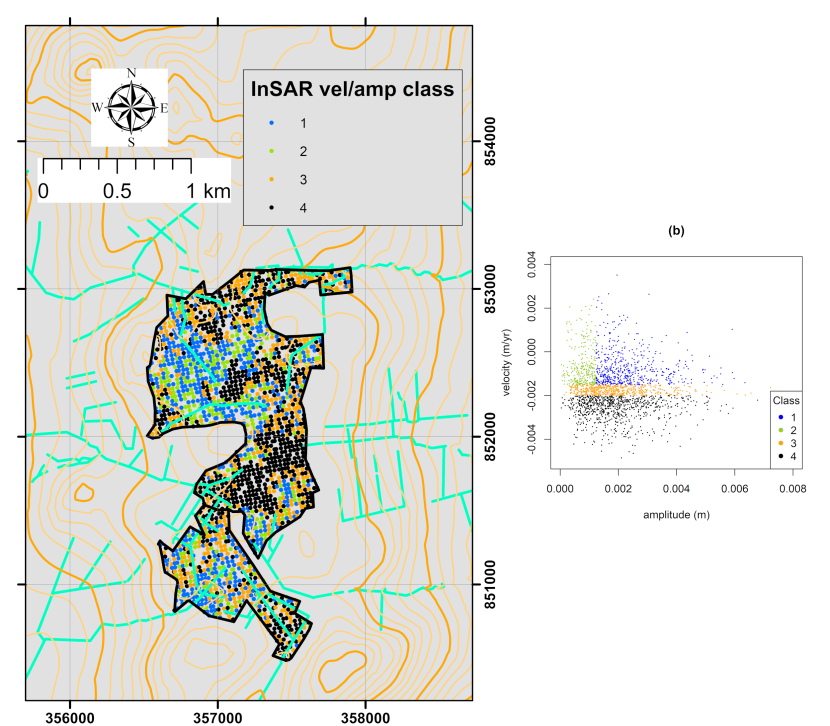
Figure A1-2: Classified InSAR condition map of Moss of Crombie for 2016-17, showing: (a) spatial distribution of classes 1 to 4 (defined in Table 4), and (b) the amplitude and velocity thresholds used to bound the classes in the distribution.
Click for a full description
InSAR velocity amplitude class, 1 - Soft, 2 - Stiff, 3 – Degrading-subsiding, 4 - Degrading–rapidly subsiding.

Figure A1-3: Classified InSAR condition map of Moss of Crombie for 2017-18 showing: (a) spatial distribution of classes 1 to 4 (defined in Table 4), and (b) the amplitude and velocity thresholds used to bound the classes in the distribution.
Click for a full description
InSAR velocity amplitude class, 1 - Soft, 2 - Stiff, 3 – Degrading - subsiding, 4 – Degrading – rapidly subsiding.
Figure A1-4: Classified InSAR condition map of Moss of Crombie for 2018-19 showing: (a) spatial distribution of classes 1 to 4 (defined in Table 4), and (b) the amplitude and velocity thresholds used to bound the classes in the distribution.
Click for a full description
InSAR velocity amplitude class, 1 - Soft, 2 - Stiff, 3 – Degrading-subsiding, 4 – Degrading–rapidly subsiding
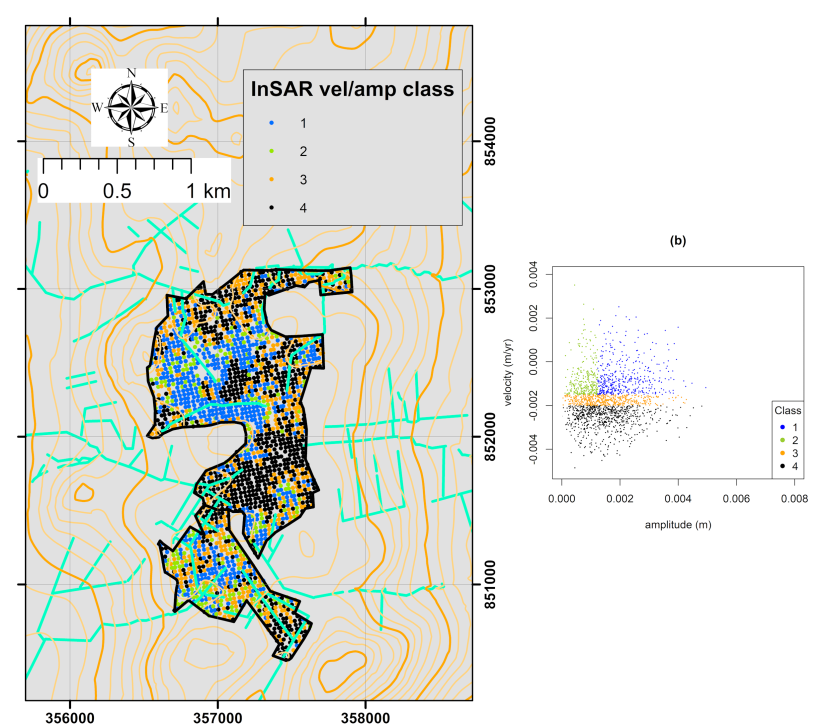
Figure A1-5: Classified InSAR condition map of Moss of Crombie for 2019-20 showing: (a) spatial distribution of classes 1 to 4 (defined in Table 4), and (b) the amplitude and velocity thresholds used to bound the classes in the distribution.
Click for a full description
InSAR velocity amplitude class, 1 - Soft, 2 - Stiff, 3 – Degrading-subsiding, 4 – Degrading–rapidly subsiding
Annex 2 – Field classification score generator files
Annex 2 is provided in the form of two downloadable files, the first containing the original field classification score generator and the second containing the revised field classification score generator. The files are available in CSV file format below. Please note that these documents are not fully accessible. If you require an accessible format, please use the feedback form on our website.
Annex 3 – Annual classified InSAR condition maps of Cairnsmore
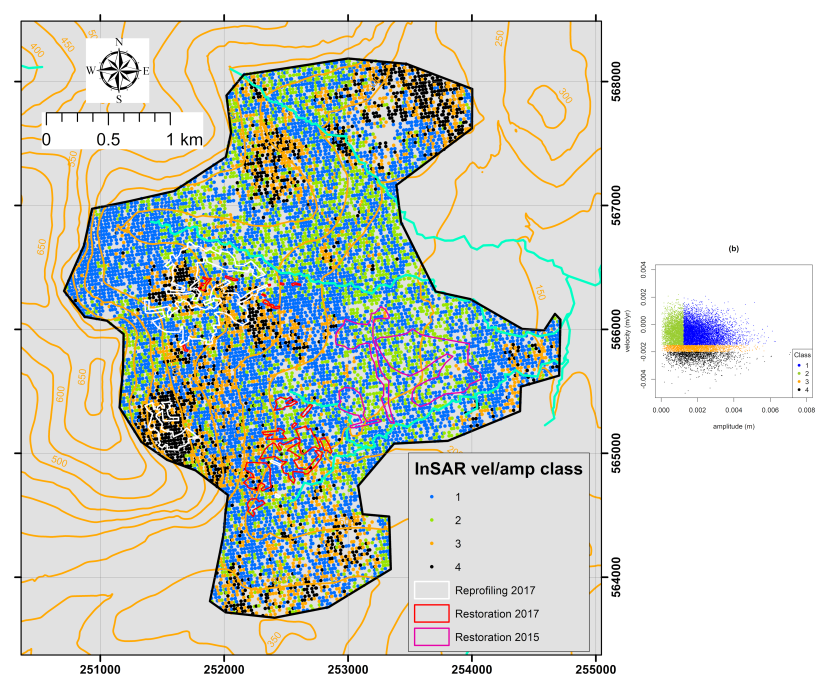
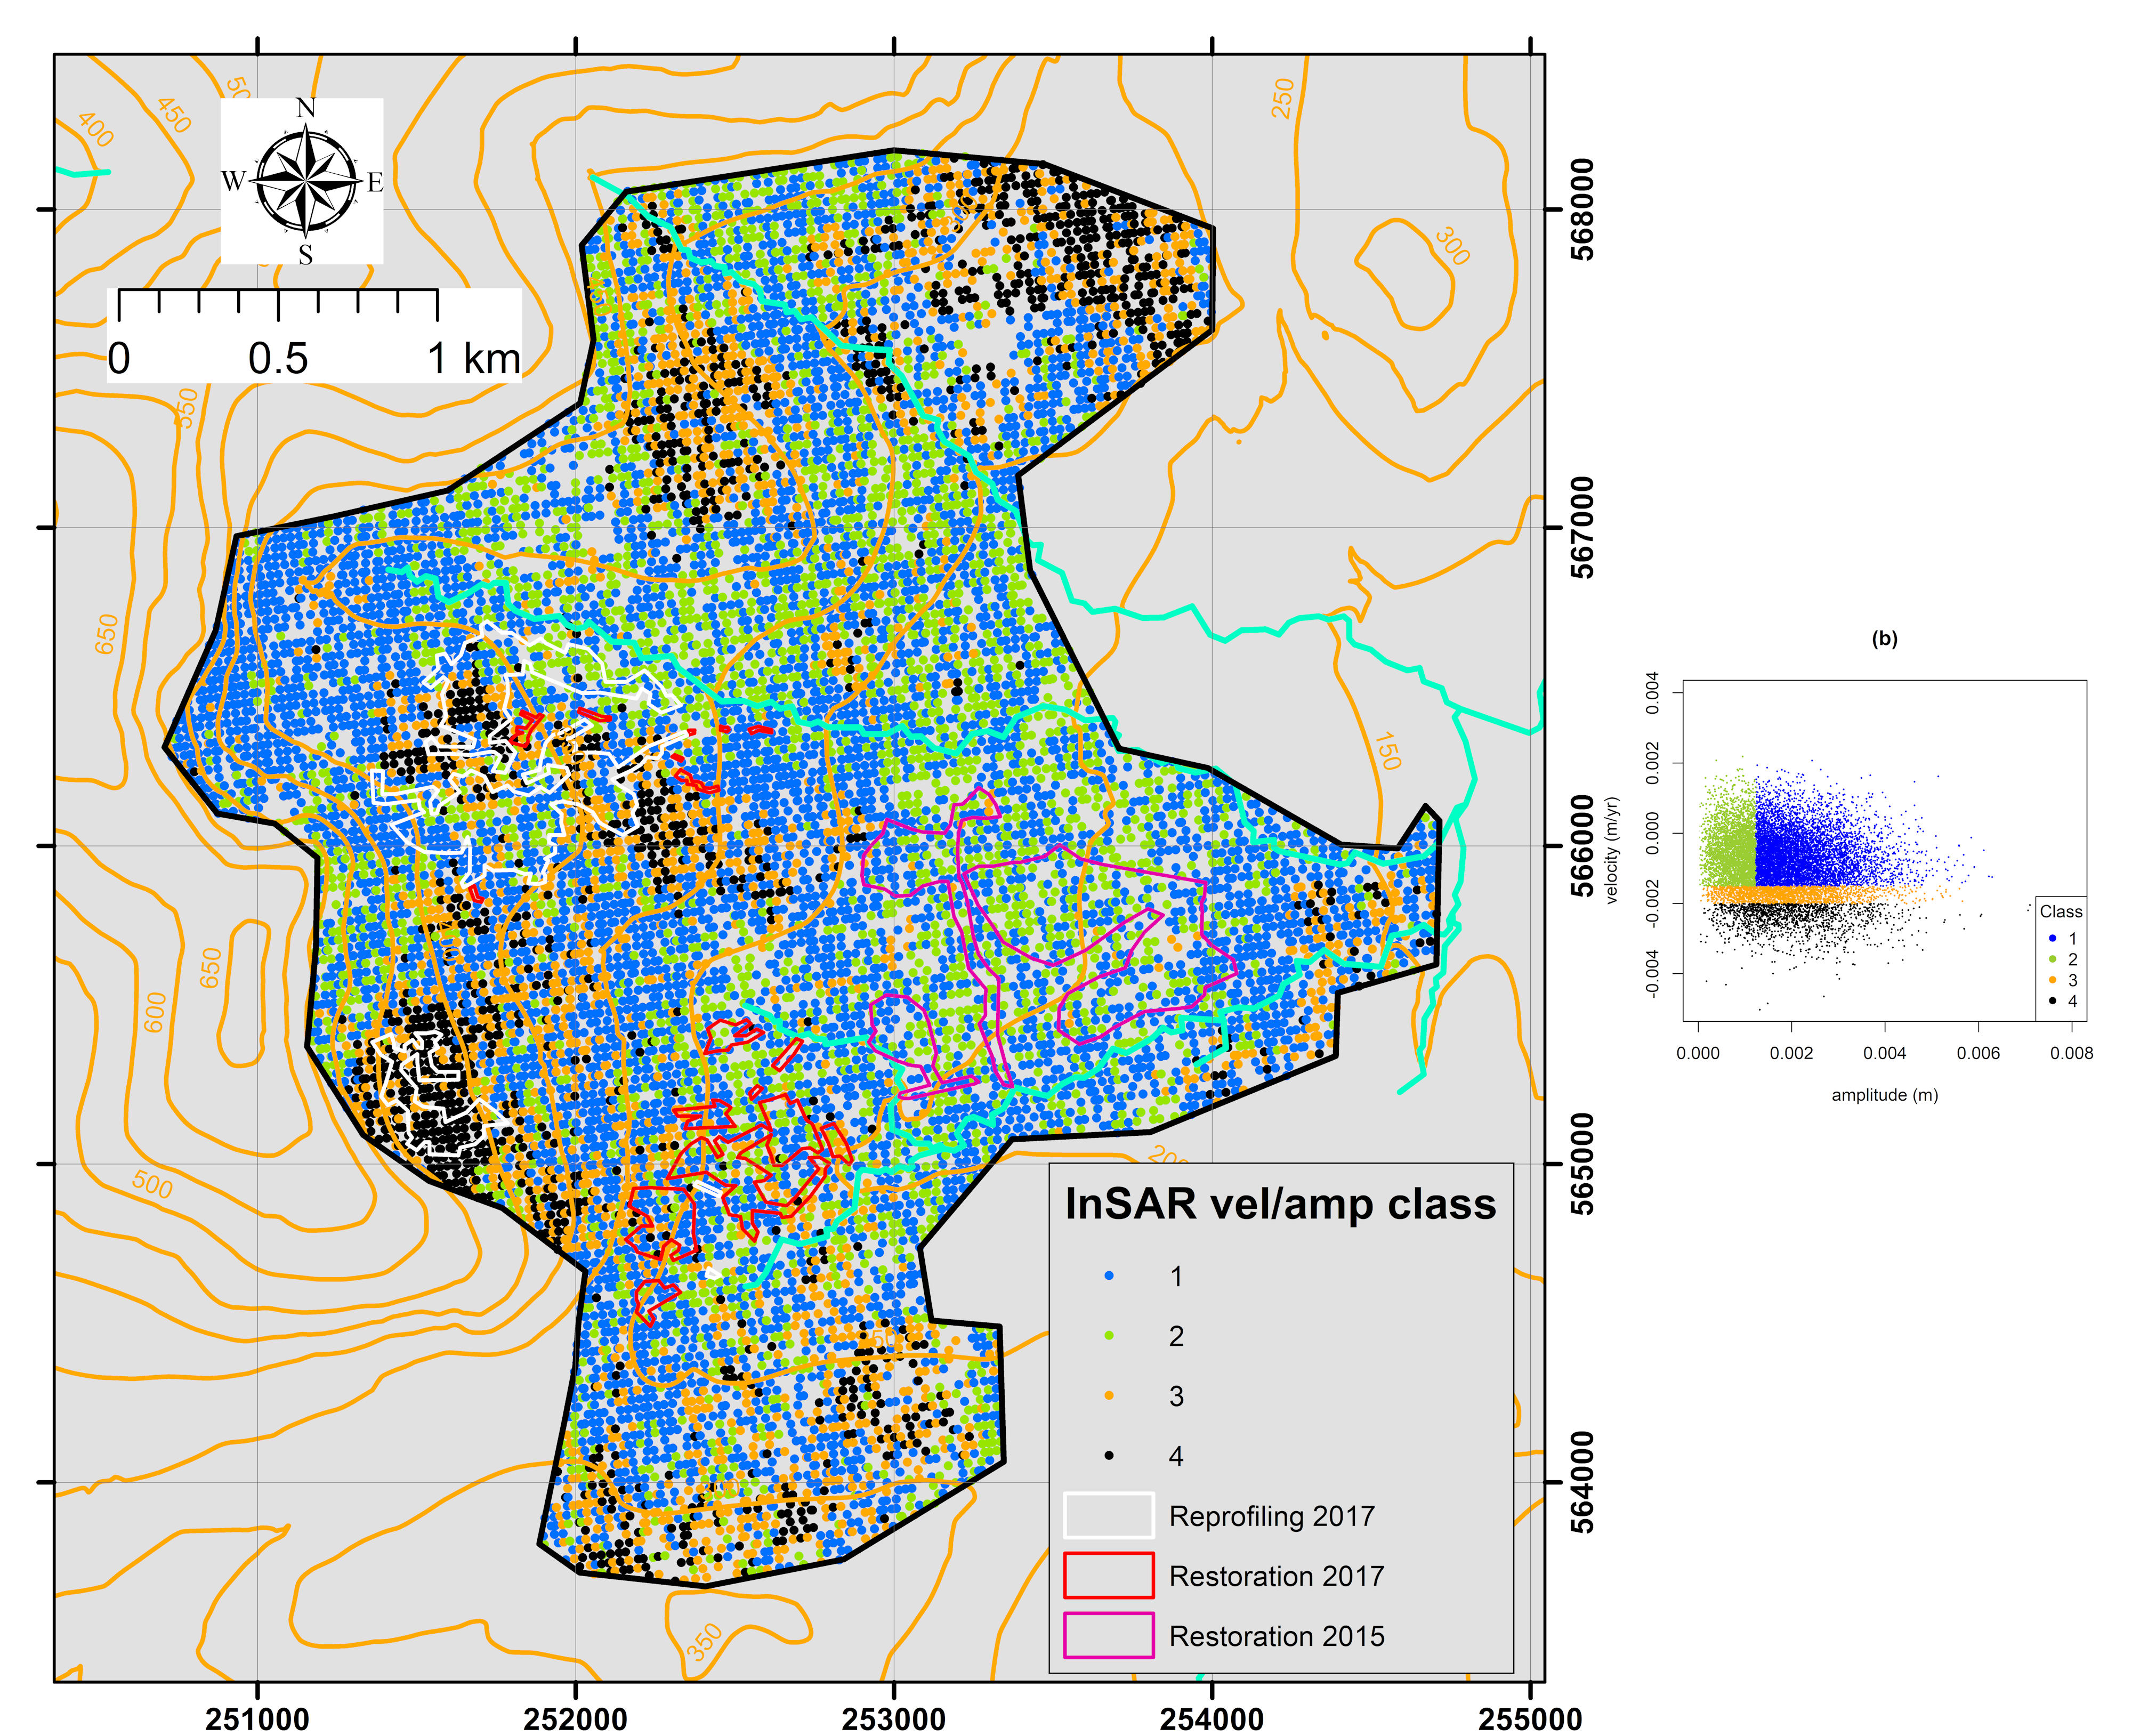
Figure A3-1: Classified InSAR condition map of Cairnsmore for 2016-17, showing: (a) spatial distribution of classes 1 to 4 (defined in Table 4), and (b) the amplitude and velocity thresholds used to bound the classes in the distribution.
Click for a full description
Velocity-amplitude classification scheme and classified map of the Cairnsmore National Nature Reserve 2016-17 showing four classes, two actively degrading classes 3 and 4, a stiff class 2 and a soft wet class 1. The boundaries of areas of hag reprofiling in 2017 and restoration by ditch blocking in 2017 and 2015 are overlain.
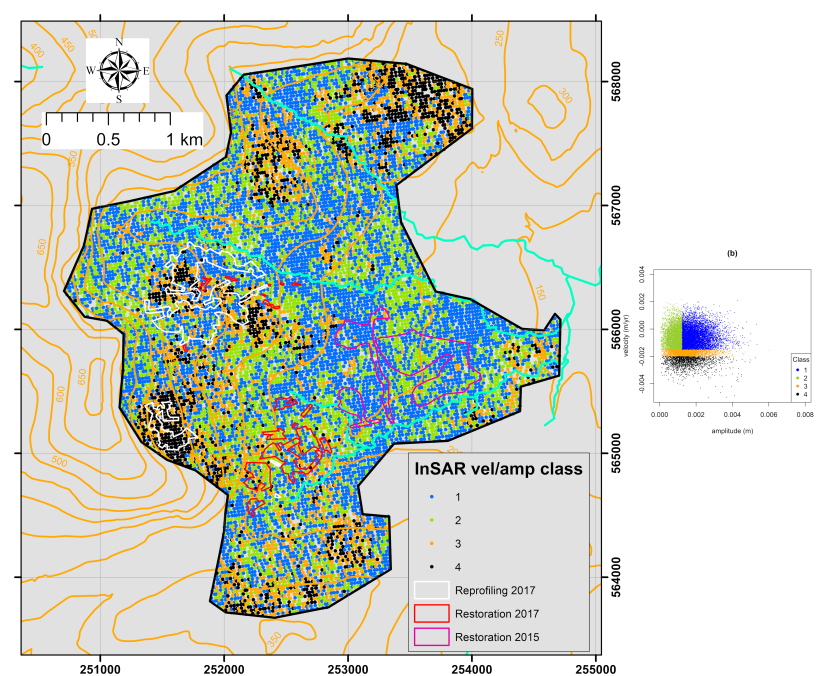
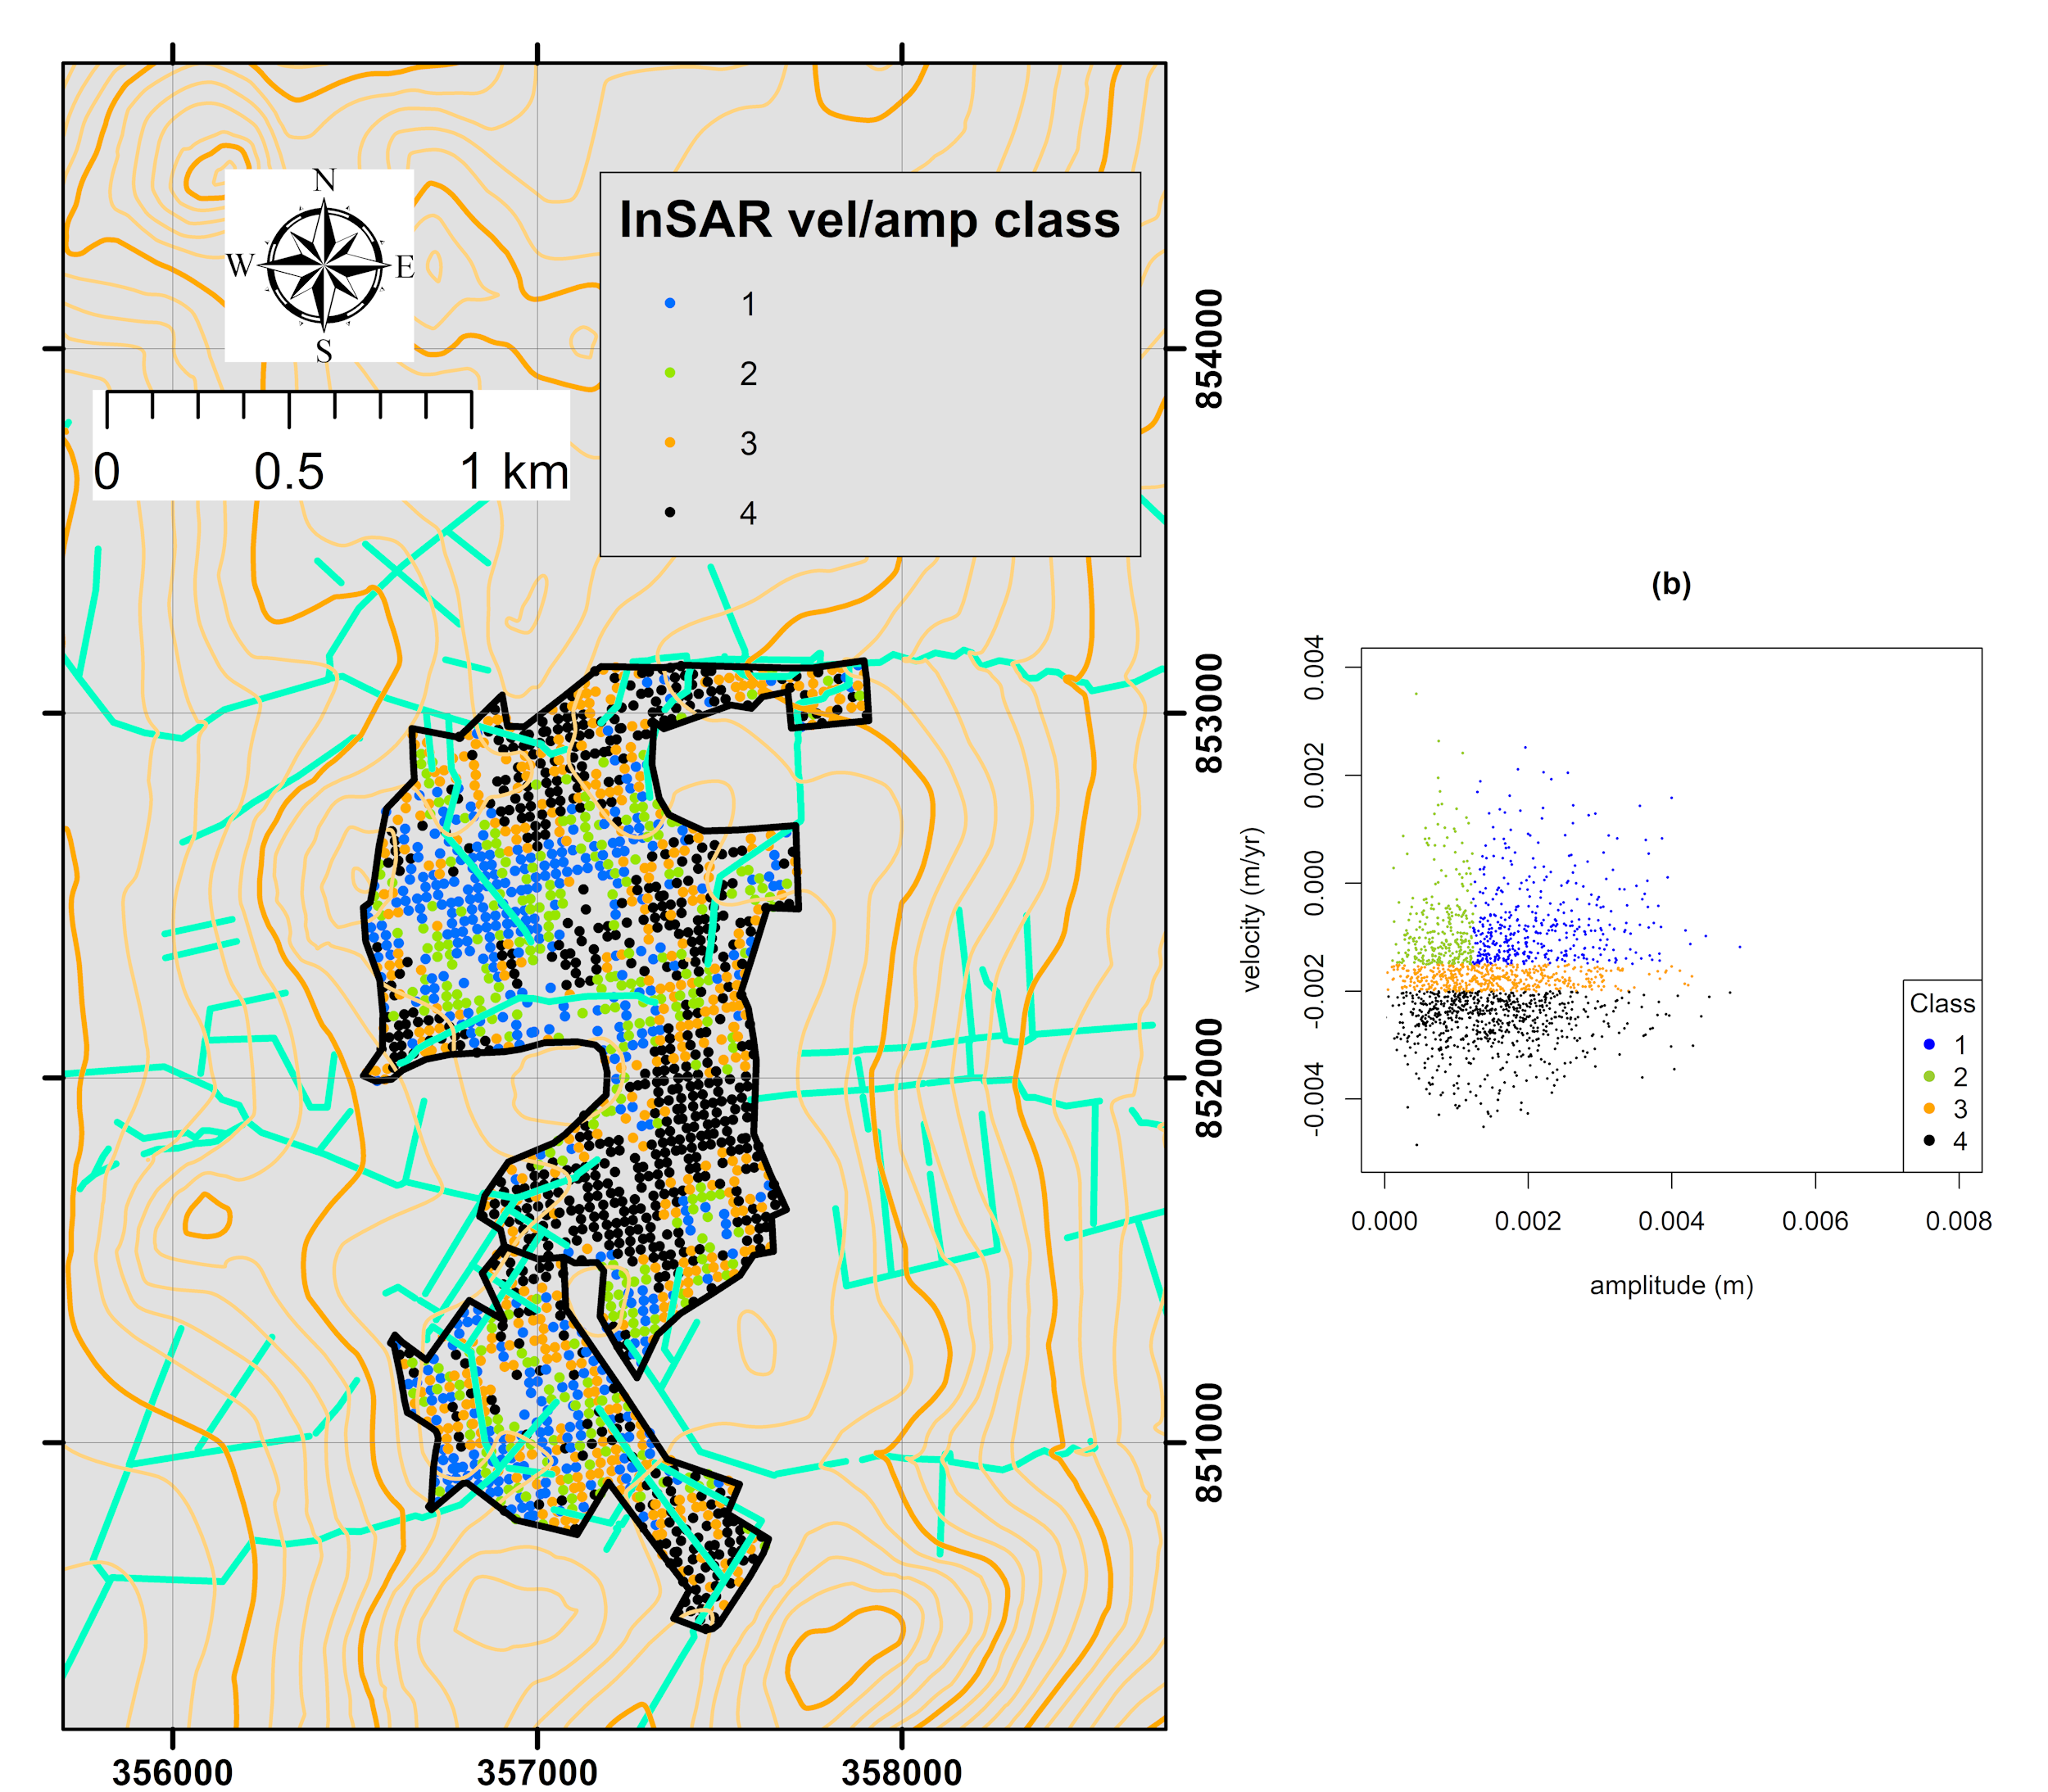
Figure A3-2: Classified InSAR condition map of Cairnsmore for 2017-18 showing: (a) spatial distribution of classes 1 to 4 (defined in Table 4), and (b) the amplitude and velocity thresholds used to bound the classes in the distribution.
Click for a full description
Velocity-amplitude classification scheme and classified map of the Cairnsmore National Nature Reserve 2017-18 showing four classes, two actively degrading classes 3 and 4, a stiff class 2 and a soft wet class 1. The boundaries of areas of hag reprofiling in 2017 and restoration by ditch blocking in 2017 and 2015 are overlain.
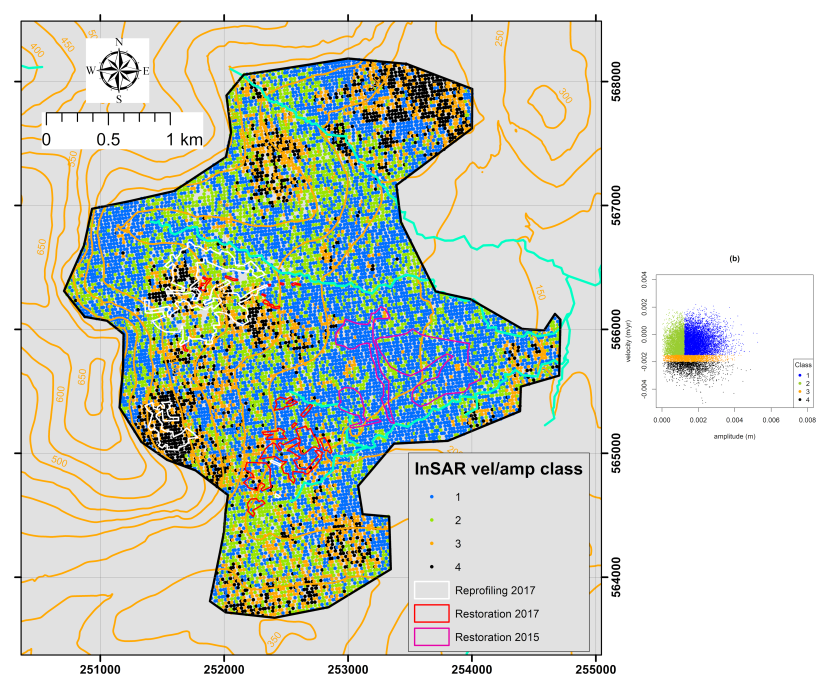
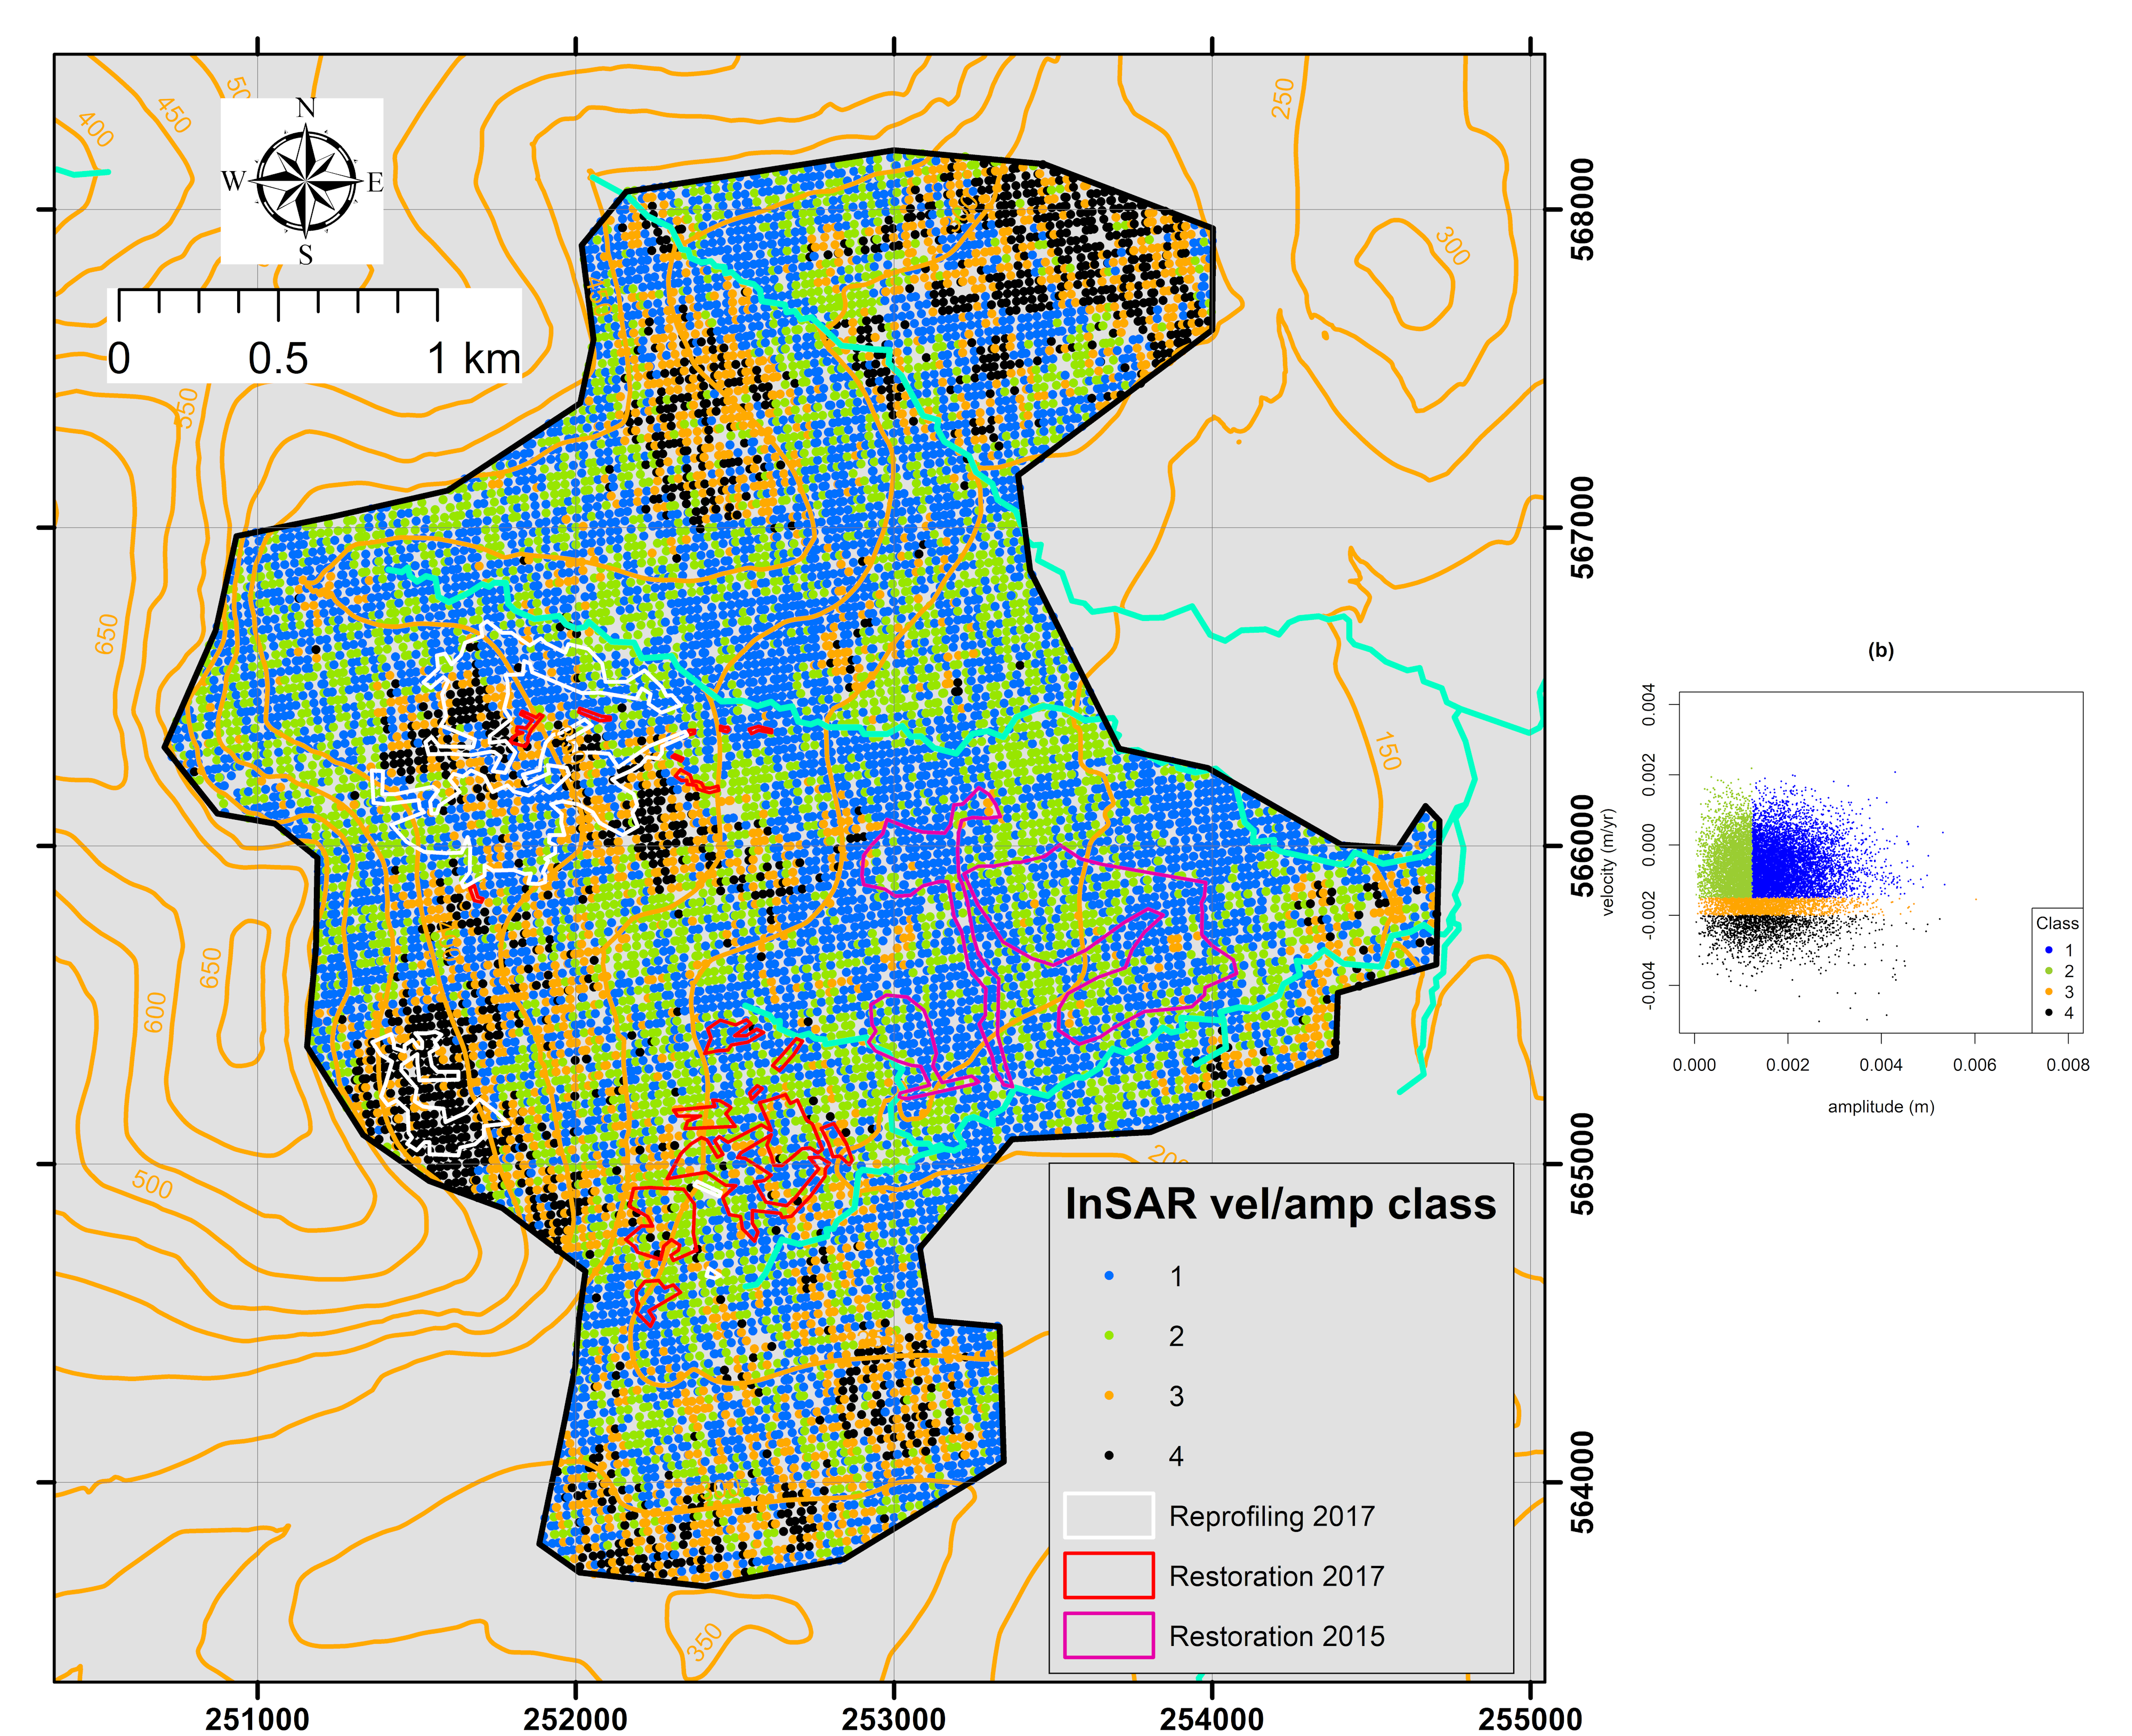
Figure A3-3: Classified InSAR condition map of Cairnsmore for 2018-19 showing: (a) spatial distribution of classes 1 to 4 (defined in Table 4), and (b) the amplitude and velocity thresholds used to bound the classes in the distribution.
Click for a full description
Velocity-amplitude classification scheme and classified map of the Cairnsmore National Nature Reserve 2018-19 showing four classes, two actively degrading classes 3 and 4, a stiff class 2 and a soft wet class 1. The boundaries of areas of hag reprofiling in 2017 and restoration by ditch blocking in 2017 and 2015 are overlain.
Annex 4 – Field observation data obtained at Cairnsmore
Annex 4 is a copy of field observation data collected at Cairnsmore. It has been edited for contradictions, errors etc. It has been provided in CSV file format below. Please note that this document is not fully accessible. If you require an accessible format, please use the feedback form on our website.


