NatureScot Research Report 1400 - Deer Vehicle Collision Analysis 2022–2024
Published: 2026
Authors: Lush, M.J. and Lush, C.E.
Cite as: Lush, M.J. and Lush, C.E. Deer Vehicle Collision Analysis 2022–2024. NatureScot Research Report 1400.
Contents
- Keywords
- Non-technical summary
- Background
- Main findings
- Acknowledgements
- Abbreviations
- Introduction
- Data collection regime, processing and analysis
-
Results
- Change in volume of data by source, type and years
- Volume and trends of DVC records from core sources across years
- Volume and trends of DVC records from supplementary data sources across years
- Overview of Scotland-wide distribution of DVC records from core sources
- Changes in volume of TROC reports overall and by region
- Changes in the volume of SSPCA and FLS records
- Changes to the number of human injury collisions and damage-only DVCs attended by the police
- DVC distribution and change on the wider road network
- DVC distribution and change on the trunk road network
- Combined records from all core sources by local authority areas
- Human injury collisions and damage-only DVCs attended by the police
- DVC frequency in relation to Time of day and Season
- DVC reports with reliable detail of deer species
- Wildlife Vehicle Collisions including non-deer species
- DVC risk based on recent incidents
- Predicting DVC risk using environmental data
- DVCs in Deer Management Priority Areas
- Navidale mobile VMS deployment
-
Discussion and recommendations arising
- Data collection and collation
- Basic analysis, trends and distribution of DVC occurrence
- DVCs resulting in human injury or vehicle damage
- Lack of British Deer Society data
- Incident-based assessment of DVC risk
- Predicting DVC risk
- Addition of non-deer species to the database
- Mitigation at Navidale
- TROC reports not resulting in a deer carcass uplift
- The effect of changes to the road network
- Marker post datasets
- The potential of animal rescue centres to collect DVC data
- Increasing data mobilisation and improving quality
- Annexes
Keywords
Deer vehicle collision; wildlife vehicle collision; wildlife management; road management; road networks; risk mapping.
Non-technical summary
Overview
Deer numbers across Scotland have grown over recent decades, potentially bringing deer into closer contact with people and vehicles. This study updates Scotland’s long-running monitoring of Deer Vehicle Collisions (DVCs), using over 43,000 mapped incidents recorded between 2008 and 2024. The aim is to understand where and when collisions happen most often, so steps can be taken to reduce the risks to both people and wildlife.
What’s changing?
- Overall numbers steady: The total number of reported DVCs on trunk roads – major routes managed at a national level rather than by local authorities – has not increased since 2015, suggesting the overall risk at a national scale has remained stable.
- Shifting locations: The number of collisions is increasing in the Central Belt and around Aberdeen, but is decreasing in the north-west.
- Hotspots: The 10 locations with the most recorded DVCs in 2022–2024 were all in the Central Belt, mainly around junctions with small areas of woodland. Only one of these ‘hotspots’ matched a previous top-ten hotspot from 2019–2021, showing that high-risk locations can change.
- Human injuries: Incidents involving human injury and/or vehicle damage have declined since 2008, perhaps partly reflecting changes in reporting.
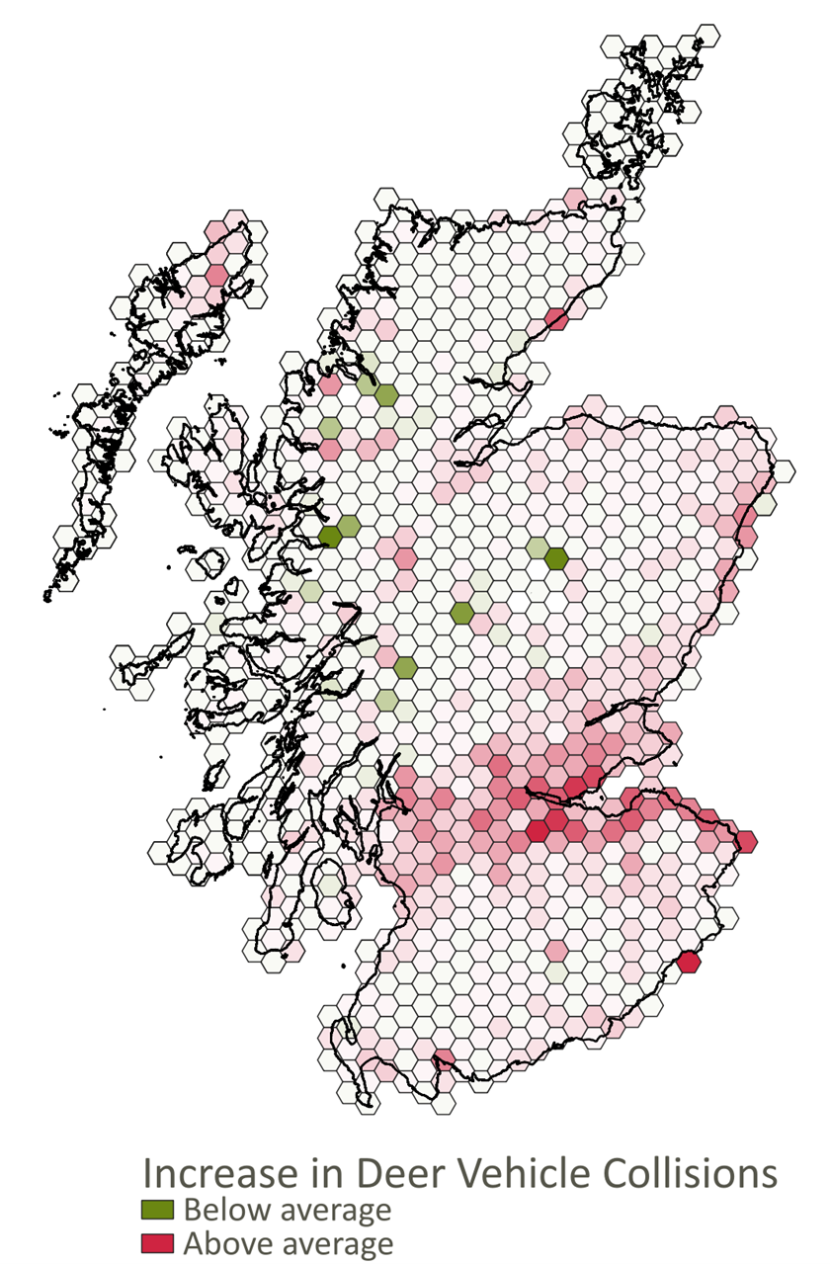
Figure 1. Changing frequency of DVCs in Scotland. A more detailed version of this map can be found in Figure 17.
Click for a full description
Map of Scotland showing increases and decreases in DVCs in hexagonal grid cells. Above average increases in DVCs are shown in shades of red. Below average increases in DVCs are shown in green. Darker colours indicate a larger change.
Most of increase is in the central belt, whilst north west Scotland shows the greatest overall decrease.
When and where collisions happen
- Time of day: Most collisions occur at dusk, extending into the late evening in winter.
- Time of year: May and June are the peak months for DVCs, especially on motorways. Autumn and early winter peaks also occur in some areas.
- Regions most affected: The highest numbers of DVCs are in Highland, Fife, Perth & Kinross and Aberdeenshire, but when the total length of the roads within a region is taken into account, Falkirk, North Lanarkshire and East Lothian show the highest collision rates.
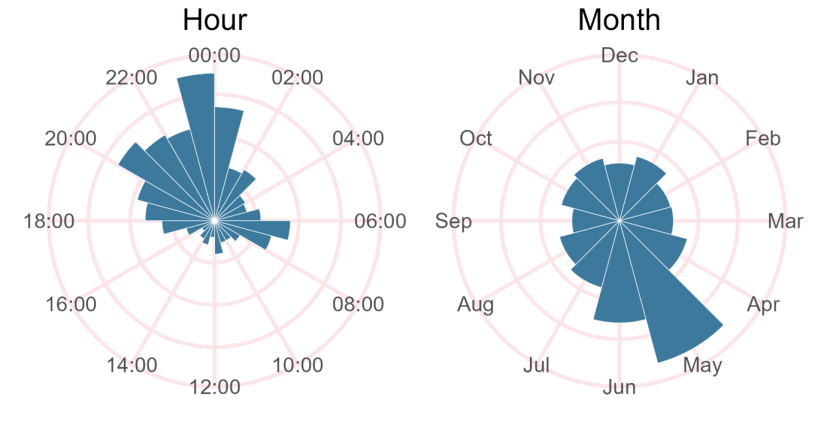
Figure 2. Number of DVCs in each hour of the day (left) and each month of the year (right). See Diurnal patterns of DVC occurrence and Seasonal patterns of DVC occurrence by road type and region for more detailed analysis.
Click for a full description
Two polar plots showing the relative number of DVCs occurring in each hour of the day(left) and each month of the year (right). Times are shown around the plot on the left on a 24-hour clock, labelled every two hours. Months are shown around the plot on the right, labelled at every month. The number of DVCs is shown as columns arising from the centre of each plot in blue. The plot on the left shows that the bar for 23:00–00:00 is the largest, with large numbers of DVCs occurring in the evenings from 20:00–01:00. A smaller peak of DVCs occurs in the morning from 06:00–08:00. The plot on the right shows that the bar for May is the largest, with large numbers of DVCs also occurring in June.
Which deer species are involved?
- Roe deer are involved in the most collisions nationwide. Evidence suggests female roe deer are slightly more often involved than males.
- Red deer dominate the number of collisions in Highland and parts of western Scotland.
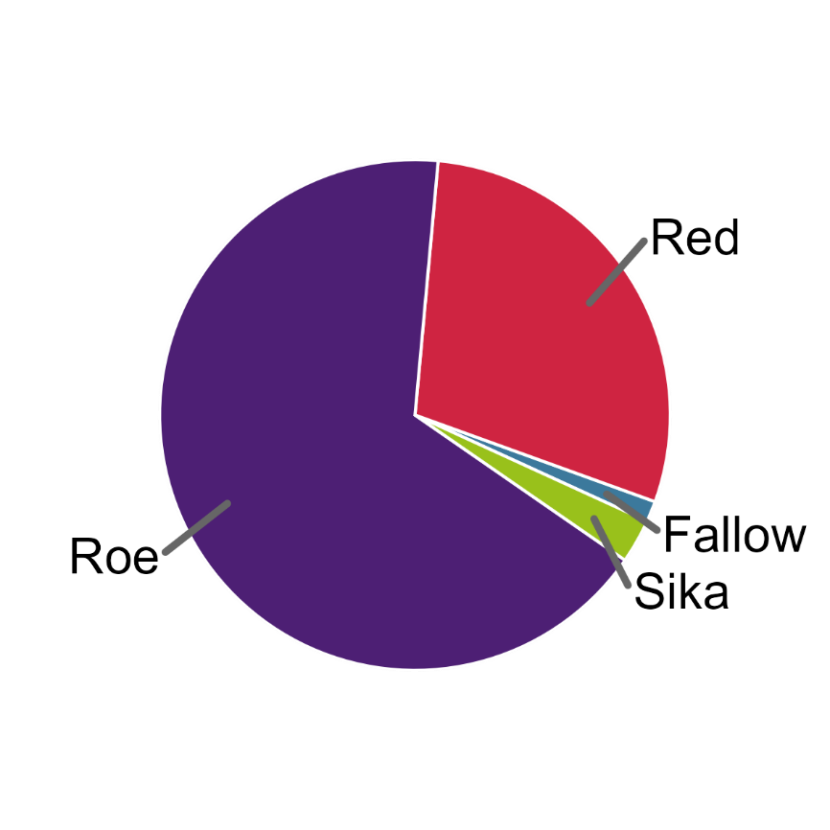
Figure 3. Proportion of DVCs involving each deer species. See DVC reports with reliable detail of deer species for more detailed analysis.
Click for a full description
Pie chart showing the proportion of DVCs involving each deer species. Each species is shown in a different colour:
Roe deer in purple accounting for 67%.
Red deer in red, accounting for 29%.
Sika deer in green, accounting for 3%.
Fallow deer in blue, accounting for 1%.
Other wildlife on roads
Deer are not the only animals affected. Reports also included:
- Badgers and foxes – frequently recorded victims.
- Otters, pine martens and red squirrels – occasionally killed on roads, showing impacts on rare and endangered species.
How the findings help
The information supports road managers, conservationists and local authorities in:
- Identifying high-risk road sections for possible signage, roadside habitat management or other mitigation measures.
- Improving data collection, including reports from the public through mobile apps.
- Developing future models to predict collision risk using traffic, habitat and road features.
Primary data suppliers
- Amey
- Autolink Concessionaires (M6) Plc.
- Balfour Beatty
- BEAR Scotland
- British Deer Society
- Forestry and Land Scotland
- Mammal Society
- Police Scotland
- Scottish Society for the Prevention of Cruelty to Animals
- Transport Scotland
Background
In recent decades, the number of deer in Scotland has increased and deer populations have expanded their range. At the same time, traffic volumes have also risen, potentially increasing the risk of collisions between deer and vehicles.
This report continues work begun in 2003 to analyse Deer Vehicle Collisions (DVCs) in Scotland. The purpose of this work is to track changing patterns in the frequency and distribution of DVCs on the trunk road network, and to inform actions aimed at reducing future collisions, particularly on stretches of road where incidents occur most often.
For this contract, data covering 2022–2024 have been added to the NatureScot DVC database, together with some earlier records that were previously unavailable. The database now contains 40,179 mapped incidents dated from 2008 to 2024. Around 65% of these come from four main sources: the SSPCA, Trunk Road Operating Companies, Forestry and Land Scotland rangers, and human-injury collisions recorded by Police Scotland. An additional 26% of records were drawn from Police Scotland’s STORM database, incorporated during this contract and covering the years 2020–2024.
The full dataset has been analysed, broadly replicating methods used in earlier studies while also introducing enhancements to improve the identification of trends and to refine the approach to DVC risk mapping.
Main findings
- Accounting for new data, there is limited evidence for an increase in the number of DVCs reported on trunk roads per annum between 2015 and 2024. This suggests that the risk of DVCs on the Scottish trunk road network as a whole is not increasing.
- However, the distribution of DVCs across the road network appears to have changed. Numbers of DVCs were increasing in the central belt across all roads and around Aberdeen for non-trunk roads. Fewer DVCs were reported elsewhere, especially in the wider road network in the north west.
- The largest number of DVC incidents occur in northern local authority areas in Scotland, notably Highland, Fife, Perth and Kinross and Aberdeenshire. However, when expressed as the number of DVCs per length of road within a local authority area, the largest number of incidents occur in the central belt, notably Falkirk, North Lanarkshire and East Lothian.
- May and June remain the peak months for DVCs. This was most notable on motorways and became less pronounced as roads became more minor. This may reflect levels of activity for roe deer only; the peak months for DVCs on Lewis and Harris, where only red deer are present, appear to be September to December. At Navidale, north Scotland, where red deer predominate, DVCs peak in September to November.
- Dusk remains the peak time for DVCs, though this peak is spread over a longer period from mid-afternoon until midnight in winter. This is likely due to high levels of both traffic and deer activity, plus factors such as driving conditions and driver fatigue.
- Roe deer remain the most frequently implicated species in DVC incidents and there is evidence to suggest that DVCs are more likely to involve female than male roe deer. However, red deer were most frequently implicated in Highland and North Ayrshire, whilst fallow deer were most frequently implicated in Dumfries and Galloway.
- The number of DVCs resulting in human injury, especially slight injuries, or vehicle damage appears to have declined from 2008–2024. However, this may be due to incomplete data or a change to the threshold for what constitutes a slight injury.
- Deer escape uninjured in the majority of reported DVCs resulting in human injury. The proportion of these DVCs that represent drivers avoiding the deer but having some sort of incident in the process and those using deer as an excuse for an incident with some other underlying cause is not known, though both are thought to occur.
- The number of DVC records made by the public has increased over time, reflecting the increased availability and use of recording tools such as the Mammal Society app, iRecord and iNaturalist.
- Large numbers of badger and red fox are also implicated in Wildlife Vehicle Collisions (WVCs), though it is not currently possible to estimate the total numbers. WVCs also account for mortality in rare and endangered species, including otters, pine martens and red squirrels.
- Most DVC hotspots between 2022 to 2024 were in the central belt.
- Ten DVC hotspots were shortlisted. All were within the central belt and around road junctions with adjacent small areas of woodland. A combination of deer using the woodland as daytime or birthing retreats, intermittent, fast-moving traffic on slip roads and reduced visibility on curved slip roads is believed to be responsible.
- Only one of the top ten DVC hotspots identified in 2019–2021 was included in the top ten hotspots in 2022–2024. This may reflect fluctuations in local deer numbers and suggests that the analysis needs to encompass a greater number of years. This would require DVC data with largely unbiased positional accuracy over multiple years.
- Mapping DVC hotspots using Kernel Density Estimation is recommended for a future study. This may be complementary to the hotspot mapping employed here, as it would provide additional evidence.
- Attempts to determine the relationship between DVC hotspots and physical and environmental factors failed, but suggested that a reliable model could be produced with more years of data. It is recommended that this work is repeated using reliable data from future years.
- Despite the failure of the model to converge, the results supported suggestions that DVCs are more likely to occur around road junctions, and close to woodland, moorland and moderately urban areas. Higher vehicle speeds and larger volumes of traffic also appeared to be related to a high incidence of DVCs.
- The DVC database should be improved by developing functionality that differentiates between records relating to collisions between deer and vehicles, and those representing uninjured deer on roads. This ensures that all records can be used to assess risk whilst allowing the identification of DVCs.
- Animal rescue centres other than the SSPCA, which already provides data, are recognised as a valuable potential source of DVC data. Recommendations are made regarding the collection and mobilisation of this data.
Acknowledgements
We thank the Project Steering Group members for their advice and support, and for funding this work: Dominic Sargent (NatureScot) and Angus Corby (Transport Scotland). Dr. Jochen Langbein is also thanked for useful conversations during this contract.
Thanks are also due to those that have regularly supplied data for use in this project from a range of organisations, primarily Kristoffer Thorbjornsen (Amey); Jock Laidlaw and Neil Brannock (Autolink Concessionaires (M6) Plc.); Carla Cummins (Galliford Try Investments); Stewart MacKenzie (Balfour Beatty); Boris Boum, David Patton, Sheila Thomson and Tommy Deans (BEAR Scotland); Laura Boyle (SSPCA); Sheila Baxter (Forestry and Land Scotland); Ross Clifton (Mammal Society). Additional data was also received from Hannah Crow (West Lothian Council), Ben Pacholek (Police Scotland), Mark Jamieson (NatureScot), Paul Reynolds (New Arc Wildlife Rescue) and Mark Scott (Transport Scotland).
Thanks also to all those that have uploaded Wildlife Vehicle Collision records to the NBN Gateway, often via iRecord, and iNaturalist. Organisations providing data via the NBN Gateway included Argyll Biological Records Centre, Highland Biological Recording Group, National Trust for Scotland and The Wildlife Information Centre. Particular thanks to those iNaturalist recorders that provided unobscured coordinates for several records, thus allowing these additional records to be included in the analysis – especially users sugarsnap_t and Mike G. Rutherford.
Abbreviations
Aberdeen Western Peripheral Route (AWPR)
Asset Management Performance System (AMPS)
Average Annual Daily Flow (AADF)
Deer Vehicle Collision (DVC)
Design-Build-Finance-Operate (DBFO)
Collision Reporting and Sharing system (CRaSH)
Forestry and Land Scotland (FLS)
Integrated Road Information System (IRIS)
Kernel Density Estimation (KDE)
Locally Estimated Scatterplot Smoothing (LOESS)
Road Traffic Accident (RTA)
Road Traffic Collision (RTC)
Scottish Society for the Prevention of Cruelty to Animals (SSPCA)
Trunk Road Operating Company (TROC)
Wildlife Vehicle Collision (WVC)
Introduction
Wild deer numbers in Scotland have risen substantially in recent decades. Although all species have expanded their ranges, roe deer have become especially well established across lowland Scotland, and deer are now increasingly present in urban areas and throughout the central belt (Pepper, Barbour and Glass, 2019).
These increases in deer populations and distribution have coincided with growth in road traffic, potentially leading to more Deer Vehicle Collisions (DVCs). Langbein (2019) defines DVCs as “any incidents where it may be concluded that a collision between a road vehicle and a deer has occurred; as evident either from live injured or dead deer casualties found at the roadside, or from reported road traffic collisions in which deer were implicated as an object or hazard in the carriageway (e.g. deer colliding with road vehicle, or deer presence causing drivers to swerve).”
This report presents findings from the sixth contract analysing the impact of DVCs on Scotland’s trunk roads, extending the dataset to cover the years 2022–2024. The database now includes records from 2008 onwards. Earlier contracts were reported by Langbein & Putman (2006), Langbein (2011; 2013; 2017; 2019), and Lush and Lush (2023). Langbein (2019) provides a consolidated summary of work undertaken between 2004 and 2018.
The current contract focused on updating and extending the dataset compiled in earlier studies, repeating analyses to enable comparison across time, and developing new analyses to provide additional insight. The results are intended to help guide measures to reduce the number and impact of DVCs in Scotland.
Data were sourced from the same organisations that contributed to previous contracts, primarily the Trunk Road Operating Companies (TROCs), supplemented by a range of other organisations that routinely deal with DVCs, as well as reports from the public submitted through various channels. Changes to participating organisations and available data are documented in this report.
This contract has also further refined methods of data collation, processing, and analysis, with the aim of improving consistency and efficiency and minimising the risk of human error.
Data collection regime, processing and analysis
Records of DVC incidents between 2008 and 2021 had been collated as part of previous contracts (Langbein, 2011; 2013; 2017; 2019; Lush and Lush, 2023). Records for 2022 to 2024, as well as some for earlier years that had not been previously collated, were obtained from source organisations, as described below.
As before, data were collated into a PostgreSQL/PostGIS database. The structure of the data was rationalised during this contract to make it more relational and consistent, and therefore easier to analyse (Annex 1: Database main table structure).
Changes to the database included enhancing its ability to accommodate Wildlife Vehicle Collisions (WVCs) involving species other than deer. Efforts were made to collate such data for 2022 to 2024, and records from data received between 2019 and 2021 were reviewed to incorporate additional species into the database. This may have importance in the future if, for example, collisions with large animals such as feral pigs become more common. A fuller understanding of WVC numbers also helps to put DVC numbers in context, where recording is relatively consistent.
Records were retained in their original formats and as separate processed PostgreSQL tables, so that data provenance could be easily traced. PostgreSQL scripts used to process the data, both from original sources into usable spatial database tables and into the master table, were retained, allowing full traceability and enabling changes to be quickly implemented if errors were found. Any manual processing undertaken was carefully documented.
Core data sources
Trunk Road Operating Companies
Data on reported DVC incidents since 2022 were supplied by the Trunk Road Operating Companies (TROCs) and added to the existing data for 2008–2021. This included data from the four main trunk road units and the smaller Design-Build-Finance-Operate (DBFO) sections. Data from the M8 DBFO included DVC incidents from August 2020 to December 2021, which were missing in the previous analysis (Lush and Lush, 2023). All TROCs supplied data for all years covered by this study and these were incorporated into the DVC database.
Efforts were made to obtain records of reports that did not result in a deer carcass uplift (Lush and Lush, 2023) and those relating to other animals. Some TROCs supplied data for other species, but in many cases it was not possible to know whether supplied DVC data included ‘no trace’ records.
Figure 4 represents the trunk road network as of December 2021. However, the trunk road network is evolving and since December 2021 the following modifications have occurred:
- A9 Luncarty to Birnham – upgrade with minimal impact on road layout.
- A9 Cross Tay – realignment of the road by up to 170 m.
- A85 Ruthvenfield – addition of several new slip roads parallel to the A9.
- A9 Berridale – minor realignment of less than 15 m.
- M8 Inchinen – addition of two new slip roads onto the A8.
- M9 Winchburgh – addition of four new slip roads onto the B8020.
- A77 Maybole bypass – realignment of the road by up to one kilometre.
Of these, only the A77 Maybole bypass was considered likely to have the potential for significantly impacting DVC analysis, but it was situated in an area where numbers of DVCs were few. Analysis of all DVC records using the 2021 trunk road network was therefore considered unlikely to affect the results significantly.
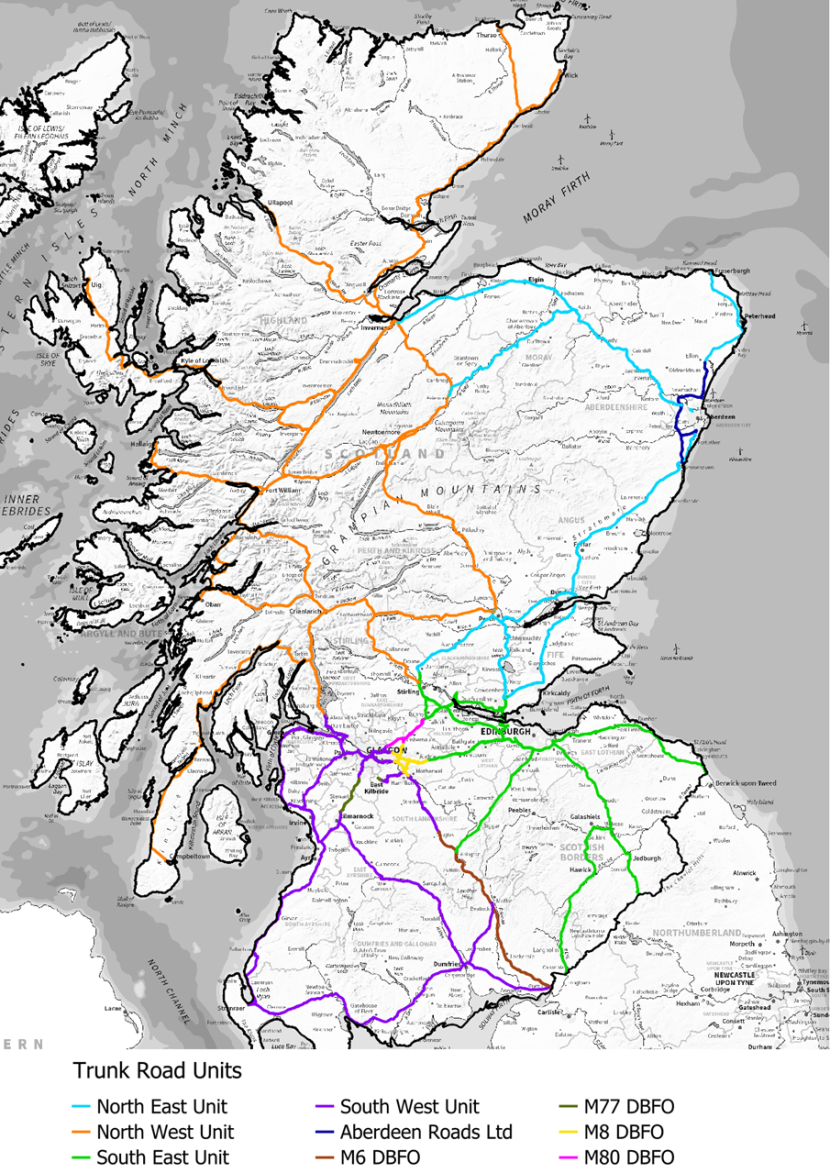
Figure 4. Scottish Trunk Road Map as of December 2021. DBFO = Design-Build-Finance-Operate. © Crown copyright (and database rights) 2024.
Click for a full description
Map of Scotland showing the Trunk Road network, coloured by the operating contract:
Aberdeen Roads Ltd. in dark blue
M6 DBFO in brown
M77 DBFO in dark green
M80 DBFO in magenta
M8 DBFO in yellow
South East Unit in purple
South West Unit in light green
North East Unit in light blue
North West Unit in orange
Scottish Society for the Prevention of Cruelty to Animals
The SSPCA has supplied records of incidents reported by various bodies and sometimes attended by staff since 2008. Incidents involving DVCs up to and including 2024 were provided by them and integrated into the DVC database. Reports typically included a postcode and were geolocated using Ordnance Survey Code-Point data.
Forestry and Land Scotland Wildlife Rangers
Forestry and Land Scotland (FLS; formerly Forestry Commission Scotland) has provided extracts from its national cull database for records classified as Road Traffic Accidents (RTA) or Road Traffic Collisions (RTC) from 2008 onwards. Records up to and including 2024 have been incorporated into the DVC database.
Each entry in the FLS dataset represents an individual deer. Consequently, where multiple DVCs occurred at the same time and location, an equivalent number of records are present. In other datasets that distinguish sex and age class, the total number of deer is derived from the sum of males, females, and juveniles. Forestry and Land Scotland is unique among the core data providers in recording the sex of juvenile deer. Because each FLS record represents a single animal, values of one are entered into the relevant sex, juvenile, and total deer fields within the database. Accordingly, unlike other sources, the total count in FLS records is not derived from the aggregation of sex and age-class fields.
Police and Road Safety Teams’ RTC records
The primary source of information on incidents involving DVCs from the police and road safety teams since 2008 has been STATS19 accident reporting forms. STATS19 is Great Britain’s official road traffic casualty database. Complete or near complete STATS19 data was included in the DVC database for 2008–2017 inclusive. These data subsequently became unavailable, due to changes to the data structure supplied.
In 2024, Police Scotland supplied an extract from their CRaSH database covering January 2020 to September 2024 (see Police Scotland). Whilst these data contained only an accident reference, date and description, and were therefore not incorporated into the database, the accident reference could be cross-referenced with related STATS19 records downloaded from the Department for Transport (2025). Because it was possible to identify which CRaSH records involved deer, these were linked to the relevant STATS19 record. It is not clear whether all relevant STATS19 records were identified this way, but it was more comprehensive than could be achieved in the previous contract (Lush and Lush, 2023).
Combined data were added to the DVC database, incorporating the description from CRaSH and other data from STATS19 where the accident references matched. This included adding records to the existing incomplete data for 2020 and 2021.
It was therefore considered unnecessary to repeat the Freedom of Information requests reported in Lush and Lush (2023), as these were time consuming and resulted in little data.
Note that there is often a lag between STATS19 data being collected and it being made available to other users. STATS19 data for 2024 was unavailable at the time of writing, so only data from 2020 to 2023 could be incorporated. 2024 data will need to be incorporated in a future project.
Supplementary data sources
Mammal Society
Data from the Mammal Society’s Mammal Mapper and Mammal Tracker schemes have been available since 2016. The Mammal Tracker scheme was phased out and replaced by the Mammal Mapper scheme in 2019. Data from both schemes up to and including 2024 were incorporated into the DVC database. These usually contribute between 10 and 50 records relating to DVC incidents in Scotland per year (Table 1).
Data from the National Mammal Atlas Project were also downloaded from the NBN Atlas (see NBN Atlas). Those records relating to DVCs were extracted and added to the database. These dated from 2013 to 2024 and contributed between zero and five DVC records in Scotland per year (Table 1). Any duplicates between this and the Mammal Mapper and Mammal Tracker datasets were flagged and removed from the analysis.
| Year | Mammal Mapper | Mammal Tracker | National Mammal Atlas Project |
|---|---|---|---|
| 2013 | - | - | 1 |
| 2015 | - | - | 2 |
| 2016 | 24 | 1 | - |
| 2017 | 13 | - | 2 |
| 2018 | 22 | - | 3 |
| 2019 | 21 | - | 2 |
| 2020 | 20 | - | - |
| 2021 | 38 | - | 2 |
| 2022 | 43 | - | - |
| 2023 | 46 | - | 5 |
| 2024 | 25 | - | 5 |
| Total | 252 | 1 | 22 |
British Deer Society
From 2009 members of the public were able to report DVCs online via the DeerAware website. This generally involved fewer than 50 records for Scotland per year. The data were very poorly structured and required significant manual processing to make them usable. The British Deer Society took control of the DeerAware website in 2020 and started collating the online reports in a structured format.
Regular recorders had been encouraged to use the British Deer Society app instead, after its launch in 2019. This collected DVC data in a more structured format than DeerAware, which allowed for easier collation and analysis. However, the app was unavailable and undergoing an extensive rebuild at the time of writing.
The British Deer Society provided data for both DeerAware and the app up to February 2021, which had been incorporated into the DVC database (Lush and Lush, 2023). They have been unable to process or provide more recent data since 2021, which means no data were collated during this contract.
Animal rescue records
The database included two records from an animal rescue centre other than the SSPCA from 2010. During this contract, 157 records provided by New Arc Wildlife Rescue were incorporated into the DVC database, covering 2023 and 2024. These comprised the locations and details of call-outs related to DVCs, mainly covering the area around Aberdeen (Figure 5). Unlike many other data sources, these records were considered to have been accurately identified to species level.
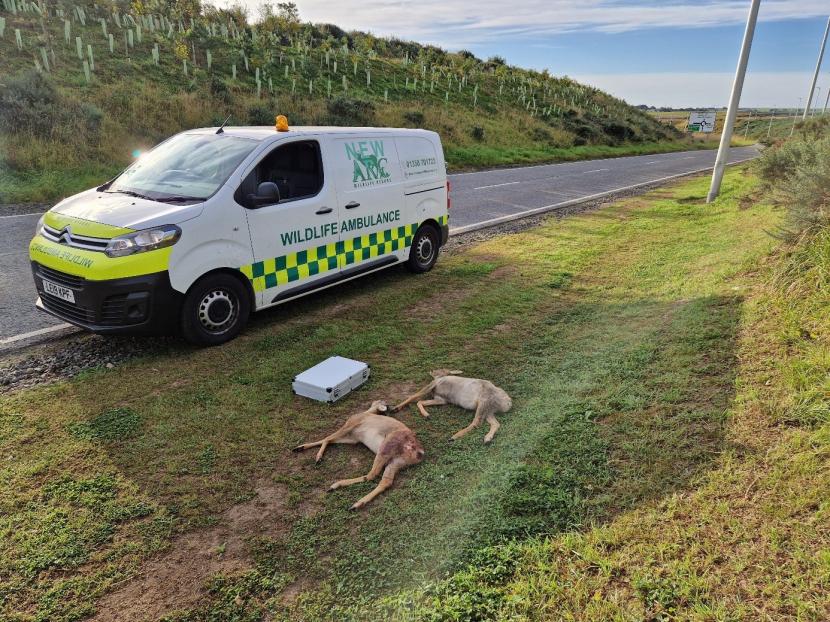
Figure 5. DVC involving two roe deer attended by New Arc Wildlife Rescue. © Paul Reynolds, New Arc Wildlife Rescue.
Click for a full description
Photograph showing a DVC attended by New Arc Wildlife Rescue. Two dead roe deer are shown lying on a soft verge in the foreground, whilst a rescue van is parked on the edge of the road behind.
Road Cleansing Departments
Langbein and Putman (2006) found that only a minority of local authority road cleansing departments would be able to provide useable records of DVCs. Because of this, and as in previous projects (Langbein, 2017; 2019; Lush and Lush, 2023), data from local authority road cleansing departments was not actively sought. All such data collated between 2008 and 2018 was included in the database, to which one record was added in the previous analysis that was included in a local authority response to the request for STATS19 data (Lush and Lush, 2023).
West Lothian provided additional data from their road cleansing department covering 16 February 2004 to 27 August 2024. These data included a date and a description of the location, and coordinates for some records since 2017 (Table 2). The location descriptions were inadequate for determining the precise location of those records without coordinates.
| Year | Mapped | Unmapped | Total |
|---|---|---|---|
| 2004 | - | 20 | 20 |
| 2005 | - | 57 | 57 |
| 2006 | - | 65 | 65 |
| 2007 | - | 98 | 98 |
| 2008 | - | 58 | 58 |
| 2009 | - | 66 | 66 |
| 2010 | - | 84 | 84 |
| 2011 | - | 80 | 80 |
| 2012 | - | 45 | 45 |
| 2013 | - | 78 | 78 |
| 2014 | - | 55 | 55 |
| 2015 | - | 61 | 61 |
| 2016 | - | 57 | 57 |
| 2017 | 16 | 74 | 90 |
| 2018 | 28 | 69 | 97 |
| 2019 | 81 | 53 | 134 |
| 2020 | 61 | 52 | 113 |
| 2021 | 70 | 57 | 127 |
| 2022 | 169 | 15 | 184 |
| 2023 | 164 | 44 | 208 |
| 2024 | 153 | 1 | 154 |
| Total | 742 | 1,189 | 1,931 |
The West Lothian data included records of a range of species, of which deer were the most frequently reported (Table 3). Whilst all were incorporated into the DVC database, records of non-deer species and those without coordinates were excluded from the analysis, where appropriate.
| Species | Mapped | Unmapped | Total |
|---|---|---|---|
| Deer (Cervidae) | 362 | 521 | 883 |
| Cat (Felis) | 2 | 7 | 9 |
| Dog (Canis familiaris) | 2 | 14 | 16 |
| Eurasian badger (Meles meles) | 203 | 297 | 500 |
| European rabbit (Oryctolagus cuniculus) | - | 1 | 1 |
| Feral pig (Sus scrofa) | - | 1 | 1 |
| Rat (Rattus) | 20 | 51 | 71 |
| Red fox (Vulpes vulpes) | 141 | 269 | 410 |
| Red-necked wallaby (Macropus rufogriseus) | - | 1 | 1 |
| Squirrel species (Sciurus sp.) | 12 | 26 | 38 |
| West European hedgehog (Erinaceus europaeus) | - | 1 | 1 |
| Total | 742 | 1,189 | 1,931 |
Police Scotland
Police Scotland provided records containing the word “deer” from their STORM and CRaSH databases.
STORM Unity is the national command and control incident recording system used by Police Scotland. It therefore contains logs of incidents reported by various bodies, including those involving DVCs. The supplied data included coordinates, a date and time, and a short description of the incident. The extract covered the period from 1 January 2019 to 25 November 2024. The time related to the time the call was received, not the time of the incident.
Several records had coordinates that could not be used and a few records referred to deer but were unrelated to DVCs, such as “John Deere” or “Deer Park”, and were excluded. Nevertheless, STORM records contributed a huge number of records spanning the years 2019 and 2024 (Table 4).
| Year | Number of records |
|---|---|
| 2019 | 2,085 |
| 2020 | 1,738 |
| 2021 | 1,631 |
| 2022 | 1,599 |
| 2023 | 1,691 |
| 2024 | 1,606 |
| Total | 10,350 |
The Collision Recording and SHaring system (CRaSH) is used to record data on road traffic collisions attended by Police Scotland (Figure 6). The supplied CRaSH data contained no location information and was not incorporated into the database. However, it was cross-referenced with STATS19 data to identify those records related to DVCs (Police and Road Safety Teams’ RTC records).
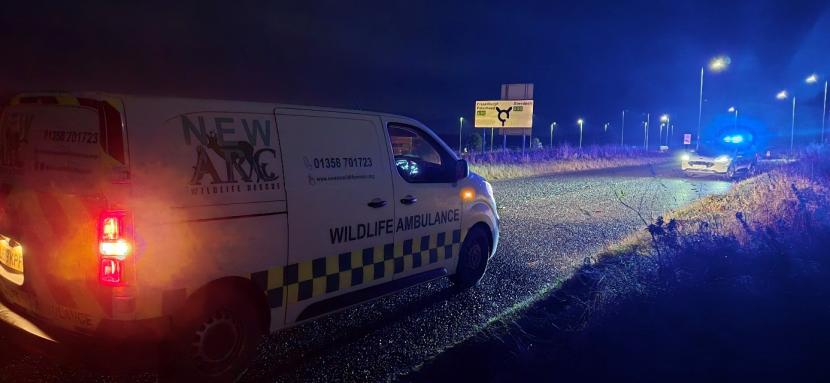
Figure 6. Example of a DVC attended by Police Scotland. © Paul Reynolds, New Arc Wildlife Rescue.
Click for a full description
Photograph showing a DVC attended by Police Scotland. A New Arc Wildlife Rescue van is shown parked on the road in the foreground with a police car in the background. It is dark and the scene is lit by the two vehicles, but the deer is not visible. Blue lights from the police car and orange hazard warning lights from the van warn other drivers of the hazard.
Transport Scotland AMPS database
Transport Scotland provided records of ‘animal defects’ from their Asset Management Performance System (AMPS) database. AMPS is a centralised asset management system that was gradually rolled out to the TROCs whilst this study was underway. Some data had also been imported into AMPS from the previous IRIS database. The AMPS ‘animal defects’ data supplemented the data received from the TROCs, as it contained additional records.
The supplied data included point geometries, a date and a description of the defect, which often included the name of the animal involved. The extract covered the period from 3 April 2022 to 30 April 2024, with an outlying record from 21 September 2020.
The records included species other than deer (Table 5). Whilst all were incorporated into the DVC database, records of non-deer species were excluded from the analysis, where appropriate.
| Species | 2020 | 2022 | 2023 | 2024 |
|---|---|---|---|---|
| Deer (Cervidae) | - | 303 | 595 | 115 |
| American mink (Neovison vison) | - | 1 | - | - |
| Bird (Aves) | - | - | 6 | 3 |
| Buzzard (Buteo buteo) | - | - | 2 | - |
| Cat (Felis) | - | 24 | 32 | 7 |
| Dog (Canis familiaris) | - | 3 | 3 | 1 |
| Eurasian badger (Meles meles) | - | 75 | 196 | 106 |
| Eurasian otter (Lutra lutra) | - | 5 | 8 | 2 |
| European rabbit (Oryctolagus cuniculus) | - | 1 | 7 | 2 |
| Grey heron (Ardea cinerea) | - | 1 | 1 | - |
| Gull species (Larus sp.) | - | - | 5 | - |
| Hare (Lepus) | - | - | 2 | 2 |
| Pheasant (Phasianus colchicus) | 1 | 1 | 19 | 11 |
| Pine marten (Martes martes) | - | 1 | 2 | - |
| Raptor (Accipitridae / Falconidae) | - | - | 1 | - |
| Red fox (Vulpes vulpes) | - | 81 | 144 | 41 |
| Sheep (Ovis) | - | 1 | 3 | 2 |
| Swan species (Cygnus sp.) | - | 3 | 4 | 1 |
| Total | 1 | 500 | 1,030 | 293 |
NatureScot
NatureScot provided 40 records of DVCs that had been casually recorded by staff in 2023 and 2024. Species identification was considered to be accurate and records were flagged where the incident had been witnessed, meaning that the time was reliable.
NatureScot also provided a summary of DVCs made by the Lewis and Harris Deer Management Group in 2023 and 2024. Since the data was aggregated per month and lacked accurate locations it was not incorporated into the DVC database.
NBN Atlas
All records relating to deer that were licensed for commercial use were downloaded from the NBN Atlas. Those records that related to DVCs were extracted and incorporated into the DVC database. Some of these came from the National Mammal Atlas Project (see Mammal Society). The remaining relevant records came from four datasets and spanned the years 1992 to 2023 (Table 6). All pre-2008 records were retained in the database, but were not included in this analysis.
| Year | Argyll Biological Records Centre | Argyll Biological Records Dataset [Accepted] | Highland Biological Recording Group | HBRG Vertebrates (not Badger) Dataset [Accepted] | National Trust for Scotland | National Trust for Scotland Species Records [Unconfirmed] | The Wildlife Information Centre | A.T. Sumner's Records [Accepted] | Total |
|---|---|---|---|---|---|
| 1992 | - | - | - | 1 | 1 |
| 1995 | - | 3 | - | - | 3 |
| 1996 | - | 2 | - | - | 2 |
| 1997 | - | 2 | - | - | 2 |
| 1998 | 2 | 13 | - | - | 15 |
| 1999 | - | 16 | - | - | 16 |
| 2000 | - | 21 | - | - | 21 |
| 2001 | - | 16 | - | - | 16 |
| 2002 | - | 17 | - | - | 17 |
| 2003 | - | 6 | - | - | 6 |
| 2004 | - | 8 | - | - | 8 |
| 2005 | - | 10 | - | - | 10 |
| 2006 | - | 20 | - | - | 20 |
| 2007 | - | 27 | - | - | 27 |
| 2008 | - | 8 | - | - | 8 |
| 2009 | - | 6 | - | - | 6 |
| 2010 | - | 7 | - | - | 7 |
| 2011 | - | 2 | - | - | 2 |
| 2012 | 2 | 3 | - | - | 5 |
| 2013 | 2 | 3 | - | - | 5 |
| 2014 | - | 4 | 1 | - | 5 |
| 2015 | 1 | 4 | - | 1 | 6 |
| 2016 | 2 | 2 | - | - | 4 |
| 2017 | 1 | - | - | - | 1 |
| 2018 | 1 | 4 | - | - | 5 |
| 2019 | 1 | - | - | - | 1 |
| 2022 | 1 | 1 | - | - | 2 |
| 2023 | 2 | 2 | - | - | 4 |
| Total | 15 | 207 | 1 | 2 | 225 |
iNaturalist records
The GLOBAL Roadkill Observations project gathers records of WVCs crowdsourced using the iNaturalist platform. Wider research on iNaturalist records found this project to be comprehensive. All data from Scotland was downloaded and filtered for those licensed for commercial use, which reduced the number of usable records from 153 to 98. The coordinates on some records were obscured and could not be used, further reducing the number of usable records. A few prolific recorders were asked to change the settings on the records so that they could be used, resulting in 83 usable records.
These records were split into research and non-research grades. All records start as non-research grade. Records become research grade if they meet validity criteria and two thirds of users agree on the identification. Research grade records do not necessarily meet the verification standards of records on the NBN Atlas, but it is nevertheless a useful indicator of confidence in the species identification.
The records dated from 2018 to 2025 (Table 7) and included species other than deer (Table 8). Whilst all were incorporated into the DVC database, those from 2025 were not included in this analysis. Records of non-deer species were excluded from the analysis, where appropriate. The five records of deer shown in Table 8 dated from 2020 to 2023.
| Year | Research | Non-research | Total |
|---|---|---|---|
| 2018 | 3 | - | 3 |
| 2019 | 6 | 1 | 7 |
| 2020 | 12 | - | 12 |
| 2021 | 3 | - | 3 |
| 2022 | 8 | 1 | 9 |
| 2023 | 18 | 1 | 19 |
| 2024 | 8 | 2 | 10 |
| 2025 | 17 | 3 | 20 |
| Total | 75 | 8 | 83 |
| Species | Research | Non-research | Total |
|---|---|---|---|
| Deer (Cervidae) | - | 1 | 1 |
| Fallow deer (Dama dama) | 1 | - | 1 |
| Roe deer (Capreolus capreolus) | 3 | - | 3 |
| Adder (Vipera berus) | 2 | - | 2 |
| Barn owl (Tyto alba) | 1 | - | 1 |
| British stoat (Mustela erminea stabilis) | 2 | - | 2 |
| Brown hare (Lepus europaeus) | - | 1 | 1 |
| Brown rat (Rattus norvegicus) | 1 | - | 1 |
| Common crossbill (Loxia curvirostra) | - | 1 | 1 |
| Common shrew (Sorex araneus) | 3 | - | 3 |
| Common slowworm (Anguis fragilis) | 5 | - | 5 |
| Common swift (Apus apus) | 1 | - | 1 |
| Eastern grey squirrel (Sciurus carolinensis) | 2 | - | 2 |
| Eurasian badger (Meles meles) | 11 | - | 11 |
| Eurasian otter (Lutra lutra) | 2 | - | 2 |
| Eurasian red squirrel (Sciurus vulgaris) | 4 | - | 4 |
| Eurasian woodcock (Scolopax rusticola) | 1 | - | 1 |
| European common frog (Rana temporaria) | 2 | - | 2 |
| European mole (Talpa europaea) | 1 | - | 1 |
| European rabbit (Oryctolagus cuniculus) | 3 | - | 3 |
| European toad (Bufo bufo) | 15 | - | 15 |
| European wood mouse (Apodemus sylvaticus) | 1 | - | 1 |
| Evening bats (Vespertilionidae) | - | 1 | 1 |
| Great black-backed gull (Larus marinus) | - | 2 | 2 |
| Grey heron (Ardea cinerea) | 1 | - | 1 |
| Gull species (Larus sp.) | - | 1 | 1 |
| Pheasant (Phasianus colchicus) | 3 | - | 3 |
| Pine marten (Martes martes) | 3 | - | 3 |
| Red grouse (Lagopus lagopus) | 1 | - | 1 |
| Stoat (Mustela erminea) | 1 | - | 1 |
| West european hedgehog (Erinaceus europaeus) | 5 | 1 | 6 |
| Total | 75 | 8 | 83 |
Supporting data
Several national-level datasets were collated to underpin the analysis and provide additional context:
- Integrated Road Information System (IRIS): An extract of the IRIS database, including Average Annual Daily Flow (AADF) figures, was supplied by Transport Scotland on 16 December 2021 and was considered current at the time of writing. Trunk road sections (Figure 4) were identified by selecting records where the OWNER_UID field was not equal to LOCAL AUTHORITY and the SECTION_CO field did not begin with 14935. The excluded codes (14935) corresponded to parts of the A737 that were removed from the live network on 7 April 2020 (Angus Corby, pers. comm.).
- Asset Management Performance System (AMPS): Transport Scotland also supplied an extract of various trunk road asset data from AMPS. This included the locations of basic, matrix and variable message signs, barriers and habitats.
- Ordnance Survey Open Roads: Data downloaded in October 2021 provided full coverage of the road network, enabling analysis of DVC frequencies across both trunk and non-trunk roads, as well as changes over time.
- Ordnance Survey Code Point: These data were obtained to support georeferencing of records supplied only as postcodes. Updates were made annually to ensure all new records could be incorporated into the database.
- Marker post data: Information released through a Freedom of Information request (https://www.gov.scot/publications/foi-19-01392/) had been obtained during the previous contract (Lush and Lush, 2023). The dataset was incomplete and contained some errors, but no comprehensive alternative existed. The missing marker post locations were supplemented and errors in the data were corrected manually.
- Habitat and Land Cover Map 2022: Data downloaded in July 2023 provided broad habitat data for the whole of Scotland.
- Deer Management Priority Areas: NatureScot provided boundaries for ten Deer Management Priority Areas in Scotland.
NatureScot also provided vehicle speed data that had been collected by BEAR Scotland for the A9 at Navidale, which was previously identified as a DVC hotspot (Lush and Lush, 2023). Two mobile Variable Message Signs (VMS) warning about the risk of deer were deployed at this location from 1–25 November 2024. The speed data covered the period 25 October to 18 December 2024, and therefore included a few weeks before and after deployment of the VMS. The data were affected by the presence of snow on the road from 16–23 November 2024.
Identification of duplicate records
A semi-automated process was used to identify potential duplicate DVC incident records. The procedure compared records from the same date for grid references within 100 m of each other, excluding any records that had already been flagged as duplicates in earlier checks.
Where species information was available, this was also taken into account: records listing different deer species – or cases where species was not identified – were generally treated as separate incidents. It is acknowledged that in some situations a single incident may have been entered multiple times with different species recorded.
The process generated a set of candidate duplicate pairs which were then reviewed manually. For each pair, the record judged to contain the least detail was typically marked as the duplicate. In cases where duplication could not be confidently established, both records were retained in the database without amendment.
Analysis
Analysis was undertaken using a combination of standard and bespoke PostgreSQL/PostGIS functions, and the R statistical environment. Maps were produced using QGIS, drawing upon the data in PostgreSQL, either directly or using PostgreSQL views.
All charts, tables and statistical tests were produced or undertaken in R v.4.4.2, drawing directly upon PostgreSQL using the packages DBI v.1.2.3 and RPostgres v.1.4.7 (R Special Interest Group on Databases (R-SIG-DB), Wickham and Müller, 2024; Wickham, Ooms and Müller, 2025). Data reshaping in R was undertaken using core R functions and the packages tidyverse v.2.0.0 and janitor v.2.2.1 (Wickham, 2023; Firke, 2024). Most charts were produced using the packages ggplot2 v.3.5.2, patchwork v.1.3.1, scales v1.4.0 and ggpubr v.0.6.0 (Kassambara, 2023; Pedersen, 2025; Wickham et al., 2025; Wickham, Pedersen and Seidel, 2025). Reshaped, publication ready data tables were copied from R using clipr v.0.8.0 (Lincoln, 2022).
A mixed-effects regression was used to analyse the Navidale speed data and deer sex ratios, using the R package lmerTest 3.1-3 to estimate p-values using Satterthwaite's method or the Laplace Approximation (Kuznetsova, Bruun Brockhoff and Haubo Bojesen Christensen, 2020). For the Navidale analysis, VMS deployment, time of day and vehicle class were treated as fixed effects, whilst road direction and day were treated as random effects. Snow during the survey period was also treated as a fixed effect. For the sex ratio analysis, sex was treated as a fixed effect and year was treated as a random effect.
Generalized linear regression was used to model the relationship between DVC hotspots and physical and environmental factors, using the R package MASS 7.3-61 for the regression, and car 3.1-3 and vcd 1.4-13 for model diagnostics (Fox, Weisberg and Price, 2024; Meyer et al., 2024; Ripley and Venables, 2024)
Results
Change in volume of data by source, type and years
A total of 11,789 records of DVCs were collated for the period 2022 to 2024. Of these, 71 had no or insufficient location information to map, and in many cases could not be analysed. A further 1,088 were thought to be potential duplicate records and, where relevant, were excluded from the analysis.
In addition, 5,488 non-duplicate records with sufficient location information were added for previous years, mostly between 2019 and 2021. These largely came from extracts from Police Scotland’s STORM database, which contributed 5,414 records for this period. 2021 data for the M8 DBFO, which was not available for the previous study (Lush and Lush, 2023), added 40 records. A further 22 records from STATS19 accident reporting were also added for 2020–2021. Other pre-2022 records came from various sources, such as data extracted from iNaturalist and the NBN Atlas.
The change in volume of DVC records received from core and non-core sources since the initiation of these studies in 2003 is shown in Table 9, and since 2008 in Figure 7. The dramatic increase in the available records from 2019 onwards was largely due to extracts from Police Scotland’s STORM database and Transport Scotland’s AMPS database. These were both regarded as non-core sources, to allow for the analysis of a consistent set of data covering 2008 to 2024.
| Year | Core | Other | Total |
|---|---|---|---|
| 2003–2007 | 2,136 | 3,702 | 5,838 |
| 2008 | 882 | 249 | 1,131 |
| 2009 | 1,061 | 479 | 1,540 |
| 2010 | 1,146 | 370 | 1,516 |
| 2011 | 1,136 | 71 | 1,207 |
| 2012 | 1,515 | 82 | 1,597 |
| 2013 | 1,438 | 150 | 1,588 |
| 2014 | 1,235 | 104 | 1,339 |
| 2015 | 1,628 | 77 | 1,705 |
| 2016 | 1,725 | 70 | 1,795 |
| 2017 | 1,938 | 67 | 2,005 |
| 2018 | 1,694 | 79 | 1,773 |
| 2019 | 1,777 | 2,189 | 3,966 |
| 2020 | 1,623 | 1,779 | 3,402 |
| 2021 | 1,843 | 1,727 | 3,570 |
| 2022 | 1,530 | 1,810 | 3,340 |
| 2023 | 1,945 | 2,014 | 3,959 |
| 2024 | 1,434 | 1,897 | 3,331 |
| Total | 27,686 | 16,916 | 44,602 |
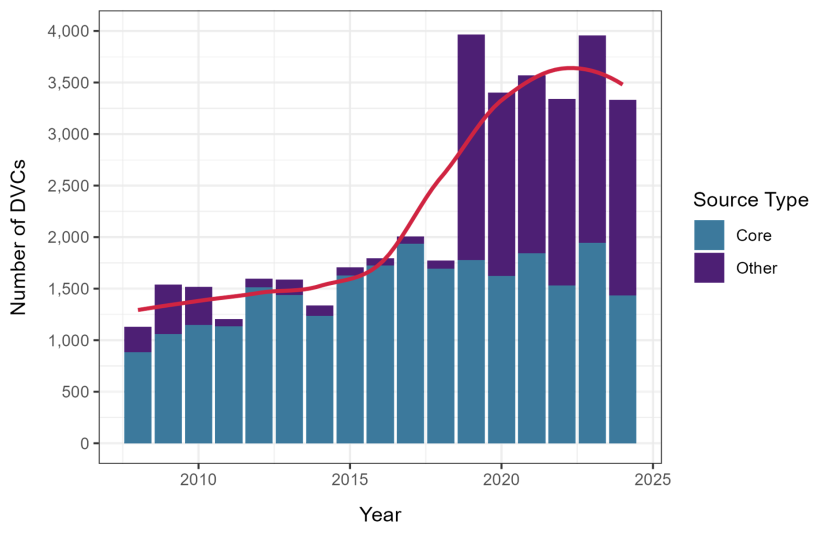
Figure 7. Number of DVC records from core and other sources with adequate location details for mapping retained in the DVC database and included in the analysis in each year.
Click for a full description
Stacked bar chart showing the numbers of DVC reports per year. The y-axis is titled ‘Number of DVCs’ and ranges from 0 to 4,000 at intervals of 500. The x-axis shows years from 2008 to 2024, labelled at every five years. Bars show records from core sources in blue below and records from other sources in purple stacked on top. Records that are believed to be duplicates are excluded. Records from core sources greatly outnumbered those from other sources until 2019, generally increasing from 882 in 2008 to 1,945 in 2023, though numbers appear to have plateaued since about 2015. Records from other sources were generally few until 2019, ranging from 67 in 2017 to 150 in 2013. Higher numbers of reports from other sources were received between 2008 and 2010, largely due to a special project undertaken by the Deer Commission for Scotland at that time (Langbein, 2019). Since 2019, numbers from other sources have exceeded those from core sources, ranging from 1,727 in 2021 to 2,189 in 2019. A smoothed LOESS trendline for all data is superimposed in red, highlighting the dramatic increase in the number of available DVC reports per year in 2019. The data are summarized in Table 9.
Volume and trends of DVC records from core sources across years
The number of records collated from core and other sources has increased since 2008 (Table 10). STATS19 road traffic collision data are likely incomplete from 2018 onwards and at the time of writing were not available for 2024, as described in Police and Road Safety Teams’ RTC records. Note that records extracted from Transport Scotland’s AMPS database are considered to be non-core, as they are not consistently available across all years and regions.
The number of DVCs reported from core sources has remained fairly constant since 2015. The constancy was due to relatively stable combined totals from Trunk Road Operating Companies (TROCs), with 2023 showing an above average number of reports from TROCs (Figure 8). Nearly all of the variation in the number DVCs reported by core sources comes from SSPCA data. This has masked the changes to incidents reported by FLS described in Changes in the volume of SSPCA and FLS records and certain trunk road regions, plus a significant strong decline in DVCs from road traffic collision reporting described in Changes to the number of human injury collisions and damage-only DVCs attended by .
| Year | TROC | RTC | SSPCA | FLS | Total Core | Total All Others |
|---|---|---|---|---|---|---|
| 2008 | 480 | 30 | 311 | 61 | 882 | 272 |
| 2009 | 650 | 20 | 290 | 101 | 1,061 | 503 |
| 2010 | 718 | 15 | 346 | 67 | 1,146 | 408 |
| 2011 | 592 | 21 | 419 | 104 | 1,136 | 92 |
| 2012 | 745 | 21 | 665 | 84 | 1,515 | 101 |
| 2013 | 637 | 30 | 697 | 74 | 1,438 | 186 |
| 2014 | 673 | 13 | 473 | 76 | 1,235 | 127 |
| 2015 | 660 | 23 | 883 | 62 | 1,628 | 97 |
| 2016 | 672 | 18 | 999 | 36 | 1,725 | 90 |
| 2017 | 620 | 17 | 1,253 | 48 | 1,938 | 105 |
| 2018 | 530 | 15 | 1,093 | 56 | 1,694 | 119 |
| 2019 | 686 | 11 | 1,053 | 28 | 1,778 | 2,217 |
| 2020 | 696 | 12 | 884 | 31 | 1,623 | 1,809 |
| 2021 | 698 | 14 | 1,091 | 40 | 1,843 | 1,766 |
| 2022 | 684 | 11 | 792 | 44 | 1,531 | 1,822 |
| 2023 | 822 | 6 | 1,097 | 24 | 1,949 | 2,052 |
| 2024 | 667 | - | 743 | 28 | 1,438 | 1,909 |
| Total | 11,230 | 277 | 13,089 | 964 | 25,560 | 13,675 |
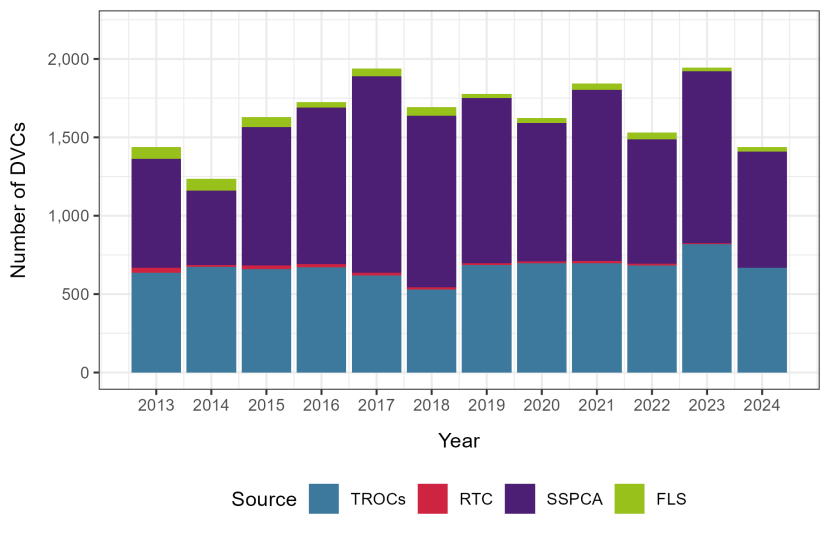
Figure 8. Total number of DVCs reported from 2013 to 2024 from all core sources, segmented by source type.
Click for a full description
TROC = Trunk Road Operating Company, RTC = Road Traffic Collision, SSPCA = Scottish Society for the Prevention of Cruelty to Animals; FLS = Forestry and Land Scotland.
Stacked bar chart showing the number of DVCs reported from four core source types between 2013 and 2024. The y-axis is titled ‘Number of DVCs’ and ranges from zero to 2,200, with labels at intervals of 500. The x-axis shows years from 2013 to 2024, labelled at every year. DVCs reported each year by trunk road operators are in blue and generally show little change over time, varying from a low of 530 in 2018 to a high of 795 in 2022, except for a peak of 995 in 2023 – see Figure 11 for detail. Personal injury DVC related incidents obtained from STATS19 each year are shown as a thin red line and contribute little overall each year – see Figure 16 for detail. Most variation in the chart is for DVCs reported by the Scottish Society for the Prevention of Cruelty to Animals, in purple, which ranges from 473 in 2014 to 1,253 in 2017 – see Figure 15 for detail. DVCs reported each year by Forestry and Land Scotland and its predecessor Forestry Commission Scotland are shown in green and range from 24 in 2023 to 76 in 2014 – see Figure 15 for detail.
Volume and trends of DVC records from supplementary data sources across years
Non-core data and accurately identified deer records have come from a range of sources that have varied since 2008. The categorisation of Table 11 is different from the equivalent table in Lush and Lush (2023), in that the “other deer experts” and “general public” has been replaced with terms that reflect whether the record has undergone some form of expert verification. Additionally, “council uplifts” has been replaced with a broader term encompassing all road carcass uplifts, to accommodate data for the non-trunk roads received from TROCs.
Up until March 2011, data were available for a special project commissioned by the Deer Commission for Scotland (DCS; Langbein, 2011), but such data have not been available for subsequent studies. Recent road uplift data comes mainly from West Lothian Council and Amey supplying data for a non-trunk road contract. Data from Police Control since 2019 has come largely from STORM data.
Data from deer experts other than the DCS project and FLS (Figure 15) has been supplemented with reliable data from New Arc Wildlife Rescue and NatureScot, and verified data from the Mammal Society. Verified data from the NBN Atlas and Research Grade records from iNaturalist have increased the number of pre-2022 DVC records for some years, as well as adding records for 2023–2024.
Unverified records from the public were supplemented with data from the NBN Atlas and non-research-grade observations from iNaturalist. Despite the loss of DeerAware records after February 2021 – which only contributed a few records annually – verified and unverified data from the public shows a strong increasing trend (Spearman’s rank correlation, r = 0.66, p < 0.01), supported by contributions of unverified records from other sources.
| Year | DCS roadkill searches | Other verified records | General public (unverified) | Police control | Non-core road uplifts | Total |
|---|---|---|---|---|---|---|
| 2008 | 84 | 22 | 8 | 123 | 35 | 272 |
| 2009 | 50 | 13 | 6 | 273 | 161 | 503 |
| 2010 | 51 | 5 | 9 | 122 | 221 | 408 |
| 2011 | 14 | 5 | 2 | 47 | 24 | 92 |
| 2012 | - | 24 | 5 | 53 | 19 | 101 |
| 2013 | - | 87 | 12 | 51 | 36 | 186 |
| 2014 | - | 65 | 5 | 34 | 23 | 127 |
| 2015 | - | 65 | 6 | 6 | 20 | 97 |
| 2016 | - | 35 | 28 | 7 | 20 | 90 |
| 2017 | - | 15 | 41 | 7 | 42 | 105 |
| 2018 | - | 17 | 56 | - | 46 | 119 |
| 2019 | - | 22 | 32 | 2,085 | 78 | 2,217 |
| 2020 | - | 5 | 27 | 1,721 | 56 | 1,809 |
| 2021 | - | 4 | 81 | 1,608 | 73 | 1,766 |
| 2022 | - | - | 45 | 1,580 | 197 | 1,822 |
| 2023 | - | 55 | 50 | 1,668 | 282 | 2,055 |
| 2024 | - | 144 | 24 | 1,587 | 154 | 1,909 |
| Total | 199 | 583 | 437 | 10,972 | 1,487 | 13,678 |
Overview of Scotland-wide distribution of DVC records from core sources
The distribution of DVC records within Scotland from core sources from 2022 to 2024 is shown in Figure 9.
Data from the TROCs reflects the trunk road network, though the density of records is clearly higher along some parts of the network than others. Fewer records from TROCs were located outside the network than reported in Lush and Lush (2023), suggesting an improvement in data collection methods.
SSPCA records cover the entire road network, but their spatial distribution closely resembles that of TROC data. This reflects underlying factors such as traffic density, human and deer population distribution, and the locations of wildlife rescue centres. SSPCA data also provides relatively high record densities in urbanised areas of the central belt and Aberdeenshire. Forestry and Land Scotland records, while also present on the road network, include forest tracks and more remote locations, with clusters around FLS-managed sites. In contrast, STATS19 data cover the full road network but are comparatively sparse and widely scattered, with no clear spatial pattern.
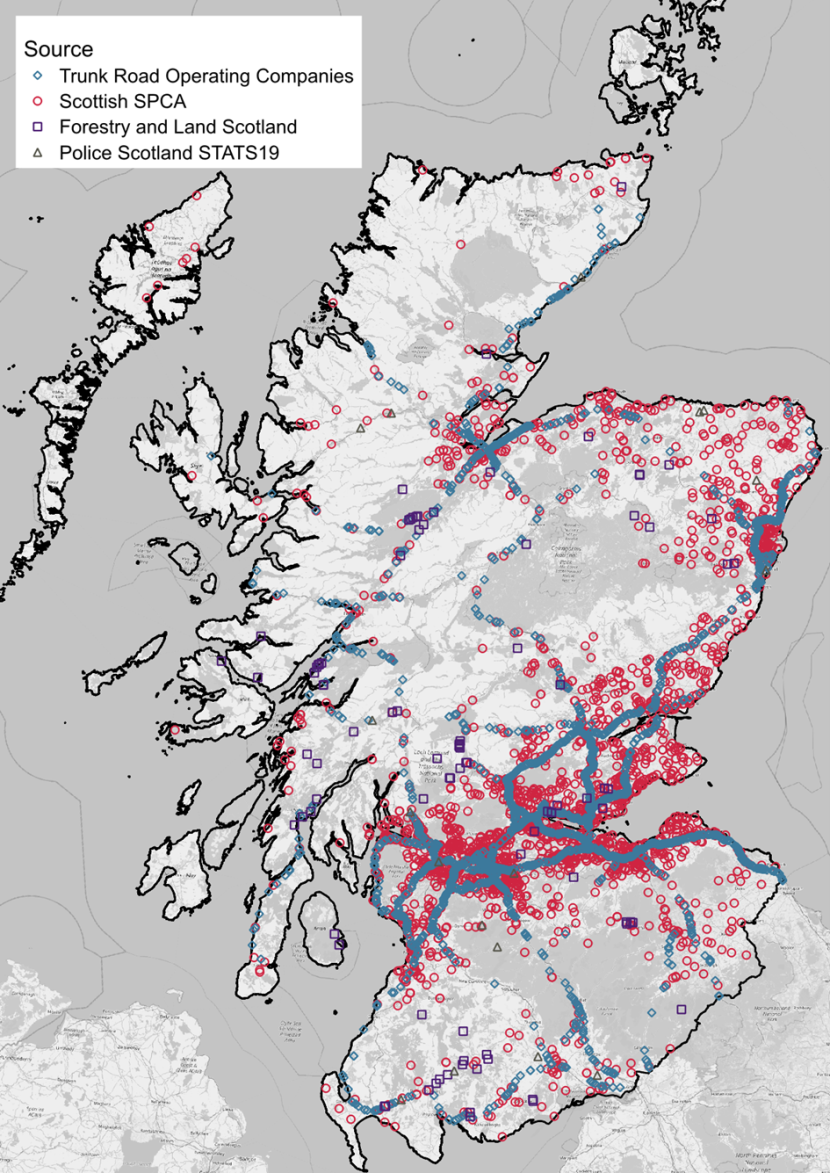
Figure 9. Locations of all mapped DVC reports obtained for 2022 to 2024 from Trunk Road Operating Companies, Scottish SPCA, Forestry and Land Scotland Rangers and Police Scotland STATS19 records. © Crown copyright (and database rights) 2025.
Click for a full description
Map data from OpenStreetMap.
Map of Scotland showing the locations of DVC reports, coloured by data supplier:
Trunk Road Operating Company as blue diamonds
Scottish SPCA as red circles
Forestry and Land Scotland as purple squares
Police Scotland STATS19 as brown triangles
Most records are scattered throughout Scotland, with obvious dense clusters in the central belt and Aberdeenshire.
The overall distribution of DVCs has changed little between 2013 and 2024 (Figure 10). Deer Vehicle Collisions are most frequently recorded on the trunk road network, through the central belt and around Aberdeen. There appears to be a greater density of DVCs on the trunk road network in 2022–2024, with more dark squares positioned on trunk roads. There are also indications that DVCs are less dense but more widespread in Aberdeenshire and Moray in 2022–2024.
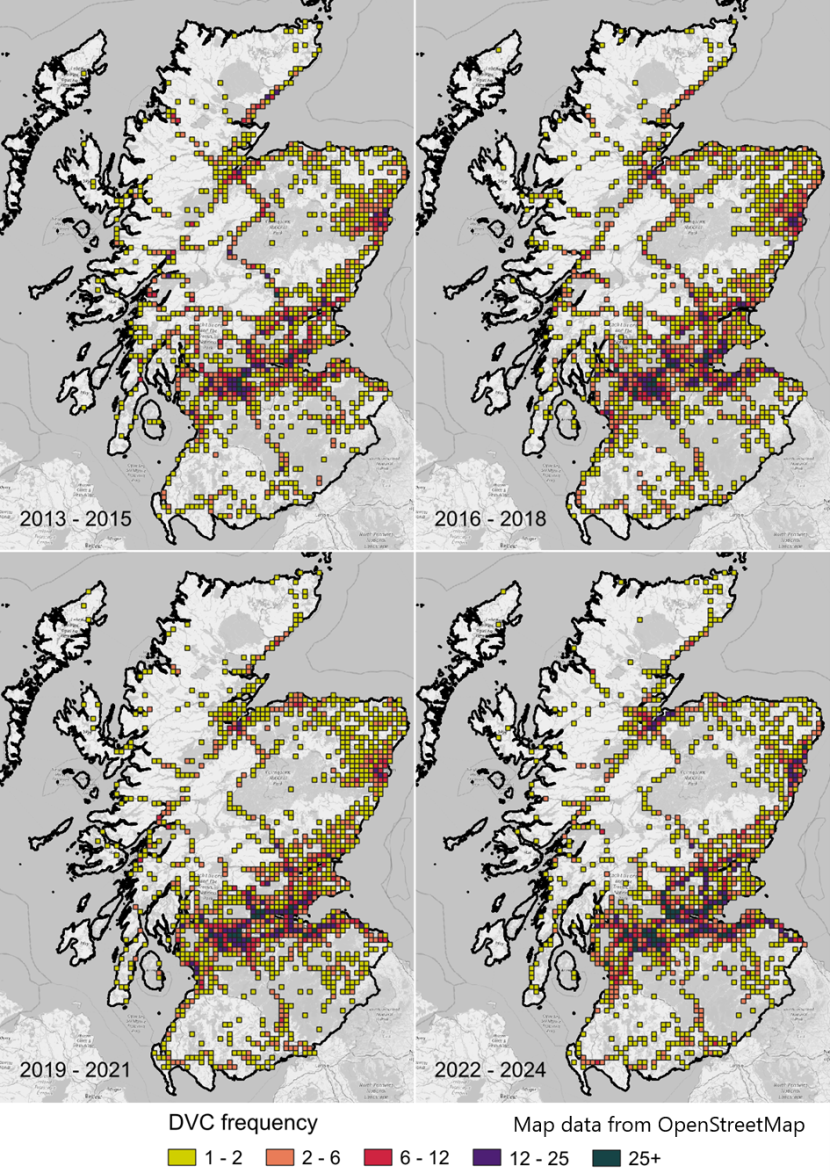
Figure 10. Distribution and frequency by 4 km by 4 km OS grid squares for DVC data from all core sources combined for 2013–’15, top left; 2016–’18, top right; 2019–’21, bottom left; and 2022–’24, bottom right © Crown copyright (and database rights) 2024.
Click for a full description
Maps of Scotland showing 4 km by 4 km Ordnance Survey grid squares in 2013–2015 (top left), 2016–2018 (top right), 2019–2021 (bottom left) and 2022–2024 (bottom right). The colour of each grid square represents the number of DVCs it contains:
1–2 records as pale green
2–6 records as orange
6–12 records as red
12–25 records as purple
25–80 records as dark teal
Data from all core sources are included. Comparison of the four periods mapped shows high densities of DVC reports in the central belt, around Aberdeen and around Inverness, with indications of a greater intensity on trunk roads in 2022–2024.
Changes in volume of TROC reports overall and by region
Overall, the number of DVCs reported by TROCs remained relatively stable between 2009 and 2024, but show a clear spike in numbers in 2023 (Figure 11).
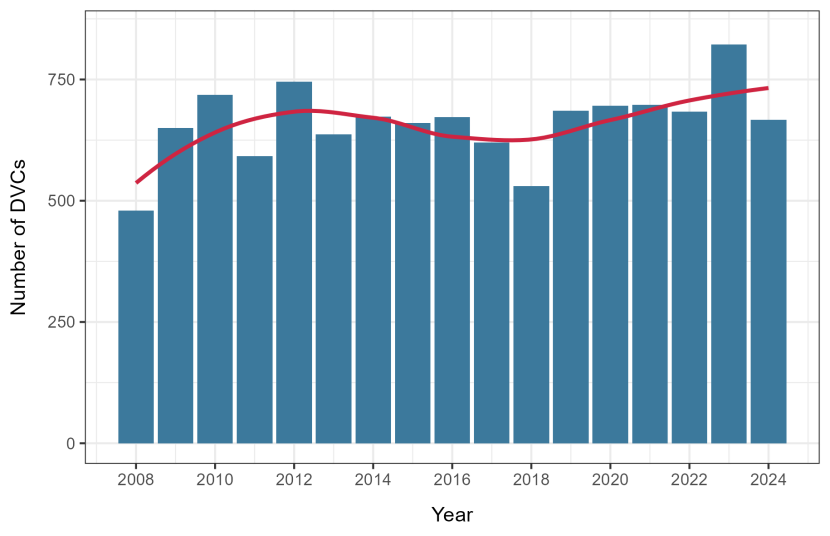
Figure 11. DVCs reported by Trunk Road Operating Companies for the years 2008 to 2024. Additional reports exported directly from AMPS are excluded. A smoothed trendline is superimposed in red.
Click for a full description
Bar chart showing the numbers of DVC reports received from Trunk Road Operating Companies per year. The y-axis is titled ‘Number of DVCs’ and ranges from zero to 850, labelled at intervals of 250. The x-axis shows years from 2008 to 2024, labelled every two years. Numbers of DVC reports were low in 2008 (480) and 2018 (530), and exceptionally high in 2023 (822), but otherwise varied between 592 to 745. A smoothed LOESS trendline for all data is superimposed in red, showing relatively little change in the number of DVC reports per year since 2009. The data are summarized in the following table.
Incident year Number of DVCs
2008 480
2009 650
2010 718
2011 592
2012 745
2013 637
2014 673
2015 660
2016 672
2017 620
2018 530
2019 686
2020 696
2021 698
2022 684
2023 822
2024 667
Figure 11 excludes additional data exported from Transport Scotland’s AMPS, as AMPS data was only available from April 2022 to April 2024. The number of additional records provided by AMPS varied (Figure 12), with the greatest number of additional records provided in 2023, which was also the only year with full data.
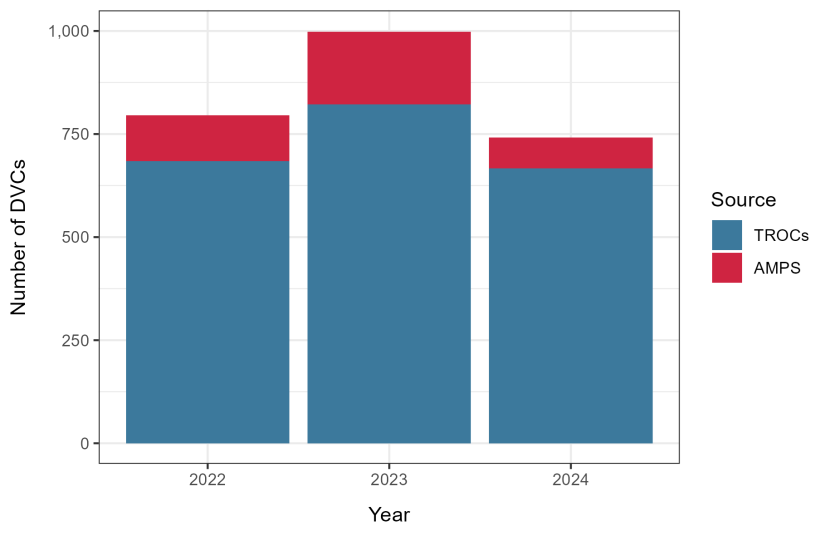
Figure 12. Reports of DVCs received per year from Trunk Road Operating Companies (TROCs) versus those only received as an extract from Transport Scotland’s Asset Management Performance System (AMPS) and not from the TROCs.
Click for a full description
AMPS data was available for the period April 2022 to April 2024 inclusive, so 2022 and 2024 do not represent full years. Stacked bar chart showing the numbers of DVC reports received per year from Trunk Road Operating Companies (TROCs) and extracted from Transport Scotland’s Asset Management Performance System (AMPS). The y-axis is titled ‘Number of DVCs’ and ranges from zero to 1,000, labelled at intervals of 250. The x-axis shows years from 2022 to 2024, labelled every year. DVC reports from TROCs is shown in blue, with records received only as part of the AMPS export stacked on top in red. Numbers of DVC reports per year from TROCs varied from 690 to 836. Numbers of DVC reports per year from AMPS only were 105 and 162 in 2022 and 2023 respectively, but only 15 in 2024. The data are summarized in the following table.
Year Number of DVCs (TROCs) Number of additional DVCs (AMPS)
2022 684 111
2023 822 176
2024 667 75
The number of DVC records reported by TROCs in the SE region increased gradually from 2008 and 2019, but showed a dramatic increase in reported DVCs between 2020 and 2023, after which numbers returned to normal in 2024. There was a significant strong increase between 2008 and 2024 (Spearman's rank-order correlation, r = 0.85, p < 0.01).
The NE region also showed an increase in the number DVC records reported by TROCs in 2023 and 2024, though numbers had remained remarkably stable between 2008 and 2022.
In contrast, the number of DVC records reported by TROCs in the NW region showed a significant strong decline from 2008 to 2024 (Spearman's rank-order correlation, r = -0.76, p < 0.01) (Figure 13).
The SW region shows great variation in the number of DVCs reported by TROCs per year, but no statistically significant change overall.
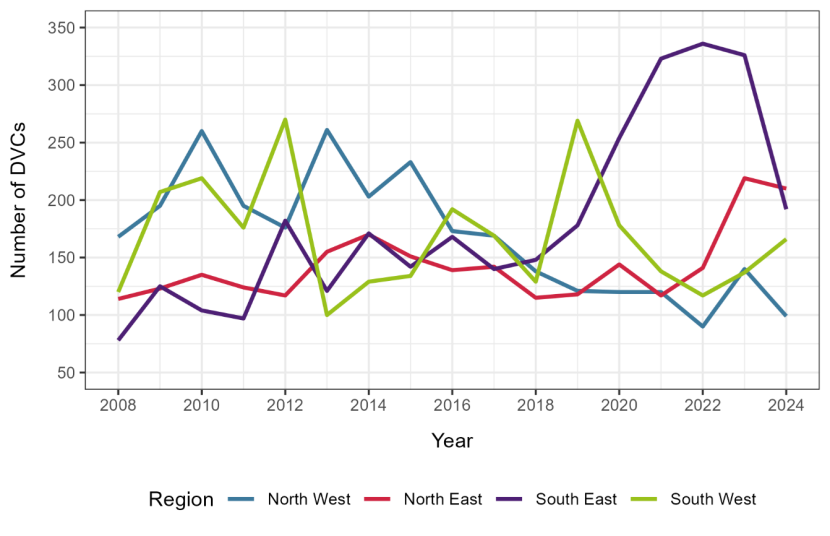
Figure 13. DVCs reported by Trunk Road Operating Companies by region for the years 2008 to 2024. Additional reports exported directly from AMPS are excluded.
Click for a full description
Chart showing number of DVCs reported by Trunk Road Operating Companies by region between 2008–2024. The y-axis is titled ‘Number of DVCs’ and ranges from 50 to 350, labelled at intervals of 50. The x-axis shows years from 2008 to 2024, labelled every two years. Each region is represented by a different coloured line. Though there is much variation in the number of DVCs reported in each year, overall trends are noted:
North West in blue, showing a gradual recent decline in DVC reports per year until 2022, but with a slight peak in 2023.
North East in red, showing little change since in DVC reports per year until 2022, but with an increase in 2023 and 2024.
South East in purple, showing a distinct increase in DVC reports per year since 2020, but with a much smaller number in 2024.
South West in green, showing great variation in the number of DVC reports per year, but no overall trend.
The data are summarised in the following table.
Number of DVCs reported by Trunk Road Operating Companies in four regions, 2008–2024.
Year North East North West South East South West
2008 114 168 78 120
2009 123 195 125 207
2010 135 260 104 219
2011 124 195 97 176
2012 117 176 182 270
2013 155 261 121 100
2014 170 203 171 129
2015 151 233 142 134
2016 139 173 168 192
2017 142 169 140 169
2018 115 138 148 129
2019 118 121 178 269
2020 144 120 254 178
2021 117 120 323 138
2022 141 90 336 117
2023 219 140 326 137
2024 210 99 192 166
Lush and Lush (2023) described an apparent increase in the number of DVC records in the SE unit since 2019, but the updated data instead shows that the number of records remained fairly consistent in 2021–2023 (Figure 14). This jump in the number of DVC records likely coincided with the contract change from Amey to BEAR Scotland in August 2020 and the subsequent provision of direct data extracts from the IRIS and AMPS databases, including some records from before August 2020.
The data also show generally fewer records from the SE unit in 2024 than in previous years across most months, especially in the normal May–June peak. Figure 14 suggests a dramatic drop between higher-than-normal records in December 2023 and lower than normal records in January 2024.
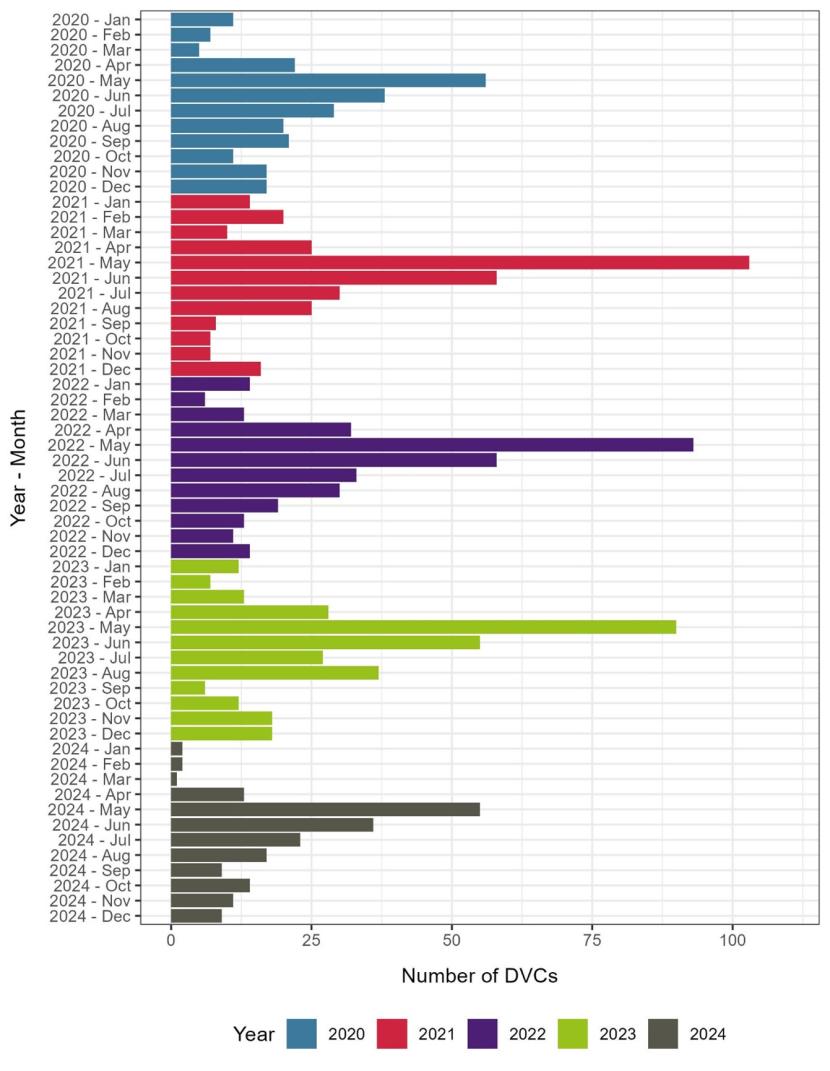
Figure 14. DVCs reported by Trunk Road Operating Companies per month for the South East unit between 2020–2024.
Click for a full description
Bar chart showing the numbers of DVC reports per month provided by Trunk Road Operating Companies for the South East unit and Forth Bridges Unit combined between 2020–2024. The Forth Bridges Unit is included as it was subsumed into the South East unit on 17 August 2020. The y-axis shows the year and month, covering 2020 to 2024. The x-axis is labelled ‘Number of DVCs’ and ranges from 0 to 110. Bars are coloured by year:
2020 in blue
2021 in red
2022 in purple
2023 in green
2024 in grey
Each year follows a similar pattern, with a peak in DVC reports in May and June, but the overall number of DVC reports in 2020 was lower than in subsequent years. The number of DVC reports between 2021 and 2023 remained consistent. In contrast, fewer DVCs were reported in 2024. Data are summarised in the following table:
Number of DVCs reported per month by the South East trunk road unit in 2020 to 2024.
Month 2020 2021 2022 2023 2024
January 12 14 14 17 21
February 7 20 6 7 24
March 7 10 14 13 28
April 22 25 32 32 56
May 60 103 93 97 87
June 40 58 58 59 64
July 32 31 33 30 37
August 20 25 31 37 38
September 23 8 19 6 32
October 12 7 13 15 48
November 19 7 11 18 38
December 17 16 15 22 30
As before, most reports of DVCs in all regions come from the Trunk Road Units, with relatively small numbers being reported from the DBFOs (Table 12).
| Year | North East Unit | North East DBFOs | North West Unit | North West DBFOs | South East Unit | South East DBFOs | South West Unit | South West DBFOs | Total |
|---|---|---|---|---|---|---|---|---|---|
| 2008 | 114 | - | 168 | - | 78 | - | 111 | 9 | 480 |
| 2009 | 123 | - | 195 | - | 125 | - | 194 | 13 | 650 |
| 2010 | 134 | 1 | 260 | - | 104 | - | 213 | 6 | 718 |
| 2011 | 124 | - | 195 | - | 95 | 2 | 167 | 9 | 592 |
| 2012 | 117 | - | 176 | - | 172 | 19 | 259 | 11 | 754 |
| 2013 | 155 | - | 261 | - | 112 | 19 | 85 | 15 | 647 |
| 2014 | 170 | - | 203 | - | 120 | 57 | 115 | 14 | 679 |
| 2015 | 145 | 6 | 233 | - | 89 | 56 | 121 | 13 | 663 |
| 2016 | 135 | 4 | 173 | - | 123 | 46 | 167 | 25 | 673 |
| 2017 | 141 | 1 | 169 | - | 111 | 31 | 153 | 16 | 622 |
| 2018 | 113 | 2 | 138 | - | 99 | 51 | 111 | 18 | 532 |
| 2019 | 158 | 25 | 145 | - | 250 | 89 | 382 | 48 | 1,097 |
| 2020 | 180 | 41 | 151 | - | 234 | 37 | 292 | 36 | 971 |
| 2021 | 178 | 38 | 162 | - | 307 | 17 | 186 | 30 | 918 |
| 2022 | 155 | 52 | 121 | - | 297 | 42 | 97 | 38 | 802 |
| 2023 | 308 | 70 | 160 | - | 289 | 64 | 190 | 49 | 1,130 |
| 2024 | 328 | 46 | 123 | - | 391 | 112 | 253 | 39 | 1,292 |
| Total | 2,778 | 286 | 3,033 | - | 2,996 | 642 | 3,096 | 389 | 13,220 |
Changes in the volume of SSPCA and FLS records
Unlike the data received from the TROCs, which is focussed on the trunk road network, data from the SSPCA and FLS offer an insight into DVC frequencies across the full Scottish road network.
The average number of records obtained from the SSPCA shows a significant strong increase between 2008 and 2017 (Spearman’s rank-order correlation, r = 0.95, p < 0.001), with a slight dip in 2014 (Figure 15). However, the annual number of SSPCA records seems to have plateaued since its peak of c.1,250 records in 2017. The apparent dip in 2020 ascribed to the lockdown imposed due to the Covid pandemic by Lush and Lush (2023) is clearly within the annual variation between 2018 and 2024.
The number of records obtained from FLS has seen a general decline since 2011 (Figure 15). There was a significant strong decline in the annual number of records between 2008 and 2024, despite relatively stable numbers until 2012 (Spearman’s rank-order correlation, r = -0.83, p < 0.001).
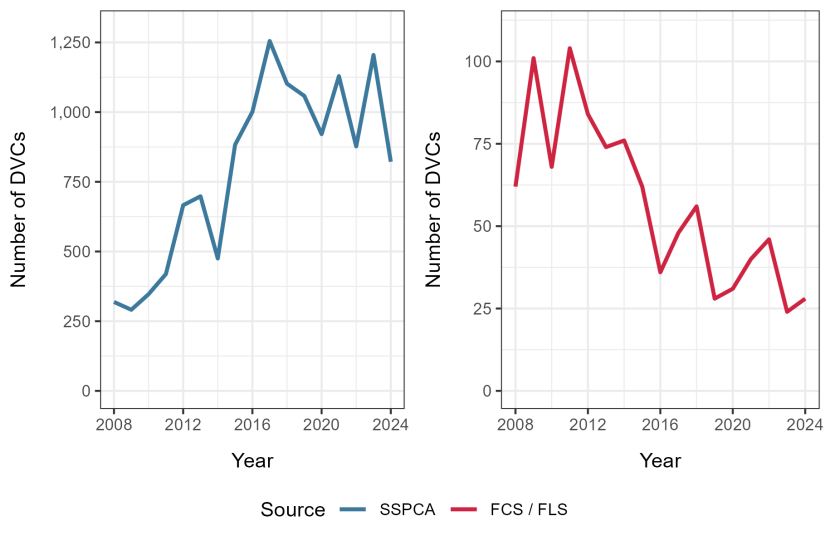
Figure 15. Changes in the number of DVC related incidents reported by the Scottish Society for the Prevention of Cruelty to Animals (SSPCA) and Forestry and Land Scotland (formerly Forestry Commission Scotland; FCS/FLS) between 2008 and 2024.
Click for a full description
Two charts showing number of DVCs reported by Scottish Society for the Prevention of Cruelty to Animals (SSPCA; left) and Forestry and Land Scotland (formerly Forestry Commission Scotland; FCS / FLS; right) between 2008 and 2024. In both charts, the y-axis is labelled ‘Number of DVCs’ and the x-axis shows years from 2008 to 2024, labelled every four years. The y-axis for the SSPCA chart ranges from zero to 1,300, labelled at intervals of 250. The number of DVCs reported per year by the SSPCA varies, but shows an overall increase in DVC reports per year from 291 in 2009 to 1,255 in 2017, following which numbers appear to have plateaued. The y-axis for the Forestry and Land Scotland chart ranges from zero to 110, labelled at intervals of 25. The number of DVCs reported per year by the Forestry and Land Scotland also varies, but shows an overall decline from a peak of 104 in 2011 to 24 in 2023. The data are summarised in the following table.
Number of DVC related incidents reported by the Scottish Society for the Prevention of Cruelty to Animals (SSPCA) and Forestry and Land Scotland (formerly Forestry Commission Scotland; FCS/FLS) between 2008 and 2024.
Year SSPCA FCS / FLS
2008 319 62
2009 291 101
2010 347 68
2011 419 104
2012 666 84
2013 698 74
2014 475 76
2015 883 62
2016 1001 36
2017 1255 48
2018 1102 56
2019 1058 28
2020 921 31
2021 1129 40
2022 877 46
2023 1205 24
2024 822 28
The distribution of these records in each local authority area in Scotland is shown in Table 13. Aberdeenshire has the largest total number of records spanning all years, followed by Fife and then North Lanarkshire. This is similar to the pattern reported in Lush and Lush (2023), except that Highland has been relegated to fourth place. The Western Isles continue to contain the lowest frequency of reported DVCs.
However, when expressed per kilometre of road within each local authority, East Dunbartonshire has the highest number of DVCs reported by SSPCA and FLS between 2008 and 2024, followed by Aberdeen City between 2008 and 2017, and North Lanarkshire between 2018 and 2024. This likely reflects relatively high numbers of DVCs, dense road networks, high traffic volumes and the location of SSPCA animal rescue centres.
| Unitary Authority | 2008–2017 SSPCA | 2008–2017 FLS | 2008–2017 Total / 100 km / year | 2018–2024 SSPCA | 2018–2024 FLS | 2018–2024 Total / 100 km / year |
|---|---|---|---|---|---|---|
| East Dunbartonshire | 195 | - | 2.8421 | 89 | - | 1.8531 |
| North Lanarkshire | 444 | - | 2.0005 | 286 | 1 | 1.8473 |
| Midlothian | 172 | - | 1.8212 | 122 | - | 1.8454 |
| Clackmannanshire | 69 | 1 | 1.5693 | 52 | - | 1.6654 |
| Falkirk | 176 | 1 | 1.3230 | 150 | - | 1.6017 |
| Fife | 615 | 8 | 1.5152 | 436 | 1 | 1.5184 |
| East Lothian | 206 | - | 1.2727 | 151 | - | 1.3327 |
| West Lothian | 164 | 2 | 1.0737 | 131 | 1 | 1.2197 |
| Aberdeen City | 292 | - | 2.1663 | 103 | 1 | 1.1022 |
| Inverclyde | 46 | - | 0.8242 | 42 | - | 1.0750 |
| West Dunbartonshire | 45 | - | 0.7656 | 44 | - | 1.0695 |
| Stirling | 215 | 47 | 0.9901 | 183 | 15 | 1.0689 |
| Glasgow City | 299 | - | 1.3178 | 168 | - | 1.0578 |
| Renfrewshire | 102 | - | 0.8295 | 72 | - | 0.8365 |
| City of Edinburgh | 113 | - | 0.5731 | 115 | - | 0.8332 |
| East Renfrewshire | 66 | - | 0.9220 | 41 | - | 0.8182 |
| Dundee City | 63 | - | 0.8752 | 36 | - | 0.7145 |
| South Lanarkshire | 224 | 4 | 0.5976 | 181 | 3 | 0.6890 |
| Perth and Kinross | 413 | 2 | 0.6952 | 274 | 2 | 0.6605 |
| Angus | 208 | 3 | 0.6571 | 147 | 1 | 0.6585 |
| Aberdeenshire | 909 | 53 | 0.9017 | 460 | 7 | 0.6253 |
| Moray | 179 | 44 | 0.6245 | 142 | 7 | 0.5961 |
| North Ayrshire | 84 | 8 | 0.5170 | 62 | 9 | 0.5700 |
| Scottish Borders | 217 | 8 | 0.3779 | 153 | 5 | 0.3791 |
| Argyll and Bute | 145 | 246 | 0.5540 | 88 | 45 | 0.2692 |
| Highland | 426 | 164 | 0.3630 | 283 | 20 | 0.2663 |
| South Ayrshire | 61 | 3 | 0.2587 | 44 | 2 | 0.2656 |
| East Ayrshire | 60 | 6 | 0.2934 | 37 | - | 0.2350 |
| Dumfries and Galloway | 144 | 115 | 0.2700 | 113 | 35 | 0.2204 |
| Na h-Eileanan an Iar | 2 | - | 0.0112 | 5 | - | 0.0399 |
| Scotland | 6,354 | 715 | 0.7116 | 4,210 | 155 | 0.6277 |
Changes to the number of human injury collisions and damage-only DVCs attended by the police
Overall, there has been a significant strong decline in DVCs from road traffic collision reporting (Figure 16; Spearman’s rank-order correlation, r = -0.80, p < 0.01). Most of this decline has been since 2018, with no significant decline in the number of records between 2008 and 2017. The average number of DVC records from road traffic collision reporting between 2018 and 2023 was little over half the average from previous years, despite the better availability of STATS19 data then reported in Lush and Lush (2023). This decline may be real or reflect incomplete data from 2018 to 2023 if not all relevant STATS19 records were included in Police Scotland’s CRaSH database (see Police and Road Safety Teams’ RTC records).
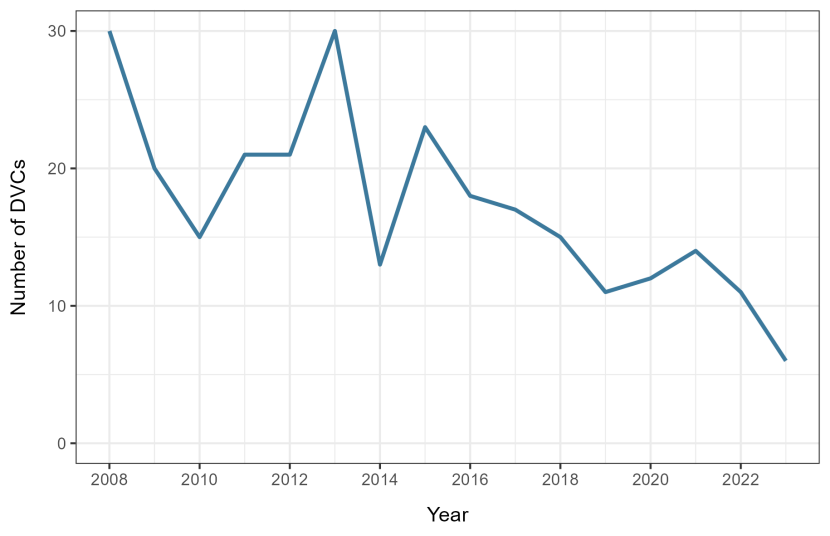
Figure 16. Changes in the number of personal injury DVC related incidents obtained from STATS19 between 2008 and 2023.
Click for a full description
Chart showing number of personal injury DVC related incidents obtained from STATS19 between 2008 and 2023. STATS19 data were not available for 2024 at the time of writing. The y-axis is titled ‘Number of DVCs’ and ranges from zero to 30, labelled at intervals of 10. The x-axis shows years from 2008 to 2023, labelled every two years. Numbers of DVCs reported per annum varied but remained relatively stable between 13 and 30 until about 2015, following which there has been a gradual decline to a low of six in 2023. Data are summarised in Table 10.
DVC distribution and change on the wider road network
The changing distribution and frequencies of DVCs across the entire Scottish road network, including non-trunk roads, was assessed by using a hexagonal grid using the method described in Lush and Lush (2023). In summary:
- Each cell was approximately 100 km².
- Cells were attributed with the total length of road they contained, taken from Scotland only Ordnance Survey Open Roads data (see Supporting data).
- Cells were attributed with DVC counts in 2008–2017 and 2018–2024 in the categories: all records, core records only, core records excluding TROC data.
- The average number of DVCs per kilometre of road per year was calculated for the six combinations.
- Change was calculated by subtracting 2008–2017 values from the equivalent values for 2018–2024.
The change in the average number of DVCs per kilometre of road per year using all DVC records is shown in Figure 17, core DVC records only in Figure 18and core records excluding those from TROCs in Figure 19. In each case there was an overall increasing trend, so change per cell relative to the overall change is highlighted by styling the average change as white, instead of no change. All show a relative increase in the average number of DVCs per kilometre of road per year in the central belt and an overall relative decrease in the north. This is less pronounced but still clear when data from the TROCs is excluded (Figure 19), which suggests that the trend is not solely due to an increase in incidents recorded from trunk roads in central belt.
There is a clear outlier on the southern border in Figures 17 and 18. This relates to two records on the A68 at Carter Bar in 2023 and 2024, although there were no previous records for this area. The short length of road within Scotland in this cell (c.1.1 km) exaggerates the change. It is absent from Figure 19, which demonstrates that it has not affected the overall pattern of change.
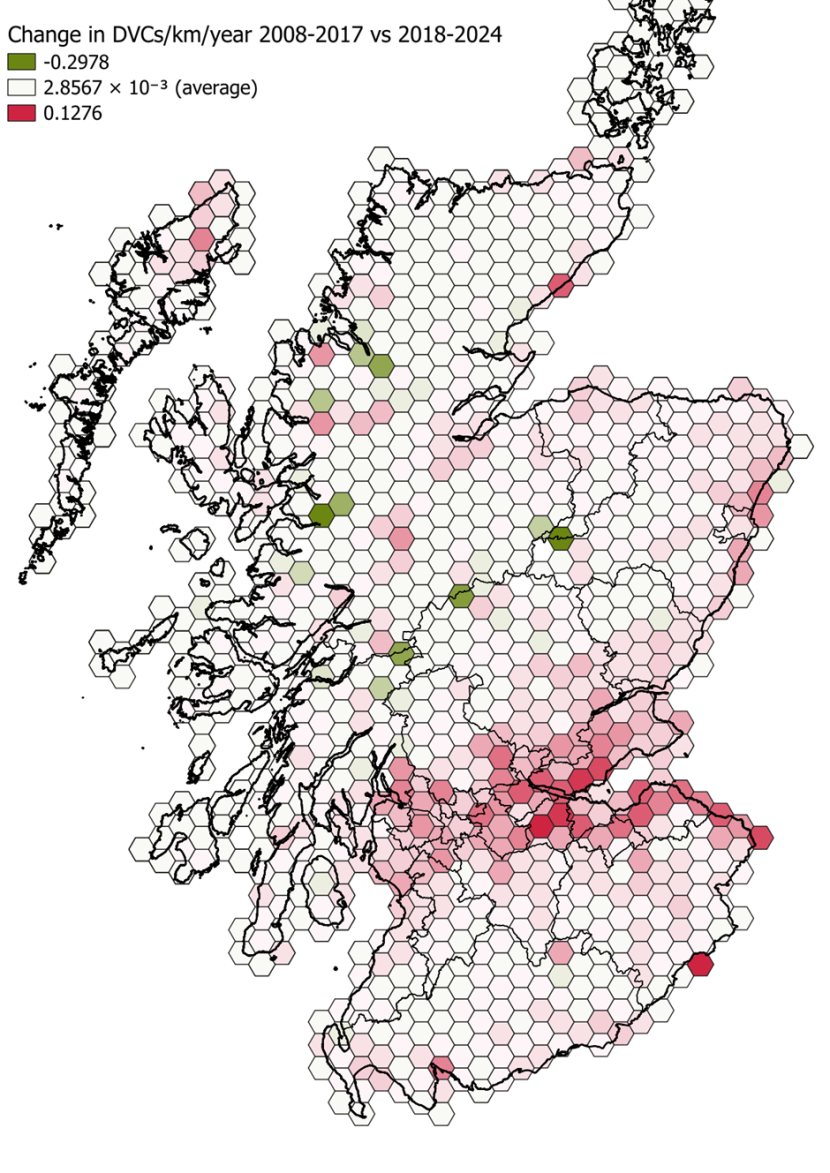
Figure 17. Change in the average number of DVCs per kilometre of road per year between 2008–2017 and 2018–2024 for the entire road network, calculated using all DVC records. © Crown copyright (and database rights) 2024.
Click for a full description
Map of Scotland showing the change in the average number of DVCs per kilometre of road per year in 100 km² hexagonal grid cells between 2008–2017 and 2018–2024. DVCs reported by all sources are included. The full road network is considered, rather than trunk roads only. See Lush and Lush (2023) for an explanation of how change was calculated.
The colour of each cell represents the change in average number of DVCs per kilometre of road per year. Since there is an overall trend of increasing numbers of DVC reports, white cells represent the average change rather than zero change. Thus, red cells indicate an above average increase in the number of DVCs per kilometre of road per year, whilst green cells indicate a blow average change:
The greatest decrease is -0.2978 DVCs per kilometre of road per year and is shown in dark green.
The average change is 2.8567 ×10-³ DVCs per kilometre of road per year and is shown in white. This is so that reds and greens show below and above average change, concealing the overall trend.
The greatest increase is 0.1276 DVCs per kilometre of road per year and is shown in dark red.
Most of increase is in the central belt, whilst the north of Scotland shows the greatest overall decrease.
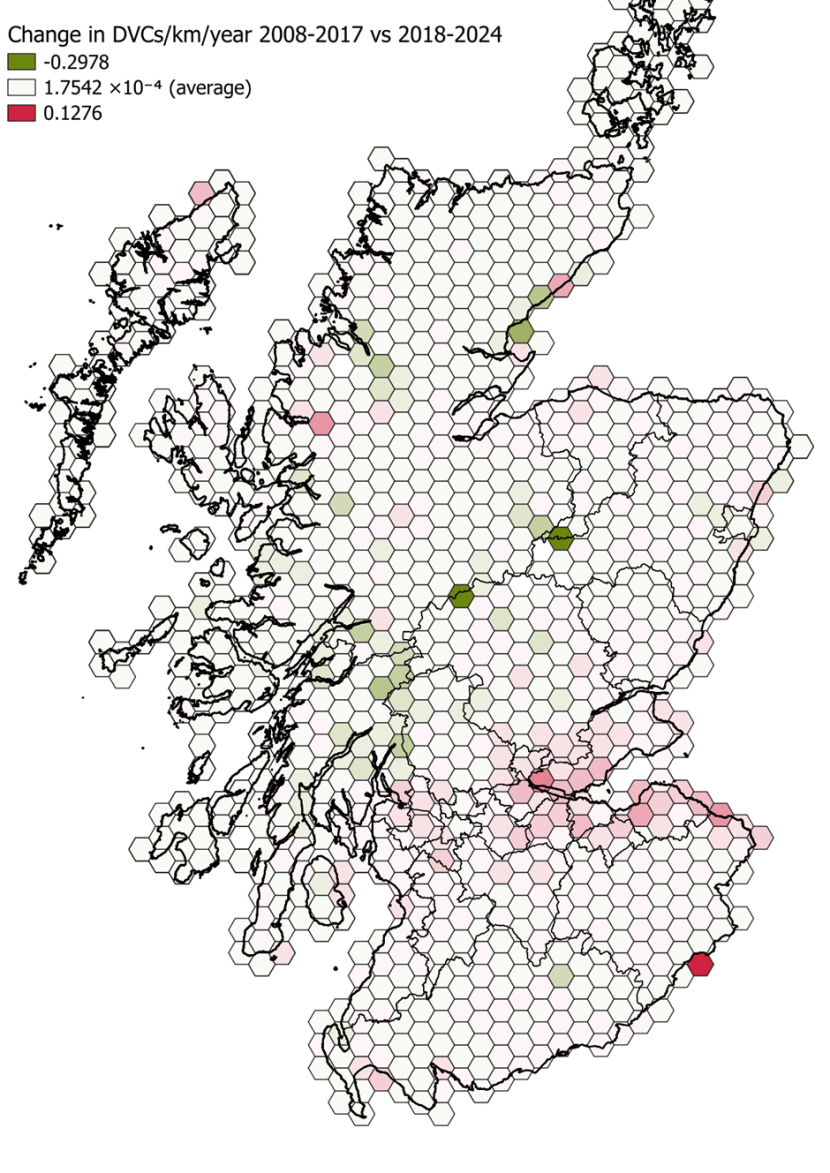
Figure 18. Change in the average number of DVCs per kilometre of road per year between 2008–2017 and 2018–2024 for the entire road network, calculated using only core DVC records. © Crown copyright (and database rights) 2024.
Click for a full description
Map of Scotland showing the change in the average number of DVCs per kilometre of road per year in 100 km² hexagonal grid cells between 2008–2017 and 2018–2024. Only DVCs reported by core sources are included. The full road network is considered, rather than trunk roads only. See Lush and Lush (2023) for an explanation of how change was calculated.
The colour of each cell represents the change in average number of DVCs per kilometre of road per year. Since there is an overall trend of increasing numbers of DVC reports, white cells represent the average change rather than zero change. Thus, red cells indicate an above average increase in the number of DVCs per kilometre of road per year, whilst green cells indicate a blow average change:
The greatest decrease is -0.2978 DVCs per kilometre of road per year and is shown in dark green.
The average change is 1.7542 ×10⁻⁴ DVCs per kilometre of road per year and is shown in white. This is so that reds and greens show below and above average change, concealing the overall trend.
The greatest increase is 0.1276 DVCs per kilometre of road per year and is shown in dark red.
Most of increase is in the central belt, whilst the north of Scotland shows the greatest overall decrease.
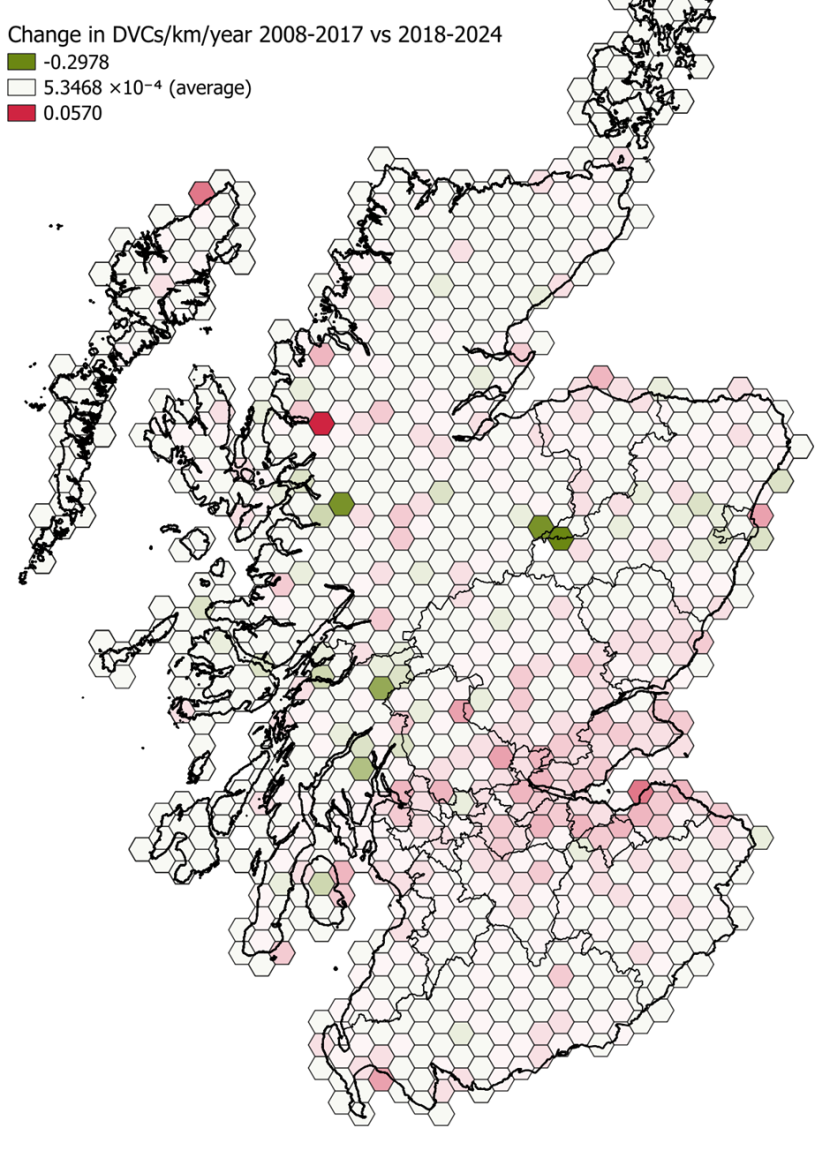
Figure 19. Change in average number of DVCs per km of road per year between 2008–2017 & 2018–2024 for entire road network, calculated using only core DVC records excluding any gathered by trunk road operators. © Crown copyright (and database rights) 2024.
Click for a full description
Map of Scotland showing the change in the average number of DVCs per kilometre of road per year in 100 km² hexagonal grid cells between 2008–2017 and 2018–2024. Only DVCs reported by core sources are included, but those reported by trunk road operators are excluded. The full road network is considered, rather than trunk roads only. See Lush and Lush (2023) for an explanation of how change was calculated.
The colour of each cell represents the change in average number of DVCs per kilometre of road per year. Since there is an overall trend of increasing numbers of DVC reports, white cells represent the average change rather than zero change. Thus, red cells indicate an above average increase in the number of DVCs per kilometre of road per year, whilst green cells indicate a blow average change:
The greatest decrease is -0.2978 DVCs per kilometre of road per year and is shown in dark green.
The average change is 5.3468 ×10⁻⁴ DVCs per kilometre of road per year and is shown in white. This is so that reds and greens show below and above average change, concealing the overall trend.
The greatest increase is 5.7003 × 10-² DVCs per kilometre of road per year and is shown in dark red.
Most of increase is in the central belt, whilst the north of Scotland shows the greatest overall decrease.
DVC distribution and change on the trunk road network
The hexagonal grid approach was also applied to DVCs on the trunk road network. Only records that were on the trunk road or within 250 m were included.
The change in the average number of DVCs per kilometre of trunk road per year using all DVC records is shown in Figure 20 and core DVC records only in Figure 21. In both cases, there was an overall increasing trend in DVC records and the strongest increase occurred in the central belt, though for core records this predominantly affected only the eastern part. The north of Scotland showed the strongest overall decline when all and only core records were considered.
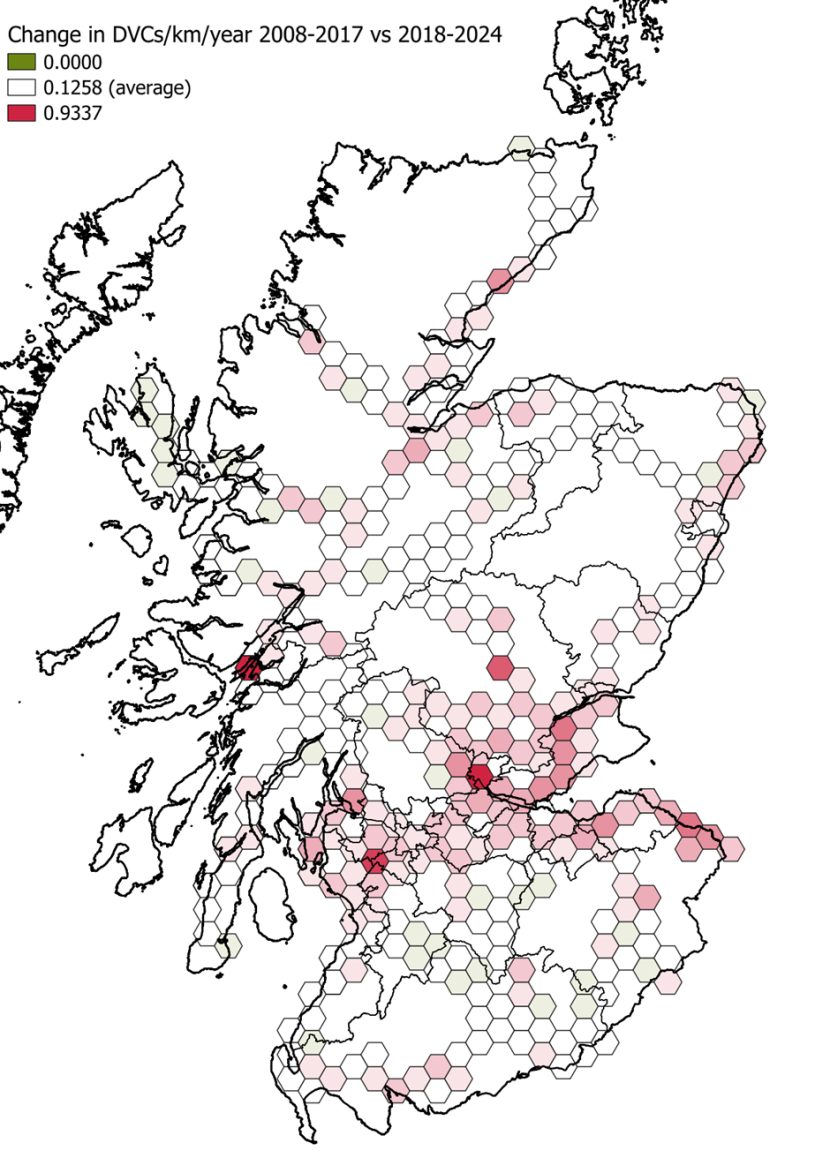
Figure 20. Change in the average number of DVCs per kilometre of road per year between 2008–2017 and 2018–2024 for the trunk road network, calculated using all DVC records on or within 250 m of a trunk road. © Crown copyright (and database rights) 2024.
Click for a full description
Map of Scotland showing the change in the average number of DVCs per kilometre of trunk road per year in 100 km² hexagonal grid cells between 2008–2017 and 2018–2024. DVCs reported by all sources within 250 m of a trunk road are included. Only the trunk road network is considered – see Figure 17 for an equivalent map covering the entire road network. See Lush and Lush (2023) for an explanation of how change was calculated.
The colour of each cell represents the change in average number of DVCs per kilometre of trunk road per year. Since there is an overall trend of increasing numbers of DVC reports, white cells represent the average change rather than zero change. Thus, red cells indicate an above average increase in the number of DVCs per kilometre of road per year, whilst green cells indicate a blow average change:
The smallest change is zero DVCs per kilometre of trunk road per year and is shown in dark green.
The average change is 0.1258 DVCs per kilometre of trunk road per year and is shown in white. This is so that reds and greens show below and above average change, concealing the overall trend.
The greatest increase is 0.9337 DVCs per kilometre of trunk road per year and is shown in dark red.
Most of increase is in the central belt, whilst the north of Scotland shows the smallest overall increase.
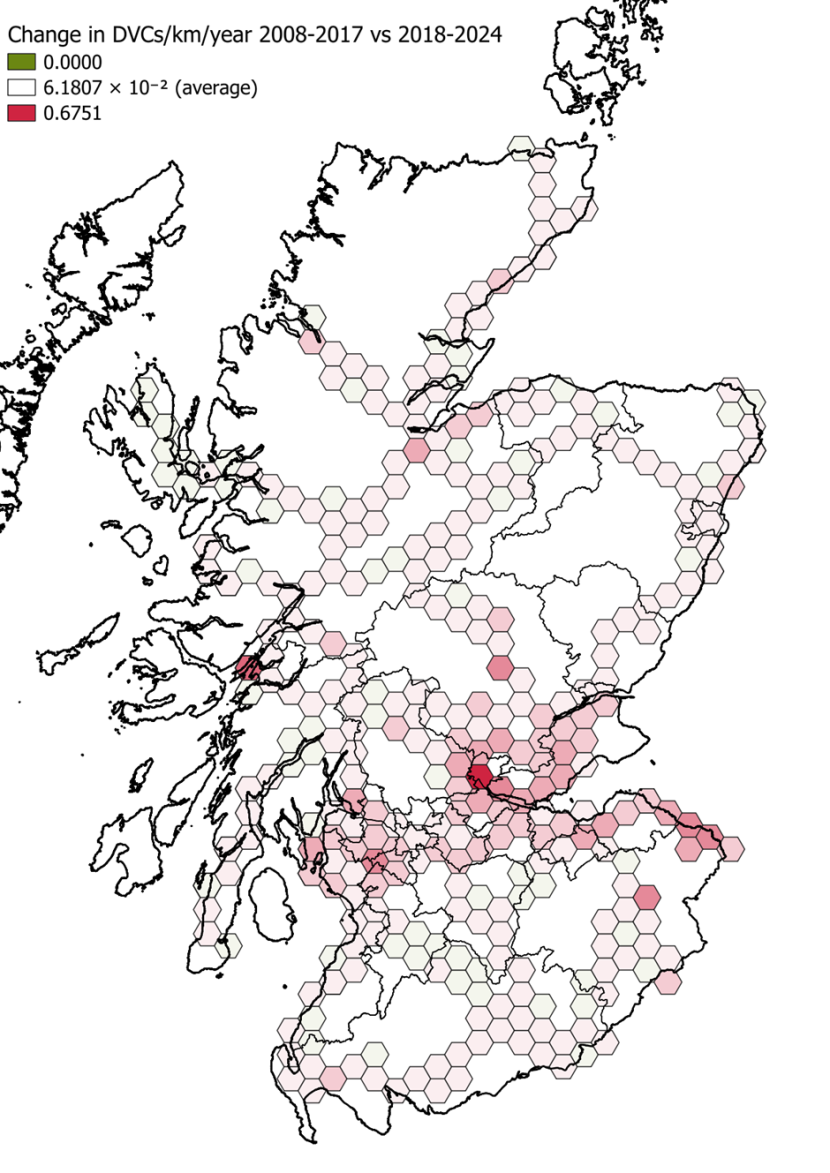
Figure 21. Change in the average number of DVCs per km of road per year between 2008–2017 and 2018–2024 for the trunk road network, calculated using only core DVC records on or within 250 m of a trunk road. © Crown copyright (and database rights) 2024.
Click for a full description
Map of Scotland showing the change in the average number of DVCs per kilometre of trunk road per year in 100 km² hexagonal grid cells between 2008–2017 and 2018–2024. Only DVCs reported by core sources are within 250 m of a trunk road included. Only the trunk road network is considered – see Figure 18 for an equivalent map covering the entire road network. See Lush and Lush (2023) for an explanation of how change was calculated.
The colour of each cell represents the change in average number of DVCs per kilometre of trunk road per year. Since there is an overall trend of decreasing numbers of DVC reports, white cells represent the average change rather than zero change. Thus, red cells indicate an above average increase in the number of DVCs per kilometre of road per year, whilst green cells indicate a blow average change:
The smallest change is zero DVCs per kilometre of trunk road per year and is shown in dark green.
The average change is 6.1807 ×10-² DVCs per kilometre of trunk road per year and is shown in white. This is so that reds and greens show below and above average change, concealing the overall trend.
The greatest increase is 0.6751 DVCs per kilometre of trunk road per year and is shown in dark red.
Most of increase is in the central belt.
Combined records from all core sources by local authority areas
Highland continues to contain the largest number of DVC incident reports from core sources (Table 14), largely due to large numbers reported by the North West unit trunk road operating company (Figure 22, top). Fife, Perth and Kinross, and Aberdeenshire, also contribute large numbers of recorded DVC incidents.
However, Falkirk has the largest number of DVCs per length of road from core sources (Figure 22, bottom), followed by North Lanarkshire and East Lothian. Fife has the fourth largest number of DVCs per length of road, but Perth and Kinross, and especially Highland and Aberdeenshire rank much lower. This reflects road network, deer density and likely recording bias, with local authorities in the central belt ranking higher.
| Unitary Authority | 2008–2017 All Core Avg | 2008–2017 % TROC | 2018–2024 All Core Avg | 2018–2024 % TROC |
|---|---|---|---|---|
| Highland | 186.2 | 63.7 | 155.3 | 53.8 |
| Fife | 103.2 | 37.8 | 176.6 | 43.4 |
| Perth and Kinross | 130.4 | 67.3 | 134.9 | 52.9 |
| Aberdeenshire | 118.2 | 17.1 | 121.3 | 19.2 |
| North Lanarkshire | 71.1 | 37.8 | 92.0 | 30.0 |
| Stirling | 65.2 | 57.5 | 80.9 | 42.0 |
| Dumfries and Galloway | 69.4 | 62.8 | 66.1 | 47.1 |
| Glasgow City | 65.8 | 54.7 | 67.1 | 44.7 |
| East Lothian | 43.2 | 51.4 | 80.9 | 53.9 |
| South Lanarkshire | 49.1 | 54.2 | 69.9 | 40.7 |
| Argyll and Bute | 74.5 | 47.4 | 44.3 | 33.2 |
| Falkirk | 42.3 | 55.6 | 74.7 | 50.9 |
| Scottish Borders | 38.2 | 39.0 | 57.7 | 39.4 |
| Angus | 40.1 | 45.1 | 45.1 | 20.9 |
| West Lothian | 23.7 | 28.7 | 51.7 | 35.1 |
| City of Edinburgh | 20.5 | 43.9 | 52.0 | 46.4 |
| Renfrewshire | 27.2 | 62.5 | 43.4 | 52.6 |
| Moray | 27.2 | 16.5 | 34.6 | 11.6 |
| Aberdeen City | 32.9 | 10.9 | 28.3 | 14.6 |
| Midlothian | 23.2 | 25.0 | 36.6 | 14.8 |
| North Ayrshire | 21.6 | 57.4 | 32.4 | 49.8 |
| South Ayrshire | 17.3 | 63.0 | 25.6 | 50.8 |
| East Dunbartonshire | 19.5 | 0.0 | 19.6 | 0.0 |
| East Renfrewshire | 12.9 | 48.8 | 20.1 | 56.0 |
| West Dunbartonshire | 11.9 | 62.2 | 21.1 | 49.3 |
| East Ayrshire | 11.2 | 41.1 | 18.9 | 43.2 |
| Inverclyde | 9.2 | 50.0 | 14.1 | 29.3 |
| Clackmannanshire | 7.3 | 4.1 | 12.9 | 13.3 |
| Dundee City | 7.6 | 17.1 | 12.3 | 33.7 |
| Na h-Eileanan an Iar | 0.3 | 0.0 | 1.7 | 0.0 |
| Total | 1,370.4 | 47.0 | 1,692.0 | 40.3 |
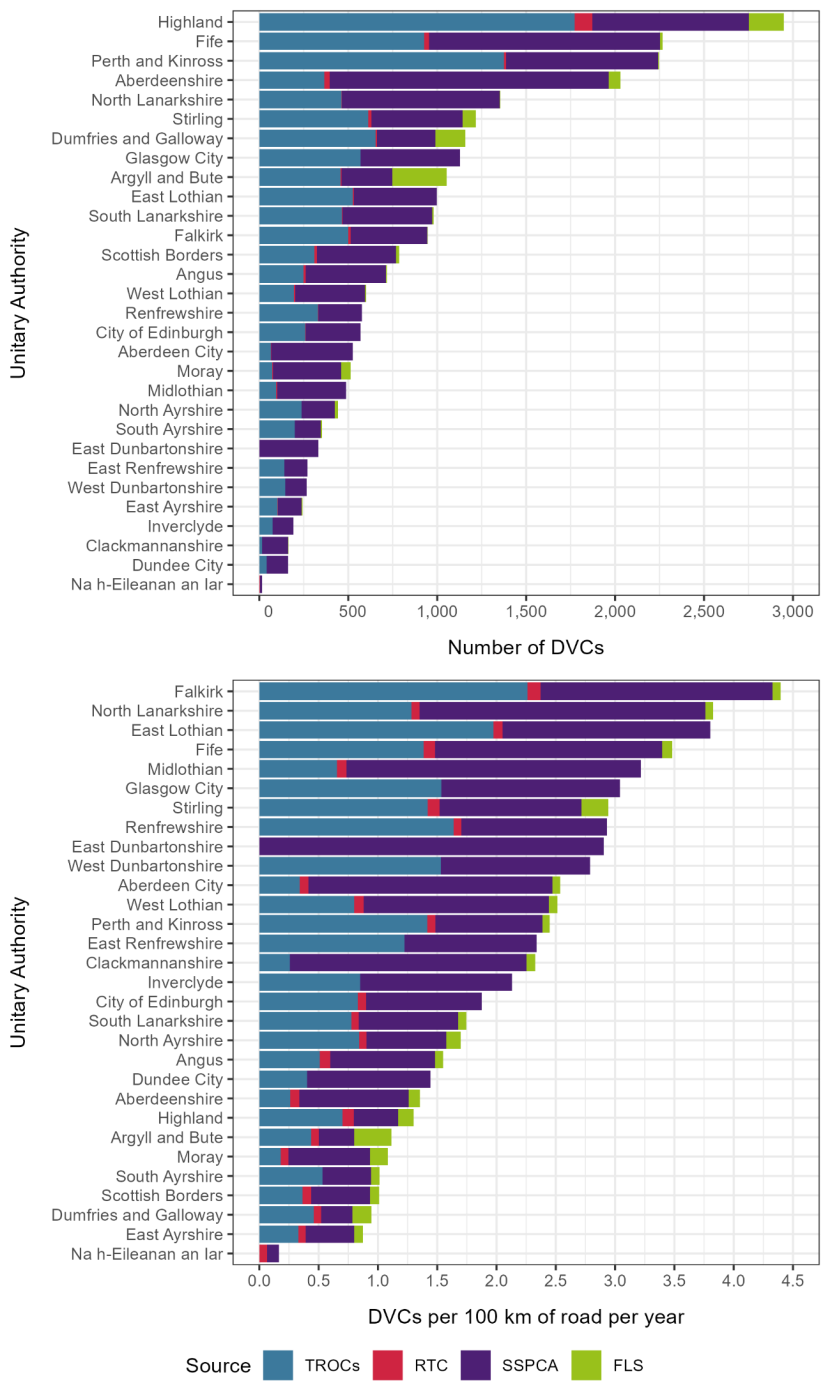
Figure 22. Total number (top) and number per 100 km of road per year (bottom) of DVCs reported from 2008 to 2024 from all core sources within each Scottish local authority, segmented by source type.
Click for a full description
The figure comprises two bar charts that have been converted into the following tables.
Number of DVCs reported by core sources in each Scottish local authority, in order of descending totals. TROC = Trunk Road Operating Company, RTC = Road Traffic Collision, SSPCA = Scottish Society for the Prevention of Cruelty to Animals; FLS = Forestry and Land Scotland.
Unitary Authority TROC RTC SSPCA FLS Total
Highland 1,772 99 880 198 2,949
Fife 926 28 1,297 17 2,268
Perth and Kinross 1,376 12 854 6 2,248
Aberdeenshire 365 32 1,568 66 2,031
North Lanarkshire 462 3 888 2 1,355
Stirling 613 17 512 76 1,218
Dumfries and Galloway 654 6 330 167 1,157
Glasgow City 570 0 558 0 1,128
Argyll and Bute 456 5 287 307 1,055
East Lothian 527 5 466 0 998
South Lanarkshire 465 3 505 7 980
Falkirk 501 12 431 2 946
Scottish Borders 308 16 443 19 786
Angus 247 15 451 4 717
West Lothian 195 6 394 4 599
Renfrewshire 330 1 245 0 576
City of Edinburgh 259 3 307 0 569
Aberdeen City 65 3 458 1 527
Moray 73 4 383 54 514
Midlothian 96 3 389 0 488
North Ayrshire 237 1 186 19 443
South Ayrshire 200 0 146 6 352
East Dunbartonshire 0 0 332 0 332
East Renfrewshire 142 0 128 0 270
West Dunbartonshire 147 0 120 0 267
East Ayrshire 103 1 134 6 244
Inverclyde 75 0 116 0 191
Clackmannanshire 15 0 147 1 163
Dundee City 42 0 120 0 162
Na h-Eileanan an Iar 0 2 13 0 15
Total 11,221 277 13,088 962 25,548
Number of DVCs per 100 km of road per year reported by core sources in each Scottish local authority, in order of descending totals. TROC = Trunk Road Operating Company, RTC = Road Traffic Collision, SSPCA = Scottish Society for the Prevention of Cruelty to Animals; FLS = Forestry and Land Scotland.
Unitary Authority TROC RTC SSPCA FLS Total
Falkirk 2.26 0.11 1.95 0.07 4.39
North Lanarkshire 1.28 0.07 2.41 0.06 3.82
East Lothian 1.97 0.08 1.75 0 3.8
Fife 1.38 0.1 1.91 0.08 3.47
Midlothian 0.66 0.08 2.48 0 3.22
Glasgow City 1.54 0 1.51 0 3.05
Stirling 1.42 0.1 1.2 0.23 2.95
Renfrewshire 1.64 0.06 1.23 0 2.93
East Dunbartonshire 0 0 2.91 0 2.91
West Dunbartonshire 1.53 0 1.26 0 2.79
Aberdeen City 0.34 0.07 2.06 0.06 2.53
West Lothian 0.8 0.08 1.56 0.07 2.51
Perth and Kinross 1.41 0.07 0.9 0.06 2.44
East Renfrewshire 1.23 0 1.11 0 2.34
Clackmannanshire 0.26 0 2 0.07 2.33
Inverclyde 0.85 0 1.28 0 2.13
City of Edinburgh 0.83 0.07 0.97 0 1.87
South Lanarkshire 0.78 0.06 0.84 0.07 1.75
North Ayrshire 0.84 0.06 0.67 0.12 1.69
Angus 0.51 0.09 0.89 0.07 1.56
Dundee City 0.4 0 1.04 0 1.44
Aberdeenshire 0.26 0.08 0.92 0.1 1.36
Highland 0.7 0.09 0.38 0.13 1.3
Argyll and Bute 0.44 0.06 0.3 0.31 1.11
Moray 0.18 0.07 0.69 0.15 1.09
Scottish Borders 0.36 0.07 0.5 0.08 1.01
South Ayrshire 0.53 0 0.41 0.07 1.01
Dumfries and Galloway 0.46 0.06 0.26 0.16 0.94
East Ayrshire 0.33 0.06 0.41 0.07 0.87
Na h-Eileanan an Iar 0 0.07 0.1 0 0.17
Human injury collisions and damage-only DVCs attended by the police
Whilst most human personal injuries sustained through deer-related road incidents are slight, the higher proportion of serious incidents reported in Lush and Lush (2023) continued between 2021 and 2023, but no fatal collisions were reported (Figure 23). Unfortunately, it is difficult to draw any conclusions about this due to possible gaps in the data: if all missing data between 2018 and 2023 related to slight injuries, the overall severity would be similar to previous years.
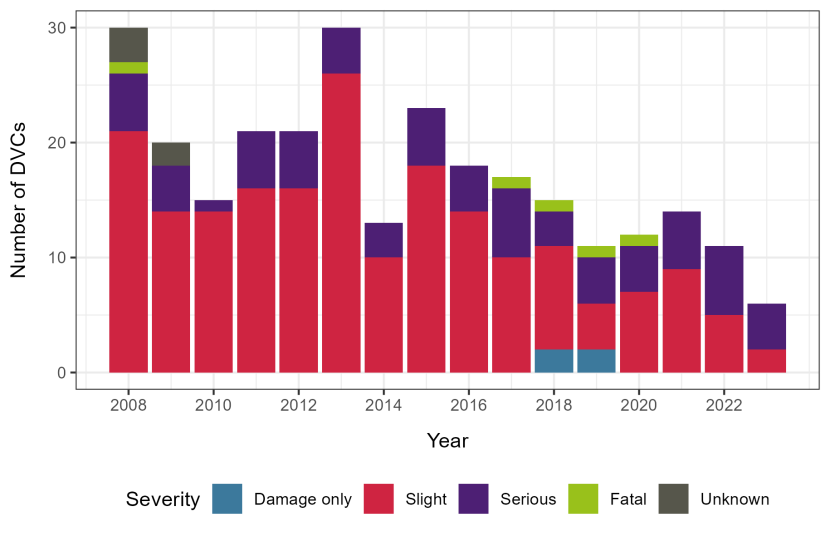
Figure 23. Severity of deer related human personal injury road accidents by year, based only on DVC incidents attended by the police (n = 277).
Click for a full description
Stacked bar chart showing the severity of deer related human personal injury road accidents by year. Only DVC incidents that were attended by the police are included. The y-axis is titled ‘Number of DVCs’ and ranges from zero to 30, labelled at intervals of 10. The x-axis shows years from 2008 to 2023, labelled every two years – STATS19 data for 2024 were not available at the time of writing. A decline in the number of DVCs reported is shown, but no pattern is visible for severity. The data are summarised in the following table.
Severity of deer related human personal injury road accidents in each year.
Year Damage only Fatal Serious Slight Unknown
2008 0 1 5 21 3
2009 0 0 4 14 2
2010 0 0 1 14 0
2011 0 0 5 16 0
2012 0 0 5 16 0
2013 0 0 4 26 0
2014 0 0 3 10 0
2015 0 0 5 18 0
2016 0 0 4 14 0
2017 0 1 6 10 0
2018 2 1 3 9 0
2019 2 1 4 4 0
2020 0 1 4 7 0
2021 0 0 5 9 0
2022 0 0 6 5 0
2023 0 0 4 2 0
An assessment of the 65 CRaSH records of Road Traffic Collisions caused by deer between 1 January 2020 and 15 September 2024, shows that the deer escaped injury in 65% of cases. The fate of the deer was not clear in a further 5% of cases. These findings suggest that the majority of incidents resulting in more serious damage to both the vehicle and its occupants involve drivers either successfully taking evasive action to avoid the deer but having an incident as a consequence, or using the avoidance of deer as a justification for an incident with another cause. For example, in one incident the driver alleged that they swerved to avoid a deer, but subsequently failed a road-side breath test for alcohol. Without an injured/deceased deer or independent corroboration, verification of a deer’s presence may not be possible.
DVC frequency in relation to Time of day and Season
Diurnal patterns of DVC occurrence
Although many DVC records include a time stamp, these often refer to the time of reporting or carcass recovery rather than the incident itself. The data most consistently recording the actual time of collisions are the police incident reports, where times are assumed to accurately reflect the incident. A few other records were also known to have accurate times where the incident had been witnessed.
Analysis of records with reliable time information indicates that the highest frequency of DVCs occurs between 21:00 and midnight (Figure 24). However, during the winter months (December to February), this late-evening peak is less evident, with equally high numbers of incidents spread across the period from 15:00 to 00:00 (Figure 25).
High frequencies of DVCs are also apparent between 18:00 and 21:00 and 00:01 and 03:00 (Figure 24). The early evening peak is most marked in autumn (September to November), whilst the nighttime peak occurs mostly in the spring and summer (March to August).
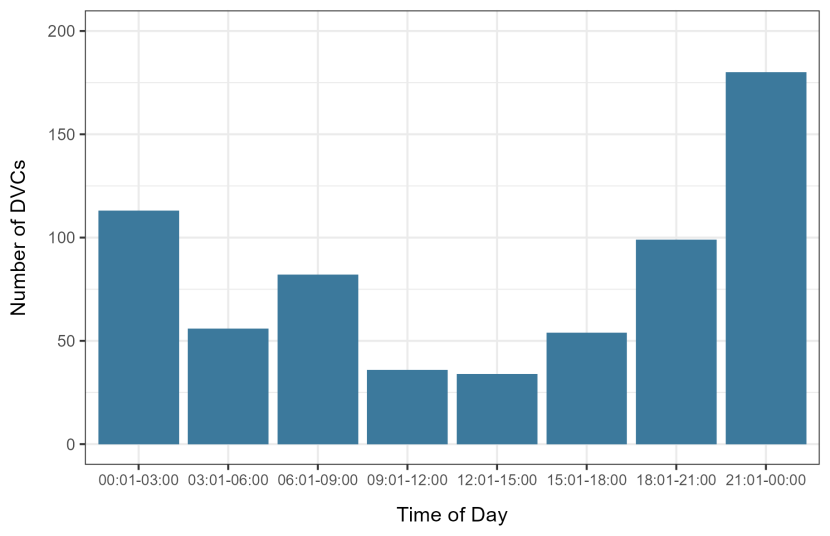
Figure 24. Relative frequency of DVC occurrence in differing daily time periods, based only on DVC incidents where the timestamp was known to reflect the time of the incident (n = 654). Most records included were those attended by the police
Click for a full description
Bar chart showing the number of DVCs reported for different periods in the day. Only DVC incidents where the timestamp was known to be reflect the incident time are included. Most records were attended by the police are included, as these include the most reliable actual incident times, with two other records included where the incident was known to have been witnessed at the recorded time. All qualifying records between 2008 and 2024 are included. The y-axis is titled ‘Number of DVCs’ and ranges from zero to 200, with labels at intervals of 50. The x-axis is titled ‘Time of Day’ and is labelled with eight three-hour periods, starting with 00:01–03:00 and ending with 21:01–00:00. Between 00:01 and 09:00 the number of DVCs is between 56 and 113 in each three-hour period. Between 09:01 and 15:00 the number of DVCs in each three-hour period is lower, at 34 to 36. The numbers of DVCs start to increase in the period 15:01–18:00 (52), through 18:01–21:00 (99) to a peak between 21:01–00:00 (180). The data are summarised in the following table.
Number of DVC reports from different daily time periods, based on records where the timestamp was known to reflect the time of the incident.
Time of day Number of DVCs
00:01–03:00 113
03:01–06:00 56
06:01–09:00 82
09:01–12:00 36
12:01–15:00 34
15:01–18:00 54
18:01–21:00 99
21:01–00:00 180
Total 654
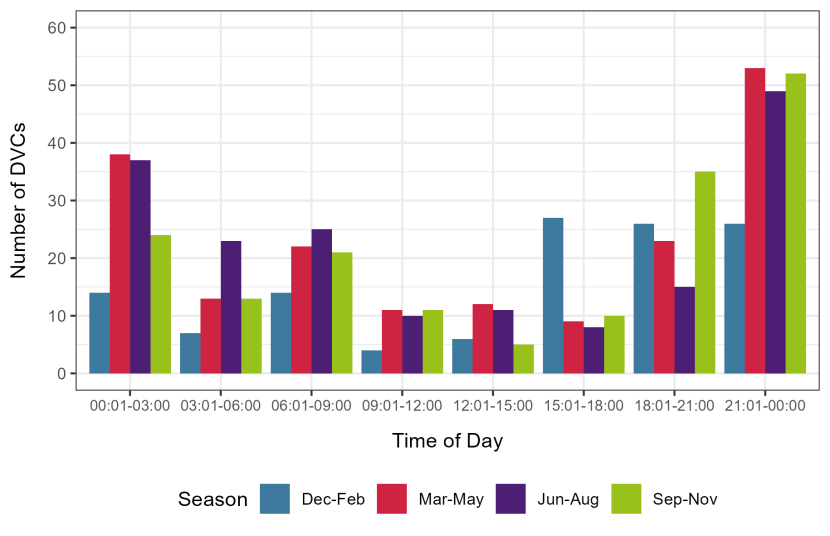
Figure 25. Relative frequency of DVC occurrence in differing daily time periods in differing seasons, based only on DVC incidents where the timestamp was known to reflect the time of the incident (n = 654).
Click for a full description
Most records included were those attended by the police and hence with the most reliable actual incident times. Bar chart showing the number of DVCs reported in each season for different periods in the day. Most records included were attended by the police, as these include the most reliable actual incident times, with two other records included where the incident was known to have been witnessed at the recorded time. All qualifying records between 2008 and 2024 are included. The y-axis is titled ‘Number of DVCs’ and ranges from zero to 60, with labels at intervals of 10. The x-axis is titled ‘time of day’ and is labelled with eight three-hour periods, starting with 00:01–03:00 and ending with 21:01–00:00. Seasons are expressed as four three-month periods: December to February in blue, March to May in red, June to August in purple and September to November in green. Data are summarised in the following table.
Number of DVC reports in differing daily time periods in differing seasons, based on records where the timestamp was known to reflect the time of the incident.
Time of day Dec–Feb Jun–Aug Mar–May Sep–Nov Total
00:01–03:00 14 37 38 24 113
03:01–06:00 7 23 13 13 56
06:01–09:00 14 25 22 21 82
09:01–12:00 4 10 11 11 36
12:01–15:00 6 11 12 5 34
15:01–18:00 27 8 9 10 54
18:01–21:00 26 15 23 35 99
21:01–00:00 26 49 53 52 180
Total 124 178 181 171 654
Seasonal patterns of DVC occurrence by road type and region
As found in the previous studies (Langbein, 2019; Lush and Lush, 2023), seasonal patterns in reported DVC occurrences showed a peak in May to June, regardless of road type (Figure 26).
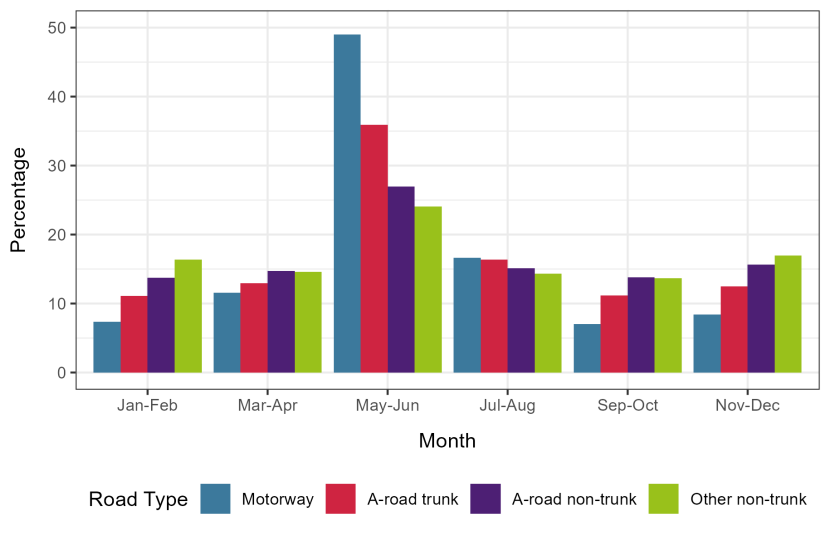
Figure 26. Seasonal pattern of DVCs in Scotland on trunk roads (motorways plus strategic A roads), A-class non-trunk roads and minor roads. Motorway n = 3,441; A-road trunk n = 8,666; A-road non-trunk n = 2,067, Other non-trunk n = 25,061.
Click for a full description
All records between 2008 and 2024 are included, except those identified as possible duplicates. The y-axis shows the percentage of DVCs from each road type that occur in each season and ranges from 0% to 50%, with labels at intervals of 10%. The x-axis is titled ‘Season’ and is labelled with six two-month periods, starting with January to February and ending with November to December. Road types are coloured as: Motorway in blue, A-roads that are part of the trunk road network in red, A roads that are not part of the trunk road network in purple and other non-trunk roads in purple. Data are summarised in the following table.
Percentage of DVC reports from different road types in differing two-month periods, based only on DVC incidents attended by the police.
Season Motorway A-road trunk A-road non-trunk Other non-trunk
Jan–Feb 7.4 11.1 13.7 16.4
Jul–Aug 16.5 16.3 15.1 14.4
Mar–Apr 11.7 13.1 14.9 14.7
May–Jun 48.9 35.9 26.8 24
Nov–Dec 8.4 12.5 15.6 17
Sep–Oct 7.1 11.2 13.8 13.6
Total 100 100 100 100
Police Scotland’s STORM database provides a consistently collected six-year dataset against which seasonal changes may be assessed. This shows a distinct peak in May and roughly equal troughs in September and March (Figure 27). It also shows a significant decline in the May peak over time (Spearman’s, r = -0.81, p < 0.05), whilst figures for the other months remain broadly unchanged and there is no evidence of an annual decline.
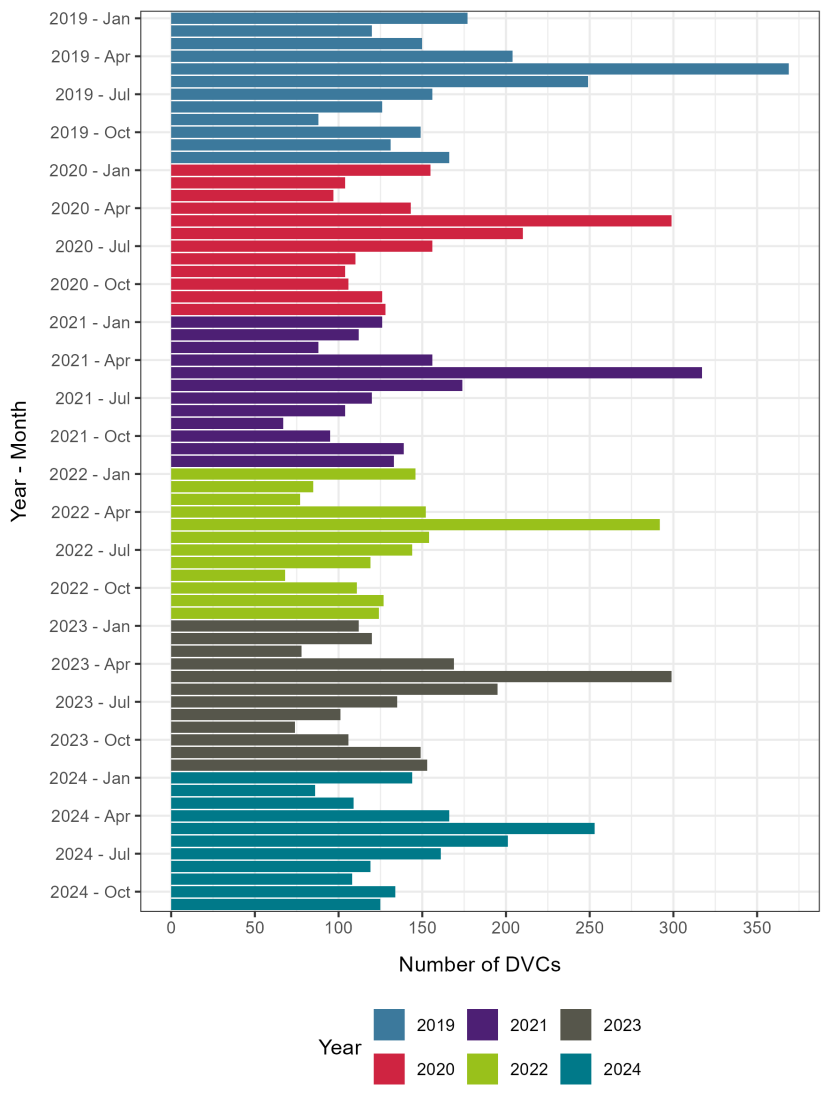
Figure 27. DVCs in Police Scotland’s STORM database per month between 1 January 2019 and 25 November 2024.
Click for a full description
Bar chart showing the numbers of DVC reports per month extracted from Police Scotland’s STORM database between 1 January 2019 and 25 November 2024. Data for November 2024 may therefore be incomplete. The y-axis shows the year and month, covering January 2019 to November 2024. The x-axis is labelled ‘Number of DVCs’ and ranges from zero to 375. Bars are coloured by year:
2019 in blue
2020 in red
2021 in purple
2022 in green
2023 in grey
2024 in cyan
Each year follows a similar pattern, with a peak in DVC reports in May and troughs in September and March, but the peaks have become less pronounced between 2019 and 2024. Data are summarised in the following table:
Number of DVCs per month extracted from Police Scotland’s STORM database between 1 January 2019 and 25 November 2024. Figures for the end of November 2024 may be incomplete.
Month 2019 2020 2021 2022 2023 2024
Jan 177 155 126 146 112 144
Feb 120 104 112 85 120 86
Mar 150 97 88 77 78 109
Apr 204 143 156 152 169 166
May 369 299 317 292 299 253
Jun 249 210 174 154 195 201
Jul 156 156 120 144 135 161
Aug 126 110 104 119 101 119
Sep 88 104 67 68 74 108
Oct 149 106 95 111 106 134
Nov 131 126 139 127 149 125
Dec 166 128 133 124 153 -
Total 2,085 1,738 1,631 1,599 1,691 1,60
The size of the May to June peak varied between the different road types (Figure 28) across all years. It was greatest on motorways, where it accounted for around 50% of all reported DVCs. It was less pronounced on A-roads within the trunk road network (c.36%) and other A-roads (c.28%), and accounted for only about 24% on other non-trunk roads. This suggests a reduction in the May to June peak from major to minor roads.
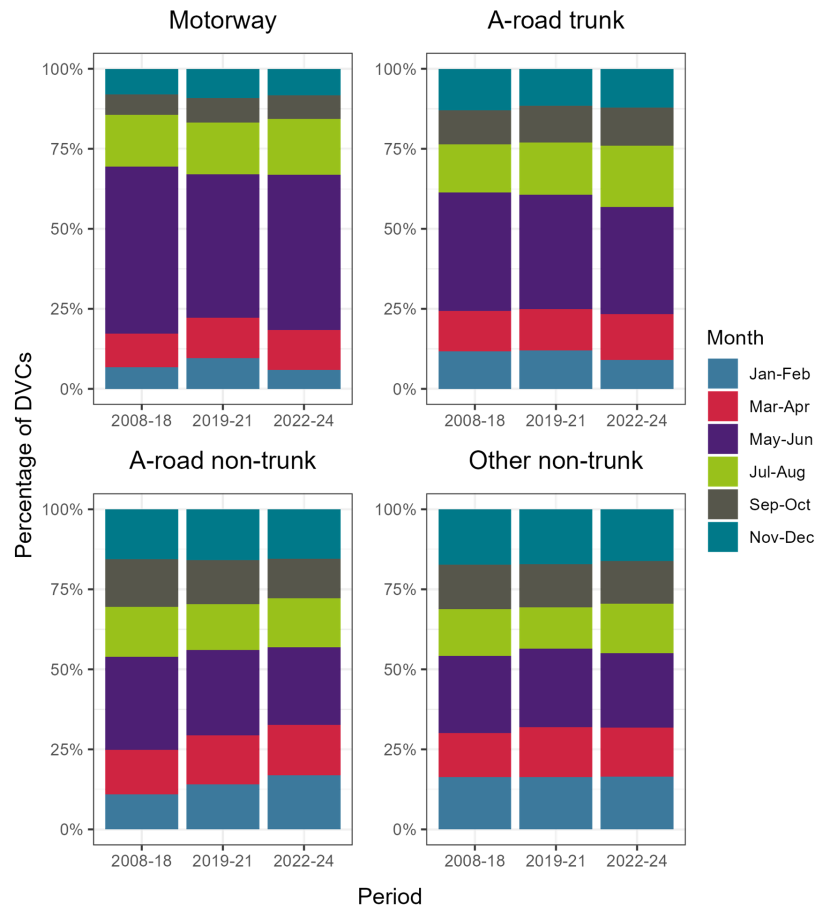
Figure 28. Seasonal pattern of all DVCs in Scotland on trunk roads (motorways plus strategic A roads), A-class non-trunk roads and minor roads. Motorway n = 3,441; A-road trunk n = 8,666; A-road non-trunk n = 2,067, Other non-trunk n = 25,061.
Click for a full description
Four stacked bar charts showing the percentage of all DVCs reported in two-month windows for different road types. All records between 2008 and 2024 are included, except those identified as possible duplicates. DVCs reported from motorways are shown in the top left, A-class trunk roads in the top right, other A-roads in the bottom left and other non-trunk roads in the bottom right. The y-axis on each chart shows the percentage of DVCs from each two-month period for the road type and ranges from 0% to 100%, with labels at intervals of 25%. The x-axis is titled ‘Period’ and is labelled with 2008–2018 (early data), 2019–2021 (last reporting period (Lush and Lush, 2023)) and 2022–2024 (the current period). Months are coloured as: January and February in blue, March and April in red, May and June in purple, July and August in green, September and October in dark grey and November to December in cyan. The charts show that the proportion of DVCs reported in May to June is greatest on motorways and declines as the roads become less major. Data are shown in Tables 15 to 18.
The results are broadly similar to those of the previous studies, but it is worth revisiting the possible trends identified in Lush and Lush (2023):
- The average annual numbers of DVCs reported from motorways was higher in 2019–2024 than 2008–2018. The monthly distribution was flatter in 2019–2021, but in 2022–2024 it was more similar to 2008–2018 (Table 15).
- The average annual numbers of DVCs reported from A-class trunk roads was highest in 2022–2024, closely followed by 2019–2021, and substantially lower in 2008–2018. This was probably due to increased data availability in recent years. The proportions in each period across the entire seventeen-year dataset was fairly consistent in 2008–2021, but the distribution was flatter in 2022–2024 (Table 16).
- The average annual numbers of DVCs reported from non-trunk A-roads was highest in 2019–2021, closely followed by 2021–2024, and substantially lower in 2008–2018. In addition, the proportion reported in May and June was much higher in 2008–2018 and has decreased in 2019–2021 and 2022–2024. The result of this decrease is that the distribution in 2021–2024 was remarkably similar to the distribution seen for other non-trunk roads (Table 17).
- The annual numbers of DVCs reported from other non-trunk roads was also highest in 2019–2021, followed by 2021–2024, and substantially lower in 2008–2018. The proportions in each period across the entire seventeen-year dataset appear to be remarkably consistent, with a much flatter distribution across all periods than other road types (Table 13).
| Period | 2008–2018 | 2019–2021 | 2022–2024 |
|---|---|---|---|
| Jan–Feb | 6.8% | 9.6% | 5.9% |
| Mar–Apr | 10.5% | 12.7% | 12.4% |
| May–Jun | 52.1% | 44.7% | 48.5% |
| Jul–Aug | 16.2% | 16.2% | 17.4% |
| Sep–Oct | 6.4% | 7.7% | 7.4% |
| Nov–Dec | 8% | 9.1% | 8.3% |
| Total | 100% | 100% | 100% |
| Sample size | 1,931 | 1,319 | 1,245 |
| Period | 2008–2018 | 2019–2021 | 2022–2024 |
|---|---|---|---|
| Jan–Feb | 11.7% | 12% | 9.1% |
| Mar–Apr | 12.6% | 12.9% | 14.2% |
| May–Jun | 37% | 35.8% | 33.6% |
| Jul–Aug | 15% | 16.2% | 19% |
| Sep–Oct | 10.6% | 11.6% | 11.9% |
| Nov–Dec | 13% | 11.6% | 12.2% |
| Total | 100% | 100% | 100% |
| Sample size | 5,650 | 2,406 | 2,825 |
| Period | 2008–2018 | 2019–2021 | 2022–2024 |
|---|---|---|---|
| Jan–Feb | 11% | 14.1% | 17% |
| Mar–Apr | 13.9% | 15.3% | 15.7% |
| May–Jun | 29.1% | 26.6% | 24.2% |
| Jul–Aug | 15.5% | 14.4% | 15.3% |
| Sep–Oct | 14.9% | 13.8% | 12.4% |
| Nov–Dec | 15.6% | 15.8% | 15.5% |
| Total | 100% | 100% | 100% |
| Sample size | 1,761 | 1,511 | 1,351 |
| Period | 2008–2018 | 2019–2021 | 2022–2024 |
|---|---|---|---|
| Jan–Feb | 16.4% | 16.4% | 16.4% |
| Mar–Apr | 13.7% | 15.6% | 15.4% |
| May–Jun | 24.1% | 24.5% | 23.2% |
| Jul–Aug | 14.7% | 13% | 15.5% |
| Sep–Oct | 13.9% | 13.4% | 13.3% |
| Nov–Dec | 17.3% | 17.2% | 16.2% |
| Total | 100% | 100% | 100% |
| Sample size | 8,156 | 5,800 | 5,280 |
DVCs on Lewis and Harris
Records made by the Lewis and Harris Deer Management Group in 2023 and 2024 show a peak of DVCs between September and December (Figure 29). The peak in 2024 appears to be about two months earlier, though no data were available for December 2024 and any trend is unclear. Almost twice the number of DVCs had been recorded in 2024 compared to 2023, though this was thought to be due to better surveillance in 2024 (Mark Jamieson pers. comm.).
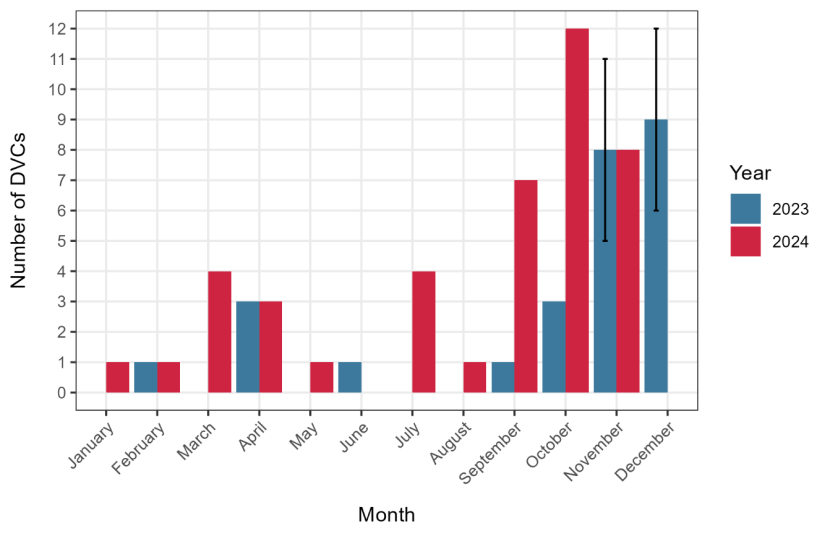
Figure 29 Number of DVCs recorded on Lewis and Harris per month in 2023 and 2024 (n = 68) Six DVCs in November and December 2023 but not assigned a month have been split evenly between those months with error bars showing the possible max and min values.
Click for a full description
Grouped bar chart showing the number of DVCs recorded on Lewis and Harris in each month of 2023 and 2024. The y-axis is titled ‘Number of DVCs’ and ranges from zero to 12, with labels at each whole number. The x-axis is titled ‘Month’ and shows the months from January to December. Data for 2023 and 2024 are shown separately for each month: 2023 in blue, 2024 in red. Data for December 2024 were not available at the time of writing. Data are summarised in the following table.
Number of DVCs recorded on Lewis and Harris in 2023 and 2024.
Month 2023 2024
January 0 1
February 1 1
March 0 4
April 3 3
May 0 1
June 1 0
July 0 4
August 0 1
September 1 7
October 3 12
November 5 8
December 6 No data
November/December 6 N/A
Total 26 42
DVC reports with reliable detail of deer species
As noted by Langbein (2019), the accuracy of deer species identification in the submitted datasets is variable, with only a proportion considered sufficiently reliable for analysis. For records prior to 2019, only those deemed reliable by Jochen Langbein were included in this study. Since 2019, the dataset has been supplemented with verified contributions from the Mammal Society’s Mammal Mapper app, the British Deer Society app, Forestry and Land Scotland, NatureScot, selected animal rescue organisations, validated records from the NBN Atlas, and research-grade records from iNaturalist. In total, these sources accounted for approximately 4.3% of all available records.
Analysis of incidents where species identification was regarded as reliable indicates that roe deer were the species most frequently involved, followed by red deer, with smaller numbers of sika and fallow deer (Table 19). The highest numbers of incidents involving roe, red and sika deer were all recorded in Highland. Red deer outnumbered roe deer only in Highland and North Ayrshire, while incidents involving fallow deer were most frequently reported from Dumfries and Galloway.
| Unitary Authority | Roe | Red | Sika | Fallow | Total |
|---|---|---|---|---|---|
| Highland | 247 | 310 | 33 | 0 | 590 |
| Argyll and Bute | 212 | 151 | 13 | 0 | 376 |
| Aberdeenshire | 200 | 3 | 0 | 0 | 203 |
| Dumfries and Galloway | 164 | 4 | 0 | 15 | 183 |
| Moray | 89 | 1 | 0 | 0 | 90 |
| Stirling | 68 | 15 | 0 | 0 | 83 |
| Perth and Kinross | 28 | 4 | 0 | 6 | 38 |
| North Ayrshire | 7 | 20 | 0 | 0 | 27 |
| Fife | 23 | 0 | 1 | 0 | 24 |
| Scottish Borders | 21 | 0 | 1 | 1 | 23 |
| North Lanarkshire | 15 | 0 | 0 | 0 | 15 |
| South Lanarkshire | 14 | 0 | 0 | 0 | 14 |
| Angus | 9 | 1 | 0 | 0 | 10 |
| Aberdeen City | 8 | 0 | 0 | 0 | 8 |
| East Ayrshire | 8 | 0 | 0 | 0 | 8 |
| West Lothian | 8 | 0 | 0 | 0 | 8 |
| South Ayrshire | 6 | 0 | 0 | 0 | 6 |
| East Lothian | 3 | 0 | 0 | 1 | 4 |
| Falkirk | 3 | 0 | 0 | 0 | 3 |
| Renfrewshire | 3 | 0 | 0 | 0 | 3 |
| City of Edinburgh | 2 | 0 | 0 | 0 | 2 |
| Glasgow City | 2 | 0 | 0 | 0 | 2 |
| Inverclyde | 2 | 0 | 0 | 0 | 2 |
| Midlothian | 2 | 0 | 0 | 0 | 2 |
| Clackmannanshire | 1 | 0 | 0 | 0 | 1 |
| East Renfrewshire | 1 | 0 | 0 | 0 | 1 |
| West Dunbartonshire | 0 | 0 | 1 | 0 | 1 |
| Unknown | 24 | 0 | 0 | 0 | 24 |
| Total | 1,170 | 509 | 49 | 23 | 1,751 |
Of the records where identification was considered reliable where the sex or age had also been recorded, there were too few records of fallow and sika deer to suggest any trends or bias (Figure 30). Both red and roe deer had more records of adults than juveniles. Whilst red deer showed declining numbers but no clear sex bias overall, female roe deer were significantly more likely to be recorded than males (GLMM, β = -0.33, p < 0.001).
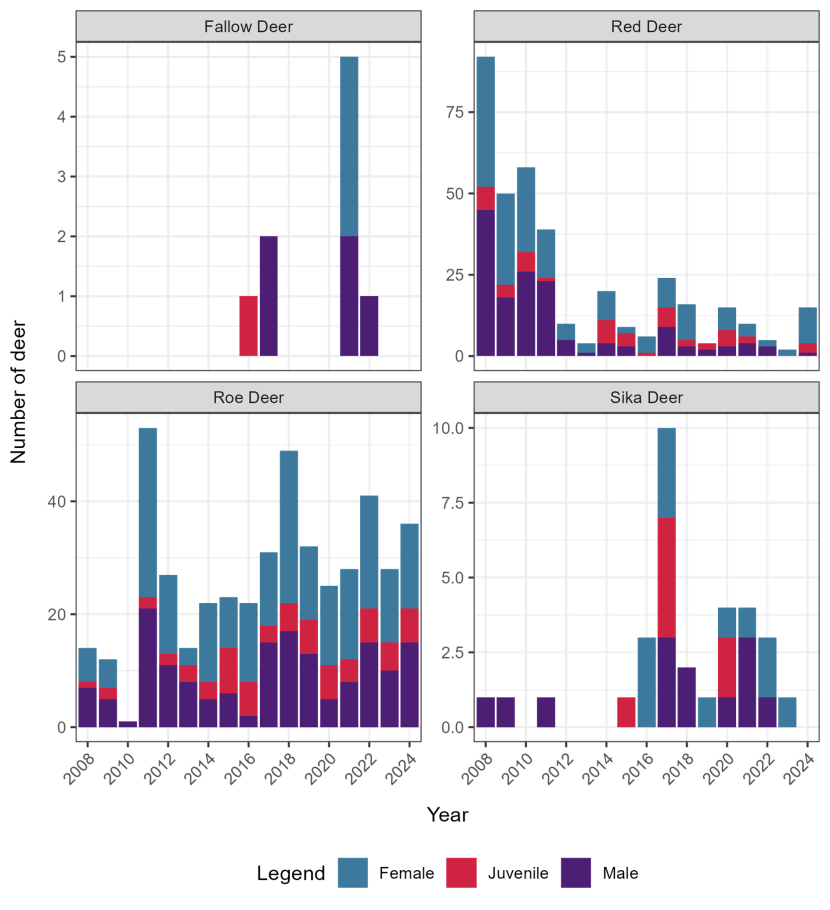
Figure 30. Numbers of DVC records from ‘deer-knowledgeable contributors’ recorded as male, female or juvenile in each year from 2008 to 2024. Only records assigned to deer species are shown.
Click for a full description
Four stacked bar charts showing the number of DVC records from ‘deer-knowledgeable contributors’ recorded as male, female or juvenile per year. The y-axis is titled ‘Year’ and ranges from 2008 to 2024, with labels every other year. The x-axis is titled ‘Number of deer’ and has the following ranges: zero to five for fallow deer, zero to 95 for red deer, zero to 55 for roe deer and zero to 10 for sika deer. Females are shown in blue, males in purple and juveniles in red. There are only a few records of fallow deer (top left), so no clear trend is apparent. Red deer (top right) show an overall decline in the number of records assigned to sex or age and higher numbers of adults, but no clear bias towards males or females. Roe deer (bottom left) show higher overall numbers since 2011, with clear biases to adults and indications of a bias towards females. Sika deer (bottom right) show overall low numbers except in 2017, with no obvious trends.
Wildlife Vehicle Collisions including non-deer species
There is a clear increase in the number of Wildlife Vehicle Collisions (WVCs) in the DVC database that did not involve deer between 2008 and 2024 (Table 20), but this is because data for earlier years is less complete. Data for 2022–2024, when most efforts were made to collate data on WVCs not including deer, are also known to be patchy and incomplete.
Badgers were the most frequently implicated animal after deer, amounting to 1,540 records over the full period. There was also evidence of the impact of cars on rare and endangered species, especially otters, but also pine marten and red squirrel. Most if not all records of cats are likely to be domesticated or feral animals rather than true Scottish wildcats, and are the most frequently recorded of several domesticated animals on the list.
Whilst larger animals are more likely to be recorded, rats are surprisingly frequently recorded. It is likely that these mostly occurred on minor roads, as they are unlikely to be spotted on trunk roads and few TROCs provide such records.
| Animal | 2008–2018 | 2019–2021 | 2022–2024 | Total |
|---|---|---|---|---|
| Deer | 16,211 | 10,907 | 10,406 | 37,524 |
| Eurasian badger | 210 | 465 | 865 | 1,540 |
| Red fox | 209 | 462 | 574 | 1,245 |
| Roe deer | 790 | 91 | 265 | 1,146 |
| Red deer | 450 | 23 | 22 | 495 |
| Cat | 5 | 23 | 118 | 146 |
| Eurasian otter | 5 | 55 | 47 | 107 |
| Rat | 32 | 11 | 19 | 62 |
| Sika deer | 33 | 8 | 6 | 47 |
| Dog | 10 | 18 | 16 | 44 |
| Pheasant | - | 4 | 33 | 37 |
| Swan | 1 | 5 | 26 | 32 |
| Squirrel | 17 | 3 | 10 | 30 |
| Fallow deer | 14 | 7 | 1 | 22 |
| European rabbit | - | - | 15 | 15 |
| Pine marten | - | 4 | 10 | 14 |
| Hare | 1 | 2 | 9 | 12 |
| Bird | - | - | 11 | 11 |
| Gull | - | 1 | 8 | 9 |
| Sheep | - | 1 | 8 | 9 |
| Buzzard | - | 1 | 6 | 7 |
| West European hedgehog | 1 | 4 | 1 | 6 |
| American mink | - | 3 | 3 | 6 |
| Feral pig | - | 1 | 5 | 6 |
| Grey heron | - | 1 | 4 | 5 |
| Owl | - | 2 | 3 | 5 |
| Raptor | - | 3 | 2 | 5 |
| Eurasian red squirrel | 1 | - | 3 | 4 |
| Common slowworm | - | 1 | 3 | 4 |
| European toad | - | 1 | 3 | 4 |
| Adder | - | 1 | 2 | 3 |
| British stoat | - | 1 | 1 | 2 |
| Eastern grey squirrel | - | 1 | 1 | 2 |
| Cattle | - | - | 2 | 2 |
| Common shrew | - | - | 2 | 2 |
| Goose | - | - | 2 | 2 |
| Great black-backed gull | - | - | 2 | 2 |
| Horse | 1 | - | - | 1 |
| Beaver | - | 1 | - | 1 |
| Common crossbill | - | 1 | - | 1 |
| Duck | - | 1 | - | 1 |
| Barn owl | - | - | 1 | 1 |
| Brown rat | - | - | 1 | 1 |
| Common swift | - | - | 1 | 1 |
| Eurasian woodcock | - | - | 1 | 1 |
| European common frog | - | - | 1 | 1 |
| European mole | - | - | 1 | 1 |
| European wood mouse | - | - | 1 | 1 |
| Unknown | - | 11 | 128 | 139 |
| Total | 17,991 | 12,124 | 12,649 | 42,764 |
DVC risk based on recent incidents
Lush and Lush (2023) developed an approach to identifying DVC hotspots along the trunk road network. DVCs were repositioned on the trunk road where they were within 500 m of that trunk road, in stages:
- Where the section code associated with the DVC matched a section code in the most recent available trunk road dataset the DVC was repositioned on the closest point on that trunk road section.
- Where the road number (e.g. A9) associated with the DVC matched the road number in the most recent available trunk road dataset the DVC was repositioned on the closest point on that road.
- All other DVCs were repositioned on the closest point on the trunk road network.
Repositioned DVCs were also duplicated on nearby trunk road sections where they were within 50 m, meaning that individual DVCs could be represented on multiple trunk roads. The DVCs in the last three years associated with a moving window of 500 m length along each trunk road section were counted, with the window moving 10 m along the section after each count. Short trunk road sections were treated as single lengths, down to a minimum of 50 m.
Non-overlapping trunk road lengths with the highest number of DVCs were selected. The number of DVCs per km per year and normalised DVC risk index (Figure 31) were calculated for each length.
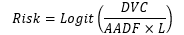
Figure 31. Equation for the normalised DVC risk index (Langbein, 2019).
Click for a full description
Equation used for the calculation of normalised DVC risk index, following Langbein (2019). DVC is the average annual number of DVCs related to the trunk road section or shorter road length, AADF is the Average Annual Daily Flow of traffic for the trunk road section and L is the length of the road in kilometres. The average annual number of DVCs related to a full or part trunk road section is divided by the product of the Average Annual Daily Flow of traffic (AADF) for the trunk road section and the length of the road in kilometres. The results are normalised from zero to one using a logit function, i.e. the log of the result divided by one minus itself. AADF data is collected by the Department of Transport.
A PostgreSQL function was developed to apply the methodology, allowing it to be rapidly repeated using different parameters. Whilst this function had been enhanced during this contract, the basic approach remained unchanged.
This approach was repeated for DVCs from 2022–2024. Including more years of data was rejected due to suspected positional bias in the data before 2022, whilst the data included appeared to contain limited bias (Annex 2: Accuracy of incident locations). Note that the results are not directly comparable with previous results, due to differences in the data sources used and the way that the normalised risk index is calculated.
DVC hotspots were calculated using a minimum of two DVCs per length of trunk road and zero DVCs per length of trunk road. Due to the way that it is calculated, these produce different normalised DVC risk index results. A minimum of two DVCs per length of trunk road is most useful for identifying hotspots, whilst using zero DVCs produces a dataset with near complete coverage – small gaps between lengths with high normalised DVC risk index values are not filled. The former are considered here, whilst the latter data were used in Predicting DVC risk using environmental data.
The results of the risk analysis for 2022–2024 are shown in Figures 32 to 38. These show that hotpots remain densest in the central belt, as in 2018–2021 (Lush and Lush, 2023).
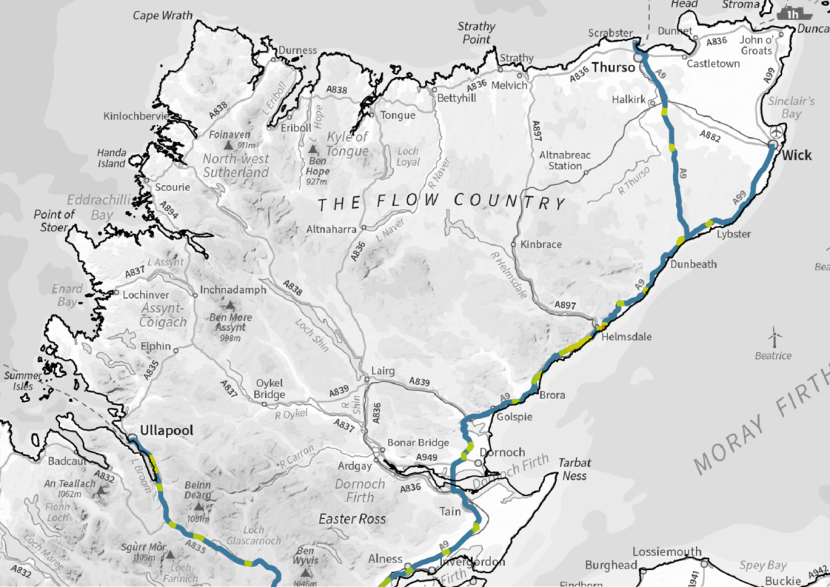
Figure 32. DVC hotspots in North Highland, based on analysis of 2022–2024 data, mapped according to the normalised DVC risk index. © Crown copyright (and database rights) 2025.
Click for a full description
Map of Highland north of a line from the Cromarty Firth to Loch Maree. The trunk road network is shown, coloured according to the normalised DVC risk index. The index was calculated on 50–500 m stretches of trunk road with a minimum of two DVCs in 2022–2024. Colours are as follows:
Blue indicates no or very low risk and includes trunk road lengths with fewer than two DVCs.
Green indicates low risk.
Yellow indicates medium risk.
Orange indicates high risk.
Red indicates very high risk.
See text and Lush and Lush (2023) for the method applied.
The map shows roads in mostly blue, green and yellow, though the Navidale Roundabout on the A9 near Helmsdale is highlighted in orange.
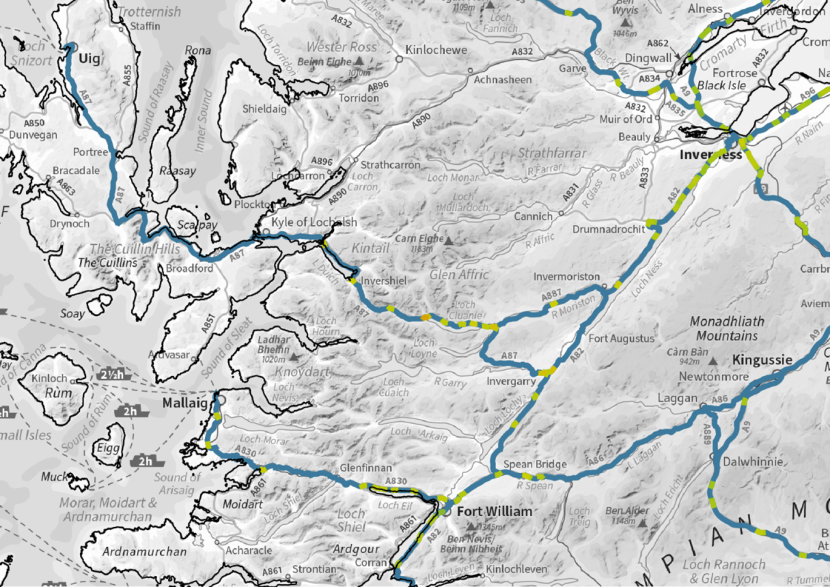
Figure 33. DVC hotspots in West Highland, based on analysis of 2022–2024 data, mapped according to the normalised DVC risk index. © Crown copyright (and database rights) 2025.
Click for a full description
Map of Highland between Ardnamurchan in the south west and the Cormarty Firth in the north east. The trunk road network is shown, coloured according to the normalised DVC risk index. The index was calculated on 50–500 m stretches of trunk road with a minimum of two DVCs in 2022–2024. Colours are as follows:
Blue indicates no or very low risk and includes trunk road lengths with fewer than two DVCs.
Green indicates low risk.
Yellow indicates medium risk.
Orange indicates high risk.
Red indicates very high risk.
See text and Lush and Lush (2023) for the method applied.
The map shows roads in mostly blue, green and yellow, though the road through Glen Moriston on the A87 is highlighted in orange.
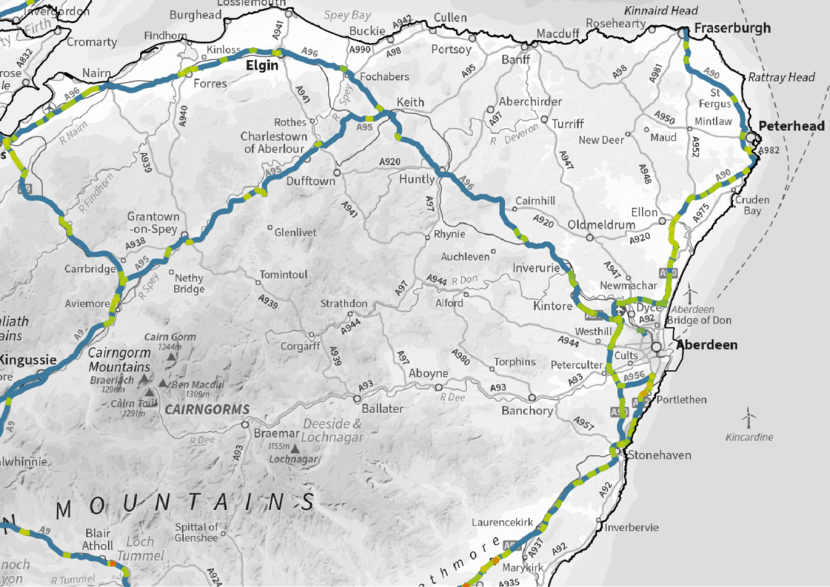
Figure 34. DVC hotspots in north east Scotland, based on analysis of 2022–2024 data, mapped according to the normalised DVC risk index. © Crown copyright (and database rights) 2025.
Click for a full description
Map of north east Scotland between Blair Atholl in the south west and the north east coast of Aberdeenshire in the north east. The trunk road network is shown, coloured according to the normalised DVC risk index. The index was calculated on 50–500 m stretches of trunk road with a minimum of two DVCs in 2022–2024. Colours are as follows:
Blue indicates no or very low risk and includes trunk road lengths with fewer than two DVCs.
Green indicates low risk.
Yellow indicates medium risk.
Orange indicates high risk.
Red indicates very high risk.
See text and Lush and Lush (2023) for the method applied.
The map shows roads in mostly blue, green and yellow, but there are several orange sections on the A90 near Brechlin, at the Portlethen junction on the A92 and at the Blair Atholl junction on the A9.
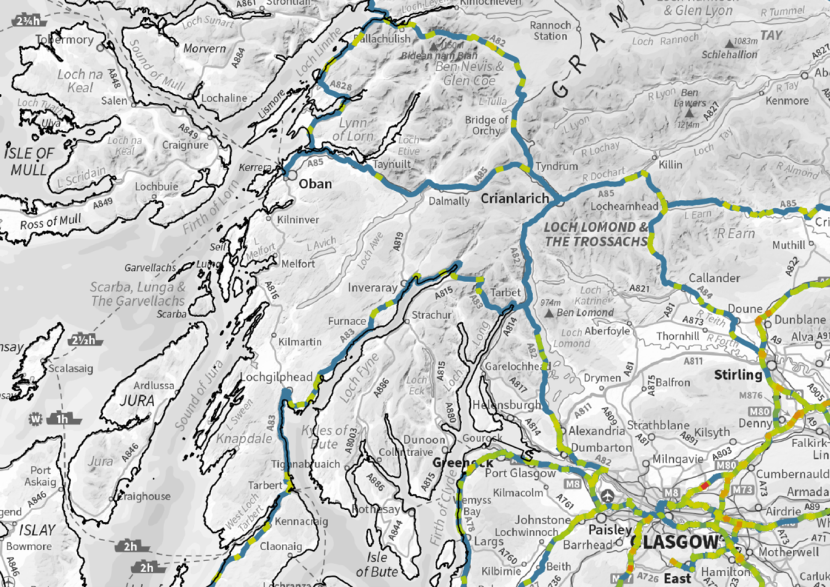
Figure 35. DVC hotspots in west central Scotland, based on analysis of 2022–2024 data, mapped according to the normalised DVC risk index. © Crown copyright (and database rights) 2025.
Click for a full description
Map of west central Scotland from Islay in the south west to Aberfeldy in the north east. The trunk road network is shown, coloured according to the normalised DVC risk index. The index was calculated on 50–500 m stretches of trunk road with a minimum of two DVCs in 2022–2024. Colours are as follows:
Blue indicates no or very low risk and includes trunk road lengths with fewer than two DVCs.
Green indicates low risk.
Yellow indicates medium risk.
Orange indicates high risk.
Red indicates very high risk.
See text and Lush and Lush (2023) for the method applied.
The northwestern three quarters of the map shows roads in blue, green and yellow. Numerous orange roads occur around Glasgow and Stirling, with a red road length at the Hornhill Interchange on the M80.
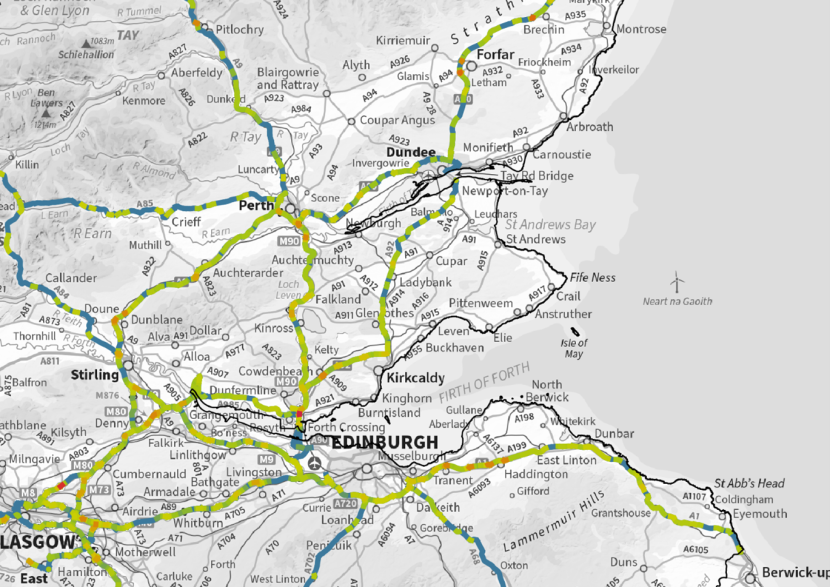
Figure 36. DVC hotspots in east central Scotland, based on analysis of 2022–2024 data, mapped according to the normalised DVC risk index. © Crown copyright (and database rights) 2025.
Click for a full description
Map of east central Scotland from East Kilbride in the south west to Montrose in the north east, extending east to Berwick-upon-Tweed. The trunk road network is shown, coloured according to the normalised DVC risk index. The index was calculated on 50–500 m stretches of trunk road with a minimum of two DVCs in 2022–2024. Colours are as follows:
Blue indicates no or very low risk and includes trunk road lengths with fewer than two DVCs.
Green indicates low risk.
Yellow indicates medium risk.
Orange indicates high risk.
Red indicates very high risk.
See text and Lush and Lush (2023) for the method applied.
The map shows roads in mostly blue, green and yellow, but with orange scattered on most roads. The southbound exit from the M90 onto the A985 is shown in red, in addition to the Hornhill Interchange shown on Figure 35.
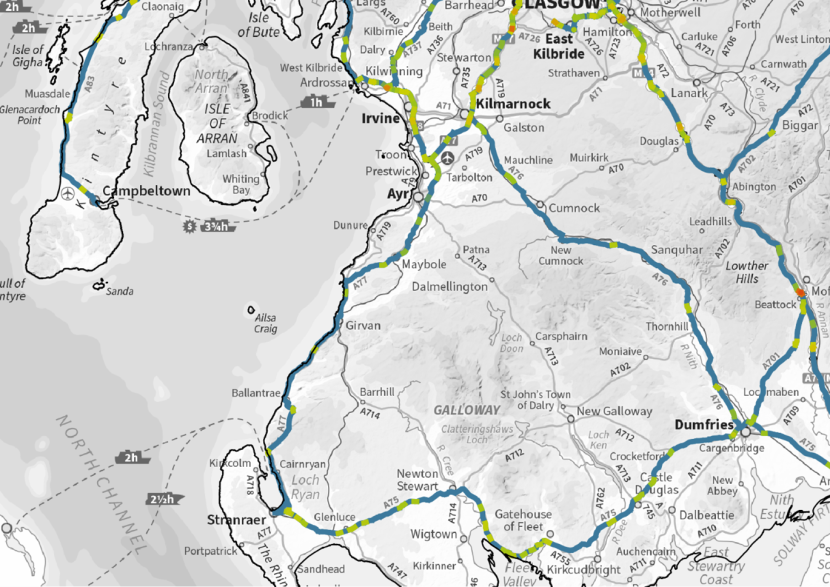
Figure 37. DVC hotspots in south west Scotland, based on analysis of 2022–2024 data, mapped according to the normalised DVC risk index. © Crown copyright (and database rights) 2025.
Click for a full description
Map of south west Scotland from Kirkcudbright in the south, Mull of Kintyre in the west and Forth in the north east. The trunk road network is shown, coloured according to the normalised DVC risk index. The index was calculated on 50–500 m stretches of trunk road with a minimum of two DVCs in 2022–2024. Colours are as follows:
Blue indicates no or very low risk and includes trunk road lengths with fewer than two DVCs.
Green indicates low risk.
Yellow indicates medium risk.
Orange indicates high risk.
Red indicates very high risk.
See text and Lush and Lush (2023) for the method applied.
The map shows roads in mostly blue, green and yellow, though there are several orange lengths on the A78 near Irvine and the M77/A77 between Kilmarnock and Glasgow, and one on the B7078 slip road on the M74. The Moffat junction on the M74 is shown in dark orange.
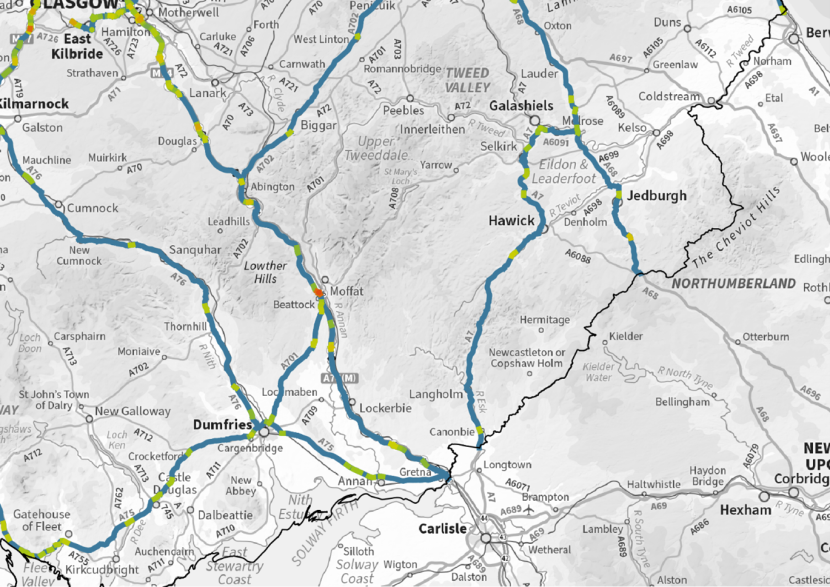
Figure 38. DVC hotspots in south east Scotland, based on analysis of 2022–2024 data, mapped according to the normalised DVC risk index. © Crown copyright (and database rights) 2025.
Click for a full description
Map of south east Scotland from Kirkcudbright in the south west to Berwick-upon-Tweed in the north east. The trunk road network is shown, coloured according to the normalised DVC risk index. The index was calculated on 50–500 m stretches of trunk road with a minimum of two DVCs in 2022–2024. Colours are as follows:
Blue indicates no or very low risk and includes trunk road lengths with fewer than two DVCs.
Green indicates low risk.
Yellow indicates medium risk.
Orange indicates high risk.
Red indicates very high risk.
See text and Lush and Lush (2023) for the method applied.
The map shows roads in mostly blue, green and yellow, with parts of the M74 and M77 in orange (see Figure 37). Part of the A68 south of Jedburgh is also shown in orange.
The top 20 DVC hotspots for all road lengths between 50 m and 500 m includes several on each of the A1, A9 and A90 (Table 21). However, none of the identified top 20 hotspots relate to 500 m road lengths, which suggests bias towards shorter road sections having highest calculated DVC risk. It is therefore also appropriate to consider only those hotspots that relate to 500 m road lengths, which additionally identifies several each on the A87, M876 and M90 (Table 22). Combining the roads in the two tables suggests that the M90 has the largest number of DVC hotspots (seven), followed by the A1 and M876 (four each), and the A87, A9 and A90 (three each). Section 14402/95 on the M876 includes two separate hotspots that appear in the top twenty road hotspots that relate to 500 m road lengths.
| Road | Section Code | Length (m) | DVC/km/year | Risk index |
|---|---|---|---|---|
| A1 | 10147/95 | 427 | 5.46 | 0.63 |
| A1 | 10156/11 | 260 | 5.12 | 0.65 |
| A1 | 10163/11 | 192 | 10.4 | 0.64 |
| A701 | 13115/90 | 189 | 54.55 | 0.69 |
| A701 | 13115/95 | 109 | 61.18 | 0.75 |
| A725 | 15045/67 | 123 | 10.87 | 0.64 |
| A77 | 11681/90 | 167 | 7.99 | 0.66 |
| A78 | 14060/10 | 203 | 9.87 | 0.63 |
| A8 | 11365/19 | 267 | 12.5 | 0.63 |
| A9 | 10408/08 | 375 | 10.66 | 0.64 |
| A9 | 10408/13 | 74 | 9.05 | 0.63 |
| A9 | 10440/26 | 93 | 10.72 | 0.67 |
| A90 | 12233/20 | 65 | 10.22 | 0.66 |
| A90 | 12240/01 | 62 | 10.77 | 0.65 |
| A90 | 12240/02 | 70 | 9.49 | 0.66 |
| A92 | 14806/07 | 333 | 13.02 | 0.62 |
| M74 | 10750/94 | 389 | 17.16 | 0.67 |
| M74 | 10755/08 | 428 | 14.8 | 0.65 |
| M80 | 11820/12 | 426 | 2.35 | 0.88 |
| M90 | 15505/54 | 175 | 7.63 | 1 |
| Road | Section Code | Length (m) | DVC/km/year | Risk index |
|---|---|---|---|---|
| A1 | 10169/11 | 500 | 4.67 | 0.51 |
| A68 | 13003/29 | 500 | 2.67 | 0.51 |
| A82 | 10861/25 | 500 | 7.33 | 0.54 |
| A87 | 17400/00 | 500 | 4 | 0.52 |
| A87 | 17404/00 | 500 | 4.67 | 0.53 |
| A87 | 17404/45 | 500 | 7.33 | 0.58 |
| M73 | 18320/31 | 500 | 6 | 0.53 |
| M8 | 11310/93 | 500 | 8.67 | 0.56 |
| M876 | 14402/95 | 500 | 9.33 | 0.6 |
| M876 | 14402/95 | 500 | 4 | 0.52 |
| M876 | 14402/96 | 500 | 4 | 0.52 |
| M876 | 14408/40 | 500 | 4.67 | 0.6 |
| M9 | 10350/90 | 500 | 5.33 | 0.58 |
| M9 | 10360/85 | 500 | 5.33 | 0.53 |
| M90 | 15505/65 | 500 | 8 | 0.59 |
| M90 | 15527/21 | 500 | 4 | 0.55 |
| M90 | 15535/48 | 500 | 4.67 | 0.53 |
| M90 | 15540/10 | 500 | 4 | 0.53 |
| M90 | 15540/50 | 500 | 4 | 0.54 |
| M90 | 16005/00 | 500 | 4.67 | 0.54 |
Several roads were flagged as DVC hotspots in both 2018–2021 and 2022–2024, in several cases with the same link section (Table 23). Most of these had been considered questionable due to positional bias of DVCs along the trunk roads. It appears that previous concerns were therefore unfounded and these road links are of concern.
| Hotspot type | Road | Link no | 2018–2021 | 2022–2024 |
|---|---|---|---|---|
| 50–500 m | A1 | 10156 | 10156/15 | 10156/11 |
| 50–500 m | A1 | 10163 | 10163/10 10163/11 10163/16 | 10163/11 |
| 50–500 m | A77 | 11681 | 11681/90 | 11681/90 |
| 50–500 m | A9 | 10408 | 10408/08 | 10408/08 10408/13 |
| 500 m | M8 | 11310 | 11310/93 | 11310/93 |
| 500 m | M876 | 14402 | 14402/96 | 14402/95 14402/96 |
| 500 m | M9 | 10350 | 10350/90 | 10350/90 |
| 500 m | M9 | 10360 | 10360/85 10360/91 | 10360/85 |
| 50–500 m | M90 | 15505 | 15505/65 | 15505/54 |
| 500 m | M90 | 15505 | 15505/65 | 15505/65 |
| 500 m | M90 | 15535 | 15535/12 15535/13 15535/14 | 15535/48 |
As in Lush and Lush (2023), the 40 hotspots listed in Tables 21 and 22 were manually assessed. This assessment prioritised hotspots with the highest normalised risk index with high numbers of implicated and reliably located DVCs, longer lengths of road, and clusters of hotspots. This resulted in a shortlist of the ten locations with the highest risk of DVCs, based on reliably positioned DVC records (Table 24). 38% of shortlisted hotspots included 500 m parts of longer road sections.
| Road | Location | Section Code(s) | Description |
|---|---|---|---|
| A1 | Oak Tree Junction | 10156/05 10156/06 10156/10 10156/11 10156/15 10156/16 10156/20 (eastern part) 10153/11 (western part) | Junction in urban fringe. Small, wooded islands cut off by roads and a railway. |
| A1 | Bankton Junction | 10163/07 10163/08 10163/10 10163/11 10163/15 10163/16 10163/29 (eastern part) | Urban junction. Wooded islands cut off by roads with other woodland in the vicinity. |
| A1 | Abbotsview Junction | 10147/90 (western part) 10147/91 (western part) 10147/95 10147/96 10153/10 (eastern part) 10153/11 (eastern part) 10153/15 10153/16 | Junction in urban fringe. Small, wooded islands cut off by roads. |
| A725/M8 | J7A Shawhead Junction | 11363/72 11363/80 11363/85 11363/90 11365/01 (eastern part) 11365/90 (eastern part) 15045/60 15045/62 15045/64 15045/67 15045/73 15045/75 15045/79 15045/91 (northern part) | Urban junction. Grassland and scattered woodland between the M8 and A8, plus large patches of woodland in the vicinity. |
| A9 | Dunblane West Junction | 10408/08 10403/85 10403/86 10403/90 10403/91 10408/05 10408/06 10408/09 | Junction in urban fringe. Small, wooded islands cut off by roads and other small woodland in the vicinity. |
| A92 | Cowdenbeath Junction | 14804/91 14804/93 14804/96 14804/98 14806/05 14806/06 14806/07 14806/08 | Junction in urban fringe. Small, wooded islands cut off by roads and a large woodland to the south. |
| M80 | J3 Hornshill Interchange | 11805/88 (eastern part) 11805/91 (eastern part) 11805/96 11805/98 11820/05 (western part) 11820/06 (western part) 11820/11 11820/12 | Rural junction. Developing woodland on islands cut off by roads, and mature woodland in the vicinity. |
| M876 | J2 Glenbervie Interchange | 14402/07 (northern part) 14402/08 (northern part) 14402/95 14402/96 | Junction in urban fringe. Large, wooded island cut off by roads and numerous other woodlands in the vicinity. |
| M90 | J2 Masterton Junction | 14636/00 15502/26 15505/01 15505/02 15505/03 15505/04 15505/07 15505/08 15505/09 15505/15 15505/54 | Urban junction. Adjacent woodland on both side of the junction. |
| M90 | M90 J10 Craigend Interchange | 12005/00 12005/05 12005/10 12005/27 15535/81 15535/82 15535/83 15535/88 15535/89 15535/90 15535/91 15540/00 15540/05 15540/10 15540/50 | Junction in urban fringe. Wooded islands cut off by roads and other woodlands in the vicinity. |
The locations of the combined top 10 DVC hotspots are shown in Annex 3: Maps of DVC hotspots for 2022–2024.
Predicting DVC risk using environmental data
Heckels (2018) used several models to investigate the relationship between DVCs and a range of road characteristics and environmental factors. They used the original point-based Scottish DVC records for 2009–2016 and unmodified trunk road sections, which are highly variable in length. They found that a generalised additive model performed best and explained 36–37% of the variability in the data, but had poor predictive ability.
The availability of DVC count data related to standardised lengths of trunk roads (DVC risk based on recent incidents) presented an opportunity to develop new statistical models. The focus was to investigate the factors related to the spatial distribution of DVCs and did not consider temporal variation.
The review by Putman and Langbein (2024) identified several factors that could be used to explain the incidence of DVCs. The variables used in this analysis were:
- The number of DVCs along non-overlapping lengths of road, including zero DVCs.
- The length of road considered. Because of the algorithm used, these ranged from 50–500 m and were strongly biased towards 500 m.
- Estimated Annual Average Daily Flow (AADF) data for each road length. These were based on the sum of individual counts for different vehicle types on each trunk road section.
- A measure of road sinuosity. The ratio of the length of the road and the straight-line length between start and end nodes was used.
- The maximum speed limit for the road. Most were 60 or 70 miles per hour, though small numbers of road lengths were 30, 40 or 50 miles per hour.
- The distance to the nearest woodland, moorland and urban habitat within 2 km. Habitats were mapped on a 20 m grid in the Scotland Habitat and Land Cover Map 2022 EUNIS level 1 data (Space Intelligence Ltd., 2023). Additional mapped woodland areas wider than five metres were extracted from AMPS habitat data and included, as these were thought likely to provide additional information on woodland immediately adjacent to roads.
- The area of woodland, moorland and urban habitat within 25 m perpendicular to the road.
- The area of woodland, moorland and urban habitat within 100 m perpendicular to the road.
- The area of contiguous woodland, moorland and urban habitat intersecting a 25 m buffer around the road.
- The road type. Most lengths were classified as carriageway, as they related to the major stretches of trunk roads. Fewer lengths were classified as slipways or roundabouts, which represented typically shorter lengths of road at junctions.
- The number of lanes, extracted from AMPS data.
- An estimation of the road width, based on:
- 3.65 m for each normal carriageway.
- 4.00 m for each wide carriageway.
- 3.30 m for each hard shoulder.
- 5.00 m for each central reservation where the road was dual carriageway or motorway.
- The total length of road barrier within 10 m perpendicular to the road.
- The number of “Wild animals likely to be in road ahead” signs within 100 m. Sadly, it was not possible to limit these to those within 100 m along the road network.
Many of these variables were expected to be collinear, but were included so that the most informative could be selected.
Other possible factors not considered included:
- Actual traffic speeds. Estimated average traffic speed data for roads is available from Ordnance Survey and could be included in a future analysis.
- Landscape heterogeneity and patch size. It was felt that the habitat data available were inadequate to calculate these metrics.
- Deer species. Very few DVCs could be adequately assigned to species for the years considered. Given different deer have different ecological requirements and will be found in different locations, this lack of information is likely to have perturbed the model.
- Time of year and day. Due to the nature of the data analysed, this information could not be considered by the analysis.
- The presence of wildlife corridors perpendicular to and crossing the road. This would be challenging to achieve at a national level.
Only the data for 2022–2024 were included in the analysis, due to concerns about positional bias in earlier data (Annex 2: Accuracy of incident locations). Data diagnostics suggested that the data had a negative binomial distribution. Zero-inflation in the data was rejected by comparing predicted with observed zeros and through Vuong's non-nested test. One road length, containing 34 DVCs over the three-year period, was removed as an outlier following model diagnostics.
Models were assessed for collinear predictors and those with the poorest performance were removed. This resulted in the removal of several predictor variables:
- The area of woodland within 100 m – collinear with the area of woodland within 25 m.
- The area of moorland within 100 m – collinear with the area of moorland within 25 m.
- The area of urban habitat within 100 m – collinear with the area of urban habitat within 25 m.
- The number of lanes – collinear with the estimated road width.
Predictor variables were also removed using a combination of stepwise regression and manual removal of poorly performing predictors. This resulted in a more parsimonious model containing eleven predictors, all of which showed a highly significant relationship with the number of DVCs within each length of road over the three-year period. However, all models failed to converge, most likely due to the relatively few DVCs over the whole trunk road network in the three-year period, and were regarded as unreliable.
DVCs in Deer Management Priority Areas
The Operational Delivery Workstream of the Deer Management Strategic Board identified several Deer Management Priority Areas. These aimed to deliver a cohesive and dynamic ‘on the ground’ approach to deer management, with all partners focussing on opportunities for landscape scale delivery (NatureScot, 2025).
A series of maps summarising the occurrence of DVCs within the Priority Areas were developed in collaboration with NatureScot staff. These were based on the average number of DVCs per kilometre of road per year within 5 km² hexagonal cells. The length of road was calculated using Ordnance Survey OpenRoads data. A PostgreSQL function was developed that could undertake the analysis on any set of areas using any cell size.
Two maps were produced covering two five-year periods for the previous decade of data, allowing comparison of the two maps. Simplified versions of the maps are provided in Annex 4: Deer Management Priority Area DVC maps. These show that the Central Scotland Priority Area had the most DVCs per kilometre of road per year, though DVCs appeared fewer and more patchy in 2020–2024 than in 2015–2019 (Figure 67). Large parts of the Clyde Climate Forest Area Priority Area also had large numbers of DVCs, though again fewer in 2020–2024 (Figure 68). In most other areas DVCs were more scattered.
Navidale mobile VMS deployment
Mixed-effects regression analysis of vehicle speed data from the VMS deployment at Navidale showed that time of day, vehicle type and snow affected vehicle speeds, but the deployment of the VMS had no significant effect. This was true regardless of the direction of traffic. Ignoring vehicle class, the snow had the biggest effect on vehicle speed, accounting for a reduction of about 4.5 miles per hour controlling for other variables (p < 0.01).
Discussion and recommendations arising
Data collection and collation
Data collation was successful, with data from all core sources and several supplementary data sources added to the DVC database. The DVC database now includes 43,482 mapped incident records for the period 2008–2024. During this contract, 20,729 records were added, which includes previously missing 2020–2021 data for the M8 and pre‑2022 data from several significant new sources (Lush and Lush, 2023). Non-deer species account for 3,303 records.
The supply of CRaSH data by Police Scotland has allowed STATS19 records to be included for all local authority areas for the first time since 2017. The completeness of the data is not known, but it is likely to include all or most DVCs that resulted in a human injury, since most STATS19 incidents are expected to be recorded in CRaSH.
In terms of numbers, data from Police Scotland’s STORM database were the most significant addition to the DVC database. However, some records relate to deer on roads, rather than DVCs. All STORM records have been included in the database, since all represent an increased risk of DVCs. Assuming that it is possible to separate DVCs from other records in the STORM data, it would be appropriate to add a field to the DVC database to flag collisions.
The positional accuracy of the STORM data is also unknown, but a review of records around the DVC hotspots suggested that it was not accurate. For example, it included a small cluster of records from a fast-food outlet. Records were also often unrealistically clustered on single points. Future work would benefit from investigating how incidents are reported and assigned locations, and any bias apparent in the data.
Data extracted by Transport Scotland from its AMPS database also made a valuable new contribution. Whilst many records had also been obtained from TROCs, it also contained numerous non-duplicate records that have enhanced the analysis. The AMPS database was rolled out to TROCs and DBFOs gradually, which means that the chances of duplicate records may increase alongside use of the AMPS. However, it is also known that some TROCs and DBFOs maintain separate systems for recording DVCs that may not be readily recorded in AMPS.
Data from the STORM and AMPS databases were not treated as core sources in this contract and were therefore excluded from many analyses. However, they could be valuably included in many of these analyses if the data is added to the DVC database in future years. This would essentially involve different analyses to look at trends from 2008 and a later year from which STORM and AMPS data is consistently available.
The addition of records from the NBN Atlas and iNaturalist has increased the number of records where species are thought to have been reliably identified. These will need to be regularly updated, which must include the deletion of existing data and addition of up-to-date records for all years, as this allows for redeterminations and other changes to historic records.
Data from NatureScot and New Arc Wildlife Rescue also increased the number of reliably identified records.
Basic analysis, trends and distribution of DVC occurrence
Evidence for DVC trends
Trends in DVCs appear to be in line with previous years once new data sources are taken into account, with an overall plateauing of records between 2017–2024 (Lush and Lush, 2023). The addition of supplementary data from new sources, notably the large Police Scotland STORM dataset, means that there are now many more records from 2019–2024. Nevertheless, the overall number of DVCs per year between 2019–2024 also appears to be relatively stable.
The numbers of DVCs reported by TROCs remained broadly stable between 2009–2024, though individual regions show large variability. Whilst the North East region had reported relatively stable numbers of DVCs per year until 2022, the numbers in 2023 and 2024 were clearly higher. Whether the apparent increase in the North East region continues and proves to be significant will become clear as more years are analysed. The significant declining trend in DVCs in the North West region continued, though shows signs of stability between 2019–2024. Meanwhile, annual numbers of DVCs in the South West region continued to show great variability, with no apparent trend in recent years.
The significant increasing trend in the South East TROC region has continued, with numbers in 2021–2023 approximately twice those of previous years and 2024. The reasons for the increase and subsequent decrease are unclear, but may be due to the move from IRIS to AMPS and subsequent adoption of AMPS modules – an issue that may also have affected other TROCs and DBFOs. Staff changes may also mean that different techniques were used to extract the data, which may have affected consistency. The extent to which records where a deer carcass was not uplifted were including in 2024 data is unclear, but may explain the peak in 2021–2023 if they were subsequently removed from the data supply.
Despite the variation in records from TROCs, the trunk road network shows a clear increase in the number of DVCs per length of road per year between 2008–2017 and 2018–2024. This is due to records from other sources and is true regardless of whether all or only core records are considered. Perhaps more interestingly, no part of the trunk road saw a decline in DVCs per length of road per year.
Most variation in the numbers of DVCs per year from core sources is due to data from the SSPCA. Whilst this has significantly increased since 2008, the previously speculated dip in numbers in 2020 now appears to be a general plateauing of numbers since 2017 (Lush and Lush, 2023). The reasons for this are not clear, but will likely relate to a range of perturbing factors including availability of suitable staff, SSPCA locations in relation to DVC incidents, changes to whether the SSPCA are called by key individuals and organisations, and the location and availability of other wildlife rescue centres. Whether this represents a plateauing of DVCs within the wider road network is therefore unclear.
DVC reports from Forestry and Land Scotland (FLS) continue to decline. It is likely that this is due to culling activities around FLS sites that have reduced the number of incidents that they are called to attend (Lush and Lush, 2023). As such, FLS data represents an interesting case study in how consistent, long-term deer culling may reduce local DVC numbers, though it is acknowledged that culling is not possible or as effective in all areas (Putman and Langbein, 2024).
On a finer scale, DVCs remained concentrated in the central belt, with evidence of increases from 2008–2024 across all relevant data sources. Whilst numbers remained comparatively low, there was also evidence of above average increases in DVC frequencies in the south and north east, along with below average increases in the north and west. Two local authority areas, Argyll and Bute and Aberdeen City, showed a decline in the number of DVCs reported by the SSPCA and Forestry and Land Scotland, which may be representative of overall trends in the wider road network. Indications of an increase in DVCs in the Aberdeen area vanish when only core data sources are considered and are likely due to the inclusion of data supplied by New Arc Wildlife Rescue.
Any apparent localised increases or decreases in the data are likely to be within the expected range of random variation and could be due to fluctuating deer numbers, changes in traffic levels or reporting likelihood, or the implementation of localised DVC mitigation, such as signage or culling.
Overall, this suggests a relative decline in DVC frequencies in north Scotland and a relative increase in the central belt. No clear change in DVC frequencies could be discerned for the area south of the central belt.
Diurnal and seasonal distribution, and species involved
The available evidence suggests that the DVC incidents continue to peak between 21:00 and 00:00, or between 15:00 and 00:00 between December and February. These patterns reflect those previously reported (Langbein, 2019; Lush and Lush, 2023), though improvements to the data more clearly show the nighttime peak in spring and summer.
Although deer are active throughout the 24-hour cycle, they show strong crepuscular peaks (Mitchell, Staines and Welch, 1977; Georgii, 1981; Pagon et al., 2013; Sándor et al., 2013; Ensing et al., 2014; Ikeda et al., 2019). In upland habitats, deer typically descend from higher ground at dusk to forage, returning at dawn, while in lowland landscapes they emerge from woodland at dusk to feed and likewise return at dawn (Mitchell, Staines and Welch, 1977). These movements place deer close to roads in the evening and early morning, with evening activity occurring earlier in winter months. Activity also increases, and becomes less predictable, during the rut (Sándor et al., 2013), which can shift risk to earlier in the day – a pattern evident in this study between September and November.
Traffic levels also fluctuate daily, generally peaking during morning and evening commutes. When deer activity coincides with these peaks, DVCs are more frequent, as seen between 15:00 and 18:00 during December to February.
Driver behaviour and road conditions add further complexity. A consistent peak in DVCs occurs between 21:00 and 00:00 throughout the year, which may reflect driver fatigue, reducing their ability both to see and then react to deer. Alcohol or drug use could also play a role, though collisions linked to these factors may not display a consistent daily pattern.
Adverse driving conditions – such as reduced visibility or slippery roads – can heighten risk. However, the evenings of December to February, when conditions are poorest, do not show a sharp peak in DVCs. This may result from reduced deer activity or lower traffic volumes. Red deer in particular are less active during January and February (Georgii, 1981), though the available evidence also suggests that the daily peak in DVCs may be spread across a longer period, from 15:00 to 00:00, during the winter months. Evidence from Lewis and Harris, where red deer are the only deer species present, suggests a peak of DVCs involving red deer between September and December. A similar peak occurs between September and November at Navidale, north Scotland, where red deer also predominate. These seasonal peaks coincide with the annual rut, which peaks in October in Scotland (Mitchell, Staines and Welch, 1977).
The primary reason for the increased average number of DVCs per year on all roads, especially trunk roads, is likely to be better reporting, due to the increased number of reports received from the SSPCA and the inclusion of Police Scotland’s STORM data. However, this is unlikely to have affected the monthly proportions of DVCs.
DVC frequencies continue to show a peak in May and June across all road types, but especially for motorways and ‘A’ class trunk roads. The proportion of DVCs in May and June has remained broadly consistent on all roads except non‑trunk A‑roads, which show evidence of decline. At the same time, the proportion of DVCs in November and December has increased on non-trunk A-roads. Police Scotland’s STORM dataset, which is expected to be consistent between years and reflect the entire road network, also shows a significant decline in the May peak. The reasons for these apparent trends are not clear.
Analysis of records where the species of deer was thought to have been reliably identified suggests no change from previous analysis (Lush and Lush, 2023). Roe deer appear to be the most frequently involved species throughout Scotland and in most local authorities, and are reported from all local authorities except West Dunbartonshire. Red deer are the next most frequent, having been reported from nine local authority areas. Red deer are also the most frequently reported species in Highland and North Ayrshire. Sika and fallow deer are less frequently recorded, though fallow deer were most frequently recorded in Dumfries and Galloway, and the only report from West Dunbartonshire with a reliable species identification involved a sika deer.
The results suggest a significant bias towards DVCs involving female roe deer over males. This may be because female deer are more likely to seek out and utilise wooded ‘islands’ within complex road junctions and interchanges or woodland strips adjacent to roads whilst they are rearing young, as these areas are generally free of human and dog disturbance. These deer are then more likely to be involved in RTCs when crossing the adjacent roads to access their wider environment.
DVCs resulting in human injury or vehicle damage
There is an apparent declining trend in DVCs resulting in human injury or vehicle damage, according to the available STATS19 data. This is most noticeable in an annual decline in injuries regarded as slight, whilst the annual number of serious injuries remain broadly unchanged. Fatal and damage-only incidents have been rarely reported since 2008.
However, it is hard to draw firm conclusions, as the data may be incomplete. Even if complete data has been included, there may have been a declining tendency for police to record slight injuries, or perhaps the threshold used for a slight injury has changed. This should be explored with Police Scotland in a future contract.
There are also questions around how many RTCs where deer are implicated actually involve deer. It is easy for drivers to ‘blame’ deer for an incident, excusing bad driving and/or human error on the sudden presence of one in the road. There will always be an element of doubt unless dead or injured deer are found at the scene of the incident. How many of the approximately two-thirds of incidents where deer are implicated but not at the scene this scenario affects cannot be known.
Lack of British Deer Society data
The number of records per year previously obtained from DeerAware and the British Deer Society mobile app was low, but its absence from this study is nevertheless notable. Relatively few data sources provide accurate information on deer species, but these datasets were considered reliable. It is also unclear what currently happens to records made via the DeerAware website, which was still live and presumably receiving reports at the time of writing.
Funding should be made available for the British Deer Society to continue their work in this area, including collation of DeerAware data, update and release of the mobile app, and ongoing data management. Funding should be contingent on the supply of data to inform analysis such as this.
Incident-based assessment of DVC risk
Analysis of DVC risk at a fine enough resolution to guide mitigation efforts relies upon the provision of positionally accurate DVC reports. Whilst DVCs more than 500 m from the relevant trunk road can be removed from the analysis, identification of records inaccurately located on the trunk road networks is non-trivial. Poorly located DVC records can result in artificially clustered records of DVCs that bias the results of the analysis.
The previous analysis identified potential bias in the position of records supplied by several TROCs, but these issues appeared largely resolved in this analysis. Only the North West Unit showed evidence of positional bias in the years analysed, and only in the first few months of data (Annex 2: Accuracy of incident locations). This may be partly due to the replacement of IRIS, which contained a known bug where locations defaulted to trunk road section start nodes, with AMPS. Whilst this marks an important improvement, positional inaccuracy may occur without biasing data. Positional accuracy remains a key goal for TROCs and other data suppliers.
Whilst all trunk road operators are meeting their DVC-related contractual obligations and providing high-quality data on DVCs, the only location information for some records was a section code or description. Ideally coordinates would be supplied, but it is not clear whether coordinates would reflect the actual locations of incidents. This may be true of TROC data more generally, as reports are often made after the incident has been attended and the process of locating an incident may preclude the recording of accurate locations.
Positional accuracy was also an issue in other datasets. SSPCA data only includes postcodes, which cover an area rather than a point location, so accuracy is inevitably variable. Also, manual review of Police Scotland’s STORM dataset, whilst being a significant contribution to the analysis and including coordinates, identified clustering of records and suggested that some were poorly located.
Manual review of the underlying data for lengths of road identified as high-risk was therefore necessary to account for the influence of potential positional accuracy issues. This was undertaken in 2019–2021 (Lush and Lush, 2023) and 2022–2024, and tended to be cautious, removing high-scoring road lengths from the shortlist if there were any potential issues. It was not necessary to review the full forty highest scoring lengths of roads to create the shortlist for 2022–2024, which demonstrates the improvements made since 2019–2021.
Shortlisted hotspots for targeted mitigation activities
The ten subjectively selected most significant hotspots for 2022–2024 were all within the central belt (Annex 3: Maps of DVC hotspots for 2022–2024; Table 24), as were most of those within the top twenty lists for 50–500 m and 500 m lengths (Tables 21 and 22). This broadly reflects the lists for 2019–2021.
However, only one of the 2019–2021 top ten hotspots, the A9 Dunblane West junction, was selected again. This may be due to the mobile and territorial nature of roe deer, which means that woody islands within road interchanges and road-adjacent habitat may be occupied in some years and not others. This makes it hard to create a reliable list of the locations with the highest risk, as the level of risk will change from year to year. This could be mitigated against by increasing the number of years included in the analysis, which may be possible in future years if the positional reliability of incident records continues to improve. Nevertheless, many of the longer lists of hotspots included locations identified previously.
One notable omission from the hotspot lists was the stretch of the A9 north of the Navidale Roundabout, which was a top hotspot in 2019–2021. This does not mean that deer are no longer a concern along this stretch of road, as the surrounding land continues to be well used by red deer (Langbein, 2025). Several factors may have meant that it was not identified as one of the most significant hotspots in 2022–2024, including:
- The removal of scrub that had been encroaching onto the verge will have increased visibility for drivers and deer, thus reducing the risk of DVCs (Langbein, 2025).
- Other mitigation may have reduced DVC numbers, such as the implementation of a mobile Variable Messaging Sign in November 2024 (Mitigation at Navidale).
- Low rates of reporting is a known issue in the more remote locations (Langbein, 2011) and is likely a factor here.
- The length of affected road is very long, compared to some of the more localised hotspots in the central belt. DVCs spread over a greater length of road are less likely to be identified as a hotspot than the same number over a shorter road length.
- Whilst the risk of DVCs may remain high, this does not mean that they will be temporally evenly spaced. The low numbers in 2022–2024 may be within the normal range of variation.
All of the shortlisted hotspots and most of those in the top twenty lists for 50–500 m and 500 m lengths (Tables 21 and 22) related to junctions. This supports previous conclusions that junctions are more likely to be DVC hotspots, especially in the light of improvements to the positional accuracy in the source data. The possible reasons for this given by Lush and Lush (2023) and Putman and Langbein (2024) are:
- Slip roads at road junctions tend to be curved and thus visibility is reduced, potentially increasing the chance of vehicles colliding with deer on the road.
- Slip roads are not in constant use, potentially making it more likely that deer will stray onto the road when cars are not visible.
- Road junctions often include wooded areas surrounded by roads with no public disturbance that may act as daytime refuges for deer from which they will move to feed. This is especially likely near built up areas where there are few alternative undisturbed resting up places for deer.
- Fencing along roads must end at junctions to permit vehicle access, also allowing access to animals otherwise excluded from the carriageway.
The shortlisted hotspots could be targeted for mitigation. In their review of mitigation measures to reduce DVCs, Putman and Langbein (2024) primarily recommended the use of fencing, Dynamic Warning Signs activated by Roadside Animal Detection Systems, and the removal of tree cover and shrubby vegetation along verges. They note that mitigation needs to be tailored to the specific location and typically involve a range of measures, including monitoring to determine its effectiveness. However, it may be appropriate to await results from the mitigation proposed in Langbein (2025), as this may indicate the most effective actions at each hotspot.
Improving DVC hotspot mapping
The current approach to DVC hotspot mapping has proven to be effective since its development by Lush and Lush (2023). For example, the outputs of this analysis were used to quickly assess the basis for concerns at one location raised by a member of the public. Four of the worst hotspots were also selected as study sites for Langbein (2025).
The approach is most similar to the Getis-OrdGi* statistic used by Garrah et al. (2015), but with differences, most notably the use of a moving window algorithm. However, other standard approaches have been applied elsewhere that may be more accurate or provide additional insight.
Kernel Density Estimation (KDE) has been used by several similar studies (Bíl et al., 2015; 2019; Seiler et al., 2016; Laube et al., 2023). This is a non-parametric method for estimating the probability density function of a random variable by treating each point, in this case each DVC, as the median point on a symmetrical curve, i.e. a kernel. How wide each kernel spreads is determined by a bandwidth parameter. Summing the values of all kernels creates a surface that shows where the points are more densely clustered.
KDEs fall into two types:
- Planar KDE, which treats the world as an open, two-dimensional plane. The kernels therefore spread in all directions. Applied to DVCs, this means that a kernel from a DVC on one road can affect the density estimation of other roads within the distance determined by the bandwidth.
- Linear KDE, which are constrained to a linear network, such as a road network. The kernels therefore only spread along the road network, including following branches in the network that represent joining roads. Applied to DVCs, this means that kernels from DVCs can only affect roads that are physically connected, up to the distance determined by the bandwidth.
The main difference between KDE and the approach used in this study is that KDE produces a smooth surface. The size and type of kernel, which dictates the shape of the curve, dictates how smooth the surface is. KDE is also more statistically rigorous. They are otherwise compatible and likely to produce similar results.
Linear KDE has been used in most studies, but would be difficult to implement on Scottish trunk roads, as the available trunk road data does not form a cohesive network – there are gaps between some of the sections. This means that kernels would not be able to pass to physically joined road sections where they are not joined in the data, resulting in artificially abrupt changes in the surface. Linear KDE also fails to account for the increased risk indicated by DVCs on nearby roads, which the approach applied in this study attempts to include. This is particularly important in Scotland, since many DVCs occur at junctions where there are multiple road sections and dual carriageways are represented as parallel lines in the network.
Planar KDE has been used by (Laube et al., 2023) and overcomes some of the shortcomings of linear KDE, as DVCs on one road will affect nearby roads. However, planar KDE applied to a network assumes that the area between links in the network is uniformly penetrable. This may not be the case for DVCs, as fences and other obstacles could limit the movement of deer between nearby road sections. The nature of planar KDE also means that it produces uniform results only when applied to straight roads, as each kernel can intersect with a greater length of sinuous road. This may result in bias towards sinuous roads.
Attempts could be made to resolve the issues with the Scottish trunk road network data. However, automated approaches to repair networks rarely produce good results and manually joining road sections would be costly. This suggests that planar KDE may be the best method for analysing DVCs in Scotland, despite its shortcomings.
However, other solutions could be considered:
- Nearby road sections could be connected where they are within a defined distance, such as 50 m. This would mean that the original network data would be unmodified, but would connect them to allow kernels in linear KDE to spread to nearby roads. The connections could be weighted, thus adding a cost reflecting the uncertain permeability of the space between the roads to deer. However, the results would be influenced by the frequency of the connections. Whilst this could be resolved by increasing the frequency of the connections, the amount of processing required to adequately resolve the issue could be too costly.
- Implement a hybrid approach that combines linear and planar KDE. This would involve calculating both linear and planar KDE, and then combining them for the road network, summing weighted or unweighted values. This could produce results that account for the increased risk of DVCs on the road section where a DVC has occurred and, to a lesser extent, the likely increased risk to nearby roads.
Further exploration and application of KDE to DVC analysis in Scotland is recommended for a future contract.
Proximity of DVC hotspots and road signs
An analysis of the proximity of DVC hotspots and permanent signs indicating a risk of deer on the road was undertaken, but provided no evidence of a relationship. It considered two types of sign: the “Wild animals likely to be in road ahead” signs that feature a picture of a running deer and fixed location Variable Message Signs (VMS) that can programmed to display different messages to alert drivers to the risks on the road.
Several issues were noted that meant a reliable statistical analysis was not possible, notably:
- The data showing the locations of “Wild animals likely to be in road ahead” signs was thought to be incomplete. The completeness of data on VMS was unknown.
- The direction of the sign, i.e. which way it was facing, was not known. This is important, as the sign might occur after a hotspot when accounting for direction of travel.
- Signs sometimes state the distance of road covered by the warning, but this data was not available.
- “Wild animals likely to be in road ahead” signs may not relate to a risk of deer on the road or necessarily be placed in response to strong evidence of a high risk. Additionally, if the signs were reducing DVC risk, then the likelihood of a nearby DVC hotspot would also be reduced.
- Straight-line distances were considered, rather than distances along the road. A network analysis was considered to give more accurate distances along a road, but was not undertaken due to the other issues noted.
A manual assessment of the ten most recently installed permanent “Wild animals likely to be in road ahead” signs up to the end of 2022 was therefore undertaken. The direction of each sign was established using Google Streetview and any distances associated with the signs were noted. These were compared with DVC risks along 500 m stretches of road (Table 21). The results of this assessment suggested that the reasons for the installation of many signs could not be related to a high incidence of DVCs. Where signs may have been installed due to high DVC incidence, there was little evidence to suggest that they had been effective. Only one location showed evidence of a decline in DVC incidence since the installation of signs. This aligns with other studies, which show no evidence to suggest that permanent signs reduce the incidence of Wildlife Vehicle Collisions (Putman and Langbein, 2024).
Analysis of the impact of road signs on DVC incidents may be possible, but this will need to be on a case-by-case basis. This could be achieved in two ways:
- Identify DVC hotspots and either install signs or make use of mobile VMS, and compare DVC incidence before and after.
- Analyse how the incidence of DVCs is affected if signs are removed due to damage or wear and tear, and not replaced.
Predicting DVC risk
Due to the relative sparseness of the few years of unbiased data included, the models described in Predicting DVC risk using environmental data did not converge reliably and should be interpreted cautiously. Nevertheless, it is worth considering the predictors that were retained, as these suggest patterns in the data.
The greatest effects on DVCs appeared to be due to road type. The model suggested that slip roads and roundabouts had several times more predicted DVCs than normal roads. This is unsurprising, given the patterns already observed in the data and the locations of the worst DVC hotspots in 2019–2021 and 2022–2024.
Interestingly, wider roads appeared to be associated with fewer DVCs. This may be due to the effects of slip roads, but may also suggest that deer are less likely to cross wider roads. Wider roads may also give drivers more space in which to see a deer and take successful measures to avoid a collision.
As expected, the model suggested that nearby habitat had an effect on DVC frequency. The area of woodland and urban habitats within 25 m appeared to have a positive relationship with the predicted number of DVCs. The apparent effect of woodland is unsurprising and is possibly heightened where urban habitats are also nearby. Urban habitats will reduce the availability of semi-natural habitats and increase potential public disturbance, thus making woodlands near roads more attractive to deer. However, the model suggested that large, contiguous areas of urban habitat nearby were negatively associated with DVCs. This may be because of a relative reduction in semi-natural habitat that can support deer, leading to a supressed deer population and fewer DVCs. It may also be that vehicle speeds near large urban areas were slower on average, due to slower maximum speed limits or volume of traffic, thus reflecting the risk of DVCs.
With the exception of road width, the aforementioned predictors most likely relate to roe deer. However, the model suggested that the proximity of moorland was positively related to DVC numbers, with predicted DVCs declining as moorland became more distant. This was most likely to reflect the likelihood of DVCs involving red deer. Moorland proximity was likely selected over moorland extent because moorland tends not to occur within 100 m of roads in the central belt where most DVC hotpots occur.
The model also suggested that increases in the number of vehicles on the road and in road speed increased the number of predicted DVCs. Higher volumes of traffic will increase the opportunities for DVCs to occur, whilst increased speed reduces stopping distances and therefore the number of DVCs that are averted.
Finally, the model suggested that the longer lengths of barriers within 10 m of a road increased the predicted number of DVCs, though only slightly. This may be because these act as a barrier to deer exiting roads and, in the case of central barriers, reducing deer transit time, meaning that they are on the road for longer. It suggests that roadside barriers are not effective at reducing DVCs unless deer are completely excluded from entering the road in the first place. The data exported from AMPS suggested that there was only 6 km of roadside deer fence in Scotland.
These predictors are therefore consistent with ecological expectations and previous studies, but given the convergence issues and data sparseness, they should be regarded as indicative associations rather than statistically reliable effects.
It may be possible to produce a reliable model given sufficient data without positional bias. Repeating the analysis with additional years of unbiased data will allow the robustness of these patterns to be tested. Assuming the positional accuracy of DVC records continues to improve, or with improvements to data management to flag and exclude records with positional accuracy issues without otherwise biasing the model, three more years of data may adequate. Repeat analysis using 2022–2027 data is therefore recommended.
Ideally, future analysis could incorporate some potential predictors that could not be included here. Notable parameters include actual traffic speeds and landscape heterogeneity and patch size. The landscape measures may require better habitat data than was available for this study. The presence of wildlife corridors perpendicular to a road would also be a valuable addition, though it is unclear how this data could be derived from information available at present. The slope of the road may also be relatively easy to calculate given suitable data and may show a relationship to DVC frequency (Laube et al., 2023). Other potential predictors, such as visibility and the presence of embankments, could ideally be included, though this may be difficult without manual capture of suitable data.
It may be possible to include information on the time of year and day. These do not affect where DVCs happen, but as DVCs are temporally unevenly distributed they could then be included as random effects in a mixed-effects model. However, including these in what is essentially aggregated data is likely to mask any effects and incident times are reliable in only a small proportion of cases.
Ideally, it would also be useful to include the species of deer implicated in a repeat analysis. In theory this could be achieved by including counts for each species, but in practice relatively few DVCs are accurately identified to species. This means that future models are likely to be biased towards incidents involving roe deer. A possible proxy for this information could be local population estimates for each species, but this information currently does not exist at a national level. In the absence of information on deer species, the eastings and northings of the road length could be included as a proxy, to reflect the different distributions of deer species in Scotland.
Addition of non-deer species to the database
Changes to the DVC database mean that it is now possible to include incidents involving species other than deer. Whilst DVCs remain the focus in Scotland, this opens up possibilities for other analyses in the future. The data on incidents involving non-deer species is currently incomplete, but as more data holders supply records of non-deer species the analysis of such data could be improved. This has three potential benefits for Wildlife Vehicle Collision (WVC) analysis in Scotland:
- Better data on WVCs in general can help calibrate DVC records by determining which species are most and least affected.
- The risks imposed by non-deer species may change over time, in which case data tracking this change would be beneficial. For example, collisions with badgers and feral pigs can damage cars, and the latter may increase in Scotland without management (Massei and Ward, 2022).
- Better knowledge of non-deer WVCs could improve our understanding of the impacts of traffic on rare or threatened species, such as pine marten, otter and red squirrel.
More comprehensive data on non-deer species would be possible with investment in working with data holders to obtain such data. However, issues will likely remain with obtaining reliable data on small animals, as injured specimens are often taken directly to wildlife rescue centres (Paul Reynolds, pers. comm.).
These changes to the DVC database also create the opportunity to undertake similar analyses of WVCs in other countries where deer are not the sole or main concern, whilst using the same database and analysis infrastructure.
Mitigation at Navidale
Analysis of vehicle speed data at Navidale indicated that the deployment of two mobile VMS warning of deer on the road had no detectable effect on vehicle speed. However, the reliability of this finding is uncertain because of how the data were collected and the specific road layout.
The speed detection strips were located approximately 422 m north of the northbound VMS and 551 m south of the southbound VMS. The northbound VMS was positioned at the Navidale roundabout, where vehicles were still accelerating towards their normal cruising speed. In this case, the absence of a measurable effect may reflect the fact that recorded speeds captured vehicles before they reached their maximum speed. If the VMS did influence drivers, this might only have been apparent further along the road, beyond the location of the speed detection strips.
Southbound traffic was not constrained by the roundabout, and the distance between the VMS and detection strips should have been sufficient to detect any change in speed. However, speeds immediately north of the VMS were not monitored, so it is not possible to assess whether the VMS had an effect in that location. It is also possible that southbound traffic happened to be travelling faster overall during periods when the VMS was active and conditions were clear of snow, further complicating interpretation.
Future data collection of this type would benefit from closer consideration of the relationship between VMS placement and speed monitoring. Ideally, several sets of detection strips would be positioned at varying distances downstream of the VMS to capture potential changes in speed over distance. Additional strips placed upstream of each VMS on comparable stretches of road would provide useful control data – provided they are sufficiently far from the sign to avoid influence and are unaffected by confounding features such as the road layout, in this case the Navidale roundabout.
Other recommendations to improve data collection and analysis include:
- Recording exact VMS activation times rather than approximate deployment weeks. This would allow each vehicle record to be assigned precisely to VMS on/off periods, enabling finer-grained modelling.
- More detailed weather logging, ideally including rainfall, temperature and snow depth, to account more accurately for environmental influences on driver behaviour.
While survey design will always be constrained by cost, even modest improvements to monitoring could help reveal whether mobile VMS do influence vehicle speeds.
It is also worth noting that vehicle speed is not the only measure of DVC risk. The signs may have resulted in increased driver awareness that meant DVCs were averted, without affecting vehicle speeds. Determining whether this is the case when VMS are deployed in this manner is likely to be impossible, as it will require deployment for long enough to observe an effect on actual DVCs. This would likely suffer from driver complacency, where the VMS looses its effect on driver behaviour over time, thus negating the results.
TROC reports not resulting in a deer carcass uplift
Despite changes to the requests for data, it was not clear how many TROCs supplied records for DVC reports where a carcass was not uplifted. In many cases this was due to the systems already in place for managing and collating the data. Changes to existing systems will not be quick to achieve.
This likely means that there is an element of bias in the data, as those TROCs that supplied such ‘no trace’ records would have relatively more records in their area in the DVC database. It is not thought that this will have influenced overall trends, but may have had localised impacts on the results of this analysis.
Future research should continue to ensure that all relevant data is collected by and collated from TROCs, for inclusion in the DVC database. Over time the number of TROCs supplying ‘no trace’ records should increase.
The effect of changes to the road network
All analyses in this study have been conducted using the road network as it was in 2021, rather than attempting to reconstruct the network as it existed at the time of each DVC. This is both pragmatic and appropriate: identifying historic network layouts for every incident and adjusting the analysis accordingly would be impractical and would provide little additional value. More importantly, analyses should be valid at the point they are undertaken, and therefore should reflect the present-day road network.
One implication of this approach is that some historic DVCs may no longer fall on the current network, while others that occurred on one road type may now appear on another. To minimise this issue, many of the more detailed analyses described in this report have been designed to match DVCs to roads by trunk road section and road number. Any misclassified incidents are expected to be rare and unlikely to materially affect results or their interpretation.
The use of the 2021 trunk road network data for this report will have had a negligible impact on the results of the latest analyses, as the trunk road network had only changed substantially in one location, which had few DVCs. However, as the trunk road network continues to evolve, it will be desirable to use updated trunk road network mapping for future DVC analyses, when this is available.
Because the trunk road network is evolving, analyses assigning DVCs to roads or sections of roads should be regarded as a snapshot in time, rather than a fully consistent comparison across years. Thus, direct year-to-year comparisons or specific locational comparisons may not always be reliable, but given the limited scale of the changes to the trunk road network compared with the extent of the network itself, the general conclusions remain robust.
Marker post datasets
For some DVC records, reference to the nearest marker post is the only available location information. The previous study began compiling a marker-post dataset, correcting existing records and adding previously unmapped locations (Lush and Lush, 2023). This work was continued during the present study.
To date, updates to the dataset have been piecemeal, meaning that coverage remains incomplete. Where marker posts are the sole location reference, this lack of comprehensive data is a barrier to effective DVC collation. Adding marker posts on an ad hoc basis also slows the overall process.
A more systematic method has now been developed to make completion of the dataset more efficient. This involves using Google Street View to record the latitude and longitude of marker posts visible on the roadside. These are then added directly to the dataset. Mapping whole road sections in this way – recording the number and position of each marker post sequentially – would be more effective than continuing to add posts individually as required. This approach also resolves cases where marker post numbers are illegible, as numbers can be inferred from neighbouring posts, and even allows approximate placement where posts are obscured, as they are typically 100 m apart.
Developing the dataset in this systematic manner would be significantly more efficient than the current incremental approach. Moreover, a complete marker-post dataset would likely have wider value for Transport Scotland and the relevant TROCs. It is therefore recommended that funding be secured to support the creation of a comprehensive, national marker-post dataset using this method.
The potential of animal rescue centres to collect DVC data
The SSPCA operates nationally in Scotland and has provided records of incidents reported and attended by staff. These data have been consistent and invaluable for DVC analysis since the 2008.
However, several other independent animal rescue centres operate within Scotland that do not regularly provide data. New Arc Wildlife Rescue provided valuable data for 2023 and 2024, which included many additional records not occurring in other sources. This highlights the already recognised under-recording of DVCs and demonstrates the potential value of data from animal rescue centres.
One of the obstacles to obtaining DVC data from wildlife rescue centres is the lack of a standardised system for recording such data. Most wildlife rescue centres operate on a limited budget and are therefore unlikely to develop a suitable system themselves. There would also be benefit in having a standardised central system where information from all wildlife rescue centres could be held, making it more readily available for analysis.
Options for a system range from basic with limited functionality, through to complex and functionality rich. A basic solution could involve creating a QField project that could be deployed to interested wildlife rescue centres, with data being fed back to a central body and perhaps published via QGIS Cloud. This would have no license costs, meaning that only development, ongoing maintenance and data management would need funding.
A more complex solution could involve a bespoke mobile application for use in the field linked to a centralised database and a web-based interface for managing and interrogating the data. This could include the use of user logins to ensure that staff only saw records related to their organisation. It could also encompass functionality for recording admissions, treatment and rerelease where appropriate. However, this would require significant investment in development and maintenance, which would need to be weighed against the number of users, and the volume and value of the data captured.
Further work on mobilising data from animal rescue centres is recommended. This should initially involve exploratory work to identify the relevant organisations, their interest in a solution, their requirements, and potential sources of funding for development, maintenance and management. This should also aim to gauge the volume of data that could be mobilised through the solution.
Increasing data mobilisation and improving quality
Several datasets obtained during this contract had issues that limited their inclusion in the analysis, notably lack of dates and accurate locations. This is unfortunate, as it reduces the value of the data. Other data could not be obtained or used, either because they were not supplied or due to licensing issues.
Future contracts should aim to continue to both improve data quality and mobilisation. Where DVCs are recorded by organisations with internal data management processes, efforts should be made to influence data capture and management, to improve record quality and increase record usefulness.
For other, less structured recording of DVCs, the use of an established mobile app is recommended. This should allow the date and location of the incident to be accurately recorded, along with other key information constituting a valid biological record. Data verification mechanisms are also valuable, especially where this results in usable species-specific data. The Mammal Society’s Mammal Mapper app is strongly recommended, as this specifically allows for recording of roadkill and the data is supplied for use in this analysis. The iRecord and iNaturalist apps can also be used, though the comment on any DVC records made should state that it is roadkill, the data should be licensed for commercial use and the coordinates should be unobscured, to ensure that the data can be used in this analysis.
Annexes
Annex 1: Database main table structure
The database consisted of one main table and eight related tables Figure 39.
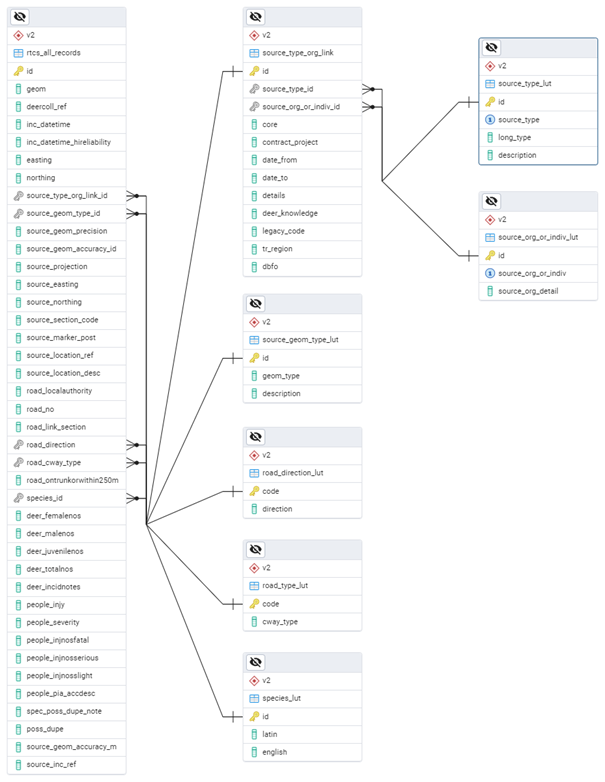
Figure 39. Entity Relationship Diagram for the DVC PostgreSQL database.
Click for a full description
An Entity Relationship Diagram ERD for the DVC PostgreSQL database, consisting of one large main table, five linked tables and two further subsidiary tables. The structure of the tables and their relationships are detailed in Tables 25 to 33.
The table rtcs_all_records contains the main information relating to DVC incidents and links to categories stored in related tables (Table 25).
| Field name | Field type | Description |
|---|---|---|
| id | Serial | Primary key. |
| geom | Geometry(Point,27700) | Point location in British National Grid. |
| deercoll_ref | Integer | Legacy unique record identity field as supplied by Jochen Langbein. |
| inc_datetime | Timestamp with time zone | The original date and time logged on record. Where the record has no time it is recorded as 00:00:00. |
| inc_datetime_hireliability | Boolean | TRUE for those records where the time is believed to be reliable, otherwise FALSE. |
| easting | Integer | The eastings for the mapped geometry, in British National Grid. |
| northing | Integer | The northings for the mapped geometry, in British National Grid. |
| source_type_org_link_id | Integer | The id of the linked row in the source_type_org_link table, which links source types and organisations to the data. |
| source_geom_type_id | Integer | The id of the linked row in the source_geom_type_lut table. |
| source_geom_precision | Integer | The precision of the location in metres, where this information is available. |
| source_geom_accuracy_id | Integer | The id of the linked row in the source_geom_accuracy_lut table. An assessment of the accuracy of the original location information, based mainly on the data collection method. |
| source_projection | Character varying | The projection of the source data in ESPG format, where relevant. This is typically 27700 for British National Grid, but also 4326 for WGS84. |
| source_easting | Integer | The eastings recorded in the original data, in British National Grid. |
| source_northing | Integer | The northings recorded in the original data, in British National Grid. |
| source_section_code | Character varying | The trunk road section code in the original data, where recorded, e.g. 11031/76. |
| source_marker_post | Character varying | The road marker post number in the original data, where recorded, e.g. 57/1. |
| source_location_ref | Character varying | The source location reference in the original data, where recorded. This is typically a British grid reference, but may be another reference, e.g. What3Words. |
| source_location_desc | Character varying | A description of the location as recorded in the original data. |
| road_localauthority | Character varying | The local authority area the record occurs within. In a few cases spatial imprecision results in NULL results, so these are updated manually. |
| road_no | Character varying | The road number, e.g. A7. |
| road_link_section | Character varying | The trunk road section code, based on the geometry location, e.g. 11031/76. |
| road_direction | Character varying | The direction of traffic for motorways and dual carriageways, where available or inferred by the section code. |
| road_cway_type | Character varying | The carriageway type of the road. Links to the code field in the road_direction_lut table. |
| road_ontrunkorwithin250m | Boolean | An indication of whether the record relates to a trunk road, based on its attributes or proximity within 250 m. |
| deer_id | Integer | The id. of the linked row in the species_lut table. |
| deer_femalenos | Integer | The number of females, where recorded. |
| deer_malenos | Integer | The number of males, where recorded. |
| deer_juvenilenos | Integer | The number of juveniles, where recorded. |
| deer_totalnos | Integer | The total number of animals involved. Assumed to be 1 where no information is provided. |
| deer_incidnotes | Character varying | Descriptive text relating to the wildlife vehicle collision as recorded in the original data. |
| people_injy | Boolean | TRUE where there is a police incident report, otherwise assumed to be FALSE. |
| people_severity | Character varying | The maximum severity, based on the following fields. |
| people_injnosfatal | Integer | The recorded number of fatalities. |
| people_injnosserious | Integer | The recorded number of serious injuries. |
| people_injnosslight | Integer | The recorded number of slight injuries. |
| people_pia_accdesc | Character varying | Descriptive text from the police accident report. |
| spec_poss_dupe_note | Character varying | Used to describe why records are suspected duplicates. |
| poss_dupe | Boolean | TRUE where the record is thought to be a duplicate of another record, otherwise assumed to be FALSE. |
| deer_experienced | Boolean | An indication of whether the data comes from a deer experienced individual or has undergone expert verification |
| source_geom_accuracy_m | Integer | Used to record the accuracy of WGS84 coordinates taken using a GPS, where available. |
| source_inc_ref | Character varying | The incident reference from the source dataset, where available. Useful when referring back to a supplied record. |
The main DVC incident table is linked to the following tables: road_direction_lut (Table 26), road_type_lut (Table 27), source_geom_accuracy_lut (Table 28), source_geom_type_lut (Table 29), source_type_org_link (Table 30) and species_lut (Table 31). The source_type_org_link table further links to the source_org_or_indiv_lut (Table 32) and source_type_lut (Table 33) tables.
| Field name | Field type | Description |
|---|---|---|
| code | Character varying | Primary key. The direction of the road as a two-letter abbreviation: NB, SB, EB and WB. |
| direction | Character varying | The full direction of the road: Northbound, Southbound, Eastbound and Westbound. |
| Field name | Field type | Description |
|---|---|---|
| code | Character varying | Primary key. The carriageway type as a one letter abbreviation: S, D and M. |
| cway_type | Character varying | The full carriageway type: Single, Dual and Motorway. |
| Field name | Field type | Description |
|---|---|---|
| id | Serial | Primary key. |
| accuracy | Character varying | A short description of the geometry accuracy type. |
| description | Character varying | A long description of the geometry accuracy type, with indicative distances from the source geometry to the true location. |
| Current | Boolean | Used to flag current from legacy geometry accuracy types. |
| Field name | Field type | Description |
|---|---|---|
| id | Serial | Primary key. |
| geom_type | Character varying | A short alphanumeric code for the geometry type. |
| description | Character varying | A long description of the geometry type, e.g. grid reference, marker post, manual. |
| Field name | Field type | Description |
|---|---|---|
| id | Serial | Primary key. |
| source_type_id | Integer | The id of the linked row in the source_type_lut table. |
| source_org_or_indiv_id | Integer | The id of the linked row in the source_org_or_indiv_lut table. |
| core | Boolean | TRUE where the data source is considered to be a core source, otherwise FALSE. |
| contract_project | Character varying | The name of the contract or project, where relevant. |
| date_from | Date | The start date of the contract or project, where relevant. |
| date_to | Date | The end date of the contract or project, where relevant. |
| details | Character varying | A description of the data source. |
| deer_knowledge | Boolean | TRUE where the original recorders were thought able to correctly identify deer species, otherwise FALSE. |
| legacy_code | Character varying | The legacy code for the data source/ |
| tr_region | Character varying | The trunk road region for TROCs and DBFOs, i.e. North East, North West, South East and South West. |
| dbfo | Boolean | TRUE where the data source is a DBFO, FALSE where it one of the four main contracts, and NULL for other data sources. |
| Field name | Field type | Description |
|---|---|---|
| id | Serial | Primary key. |
| latin | Character varying | The species’ Latin name or smallest higher taxon, e.g. Cervidae. |
| english | Character varying | The species’ English name or the English name for the higher taxon, e.g. deer. |
| Field name | Field type | Description |
|---|---|---|
| id | Serial | Primary key. |
| source_org_or_indiv | Character varying | The name of the organisation or individual that has supplied data. |
| source_org_detail | Character varying | More detail on the organisation or individual, where required. |
| Field name | Field type | Description |
|---|---|---|
| id | Serial | Primary key. |
| source_type | Character varying | A short alphanumeric code for the source type. |
| long_type | Character varying | A long description of the source type, e.g. Trunk OC or DBFO, Animal Rescue, STATS19 records. |
| description | Character varying | More detail on the source type, where required. |
Annex 2: Accuracy of incident locations
Hotspots are identified based upon clusters of DVCs. To identify hotspots correctly, the location of each DVC needs to be accurately recorded at the incident. Allocation of records lacking accurate location information to the start, centre or end of trunk road sections will introduce bias and increase the likelihood of hotspots being identified.
The analysis undertaken by Lush and Lush (2023) to determine the distribution of DVCs recorded by TROCs along sections was repeated for 2021–2024. DVCs from other sources were not considered, as they were not so directly related to the trunk road network. In order to analyse how particular TROCs record data, the analysis was split into the North East, North West, South East and South West units, plus the M6, M77, M8 and M80 DBFOs, and the Aberdeen Western Peripheral Route.
The analysis considered repositioned records within 500 m of the relevant trunk road. Each record was allocated a percentage from 0% to 100%, based upon its position from the start to the end of the relevant trunk road section.
The box-whisker plots below represent the data as a box showing the median and the interquartile range for each month in 2021–2024. Whiskers extend from the ends of each box and represent the statistical minimum and maximum, excluding outliers. Black dots represent the individual incidents. The number of incidents for each month is shown below each box. Well distributed data would show a box and distinct whisker, with a scattering of DVCs between 0% and 100%. Poorly distributed data would show a box biased towards 0%, 50% or 100%, or occupying the full range, and/or distinct clustering of records.
Note that DVCs are not expected to be evenly distributed along trunk road sections, so statistical tests such as Kolmogorov-Smirnov, Cramér-von Mises or Anderson-Darling typically show significant diversion from a uniform distribution. However, Cramér-von Mises (CvM) ω2 (Faraway et al., 2021) was used to identify the most extreme diversions from a uniform distribution.
DVCs in 2022–2024 show limited bias, with only the North West Unit showing bias towards road section ends in early 2022 (Figure 41; CvM ω2 = 4.27, rank = 4). The North West (CvM ω2 = 6.68, rank = 2), along with the North East (Figure 40; CvM ω2 = 5.33, rank = 3) and South East (Figure 42; CvM ω2 = 33.3, rank = 1), also show previously observed evidence of bias in 2021.
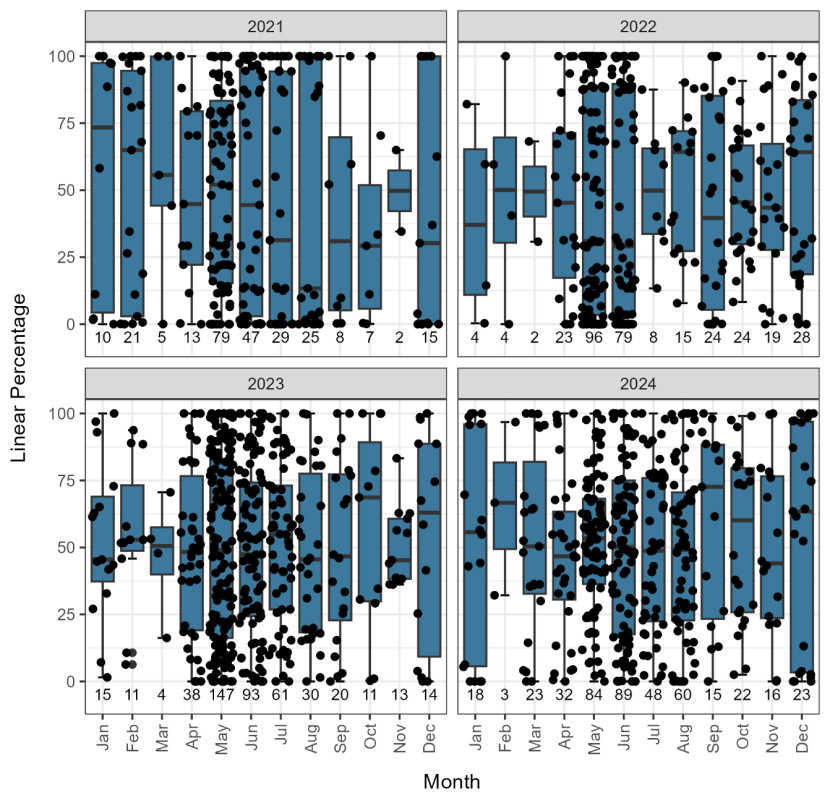
Figure 40. DVCs per month by percentage distance along the associated section for the North East Unit from 2021 to 2024.
Click for a full description
Four box and whisker plots showing the distribution of DVC locations reported by the North East trunk road unit in each month. DVCs are associated with trunk road sections based upon attributes in the original data or where they are within 500 m. Each plot represents a different year: 2021 in the top left, 2022 in the top right, 2023 in the bottom left and 2024 in the bottom right. The location is expressed as a percentage along the full section length. Location is shown on the y-axis on each plot, which is titled ‘Linear percentage’ and ranges from 0% to 100%. Months from January to December are shown on the x-axis on each plot. Each vertically aligned box shows the 25th, 50th (median) and 75th percentile. Whiskers extend from the top and bottom of boxes and show the statistical minimum and maximum values. Individual incidents are shown as black dots; where these are beyond the ends of the whiskers they represent outliers. Well distributed data would show a box and distinct whisker, with a scattering of DVCs between 0% and 100%. Numbers below each box indicate the number of incidents per month. The charts show that the data are well distributed between 2022 and 2024, but show some evidence of bias towards section ends in 2021.
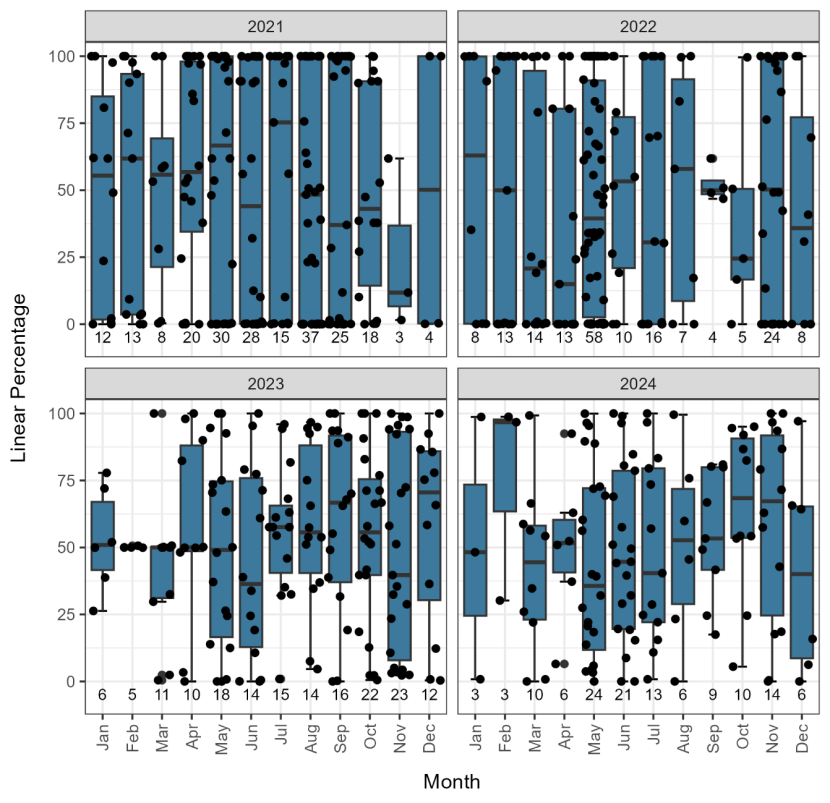
Figure 41. DVCs per month by percentage distance along the associated section for the North West Unit from 2021 to 2024.
Click for a full description
Four box and whisker plots showing the distribution of DVC locations reported by the North West trunk road unit in each month. DVCs are associated with trunk road sections based upon attributes in the original data or where they are within 500 m. Each plot represents a different year: 2021 in the top left, 2022 in the top right, 2023 in the bottom left and 2024 in the bottom right. The location is expressed as a percentage along the full section length. Location is shown on the y-axis on each plot, which is titled ‘Linear percentage’ and ranges from 0% to 100%. Months from January to December are shown on the x-axis on each plot. Each vertically aligned box shows the 25th, 50th (median) and 75th percentile. Whiskers extend from the top and bottom of boxes and show the statistical minimum and maximum values. Individual incidents are shown as black dots; where these are beyond the ends of the whiskers they represent outliers. Well distributed data would show a box and distinct whisker, with a scattering of DVCs between 0% and 100%. Numbers below each box indicate the number of incidents per month. The charts show that the data are well distributed in 2023 and 2024, but show some evidence of bias towards section ends in 2021 and the first few months of 2022. The evidence for bias in 2021 and 2022 is inconsistent across maps, suggesting that two approaches may have been used – one that recorded locations accurately and another that tended to position incidents at section ends.
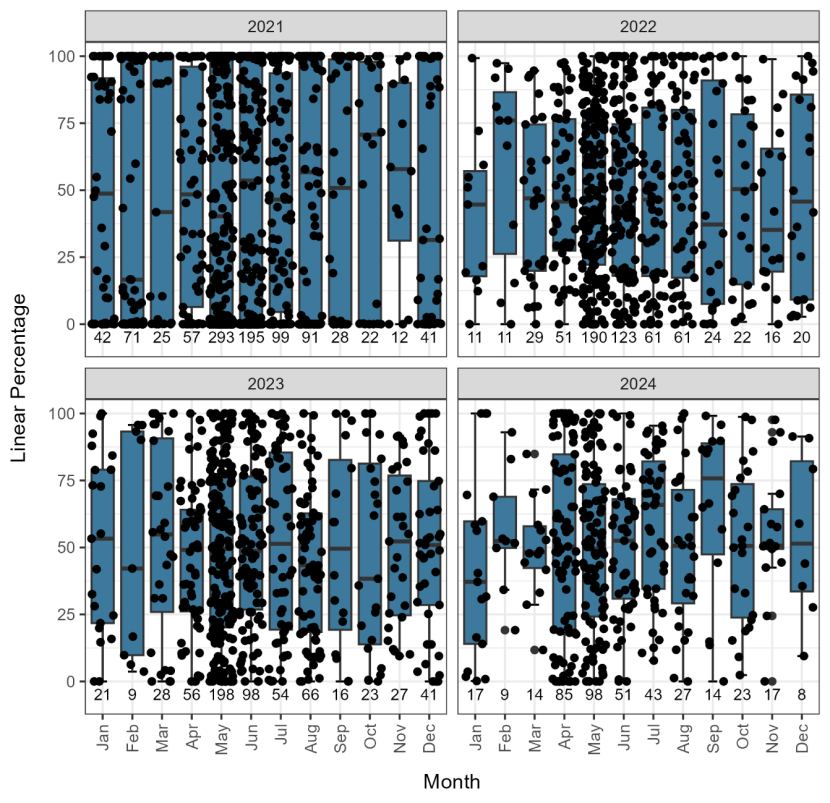
Figure 42. DVCs per month by percentage distance along the associated section for the South East Unit from 2021 to 2024.
Click for a full description
Four box and whisker plots showing the distribution of DVC locations reported by the South East trunk road unit in each month. DVCs are associated with trunk road sections based upon attributes in the original data or where they are within 500 m. Each plot represents a different year: 2021 in the top left, 2022 in the top right, 2023 in the bottom left and 2024 in the bottom right. The location is expressed as a percentage along the full section length. Location is shown on the y-axis on each plot, which is titled ‘Linear percentage’ and ranges from 0% to 100%. Months from January to December are shown on the x-axis on each plot. Each vertically aligned box shows the 25th, 50th (median) and 75th percentile. Whiskers extend from the top and bottom of boxes and show the statistical minimum and maximum values. Individual incidents are shown as black dots; where these are beyond the ends of the whiskers they represent outliers. Well distributed data would show a box and distinct whisker, with a scattering of DVCs between 0% and 100%. Numbers below each box indicate the number of incidents per month. The charts show that the data are well distributed from 2022 to 2024, but show some evidence of bias towards section ends in 2021.
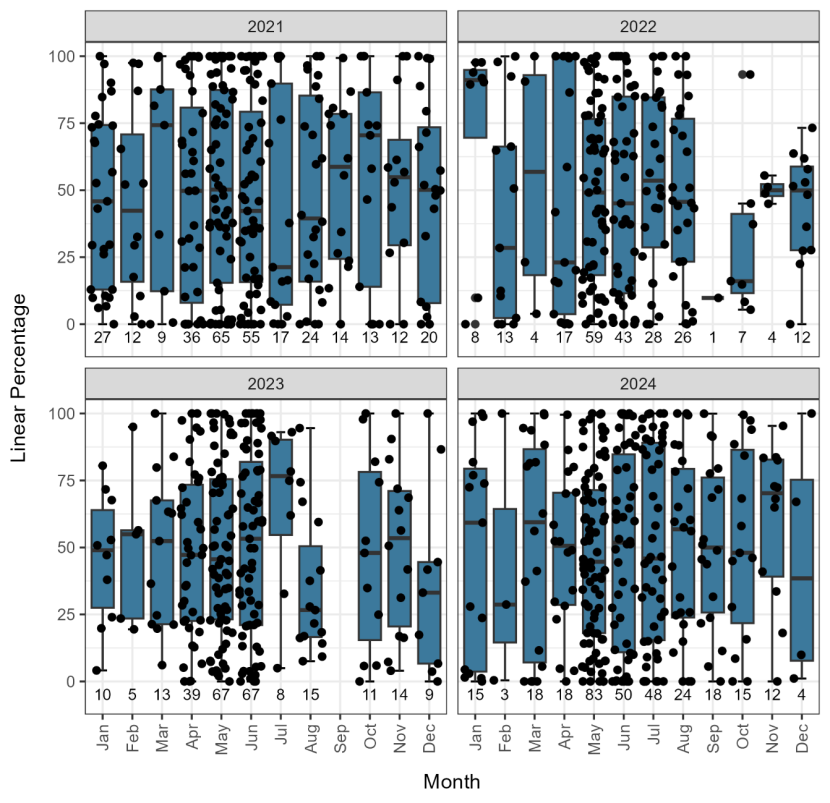
Figure 43. DVCs per month by percentage distance along the associated section for the South West Unit from 2021 to 2024.
Click for a full description
Four box and whisker plots showing the distribution of DVC locations reported by the South West trunk road unit in each month. DVCs are associated with trunk road sections based upon attributes in the original data or where they are within 500 m. Each plot represents a different year: 2021 in the top left, 2022 in the top right, 2023 in the bottom left and 2024 in the bottom right. The location is expressed as a percentage along the full section length. Location is shown on the y-axis on each plot, which is titled ‘Linear percentage’ and ranges from 0% to 100%. Months from January to December are shown on the x-axis on each plot. Each vertically aligned box shows the 25th, 50th (median) and 75th percentile. Whiskers extend from the top and bottom of boxes and show the statistical minimum and maximum values. Individual incidents are shown as black dots; where these are beyond the ends of the whiskers they represent outliers. Well distributed data would show a box and distinct whisker, with a scattering of DVCs between 0% and 100%. Numbers below each box indicate the number of incidents per month. The charts show that the data are well distributed in all months.
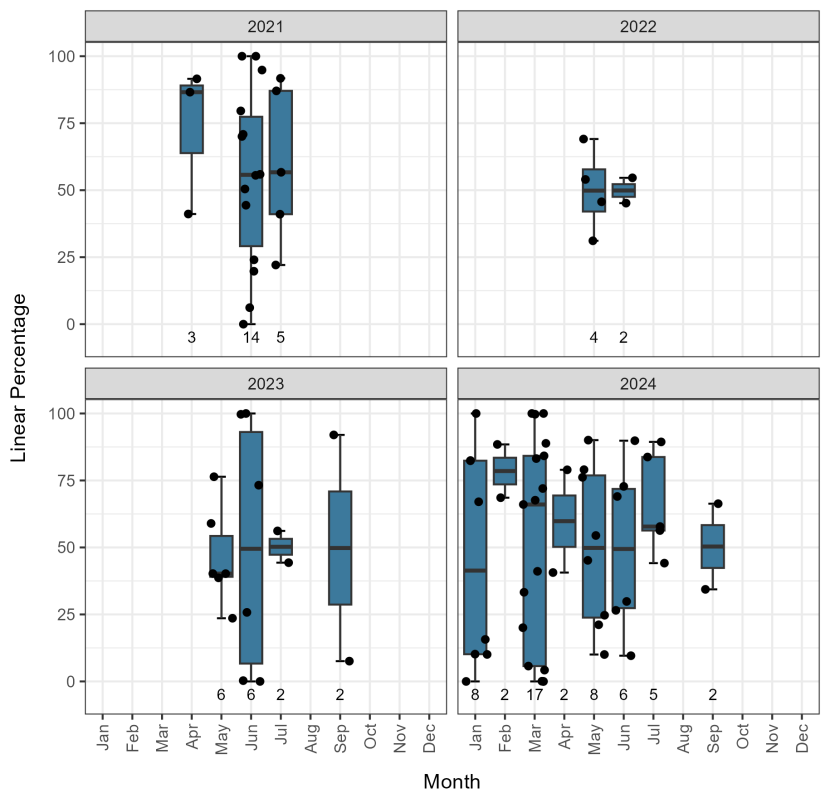
Figure 44. DVCs per month by percentage distance along the associated section for the M6 DBFO from 2021 to 2024.
Click for a full description
Four box and whisker plots showing the distribution of DVC locations reported by the M6 DBFO in each month. DVCs are associated with trunk road sections based upon attributes in the original data or where they are within 500 m. Each plot represents a different year: 2021 in the top left, 2022 in the top right, 2023 in the bottom left and 2024 in the bottom right. The location is expressed as a percentage along the full section length. Location is shown on the y-axis on each plot, which is titled ‘Linear percentage’ and ranges from 0% to 100%. Months from January to December are shown on the x-axis on each plot. Each vertically aligned box shows the 25th, 50th (median) and 75th percentile. Whiskers extend from the top and bottom of boxes and show the statistical minimum and maximum values. Individual incidents are shown as black dots; where these are beyond the ends of the whiskers they represent outliers. Well distributed data would show a box and distinct whisker, with a scattering of DVCs between 0% and 100%. Numbers below each box indicate the number of incidents per month. The charts show that the data generally are well distributed in all months.
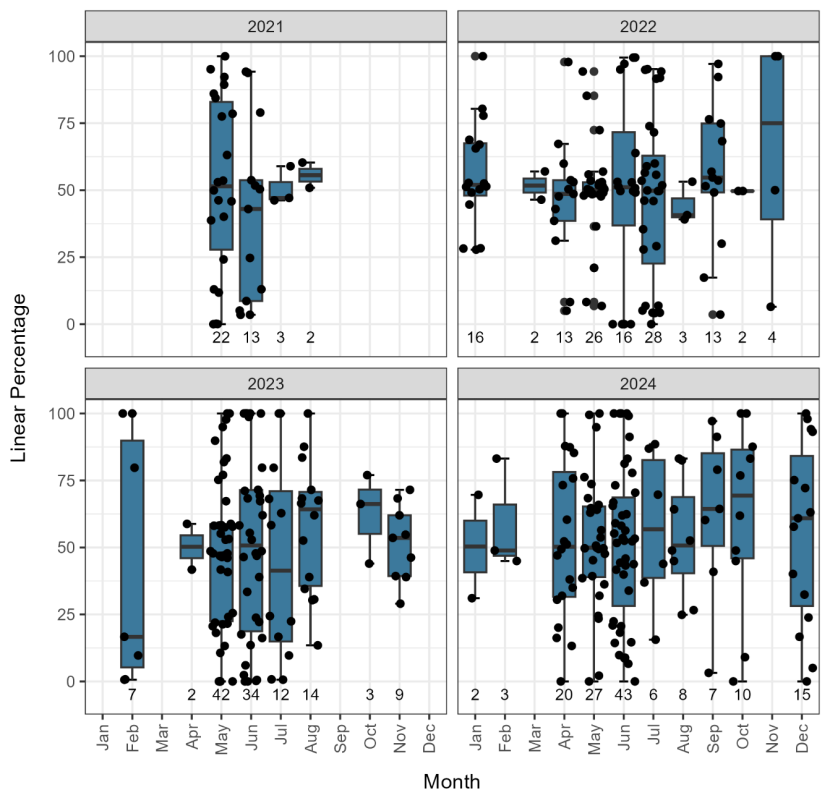
Figure 45. DVCs per month by percentage distance along the associated section for the M8 DBFO from 2021 to 2024.
Click for a full description
Four box and whisker plots showing the distribution of DVC locations reported by the M8 DBFO in each month. DVCs are associated with trunk road sections based upon attributes in the original data or where they are within 500 m. Each plot represents a different year: 2021 in the top left, 2022 in the top right, 2023 in the bottom left and 2024 in the bottom right. The location is expressed as a percentage along the full section length. Location is shown on the y-axis on each plot, which is titled ‘Linear percentage’ and ranges from 0% to 100%. Months from January to December are shown on the x-axis on each plot. Each vertically aligned box shows the 25th, 50th (median) and 75th percentile. Whiskers extend from the top and bottom of boxes and show the statistical minimum and maximum values. Individual incidents are shown as black dots; where these are beyond the ends of the whiskers they represent outliers. Well distributed data would show a box and distinct whisker, with a scattering of DVCs between 0% and 100%. Numbers below each box indicate the number of incidents per month. The charts show that the data are well distributed in all months.
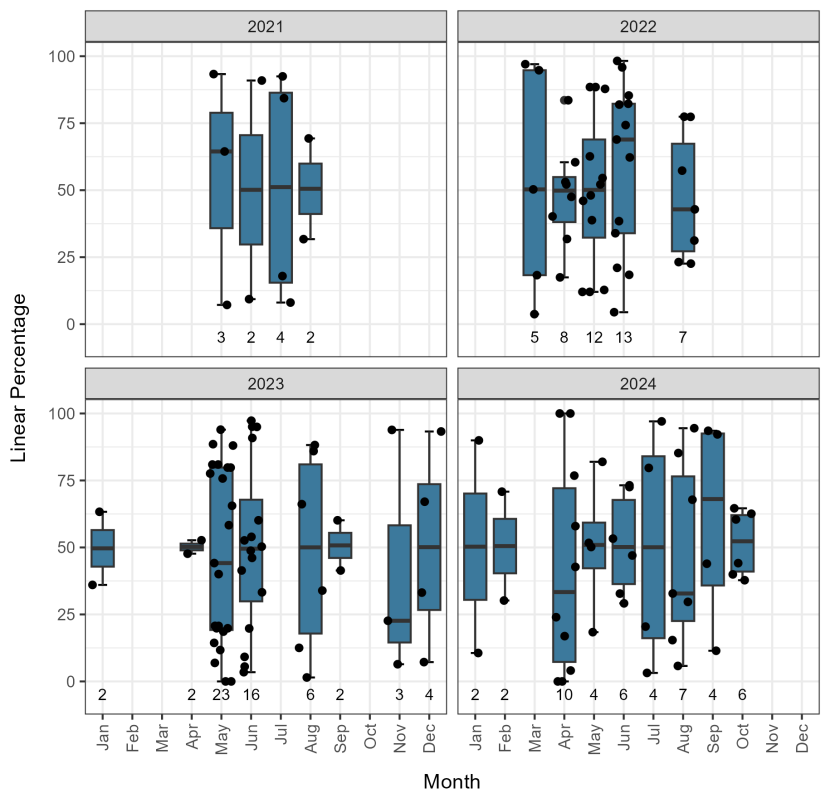
Figure 46. DVCs per month by percentage distance along the associated section for the Aberdeen Western Peripheral Route from 2021 to 2024.
Click for a full description
Four box and whisker plots showing the distribution of DVC locations reported by the Aberdeen Western Peripheral Route in each month. DVCs are associated with trunk road sections based upon attributes in the original data or where they are within 500 m. Each plot represents a different year: 2021 in the top left, 2022 in the top right, 2023 in the bottom left and 2024 in the bottom right. The location is expressed as a percentage along the full section length. Location is shown on the y-axis on each plot, which is titled ‘Linear percentage’ and ranges from 0% to 100%. Months from January to December are shown on the x-axis on each plot. Each vertically aligned box shows the 25th, 50th (median) and 75th percentile. Whiskers extend from the top and bottom of boxes and show the statistical minimum and maximum values. Individual incidents are shown as black dots; where these are beyond the ends of the whiskers they represent outliers. Well distributed data would show a box and distinct whisker, with a scattering of DVCs between 0% and 100%. Numbers below each box indicate the number of incidents per month. The charts show that the data are well distributed in all months.
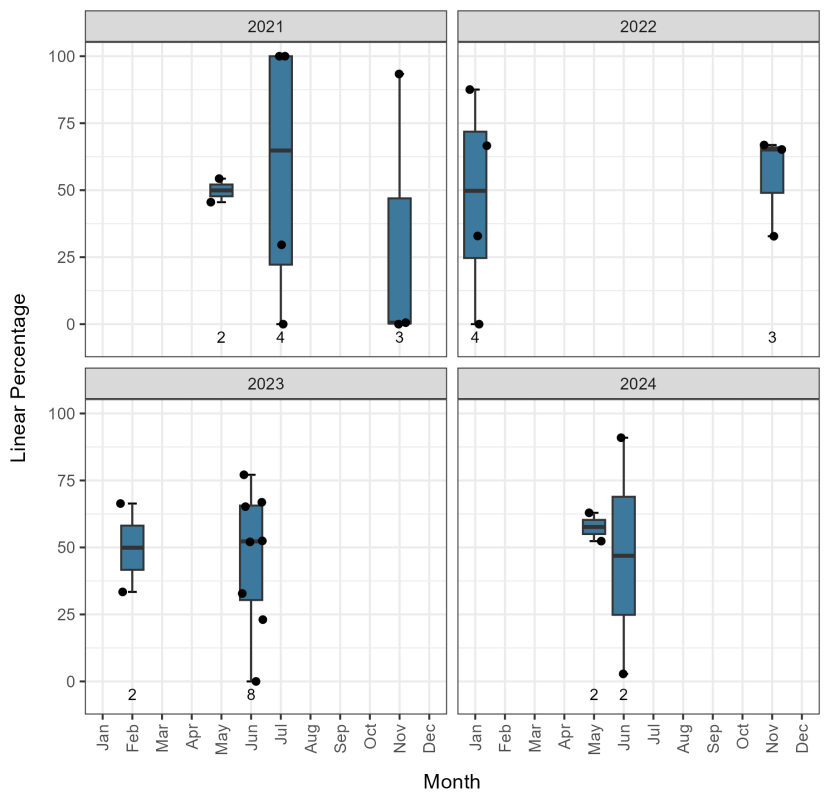
Figure 47. DVCs per month by percentage distance along the associated section for the M80 DBFO from 2021 to 2024.
Click for a full description
Four box and whisker plots showing the distribution of DVC locations reported by the M80 DBFO in each month. DVCs are associated with trunk road sections based upon attributes in the original data or where they are within 500 m. Each plot represents a different year: 2021 in the top left, 2022 in the top right, 2023 in the bottom left and 2024 in the bottom right. No DVCs were recorded in 2020. The location is expressed as a percentage along the full section length. Location is shown on the y-axis on each plot, which is titled ‘Linear percentage’ and ranges from 0% to 100%. Months from January to December are shown on the x-axis on each plot. Each vertically aligned box shows the 25th, 50th (median) and 75th percentile. Whiskers extend from the top and bottom of boxes and show the statistical minimum and maximum values. Individual incidents are shown as black dots; where these are beyond the ends of the whiskers they represent outliers. Well distributed data would show a box and distinct whisker, with a scattering of DVCs between 0% and 100%. Numbers below each box indicate the number of incidents per month. The charts show that the data are generally well distributed in all months.
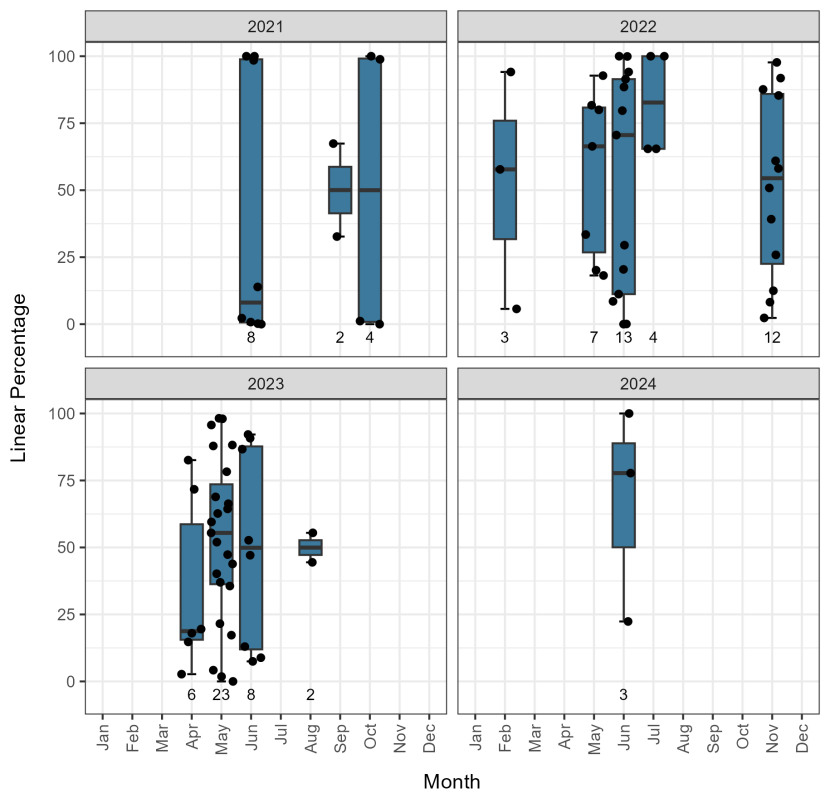
Figure 48. DVCs per month by percentage distance along the associated section for the M77 DBFO from 2021 to 2024.
Click for a full description
Four box and whisker plots showing the distribution of DVC locations reported by the M77 in each month. DVCs are associated with trunk road sections based upon attributes in the original data or where they are within 500 m. Each plot represents a different year: 2021 in the top left, 2022 in the top right, 2023 in the bottom left and 2024 in the bottom right. The location is expressed as a percentage along the full section length. Location is shown on the y-axis on each plot, which is titled ‘Linear percentage’ and ranges from 0% to 100%. Months from January to December are shown on the x-axis on each plot. Each vertically aligned box shows the 25th, 50th (median) and 75th percentile. Whiskers extend from the top and bottom of boxes and show the statistical minimum and maximum values. Individual incidents are shown as black dots; where these are beyond the ends of the whiskers they represent outliers. Well distributed data would show a box and distinct whisker, with a scattering of DVCs between 0% and 100%. Numbers below each box indicate the number of incidents per month. The charts show that the data are well distributed in all months.
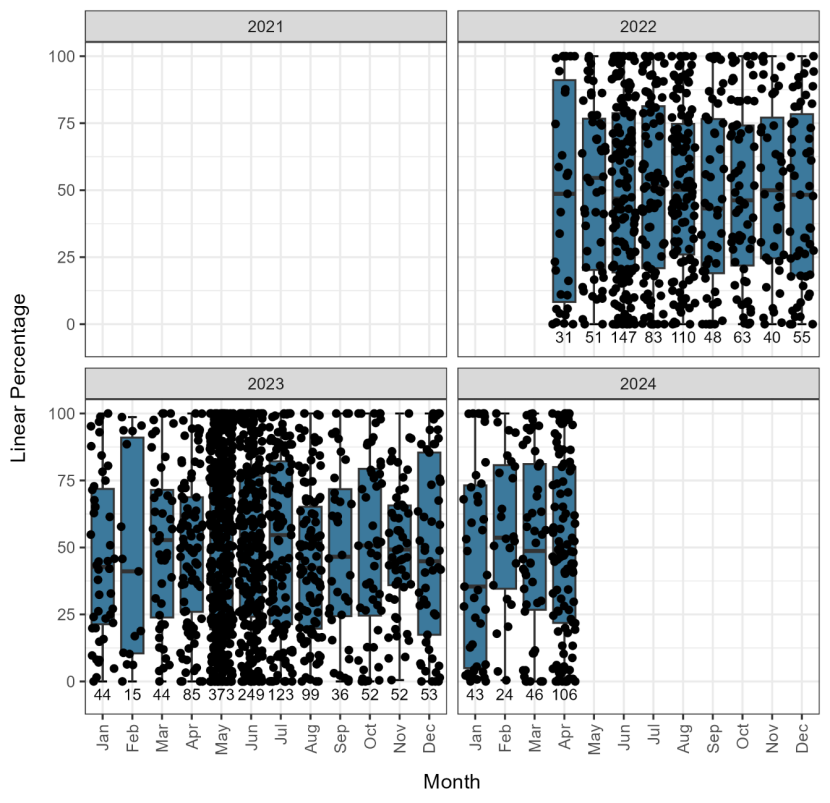
Figure 49. DVCs per month by percentage distance along the associated section for data extracted from Transport Scotland’s AMPS database from 2021 to 2024.
Click for a full description
Four box and whisker plots showing the distribution of DVC locations in data extracted from Transport Scotland’s AMPS database in each month. DVCs are associated with trunk road sections based upon attributes in the original data or where they are within 500 m. Each plot represents a different year: 2021 in the top left, 2022 in the top right, 2023 in the bottom left and 2024 in the bottom right. The location is expressed as a percentage along the full section length. AMPS data were only available for April 2022 to April 2024. Location is shown on the y-axis on each plot, which is titled ‘Linear percentage’ and ranges from 0% to 100%. Months from January to December are shown on the x-axis on each plot. Each vertically aligned box shows the 25th, 50th (median) and 75th percentile. Whiskers extend from the top and bottom of boxes and show the statistical minimum and maximum values. Individual incidents are shown as black dots; where these are beyond the ends of the whiskers they represent outliers. Well distributed data would show a box and distinct whisker, with a scattering of DVCs between 0% and 100%. Numbers below each box indicate the number of incidents per month. The charts show that the data are well distributed in all months.
Annex 3: Maps of DVC hotspots for 2022–2024
The following maps (Figures 50 to 63) show the locations of the top 10 DVC hotspots based on data for 2022 to 2024 and using the PostgreSQL/PostGIS function described in Lush and Lush (2023). Hotspots were identified based on the normalised risk index only. The highest 20 hotspots of any length and highest 20 of 500 m length were combined. These were manually reviewed to identify the 10 most severe hotspots that appear to be based on accurately located DVC records (Table 24). The review considered the number and reliability of the implicated DVC, giving priority to locations where hotspots were clustered and longer hotspots with the highest normalised risk index. Maps are shown for each trunk road section with high normalised risk index, so hotspots identified based on more than one road section have multiple maps. The locations of ‘wild animals likely to be in road ahead’ signs and fixed VMS are shown, with an arrow indicating the direction in which they are facing, where recorded.
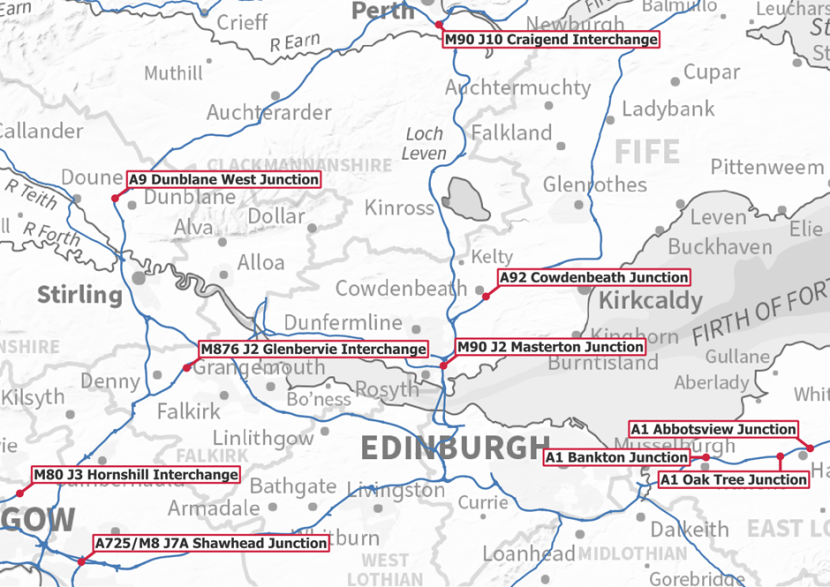
Figure 50. The locations of the top ten Deer Vehicle Collision hotspots in 2022-2024.
Click for a full description
Map showing the locations of the top ten Deer Vehicle Collision hotspots in 2022-2024. Each hotspot is shown as a red dot with an associated label showing the hotspot name used in the subsections of this Annex. Other parts of the trunk road network are shown in blue. The map extends from Callander in the west to Haddington in the east and Loanhead in the south to Perth in the north.
A1 Oak Tree Junction
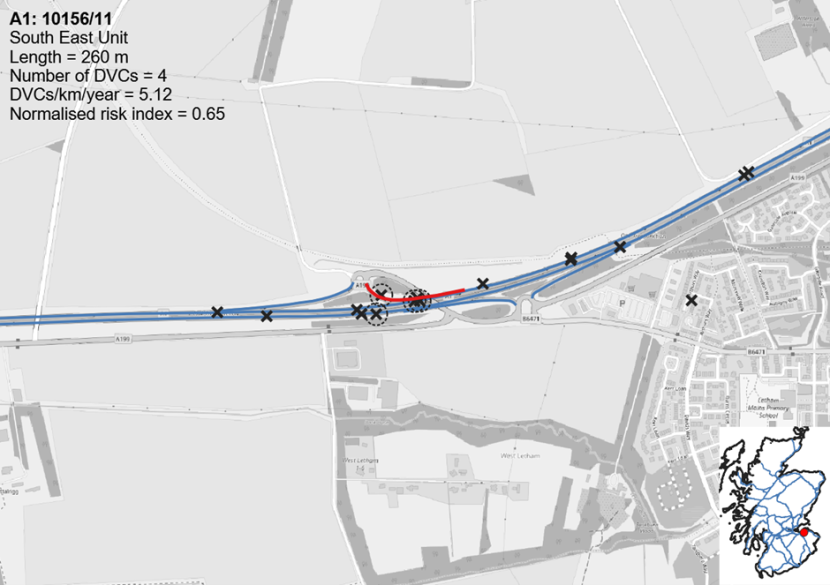
Figure 51. The Deer Vehicle Collision hotspot on the A1 at Oak Tree Junction.
Click for a full description
Map showing the DVC hotspot on the A1 at Oak Tree Junction in red. Other parts of the trunk road network are shown in blue. The original recorded locations of the DVC records from 2022 to 2024 are shown as black crosses, with those used to identify the hotspot circled, to allow interpretation of the validity of the hotspot. Note that DVCs can share a single location, in which case they may appear as a single DVC on the maps. The scale used is 1:10,000.
The following information is also shown:
Trunk road number and section: A1: 10156/11
Trunk road operating contract: South East Unit
Hotspot length = 260 m
Number of DVCs associated with the hotspot = 4
DVCs per kilometre per year = 5.12
Normalised risk index = 0.65
A1 Bankton Junction
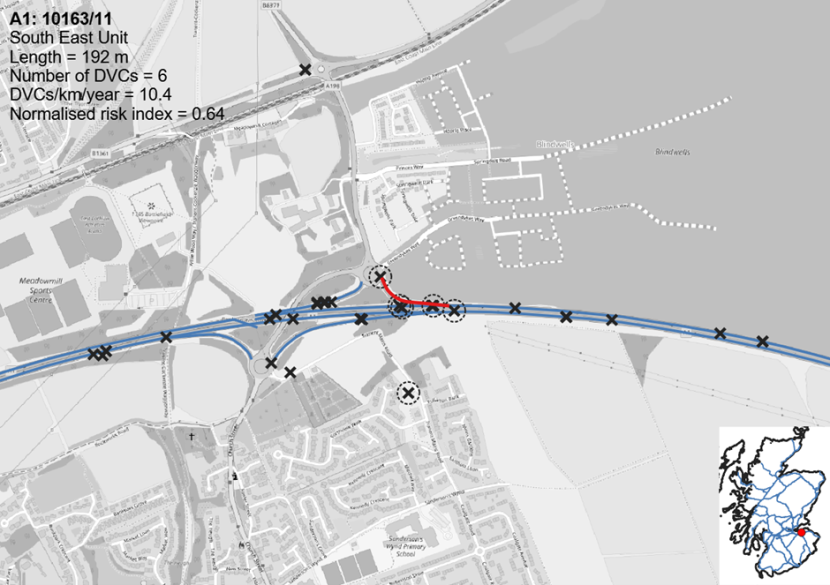
Figure 52. The Deer Vehicle Collision hotspot on the A78 at Bankton Junction.
Click for a full description
Map showing the DVC hotspot on the A78 at Bankton Junction in red. Other parts of the trunk road network are shown in blue. The original recorded locations of the DVC records from 2022 to 2024 are shown as black crosses, with those used to identify the hotspot circled, to allow interpretation of the validity of the hotspot. Note that DVCs can share a single location, in which case they may appear as a single DVC on the maps. The scale used is 1:10,000.
The following information is also shown:
Trunk road number and section: A1: 10163/11
Trunk road operating contract: South East Unit
Hotspot length = 192 m
Number of DVCs associated with the hotspot = 6
DVCs per kilometre per year = 10.4
Normalised risk index = 0.64
A1 Abbotsview Junction
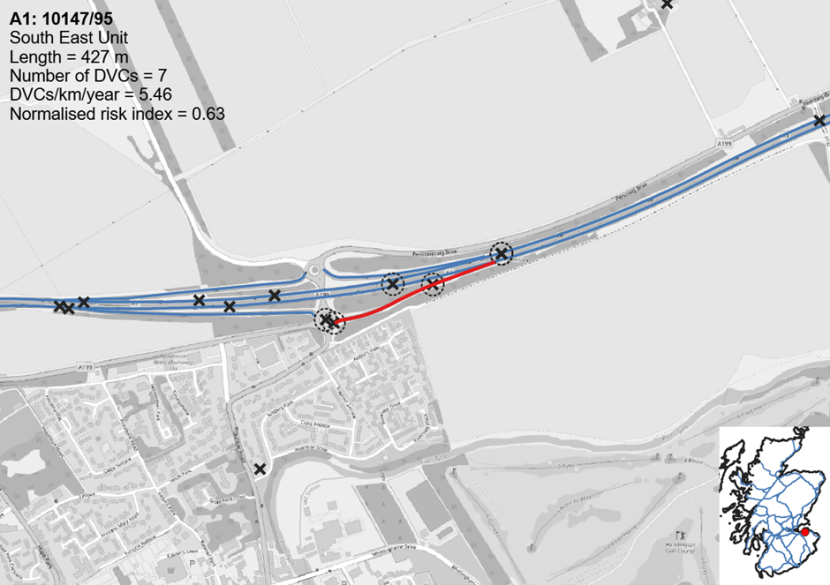
Figure 53. The Deer Vehicle Collision hotspot on the A1 at Abbotsview Junction.
Click for a full description
Map showing the DVC hotspot on the A1 at Abbotsview Junction in red. Other parts of the trunk road network are shown in blue. The original recorded locations of the DVC records from 2022 to 2024 are shown as black crosses, with those used to identify the hotspot circled, to allow interpretation of the validity of the hotspot. Note that DVCs can share a single location, in which case they may appear as a single DVC on the maps. The scale used is 1:10,000.
The following information is also shown:
Trunk road number and section: A1: 10147/95
Trunk road operating contract: South East Unit
Hotspot length = 427 m
Number of DVCs associated with the hotspot = 7
DVCs per kilometre per year = 5.46
Normalised risk index = 0.63
A725/M8 J7A Shawhead Junction
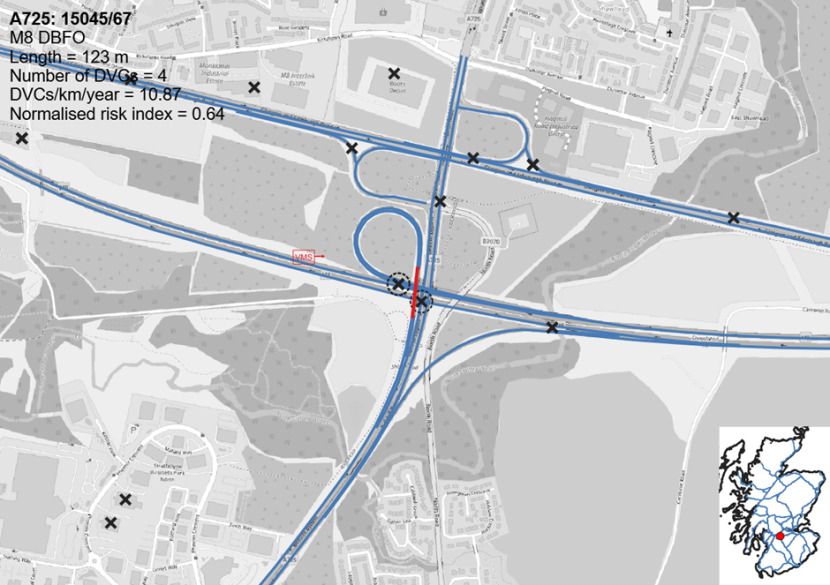
Figure 54. The Deer Vehicle Collision hotspot on the A725 at the M8 J7A Shawhead Junction.
Click for a full description
Map showing the DVC hotspot on the A725 at the M8 J7A Shawhead Junction in red. Other parts of the trunk road network are shown in blue. The original recorded locations of the DVC records from 2022 to 2024 are shown as black crosses, with those used to identify the hotspot circled, to allow interpretation of the validity of the hotspot. Note that DVCs can share a single location, in which case they may appear as a single DVC on the maps. The scale used is 1:10,000.
The following information is also shown:
Trunk road number and section: A725: 15045/67
Trunk road operating contract: M8 DBFO
Hotspot length = 123 m
Number of DVCs associated with the hotspot = 4
DVCs per kilometre per year = 10.87
Normalised risk index = 0.64
A9 Dunblane West Junction
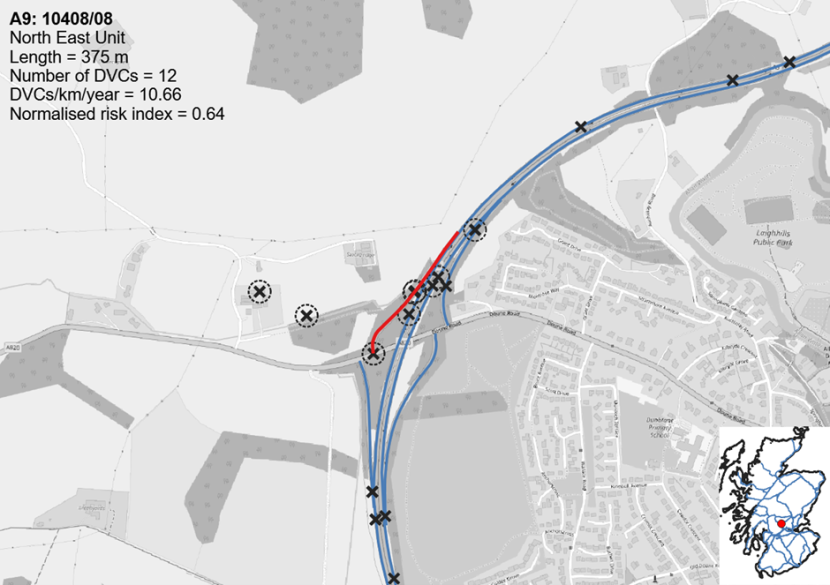
Figure 55. The Deer Vehicle Collision hotspot on the A9 at the Dunblane West Junction.
Click for a full description
Map showing the DVC hotspot on the A9 at the Dunblane West Junction in red. Other parts of the trunk road network are shown in blue. The original recorded locations of the DVC records from 2022 to 2024 are shown as black crosses, with those used to identify the hotspot circled, to allow interpretation of the validity of the hotspot. Note that DVCs can share a single location, in which case they may appear as a single DVC on the maps. The scale used is 1:10,000.
The following information is also shown:
Trunk road number and section: A9: 10408/08
Trunk road operating contract: North East Unit
Hotspot length = 375 m
Number of DVCs associated with the hotspot = 12
DVCs per kilometre per year = 10.66
Normalised risk index = 0.64
A92 Cowdenbeath Junction
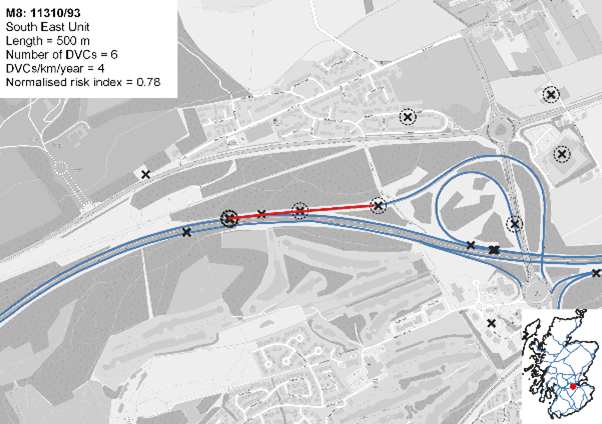
Figure 56. The Deer Vehicle Collision hotspot on the A92 at Cowdenbeath Junction.
Click for a full description
Map showing the DVC hotspot on the A92 at Cowdenbeath Junction in red. Other parts of the trunk road network are shown in blue. The original recorded locations of the DVC records from 2022 to 2024 are shown as black crosses, with those used to identify the hotspot circled, to allow interpretation of the validity of the hotspot. Note that DVCs can share a single location, in which case they may appear as a single DVC on the maps. The scale used is 1:10,000.
The following information is also shown:
Trunk road number and section: A92: 14806/07
Trunk road operating contract: North East Unit
Hotspot length = 333 m
Number of DVCs associated with the hotspot = 13
DVCs per kilometre per year = 13.02
Normalised risk index = 0.62
M80 J3 Hornshill Interchange
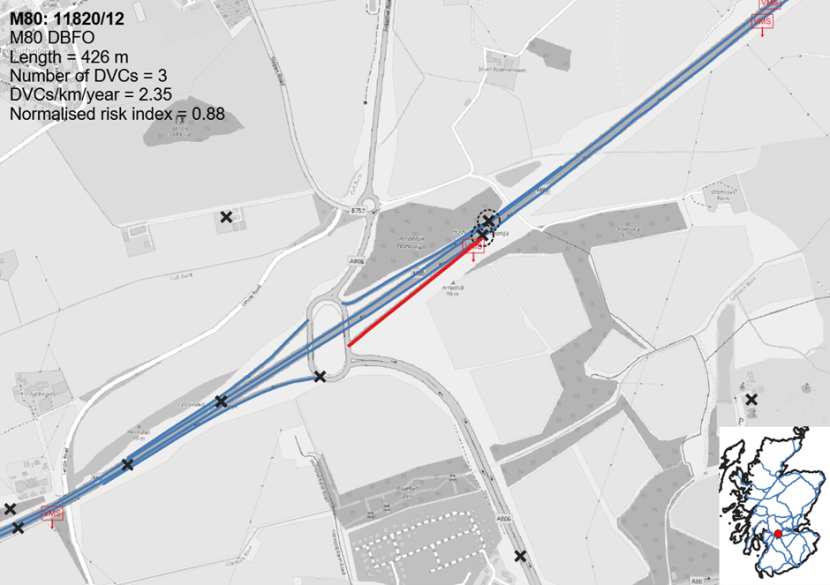
Figure 57. The Deer Vehicle Collision hotspot on the M80 J3 Hornshill Interchange.
Click for a full description
Map showing the DVC hotspot on the M80 J3 Hornshill Interchange in red. Other parts of the trunk road network are shown in blue. The original recorded locations of the DVC records from 2022 to 2024 are shown as black crosses, with those used to identify the hotspot circled, to allow interpretation of the validity of the hotspot. Note that DVCs can share a single location, in which case they may appear as a single DVC on the maps. The scale used is 1:10,000.
The following information is also shown:
Trunk road number and section: M80: 11820/12
Trunk road operating contract: M80 DBFO
Hotspot length = 426 m
Number of DVCs associated with the hotspot = 3
DVCs per kilometre per year = 2.35
Normalised risk index = 0.88
M876 J2 Glenbervie Interchange
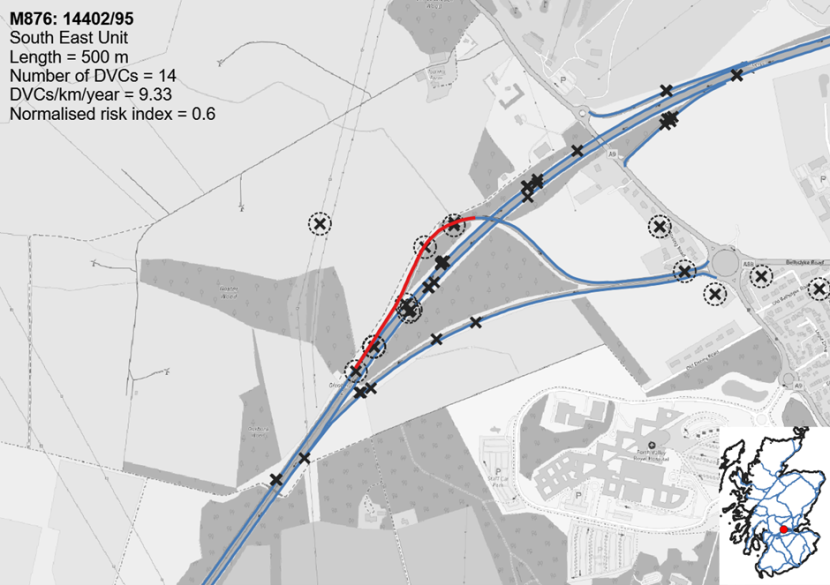
Figure 58. One of three Deer Vehicle Collision hotspots on the M876 J2 Glenbervie Interchange.
Click for a full description
Map showing one of three Deer Vehicle Collision hotspots on the M876 J2 Glenbervie Interchange in red. Other parts of the trunk road network are shown in blue. The original recorded locations of the DVC records from 2022 to 2024 are shown as black crosses, with those used to identify the hotspot circled, to allow interpretation of the validity of the hotspot. Note that DVCs can share a single location, in which case they may appear as a single DVC on the maps. The scale used is 1:10,000.
The following information is also shown:
Trunk road number and section: M876: 14402/95
Trunk road operating contract: South East Unit
Hotspot length = 500 m
Number of DVCs associated with the hotspot = 14
DVCs per kilometre per year = 9.33
Normalised risk index = 0.6
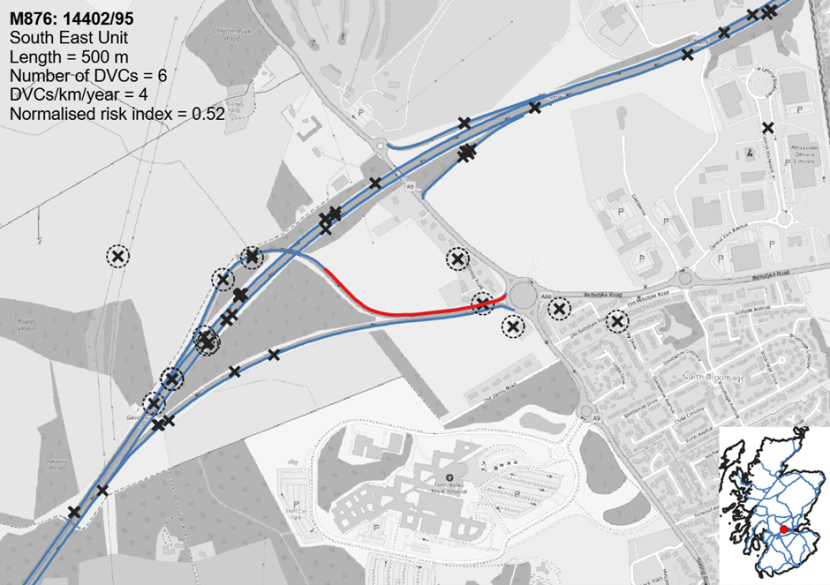
Figure 59. One of three Deer Vehicle Collision hotspots on the M876 J2 Glenbervie Interchange.
Click for a full description
Map showing one of three Deer Vehicle Collision hotspots on the M876 J2 Glenbervie Interchange in red. Other parts of the trunk road network are shown in blue. The original recorded locations of the DVC records from 2022 to 2024 are shown as black crosses, with those used to identify the hotspot circled, to allow interpretation of the validity of the hotspot. Note that DVCs can share a single location, in which case they may appear as a single DVC on the maps. The scale used is 1:10,000.
The following information is also shown:
Trunk road number and section: M876: 14402/95
Trunk road operating contract: South East Unit
Hotspot length = 500 m
Number of DVCs associated with the hotspot = 6
DVCs per kilometre per year = 4
Normalised risk index = 0.52
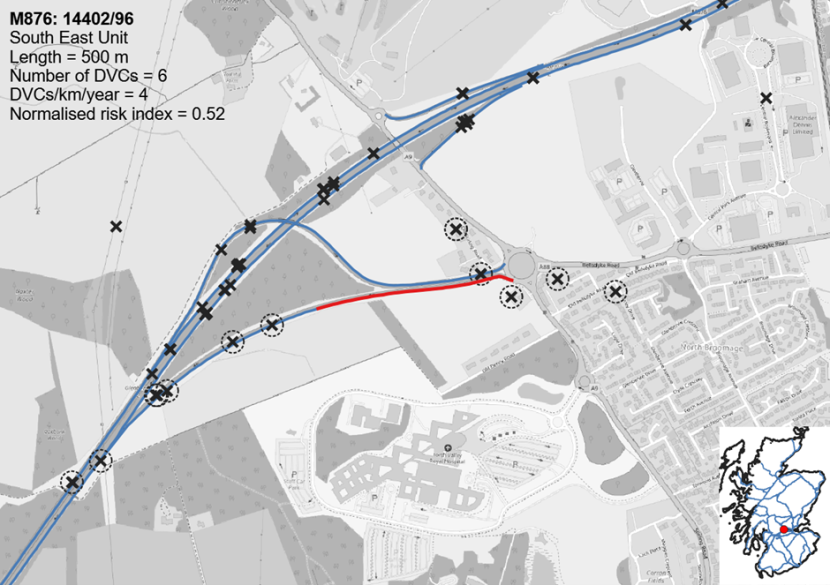
Figure 60. One of three Deer Vehicle Collision hotspots on the M876 J2 Glenbervie Interchange.
Click for a full description
Map showing one of three Deer Vehicle Collision hotspots on the M876 J2 Glenbervie Interchange in red. Other parts of the trunk road network are shown in blue. The original recorded locations of the DVC records from 2022 to 2024 are shown as black crosses, with those used to identify the hotspot circled, to allow interpretation of the validity of the hotspot. Note that DVCs can share a single location, in which case they may appear as a single DVC on the maps. The scale used is 1:10,000.
The following information is also shown:
Trunk road number and section: M876: 14402/96
Trunk road operating contract: South East Unit
Hotspot length = 500 m
Number of DVCs associated with the hotspot = 6
DVCs per kilometre per year = 4
Normalised risk index = 0.52
M90 J2 Masterton Junction
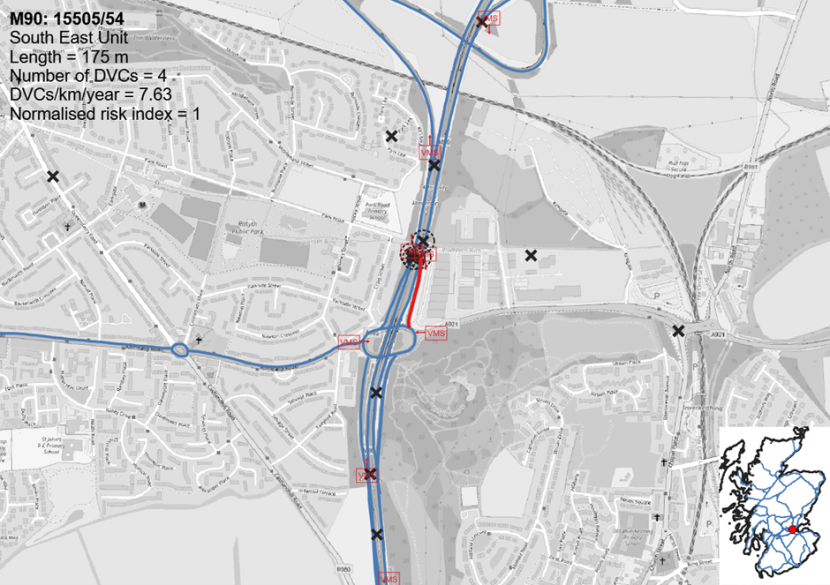
Figure 61. The Deer Vehicle Collision hotspot on the M90 J2 Masterton Junction.
Click for a full description
Map showing the DVC hotspot on the M90 J2 Masterton Junction in red. Other parts of the trunk road network are shown in blue. The original recorded locations of the DVC records from 2022 to 2024 are shown as black crosses, with those used to identify the hotspot circled, to allow interpretation of the validity of the hotspot. Note that DVCs can share a single location, in which case they may appear as a single DVC on the maps. The scale used is 1:10,000.
The following information is also shown:
Trunk road number and section: M90: 15505/54
Trunk road operating contract: South East Unit
Hotspot length = 175 m
Number of DVCs associated with the hotspot = 4
DVCs per kilometre per year = 7.63
Normalised risk index = 1
M90 J10 Craigend Interchange
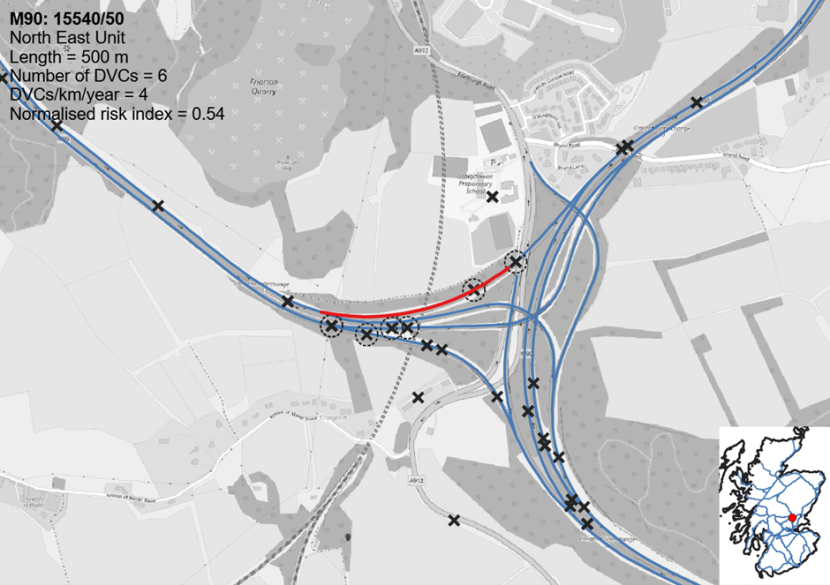
Figure 62. One of two Deer Vehicle Collision hotspots on the M90 J10 Craigend Interchange.
Click for a full description
Map showing one of two Deer Vehicle Collision hotspots on the M90 J10 Craigend Interchange in red. Other parts of the trunk road network are shown in blue. The original recorded locations of the DVC records from 2022 to 2024 are shown as black crosses, with those used to identify the hotspot circled, to allow interpretation of the validity of the hotspot. Note that DVCs can share a single location, in which case they may appear as a single DVC on the maps. The scale used is 1:10,000.
The following information is also shown:
Trunk road number and section: M90: 15540/50
Trunk road operating contract: North East Unit
Hotspot length = 500 m
Number of DVCs associated with the hotspot = 6
DVCs per kilometre per year = 4
Normalised risk index = 0.54

Figure 63. One of two Deer Vehicle Collision hotspots on the M90 J10 Craigend Interchange.
Click for a full description
Map showing one of two Deer Vehicle Collision hotspots on the M90 J10 Craigend Interchange in red. Other parts of the trunk road network are shown in blue. The original recorded locations of the DVC records from 2022 to 2024 are shown as black crosses, with those used to identify the hotspot circled, to allow interpretation of the validity of the hotspot. Note that DVCs can share a single location, in which case they may appear as a single DVC on the maps. The scale used is 1:10,000.
The following information is also shown:
Trunk road number and section: M90: 15540/10
Trunk road operating contract: North East Unit
Hotspot length = 500 m
Number of DVCs associated with the hotspot = 6
DVCs per kilometre per year = 4
Normalised risk index = 0.53
Annex 4: Deer Management Priority Area DVC maps
Figures 64 to 86 show the average number of DVCs per kilometre of road per year in 5 km² hexagonal cells in each of the Deer Management Priority Areas in Scotland (as known at the time of the analysis). Two five-year periods are shown: 2015–2019 and 2020–2024.
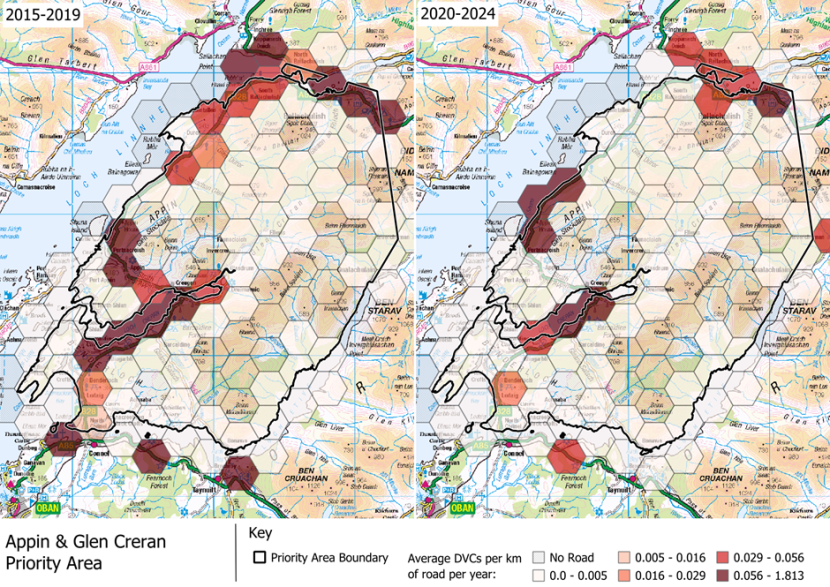
Figure 64. DVCs per km of road per year in Appin & Glen Creran DMG area, within Alliance for Scotland’s Rainforest Indicative Areas Deer Management Priority Area, comparing 2015–2019 & 2020–2024. Contains OS data © Crown copyright and database right 2025.
Click for a full description
Two maps showing the DVCs per kilometre of road per year in the Appin & Glen Creran Deer Management Group (DMG) area, which is within the Alliance for Scotland’s Rainforest Indicative Areas Deer Management Priority Area. 2015–2019 is shown on the left and 2020–2024 is shown on the right. In each, the Appin & Glen Creran DMG boundary is shown as a black outline on a 1:250,000 Ordnance Survey base map. The average number of DVCs per kilometre of road is shown using hexagonal cells approximately 5 km² and shaded from white to dark red, with darker colours representing higher averages. Cells that do not contain roads are shaded using black stippling.
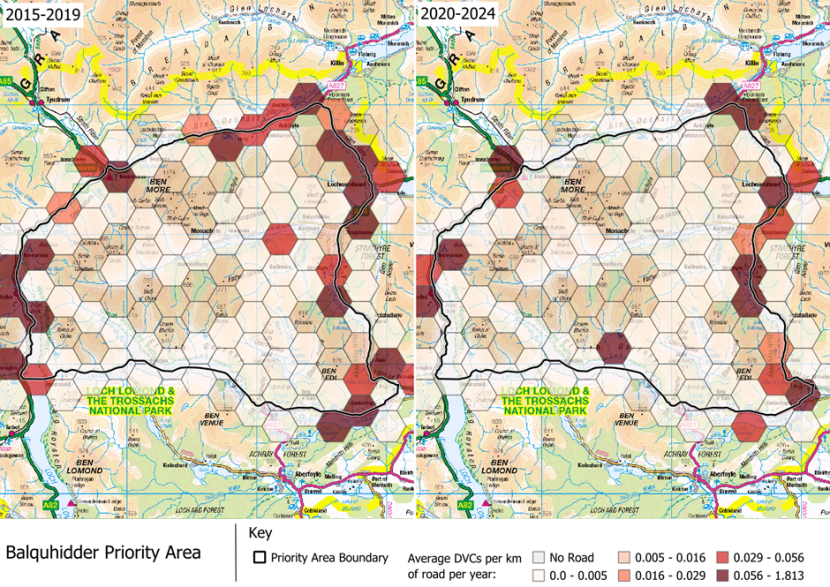
Figure 65. DVCs per km of road per year in Balquhidder Deer Management Group area, which is part of the ‘Deer Management Groups’ Deer Management Priority Area, comparing 2015–2019 and 2020–2024. Contains OS data © Crown copyright and database right 2025.
Click for a full description
Two maps showing the DVCs per kilometre of road per year in the Balquhidder Deer Management Group (DMG) area, which is part of the ‘Deer Management Groups’ Deer Management Priority Area. 2015–2019 is shown on the left and 2020–2024 is shown on the right. In each, the DMG boundary is shown as a black outline on a 1:250,000 Ordnance Survey base map. The average number of DVCs per kilometre of road is shown using hexagonal cells approximately 5 km² and shaded from white to dark red, with darker colours representing higher averages. Cells that do not contain roads are shaded using black stippling.
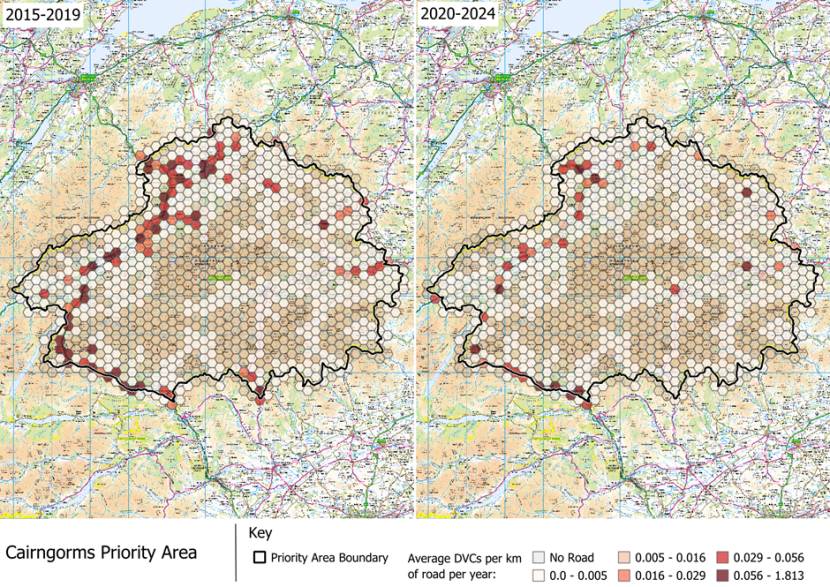
Figure 66. DVCs per kilometre of road per year in the Caingorms National Park Deer Management Priority Area, comparing 2015–2019 and 2020–2024. Contains OS data © Crown copyright and database right 2025.
Click for a full description
Two maps showing the DVCs per kilometre of road per year in the Caingorms National Park Deer Management Priority Area. 2015–2019 is shown on the left and 2020–2024 is shown on the right. In each, the Cairngorms National Park Deer Management Priority Area is shown as a black outline on a 1:250,000 Ordnance Survey base map. The average number of DVCs per kilometre of road is shown using hexagonal cells approximately 5 km² and shaded from white to dark red, with darker colours representing higher averages. Cells that do not contain roads are shaded using black stippling.
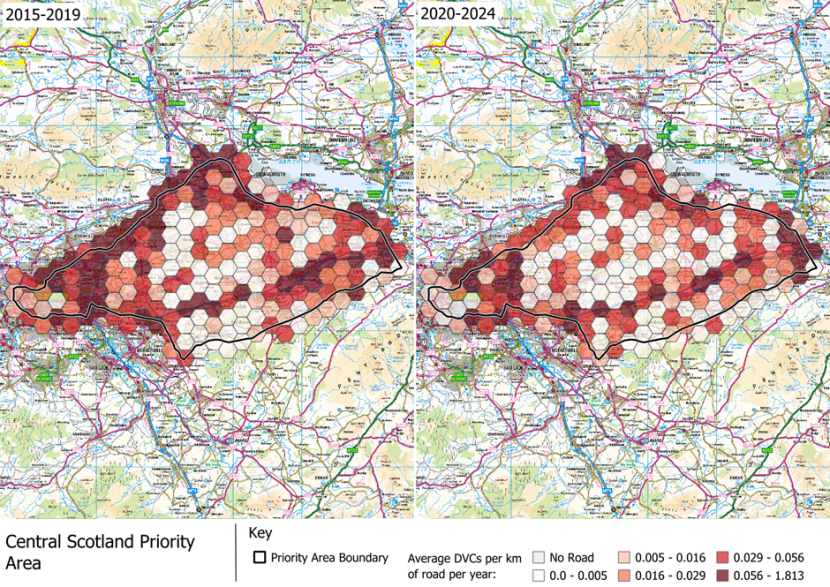
Figure 67. DVCs per kilometre of road per year in the Central Scotland Deer Management Priority Area, comparing 2015–2019 and 2020–2024. Contains OS data © Crown copyright and database right 2025.
Click for a full description
Two maps showing the DVCs per kilometre of road per year in the Central Scotland Deer Management Priority Area. 2015–2019 is shown on the left and 2020–2024 is shown on the right. In each, the Deer Management Priority Area is shown as a black outline on a 1:250,000 Ordnance Survey base map. The average number of DVCs per kilometre of road is shown using hexagonal cells approximately 5 km² and shaded from white to dark red, with darker colours representing higher averages. Cells that do not contain roads are shaded using black stippling.
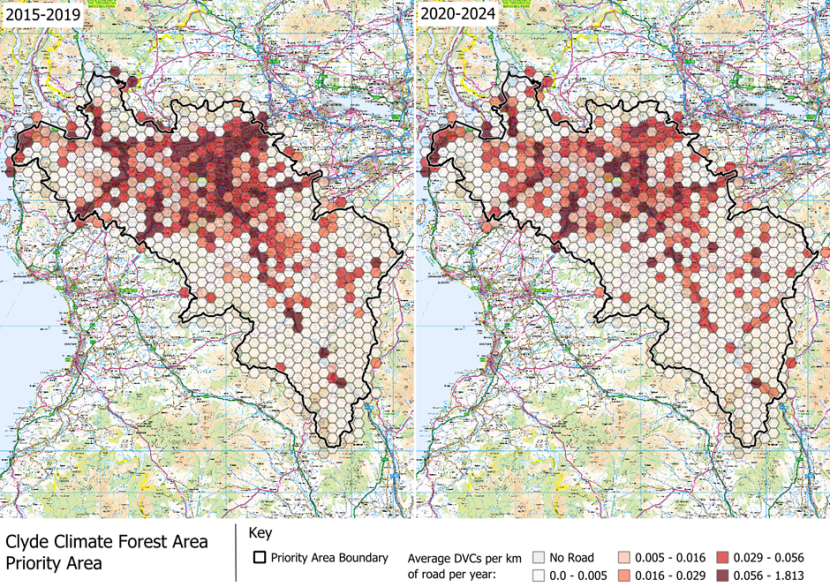
Figure 68. DVCs per kilometre of road per year in the Clyde Climate Forest Area Deer Management Priority Area, comparing 2015–2019 and 2020–2024. Contains OS data © Crown copyright and database right 2025.
Click for a full description
Two maps showing the DVCs per kilometre of road per year in the Clyde Climate Forest Area Deer Management Priority Area. 2015–2019 is shown on the left and 2020–2024 is shown on the right. In each, the Deer Management Priority Area is shown as a black outline on a 1:250,000 Ordnance Survey base map. The average number of DVCs per kilometre of road is shown using hexagonal cells approximately 5 km² and shaded from white to dark red, with darker colours representing higher averages. Cells that do not contain roads are shaded using black stippling.
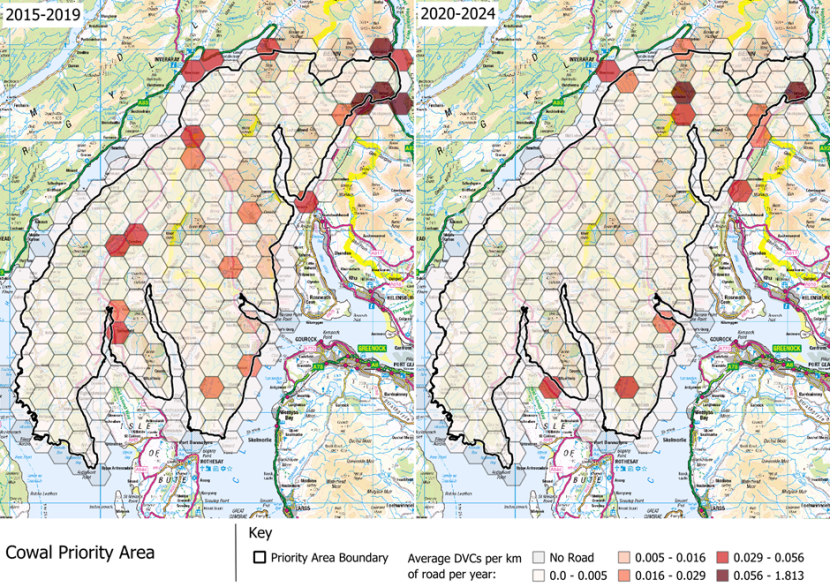
Figure 69. DVCs per kilometre of road per year in Cowal DMG area, within the Alliance for Scotland’s Rainforest Indicative Area Deer Management Priority Area, comparing 2015–2019 and 2020–2024. Contains OS data © Crown copyright and database right 2025.
Click for a full description
Two maps showing the DVCs per kilometre of road per year in the Cowal Deer Management Group (DMG) area, which is within the Alliance for Scotland’s Rainforest Indicative Area Deer Management Priority Area. 2015–2019 is shown on the left and 2020–2024 is shown on the right. In each, the DMG area is shown as a black outline on a 1:250,000 Ordnance Survey base map. The average number of DVCs per kilometre of road is shown using hexagonal cells approximately 5 km² and shaded from white to dark red, with darker colours representing higher averages. Cells that do not contain roads are shaded using black stippling.
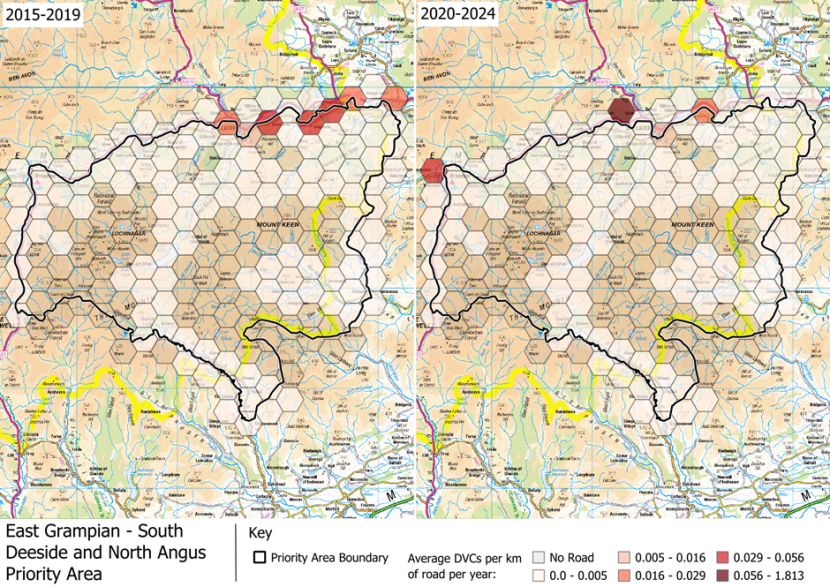
Figure 70. DVCs per km of road per year in East Grampian–South Deeside and North Angus DMG area, part of ‘Deer Management Groups’ Deer Management Priority Area, comparing 2015–2019 and 2020–2024. Contains OS data © Crown copyright and database right 2025.
Click for a full description
Two maps showing the DVCs per kilometre of road per year in the East Grampian – South Deeside and North Angus Deer Management Group (DMG) area, which is part of the ‘Deer Management Groups’ Deer Management Priority Area. 2015–2019 is shown on the left and 2020–2024 is shown on the right. In each, the DMG area is shown as a black outline on a 1:250,000 Ordnance Survey base map. The average number of DVCs per kilometre of road is shown using hexagonal cells approximately 5 km² and shaded from white to dark red, with darker colours representing higher averages. Cells that do not contain roads are shaded using black stippling.
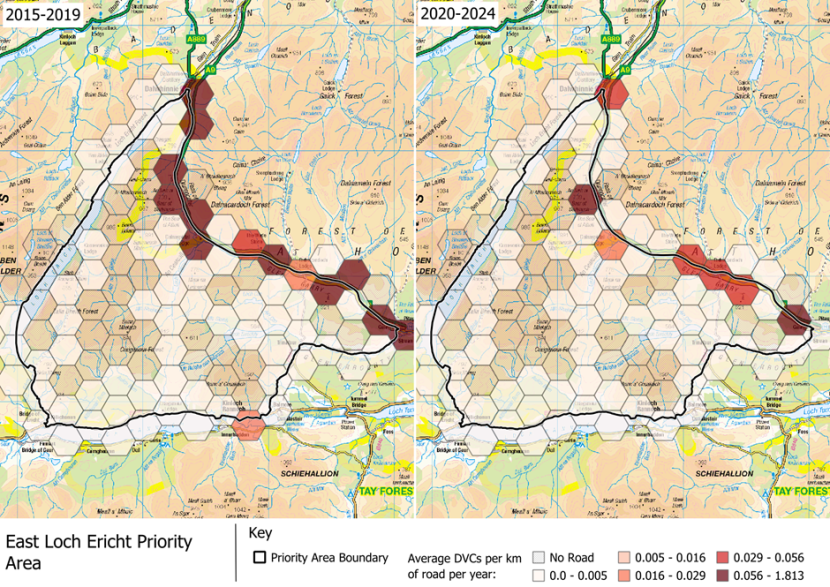
Figure 71. DVCs per kilometre of road per year in the East Loch Ericht DMG area, which is part of the ‘Deer Management Groups’ Deer Management Priority Area, comparing 2015–2019 and 2020–2024. Contains OS data © Crown copyright and database right 2025.
Click for a full description
Two maps showing the DVCs per kilometre of road per year in the East Loch Ericht Deer Management Group (DMG) area, which is part of the ‘Deer Management Groups’ Deer Management Priority Area. 2015–2019 is shown on the left and 2020–2024 is shown on the right. In each, the DMG Area is shown as a black outline on a 1:250,000 Ordnance Survey base map. The average number of DVCs per kilometre of road is shown using hexagonal cells approximately 5 km² and shaded from white to dark red, with darker colours representing higher averages. Cells that do not contain roads are shaded using black stippling.
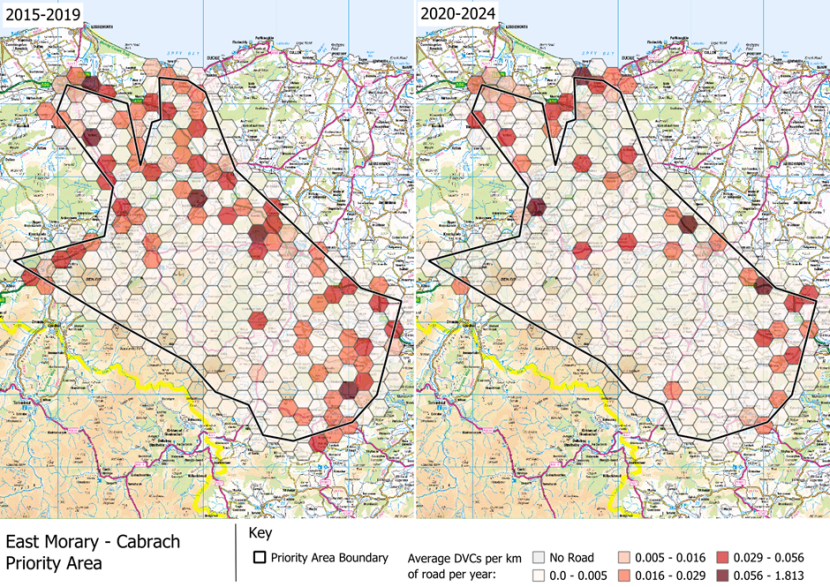
Figure 72. DVCs per kilometre of road per year in the East Moray – Cabrach area, which is part of the Priority Agricultural Areas Deer Management Priority Area, comparing 2015–2019 and 2020–2024. Contains OS data © Crown copyright and database right 2025.
Click for a full description
Two maps showing the DVCs per kilometre of road per year in the East Moray – Cabrach area, which is part of the Priority Agricultural Areas Deer Management Priority Area. 2015–2019 is shown on the left and 2020–2024 is shown on the right. In each, the East Moray – Cabrach area is shown as a black outline on a 1:250,000 Ordnance Survey base map. The average number of DVCs per kilometre of road is shown using hexagonal cells approximately 5 km² and shaded from white to dark red, with darker colours representing higher averages. Cells that do not contain roads are shaded using black stippling.
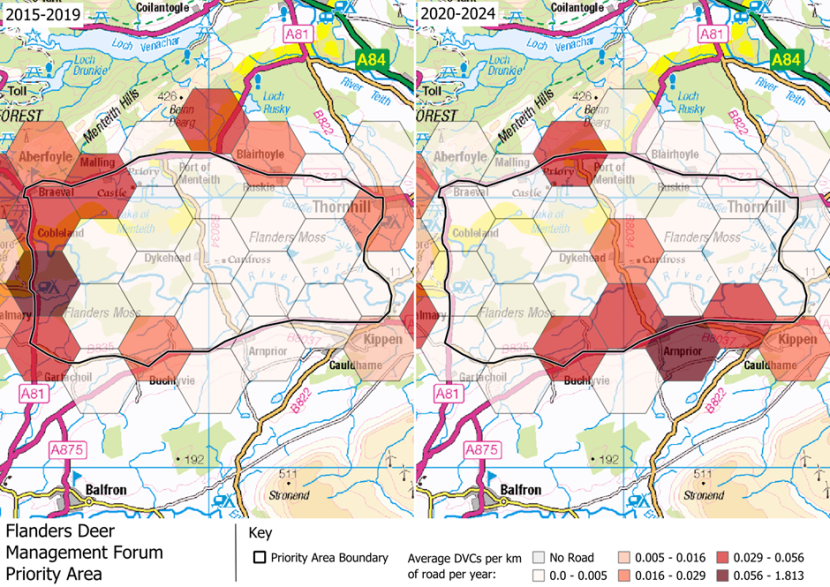
Figure 73. DVCs per kilometre of road per year in the Flanders Deer Management Forum area, part of the ‘Deer Management Groups’ Deer Management Priority Area, comparing 2015–2019 and 2020–2024. Contains OS data © Crown copyright and database right 2025.
Click for a full description
Two maps showing the DVCs per kilometre of road per year in the Flanders Deer Management Forum area, which is part of the ‘Deer Management Groups’ Deer Management Priority Area. 2015–2019 is shown on the left and 2020–2024 is shown on the right. In each, the Deer Management Forum area is shown as a black outline on a1:250,000 Ordnance Survey base map. The average number of DVCs per kilometre of road is shown using hexagonal cells approximately 5 km² and shaded from white to dark red, with darker colours representing higher averages. Cells that do not contain roads are shaded using black stippling.
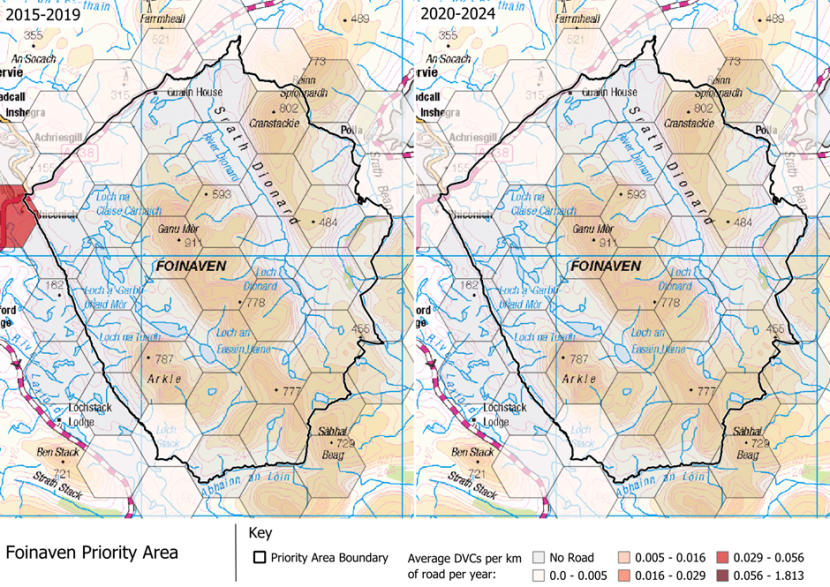
Figure 74. DVCs per kilometre of road per year in the Foinaven Special Area of Conservation Deer Management Priority Area, comparing 2015–2019 and 2020–2024. Contains OS data © Crown copyright and database right 2025.
Click for a full description
Two maps showing the DVCs per kilometre of road per year in the Foinaven Special Area of Conservation Deer Management Priority Area. 2015–2019 is shown on the left and 2020–2024 is shown on the right. In each, the Deer Management Priority Area is shown as a black outline on a 1:250,000 Ordnance Survey base map. The average number of DVCs per kilometre of road is shown using hexagonal cells approximately 5 km² and shaded from white to dark red, with darker colours representing higher averages. Cells that do not contain roads are shaded using black stippling.
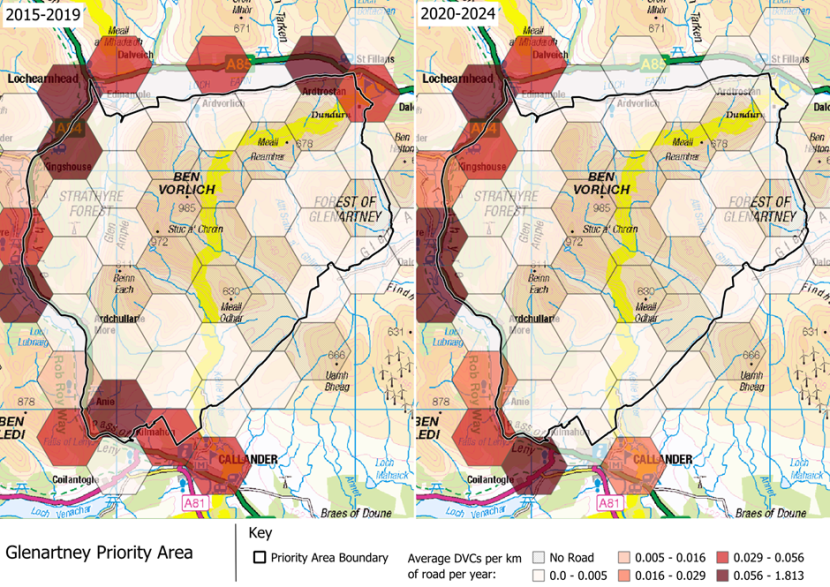
Figure 75. DVCs per kilometre of road per year in the Glenartney Deer Management Group area, part of the ‘Deer Management Groups’ Deer Management Priority Area, comparing 2015–2019 and 2020–2024. Contains OS data © Crown copyright and database right 2025.
Click for a full description
Two maps showing the DVCs per kilometre of road per year in the Glenartney Deer Management Group (DMG) area, which is part of the ‘Deer Management Groups’ Deer Management Priority Area. 2015–2019 is shown on the left and 2020–2024 is shown on the right. In each, the DMG area is shown as a black outline on a 1:250,000 Ordnance Survey base map. The average number of DVCs per kilometre of road is shown using hexagonal cells approximately 5 km² and shaded from white to dark red, with darker colours representing higher averages. Cells that do not contain roads are shaded using black stippling.
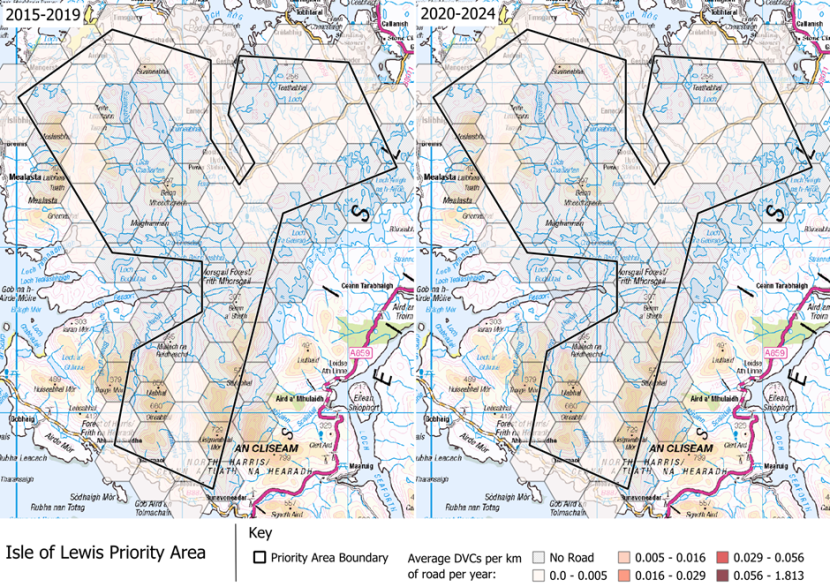
Figure 76. DVCs per kilometre of road per year in that part of the Isle of Lewis which is part of the Priority Agricultural Areas Deer Management Priority Area, comparing 2015–2019 and 2020–2024. Contains OS data © Crown copyright and database right 2025.
Click for a full description
Two maps showing the DVCs per kilometre of road per year in that part of the Isle of Lewis which is part of the Priority Agricultural Areas Deer Management Priority Area. 2015–2019 is shown on the left and 2020–2024 is shown on the right. In each, that part of the Isle of Lewis which is part of the Priority Agricultural Areas Deer Management Priority Area is shown as a black outline on a 1:250,000 Ordnance Survey base map. The average number of DVCs per kilometre of road is shown using hexagonal cells approximately 5 km² and shaded from white to dark red, with darker colours representing higher averages. Cells that do not contain roads are shaded using black stippling.
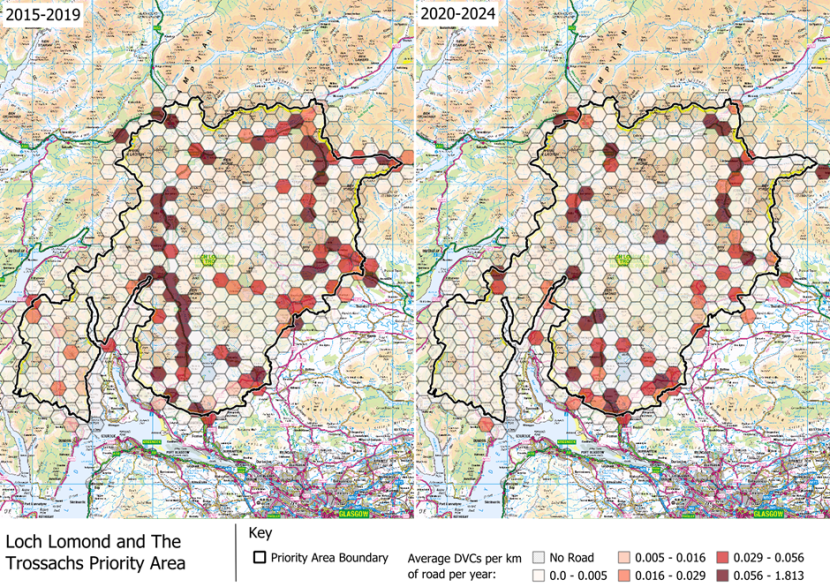
Figure 77. DVCs per kilometre of road per year in the Loch Lomond and The Trossachs National Park Deer Management Priority Area, comparing 2015–2019 and 2020–2024. Contains OS data © Crown copyright and database right 2025.
Click for a full description
Two maps showing the DVCs per kilometre of road per year in the Loch Lomond and The Trossachs National Park Deer Management Priority Area. 2015–2019 is shown on the left and 2020–2024 is shown on the right. In each, the Deer Management Priority Area is shown as a black outline on a 1:250,000 Ordnance Survey base map. The average number of DVCs per kilometre of road is shown using hexagonal cells approximately 5 km² and shaded from white to dark red, with darker colours representing higher averages. Cells that do not contain roads are shaded using black stippling.
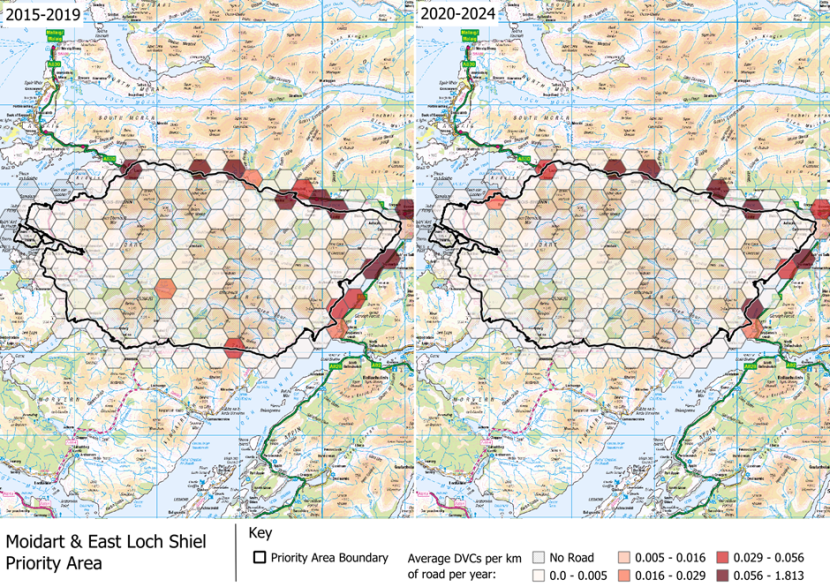
Figure 78. DVCs per km of road per year in Moidart & East Loch Shiel DMG area in Alliance for Scotland’s Rainforest Indicative Areas Deer Management Priority Area, comparing 2015–2019 & 2020–2024 Contains OS data © Crown copyright and database right 2025.
Click for a full description
Two maps showing the DVCs per kilometre of road per year in the Moidart & East Loch Shiel Deer Management Group (DMG) area, which is within the Alliance for Scotland’s Rainforest Indicative Areas Deer Management Priority Area. 2015–2019 is shown on the left and 2020–2024 is shown on the right. In each, the DMG area is shown as a black outline on a 1:250,000 Ordnance Survey base map. The average number of DVCs per kilometre of road is shown using hexagonal cells approximately 5 km² and shaded from white to dark red, with darker colours representing higher averages. Cells that do not contain roads are shaded using black stippling.
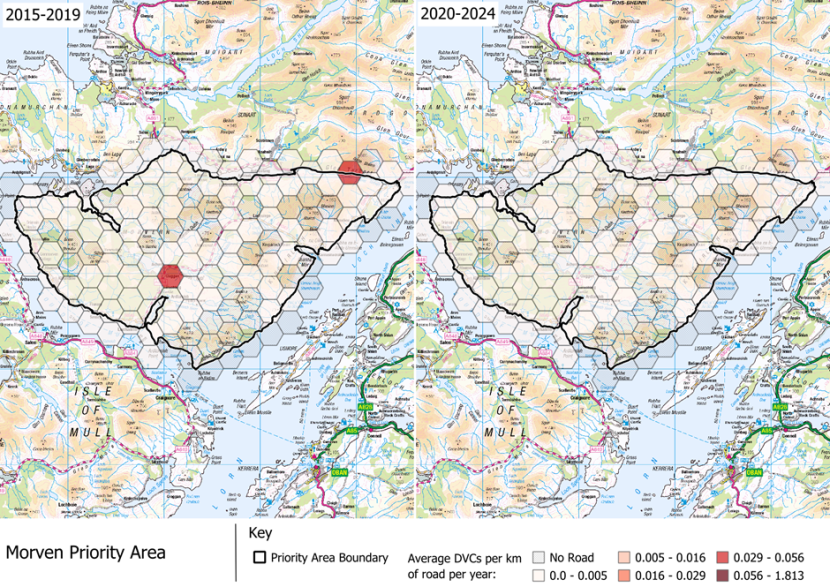
Figure 79. DVCs per kilometre of road per year in Morven DMG area, within the Alliance for Scotland’s Rainforest Indicative Areas Deer Management Priority Area, comparing 2015–2019 and 2020–2024. Contains OS data © Crown copyright and database right 2025.
Click for a full description
Two maps showing the DVCs per kilometre of road per year in the Morven Deer Management Group (DMG) area, which is within the Alliance for Scotland’s Rainforest Indicative Areas Deer Management Priority Area. 2015–2019 is shown on the left and 2020–2024 is shown on the right. In each, the DMG area is shown as a black outline on a 1:250,000 Ordnance Survey base map. The average number of DVCs per kilometre of road is shown using hexagonal cells approximately 5 km² and shaded from white to dark red, with darker colours representing higher averages. Cells that do not contain roads are shaded using black stippling.
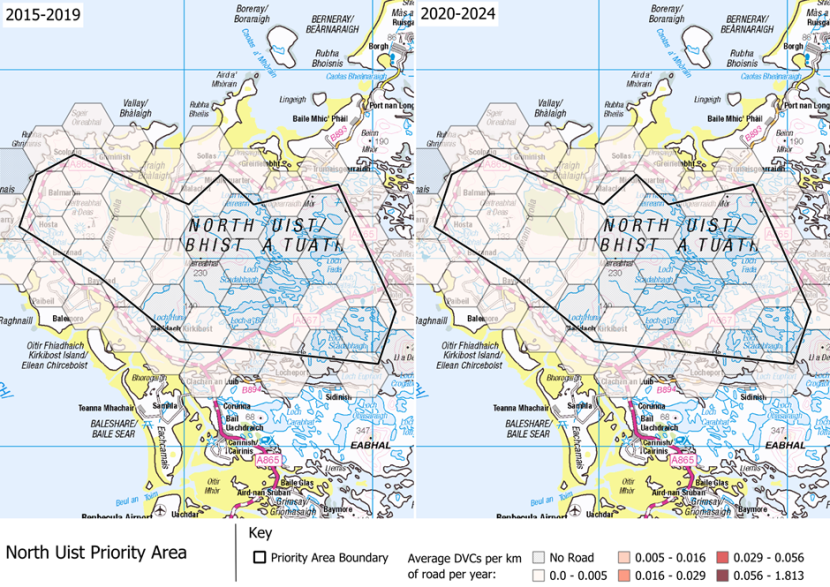
Figure 80. DVCs per kilometre of road per year in that part of North Uist which is part of the Priority Agricultural Areas Deer Management Priority Area, comparing 2015–2019 and 2020–2024. Contains OS data © Crown copyright and database right 2025.
Click for a full description
Two maps showing the DVCs per kilometre of road per year in that part of North Uist which is part of the Priority Agricultural Areas Deer Management Priority Area. 2015–2019 is shown on the left and 2020–2024 is shown on the right. In each, that part of North Uist which is part of the Priority Agricultural Areas is shown as a black outline on a 1:250,000 Ordnance Survey base map. The average number of DVCs per kilometre of road is shown using hexagonal cells approximately 5 km² and shaded from white to dark red, with darker colours representing higher averages. Cells that do not contain roads are shaded using black stippling.
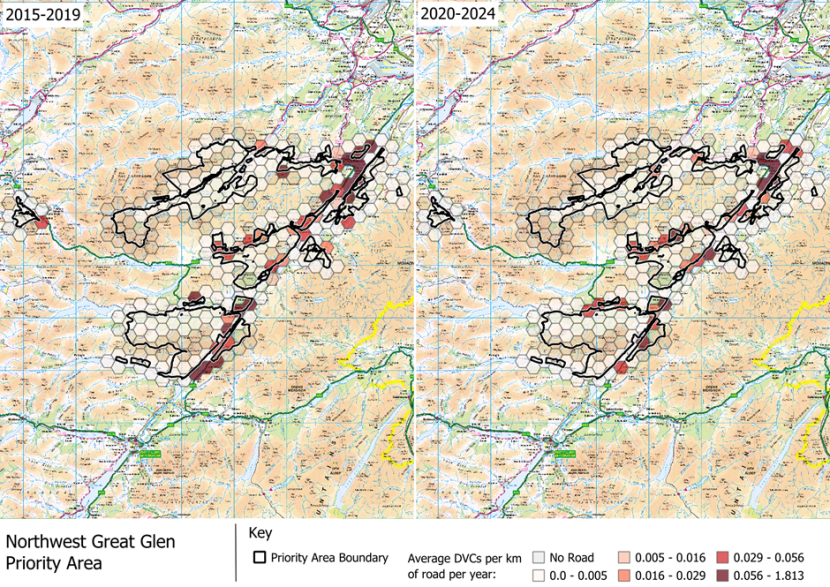
Figure 81. DVCs per km of road per year in Northwest Great Glen Forestry and Land Scotland & National Trust for Scotland properties Deer Management Priority Area, comparing 2015–2019 & 2020–2024. Contains OS data © Crown copyright and database right 2025.
Click for a full description
Two maps showing the DVCs per kilometre of road per year in the Northwest Great Glen Forestry and Land Scotland and National Trust for Scotland properties Deer Management Priority Area. 2015–2019 is shown on the left and 2020–2024 is shown on the right. In each, the Deer Management Priority Area is shown as a black outline on a 1:250,000 Ordnance Survey base map. The average number of DVCs per kilometre of road is shown using hexagonal cells approximately 5 km² and shaded from white to dark red, with darker colours representing higher averages. Cells that do not contain roads are shaded using black stippling.
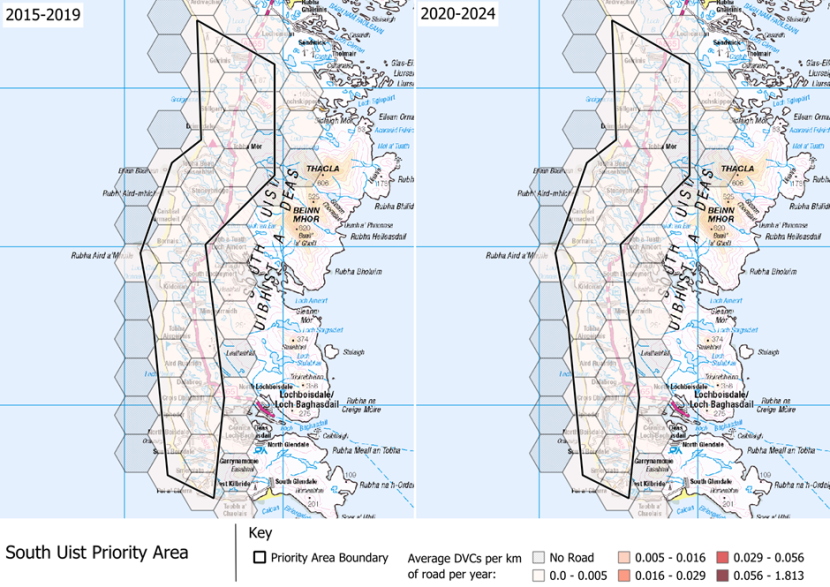
Figure 82. DVCs per kilometre of road per year in that part of South Uist which is part of the Priority Agricultural Areas Deer Management Priority Area, comparing 2015–2019 and 2020–2024. Contains OS data © Crown copyright and database right 2025.
Click for a full description
Two maps showing the DVCs per kilometre of road per year in that part of South Uist which is part of the Priority Agricultural Areas Deer Management Priority Area. 2015–2019 is shown on the left and 2020–2024 is shown on the right. In each, that part of South Uist which is part of the Priority Agricultural Areas Deer Management Priority Area is shown as a black outline on a 1:250,000 Ordnance Survey base map. The average number of DVCs per kilometre of road is shown using hexagonal cells approximately 5 km² and shaded from white to dark red, with darker colours representing higher averages. Cells that do not contain roads are shaded using black stippling.
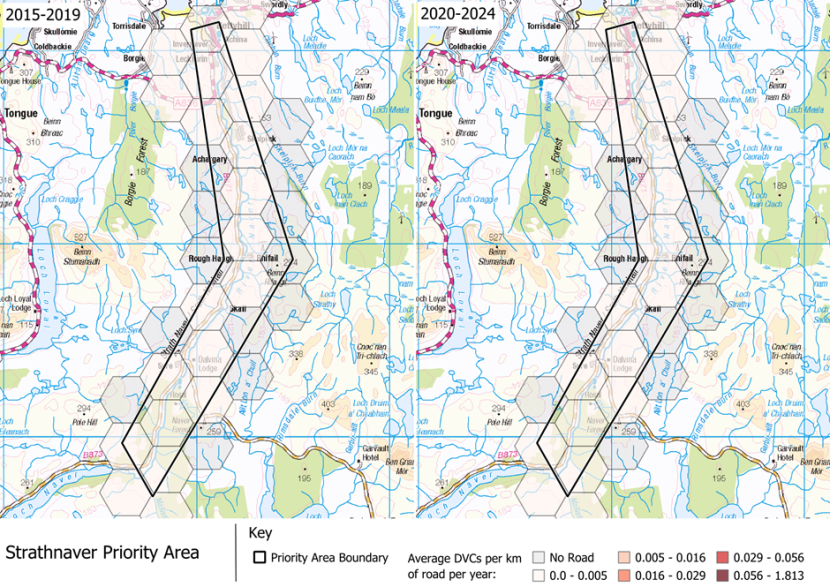
Figure 83. DVCs per kilometre of road per year in the Strathnaver area, which is part of the Priority Agricultural Areas Deer Management Priority Area, comparing 2015–2019 and 2020–2024. Contains OS data © Crown copyright and database right 2025.
Click for a full description
Two maps showing the DVCs per kilometre of road per year in the Strathnaver area, which is part of the Priority Agricultural Areas Deer Management Priority Area. 2015–2019 is shown on the left and 2020–2024 is shown on the right. In each, the area which is part of the Priority Agricultural Areas Deer Management Priority Area is shown as a black outline on a 1:250,000 Ordnance Survey base map. The average number of DVCs per kilometre of road is shown using hexagonal cells approximately 5 km² and shaded from white to dark red, with darker colours representing higher averages. Cells that do not contain roads are shaded using black stippling.
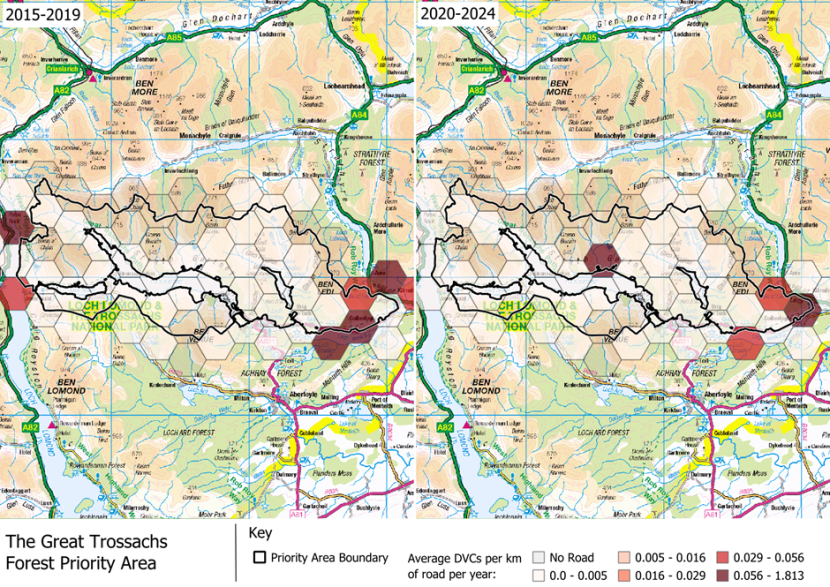
Figure 84. DVCs per kilometre of road per year in The Great Trossachs Forest Park National Nature Reserve Deer Management Priority Area, comparing 2015–2019 and 2020–2024. Contains OS data © Crown copyright and database right 2025.
Click for a full description
Two maps showing the DVCs per kilometre of road per year in The Great Trossachs Forest Park National Nature Reserve Deer Management Priority Area. 2015–2019 is shown on the left and 2020–2024 is shown on the right. In each, the Deer Management Priority Area is shown as a black outline on a 1:250,000 Ordnance Survey base map. The average number of DVCs per kilometre of road is shown using hexagonal cells approximately 5 km² and shaded from white to dark red, with darker colours representing higher averages. Cells that do not contain roads are shaded using black stippling.
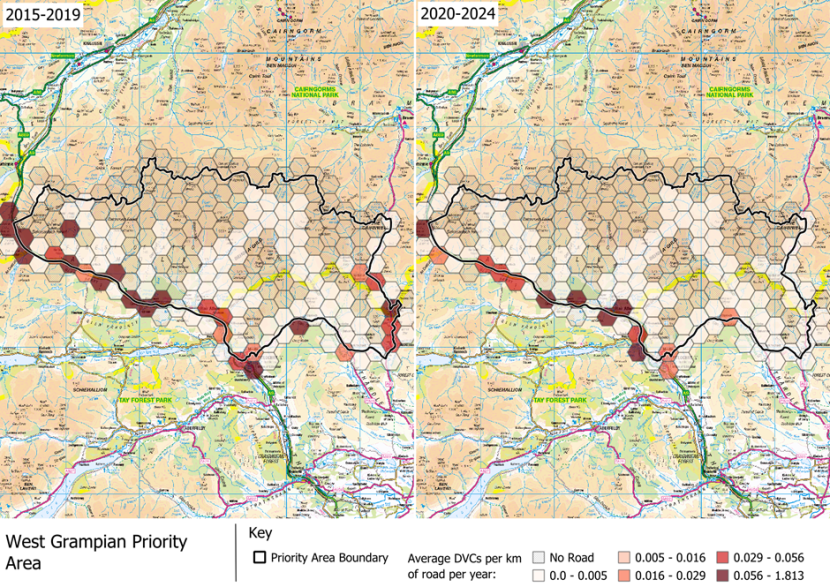
Figure 85. DVCs per kilometre of road per year in West Grampian Deer Management Group area, part of the ‘Deer Management Groups’ Deer Management Priority Area, comparing 2015–2019 and 2020–2024. Contains OS data © Crown copyright and database right 2025.
Click for a full description
Two maps showing the DVCs per kilometre of road per year in the West Grampian Deer Management Group (DMG) area, which is part of the ‘Deer Management Groups’ Deer Management Priority Area. 2015–2019 is shown on the left and 2020–2024 is shown on the right. In each, the DMG area is shown as a black outline on a 1:250,000 Ordnance Survey base map. The average number of DVCs per kilometre of road is shown using hexagonal cells approximately 5 km² and shaded from white to dark red, with darker colours representing higher averages. Cells that do not contain roads are shaded using black stippling.
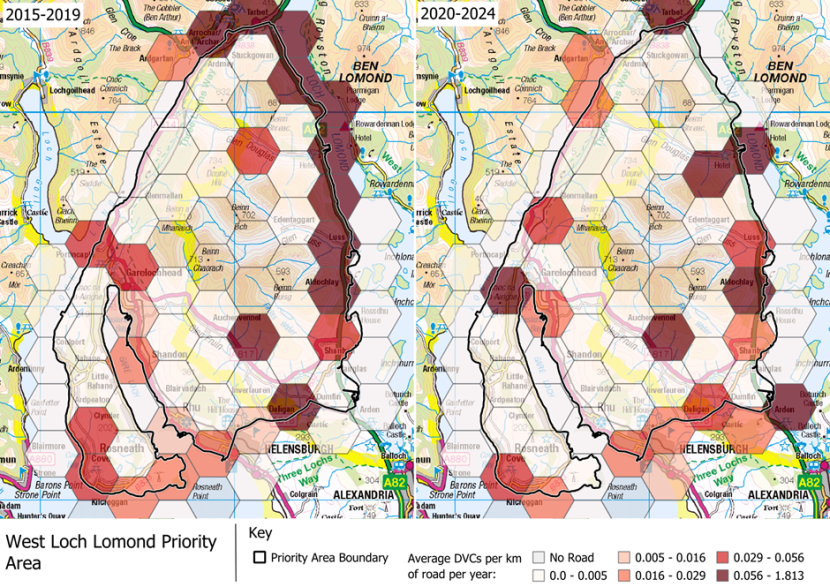
Figure 86. DVCs per kilometre of road per year in West Loch Lomond Deer Management Group area, part of the ‘Deer Management Groups’ Deer Management Priority Area, comparing 2015–2019 & 2020–2024. Contains OS data © Crown copyright and database right 2025.
Click for a full description
Two maps showing the DVCs per kilometre of road per year in the West Loch Lomond Deer Management Group (DMG) area, which is part of the ‘Deer Management Groups’ Deer Management Priority Area. 2015–2019 is shown on the left and 2020–2024 is shown on the right. In each, the DMG area is shown as a black outline on a 1:250,000 Ordnance Survey base map. The average number of DVCs per kilometre of road is shown using hexagonal cells approximately 5 km² and shaded from white to dark red, with darker colours representing higher averages. Cells that do not contain roads are shaded using black stippling.
References
Bíl, M., Andrášik, R., Duľa, M. and Sedoník, J., 2019. On reliable identification of factors influencing wildlife-vehicle collisions along roads. Journal of Environmental Management, 237, pp.297–304
Bíl, M., Andrášik, R., Svoboda, T. and Sedoník, J., 2015. The KDE+ software: a tool for effective identification and ranking of animal-vehicle collision hotspots along networks. Landscape Ecology, 31, pp.1–7
Department for Transport, 2025. Road Safety Data [online] [Accessed 1 September 2025].
Ensing, E.P., Ciuti, S., de Wijs, F.A.L.M., Lentferink, D.H., ten Hoedt, A., Boyce, M.S. and Hut, R.A., 2014. GPS Based Daily Activity Patterns in European Red Deer and North American Elk (Cervus elaphus): Indication for a Weak Circadian Clock in Ungulates. PLoS ONE, 9(9), p.e106997
Faraway, J., Marsaglia, G., Marsaglia, J. and Baddeley, A., 2021. goftest: Classical Goodness-of-Fit Tests for Univariate Distributions
Firke, S., 2024. janitor: Simple Tools for Examining and Cleaning Dirty Data
Fox, J., Weisberg, S. and Price, B., 2024. car: Companion to Applied Regression
Garrah, E., Danby, R., Eberhardt, E., Cunnington, G. and Mitchell, S., 2015. Hot Spots and Hot Times: Wildlife Road Mortality in a Regional Conservation Corridor. Environmental management, 56
Georgii, B., 1981. Activity patterns of female red deer (Cervus elaphus L.) in the Alps. Oecologia, 49(1), pp.127–136
Heckels, A., 2018. The Use of Predictive Modelling to Assess the Risk of a Deer-Vehicle Collision Under Varying Environmental and Traffic Conditions. University of Glasgow.
Ikeda, T., Takahashi, H., Igota, H., Matsuura, Y., Azumaya, M., Yoshida, T. and Kaji, K., 2019. Effects of culling intensity on diel and seasonal activity patterns of sika deer (Cervus nippon). Scientific Reports, 9(1), p.17205
Kassambara, A., 2023. Package ‘ggpubr’ version 0.6.0: ggplot2’ Based Publication Ready Plots. [online] [Accessed 15 May 2023].
Kuznetsova, A., Bruun Brockhoff, P. and Haubo Bojesen Christensen, R., 2020. lmerTest: Tests in Linear Mixed Effects Models
Langbein, J., 2011. Deer Vehicle Collisions in Scotland Monitoring Project 2008-2011. Wrexham: The Deer Initiative Limited. p.49.
Langbein, J., 2013. Deer Vehicle Collisions in Scotland Monitoring 2008-2012. Wrexham: The Deer Initiative Limited.
Langbein, J., 2017. Deer-vehicle collisions in Scotland: data collection and collation to end 2015. Scottish Natural Heritage. p.54.
Langbein, J., 2019. Deer-Vehicle Collision (DVC) data collection and analysis 2016 - 2018. p.76.
Langbein, J., 2025. Deer Vehicle Collisions - a review of mitigation measures and their effectiveness - applying the findings at a site-specific scale. [NatureScot Research Report 1381] NatureScot. [Accessed 12 September 2025].
Langbein, J. and Putman, R., 2006. National Deer-Vehicle Collisions Project: Scotland 2003 to 2005. [Report to the Scottish Executive] Wrexham: The Deer Initiative Limited. [Accessed 12 July 2021].
Laube, P., Ratnaweera, N., Wróbel, A., Kaelin, I., Stephani, A., Reifler-Baechtiger, M., Graf, R.F. and Suter, S., 2023. Analysing and predicting wildlife–vehicle collision hotspots for the Swiss road network. Landscape Ecology, 38(7), pp.1765–1783
Lincoln, M., 2022. clipr: Read and Write from the System Clipboard
Lush, M.J. and Lush, C.E., 2023.Deer Vehicle Collision analysis 2019-2021. [NatureScot Research Report] NatureScot. [Accessed 15 August 2023].
Massei, G. and Ward, A., 2022. Preliminary assessment completed in 2015 of the feasibility of maintaining, limiting or eradicating feral pigs in Scotland. [NatureScot Research Report 876.] NatureScot. [Accessed 15 September 2025].
Meyer, D., Zeileis, A., Hornik, K. and Friendly, M., 2024. vcd: Visualizing Categorical Data
Mitchell, B., Staines, B.W. and Welch, D., 1977. Ecology of Red Deer. [online] Banchory: Institute of Terrestrial Ecology [Accessed 14 March 2022].
NatureScot, 2025. Deer Management Priority Areas [Accessed 12 September 2025].
Pagon, N., Grignolio, S., Pipia, A., Bongi, P., Bertolucci, C. and Apollonio, M., 2013. Seasonal variation of activity patterns in roe deer in a temperate forested area. Chronobiology International, 30(6), pp.772–785
Pedersen, T.L., 2025. patchwork: The Composer of Plots
Pepper, S., Barbour, A. and Glass, J., 2019. The Management of Wild Deer in Scotland - Report of the Deer Working Group. [Report of theDeer Working Group] p.374
Putman, R.J. and Langbein, J., 2024. Deer Vehicle Collisions - a review of mitigation measures and their effectiveness. [NatureScot Research Report 1354] [Accessed 15 July 2024].
R Special Interest Group on Databases (R-SIG-DB), Wickham, H. and Müller, K., 2024. DBI: R Database Interface.
Ripley, B. and Venables, B., 2024. MASS: Support Functions and Datasets for Venables and Ripley’s MASS
Sándor, G., Náhlik, A., Tari, T. and Heffentraeger, G., 2013. Analysis of fallow deer home range and daily activity paterns.
Seiler, A., Sjölund, M., Rosell, C., Torrellas, M., Rolandsen, C., Solberg, E.J., Moorter, B., Lindstrøm, I. and Ringsby, T., 2016. Case studies on the effect of local road and verge features on ungulate-vehicle collisions
Space Intelligence Ltd., 2023. 2022 Scotland Land Cover Map - Report. [online] Edinburgh: Space Intelligence Ltd [Accessed 22 September 2025].
Wickham, H., 2023. tidyverse: Easily Install and Load the ‘Tidyverse’
Wickham, H., Chang, W., Henry, L., Pedersen, T.L., Takahashi, K., Wilke, C., Woo, K., Yutani, H., Dunnington, D. and van den Brand, T., 2025. ggplot2: Create Elegant Data Visualisations Using the Grammar of Graphics [online] [Accessed 9 April 2025].
Wickham, H., Ooms, J. and Müller, K., 2025. RPostgres: C++ Interface to PostgreSQL. R package version 1.4.7 [online] p.1.4.7. Available at [Accessed 14 February 2025].
Wickham, H., Pedersen, T.L. and Seidel, D., 2025. scales: Scale Functions for Visualization