NatureScot Research Report 1329 - Deer Vehicle Collision analysis 2019-2021
Year of publication: 2023
Authors: Lush, M.J. and Lush, C.E. (Exegesis, an Idox Company)
Cite as: Lush, M.J. and Lush, C.E. 2023. Deer Vehicle Collision analysis 2019-2021. NatureScot Research Report 1329.
Additional download: Deer Vehicle Collisions report - two page colour supplement
Keywords
deer vehicle collisions; road management; risk mapping; wildlife management; trunk roads; accident blackspot
Non-technical summary
Deer are large animals that are a potential hazard to vehicles on the road. Each year in the UK alone, it is thought that over 700 people are injured or killed, and over £17 million is spent on vehicle repairs because of Deer Vehicle Collisions (DVCs). In Scotland, increasing deer populations and growth in traffic have led to an increased risk of DVCs (Figure 1).
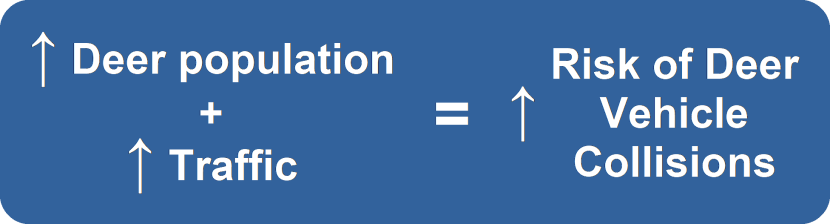
Figure 1. Increasing deer populations and traffic lead to an increased risk of DVCs.
Click for a full description
Word equation showing increasing deer population plus increasing traffic equals an increasing risk of DVCs on the other. Increases are indicated by upwards pointing arrows.
We continued an analysis of DVCs in Scotland undertaken since 2008, adding data for 2018-2021. 22,753 mapped DVC incidents were analysed for this project, providing an understanding of where DVCs occur and where to target actions to reduce risk.
Where do Deer Vehicle Collisions occur?
Everywhere, but mainly where deer populations and traffic levels are highest (Figure 2).
- DVCs are increasing most in the central belt. This is likely due to increasing roe deer populations and traffic volumes there.
- The number of DVCs appear to be decreasing in the north, possibly due to mitigation.

Figure 2. Changing frequency of DVCs in Scotland. A more detailed version of this map can be found in Figure 23.
Click for a full description
Map of Scotland showing increases and decreases in DVCs in hexagonal grid cells. Above average increases in DVCs are shown in shades of red. Below average increases in DVCs are shown in blue. Darker colours indicate a larger change.
Most of increase is in the central belt, whilst the north of Scotland shows the greatest overall decrease.
When do Deer Vehicle Collisions occur?
At any time of year, though there are times where the risk is highest.
- The peak months are May and June.
- The peak time is dusk, spread over more hours in winter.
Are there more Deer Vehicle Collisions in Scotland now?
The number of DVCs recorded each year increased from 2008 to 2016. Since 2016 there have been around 1,850 per year (Figure 3). Increases and decreases have occurred locally.
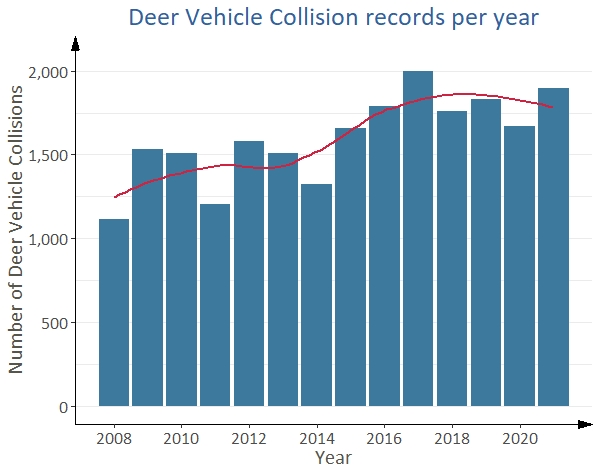
Figure 3. Number of DVC records for each year in blue, with a superimposed smoothed trendline in red.
Click for a full description
Bar chart showing the numbers of DVC reports per year. The y-axis is titled ‘Number of Deer Vehicle Collisions’ and ranges from 0 to 2,000 at intervals of 500. The x-axis shows years from 2008 to 2021, labelled at every 4 years. Bars show DVC records for each year in blue. The lowest number of records was for 2008 and the highest number of records was for 2017, though the number of records per year shows some variation across all years. A smoothed trendline is superimposed in red, showing a gradual overall increase in the number of DVC reports per year. The data are presented in greater detail in Figure 6 and Table 4.
What can be done to reduce Deer Vehicle Collisions?
- Variable Message Signs can be used to warn drivers of the general risk of DVCs. Deer warning signs can be installed at high-risk locations and mobile signs can be used where there are no static signs.
- Reducing deer usage of woodland adjacent to high-risk road junctions may reduce DVCs.
- Increased deer culling, though this is only practical in some situations.
Assessing the risk of Deer Vehicle Collisions on roads
We developed a new approach to identifying the stretches of road where DVCs are most likely to occur.
Based on the risk of DVCs, we shortlisted the 10 highest risk lengths of trunk road. Most were in the central belt and associated with road junctions near woodland (Figure 4).

Figure 4. The highest risk of DVCs is where there are road junctions with wooded islands in urban locations.
Click for a full description
Word equation showing road junctions plus wooded islands plus urban locations equals the highest DVC risk.
This suggests deer are spending the day resting in woodlands near road junctions and feeding in the surrounding area at night.
Did Covid lockdown reduce Deer Vehicle Collisions?
For three months in 2020, the UK entered a period of lockdown where travelling was severely restricted. Fewer car journeys suggested that there would be a reduction in animal roadkill. We looked at whether the number of DVCs reduced during lockdown.
Fewer DVCs were reported by volunteers, as expected, but there was no overall reduction in DVCs during lockdown. The number of DVCs during lockdown was consistent with the previous five years, as shown in Figure 5.
Freight traffic was unaffected by lockdown, suggesting that freight traffic is responsible for many DVCs. This makes sense, since domestic traffic is generally smaller and has shorter stopping distances, making it more likely that they could avoid deer on the road.
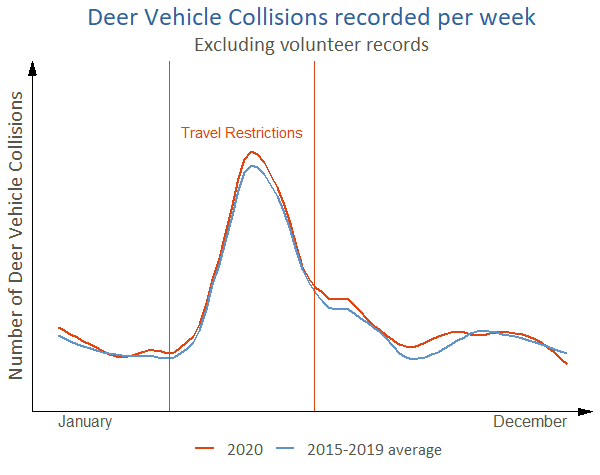
Figure 5. Number of DVCs per week in 2020 and the average number of DVCs per week between 2015 and 2019. The period when travel restrictions were enforced in 2020 due to the Covid-19 pandemic is shown. More detail is provided in Figure 31.
Click for a full description
A chart with two smoothed trendlines showing the number of DVCs per week in two time periods, excluding data collected by volunteers. The y-axis is titled ‘Number of Deer Vehicle Collisions’, with an arrow indicating increasing numbers. The x-axis is also an arrow that starts in January and ends in December. A red line shows the number of DVCs per week in 2020. A blue line shows the average number of DVCs per week from 2015 to 2019. 24 March and 3 July are marked as vertical red lines, representing the period when travel restrictions were enforced in 2020 due to the Covid-19 pandemic. Covid-19 travel restrictions coincided with the normal peak in DVC reports. Comparison of the two trendlines suggests that the enforcement of travel restrictions had no impact on the numbers of reported DVCs.
Primary data suppliers
- Amey
- Autolink Concessionaires (M6) Plc.
- Balfour Beatty
- BEAR Scotland
- British Deer Society
- Forestry and Land Scotland
- Mammal Society
- Scottish Society for the Prevention of Cruelty to Animals
Background
In recent decades, deer populations in Scotland have both increased in number and spread more widely in urban areas and the central belt. These changes have coincided with a growth in road traffic, inevitably leading to an increased risk of collisions between deer and vehicles.
This report continues work undertaken since 2003 analysing Deer Vehicle Collisions (DVCs) in Scotland. This work is important for understanding changing patterns in the locations and frequencies of DVCs on the Scottish trunk road network. This in turn helps to identify potential actions that could reduce the number of DVCs in the future, especially on stretches of road where DVCs occur more frequently.
Data covering the years 2019 to 2021 were added to the existing NatureScot DVC database, which now consists of 22,753 mapped incidents dated from 2008 to 2021. 93% of these come from four primary data sources: the SSPCA, Truck Road Operating Companies, Forestry and Land Scotland rangers and human injury records from Police Scotland.
The full dataset has been analysed, broadly repeating the analysis undertaken before, but also enhancing the analysis to further identify trends and improve the approach to DVC risk mapping.
Main findings
- Overall, numbers of DVCs reported per annum between 2019 and 2021 are consistent with the previous three years. This suggests that the risk of DVCs on the Scottish trunk road network overall is not increasing.
- The largest number of DVC incidents occur in northern local authority areas in Scotland, notably Highland, Perth and Kinross, Aberdeenshire and Fife.
- DVC frequencies show the greatest increase in the central belt, with a comparative decrease in northern Scotland. Nevertheless, there is evidence of decreases on some trunk road sections in the central belt. This suggests that DVC risk on some trunk roads in the central belt is increasing, whilst the risk in northern Scotland is decreasing.
- An increased level of culling around Forestry and Land Scotland sites since 2011 appears to have led to a reduction of DVCs in the vicinity, based upon the numbers of DVCs attended by Forestry and Land Scotland rangers. This suggests that intensive deer culling can be an effective method of reducing DVC risk on nearby roads.
- May and June are the peak months for DVCs.
- Dusk is the peak time for DVCs, though this peak is spread over a longer period from mid-afternoon until midnight in winter. This is likely due to high levels of both traffic and deer activity, plus factors such as driving conditions and driver fatigue.
- This information on the locations and times of highest DVC incidence can be used to target mitigation activities, such as warnings on the Variable-Message Sign network.
- Roe deer continue to be the most frequently implicated species in DVC incidents.
- The travel restrictions enforced in 2020 due to the emerging Covid-19 pandemic suppressed the number of DVC incidents reported by members of the public, but there is no evidence to suggest that the number of DVCs was reduced.
- DVC risk is better assessed using shorter road lengths, rather than entire trunk road sections as used in previous studies, as it can identify discrete blackspots on long road sections. Results can be improved by removing bias introduced by extremely short trunk road sections without reducing the validity of the results. This allows better targeting of actions to mitigate DVC risk to specific parts of the trunk road network.
- Most DVC blackspots between 2019 to 2021 were in the central belt, apparently mainly around road junctions with adjacent small areas of woodland. A combination of deer using the woodland as daytime retreats, non-continuous traffic on slip roads and reduced visibility on curved slip roads is believed to be responsible. A pilot to see if reducing deer numbers or the attractiveness of these woodlands to deer leads to a decrease in DVCs is recommended.
- Ten DVC blackspots were shortlisted, and recommendations made for mitigating the risk of DVCs in the future.
- Data collation needs to be proactive when trunk road operator contracts change, including contacting the outgoing contractor to obtain a final DVC dataset, and early discussions with the incoming contractor to clarify the roads covered by the new contract and DVC data requirements. This will help to avoid accidental gaps in the Scottish DVC database.
- Future data collation should actively seek reports from Trunk Road Operating Companies where carcasses were uplifted and where no carcass was found. Many instances where a carcass was not found are likely to relate to reliable reports but may be largely missing from data supplies to date. Where appropriate, requests for backdated data should be made to fill in any gaps. Doing this will lead to a better understanding of DVC risk and more reliable recommendations for DVC risk reduction.
- Consideration should be given to creating a complete dataset of trunk road marker posts, for the roads where they exist. This should include a cost-benefit exercise, considering the cost of creating the dataset with its potential value for DVC analysis and other uses.
Acknowledgements
We thank for Project Steering Group members for their advice and support, and for funding this work: Jamie Hammond (NatureScot) and Angus Corby (Transport Scotland). Andrew Knight (Transport Scotland) also provided assistance and advice.
Thanks are also due to those that have regularly supplied data for use in this project from a range of organisations, primarily Stewart Allan and Rachel Kennedy (Amey); Jock Laidlaw (Autolink Concessionaires (M6) Plc.); Carla Cummins, Stewart MacKenzie and Antony Thorpe (Balfour Beatty); David Patton, Sheila Thomson, Tommy Deans, Mark Turner and Steven Kitt (BEAR Scotland); Laura Boyle (Scottish SPCA); Sheila Baxter (Forestry and Land Scotland); Frazer Coomber (Mammal Society); and Laura McMahon (British Deer Society).
Several local authority staff members supplied STATS19 data, specifically: Richard Bailie (Aberdeenshire Council), Ross Bartlett (Highland Council), Beverley Harkins (Fife Council), Willie Kane (Dundee City Council), Stacey Monteith-Skelton (City of Edinburgh Council), Colin Smith (South Lanarkshire Council) and Andrea Strachen (Angus Council). Other local authority staff provided data anonymously in response to Freedom of Information (Scotland) Act 2002 requests. Ross Bartlett also provided advice on the information that could be held by local authorities and how best to request it.
Alex Ramage (Transport Scotland) provided an extract from the IRIS database with AADF data included, as well as good advice on how to utilise the data. Anton Watson (Forestry and Land Scotland) provided valuable advice on culling activity and its possible effects on DVCs around Forestry and Land Scotland sites.
Special thanks go to Jochen Langbein, who has undertaken much of the work on DVCs in Scotland to date. As well as supplying past data, reports and papers alongside extensive notes on the processes undertaken previously, he has also provided much support in terms of answering queries and providing advice. Without this support, repetition of previous analysis such that comparable results are obtained would have proven difficult or impossible.
Abbreviations
Average Annual Daily Flow (AADF)
Aberdeen Western Peripheral Route (AWPR)
Deer Vehicle Collision (DVC)
Design-Build-Finance-Operate (DBFO)
Collision Reporting and Sharing system (CRaSH)
Forestry and Land Scotland (FALS)
Forth Bridge Operating Company (FBOC)
Freedom of Information (Scotland) Act 2002 (FOI)
Integrated Road Information System (IRIS)
Locally Estimated Scatterplot Smoothing (LOESS)
Major Roads Database (MRDB)
Road Traffic Accident (RTA)
Road Traffic Collision (RTC)
Scottish Society for the Prevention of Cruelty to Animals (SSPCA)
Trunk Road Operating Company (TROC)
Introduction
Numbers of wild deer in Scotland have increased significantly in recent decades. Though all deer species have increased their range, roe deer have become particularly well established in lowland Scotland. Deer have also spread more widely into urban areas and throughout the central belt (Pepper, Barbour and Glass, 2019).
The population and range increases in deer in Scotland have coincided with a growth in road traffic. This has inevitably led to an increase in Deer Vehicle Collisions (DVCs). Langbein (2019) defines DVCs as including ‘any incidents where it may be concluded that a collision between a road vehicle and a deer has occurred; as evident either from live injured or dead deer casualties found at the roadside, or from reported road traffic collisions in which deer were implicated as an object or hazard in the carriageway (e.g. deer colliding with road vehicle, or deer presence causing drivers to swerve)’.
This report covers the fifth contract analysing the impact of DVCs on trunk roads in Scotland, adding data for 2019 to 2021 to the existing database containing data since 2008. Previous contract reports are Langbein and Putman (2006) and Langbein (2011; 2013; 2017; 2019). Langbein (2019) provides a summary of all DVC analysis work undertaken between 2004 and 2018.
This contract has focused on updating the data collated in previous contracts, repeating analysis to allow comparison with previous studies and enhancing the analysis to provide additional insight. New analysis has required the development of novel approaches, which are described and justified in this report. The results of this analysis can be used to target measures to reduce the impact of DVCs in Scotland.
Data was sought from those organisations that provided data for previous contracts. The primary sources are the Trunk Road Operating Companies (TROCs), supported by a range of other organisations that routinely deal with DVCs and incidents reported by members of the public and made available through various channels. Changes to the organisations involved and the data that could be collated are detailed in the report.
Alongside these activities, steps have been taken to automate data processing and analysis as much as possible, with a view to increasing consistency and efficiency, and reducing the risks of human error.
Data collection regime, processing and analysis
Records of DVC incidents between 2008 and 2018 were supplied by the previous contractor Jochen Langbein. Records from 2019 to 2020 were obtained from source organisations, as described below.
Data were collated into a PostgreSQL/PostGIS database. Records from all sources were combined into a single, rationalised and standardised master database table (see Annex 1: Database main table structure).
Original records covering data from 2019 onwards, or 2018 onwards in the case of STATS19 data, were retained in their original formats and as separate processed PostgreSQL tables, so that data provenance could be easily traced. PostgreSQL scripts used to process the data, both from original sources into usable spatial database tables and into the master table, were retained, allowing full traceability and enabling changes to be quickly implemented if errors were found. Any manual processing undertaken was carefully documented.
Core data sources
Trunk Road Operating Companies
Data on reported DVC incidents since 2019 were supplied by the Trunk Road Operating Companies (TROCs) and added to the existing data for 2008-2018. This included data from the four main trunk road units and the smaller Design-Build-Finance-Operate (DBFO) sections. A summary of the data collated is shown in Table 1.
The trunk road network has changed over time. The most significant change during this contract was the full opening of the Aberdeen Western Peripheral Route (AWPR) in February 2019, though there have been other minor changes. These changes mean that the data from the previous DVC contracts may relate to historic trunk roads that are no longer part of the trunk road network. Similarly, historic DVCs may be proximal to trunk roads that were not in existence at the time of the incident. Figure 6 represents the trunk road network as of December 2021.
Each TROC tends to hold several contracts. For example, the NE and NW units were managed by a single TROC that supplied data regularly on a 6-month basis.
The SE and SW Units TROCs changed in August 2020. As part of this, the Forth Bridges Unit was included in the SE contract. The contract changes resulted in some data duplication for the SW and associated DBFOs, which was resolved during processing to remove all duplicate records.
Due to an incorrect interpretation of the contract changes in the SW and SE, data for the M8 DBFO from August 2020 onwards has not been collated and included in this analysis.
Table 1. Data supplied for 2019 and 2020 by Trunk Road Operating Companies for each unit of the trunk road network. Data correct as of 31 December 2021. As of August 2020 the Forth Bridges OC has been incorporated into the SE Unit.
| Trunk road unit | 2019 | 2020 | 2021 | 2022 |
|---|---|---|---|---|
| SW Unit | Y | Y | Y | Y |
| SE Unit | Y | Y | Y | X |
| NW Unit | Y | Y | Y | Y |
| NE Unit | Y | Y | Y | Y |
| M8 DBFO | Y | Y | Y | Y |
| M80 DBFO | Y | Y | Y | Y |
| M77 DBFO | Y | Y | Y | Y |
| M6 DBFO | Y | Y | Y | Y |
| Forth Bridges OC | Y | Y | N/A | N/A |
| Aberdeen Roads Ltd. | Y | Y | Y | Y |
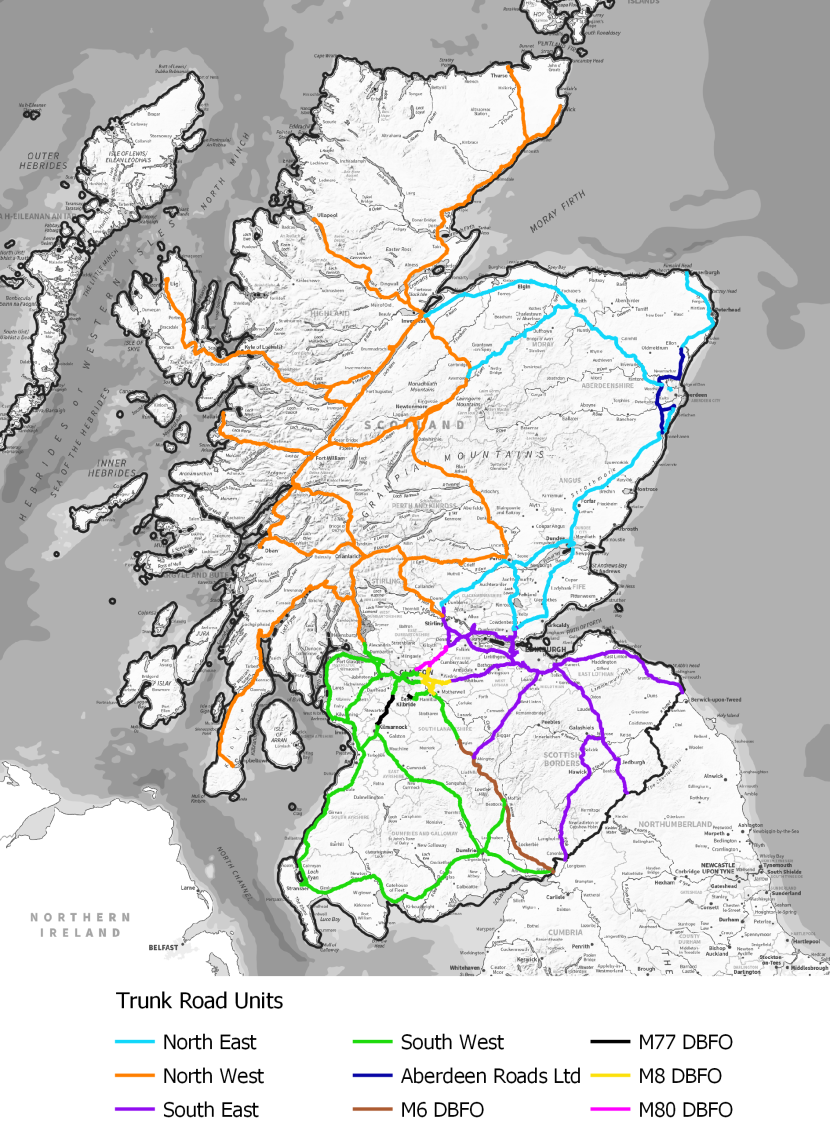
Figure 6. Scottish Trunk Road Map as of December 2021. DBFO = Design-Build-Finance-Operate. © Crown copyright (and database rights) 2022.
Click for a full description
Map of Scotland showing the Trunk Road network, coloured by the operating contract:
- Aberdeen Roads Ltd. in dark blue
- M6 DBFO in brown
- M77 DBFO in black
- M80 DBFO in magenta
- M8 DBFO in yellow
- South East Unit in purple
- South West Unit in green
- North East Unit in blue
- North West Unit in orange
Scottish Society for the Prevention of Cruelty to Animals
The SSPCA have provided records of incidents they have attended since 2008. From this data, information relating to incidents involving deer collisions has been extracted and incorporated into the database. Data up to and including 2021 were incorporated into the master database table.
Forestry and Land Scotland Wildlife Rangers
Forestry and Land Scotland (FALS; formerly Forestry Commission Scotland) have supplied extracts from their national cull database that are logged as RTA (Road Traffic Accident) or RTC (Road Traffic Collision) since 2008. Data up to and including 2021 were incorporated into the master database table.
Each record in the FALS data relates to a single deer, which means where multiple DVCs were recorded in a single time and location there are a corresponding number of records. In all other datasets that make the distinction the total number of deer is the sum of the males, females and juveniles recorded. The Forestry and Land Scotland is distinct in recording the sex of juvenile deer, but since each record relates to a single deer these records are assigned a 1 in the relevant sex, juvenile and total deer fields in the database. Thus, unlike records from other sources, the total number of deer in Forestry and Land Scotland records is not the sum of the males, females and juveniles.
Police and Road Safety Teams’ RTC records
The primary source of information on incidents involving DVCs from the police and road safety teams since 2008 has been STATS19 accident reporting forms. Complete or near complete STATS19 data is included in the database for 2008-2017 inclusive. Data for 2018 would not have been available at the time Langbein (2019) was written.
In the years up to 2017, STATS19 data were supplied to Transport Scotland in a format that allowed such incidents to be extracted, but this is no longer the case. It was therefore necessary to seek a new source of the data, using a mix of informal and Freedom of Information (Scotland) Act 2002 (FOI) requests.
STATS19 data are collected by the police, so an FOI request was made to Police Scotland to provide relevant data. Unfortunately, Police Scotland were not able to provide the relevant information, citing “changes to the national process of recording road traffic collisions in 2019 from a localised to a national recording structure”. They also stated that “there were no cases where the CRaSH [Collision Reporting and Sharing system] text field recorded the [type] of animal involved”. Police Scotland were able to provide data on the numbers and locations of animal vehicle collisions, but as these did not differentiate those involving deer they could not be used. Provision of data limited to deer would “involve cross referencing all the records referred above with the information held on multiple systems”, a process that would exceed the cost limit for a FOI response.
Considering this, relevant STATS19 records were sought from local authorities using a mix of informal and FOI requests. Many of these held road safety data that included STATS19 records supplied by Police Scotland. Some of them had provided data under previous contracts. STATS19 data was only sought from the 28 local authorities containing trunk roads in Scotland.
Responses are summarised in Table 2. Some authorities also provided data on deer carcass uplifts that were not included in STATS19 data, which are included in Table 2. Sixteen requests (57%) successfully resulted in data being obtained, including confirmation of no DVCs between 2018 and 2021.
Table 2. DVC records from STATS19 and carcass uplift data between 2018 and 2021 received from each local authority contacted. 0 records indicates that the local authority reported no DVC incidents. NULL indicates that the local authority were not able to provide the information, for the reasons categorised in the Response Type field. The total length of trunk road within each local authority area is shown for reference. Local authority areas containing no trunk roads are excluded.
| Local Authority | Total trunk road length (km) | Records received for 2018-2021 | Response type |
|---|---|---|---|
| Highland Council | 1,001 | 9 | Successful. |
| Dumfries and Galloway | 424 | NULL | Do not hold data on DVCs |
| Perth and Kinross | 386 | NULL | Unable to respond |
| Aberdeenshire Council | 322 | 5 | Successful. |
| Argyll and Bute Council | 307 | 0 | Successful. |
| South Lanarkshire | 229 | 2 | Successful. |
| North Lanarkshire | 173 | NULL | Do not hold data on DVCs |
| Fife | 171 | 7 | Successful. |
| Stirling | 169 | 2 | Successful. |
| Scottish Borders | 168 | 8 | Successful. |
| Glasgow City Council | 147 | NULL | Do not hold data on DVCs |
| South Ayrshire | 115 | NULL | Referred to Police Scotland |
| City of Edinburgh Council | 111 | 1 | Successful. |
| East Lothian | 105 | NULL | Do not hold data on DVCs |
| Moray Council | 100 | NULL | 1 record with no/inadequate location details |
| Angus Council | 96 | 6 | Successful. |
| Falkirk | 93 | 0 | Successful. |
| Renfrewshire | 91 | 1 | Successful. |
| North Ayrshire | 88 | 1 | Successful. |
| East Ayrshire | 85 | 0 | Successful. |
| West Lothian | 81 | 3 | Successful. |
| Aberdeen City Council | 68 | NULL | 1 record with no/inadequate location details |
| Midlothian Council | 38 | NULL | Do not hold data on DVCs |
| Inverclyde | 37 | NULL | Do not hold data on DVCs |
| West Dunbartonshire | 37 | NULL | Do not hold data on DVCs |
| Dundee City | 33 | 0 | Successful. |
| East Renfrewshire | 24 | NULL | Referred to Police Scotland |
| Clackmannanshire | 2 | 0 | Successful. |
| Total | 4,700 | 45 | 16 (57%) successful |
Two local authorities held relevant data, but the location information was inadequate for the analysis required by this project. Numerous local authorities do not hold data on DVCs and were therefore unable to help. Two local authorities referred us to Police Scotland as the original collectors of the data, as allowed under the FOI obligations. One local authority was unable to respond due to technical issues that were unlikely to be resolved within a reasonable timeframe.
Note that there is often a lag between STATS19 data being collected and it being made available to other users. It is therefore possible that some records from the end of 2021 were missing from the responses as they were not available to the local authorities.
Supplementary data sources
Since 2009 online reporting of DVCs by members of the public was via the DeerAware website, which took over from deercollisions.co.uk. This generally involved fewer than 50 records for Scotland per year. More recently, regular recorders, including the ‘deer-knowledgeable’ contributors described in Langbein (2019), have been encouraged to use the British Deer Society app instead, though the effect of this is not evident from the data collated (Table 3).
In 2019 only 15 records from DeerAware related to trunk roads, one of which was undated and therefore excluded (Table 3). The data were also very poorly structured, which meant that two hours were required to manually process the data into a useable format.
The British Deer Society took control of the DeerAware website in 2020. Since November 2020 they have been collating records received via the DeerAware website in a structured format, so data held by them for 2021 and part of 2020 has been obtained and collated into the database. Data for January to November in 2020 were lost whilst they took over the website and rerouted communications. In total, 53 Scottish DeerAware records were provided by The British Deer Society (Table 3).
Data from the British Deer Society app relating to DVCs in 2019 to 2021 were collated and incorporated into the master database table. As the app was launched in the summer of 2019 it included only limited data and none for Scotland in that year. Four records relating to DVCs in Scotland were included in the data for 2020 and one record for 2021 (Table 3). Many records were reported from elsewhere in the UK in 2021, so it is likely that the numbers reported in this way will increase as the app becomes more widely adopted in Scotland.
Data from the Mammal Society’s Mammal Mapper and Mammal Tracker schemes have been available since 2016. The Mammal Tracker scheme was phased out and replaced by the Mammal Mapper scheme during this contract, so no data was provided from the Mammal Tracker scheme for 2020 and 2021. Data from both schemes up to and including 2021 have been incorporated into the master database table. These usually contribute between 10 and 25 records relating to DVC incidents in Scotland per year, though records received for 2019-2021 were higher, averaging 26.3 per annum (Table 3).
Table 3. Number of records received from members of the public in 2019-2021 by source dataset. DeerAware data are not available for most of 2020, as they were lost as the website was taken over by the British Deer Society. Data for the Mammal Society’s Mammal Mapper and Mammal Tracker schemes are grouped, as data are supplied together and the latter has been phased out during this contract.
| Source | 2019 | 2020 | 2021 | 2022 |
|---|---|---|---|---|
| DeerAware | 14 | 7 | 46 | X |
| British Deer Society | 0 | 4 | 1 | X |
| Mammal Mapper/Tracker | 21 | 20 | 38 | 43 |
Langbein and Putman (2006) found that only a minority of local authority road cleansing departments would be able to provide useable records of DVCs. Because of this, and as in previous projects (Langbein, 2017; 2019) data from local authority road cleansing departments was not actively sought. All such data collated between 2008 and 2018 was included in the database, to which one record was added that was included in a local authority response to the request for STATS19 data.
Supporting data
Other national level data that have been collated to support this work and assist analysis are detailed below.
An extract from the Integrated Road Information System (IRIS) database containing the associated Average Annual Daily Flow (AADF) data was provided by Transport Scotland on 16 December 2021. Trunk roads (Figure 6) were extracted from this by selecting those where the OWNER_UID field was not equal to ‘LOCAL AUTHORITY’ and the SECTION_CO field did not start with ‘14935’. The sections with codes starting with ‘14935’ related to sections of the A737 that ceased to be part of the live network as of 7 April 2020 (Angus Corby pers. comm.).
Ordnance Survey Open Roads data were downloaded from the Ordnance Survey website in October 2021 and were used to allow analysis of DVC frequencies on the full road network (DVC distribution and change on the wider road network).
Ordnance Survey Code Point data was also downloaded to assist with georeferencing records where the location was only known as a postcode. These data were updated as required to incorporate data into the database.
Marker post data published in response to a Freedom of Information request was obtained from https://www.gov.scot/publications/foi-19-01392/. The provenance of this dataset is unknown. It is incomplete and seems to contain errors, but the only other sources of such information are from the TROCs, which is often similarly incomplete or non-existent. Marker posts are the only information upon which records can be located for AutoLink M6 and AWPR, so these data are used when processing data from these TROCs and gaps filled manually.
Identification of duplicate records
Possible duplicate records were identified using an automated process that checked for DVC incident records from the same date and where the recorded grid references were within 100 m of each other. Where a record had already been flagged as a duplicate it was excluded from this process.
Where the deer species was recorded this was also considered, so records with different species recorded, including where the species was not identified, were assumed to relate to different incidents. In some of the cases identified, there may have been a single incident involving multiple species that were added to the database as separate records.
This produced a list of paired records that were manually checked. For each pair of records either a comment was added to identify one record as a possible duplicate, usually the record with the least information, or where the evidence for duplication was not strong both records were left unaltered in the database.
Analysis
Analysis was undertaken using a combination of standard and bespoke PostgreSQL/PostGIS functions, and the R statistical environment. The tables in this report were created using PostgreSQL views on the data, allowing them to be readily updated as new information became available. Maps were produced using QGIS, drawing upon the data in PostgreSQL, either directly or using PostgreSQL views.
All charts and statistical tests were produced or undertaken in R, drawing directly upon PostgreSQL using the packages DBI and RPostgres. Data reshaping in R was undertaken using standard R functions and the package dplyr. Most charts were produced using the packages ggplot2, patchwork and ggpubr.
Results
Change in volume of data by source, type and years
A total of 5,464 records of DVCs were collated for the period 2019 to 2021. Of these, 69 were thought to be potential duplicate records and were excluded from analysis where relevant. A further 15 records from STATS19 accident reporting were added for 2018.
The change in volume DVC records received from core and non-core sources since the initiation of these studies in 2003 is shown in Table 4, and since 2008 in Figure 7.
Table 4. Number of DVC records with adequate location details for mapping retained for the DVC database and analysis during differing monitoring periods. Figures for 2003-2007 are taken from Langbein (2019). Records between 2008 and 2021 that are believed to be duplicates are excluded.
| Period | Core | Other | Total |
|---|---|---|---|
| 2003 - 2007 | 2,136 | 3,702 | 5,838 |
| 2008 - 2012 | 5,991 | 1,007 | 6,998 |
| 2013 - 2017 | 8,077 | 339 | 8,416 |
| 2018 | 1,703 | 65 | 1,768 |
| 2019 | 1,787 | 52 | 1,839 |
| 2020 | 1,668 | 31 | 1,699 |
| 2021 | 1,841 | 85 | 1,926 |
| Total | 21,067 | 1,579 | 22,646 |
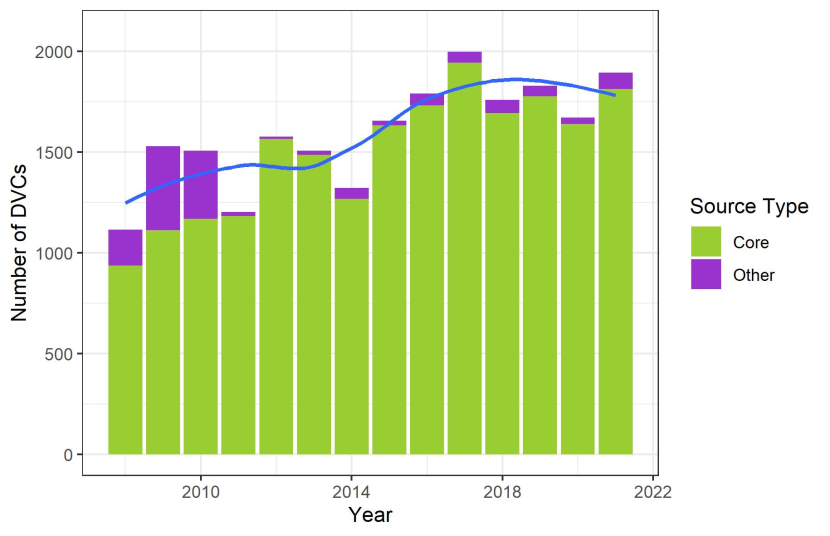
Figure 7. Number of DVC records from core and other sources with adequate location details for mapping retained in the DVC database and included in the analysis in each year.
Click for a full description
Stacked bar chart showing the numbers of DVC reports per year. The y-axis is titled ‘Number of DVCs’ and ranges from 0 to 2,000 at intervals of 500. The x-axis shows years from 2008 to 2021, labelled at every 4 years. Bars show records from core sources in green below and records from other sources in purple stacked on top. Records that are believed to be duplicates are excluded. Records from core sources have outnumbered those from other sources in every year, generally increasing from 938 in 2008 to 1,945 in 2017, following which numbers have declined slightly and plateaued. Records from other sources are generally few, ranging from 11 in 2012 to 82 in 2021, but show no obvious change in numbers per year. Exceptionally high numbers of reports from other sources were received in 2008 (177), 2009 (417) and 2010 (339), largely due to a special project undertaken by the Deer Commission for Scotland at that time (Langbein, 2011). A smoothed LOESS trendline for all data is superimposed in blue, showing a gradual overall increase in the number of DVC reports per year. The data are summarised in Table 4.
Core sources – Volume and trends across years
The number of records collated from core and other sources have increased since 2008 (Table 5). Data for the M8 DBFO is missing for 2020 and 2021, as described in Trunk Road Operating Companies. STATS19 road traffic collision data are likely incomplete from 2018 onwards, as described in Police and Road Safety Teams’ RTC records.
The number of DVCs reported from core sources has remained relatively constant since 2015, owing to relatively stable combined totals from Trunk Road Operating Companies (TROCs) and the SSPCA each year (Figure 8). This has masked the changes for the SSPCA, Forestry and Land Scotland (FALS) and certain trunk road regions described above, plus a significant strong decline in DVCs from road traffic collision reporting.
Lower numbers of DVCs were recorded overall in 2020 than in other recent years. This may be due to the Covid-19 pandemic, which may have reduced the numbers of DVCs reported to some sources as people travelled less. Nevertheless, the number of DVCs reported by TROCs was still high, which may suggest that the actual numbers of DVCs on trunk roads was unaffected by travelling restrictions.
Table 5. Number of DVC reports with sufficient detail for mapping obtained by year from each of the four core data source categories and for all other sources combined. The four core sources are: Trunk Road Operating Company TROC; Road Safety teams road traffic collisions RTC; Scottish SPCA SSPCA; Deer Knowledgeable reporters – Forestry and Land Scotland Wildlife Rangers FALS.
| Year | TROC | RTC | SSPCA | FALS | Total Core | Total All Others |
|---|---|---|---|---|---|---|
| 2008 | 480 | 86 | 319 | 62 | 947 | 187 |
| 2009 | 652 | 75 | 291 | 101 | 1,119 | 425 |
| 2010 | 718 | 64 | 347 | 68 | 1,197 | 319 |
| 2011 | 593 | 70 | 419 | 104 | 1,186 | 24 |
| 2012 | 745 | 74 | 666 | 84 | 1,569 | 25 |
| 2013 | 638 | 81 | 698 | 74 | 1,491 | 93 |
| 2014 | 674 | 47 | 475 | 76 | 1,272 | 65 |
| 2015 | 660 | 29 | 883 | 62 | 1,634 | 63 |
| 2016 | 672 | 24 | 1,001 | 36 | 1,733 | 65 |
| 2017 | 620 | 24 | 1,255 | 48 | 1,947 | 53 |
| 2018 | 530 | 15 | 1,102 | 56 | 1,703 | 65 |
| 2019 | 690 | 11 | 1,058 | 28 | 1,787 | 52 |
| 2020 | 706 | 10 | 921 | 31 | 1,668 | 31 |
| 2021 | 664 | 8 | 1,129 | 40 | 1,841 | 85 |
| Total | 9,042 | 618 | 10,564 | 870 | 21,094 | 1,552 |
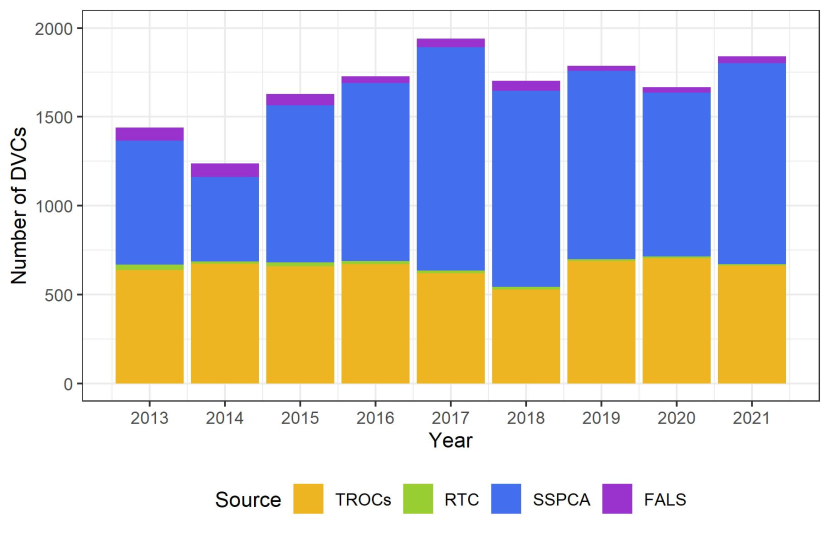
Figure 8. Total number of DVCs reported from 2013 to 2021 from all core sources, segmented by source type.
Click for a full description
TROC = Trunk Road Operating Company data, RTC = Road Traffic Collision data, SSPCA = Scottish Society for the Prevention of Cruelty to Animals; FALS = Forestry and Land Scotland.
Stacked bar chart showing the number of DVCs reported from four core source types between 2013 and 2021. The y-axis is titled ‘Number of DVCs’ and ranges from 0 to 2000, with labels at intervals of 500. The x-axis shows years from 2013 to 2021, labelled at every year. DVCs reported each year by trunk road operators are in yellow and show little change over time, varying from a low of 530 in 2018 to a high of 706 in 2020 – see Figure 11 for detail. Personal injury DVC related incidents obtained from STATS19 each year are shown as a thin green line and contribute little overall each year – see Figure 15 for detail. Most variation in the chart is for DVCs reported by the Scottish Society for the Prevention of Cruelty to Animals, in blue, which ranges from 475 in 2014 to 1,255 in 2017 – see Figure 14 for detail. DVCs reported each year by Forestry and Land Scotland and its predecessor Forestry Commission Scotland is shown in purple and ranges from 28 in 2019 to 76 in 2014 – see Figure 14 for detail.
Supplementary data sources
Non-core data and accurately identified deer records have come from a range of sources that have varied since 2008 (Table 6). Up until March 2011, data were available for a special project commissioned by the Deer Commission for Scotland (Langbein, 2011), but such data have not been available for subsequent studies. Council Uplift data has not been actively collated since September 2011, but one record was received alongside the STATS19 data received from local authorities. Data from Police Control has more recently been available as part of STATS19 data and is therefore included in core sources (see Police and Road Safety Teams’ RTC records).
Historically, data from other deer experts have come from range of sources, but since 2019 all data have come from FALS (Figure 7 above), the Mammal Society recording schemes and the British Deer Society app.
Prior to 2019, data from the General Public came exclusively from the DeerAware incident reporting form. Up until 2019, DeerAware records were received as unstructured auto-forwarded emails that required a significant investment to incorporate into the database. DeerAware records are now collated in a structured format by the British Deer Society, though most of the data for 2020 are missing (see Supplementary data sources). Recorders are now encouraged to use the British Deer Society app instead. This is expected to lead to a reduction in the number of records submitted to DeerAware in the future, but this change is not yet evident.
As data submitted via the British Deer Society app are verified by British Deer Society experts prior to supply, all records are included in ‘Other Deer Experts’ in Table 6.
Since 2011, and allowing for the missing DeerAware data in 2020, there appears to have been a gradual increase in the number of records received from non-core sources.
Table 6. Numbers of DVC reports available in database with sufficient detail for mapping from a range of supplementary source categories.
| Period | DCS Roadkill Searches | Other Deer Experts | General Public | Police Control | Council Uplifts | Total |
|---|---|---|---|---|---|---|
| 2008 - 2012 | 199 | 31 | 15 | 359 | 335 | 939 |
| 2013 - 2017 | - | 80 | 130 | - | - | 210 |
| 2018 | - | 36 | 29 | - | - | 65 |
| 2019 | - | 49 | 30 | - | 1 | 80 |
| 2020 | - | 55 | 7 | - | - | 62 |
| 2021 | - | 78 | 44 | - | - | 122 |
| Total | 199 | 329 | 255 | 359 | 336 | 1,478 |
Overview of Scotland-wide distribution of DVC records from core sources
The distribution of DVC records within Scotland is shown in Figure 9.
Unsurprisingly, data from trunk road operating companies is focussed on trunk roads. Nevertheless, some records are from outside the trunk road network where operators have contracts to lift carcasses from these areas or where records are inaccurately located. The latter may be due to poor GPS fixes, though given some occur in situations such as service stations, depots and a notable cluster from a small airfield, it is likely that some records are logged after the event.
Data from the SSPCA and FALS (formerly Forestry Commission Scotland) covers the full road network, including parts outside the trunk road network, as well as forest tracks and locations more distant from roads. The distribution of the data therefore reflects the full road network, traffic densities, and human and deer population densities. These data contribute many records in the more urban areas of the central belt and Aberdeenshire.
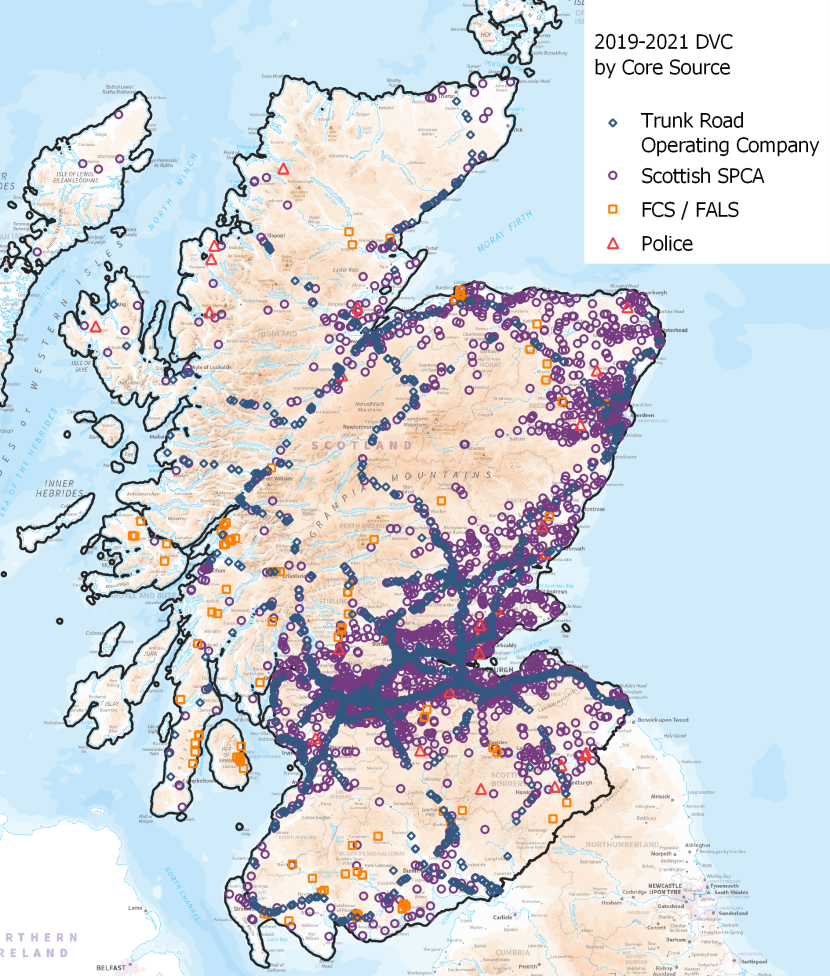
Figure 9. Locations of all mapped DVC reports obtained for 2019 to 2021 from Trunk Road Operating Companies, Scottish SPCA, Forestry and Land Scotland rangers and police STATS19 records. © Crown copyright (and database rights) 2022.
Click for a full description
Map of Scotland showing the locations of DVC reports, coloured by data supplier:
- Trunk Road Operating Company as blue diamonds
- Scottish SPCA as purple circles
- Forestry and Land Scotland (formerly Forestry Commission Scotland) as yellow squares
- Police STATS19 as red triangles
- Most records are scattered throughout Scotland, with obvious dense clusters in the central belt and Aberdeenshire.
The overall distribution of DVCs has changed little between 2016-2018 and 2019-2021 (Figure 10). DVCs are most frequently recorded on the trunk road network, through the central belt and around Aberdeen.
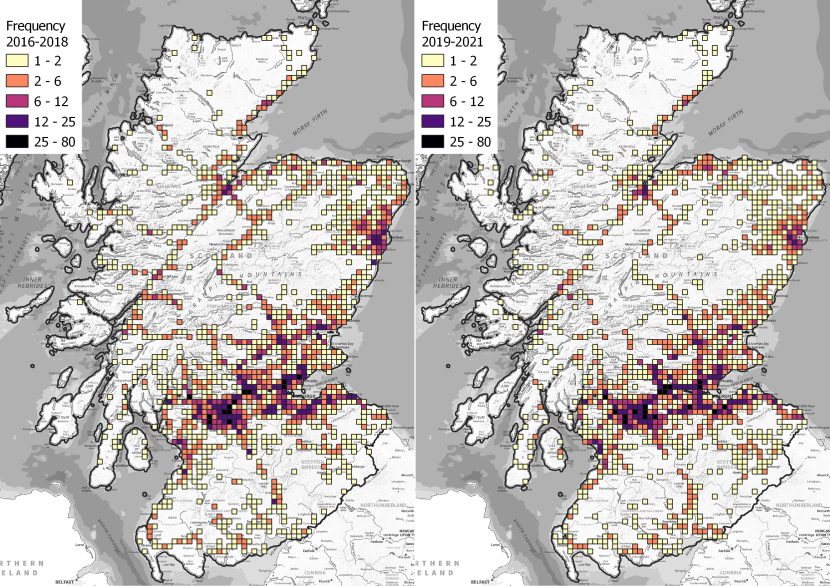
Figure 10. Distribution and frequency by 4 km by 4 km OS grid squares for DVC data from all core sources combined for 2016-2018 (left) and 2019-2021 (right). © Crown copyright (and database rights) 2022.
Click for a full description
Maps of Scotland showing 4 km by 4 km Ordnance Survey grid squares in 2016-2018 (left) and 2019-2021 (right). The colour of each grid square represents the number of DVCs it contains:
- 1-2 records as yellow
- 2-6 records as orange
- 6-12 records as dark red
- 12-25 records as dark purple
- 25-80 records as black
Data from all core sources are included. Comparison of the two periods mapped shows high densities of DVC reports in the central belt, around Aberdeen and around Inverness, but suggests very little change.
Changes in volume of TROC reports overall and by region
Overall, the number of DVCs reported by TROCs has remained relatively stable since 2009 (Figure 11). There was a notable dip in reported DVC incidents in 2018, despite greater consistency in the data sources utilised than in earlier years.
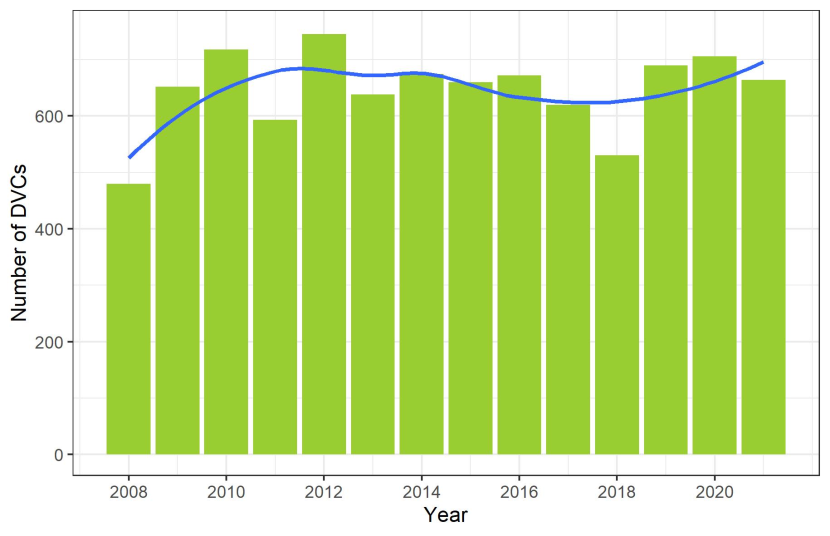
Figure 11. DVCs reported by Trunk Road Operating Companies for the years 2008 to 2021. A smoothed trendline is superimposed in blue.
Click for a full description
Bar chart showing the numbers of DVC reports received from Trunk Road Operating Companies per year. The y-axis is titled ‘Number of DVCs’ and ranges from 0 to 750, labelled at intervals of 200. The x-axis shows years from 2008 to 2021, labelled every 2 years. Numbers of DVC reports were low in 2008 (480) and 2018 (530), but otherwise vary between 592 to 745 each year. A smoothed LOESS trendline for all data is superimposed in blue, showing relatively little change in the number of DVC reports per year since 2009. The data are summarized in the following table.
|
Incident year |
Number of DVCs |
|---|---|
|
2008 |
480 |
|
2009 |
652 |
|
2010 |
718 |
|
2011 |
593 |
|
2012 |
745 |
|
2013 |
638 |
|
2014 |
674 |
|
2015 |
660 |
|
2016 |
672 |
|
2017 |
620 |
|
2018 |
530 |
|
2019 |
690 |
|
2020 |
706 |
|
2021 |
664 |
The number of DVC records reported by TROCs in the NE region has remained remarkably stable since 2008, though the number of records in the other units has been more variable (Figure 12). Fluctuations prior to 2018 are considered by Langbein (2019).
The NW region shows a gradual decline in the number of reported DVCs between 2015 and 2019, following which the number per year appears to have levelled off. Overall, there is a significant strong decline from 2008 to 2021 (Spearman's rank-order correlation, r = -0.64, p < 0.05). In contrast, the SE region shows a dramatic increase in reported DVCs since 2018 and an overall significant strong increase between 2008 and 2021 (Spearman's, r = 0.78, p < 0.01). The NE and SW regions show no significant change.
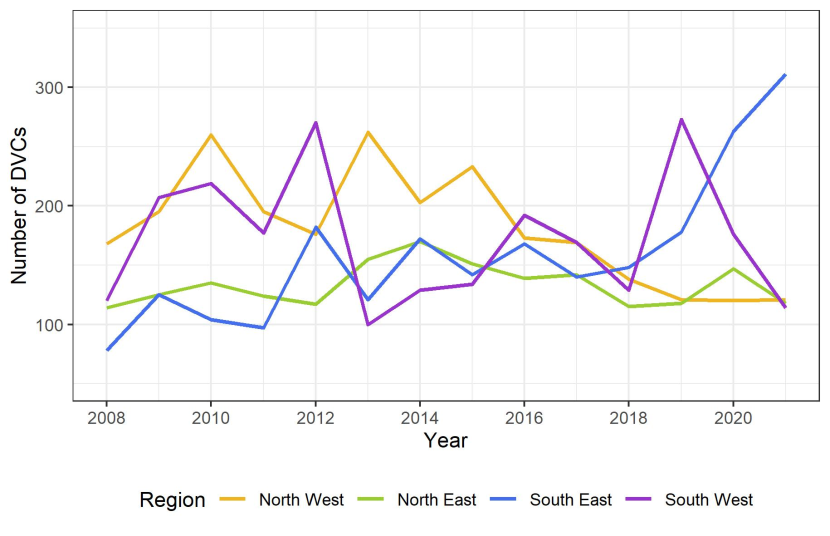
Figure 12. DVCs reported by Trunk Road Operating Companies by region (below) for the years 2008 to 2021.
Click for a full description
Chart showing number of DVCs reported by Trunk Road Operating Companies by region between 2008 – 2021. The y-axis is titled ‘Number of DVCs’ and ranges from 50 to 350. The x-axis shows years from 2008 to 2021. Each region is represented by a different coloured line. Though there is much variation in the number of DVCs reported in each year, overall trends are noted:
- North West in yellow, showing a gradual recent decline in DVC reports per year.
- North East in green, showing little change since in DVC reports per year.
- South East in blue, showing a distinct recent increase in DVC reports per year.
- South West in purple, showing great variation in the number of DVC reports per year, but no overall trend.
- The data are summarised in the following table.
Number of DVCs reported by Trunk Road Operating Companies in four regions, 2008-2021.
|
Year |
North East |
North West |
South East |
South West |
|---|---|---|---|---|
|
2008 |
114 |
168 |
78 |
120 |
|
2009 |
125 |
195 |
125 |
207 |
|
2010 |
135 |
260 |
104 |
219 |
|
2011 |
124 |
195 |
97 |
177 |
|
2012 |
117 |
176 |
182 |
270 |
|
2013 |
155 |
262 |
121 |
100 |
|
2014 |
170 |
203 |
172 |
129 |
|
2015 |
151 |
233 |
142 |
134 |
|
2016 |
139 |
173 |
168 |
192 |
|
2017 |
142 |
169 |
140 |
169 |
|
2018 |
115 |
138 |
148 |
129 |
|
2019 |
118 |
121 |
178 |
273 |
|
2020 |
147 |
120 |
263 |
176 |
|
2021 |
118 |
121 |
311 |
114 |
As mentioned in Trunk Road Operating Companies, there has been a significant increase in the number of DVC records in the SE unit since 2019. Records in most months in 2020 and 2021 were higher than 2019, with exceptional peaks in May and June 2021 (Figure 13).
Whilst the contract changed from Amey to Bear in August 2020, all records of DVCs in 2020 for the SE unit were supplied by Bear. SE records for 2020 and 2021 were based upon a direct extract from the IRIS database where the description or incident log mentioned ‘deer’. This included records that did not relate to DVCs, such as the inclusion of placenames (Deer Park Services), objects (John Deere tractors) and uninjured deer on the road verge. As Bear supplied the full description and incident log text, efforts were made to exclude irrelevant records before import into the database, based upon advanced text filtering.
Also included in the SE data for 2020 and 2021 were ‘no trace’ records mentioning dead deer were not located and uplifted by the TROC. These were reviewed, considered likely to be valid and were therefore retained in the database. However, these ‘no trace’ records accounted for only 12% of all records in 2020 and 2021. Since the average number of DVCs in 2020 and 2021 is 82% higher than that for 2016 to 2019 (Table 7), the ‘no trace’ records do not account for the full increase in DVCs since 2019.
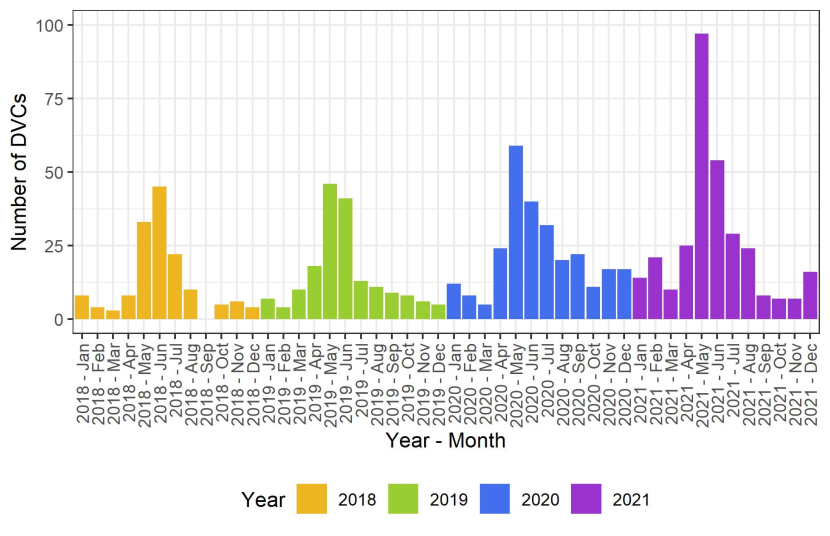
Figure 13. DVCs reported by Trunk Road Operating Companies per month for the South East unit between 2018 – 2021 showing an increasing trend since 2019.
Click for a full description
Bar chart showing the numbers of DVC reports per month provided by Trunk Road Operating Companies for the South East unit and Forth Bridges Unit combined between 2018 – 2021. The Forth Bridges Unit is included as it was subsumed into the South East unit on 17 August 2020. The y-axis is labelled ‘Number of DVCs’ and ranges from 0 to 100. The x-axis shows the year and month, covering 2018 to 2021. Bars are coloured by year:
- 2018 in orange
- 2019 in green
- 2020 in blue
- 2021 in purple
Each year follows a similar pattern, with a peak in DVC reports in May and June, but the overall number of DVC reports each year has increased, especially in 2020 and 2021. Data are summarised in the following table:
Number of DVCs reported per month by the South East trunk road unit in 2018 to 2021.
|
Month |
2018 |
2019 |
2020 |
2021 |
|---|---|---|---|---|
|
September |
0 |
9 |
21 |
8 |
|
April |
8 |
18 |
24 |
25 |
|
August |
10 |
11 |
20 |
24 |
|
December |
4 |
5 |
16 |
16 |
|
February |
4 |
4 |
8 |
20 |
|
January |
8 |
7 |
12 |
14 |
|
July |
22 |
13 |
30 |
29 |
|
June |
45 |
41 |
40 |
54 |
|
March |
3 |
10 |
5 |
10 |
|
May |
33 |
46 |
57 |
97 |
|
November |
6 |
6 |
17 |
7 |
|
October |
5 |
8 |
11 |
7 |
Most reported incidents in all regions come from the Trunk Road Units, with relatively small numbers being reported from the DBFOs (Table 7). Note that from 17th August 2020 the Forth Bridge DBFO was included in the SE unit data.
Table 7. Number of DVC reports logged by Trunk Road Operating Companies including DBFOs on trunk roads in differing regions of the Transport Scotland trunk road network by year. The regions are North East (NE), North West (NW), South East (SE) and South West (SW). Note: 2013 data for the South West region is partial, the Forth Bridges DBFO is part of the South East figures since August 2020.
| Year | North East | North East DBFOs | North West | North West DBFOs | South East | South East DBFOs | South West | South West DBFOs | Total |
|---|---|---|---|---|---|---|---|---|---|
| 2008 | 114 | - | 168 | - | 78 | - | 120 | 9 | 480 |
| 2009 | 123 | - | 195 | - | 125 | - | 207 | 13 | 650 |
| 2010 | 135 | 1 | 260 | - | 104 | - | 219 | 6 | 718 |
| 2011 | 124 | - | 195 | - | 97 | 2 | 176 | 9 | 592 |
| 2012 | 117 | - | 176 | - | 182 | 10 | 270 | 11 | 745 |
| 2013 | 155 | - | 261 | - | 121 | 9 | 100 | 15 | 637 |
| 2014 | 170 | - | 203 | - | 171 | 51 | 129 | 14 | 673 |
| 2015 | 151 | 6 | 233 | - | 142 | 53 | 134 | 13 | 660 |
| 2016 | 139 | 4 | 173 | - | 168 | 45 | 192 | 25 | 672 |
| 2017 | 142 | 1 | 169 | - | 140 | 29 | 169 | 16 | 620 |
| 2018 | 115 | 2 | 138 | - | 148 | 49 | 129 | 18 | 530 |
| 2019 | 117 | 4 | 121 | - | 178 | 52 | 269 | 19 | 685 |
| 2020 | 145 | 17 | 120 | - | 265 | 19 | 176 | 26 | 706 |
| 2021 | 118 | 5 | 119 | - | 312 | 3 | 114 | 15 | 663 |
| Total | 1,865 | 40 | 2,531 | - | 2,231 | 322 | 2,404 | 209 | 9,031 |
Observed changes based on the Scottish SPCA and FALS records
Unlike the data received from the TROCs, which is focussed on the trunk road network, data from the SSPCA and FALS offer an insight into DVC frequencies across the full Scottish road network.
The average number of records obtained from the SSPCA shows a clear increase between 2008 and 2017, with a slight dip in 2014 (Figure 14). However, the annual number of SSPCA records seems to have plateaued since its peak of c.1,250 records in 2017. There was a dip to c.900 in 2020 (see Impact of Covid on DVC frequency) but the number in 2021 was c.1,100, which is consistent with the numbers in 2018-2019. Despite the recent plateauing, there has been an overall strong increase between 2008 and 2021 (Spearman’s, r = 0.90, p < 0.001).
The number of records obtained from Forestry and Land Scotland (formerly Forestry Commission Scotland) has seen a general decline since 2011 (Figure 14). Although the number of records showed little decline between 2008 and 2011, the decline since 2008 is statistically significant (Spearman’s, r = -0.78, p < 0.01). Given a decline in DVCs is not visible in the analysis of all core data sources, the decline in reports received from Forestry and Land Scotland is considered in Evidence for DVC trends.
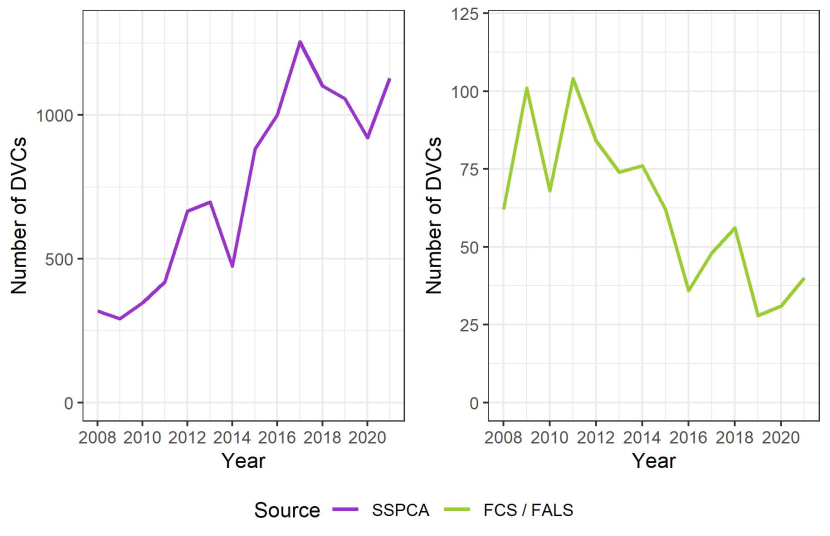
Figure 14. Changes in the number of DVC related incidents reported by the Scottish Society for the Prevention of Cruelty to Animals (SSPCA) and Forestry and Land Scotland (formerly Forestry Commission Scotland; FCS/FALS) between 2008 and 2021.
Click for a full description
Two charts showing number of DVCs reported by Scottish Society for the Prevention of Cruelty to Animals (SSPCA; left) and Forestry and Land Scotland (formerly Forestry Commission Scotland; FCS / FALS; right) between 2008 and 2021. In both charts, the y-axis is labelled ‘Number of DVCs’ and the x-axis shows years from 2008 to 2021, labelled every 2 years. The y-axis for the SSPCA chart ranges from 0 to 1,300, labelled at intervals of 500. The number of DVCs reported per year by the SSPCA varies, but shows an overall increase in DVC reports per year from 291 in 2009 to 1,255 in 2017, following which numbers have been lower and may have plateaued. The y-axis for the Forestry and Land Scotland chart ranges from 0 to 120, labelled at intervals of 25. The number of DVCs reported per year by the Forestry and Land Scotland also varies, but shows an overall decline from a peak of 104 in 2011 to 28 in 2019. The data are summarised in the following table.
Number of DVC related incidents reported by the Scottish Society for the Prevention of Cruelty to Animals (SSPCA) and Forestry and Land Scotland (formerly Forestry Commission Scotland; FCS/FALS) between 2008 and 2021.
|
Year |
FCS / FALS |
SSPCA |
|---|---|---|
|
2008 |
62 |
319 |
|
2009 |
101 |
291 |
|
2010 |
68 |
347 |
|
2011 |
104 |
419 |
|
2012 |
84 |
666 |
|
2013 |
74 |
698 |
|
2014 |
76 |
475 |
|
2015 |
62 |
883 |
|
2016 |
36 |
1,001 |
|
2017 |
48 |
1,255 |
|
2018 |
56 |
1,102 |
|
2019 |
28 |
1,058 |
|
2020 |
31 |
921 |
|
2021 |
40 |
1,129 |
The distribution of these records in each local authority area in Scotland is shown in Table 8. Aberdeenshire has the largest total number of records spanning all years, followed by Fife and then Highland. Perhaps unsurprisingly, the Western Isles contain the lowest frequency of reported DVCs.
Table 8. Numbers of DVC related incidents from Scottish SPCA and FC wildlife rangers broken down by Council administrative boundaries, and comparison of average combined total from both sources per year in the first 10-year period and the three latest study years. Unitary authorities are listed in descending totals across all years.
| Unitary Authority | 2008-2017 SSPCA | 2008-2017 FALS | 2008-2017 Mean | 2018-2021 SSPCA | 2018-2021 FALS | 2018-2021 Mean |
|---|---|---|---|---|---|---|
| Aberdeenshire | 904 | 53 | 96 | 452 | 7 | 115 |
| Fife | 613 | 8 | 62 | 427 | 1 | 107 |
| Highland | 426 | 160 | 59 | 275 | 20 | 74 |
| North Lanarkshire | 442 | - | 44 | 282 | 1 | 71 |
| Perth and Kinross | 413 | 2 | 42 | 270 | 2 | 68 |
| Argyll and Bute | 145 | 245 | 39 | 88 | 45 | 33 |
| Glasgow City | 298 | - | 30 | 164 | - | 41 |
| Aberdeen City | 290 | - | 29 | 101 | 1 | 26 |
| Stirling | 215 | 47 | 26 | 182 | 15 | 49 |
| Dumfries and Galloway | 143 | 114 | 26 | 113 | 35 | 37 |
| South Lanarkshire | 221 | 4 | 23 | 177 | 3 | 45 |
| Scottish Borders | 217 | 8 | 23 | 152 | 5 | 39 |
| Moray | 179 | 44 | 22 | 140 | 7 | 37 |
| Angus | 208 | 3 | 21 | 145 | 1 | 37 |
| East Lothian | 206 | - | 21 | 150 | - | 38 |
| East Dunbartonshire | 195 | - | 20 | 86 | - | 22 |
| Falkirk | 175 | 1 | 18 | 148 | - | 37 |
| Midlothian | 171 | - | 17 | 122 | - | 31 |
| West Lothian | 164 | 2 | 17 | 130 | 1 | 33 |
| City of Edinburgh | 113 | - | 11 | 113 | - | 28 |
| Renfrewshire | 102 | - | 10 | 71 | - | 18 |
| North Ayrshire | 84 | 8 | 9 | 61 | 9 | 18 |
| Clackmannanshire | 69 | 1 | 7 | 51 | - | 13 |
| East Renfrewshire | 66 | - | 7 | 41 | - | 10 |
| East Ayrshire | 60 | 6 | 7 | 37 | - | 9 |
| South Ayrshire | 61 | 3 | 6 | 42 | 2 | 11 |
| Dundee City | 63 | - | 6 | 36 | - | 9 |
| Inverclyde | 46 | - | 5 | 42 | - | 11 |
| West Dunbartonshire | 45 | - | 5 | 43 | - | 11 |
| Na h-Eileanan an Iar | 2 | - | 0 | 5 | - | 1 |
| Total | 6,336 | 709 | 705 | 4,146 | 155 | 1,075 |
Changes to the number of human injury collisions and damage-only DVCs attended by Police
Overall, there has been a significant strong decline in DVCs from road traffic collision reporting (Figure 15; Spearman’s, r = -0.83, p < 0.01). Most of this decline has been since 2018, with no significant decline in the number of records between 2008 and 2017. The average number of DVC records from road traffic collision reporting between 2018 and 2021 was little over half the average from previous years. This decline has been largely due to data availability (see Police and Road Safety Teams’ RTC records), so is not possible to determine whether there has been a change in the number of DVCs from road traffic collision reporting.
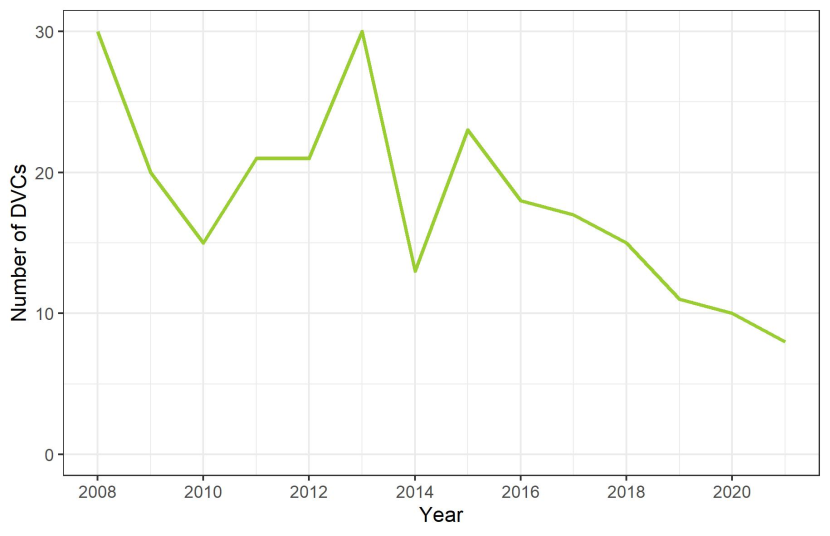
Figure 15. Changes in the number of personal injury DVC related incidents obtained from STATS19 between 2008 and 2021.
Click for a full description
Chart showing number of personal injury DVC related incidents obtained from STATS19 between 2008 and 2021. The y-axis is titled ‘Number of DVCs’ and ranges from 0 to 30, labelled at intervals of 10. The x-axis shows years from 2008 to 2020, labelled every 2 years. Numbers of DVCs reported per annum varied but remained relatively stable between 13 and 30 until about 2015, following which there has been a gradual decline to a low of 8 in 2021. Data are summarised in the following table.
Number of personal injury DVC related incidents obtained from STATS19 between 2008 and 2021.
|
Year |
Number of DVCs |
|---|---|
|
2008 |
30 |
|
2009 |
20 |
|
2010 |
15 |
|
2011 |
21 |
|
2012 |
21 |
|
2013 |
30 |
|
2014 |
13 |
|
2015 |
23 |
|
2016 |
18 |
|
2017 |
17 |
|
2018 |
15 |
|
2019 |
11 |
|
2020 |
10 |
|
2021 |
8 |
DVC distribution and change on the trunk network
As in previous projects (Langbein, 2019), the distribution and frequency of recorded DVC incidents on the trunk road network and elsewhere in Scotland has been presented as tetrads on the British National Grid. Incidents on trunk roads were taken to include all those within 250 m of the trunk road data (see Supplementary data sources), following three rules:
- Where the DVC record was associated with a section code in the most recent available trunk road dataset the DVC record was included only where it was with 250 m of that trunk road section.
- Where the DVC record was associated with a road number (e.g. A9) the DVC record was included only where it was with 250 m of that road.
- All other records were included where they were within 250 m of any trunk road in the network.
This was a slight modification of the approach described by Langbein (2019), but was done to reduce the number of incorrectly positioned records that were included as they were coincidentally within 250 m of the trunk road network.
The periods 2016-2018 and 2019-2021 were used to allow comparison with the results of Assessing DVC risk on the trunk road network. All records within these date periods were reassessed to determine whether they were within 250 m of the current trunk road network (see Supporting data), so this analysis therefore takes no account of changes in the network since 2016.
Note that the length of trunk road in each tetrad varies. Those tetrads that contain a greater length of trunk road are also likely to contain a higher number of DVCs. See Assessing DVC risk on the trunk road network for a more refined attempt at identifying DVC blackspots on the road network. Nevertheless, repeating the tetrad-based analysis allows comparison with previous studies and tetrads are easy to assess on small-scale maps.
To better show change in DVC density on the trunk road network between these two time periods, the number of recorded DVCs in 2019-2021 was subtracted from those recorded in 2016-2018.
Figures 16 to 22 show the overall pattern and change in density of DVCs across the trunk road network between the three-year periods 2016-2018 and 2019-2021. Greater amounts of green indicate a reduction in the number of DVCs on the trunk road network, whilst greater amounts of red and orange indicate an increase. Broad patterns, rather than change in individual tetrads, indicate:
- A reduction in the number of DVCs on the M73 and parts of the M8, M74 and M80 east of Glasgow.
- A reduction in the number of DVCs on the M9 between Stirling and Dunblane.
- A slight reduction in the number of DVCs between Dornoch and Helmsdale on the A9.
- An overall slight reduction in the number of DVCs between Perth and Inverness on the A9.
- An apparent overall increase in the number of DVCs around Edinburgh, including parts of the M8, M9, A985, M90 and A92.
- An increase in the number of DVCs on the M8 west of Glasgow, the northern ends of the M77 and A737, and the A82 as far north as Garelochhead.
- An increase in the number of DVCs on the A1 between Edinburgh and Grantshouse.
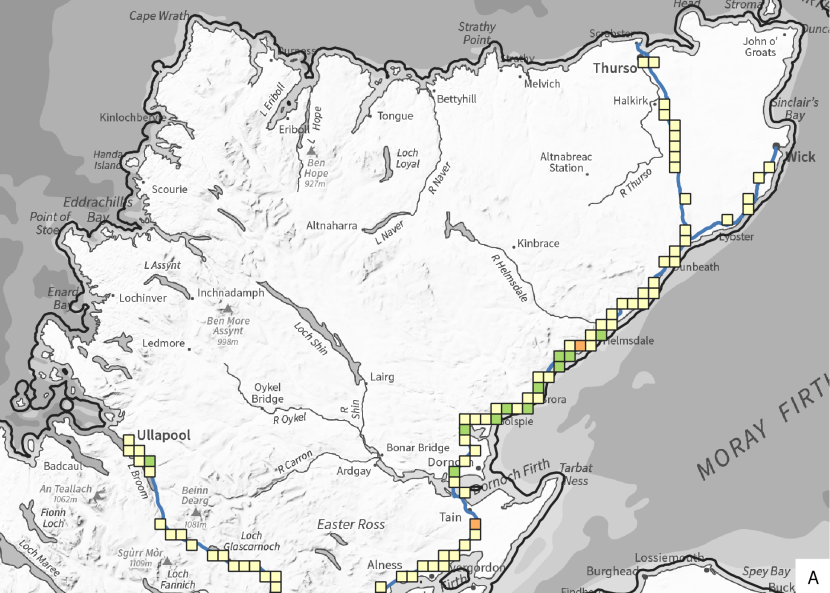
Figure 16. Distribution and change in frequency of trunk road DVCs reported by core sources per tetrad in North Highland. © Crown copyright (and database rights) 2022.
Click for a full description
Map of Highland north of a line from the Cromarty Firth to Loch Maree. Tetrads (2 km by 2 km Ordnance Survey squares) along the trunk road network are shown, coloured according to the change in the number of DVCs between the three-year periods 2016-2018 and 2019-2021. Green colours indicate a decrease in DVC numbers, whilst red colours indicate an increase:
- Decrease of 11 to 32 DVCs in dark green
- Decrease of 4 to 10 DVCs in light green
- Decrease of 3 to increase of 3 DVCs in yellow
- Increase of 4 to 10 DVCs in orange
- Increase of 11 to 32 DVCs in red
See text for the method of associating DVCs with trunk roads.
Overall little change is visible, except between the Dornoch Firth and Helmsdale, which shows a general decrease in the numbers of DVCs reported.
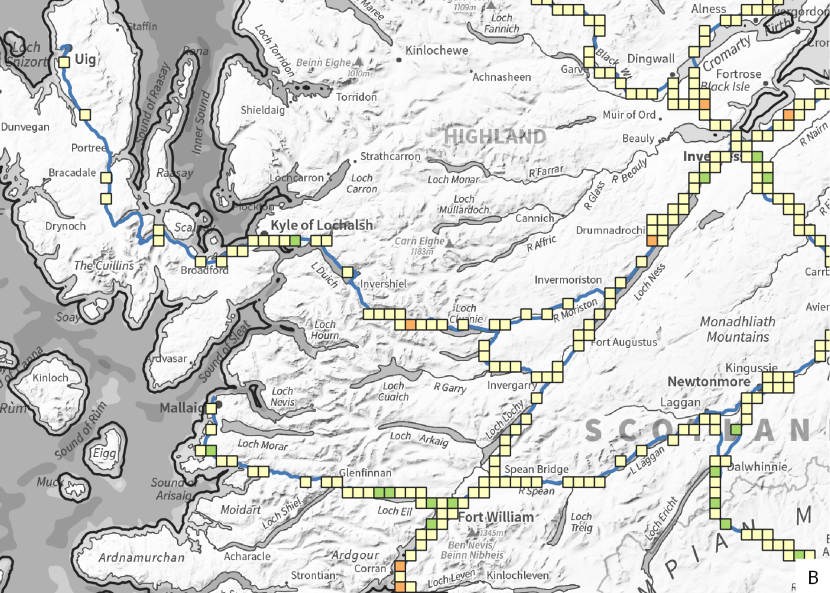
Figure 17. Distribution and change in frequency of trunk road DVCs reported by core sources per tetrad in West Highland. © Crown copyright (and database rights) 2022.
Click for a full description
Map of Highland between Ardnamurchan in the south west and the Cormarty Firth in the north east. Tetrads (2 km by 2 km Ordnance Survey squares) along the trunk road network are shown, coloured according to the change in the number of DVCs between the three-year periods 2016-2018 and 2019-2021. Green colours indicate a decrease in DVC numbers, whilst red colours indicate an increase:
- Decrease of 11 to 32 DVCs in dark green
- Decrease of 4 to 10 DVCs in light green
- Decrease of 3 to increase of 3 DVCs in yellow
- Increase of 4 to 10 DVCs in orange
- Increase of 11 to 32 DVCs in red
See text for the method of associating DVCs with trunk roads.
Overall little change is visible.
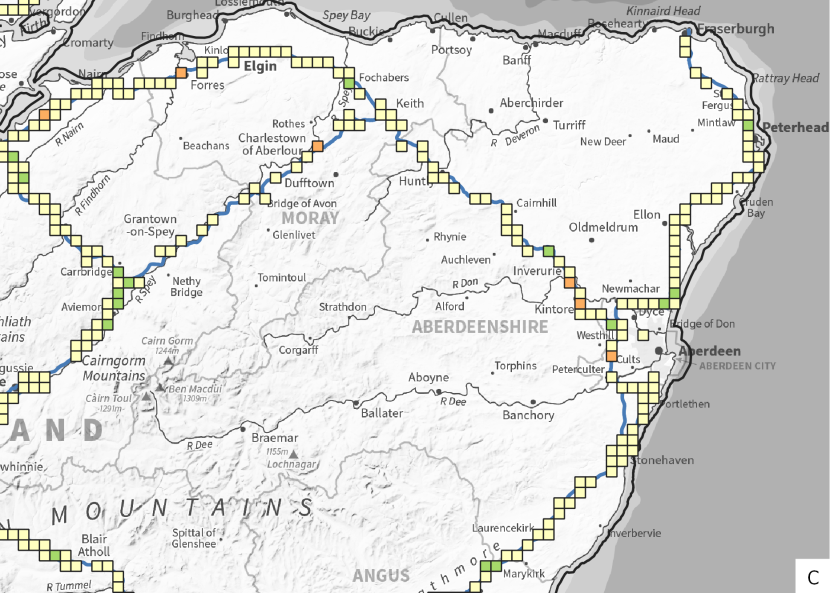
Figure 18. Distribution and change in frequency of trunk road DVCs reported by core sources per tetrad in north east Scotland. © Crown copyright (and database rights) 2022.
Click for a full description
Map of north east Scotland between Blair Atholl in the south west and the north east coast of Aberdeenshire in the north east. Tetrads (2 km by 2 km Ordnance Survey squares) along the trunk road network are shown, coloured according to the change in the number of DVCs between the three-year periods 2016-2018 and 2019-2021. Green colours indicate a decrease in DVC numbers, whilst red colours indicate an increase:
- Decrease of 11 to 32 DVCs in dark green
- Decrease of 4 to 10 DVCs in light green
- Decrease of 3 to increase of 3 DVCs in yellow
- Increase of 4 to 10 DVCs in orange
- Increase of 11 to 32 DVCs in red
See text for the method of associating DVCs with trunk roads.
Overall little change is visible.
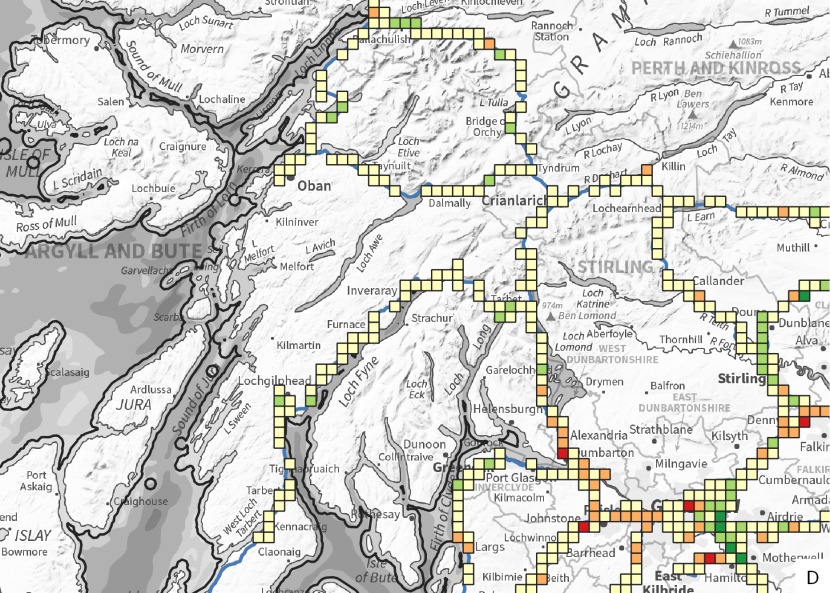
Figure 19. Distribution and change in frequency of trunk road DVCs reported by core sources per tetrad in west central Scotland. © Crown copyright (and database rights) 2022.
Click for a full description
Map of west central Scotland from Islay in the south west to Aberfeldy in the north east. Tetrads (2 km by 2 km Ordnance Survey squares) along the trunk road network are shown, coloured according to the change in the number of DVCs between the three-year periods 2016-2018 and 2019-2021. Green colours indicate a decrease in DVC numbers, whilst red colours indicate an increase:
- Decrease of 11 to 32 DVCs in dark green
- Decrease of 4 to 10 DVCs in light green
- Decrease of 3 to increase of 3 DVCs in yellow
- Increase of 4 to 10 DVCs in orange
- Increase of 11 to 32 DVCs in red
See text for the method of associating DVCs with trunk roads.
Increases and decreases are visible on varying trunk road stretches in the central belt. Little change is visible elsewhere.
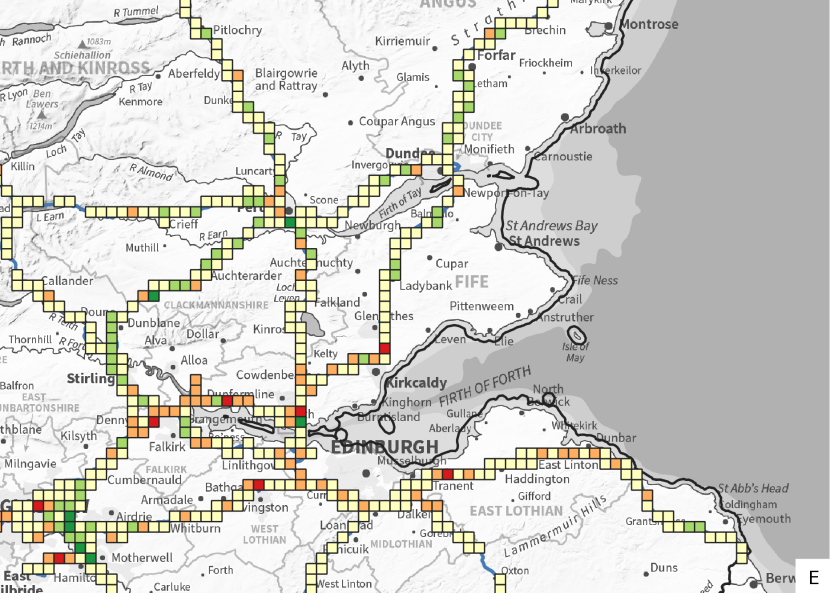
Figure 20. Distribution and change in frequency of trunk road DVCs reported by core sources per tetrad in east central Scotland. © Crown copyright (and database rights) 2022.
Click for a full description
Map of east central Scotland from East Kilbride in the south west to Montrose in the north east, extending east to Berwick-upon-Tweed. Tetrads (2 km by 2 km Ordnance Survey squares) along the trunk road network are shown, coloured according to the change in the number of DVCs between the three-year periods 2016-2018 and 2019-2021. Green colours indicate a decrease in DVC numbers, whilst red colours indicate an increase:
- Decrease of 11 to 32 DVCs in dark green
- Decrease of 4 to 10 DVCs in light green
- Decrease of 3 to increase of 3 DVCs in yellow
- Increase of 4 to 10 DVCs in orange
- Increase of 11 to 32 DVCs in red
See text for the method of associating DVCs with trunk roads.
Increases and decreases are visible along different trunk roads, with most increases occurring within the central belt.
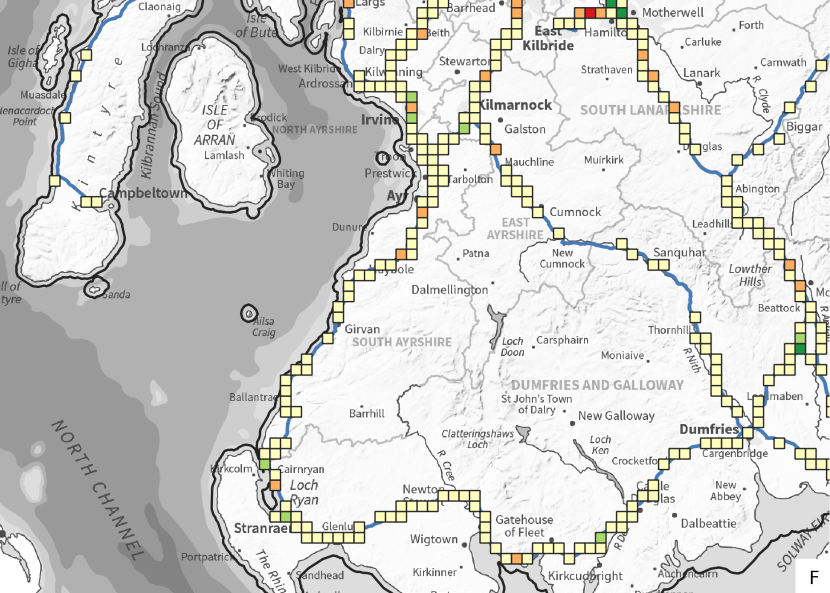
Figure 21. Distribution and change in frequency of trunk road DVCs reported by core sources per tetrad in south west Scotland. © Crown copyright (and database rights) 2022.
Click for a full description
Map of Scotland from Kirkcudbright in the south, Mull of Kintyre in the west and Forth in the north east. Tetrads (2 km by 2 km Ordnance Survey squares) along the trunk road network are shown, coloured according to the change in the number of DVCs between the three-year periods 2016-2018 and 2019-2021. Green colours indicate a decrease in DVC numbers, whilst red colours indicate an increase:
- Decrease of 11 to 32 DVCs in dark green
- Decrease of 4 to 10 DVCs in light green
- Decrease of 3 to increase of 3 DVCs in yellow
- Increase of 4 to 10 DVCs in orange
- Increase of 11 to 32 DVCs in red
See text for the method of associating DVCs with trunk roads.
Overall little change is visible.
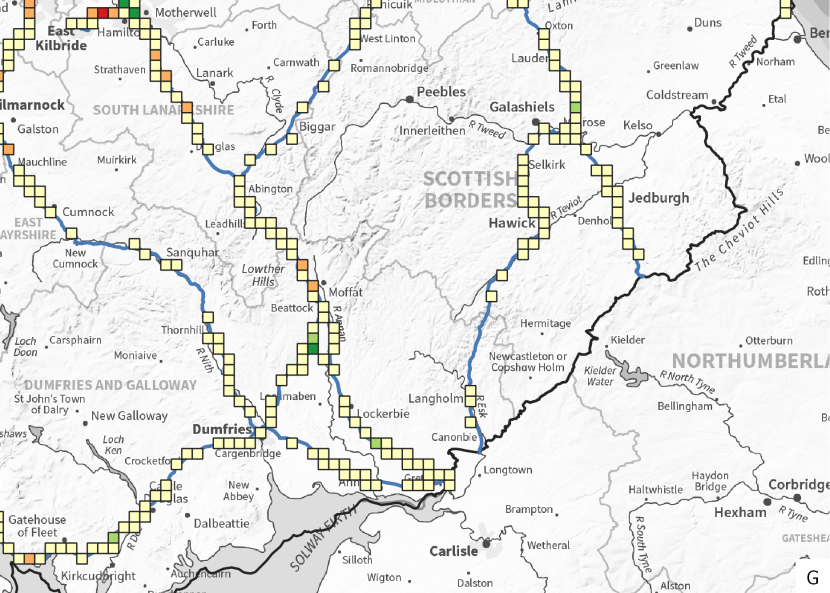
Figure 22. Distribution and change in frequency of trunk road DVCs reported by core sources per tetrad in south east Scotland. © Crown copyright (and database rights) 2022.
Click for a full description
Map of south east Scotland from Kirkcudbright in the south west to Berwick-upon-Tweed in the north east. Tetrads (2 km by 2 km Ordnance Survey squares) along the trunk road network are shown, coloured according to the change in the number of DVCs between the three-year periods 2016-2018 and 2019-2021. Green colours indicate a decrease in DVC numbers, whilst red colours indicate an increase:
- Decrease of 11 to 32 DVCs in dark green
- Decrease of 4 to 10 DVCs in light green
- Decrease of 3 to increase of 3 DVCs in yellow
- Increase of 4 to 10 DVCs in orange
- Increase of 11 to 32 DVCs in red
See text for the method of associating DVCs with trunk roads.
Overall little change is visible.
DVC distribution and change on the wider road network
Additional analysis was undertaken to gain an overview of the changing distribution and frequencies of DVCs across the entire Scottish road network, including non-trunk roads.
A grid of regular hexagonal cells was created covering Scotland, with each cell being approximately 100 km², i.e. each side was approximately 6,204 m long. Each cell was attributed with the total length of road it contained, taken from Ordnance Survey Open Roads data (see Supporting data) that had been clipped to Scotland only. As such, this analysis takes no account of changes to the road network through time. Each cell was also attributed with the number of DVC reports in the database for 2008 to 2017 and 2018 to 2021 for each of the following:
- All core and non-core records.
- Core records only.
- Core records excluding data from Trunk Road Operators. This included data collected for the whole road network that was not specifically targeted at trunk roads.
The DVC counts for each of the six combinations was divided by the length of road contained in each cell and the number of years covered to give the average number of DVCs per kilometre of road per year. The values for 2008 to 2017 were subtracted from the equivalent values for 2018 to 2021 to give the change in the average number of DVCs per kilometre of road per year.
The change in the average number of DVCs per kilometre of road per year using all DVC records is shown in Figure 23, core DVC records only in Figure 24 and core records excluding those from trunk road operators in Figure 25. In each case there was an overall increasing trend, so change per cell relative to the overall change is highlighted by styling the overall average change as white, instead of zero change. All show a relative increase in the average number of DVCs per kilometre of road per year in the central belt and an overall relative decrease in the north. This is less pronounced but still clear when data from the trunk road operators is excluded, which suggests that the trend is not solely due to an increase in incidents recorded from trunk roads in central belt.
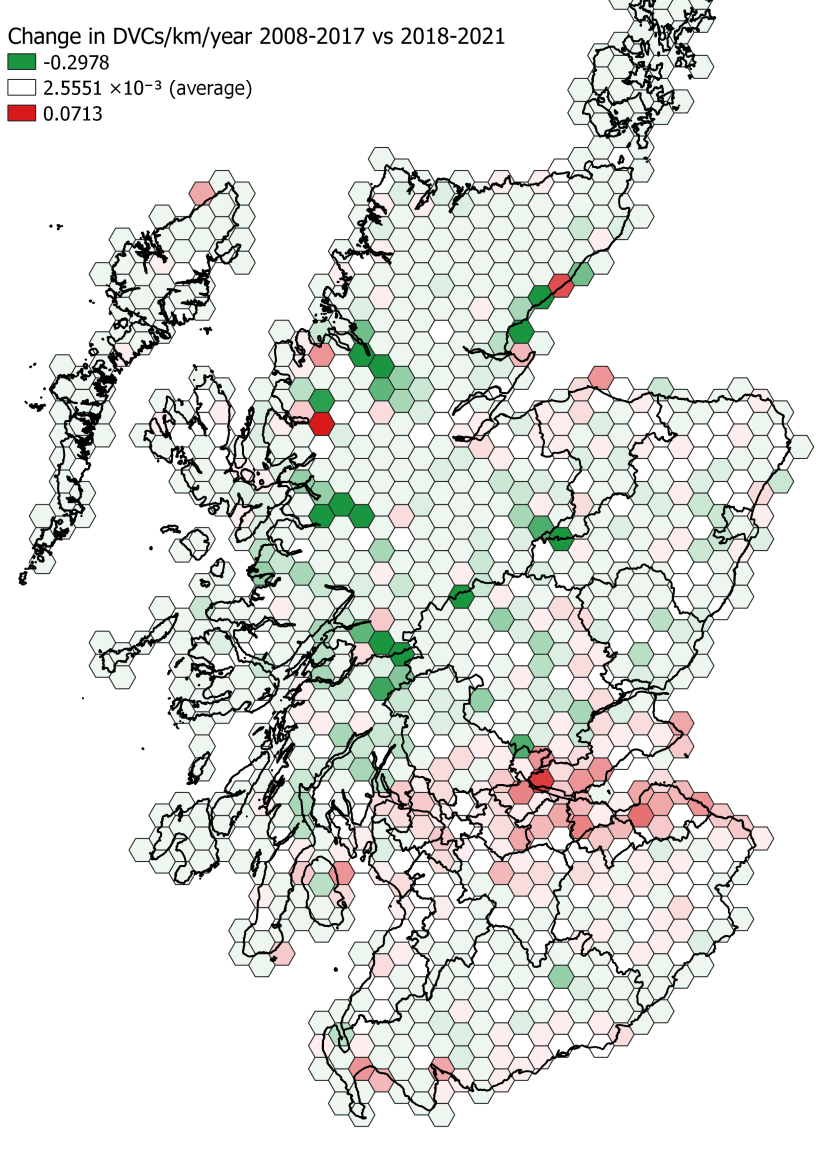
Figure 23. Change in the average number of DVCs per kilometre of road per year between 2008 to 2017 and 2018 to 2021 for the entire road network, calculated using all DVC records. © Crown copyright (and database rights) 2022.
Click for a full description
Map of Scotland showing the change in the average number of DVCs per kilometre of road per year in 100 km² hexagonal grid cells between 2008-2017 and 2018-2021. DVCs reported by all sources are included. The full road network is considered, rather than trunk roads only. See text for an explanation of how change was calculated.
The colour of each cell represents the change in average number of DVCs per kilometre of road per year. Since there is an overall trend of increasing numbers of DVC reports, white cells represent the average change rather than zero change. Thus, red cells indicate an above average increase in the number of DVCs per kilometre of road per year, whilst green cells indicate a below average change:
- The greatest decrease is -0.2978 DVCs per kilometre of road per year and is shown in dark green.
- The average change is 2.5551 ×10-³ DVCs per kilometre of road per year and is shown in white. This is so that reds and greens show below and above average change, concealing the overall trend.
- The greatest increase is 0.0713 DVCs per kilometre of road per year and is shown in dark red.
- Most of increase is in the central belt, whilst the north of Scotland shows the greatest overall decrease.

Figure 24. Change in the average number of DVCs per kilometre of road per year between 2008 to 2017 and 2018 to 2021 for the entire road network, calculated using only core DVC records. © Crown copyright (and database rights) 2022.
Click for a full description
Map of Scotland showing the change in the average number of DVCs per kilometre of road per year in 100 km² hexagonal grid cells between 2008-2017 and 2018-2021. Only DVCs reported by core sources are included. The full road network is considered, rather than trunk roads only. See text for an explanation of how change was calculated.
The colour of each cell represents the change in average number of DVCs per kilometre of road per year. Since there is an overall trend of increasing numbers of DVC reports, white cells represent the average change rather than zero change. Thus, red cells indicate an above average increase in the number of DVCs per kilometre of road per year, whilst green cells indicate a below average change:
- The greatest decrease is -0.2978 DVCs per kilometre of road per year and is shown in dark green.
- The average change is 3.3058 ×10-³ DVCs per kilometre of road per year and is shown in white. This is so that reds and greens show below and above average change, concealing the overall trend.
- The greatest increase is 0.0713 DVCs per kilometre of road per year and is shown in dark red.
- Most of increase is in the central belt, whilst the north of Scotland shows the greatest overall decrease.
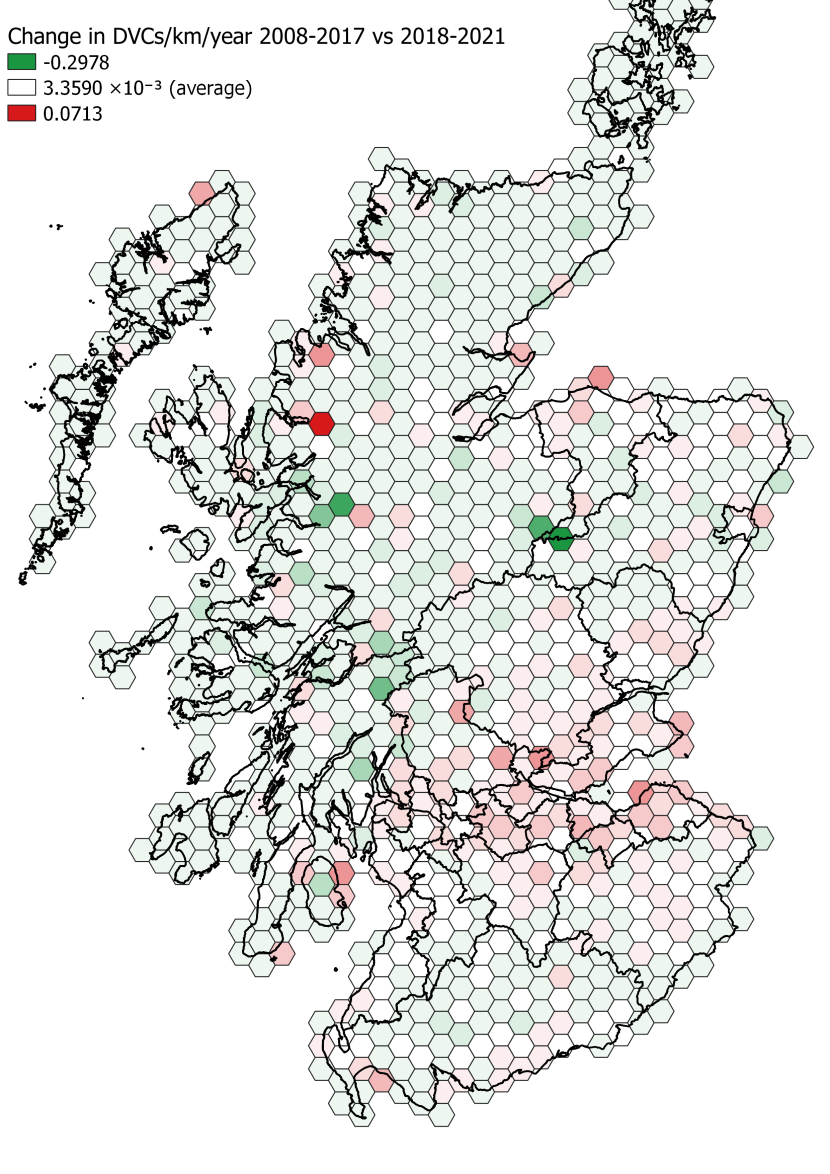
Figure 25. Change in the average number of DVCs per kilometre of road per year between 2008 to 2017 and 2018 to 2021 for the entire road network, excluding those collected by trunk road operators. © Crown copyright (and database rights) 2022.
Click for a full description
Map of Scotland showing the change in the average number of DVCs per kilometre of road per year in 100 km² hexagonal grid cells between 2008-2017 and 2018-2021. Only DVCs reported by core sources are included, but those reported by trunk road operators are excluded. The full road network is considered, rather than trunk roads only. See text for an explanation of how change was calculated.
The colour of each cell represents the change in average number of DVCs per kilometre of road per year. Since there is an overall trend of increasing numbers of DVC reports, white cells represent the average change rather than zero change. Thus, red cells indicate an above average increase in the number of DVCs per kilometre of road per year, whilst green cells indicate a below average change:
- The greatest decrease is -0.2978 DVCs per kilometre of road per year and is shown in dark green.
- The average change is 3.3590 ×10-³ DVCs per kilometre of road per year and is shown in white. This is so that reds and greens show below and above average change, concealing the overall trend.
- The greatest increase is 0.0713 DVCs per kilometre of road per year and is shown in dark red.
- Most of increase is in the central belt, whilst the north of Scotland shows the greatest overall decrease.
Combined records from all core sources by local authority areas
Highland contains the largest number of DVC incident reports from core sources (Table 9), largely due to large numbers reported by the North West unit trunk road operating company (Figure 26). Aberdeenshire, Fife, and Perth and Kinross also contribute large numbers of recorded DVC incidents. The differences may be partially due to the length of trunk road within each local authority (Table 2).
Table 9. Number of DVC records obtained from all four core source types combined and proportion contributed by Trunk Road Operating Companies (TROCs) within each Council area during two time periods. Data for 2008-2017 is the average records over the 10-year period. Data for 2018-2021 is the average records over the 4-year period. Unitary authorities are listed in descending totals across all years.
| Unitary Authority | 2008-2017 All Core Avg | 2008-2017 % TROC | 2018-2021 All Core Avg | 2018-2021 % TROC |
|---|---|---|---|---|
| Highland | 201 | 58.8 | 161 | 52.9 |
| Perth and Kinross | 130 | 67.2 | 124 | 45.4 |
| Fife | 118 | 32.8 | 173 | 37.3 |
| Aberdeenshire | 118 | 17.0 | 136 | 15.2 |
| Argyll and Bute | 74 | 47.4 | 49 | 32.5 |
| North Lanarkshire | 71 | 37.8 | 93 | 24.3 |
| Dumfries and Galloway | 69 | 62.9 | 72 | 49.0 |
| Stirling | 66 | 56.7 | 79 | 37.0 |
| Glasgow City | 65 | 54.7 | 73 | 44.4 |
| South Lanarkshire | 49 | 54.2 | 74 | 38.5 |
| East Lothian | 43 | 51.4 | 80 | 53.1 |
| Falkirk | 43 | 54.4 | 75 | 50.7 |
| Angus | 40 | 45.1 | 47 | 19.6 |
| Scottish Borders | 38 | 39.0 | 58 | 28.9 |
| Aberdeen City | 32 | 10.9 | 28 | 9.7 |
| Moray | 27 | 16.5 | 42 | 12.5 |
| Renfrewshire | 27 | 62.5 | 41 | 56.7 |
| West Lothian | 23 | 28.7 | 51 | 34.6 |
| Midlothian | 23 | 25.0 | 36 | 17 |
| North Ayrshire | 21 | 57.1 | 33 | 46.2 |
| City of Edinburgh | 20 | 43.9 | 53 | 46.7 |
| East Dunbartonshire | 19 | 0.0 | 21 | 0.0 |
| South Ayrshire | 17 | 63 | 25 | 56.4 |
| East Renfrewshire | 12 | 48.8 | 20 | 48.8 |
| West Dunbartonshire | 11 | 62.2 | 21 | 50.0 |
| East Ayrshire | 11 | 41.1 | 16 | 43.1 |
| Inverclyde | 9 | 50.0 | 15 | 30.0 |
| Clackmannanshire | 7 | 4.1 | 13 | 5.6 |
| Dundee City | 7 | 17.1 | 13 | 34.5 |
| Na h-Eileanan an Iar | 0 | 0.0 | 1 | 0.0 |
| Total | 1,404 | 45.9 | 1,732 | 37.3 |
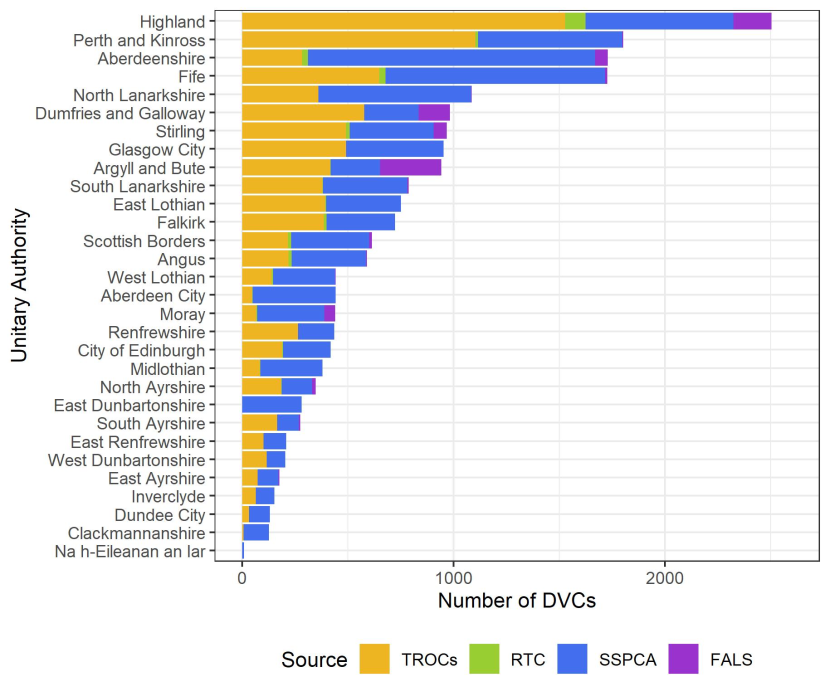
Figure 26. Total number of DVCs reported from 2008 to 2021 from all core sources within each Scottish local authority, segmented by source type.
Click for a full description
The figure is a bar chart that has been converted into the following table.
Number of DVCs reported by core sources in each Scottish local authority. TROC = Trunk Road Operating Company data, RTC = Road Traffic Collision data, SSPCA = Scottish Society for the Prevention of Cruelty to Animals; FALS = Forestry and Land Scotland.
|
Unitary authority |
SSPCA |
FALS |
RTC |
TROC |
Total |
|---|---|---|---|---|---|
|
Highland |
709 |
184 |
95 |
1,529 |
2,517 |
|
Perth and Kinross |
687 |
4 |
12 |
1,105 |
1,808 |
|
Aberdeenshire |
1,369 |
60 |
28 |
287 |
1,744 |
|
Fife |
1,051 |
9 |
28 |
650 |
1,738 |
|
North Lanarkshire |
730 |
1 |
- |
361 |
1,092 |
|
Dumfries and Galloway |
257 |
149 |
- |
580 |
986 |
|
Stirling |
398 |
62 |
17 |
494 |
971 |
|
Glasgow City |
467 |
- |
- |
491 |
958 |
|
Argyll and Bute |
233 |
291 |
2 |
417 |
943 |
|
South Lanarkshire |
405 |
7 |
2 |
381 |
795 |
|
East Lothian |
357 |
- |
4 |
393 |
754 |
|
Falkirk |
326 |
1 |
12 |
387 |
726 |
|
Scottish Borders |
370 |
13 |
16 |
216 |
615 |
|
Angus |
355 |
4 |
15 |
218 |
592 |
|
Aberdeen City |
395 |
1 |
3 |
47 |
446 |
|
Moray |
321 |
51 |
4 |
66 |
442 |
|
West Lothian |
295 |
3 |
6 |
138 |
442 |
|
Renfrewshire |
174 |
- |
- |
263 |
437 |
|
City of Edinburgh |
228 |
- |
3 |
187 |
418 |
|
Midlothian |
294 |
- |
3 |
83 |
380 |
|
North Ayrshire |
146 |
17 |
1 |
185 |
349 |
|
East Dunbartonshire |
284 |
- |
- |
- |
284 |
|
South Ayrshire |
105 |
5 |
- |
166 |
276 |
|
East Renfrewshire |
107 |
- |
- |
102 |
209 |
|
West Dunbartonshire |
89 |
- |
- |
119 |
208 |
|
East Ayrshire |
97 |
6 |
- |
74 |
177 |
|
Inverclyde |
88 |
- |
- |
64 |
152 |
|
Dundee City |
99 |
- |
- |
32 |
131 |
|
Clackmannanshire |
121 |
1 |
- |
6 |
128 |
|
Na h-Eileanan an Iar |
7 |
- |
1 |
- |
8 |
|
Total |
10,564 |
869 |
252 |
9,041 |
20,726 |
Human injury collisions and damage-only DVCs attended by police
Owing to changes in the availability of STATS19 data (Police and Road Safety Teams’ RTC records), the full analyses undertaken by Langbein (2019) have not been replicated.
Nevertheless, based upon an assessment of the limited human injury collision data available for 2018 to 2021, the assessment that approximately half of all accidents were caused by deer that themselves escaped injury remains unchallenged. However, it is likely that many incidents involving deer resulted in the vehicle and driver, and often also the deer, escaping without significant damage or injury. Many of these are unlikely to be reported, either as road traffic accidents or as injured or dead deer. This complex situation means that accident data should not be interpreted as an indication that the actual number of DVCs is twice that indicated by the other core sources.
Whilst most human personal injuries sustained through deer related road accidents are slight, there were a much higher proportion of serious and fatal incidents reported between 2018 and 2021 (Figure 27). This includes three fatal incidents: one in Highland in 2018, one in Aberdeenshire in 2019; and one in South Lanarkshire in 2020. Unfortunately, it is difficult to draw any conclusions about this due to known gaps in the data: if all missing data between 2018 and 2021 related to slight injuries, the overall severity would be similar to previous years.
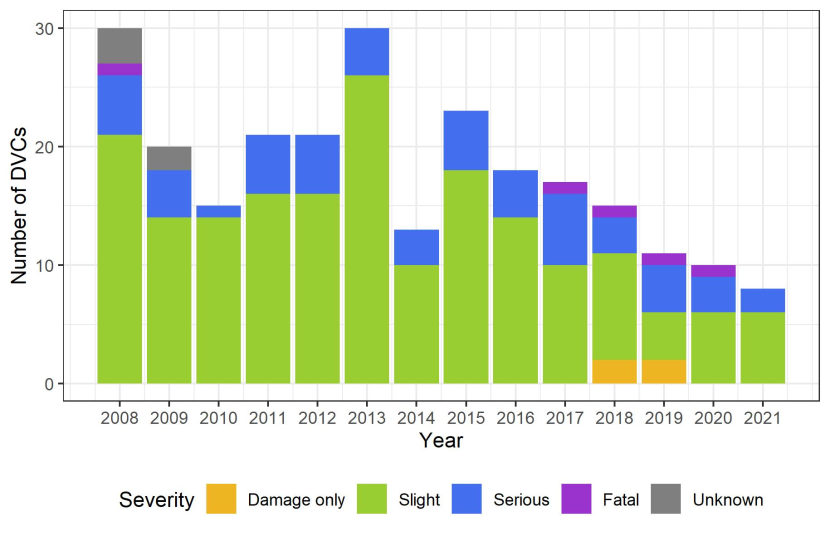
Figure 27. Severity of deer related human personal injury road accidents by year, based only on DVC incidents attended by the police and hence with the most reliable actual incident times (n = 252).
Click for a full description
Stacked bar chart showing the severity of deer related human personal injury road accidents by year. Only DVC incidents that were attended by the police and have the most reliable actual incident times are included. The y-axis is titled ‘Number of DVCs’ and ranges from 0 to 30, labelled at intervals of 10. The x-axis shows years from 2008 to 2021. A decline in the number of DVCs reported is shown, but no pattern is visible for severity. The data are summarised in the following table.
Severity of deer related human personal injury road accidents in each year.
|
Year |
Damage only |
Fatal |
Serious |
Slight |
Unknown |
Total |
|---|---|---|---|---|---|---|
|
2008 |
- |
1 |
5 |
21 |
3 |
30 |
|
2009 |
- |
- |
4 |
14 |
2 |
20 |
|
2010 |
- |
- |
1 |
14 |
- |
15 |
|
2011 |
- |
- |
5 |
16 |
- |
21 |
|
2012 |
- |
- |
5 |
16 |
- |
21 |
|
2013 |
- |
- |
4 |
26 |
- |
30 |
|
2014 |
- |
- |
3 |
10 |
- |
13 |
|
2015 |
- |
- |
5 |
18 |
- |
23 |
|
2016 |
- |
- |
4 |
14 |
- |
18 |
|
2017 |
- |
1 |
6 |
10 |
- |
17 |
|
2018 |
2 |
1 |
3 |
9 |
- |
15 |
|
2019 |
2 |
1 |
4 |
4 |
- |
11 |
|
2020 |
- |
1 |
3 |
6 |
- |
10 |
|
2021 |
- |
- |
2 |
6 |
- |
8 |
DVC frequency in relation to Time of day and Season
Diurnal patterns of DVC occurrence
Whilst times are associated with many DVC records received, most are unrelated to the time of the incident, relating instead to the time of report or carcass uplift. The data likely to include the most incident time records are the police incident reports, where the times recorded relate to the time of the incident and are assumed to be accurate.
Based on reports with reliable time records, the peak period for DVC incidents appears to be between 21:00 and 00:00 (Figure 28). This peak is not prominent between December to February, where comparatively high numbers of incidents occur from 15:00 through to 00:00 (Figure 29).
A smaller peak is visible in the preceding period of 18:00 to 21:00 (Figure 28), though this appears to be particularly prominent in September to November.
These patterns reflect those reported by Langbein (2019), though that study was able to supplement this information with c.400 records collected prior to 2008 that were not available for this analysis.
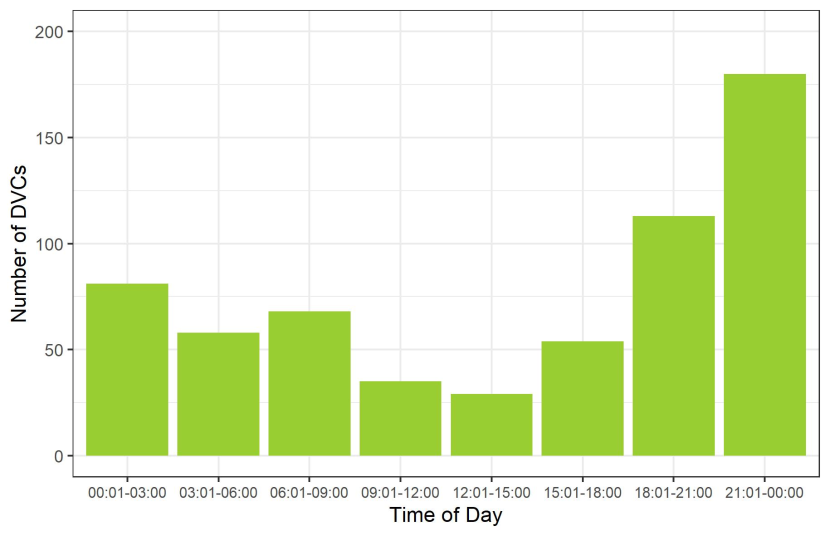
Figure 28. Relative frequency of DVC occurrence in differing daily time periods, based only on DVC incidents attended by the police and hence with the most reliable actual incident times (n = 618).
Click for a full description
Bar chart showing the number of DVCs reported for different periods in the day. Only DVC incidents attended by the police are included, as these include the most reliable actual incident times. All qualifying records between 2008 and 2021 are included. The y-axis is titled ‘Number of DVCs’ and ranges from 0 to 200, with labels at intervals of 50. The x-axis is titled ‘time of day’ and is labelled with eight 3-hour periods, starting with 00:01-03:00 and ending with 21:01-00:00. Between 00:01 and 09:00 the number of DVCs is between 58 and 81 in each 3-hour period. Between 09:01 and 15:00 the number of DVCs in each 3-hour period is lower, at 29 to 35. The numbers of DVCs start to increase in the period 51:01-18:00 (54), through 18:01-21:00 (113) to a peak between 21:01-00:00 (180).
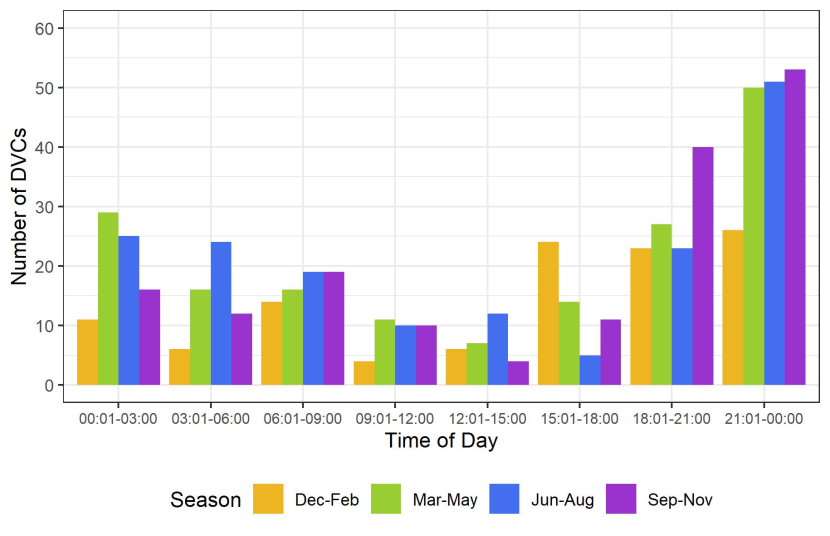
Figure 29. Relative frequency of DVC occurrence in differing daily time periods in differing seasons, based only on DVC incidents attended by the police and hence with the most reliable actual incident times (n = 618).
Click for a full description
Bar chart showing the number of DVCs reported in each season for different periods in the day. Only DVC incidents attended by the police are included, as these include the most reliable actual incident times. All qualifying records between 2008 and 2021 are included. The y-axis is titled ‘Number of DVCs’ and ranges from 0 to 60, with labels at intervals of 10. The x-axis is titled ‘time of day’ and is labelled with eight 3-hour periods, starting with 00:01-03:00 and ending with 21:01-00:00. Seasons are expressed as four 3-month periods: December to February in yellow, March to May in green, June to August in blue and September to November in purple. Data are summarised in the following table.
Number of DVC reports in differing daily time periods in differing seasons, based only on DVC incidents attended by the police.
|
Time of day |
Dec-Feb |
Jun-Aug |
Mar-May |
Sep-Nov |
|---|---|---|---|---|
|
00:01-03:00 |
11 |
32 |
33 |
23 |
|
03:01-06:00 |
6 |
23 |
13 |
12 |
|
06:01-09:00 |
14 |
24 |
20 |
19 |
|
09:01-12:00 |
4 |
8 |
10 |
11 |
|
12:01-15:00 |
6 |
11 |
11 |
5 |
|
15:01-18:00 |
24 |
8 |
9 |
10 |
|
18:01-21:00 |
23 |
15 |
22 |
32 |
|
21:01-00:00 |
26 |
49 |
51 |
53 |
|
Total |
114 |
170 |
169 |
165 |
Seasonal patterns of DVC occurrence by road type and region
As found by Langbein (2011), seasonal patterns in reported DVC occurrences showed a peak in May to June (Figure 30).
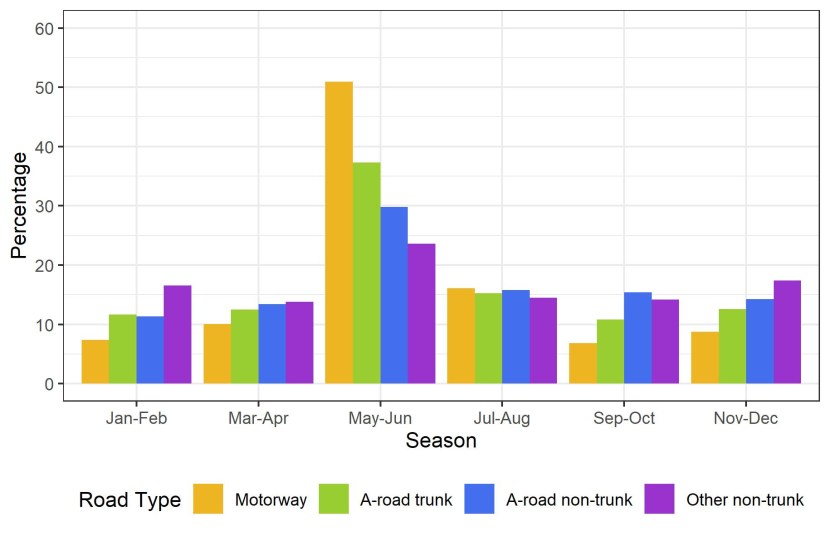
Figure 30. Seasonal pattern of DVCs in Scotland on trunk roads (motorways plus strategic A roads), A-class non-trunk roads and minor roads. Motorway n = 2,656; A-road trunk n = 6,890; A-road non-trunk n = 1,922, Other non-trunk = 11,178.
Click for a full description
Bar chart showing the percentage of DVCs reported in each season for different road type. All records between 2008 and 2021 are included, except those identified as possible duplicates. The y-axis shows the percentage of DVCs from each road type that occur in each season and ranges from 0% to 60%, with labels at intervals of 10%. The x-axis is titled ‘Season’ and is labelled with six 2-month periods, starting with January to February and ending with November to December. Road types are coloured as: Motorway in yellow, A-roads that are part of the trunk road network in green, A roads that are not part of the trunk road network in blue and other non-trunk roads in purple. Data are summarised in the following table.
Percentage of DVC reports from different road types in differing 2-month periods, based only on DVC incidents attended by the police.
|
Season |
A-Road |
A-Road Non-Trunk |
Motorway |
Other Non-Trunk |
|---|---|---|---|---|
|
Jan-Feb |
11.8 |
11.1 |
7.4 |
16.5 |
|
Jul-Aug |
15.4 |
15.2 |
16.2 |
14.5 |
|
Mar-Apr |
12.4 |
13.7 |
9.8 |
13.6 |
|
May-Jun |
37.1 |
29.6 |
51.1 |
23.7 |
|
Nov-Dec |
12.3 |
15.3 |
8.7 |
17.3 |
|
Sep-Oct |
11.0 |
15.0 |
6.8 |
14.4 |
|
Total |
100 |
100 |
100 |
100 |
Whilst the results are broadly similar to those presented by Langbein (2011), there are indications of trends:
- The average annual numbers of DVCs reported from motorways was higher in 2018-2021 than in the preceding ten years. However, the proportions occurring between March and August appear to have declined (Table 10).
- The average annual numbers of DVCs reported from A-class trunk roads in 2018-2021 was lower than in the preceding ten years. The proportions in each period across the entire fourteen-year dataset was consistent (Table 11).
- The average annual numbers of DVCs reported from non-trunk A-roads was higher in 2018-2021 than in the preceding ten years. In addition, the proportion reported in May and June was much higher in 2018-2021 than previously (Table 12).
- The annual numbers of DVCs reported from other non-trunk roads has been highly variable since 2008, so although the numbers in 2018-2021 are lower it is not possible to discern any trends. The proportions in each period across the entire fourteen-year dataset appear to be relatively consistent (Table 13).
Table 10. Seasonal distribution of DVCs reported on motorways by years.
| Period | 2008-2012 | 2013-2017 | 2018-2021 |
|---|---|---|---|
| Jan-Feb | 5.14% | 8.23% | 9.03% |
| Mar-Apr | 10.60% | 10.31% | 8.22% |
| May-Jun | 53.55% | 51.22% | 48.15% |
| Jul-Aug | 14.54% | 17.84% | 16.55% |
| Sep-Oct | 7.65% | 4.75% | 8.10% |
| Nov-Dec | 8.52% | 7.65% | 9.95% |
| Total | 100% | 100% | 100% |
| Sample Size | 915 | 863 | 864 |
Table 11. Seasonal distribution of DVCs reported on A-class trunk roads by years.
| Period | 2008-2012 | 2013-2017 | 2018-2021 |
|---|---|---|---|
| Jan-Feb | 12.78% | 10.70% | 10.65% |
| Mar-Apr | 12.37% | 11.08% | 12.76% |
| May-Jun | 37.84% | 38.15% | 38.86% |
| Jul-Aug | 13.48% | 16.97% | 16.91% |
| Sep-Oct | 10.75% | 10.59% | 10.89% |
| Nov-Dec | 12.78% | 12.50% | 9.92% |
| Total | 100% | 100% | 100% |
| Sample Size | 2,418 | 2,663 | 1,230 |
Table 12. Seasonal distribution of DVCs reported on non-trunk A-roads by years.
| Period | 2008-2012 | 2013-2017 | 2018-2021 |
|---|---|---|---|
| Jan-Feb | 11.59% | 9.64% | 11.56% |
| Mar-Apr | 14.92% | 13.45% | 12.70% |
| May-Jun | 27.37% | 25.90% | 35.83% |
| Jul-Aug | 15.78% | 17.67% | 15.15% |
| Sep-Oct | 14.80% | 17.27% | 14.50% |
| Nov-Dec | 15.54% | 16.06% | 10.26% |
| Total | 100% | 100% | 100% |
| Sample Size | 811 | 498 | 614 |
Table 13. Seasonal distribution of DVCs reported on other non-trunk roads by years. Note that data for other non-trunk road was not included in the table in Langbein (2011).
| Period | 2008-2012 | 2013-2017 | 2018-2021 |
|---|---|---|---|
| Jan-Feb | 15.76% | 16.44% | 17.93% |
| Mar-Apr | 14.79% | 13.13% | 11.76% |
| May-Jun | 23.85% | 24.37% | 23.19% |
| Jul-Aug | 13.90% | 13.78% | 17.35% |
| Sep-Oct | 14.22% | 13.88% | 14.26% |
| Nov-Dec | 17.48% | 18.40% | 15.51% |
| Total | 100% | 100% | 100% |
| Sample Size | 2,792 | 4,251 | 1,199 |
Impact of Covid on DVC frequency
A significant feature of the years covered by this study was the emergence and spread of Covid‑19. Whilst there is limited evidence that this affected deer populations directly, legally enforced travel restrictions and guidance that encouraged people to say at home would have reduced the amount of vehicular travel. Fewer vehicles may in turn have affected the behaviour of deer around roads and the likelihood of DVCs. The impact of Covid-19 was coined the ‘anthropause’, with the suggestion that it provided an opportunity to gain insights into the effect of human activity on wildlife (Rutz et al., 2020).
Bíl et al. (2021) considered the impact of reduced road traffic volumes due to Covid‑19 restrictions on wildlife-vehicle collisions in a range of European countries and Israel. Included in the study was data on DVCs in Scotland, though it failed to identify any statistically significant reductions in DVC7s due to travel restrictions in 2020. However, Bíl et al. (2021) were only able to include a rapidly collated and likely incomplete dataset of Scottish DVCs, focused primarily on the trunk road network (Langbein, pers. comm.). The current study can consider a much wider dataset also covering non-trunk roads.
The analysis discussed earlier suggests no overall change in DVC numbers in 2020. There was an apparent reduction in SSPCA records in 2020 (Figure 14) that may have been due to Covid-19 travel restrictions. However, this may be due to a reduction in the number of people actively reporting DVCs during travel restrictions, rather than a reduction in the numbers of DVCs. This is supported by the numbers reported by trunk road operating companies, who still had a contractual obligation to uplift and record deer carcasses on the trunk road network. Data provided by the trunk road operating companies showed no difference between 2020 and the other years considered by this study (Figure 12).
There was no evidence of any difference in the number of DVC reports in 2021, although advisory travel restrictions applied for much of the year.
National travel restrictions were enforced in the UK between 24 March and 3 July 2020. This coincided with the usual peak of DVCs in May and June (Figure 30). Outside of this period, travel restrictions were advisory and may have had less impact on DVCs. We therefore considered whether these restrictions had a noticeable impact on DVCs in Scotland within this period.
The usual peak in DVCs in May and June is still evident in 2020 with no evidence of a reduction in DVCs when volunteer collected data is excluded (Figure 31). There is evidence of a decline in DVC numbers after the introduction of travel restrictions and a sharp increase after they are lifted, but these may be a result of random fluctuations rather than any impact from travel restrictions.
The total number of DVCs not reported by volunteers for weeks thirteen to twenty-six in 2020 was 362, which is higher than the average for previous five years (340). This may reflect the continuation of a generally increasing trend in this data.
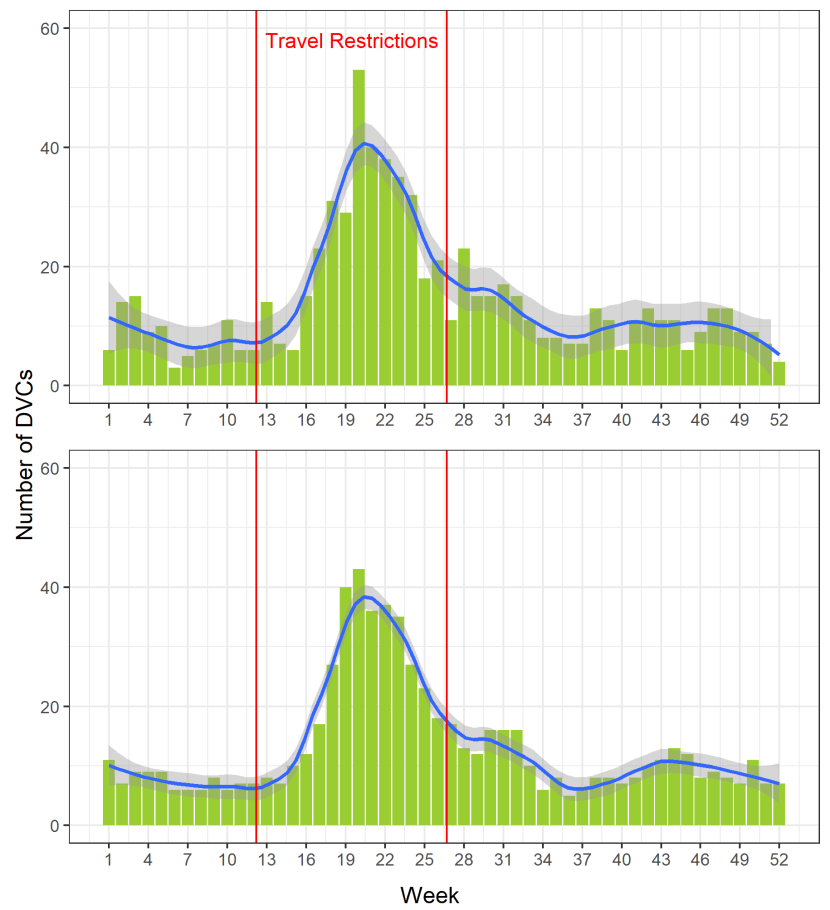
Figure 31. DVC frequency per week in 2020 (top) and the average DVC frequency per week from 2015 to 2019 (bottom), excluding volunteer data. The period when travel restrictions were enforced in 2020 due to the Covid-19 pandemic is shown as red lines.
Click for a full description
Two bar charts showing numbers of DVCs per week in two time periods. Data collected by volunteers are excluded (primarily SSPCA, British Deer Society, Mammal Society and DeerAware data; see Figure 32), as they are expected to be reduced due to travel restrictions, reflecting volunteers travelling and recording DVCs less rather than a reduction in DVCs.
The top chart shows the number of DVCs per week in 2020. The bottom chart shows the average number of DVCs per week from 2015 to 2019. The y-axis for both is titled ‘Number of DVCs’ and ranges from 0 to 60. The x-axis for both shows weeks from 1 to 52, standardised so that week 1 starts on 1 January each year. Since 31 December would be the only day to fall in week 53 in a standardised year it is excluded; 30 December is also excluded in leap years for the same reason. A smoothed LOESS trendline is shown in blue with a 95% confidence interval in grey on both charts.
24 March and 3 July are shown on both charts as vertical red lines, representing the period when travel restrictions were enforced in 2020 due to the Covid-19 pandemic. Covid-19 travel restrictions coincided with the normal peak in DVC reports, which is shown as peaks around weeks 20 and 21.
Comparison of the two charts suggests that the enforcement of travel restrictions had no impact on the numbers of reported DVCs. There is more variation in the numbers of DVCs per week in 2020, but this is expected for data that are not averaged and does not suggest an impact from Covid-19 restrictions.
In contrast, DVCs reported mainly or partially by volunteers showed a substantial reduction whilst travel restrictions were in force (Figure 32). The total number of DVCs collected by volunteers for weeks thirteen to twenty-six in 2020 was 247, compared to an average of 359 per annum for the previous five years. This reduction was undoubtedly due to a reduction in volunteer recording due to travel restrictions, rather than a reduction in in the number of DVCs. It is also interesting that there is an apparent peak of volunteer collected DVC records in the weeks following the lifting of travel restrictions, which may relate partly to volunteers recording carcasses on non-trunk roads that had not been removed in the previous weeks.
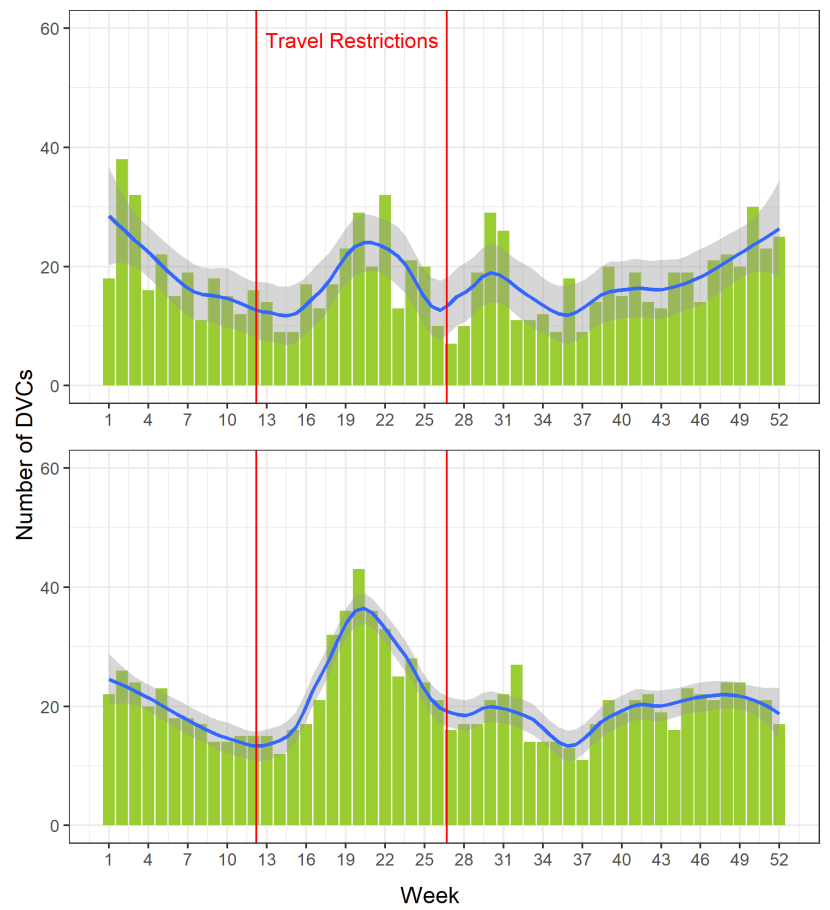
Figure 32. DVC frequency per week in 2020 (top) and the average DVC frequency per week from 2015 to 2019 (bottom); volunteer data only. The period when travel restrictions were enforced in 2020 due to the Covid-19 pandemic is shown as red lines.
Click for a full description
Two bar charts showing numbers of DVCs per week in two time periods from from data collected partly or wholly by volunteers (primarily SSPCA, British Deer Society, Mammal Society and DeerAware data).
The top chart shows the number of DVCs per week in 2020. The bottom chart shows the average number of DVCs per week from 2015 to 2019. The y-axis for both is titled ‘Number of DVCs’ and ranges from 0 to 60. The x-axis for both shows weeks from 1 to 52, standardised so that week 1 starts on 1 January each year. Since 31 December would be the only day to fall in week 53 in a standardised year it is excluded; 30 December is also excluded in leap years for the same reason. A smoothed LOESS trendline is shown in blue with a 95% confidence interval in grey on both charts.
24 March and 3 July are shown on both charts as vertical red lines, representing the period when travel restrictions were enforced in 2020 due to the Covid-19 pandemic. Covid-19 travel restrictions coincided with the normal peak in DVC reports, which is clear around week 20 in the chart showing averaged data but not in the chart for 2020 only.
Comparison of the two charts suggests that the enforcement of travel restrictions clearly suppressed the numbers of reported DVCs from datasets comprised partly or wholly from volunteer records.
DVC reports with reliable detail of deer species
As described in Langbein (2019) the reliability of deer species identifications in supplied data is variable and only some are reliable enough to use. For data prior to 2019, the records identified as reliable as provided by Jochen Langbein were used for the current analysis. Data used since 2019 has included the Mammal Society’s Mammal Mapper app, the British Deer Society app, data from Forestry and Land Scotland and records submitted via the DeerAware website. The total records used amounted to c.7% of all records.
Based on all reported DVC incidents where species identification was felt to be reliable, roe deer were most frequently involved, followed by red deer and smaller numbers of sika and fallow deer (Table 14). The largest numbers of incidents involving roe, red and sika deer all occurred in Highland.
Table 14. Numbers of DVC records from ‘deer-knowledgeable contributors’ providing reliable species detail by Council areas based on available records for 2008 to 2021 inclusive.
| Unitary Authority | Roe | Red | Sika | Fallow | Total |
|---|---|---|---|---|---|
| Highland | 224 | 306 | 25 | - | 555 |
| Argyll and Bute | 204 | 150 | 14 | - | 369 |
| Dumfries and Galloway | 143 | 4 | - | 14 | 161 |
| Perth and Kinross | 91 | 12 | - | 9 | 112 |
| Moray | 87 | 1 | - | - | 88 |
| Aberdeenshire | 77 | 5 | - | - | 82 |
| Stirling | 55 | 14 | - | - | 69 |
| South Lanarkshire | 19 | - | - | - | 19 |
| Fife | 19 | 1 | 1 | - | 21 |
| North Lanarkshire | 16 | - | - | - | 16 |
| Scottish Borders | 16 | - | 1 | - | 17 |
| Angus | 11 | 1 | - | - | 12 |
| West Lothian | 10 | - | - | - | 10 |
| North Ayrshire | 8 | 18 | - | - | 26 |
| East Ayrshire | 7 | - | - | - | 7 |
| Renfrewshire | 6 | - | - | - | 6 |
| South Ayrshire | 5 | - | - | - | 5 |
| Inverclyde | 3 | 1 | - | - | 4 |
| Aberdeen City | 3 | - | - | - | 3 |
| Midlothian | 2 | - | - | - | 2 |
| Glasgow City | 2 | - | - | - | 2 |
| Falkirk | 2 | 1 | - | - | 3 |
| East Lothian | 2 | - | - | 1 | 3 |
| City of Edinburgh | 1 | - | - | - | 1 |
| Clackmannanshire | 1 | - | - | - | 1 |
| East Renfrewshire | 1 | - | - | - | 1 |
| West Dunbartonshire | - | - | 1 | - | 1 |
| Total | 1,015 | 514 | 42 | 24 | 1,596 |
Assessing DVC risk on the trunk road network
Langbein (2019) included an approach for identifying DVC hotspots along the trunk road network by considering DVCs on each trunk road section independently. This was done to improve on the assessment based on tetrads (DVC distribution and change on the trunk network) by overcoming the variability in the length of trunk road included in each square.
Two values were calculated for each trunk road section:
- The number of DVCs per km.
- An index based upon the number of DVCs, section length and traffic volumes.
By considering the volume of traffic, the index aimed to give a better indication of risk. This normalised DVC risk index was calculated using the formula applied by Nelli et al. (2018) (Figure 33).
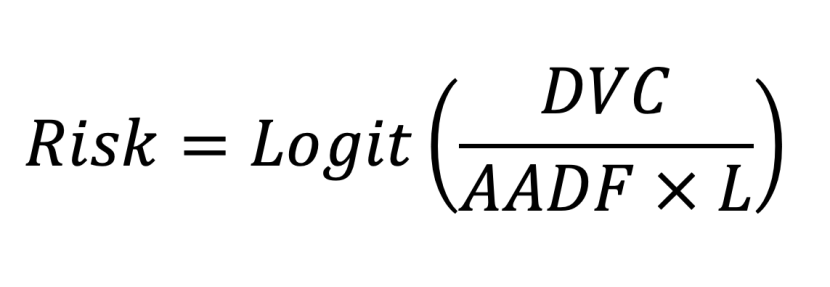
Figure 33. Equation for the normalised DVC risk index (Langbein, 2019).
Click for a full description
Equation used for the calculation of normalised DVC risk index, following Langbein (2019). Where DVC is the average annual number of DVCs related to the trunk road section or shorter road length, AADF is the Average Annual Daily Flow of traffic for the trunk road section and L is the length of the road in kilometres. The average annual number of DVCs related to a full or part trunk road section is divided by the product of the Average Annual Daily Flow of traffic (AADF) for the trunk road section and the length of the road in kilometres. The results are normalised from 0 to 1 using a logit function, i.e. the log of the result divided by 1 minus itself. AADF data is collected by the Department of Transport.
This analysis was repeated during this project, but steps were also made to improve the application of the DVC risk index by applying it to shorter road sections, with the intention of more precisely identifying DVC blackspots.
Approach
Development of a DVC blackspot analysis function
We developed a PostgreSQL/PostGIS function to identify DVC blackspots along trunk road sections. This accepted the several configurable parameters with set default values, including:
- maxdist - The maximum allowable distance in metres between a DVC record and the matching trunk road section (default 500 m).
- nyears - The number of years to be analysed (default 3 years).
- reldist - The distance in metres within which DVC records linked to one trunk road section were considered relevant to others (default 50 m). The rationale for this was that DVCs on one trunk road section suggest an increased likelihood of DVCs occurring on nearby trunk road sections. This was especially true on dual carriageways, where a DVC would be recorded on one carriageway but with a likely equal chance that it could have occurred on the other carriageway if the was deer was hit in the process of crossing the road.
- minl, maxl - The minimum (default 50 m) and maximum (default 500 m) length of a DVC blackspot identified. For trunk road sections over maxl long each identified blackspot was exactly maxl in length, so minl applied only to shorter sections. These were used to remove the bias towards high numbers of DVCs per kilometre and normalised DVC risk index on short road sections.
- mindvcs - The minimum number of DVCs that could be considered a DVC blackspot (default 2). This was used to prevent short trunk road sections with one or few DVCs being incorrectly identified as a blackspot.
These parameters meant that the function could be run multiple times to test different scenarios. This was done several times and the results analysed to determine appropriate default values (see Annex 3: Calibration of default blackspot analysis values).
The function repositioned all DVCs from the last nyears within maxdist of the matching trunk road section where the record was not identified as a possible duplicate. DVCs were matched to trunk road sections using a staged process, with each stage excluding those records repositioned by the preceding stages, to ensure that the repositioning process was as accurate as possible:
- Where the section code associated with the DVC matched a section code in the most recent available trunk road dataset the DVC was repositioned on the closest point on that trunk road section.
- Where the road number (e.g. A9) associated with the DVC matched the road number in the most recent available trunk road dataset the DVC was repositioned on the closest point on that road.
- All other DVCs were repositioned on the closest point on the trunk road network.
Where a repositioned DVC was within reldist metres of another trunk road section it was duplicated at the closest point on that section. This meant that individual DVCs could be represented on multiple trunk road sections, especially around junctions where several sections met.
Trunk road sections greater and less than maxl were then treated differently. Trunk road sections less than maxl but greater than minl were selected in their entirety where the number of DVCs along their length was equal to or greater than mindvcs.
Those that were greater than or equal to maxl were analysed using a moving window algorithm using a length of maxl and 10 m shifts. The moving window algorithm started at the start of each section and counted the number of DVCs within the first maxl metres. It then shifted the window by 10 m and counted the DVCs in the next maxl metres, and so on until it reached the end of the section. The final length was shifted to account for trunk road sections that were not exactly divisible by 10 m. The algorithm then selected non-overlapping windows containing the maximum number of DVCs. Thus, the window containing the highest number of DVCs was always selected, and the next highest number that did not overlap with the highest, and so on. Windows where the number of DVCs along their length was less than mindvcs were not selected. The result was zero or more non-overlapping windows selected for each trunk road section, typically with unselected parts of the section at the ends or between selected windows.
All selected trunk road sections less than maxl and selected windows from trunk road sections greater than or equal to maxl were combined to create a dataset of trunk road parts ranging from minl to maxl in length. Associated with each trunk road part was the number of DVCs occurring along that part and the AADF values for the trunk road section it occurred along. The function used these values to calculate the average number of DVCs per kilometre per year and the normalised risk index for each selected trunk road part.
Applied DVC blackspot analysis
Non-overlapping trunk road parts of maximum 500 m length were considered as possible DVC blackspots. Entire trunk road sections less than 50 m were excluded from the analysis. DVCs recorded from 2019 to 2021 were repositioned along these trunk road parts where they were within 500 m distance. Trunk road parts with only one DVC were excluded. Repositioned DVCs were replicated onto the closest point on nearby trunk road parts where they were within 50 m.
For each trunk road part, the average number of DVCs per kilometre per year and the normalised risk index were calculated.
This process was undertaken using the function described above.
DVC risk for entire sections
To allow comparison with the results of the DVC blackspot analysis, the average number of DVCs per kilometre per year and the normalised risk index was also calculated for entire trunk road sections for the years 2019 to 2021. The approach used was similar to that undertaken by Langbein (2019). One major difference was that DVC incidents were assigned to trunk road sections where they were attributed as such in the original data or within 500 m of the section, in line with the analysis described in DVC distribution and change on the trunk network. In contrast, Langbein (2019) associated DVCs with trunk road sections where they were within 150 m of the section. Given the likely imprecision in the recorded locations of DVC incidents, this was felt to be an acceptable change.
Results
Table 15 shows the average number of DVCs per kilometre per year and the average normalised risk index for each trunk road for the years 2019 to 2021, allowing comparison with the results in Langbein (2019).
Between 2008 and 2016 the five roads with the highest average number of DVCs per kilometre per year were the A701 (0.50), M73 (0.44), M823 (0.41), M876 (0.29) and A737 (0.23) (Langbein, 2019). Between 2019 and 2020 different roads had the highest average number of DVCs per kilometre per year, though the two roads with the highest values, M823 and A737, were also included in the worst five from 2008 to 2016.
Between 2008 and 2016 the five roads with the lowest average number of DVCs per kilometre per year were the A972 (0.00), A887 (0.02), A889 (0.02), A99 (0.02) and A76 (0.03) (Langbein, 2019). Once again, two roads, A972 and A99, were among those with the lowest average number of DVCs per kilometre per year in both time periods.
Between 2008 and 2016 the five roads with the highest average normalised risk index were the M823 (0.46), A701 (0.39), A835 (0.38), M876 (0.36), A830 (0.35) (Langbein, 2019). The average normalised risk index between 2019 and 2020 was also higher, with different roads having the highest average normalised risk index. Again, two roads, the M823 and M876, had the highest average normalised risk index in both time periods.
Between 2008 and 2016 the five roads with the lowest average normalised risk index were the A972 (0.00), A8 (0.06), A977 (0.06), A726 (0.07) and A76 (0.08) (Langbein, 2019). Only one of these, the A972, was among the roads with the lowest average normalised risk index between 2019 and 2021.
Except for the A99, the roads with the lowest average number of DVCs per kilometre per year and lowest average normalised risk index in 2019 to 2020 were very short. Lower values would be expected on short roads, as less road means less chance of a DVC, especially over the three years considered by this study. In contrast, the assessment in Langbein (2019) covered nine years, which increased the chance of at least one DVC on short road sections and meant that the lowest average number of DVCs per kilometre per year and lowest average normalised risk index was recorded on some relatively long roads.
Table 15. Number and rate of DVCs per km recorded by year on different major trunk routes between 2019 and 2021, ordered by the average DVC/km from worst to least affected. DVC risk index is calculated for entire trunk road sections and then averaged for the whole road, to allow comparisons with Langbein (2019). Bold and italic figures highlight respectively the 10% worst and least affected roads, based on averaged DVC risk index assessed over the entire road length. In the case of dual carriageways, road length refers to the sum of all road sections in both directions. (Numbers are presented here mainly for background context only, as due to the large differences in total length between routes, DVC blackspots are greatly diluted in the case of longer roads).
| Road | Average DVC/km/year | Average risk index | Length (km) | 2019 | 2020 | 2021 | Total |
|---|---|---|---|---|---|---|---|
| M823 | 1.17 | 0.58 | 5.1 | 6 | 7 | 5 | 18 |
| M876 | 0.82 | 0.47 | 30.8 | 10 | 29 | 37 | 76 |
| A985 | 0.81 | 0.38 | 23.1 | 15 | 19 | 22 | 56 |
| A876 | 0.60 | 0.25 | 8.4 | 5 | 6 | 4 | 15 |
| A1 | 0.42 | 0.35 | 139.2 | 41 | 57 | 77 | 175 |
| A737 | 0.37 | 0.17 | 41.9 | 21 | 17 | 9 | 47 |
| M77 | 0.34 | 0.23 | 67.0 | 26 | 23 | 20 | 69 |
| M9 | 0.31 | 0.22 | 116.6 | 20 | 33 | 57 | 110 |
| A720 | 0.30 | 0.24 | 54.9 | 11 | 26 | 12 | 49 |
| M80 | 0.30 | 0.15 | 84.4 | 27 | 21 | 29 | 77 |
| M898 | 0.28 | 0.19 | 3.5 | 2 | 0 | 1 | 3 |
| A977 | 0.27 | 0.14 | 4.9 | 0 | 2 | 2 | 4 |
| A78 | 0.25 | 0.20 | 102.0 | 26 | 25 | 26 | 77 |
| A898 | 0.25 | 0.18 | 8.0 | 2 | 2 | 2 | 6 |
| A92 | 0.25 | 0.16 | 133.4 | 31 | 31 | 39 | 101 |
| M90 | 0.24 | 0.15 | 158.3 | 32 | 34 | 48 | 114 |
| M8 | 0.24 | 0.12 | 249.4 | 65 | 68 | 49 | 182 |
| A725 | 0.24 | 0.10 | 45.5 | 13 | 8 | 12 | 33 |
| M73 | 0.19 | 0.12 | 32.6 | 12 | 6 | 1 | 19 |
| A84 | 0.18 | 0.25 | 45.2 | 10 | 8 | 6 | 24 |
| A82 | 0.17 | 0.22 | 276.9 | 59 | 49 | 36 | 144 |
| A701 | 0.16 | 0.25 | 29.6 | 4 | 5 | 5 | 14 |
| A956 | 0.15 | 0.21 | 13.5 | 1 | 2 | 3 | 6 |
| A75 | 0.15 | 0.19 | 162.8 | 41 | 18 | 14 | 73 |
| A68 | 0.14 | 0.16 | 82.4 | 13 | 11 | 10 | 34 |
| A77 | 0.13 | 0.14 | 138.6 | 20 | 14 | 18 | 52 |
| A751 | 0.12 | 0.27 | 2.8 | 1 | 0 | 0 | 1 |
| A9 | 0.12 | 0.16 | 523.6 | 67 | 50 | 75 | 192 |
| A702 | 0.12 | 0.13 | 57.9 | 4 | 6 | 10 | 20 |
| A96 | 0.12 | 0.11 | 177.3 | 15 | 25 | 24 | 64 |
| M74 | 0.12 | 0.10 | 325.0 | 51 | 42 | 26 | 119 |
| A726 | 0.11 | 0.08 | 8.7 | 2 | 0 | 1 | 3 |
| A85 | 0.10 | 0.19 | 140.1 | 17 | 9 | 18 | 44 |
| A828 | 0.10 | 0.17 | 42.1 | 5 | 3 | 5 | 13 |
| A90 | 0.09 | 0.09 | 433.9 | 39 | 40 | 35 | 114 |
| A8 | 0.09 | 0.07 | 58.2 | 11 | 3 | 1 | 15 |
| A835 | 0.08 | 0.23 | 79.1 | 3 | 11 | 6 | 20 |
| A86 | 0.06 | 0.19 | 64.6 | 3 | 3 | 6 | 12 |
| A830 | 0.06 | 0.16 | 65.8 | 2 | 2 | 8 | 12 |
| A83 | 0.06 | 0.14 | 163.5 | 11 | 13 | 6 | 30 |
| A7 | 0.06 | 0.12 | 75.6 | 5 | 8 | 1 | 14 |
| A76 | 0.06 | 0.07 | 90.1 | 9 | 2 | 5 | 16 |
| A887 | 0.05 | 0.27 | 24.3 | 0 | 2 | 2 | 4 |
| A889 | 0.05 | 0.18 | 13.8 | 0 | 1 | 1 | 2 |
| A95 | 0.05 | 0.16 | 74.9 | 3 | 4 | 5 | 12 |
| A87 | 0.05 | 0.13 | 160.5 | 7 | 8 | 8 | 23 |
| A6091 | 0.04 | 0.04 | 8.1 | 1 | 0 | 0 | 1 |
| A99 | 0.01 | 0.06 | 26.9 | 0 | 0 | 1 | 1 |
| A972 | 0 | 0.00 | 3.8 | 0 | 0 | 0 | 0 |
| A738 | 0 | 0.00 | 2.1 | 0 | 0 | 0 | 0 |
| A893 | 0 | 0.00 | 0.4 | 0 | 0 | 0 | 0 |
| A89 | 0 | 0.00 | 0.3 | 0 | 0 | 0 | 0 |
The results of repeating the analysis for whole trunk road sections per Langbein (2019) and the enhanced blackspot analysis described above for 2019 to 2021 are compared in Table 16. As the average number of DVCs per kilometre per year and normalised risk index are not appropriate for the blackspot analysis the maximum values are used. The highest and lowest 10% of roads are highlighted.
The roads with the highest maximum number of DVCs per kilometre per year calculated for entire trunk road sections are different from those calculated for 500 m lengths. The A1 is the only road with the highest maximum normalised risk index for both entire road sections and 500 m lengths. This suggests that the blackspot analysis is selecting shorter parts of roads with large numbers of DVCs that would otherwise be averaged over longer road sections.
Excluding those roads with no DVC reports between 2019 and 2021, four roads have the lowest 10% maximum number of DVCs per kilometre per year and maximum normalised risk index for both entire road sections and 500 m lengths: A6091, A751, A956 and the A99. A further two have the lowest 10% maximum normalised risk index using both calculation methods. A greater consistency of rates among roads with fewer DVCs is expected, as the length of road used during the calculation has less impact.
Table 16. A comparison of DVC rates for the years 2019 to 2021, calculated for entire trunk road sections (Langbein, 2019) and maximum road lengths of 500 m. Entire trunk road sections less than 500 m long are included in the latter calculations where they are at least 50 m long. Maximum values for each road are used, as the rates calculated for 500 m lengths excludes parts of roads without DVCs and therefore cannot be averaged for whole roads. Bold and italic figures highlight respectively the 10% of roads with the highest and lowest maximum DVC rates. Dashes indicate roads with no DVCs and roads with less than 2 DVCs within any lengths between 50 m and 500 m along road sections.
| Road | Max DVC/km/year (sections) | Max risk index (sections) | Max DVC/km/year (500 m) | Max risk index (500 m) |
|---|---|---|---|---|
| A1 | 3.47 | 0.99 | 10.49 | 0.97 |
| A6091 | 0.27 | 0.42 | 1.33 | 0.44 |
| A68 | 1.88 | 0.73 | 2 | 0.71 |
| A7 | 0.87 | 0.62 | 1.33 | 0.67 |
| A701 | 0.83 | 0.68 | 2 | 0.63 |
| A702 | 1.58 | 0.63 | 3.86 | 0.68 |
| A720 | 2.97 | 0.76 | 8.98 | 0.82 |
| A725 | 8.72 | 0.92 | 4.73 | 0.84 |
| A726 | 2.03 | 0.62 | 1.33 | 0.72 |
| A737 | 1.81 | 0.7 | 6 | 0.69 |
| A738 | - | - | - | - |
| A75 | 5.69 | 0.81 | 3.85 | 0.69 |
| A751 | 0.12 | 0.54 | - | - |
| A76 | 0.94 | 0.58 | 2 | 0.47 |
| A77 | 2.08 | 0.77 | 3.99 | 0.95 |
| A78 | 6.43 | 0.94 | 6.43 | 0.86 |
| A8 | 5.37 | 0.82 | 8.05 | 0.76 |
| A82 | 5.43 | 0.93 | 7.67 | 0.89 |
| A828 | 0.37 | 0.69 | 2.67 | 0.72 |
| A83 | 3.45 | 0.93 | 2 | 0.66 |
| A830 | 2.4 | 0.89 | 1.35 | 0.72 |
| A835 | 0.82 | 0.71 | 2 | 0.66 |
| A84 | 1.25 | 0.78 | 2.67 | 0.67 |
| A85 | 3.54 | 0.97 | 3.54 | 0.83 |
| A86 | 2.06 | 0.86 | 2.74 | 0.74 |
| A87 | 1.12 | 0.78 | 2.04 | 0.73 |
| A876 | 2.39 | 0.81 | 3.39 | 0.8 |
| A887 | 0.11 | 0.61 | 2 | 0.84 |
| A889 | 0.73 | 0.9 | 1.34 | 0.84 |
| A89 | - | - | - | - |
| A893 | - | - | - | - |
| A898 | 0.63 | 0.78 | 2.67 | 0.73 |
| A9 | 7.79 | 0.87 | 8.91 | 0.86 |
| A90 | 2.3 | 0.97 | 3.36 | 0.82 |
| A92 | 3.14 | 0.8 | 11.33 | 0.83 |
| A95 | 3.03 | 0.85 | 3.03 | 0.69 |
| A956 | 0.33 | 0.46 | 1.34 | 0.44 |
| A96 | 3.58 | 0.7 | 7.09 | 0.64 |
| A972 | - | - | - | - |
| A977 | 0.77 | 0.66 | 1.59 | 0.58 |
| A985 | 3.5 | 0.77 | 4.9 | 0.64 |
| A99 | 0.18 | 0.58 | - | - |
| M73 | 1.56 | 0.83 | 4.19 | 0.8 |
| M74 | 3.48 | 0.85 | 6.94 | 0.73 |
| M77 | 2.2 | 0.76 | 10.69 | 0.9 |
| M8 | 5.76 | 0.82 | 7.21 | 0.78 |
| M80 | 3.63 | 0.88 | 6.67 | 0.77 |
| M823 | 3.7 | 0.87 | 7.85 | 0.88 |
| M876 | 3.04 | 0.91 | 11.94 | 1 |
| M898 | 0.7 | 0.7 | 2 | 0.38 |
| M9 | 2.78 | 0.91 | 8.67 | 0.88 |
| M90 | 3.85 | 1 | 7.7 | 0.97 |
A comparison of the 100 trunk road sections and 50 m to 500 m parts with the highest average number of DVCs per kilometre per year is provided in Figure 34. The same is shown but using normalised DVC risk index in Figure 35. The results are similar because in many cases they will have identified the same trunk road sections that are less than 500 m long. Below 500 m long, the key difference in the calculation for short sections is that those shorter than 50 m or with only one DVC are excluded from the results for the trunk road parts, and DVCs are duplicated onto other road sections where they are within 50 m.
All maps in Figures 34 and 35 identify the central belt as the main concentration of DVC blackspots. However, many more blackspots based on average number of DVCs per kilometre per year are identified elsewhere in Scotland using the method employed by Langbein (2019) (Figure 34). Many of these will have been excluded from the analysis using 50 m to 500 m lengths as they are extremely short sections. This difference is less pronounced for the results for normalised DVC risk index (Figure 35).

Figure 34. Top 100 trunk road sections (left) and 50 m to 500 m long parts (right) with the greatest average number of DVCs per kilometre per year from 2019 to 2021. © Crown copyright (and database rights) 2022.
Click for a full description
Two maps showing the locations of the greatest DVC blackspots. In both maps DVC blackspots are determined based upon the greatest average number of DVCs per kilometre per year, using data from 2019 to 2021. DVCs are associated with trunk roads based upon attributes in the original data or where they are within 500 m. DVCs associated with one trunk road section within 50 m of another trunk road section are duplicated so that they appear associated with both. Trunk road sections or shorter lengths with less than 2 DVCs were excluded from the analysis, to remove extreme bias. The map on the left shows the top 100 trunk road sections in blue. The map on the right shows the top 50 m to 500 m trunk road section lengths in red. Whilst there is a clear concentration of identified trunk road sections and lengths in the central belt in both maps, a greater number of identified trunk road sections elsewhere in Scotland is clear. In contrast, very few 50 m to 500 m lengths are identified outside of the central belt.
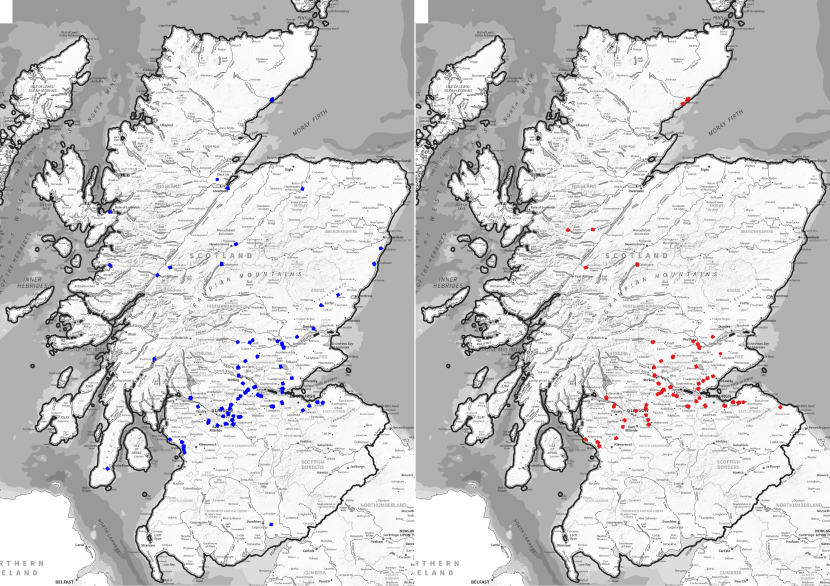
Figure 35. Top 100 trunk road sections (left) and 50 m to 500 m long parts (right) with the greatest normalised DVC risk index from 2019 to 2021. © Crown copyright (and database rights) 2022.
Click for a full description
Two maps showing the locations of the greatest DVC blackspots. In both maps DVC blackspots are determined based upon the greatest normalised DVC risk index, using data from 2019 to 2021. DVCs are associated with trunk roads based upon attributes in the original data or where they are within 500 m. DVCs associated with one trunk road section within 50 m of another trunk road section are duplicated so that they appear associated with both. Trunk road sections or shorter lengths with less than 2 DVCs were excluded from the analysis, to remove extreme bias. The map on the left shows the top 100 trunk road sections in blue. The map on the right shows the top 100 50 m to 500 m trunk road section lengths in red. Both maps show a clear concentration of identified trunk road sections and lengths in the central belt, with scattered road sections and lengths identified in the rest of Scotland.
The top 20 DVC blackspots for all road lengths between 50 m and 500 m includes several on each of the A1, A9 and M90 (Table 17). However, only two of the identified top 20 blackspots relate to 500 m road lengths, which suggests that some bias towards shorter road sections having highest calculated DVC risk rates remains. For this reason, it is appropriate to also consider only those blackspots that relate to 500 m road lengths, which additionally identifies several each on the M8 and M9 (Table 18). Combining the roads in the two tables suggests that the A9 has the largest number of DVC blackspots (seven), followed by the M90 (five), and the A1 and M9 (four each). Section 11310/93 on the M8 includes two separate hotspots with identical values that appear in the top twenty road blackspots that relate to 500 m road lengths.
Table 17. The 20 trunk road sections with the highest DVC risk index for the years 2019 to 2021, calculated for maximum road lengths of 500 m. Entire trunk road sections less than 500 m long are included in the latter calculations where they are at least 50 m long and have at least two recorded DVCs in the period. Lengths indicated are the length of road used for the calculations, up to 500 m in length. Rows in italics relate to blackspots within the South East unit and M77 DBFO that are considered potentially suspect due to issues with the accuracy of recorded locations (see Annex 4: Accuracy of incident locations).
| Road | Section Code | Length (m) | DVC/km/year | Risk index |
|---|---|---|---|---|
| A1 | 10156/15 | 285 | 3.51 | 0.87 |
| A1 | 10163/10 | 434 | 6.91 | 0.95 |
| A1 | 10163/11 | 192 | 6.94 | 0.96 |
| A1 | 10163/16 | 286 | 10.49 | 0.97 |
| A77 | 11681/90 | 167 | 3.99 | 0.95 |
| A78 | 14070/09 | 246 | 4.06 | 0.86 |
| A82 | 10817/21 | 87 | 7.67 | 0.89 |
| A82 | 10817/22 | 112 | 5.94 | 0.85 |
| A9 | 10408/08 | 375 | 3.55 | 0.86 |
| A9 | 10413/51 | 269 | 3.71 | 0.86 |
| A9 | 10418/10 | 292 | 3.43 | 0.85 |
| M77 | 11460/17 | 94 | 10.69 | 0.90 |
| M823 | 19005/90 | 255 | 7.85 | 0.88 |
| M876 | 14401/88 | 167 | 11.94 | 1.00 |
| M9 | 10350/90 | 500 | 3.33 | 0.87 |
| M9 | 10360/91 | 434 | 5.37 | 0.88 |
| M90 | 15505/65 | 500 | 4.00 | 0.85 |
| M90 | 15535/12 | 87 | 7.70 | 0.97 |
| M90 | 15535/13 | 107 | 6.21 | 0.94 |
| M90 | 15535/14 | 195 | 3.43 | 0.85 |
Table 18. The 20 trunk road sections with the highest DVC risk index for the years 2019 to 2021, calculated for 500 m road lengths. Trunk road sections less than 500 m long are excluded. Lengths indicated are the length of road used for the calculations, not the trunk road section length. Rows in italics relate to blackspots within the South East unit and M77 DBFO that are considered potentially suspect due to issues with the accuracy of recorded locations (see Annex 4: Accuracy of incident locations).
| Road | Section Code | Length (m) | DVC/km/year | Risk index |
|---|---|---|---|---|
| A720 | 11250/70 | 500 | 1.33 | 0.76 |
| A720 | 11250/80 | 500 | 2.00 | 0.82 |
| A78 | 14065/29 | 500 | 2.00 | 0.76 |
| A82 | 10817/10 | 500 | 4.00 | 0.79 |
| A876 | 14530/11 | 500 | 2.00 | 0.80 |
| A887 | 12815/05 | 500 | 2.00 | 0.84 |
| A889 | 12705/20 | 500 | 1.33 | 0.84 |
| A9 | 10418/05 | 500 | 2.00 | 0.77 |
| A9 | 10485/55 | 500 | 3.33 | 0.76 |
| A9 | 10489/11 | 500 | 3.33 | 0.80 |
| A9 | 10489/14 | 500 | 2.67 | 0.76 |
| M8 | 11310/93 | 500 | 4.00 | 0.78 |
| M8 | 11310/93 | 500 | 4.00 | 0.78 |
| M8 | 13717/96 | 500 | 3.33 | 0.76 |
| M80 | 11881/57 | 500 | 6.67 | 0.77 |
| M876 | 14402/96 | 500 | 4.00 | 0.84 |
| M9 | 10309/93 | 500 | 3.33 | 0.84 |
| M9 | 10350/90 | 500 | 3.33 | 0.87 |
| M9 | 10360/85 | 500 | 3.33 | 0.78 |
| M90 | 15505/65 | 500 | 4.00 | 0.85 |
Analysis suggested possible bias in the locations of DVC records in the South East unit and M77 DBFO for the years 2019 to 2021 (see Annex 4: Accuracy of incident locations). There may also be poorly located records in other areas that are not apparent from the analysis. Because of this, the 38 blackspots listed in Tables 17 and 18 were manually assessed. This resulted in a shortlist of the ten most serious DVC blackspots that appeared to be based on reliably positioned DVC records (Table 19). 60% of shortlisted blackspots included 500 m parts of longer road sections.
Table 19. The 10 most severe DVC blackspots for the years 2019 to 2021. This table is derived from Tables 17 and 18, following manual review to remove those believed most likely to be based on DVC records with unreliable locations. Blackspots can comprise several trunk road sections where they form a discrete cluster. All trunk road sections likely to be affected by a high risk of DVCs are listed, with those identified in Tables 17 and 18 shown in italics. Woodland described was interpreted from aerial photography and is likely to include scrub. Maps are shown in Annex 5: Maps of DVC blackspots for 2019-2021.
| Road | Location | Section Code(s) | Description |
|---|---|---|---|
| A78 | East of Eglington Interchange | 14065/29 (southern part), 14065/07 (northern part), 14065/12 (southern part) | Surrounded by woodland. Wooded islands cut off by the following road combinations:
|
| A78 | North of Warrix Interchange | 14070/09, 14070/05 (central part), 14070/06 (northern part, 14070/15 (southern part), | Surrounded by woodland. Wooded islands in the centre of the Warrix interchange. |
| A82 | Renton Junction | 10817/10, 10817/21, 10817/22, 10817/20, 10817/23 (northern part), 10817/62, 10817/63 | Wooded islands cut off by the following road combinations:
|
| A9 | Dunblane West Junction | 10408/08, 10403/85, 10403/86, 10403/90, 10403/91, 10408/05, 10408/06, 10408/09 | Surrounded by patchy woodland. Wooded islands cut off by the following road combinations:
|
| A9 | North of Navidale Roundabout | 10489/11 | Surrounded by pasture with moorland in the north and west. |
| M8 | North and West of Livingston Interchange | 11310/93, 11310/84, 11310/87, 11310/89, 11310/92, 11311/08 (eastern part) | Surrounded by woodland, with a golf course to the south. Wooded islands cut off by the following road combinations:
|
| M8/A898 | Craigton Interchange | 13717/96, 13717/94, 13717/95, 13717/97, 13719/00, 13719/03, 13719/05, 13719/48, 18501/38 (western part) | Wooded islands cut off by the following road combinations:
|
| M823/M90 | Pitreavie Interchange | 15505/65, 19005/90, 15505/10 (northern part), 19005/89, 19005/95 (western part) | Woodland on north side. Wooded islands cut off by the following road combinations:
|
| M9 | East of Pirnhall Interchange (South) | 10350/90, 10350/50 (central part), 10350/51 (central part), 10350/90, 10350/91, 10350/92 | Woodland on north and south sides. Patchy wooded island cut off within 10350/92. |
| M90 | North of Muirmont Interchange | 15535/12, 15535/13, 15535/14, 15535/00, 15535/07, 15535/15 (southern part), 15535/46, 15535/48, 15535/49 (southern part) | Surrounded by woodland. Wooded islands cut off by the following road combinations:
|
The locations of the combined top 10 DVC blackspots are shown in Annex 5: Maps of DVC blackspots for 2019-2021.
Discussion and recommendations arising
Data collection and collation
Overall data collation has been successful. The DVC database now includes 22,753 mapped incident records for the period 2008 to 2021, of which 5,479 were added during this contract covering 2019 to 2021 and including 2018 for STATS19 data.
Concerns that the Covid-19 pandemic would lead to decreased or delayed supply of data were unfounded. All data holders appear to have robust systems in place that allowed them to continue working effectively during the pandemic.
More significant issues with data collation were:
- The contracts for the SW and SE units changed in August 2020. This resulted in some delay in obtaining data during 2021 and some reduction in data quality for some data from early 2020.
- Data for the M8 DBFO from August 2020 to December 2021 was mistakenly not collated, due to a misinterpretation of the contract changes for the SW and SE units.
- STATS19 data is incomplete. This was because of changes in the way Police Scotland hold and supply the data, which meant that only some local authorities gather the data in a format that allowed them to extract incidents involving deer.
- One data provider was subjected to a cyber-attack in 2020, which meant a gap in the information until they were able to fully restore their systems. All data were subsequently provided.
A more proactive approach is required when trunk road operator contracts change. This should involve aiming to get a supply of DVC data just before the outgoing contractor finishes and contacting the new contractor early in the new contract to ensure that they understand the requirements. This could also be used to clarify the coverage of the new contract and avoid accidental omission of data. Nevertheless, contract changes are always likely to disrupt the flow of data and the chances for a gap in DVC data coverage is high.
The changes in the way that STATS19 data are held and the detail now provided to Transport Scotland are problematic for this project. Ideally these changes will be reversed to allow full analysis of the impact of DVCs on personal injury, though this is unlikely to happen.
Over the course of this study, approximately 24 hours was spent attempting to obtain complete STATS19 data, including investigations with Transport Scotland, and requests to Police Scotland and local authorities. This resulted in 44 records, translating to approximately 30 minutes per record. This rate reflects the limited number of STATS19 records received from each data source, the format of the records and the number of null responses. The rate would have been much better had it been possible to obtain a national dataset, as before.
It should be possible to reduce this rate in the future, by targeting local authorities in the first instance and only doing so once, at the end of each three-year contract. Improvements could be made to the requests, for example specifying the data in excel or csv format, that could reduce data collation time. Nevertheless, it is likely that the rate would still be about 10 minutes per record because of the small number of records received per local authority. Whilst STATS19 data provide some information not available from other data sources, it is questionable whether it is worth the investment of resources for such a small amount of data.
It may be beneficial to rationalise the data further, focusing on data from 2008 to 2018, as some inconsistencies were identified during analysis. It is likely that these could cause similar problems in the future. Resolving these inconsistencies would take time but is likely to reduce the analysis time required in subsequent years.
Benefits of database migration
Transfer of the data to a PostgreSQL/PostGIS database has been successful, allowing all processing to be fully documented in repeatable scripts. This left very little that could not be readily repeated, notably the manual placement of a few individual records, as wherever possible the locations for records were added to the relevant script.
This approach also made dealing with subsequent data supplies easier, as the previous script could often be reused with only minor modifications. As more data is collated into the database, the existing scripts are improved and become a valuable time-saving resource.
Though much of the analysis was undertaken in the R statistical environment, all spatial processing and most data preparation and reshaping was done in PostgreSQL. The tables in this report were created using PostgreSQL views allowing them to be readily updated. Additionally, whilst the maps were produced in QGIS, they drew directly on the PostgreSQL database, allowing maps to be quickly updated using standard layouts.
However, the full potential benefits of using PostgreSQL have not yet been realised. Much could be gained through the provision of the data via web services. At a basic level, this could provide a live Web Map Service or Web Feature Service feed of the raw DVC data, stripped of any information that would not be considered public, such as the detail of some police records. This could be consumed by the existing systems used by NatureScot, Transport Scotland, trunk road operators and any other interested parties, providing them up to date information on DVCs.
There may also be additional benefit in the provision of other spatial information generated by the database. For example, it might be helpful to provide a web service of the outputs of the risk analysis. In this scenario, the risk analysis could be automatically updated on a fixed schedule or as new data is added to the database. The outputs would be a map of trunk road sections classified by the average number of DVCs per kilometre per year and the normalised risk index, plus similar, potentially more useful data for the shorter DVC blackspots.
Finally, much of the information provided in this report as tables and charts could be added to a data dashboard. This would provide a current summary as new data are added. Whilst this would not eliminate the need to undertake more specific targeted analysis or expert interpretation of the results, it would allow users to start to spot trends between project reports.
Basic analysis, trends and distribution of DVC occurrence
Evidence for DVC trends
Trends in DVCs appear to be largely in line with previous years (Langbein, 2019), though there is evidence that the numbers of DVC reports received has plateaued or declined since 2017. It is unlikely that the data missing between 2018 and 2021 are responsible for the recent apparent decline, as they have historically amounted to a few dozen records per year. Similarly, the analysis undertaken suggests that it is unlikely that Covid-19 had a significant impact on the overall numbers of DVCs reported in 2020 when travel restrictions were most severe. The apparent decline may be due to the exceptionally high number of reports in 2017, which would suggest relatively constant numbers of DVCs per year since 2016. The next few years will determine whether this flatter trend continues.
Much of the change in trends in DVC reports per year has been due to changes in core records. Non-core records last made a significant impact between 2008 and 2010, when much higher numbers of reports were received from council uplifts and police control rooms, and due to roadside verge carcass searches undertaken by the Deer Commission for Scotland (Langbein, 2011).
Though the numbers of DVCs reported by TROCs has remained approximately stable since 2009, the numbers reported in three out of the four regions has varied dramatically. Only the North East region has reported consistent numbers of DVCs each year. Whilst the numbers of DVCs reported by the South West has varied greatly from year to year it shows no overall trend. In contrast, the distinct downwards trend in the North West has been offset overall by the upwards trend in the South East.
The dramatic increase in DVCs reported by the South East unit cannot be fully explained. A small proportion of the increase is likely to be due to the inclusion of records where a deer carcass had not been uplifted that may have been excluded from previous data supplies, but most of the increase appears to relate to reports where the carcass was uplifted. Nor can it be due to the change of TROC in August 2020, since the first half of 2020 also shows an obvious increase in DVCs reported. There remains the possibility that the increase was due to increased deer populations or movement within the South East. This is a cause for concern and would be worth further investigation, especially if the upwards trend continues.
The dip in DVCs reported by TROCs in 2018 is hard to explain, as the overall numbers of DVCs in that year remained consistent with other recent years. Factors such as weather, deer population numbers and traffic levels would have affected the DVCs recorded by all data sources equally, not just the TROCs. It is therefore likely that the low numbers of reports from TROC in 2018 was simply due to random variation.
Changes in DVC frequency on the wider road network are harder to determine but based upon data from the SSPCA it is likely that there has been no real increase since 2017. It is not clear to what extent the trends in DVCs reported to the SSPCA reflect overall trends in the number of calls they receive. The number of DVCs reported in 2020 was lower than in recent years, but evidence suggests that this was due to travel restrictions in force because of the Covid-19 pandemic that suppressed the number of reports for several weeks (see Covid-19).
In contrast, DVC reports from Forestry and Land Scotland (FALS), and its predecessor Forestry Commission Scotland, has steadily fallen since 2011. It is the only dataset to show such a significant drop in the number of DVCs reported. Since 2011 FALS have gradually increased the number of deer culled on its land. A case study at Callendar Wood where culling was increased was followed by a reduction in the number of DVCs in the vicinity (Anton Watson, pers. comm.). Since rangers generally only attend DVCs that are directly adjacent to FALS sites, this would have reduced the number of DVCs they attend without affecting nationwide trends. Despite the decline in DVC reports provided by the organisation, FALS data continues to provide valuable data for more remote areas, rarely duplicates reports from other data holders and reliably identifies deer to species.
Given many users were encouraged to use the British Deer Society app instead of the DeerAware incident reporting form, it is surprising that the number of DVC incidents reported via DeerAware in 2020 and 2021 was so high. Since the British Deer Society has taken control of DeerAware submission data and collate it in a rational format there may be less need to wind down this route to data submission. Moving to a more mobile app-based data submission model could alienate recorders that do not have smartphones or do not wish to install a specific app for the purpose of reporting DVCs.
Whilst submissions of DVC data via the British Deer Society app have remained low, in Scotland at least, there is evidence that the number of DVC incidents reported via the Mammal Society apps increased in 2021, being about 50% higher than the previous highest total for a single year. This trend may also have been apparent in 2020 had it not been for travel restrictions introduced due to Covid-19 that would have limited opportunities for recording for part of the year, as despite the restrictions similar numbers of DVCs were reported via the Mammal Society apps in 2020 compared with previous years. It is possible that this may have been due to increased awareness raising by the Mammal Society or a general increased interest in citizen science recording.
On a finer scale, there is limited evidence of major changes in the pattern of DVC distribution over the past six years. There are suggestions of localised increases or decreases in DVCs on trunk roads beyond what would be expected from random variation, especially in the central belt. This may be due to changes in deer populations, traffic levels and reporting by the TROCs. Decreases may be due to mitigation, such as signage or localised culling.
Local trends on the wider road network also shows a clear increase in DVC frequencies in the central belt, including when data from trunk road operators is excluded. Only two local authority areas, Argyll and Bute and Aberdeen City, showed a decline in the number of DVCs reported by the SSPCA and Forestry and Land Scotland. Nevertheless, it is possible to get some insight by expressing change as a function of the overall change, to identify above and below average changes. There is evidence of above average increases in DVC incidents in 19 local authority areas, especially Edinburgh, Inverclyde, West Dunbartonshire, Falkirk, North Ayrshire, South Lanarkshire, West Lothian, Stirling, Clackmannanshire and South Ayrshire. In contrast, only eight local authority areas showed a below average increase, notably East Dunbartonshire, Aberdeenshire, Highland and East Ayrshire.
Overall, this suggests a relative decline in DVC frequencies in the north of Scotland and a relative increase in the central belt. No clear change in DVC frequencies can be discerned for the area south of the central belt. The extent to which this relates to localised changes in deer populations, traffic levels or other factors is unclear. This should be investigated in a future contract.
Diurnal and seasonal distribution and species involved
The available evidence suggests that the DVC incidents continue to peak between 21:00 and 00:00, or between 15:00 and 00:00 between December and February. However, there are known gaps in the data from 2018 onwards that makes it unlikely the results of this analysis would differ from that in Langbein (2019).
Diurnal patterns of DVC incidents will be affected by levels of deer activity and traffic. Though deer are active over the full 24-hour period, they exhibit crepuscular peaks in activity (Mitchell, Staines and Welch, 1977; Georgii, 1981; Pagon et al., 2013; Sándor et al., 2013; Ensing et al., 2014; Ikeda et al., 2019). In upland areas they are known to descend from higher elevations at dusk to feed, returning at dawn. In lowland situations they leave woodlands at dusk, also to feed and return at dawn (Mitchell, Staines and Welch, 1977). As such, they are more likely to be actively commuting between resting and feeding areas in the evening and early morning, often placing them near roads, with evening being earlier in winter months. Furthermore, movement increases and patterns become irregular during the rut (Sándor et al., 2013), which may lead to an increased risk of DVCs earlier in the day, as is evident in this study for September to November. Traffic levels will vary during the day, generally peaking in the morning and evening commutes. Overlaps in the peak periods for deer and traffic would be expected to result in higher numbers of DVCs, as is evident for the period from 15:00 to 18:00 in December to February.
Added to the effects of deer activity and traffic levels, both driver and driving conditions will affect diurnal and seasonal DVC patterns. 21:00 to 00:00 is a consistent peak in DVCs throughout the year, which may be in part due to driver tiredness between these hours that means they are less able to respond to deer on the road. The same will be true for drivers under the influence of alcohol or narcotics, though DVCs where this is a factor may not exhibit such a clear diurnal pattern.
Driving conditions are likely to be poorer in the early morning and evening, when darkness reduces visibility, and mainly in winter months when there is a greater chance of slippery roads and conditions such as fog or snow reducing visibility. Despite this, evenings in December to February when driving conditions will be poorest do not show such a distinct peak. This may be due to reduced deer activity or traffic levels. Red deer are known to be less active in January and February (Georgii, 1981), though there is evidence to suggest that the daily peak in DVCs is simply spread across a longer time period of 15:00 to 00:00 in winter months.
DVC frequencies continue to show a peak in May and June across all road types, but especially for trunk roads. The average number of DVCs per year on motorways appears to have increased, though the numbers have decreased between March and August, covering the normal peak period for DVCs. In contrast, the average number of DVCs per year on other trunk roads appears to have decreased. The reasons for these apparent trends are not clear, but may reflect changing deer populations, whilst decreases on motorways during the usual peak period for DVCs may relate to Spring awareness campaigns using variable-message signs.
The primary reason for the increased average number of DVCs per year on non-trunk A-roads is likely to be better reporting, due to the increased number of reports received from the SSPCA. This is the primary dataset covering non-trunk roads and has reported a much higher average number of DVCs per year in the last four years than the previous ten. However, this does not appear to extend to other non-trunk roads, possibly because driving speeds are frequently slower or fewer people report injured deer on these roads.
Analysis of records where the species of deer was thought to have been reliably identified suggests no change from previous analysis (Langbein, 2019). Roe deer appear to be the most frequently involved species throughout Scotland and in most local authorities, reported from all local authorities except West Dunbartonshire. Red deer are the next most frequent, having been reported from 10 local authority areas. Red deer are also the most frequently reported species in Highland and North Ayrshire. Sika and fallow deer the less frequently recorded, though the only report from West Dunbartonshire with a reliable species identification involved a sika deer.
Assessment of DVC risk
For the first time, this study has attempted to assess the risk of DVCs on lengths of the trunk road network that are shorter than section lengths. Whilst this has little effect on the calculated risk on short trunk road sections, for longer sections it greatly improves the resolution, allowing the identification of DVC blackspots that would otherwise be missed.
However, this analysis relies upon the provision of positionally accurate DVC reports. DVCs that are more than 500 m from the relevant trunk road section or road number where this is available, or otherwise from the whole trunk road network, are removed from the analysis and are of no concern. The issue is inaccurate positioning of DVCs along relevant trunk road sections, as this can result in artificially clustered records of DVCs.
Whilst all trunk road operators are meeting their contractual obligations and providing high quality data on DVCs, the higher positional accuracy required for this analysis means that issues with supplied data were identified (Annex 4: Accuracy of incident locations). Positional accuracy is a concern in data from the South East unit, M77 and Aberdeen Western Peripheral Route, though there is also a level of inaccuracy in the data for other trunk road units.
In the South East unit, almost all records from 1 January to 17 August 2020 were positioned at either the start or end of the trunk road section. There is also evidence to suggest that this was also true of many later DVC reports, though this may be due to a known bug in IRIS that defaulted locations to the start of the trunk road section when the incident was not manually located. The data from before 2020 appears to be unaffected.
Incorrect grid references and section codes were identified in the M77 DVC reports. Many DVC reports were located at a wind farm many miles from the trunk road network. Whilst many discrepancies were identified and improvements made to the position, we cannot be confident that the locations of all DVCs records are reliable enough for the risk assessment undertaken.
The only location information for DVC reports for the Aberdeen Western Peripheral Route was contained in a description. Sometimes this included a marker post reference that allowed the DVC to be more precisely located, but it was usually only possible to match reports to somewhere on the most likely trunk road section. The apparent lack of clustering in the position of these DVCs was most likely a result of attempts to accurately locate each report when the data were collated into the main DVC database.
In addition, notable in all trunk road operator data was a small tendency for DVCs to be recorded at depots and service stations. These may relate to incidents elsewhere on the trunk road network that were recorded later. These will be included in the analysis and incorrectly linked to the nearest road section, unless they are associated with a different road section or number.
These issues required that the blackspots were manually reviewed to determine the reliability of the recorded locations of DVCs on which they were based. This was a time-consuming process that could be avoided if more accurate data were available.
Shortlisted blackspots for targeted mitigation activities
The blackspots identified in Table 19 and Annex 5: Maps of DVC blackspots for 2019-2021 could be the focus of targeted mitigation activity.
It is notable that 90% of shortlisted blackspots relate to road junctions. It seems likely that road junctions are more likely to be DVC blackspots than longer sections between junctions. There are several possible reasons for this:
- Slip roads at road junctions tend to be curved and thus visibility is reduced, potentially increasing the chance of vehicles colliding with deer on the road.
- Slip roads are not in constant use, potentially making it more likely that deer will stray onto the road when cars are not visible.
- Road junctions often include wooded areas surrounded by roads with no public disturbance that may act as daytime refuges for deer from which they will move to feed. This is especially likely near built up areas where there are few alternative undisturbed resting up places for deer.
All blackspots identified at road junctions were associated with adjacent woodland that was likely to have low level of direct human disturbance. Mitigation could therefore focus on reducing the suitability of the area surrounding each blackspot for deer. Felling the woodland is not recommended, as it can assist with issues such as noise and pollution reduction, as well as providing valuable habitat. Instead, reducing deer numbers through culling or discouraging them from using these wooded areas may prove beneficial. The decline in DVC reports from Forestry and Land Scotland following several years of increased culling suggests that this can be an effective way of reducing DVC incidents but it may not be suitable in the built up areas where many blackspots occur. Culling in wooded road islands may also lead to the rapid dispersal of deer not shot and increase the immediate risk of DVCs. Fencing woodland areas where possible would mean that deer could not utilise them and is a potential solution.
Such mitigation would be costly, so we propose several pilot projects at some of the more significant blackspots to see if DVC frequencies can be reduced. Pilots should commence with an initial survey to determine whether deer are using roadside wooded areas and collect information that can be used to inform mitigation. These surveys should record the abundance of dung, couches, tracks, slots, feeding damage and other signs of deer activity (The Deer Initiative, 2008; n.d.). Deer tracks leading out of the woodland towards the road will be particularly informative. Appropriate mitigation may include removal of deer, roadside fencing or other forms of control aimed at excluding or making the woodland less suitable for deer. Follow up surveys should be undertaken to determine whether deer continue to use the woodland and identify any unexpected consequences of the mitigation. Repeat analysis could indicate whether these actions have reduced DVC risk at the targeted locations.
A suggested priority order for the implementation of these pilot projects would be:
- M90 North of Muirmont Interchange
- A82 Renton Junction
- M823/M90 Pitreavie Interchange
- M9 East of Pirnhall Interchange (South)
- M8 North and West of Livingston Interchange
- A78 North of Warrix Interchange
- A9 Dunblane West Junction
- A78 East of Eglington Interchange
- M8/A898 Craigton Interchange
The only shortlisted blackspot not near a wooded junction was the A9 north of the Navidale Roundabout. This blackspot is surrounded by pasture with moorland in the north and west. Whilst it is near a roundabout, this may be coincidental. One of the ten DVC records in this area was reliably attributed to a red deer. Given the location, it is likely that red deer were involved in every case and that this involved them crossing the road whilst moving from the higher altitude moorland areas to pasture. Five records occurred in March and April, and four in August and September, suggesting that the activity resulting in DVCs in this area may be seasonal, though there is no evidence to suggest a crepuscular pattern.
There appears to be no signage warning about deer in this area and no permanent Variable-Message Signs along this stretch of the A9. Erecting permanent wild animals signs and/or using mobile Variable-Message Signs to display warnings in appropriate months between the Navidale Roundabout and where the cycle path diverges from the A9 at ND046172 is advised. Increased culling of red deer is also likely to reduce risk and will be more acceptable in this rural location. Erecting deer fencing along the road is not recommended without other more expensive mitigation, such as the installation of overpasses allowing the deer to migrate without crossing the road, as this is likely to move the problem elsewhere.
Comparison with previous approach
It was inevitable that comparison of the risk analysis undertaken by Langbein (2019), which covered nine years, and our analysis covering three different years would produce different results. This is especially true given the apparent changes in DVC distributions between these time periods.
The decision to repeat the calculations using records within 500 m of the trunk road for 2019 to 2021 is unlikely to have affected which roads were identified as DVC blackspots. This is because DVCs between 150 m and 500 m from trunk roads are likely to be relatively evenly distributed across the road network, rather than clustered around a smaller number of roads. This is expected to increase the average number of DVCs per kilometre per year. Note that the average number of DVC reports collated per year has also increased since 2008 and would increase the average number of DVCs per kilometre per year between the two periods. This is demonstrated by four roads with an average in 2019 to 2021 that is higher than the highest average for 2008 to 2017.
The minimum and maximum normalised risk index values would always be 0 and 1. Nevertheless, including more DVCs by using records within 500 m of trunk roads and the increasing numbers of DVCs per year would also be expected to increase the average calculated values. However, this increase should again be distributed relatively evenly across the entire road network.
Therefore, comparison of the roads identified as blackspots between the two periods is meaningful.
In 2008 to 2017 and 2019 to 2021 the five roads with the highest average number of DVCs per kilometre per year were all in the south and mainly in the central belt. The main change has been a move towards roads in the South East having the highest rates in 2019 to 2021. This is most likely due to the large increase in DVC records from the South East in 2020 and 2021. The same pattern of change is also shown for the roads with the highest average normalised risk index, except for the A887 in Highland in 2019 to 2021.
Those roads with the lowest average number of DVCs per kilometre per year were more scattered in both years, but included more short roads in 2019 to 2021, including the A738, A89, A893 and A972. All these roads are less than four kilometres long and had no reported DVCs in 2019 to 2021.
Comparing the maximum number of DVCs per kilometre per year and normalised risk index for whole trunk road sections and for 50 m to 500 m parts of these for 2019 to 2021 shows an obvious difference, with almost completely different results. This is expected, as where DVC blackspots occur they are concentrated over relatively short lengths of the trunk road network. Such blackspots are averaged over the entire length of long trunk road sections in the method developed by Langbein (2019), whereas they produce much higher results for shorter parts of those sections when using the PostgreSQL/PostGIS function described here.
In addition, attempts to reduce the bias inherent in including short road sections, and duplicating DVC records across dual carriageways and other nearby sections will also have led to different results being obtained by the PostgreSQL/PostGIS function.
This all suggests that the approach employed by the PostgreSQL/PostGIS function is an improvement on that employed by Langbein (2019). Because of this, the difference in the results produced by both approaches is regarded as reassuring evidence that development of the PostgreSQL/PostGIS function was worthwhile. This is supported by review of the maps in Annex 5: Maps of DVC blackspots for 2019-2021, which suggests that those identified using the function were located where there were large numbers of DVCs reported.
There seems little reason to continue to assess DVC blackspots on whole trunk road sections, so use of the PostgreSQL/PostGIS function is recommended in the future. Opportunities to further enhance the function to make the approach and results more robust should also be explored.
Covid-19
The Covid-19 pandemic has had a major impact on human activities in Scotland and globally. This has included national lockdowns and restrictions to travel to contain the virus. It is therefore reasonable to expect that reduced travel may have affected the number of DVCs reported. Viewed simply, less traffic on the road means fewer vehicles to collide with deer. However, the absence of traffic may have led deer to become less wary, which would in turn make DVCs relatively more frequent for a given volume of traffic. Whilst it was unlikely that Covid-19 would result in an increase in DVC incidents, it was reasonable to assume that there would have been a decrease or no change, either of which would have provided interesting information.
Overall, the number of DVC reports during the enforcement of travel restrictions was found to have decreased, but this was entirely driven by decreased reports from members of the public. This was clear when we separated data from those with an obligation to report DVCs, such as the trunk road operating companies, and data reliant upon public reporting, such as SSPCA, online reporting tools and apps. Whilst there was a clear suppression of reports from the public whilst travel restrictions were in place, the number of DVC reports not collected by volunteers remained consistent with previous years. This analysis therefore supports the conclusion of Bíl et al. (2021) that there is no evidence for a suppression of DVC numbers in Scotland due to Covid-19 travel restrictions.
The analysis undertaken by Bíl et al. (2021) was more robust. They built a seasonal ARIMA model, which they used to predict expected weekly wildlife vehicle collisions in 2020 and compare with the actual figures. A repeat of this exercise using the available data might predict higher numbers for 2020 than the previous five-year average, but it is unlikely that the prediction would be higher than the number recorded by non-volunteers. In the light of the results presented, we do not consider an ARIMA model-based analysis of the data to be worthwhile.
It is nevertheless surprising that travel restrictions had no noticeable impact on the frequency of DVCs. These results contrast with anecdotal reports from various observers that wildlife had become more noticeable when Covid-19 restrictions were in place (Rutz et al., 2020). They could be explained if traffic volumes were lower, but deer became less wary around roads. This would have increased the number of DVCs per volume of traffic, thus masking the impact of reduced volumes of traffic. However, it is likely that such behavioural changes would take more than a few months to occur.
A perhaps more realistic explanation for the absence of any reduction in DVCs whilst travel restrictions were in place could be due to the type of vehicles affected. Although many were encouraged to work from home or were placed on furlough, essential travel continued to be allowed. This may have led to a reduction in the number of cars on the road, but little or no change to the volume of freight traffic. Most freight traffic consists of large vehicles that are less able to react to deer on the road. They are also more likely to be in the inside lane where deer are most likely to occur. Where they do collide with a deer, it is less likely to damage the vehicle and will therefore go unreported, with the carcass found later. As such, they may be responsible for a large proportion of DVCs that cannot be ascribed to a particular type of vehicle.
It would be useful to investigate the relative frequencies of DVCs for different types of road user, to see whether freight traffic does account for a large proportion of DVCs. This could be undertaken as a survey of different types of drivers, asking whether they have hit deer in the last one or two years. The information gained could influence mitigation measures, such as campaigns targeting freight drivers. Such a campaign would primarily target a reduction in damage to vehicles and related insurance claims, and animal welfare concerns.
TROC reports not resulting in a deer carcass uplift
The South East region reported exceptionally high numbers of DVCs in 2021 and to some extent 2020. 12% of these DVC records related to reports of dead or injured deer on the roadside that were subsequently not found, which were often informally recorded as ‘no trace’. It is not clear whether the other TROCs have supplied similar records, as the level of detail on the records provided for the South East for 2020 and 2021 has been higher than has been typical.
Review of these records suggested a high level of reliability, despite the absence of a carcass to prove the DVC. The majority were reported to the TROC by Police Scotland with very precise location information and plenty of detail. Other evidence of the reliability of these records includes:
- Records that were initially recorded as ‘no trace’ and then subsequently updated when a carcass was found.
- One record where no carcass but a ‘small patch of blood and guts’ was recorded. It is unlikely that this would have been documented had it been old, which suggested that the carcass had been uplifted by a third party.
- Instances where the TROC knew or suspected that the carcass had been uplifted by a third party. This included uplifts ascribed to the SSPCA and a local gamekeeper.
Only a very small number were thought to be potentially dubious, though in all cases this was due to a lack of detail in the incident log rather than any real concern about the validity of the record. This suggested that the ‘no trace’ records most likely did represent DVCs, but that deer had been dispatched and carcasses removed by third parties. It is likely that in some areas there are a significant proportion of the public are willing to stop and remove deer carcasses, and that this might account for the 12% of records where the carcass was not found.
For this reason, all ‘no trace’ records for the South East in 2020 and 2021 were retained in the database. This may have accounted for some of the increase in reported DVCs in this region in 2020 and 2021 if similar data were not included for previous years.
This also suggests that there may be similar data held by other TROCs that have not been included in data supplies, as previous supplies appear to have focused on carcass uplifts. This should be investigated in the next contract, to determine whether such data exists and what sort of impact it would have. It may also be possible to add ‘no trace’ records for previous years to the database if they are not already included, which would provide better data on total numbers of DVCs per annum and trends.
Correlation of DVCs against other factors
The trends in DVCs per annum are likely to be due to a combination of deer population levels, traffic levels and reporting effort. Knowing the relative importance of each would help to better understand the measures that could be taken nationally to reduce DVC risk. However, concerns about the completeness of the data (see TROC reports not resulting in a deer carcass uplift) have precluded such an analysis.
Once any missing ‘no trace’ records have been added to the database and the dataset is felt to be sufficiently complete an analysis of DVC trends against other factors is recommended. Relevant factors include:
- AADF traffic levels.
- Deer population estimates.
- Office for National Statistics population data.
- Level of citizen science deer recording. This could be indicated by the overall numbers of records submitted via the various apps and online forms mentioned in this report.
- Weather data. It is likely that poor weather will increase the number of DVCs, though given the delay between many DVCs and report of the carcass this data may need to be generalised.
- Time of year.
The period covered by the analysis would be dictated by the availability of data. It will also most likely be necessary to partition the data into shorter periods to provide appropriate data resolution for analysis, as the factors will change through time.
The effect of changes to the road network
All analyses have used the current road network, rather than the network at the time of the DVC. This approach is both pragmatic and appropriate. Determining the road network at the time of each DVC incident and adjusting the analysis to match would be impractical for no real gain. Moreover, the analysis should be valid when it is done, so should apply to the current road network.
This may mean that some historic DVCs are no longer on the road network, or that some that were on the wider road network are now close to trunk roads. Much of the more complex analyses described in this report have been designed to overcome this issue wherever possible by matching DVCs to roads based on trunk road section and road numbers. Those that are incorrectly included in the analysis are likely to be few and therefore unlikely to have a great impact on the results or interpretation.
This means that analyses where DVCs are assigned to roads should be considered a snapshot of the current situation. It will not always be possible to reliably compare the results for different years. Nevertheless, conclusions drawn in a single study are likely to be reliable, as the locations of the DVCs have not changed.
Marker post datasets
Reference to the nearest marker post is the only location information available for some DVC records. However, marker post data in Scotland are patchy. For this study, data presumed to originate from Transport Scotland was combined with data for the M6 and Aberdeen Western Peripheral Route. These data were found to be incomplete and include errors, noting that many trunk roads in Scotland do not have marker posts.
In many cases, it was necessary to estimate the location of a marker post referenced by a DVC record, based upon the location of mapped marker posts, so that the DVC could be mapped. These manually mapped marker posts were added to a combined marker post dataset maintained within the PostgreSQL database. However, this process is time consuming and is likely to be result in inaccurately mapped marker post records.
It is likely that the absence of accurately mapped marker post data impacts activities other than DVC analysis. There would be benefit in developing a complete marker post dataset, though this would be costly to create. We therefore suggest a cost-benefit exercise is undertaken that considers the value of a marker post dataset, mapping precision required, mapping approaches that could be used and cost of creating it, and makes appropriate recommendations for its development.
References
Bíl, M., Andrášik, R., Cícha, V., Arnon, A., Kruuse, M., Langbein, J., Náhlik, A., Niemi, M., Pokorny, B., Colino-Rabanal, V.J., Rolandsen, C.M. and Seiler, A. 2021. COVID-19 related travel restrictions prevented numerous wildlife deaths on roads: A comparative analysis of results from 11 countries. Biological Conservation, 256, 109076.
Ensing, E.P., Ciuti, S., de Wijs, F.A.L.M., Lentferink, D.H., ten Hoedt, A., Boyce, M.S. and Hut, R.A. 2014. GPS Based Daily Activity Patterns in European Red Deer and North American Elk (Cervus elaphus): Indication for a Weak Circadian Clock in Ungulates. PLoS ONE, 9(9), p.e106997.
Georgii, B. 1981. Activity patterns of female red deer (Cervus elaphus L.) in the Alps. Oecologia, 49(1), 127-136.
Ikeda, T., Takahashi, H., Igota, H., Matsuura, Y., Azumaya, M., Yoshida, T. and Kaji, K. 2019. Effects of culling intensity on diel and seasonal activity patterns of sika deer (Cervus nippon). Scientific Reports, 9(1), 17205.
Langbein, J. 2011. Deer Vehicle Collisions in Scotland Monitoring Project 2008-2011. Wrexham: The Deer Initiative Limited. p.49.
Langbein, J. 2013. Deer Vehicle Collisions in Scotland Monitoring 2008-2012. Wrexham: The Deer Initiative Limited.
Langbein, J. 2017. Deer-vehicle collisions in Scotland: data collection and collation to end 2015. Scottish Natural Heritage. p.54.
Langbein, J. 2019. Deer-Vehicle Collision (DVC) data collection and analysis 2016 - 2018. p.76.
Langbein, J. and Putman, R. 2006. National Deer-Vehicle Collisions Project: Scotland 2003 to 2005. Report to the Scottish Executive. Wrexham: The Deer Initiative Limited.
Mitchell, B., Staines, B.W. and Welch, D. 1977. Ecology of Red Deer. Banchory: Institute of Terrestrial Ecology.
Nelli, L., Langbein, J., Watson, P. and Putman, R. 2018. Mapping risk: Quantifying and predicting the risk of deer-vehicle collisions on major roads in England. Mammalian Biology, 91, 71-78.
Pagon, N., Grignolio, S., Pipia, A., Bongi, P., Bertolucci, C. and Apollonio, M. 2013. Seasonal variation of activity patterns in roe deer in a temperate forested area. Chronobiology International, 30(6), pp.772–785.
Pepper, S., Barbour, A. and Glass, J. 2019. The Management of Wild Deer in Scotland. p.374.
Rutz, C., Loretto, M.-C., Bates, A.E., Davidson, S.C., Duarte, C.M., Jetz, W., Johnson, M., Kato, A., Kays, R., Mueller, T., Primack, R.B., Ropert-Coudert, Y., Tucker, M.A., Wikelski, M. and Cagnacci, F. 2020. COVID-19 lockdown allows researchers to quantify the effects of human activity on wildlife. Nature Ecology & Evolution, 4(9), 1156-1159.
Sándor, G., Náhlik, A., Tari, T. and Heffentraeger, G. 2013. Analysis of fallow deer home range and daily activity paterns.
The Deer Initiative, 2008. Species Ecology England and Wales Best Practice Guides - Deer Signs.
The Deer Initiative, n.d. Woodland Impact Survey.
Annex 1 – Database main table structure
| Field name | Field type | Description |
|---|---|---|
| id | Serial | Primary key |
| geom | Geometry(Point,27700) | Point location in British National Grid |
| deercoll_ref | Integer | Legacy unique record identity field as supplied by Jochen Langbein. |
| inc_datetime_loreliability | Timestamp with time zone | The original date and time logged on record. Where the record has no time it is recorded as 00:00:00. |
| inc_datetime_hireliability timestamp with time zone, | Timestamp with time zone | As above, but the time is kept only for those records where it is believed to be reliable. |
| os_easting | Integer | The eastings recorded in the original data, in British National Grid. |
| os_northing | Integer | The northings recorded in the original data, in British National Grid. |
| os_gridaccuracy | Character varying | An assessment of the accuracy of the grid reference, based primarily upon the data collection method. |
| os_location_desc | Character varying | A description of the location as recorded in the original data. |
| road_localauthority | Character varying | The local authority area the record occurs within. In a few cases spatial imprecision results in NULL results, so these are updated manually. |
| road_no | Character varying | The road number, e.g. A7. |
| road_link_section | Character varying | The trunk road section code, e.g. 11031/76. |
| road_direction | Character varying | The direction of traffic for motorways and dual carriageways. |
| road_cway_type | Character varying | The carriageway type of the road. |
| road_ontrunkorwithin250m | Boolean | An indication of whether the record relates to a trunk road, based on its attributes or proximity within 250 m. |
| deer_species | Character varying | The species of deer, where recorded. |
| deer_femalenos | Integer | The number of females, where recorded. |
| deer_malenos | Integer | The number of males, where recorded. |
| deer_juvenilenos | Integer | The number of juveniles, where recorded. |
| deer_totalnos | Integer | The total number of deer involved. Assumed to be 1 where no information is provided. |
| deer_incidnotes | Character varying | Descriptive text relating to the deer as recorded in the original data. |
| deer_experienced | Boolean | An indication of whether the data comes from a deer experienced individual or has undergone expert verification |
| people_injy | Boolean | TRUE where there is a police incident report, otherwise assumed to be FALSE. |
| people_severity | Character varying | The maximum severity, based on the following fields. |
| people_injnosfatal | Integer | The recorded number of fatalities. |
| people_injnosserious | Integer | The recorded number of serious injuries. |
| people_injnosslight | Integer | The recorded number of slight injuries. |
| people_pia_accdesc | Character varying | Descriptive text from the police accident report. |
| source_core_record | Boolean | An indication of whether or not the record comes from a core source. |
| source_type | Character varying | A code for the source type. |
| source_org_or_indiv | Character varying | A code for the source. |
| source_geom | Character varying | A code for the type of location, such as grid reference, lat/long, marker post, section code or manually located based on the description. |
| specproj_possdup | Character varying | Used to indicate suspected duplicate records. |
Annex 2 – Map of DVC incidents by year
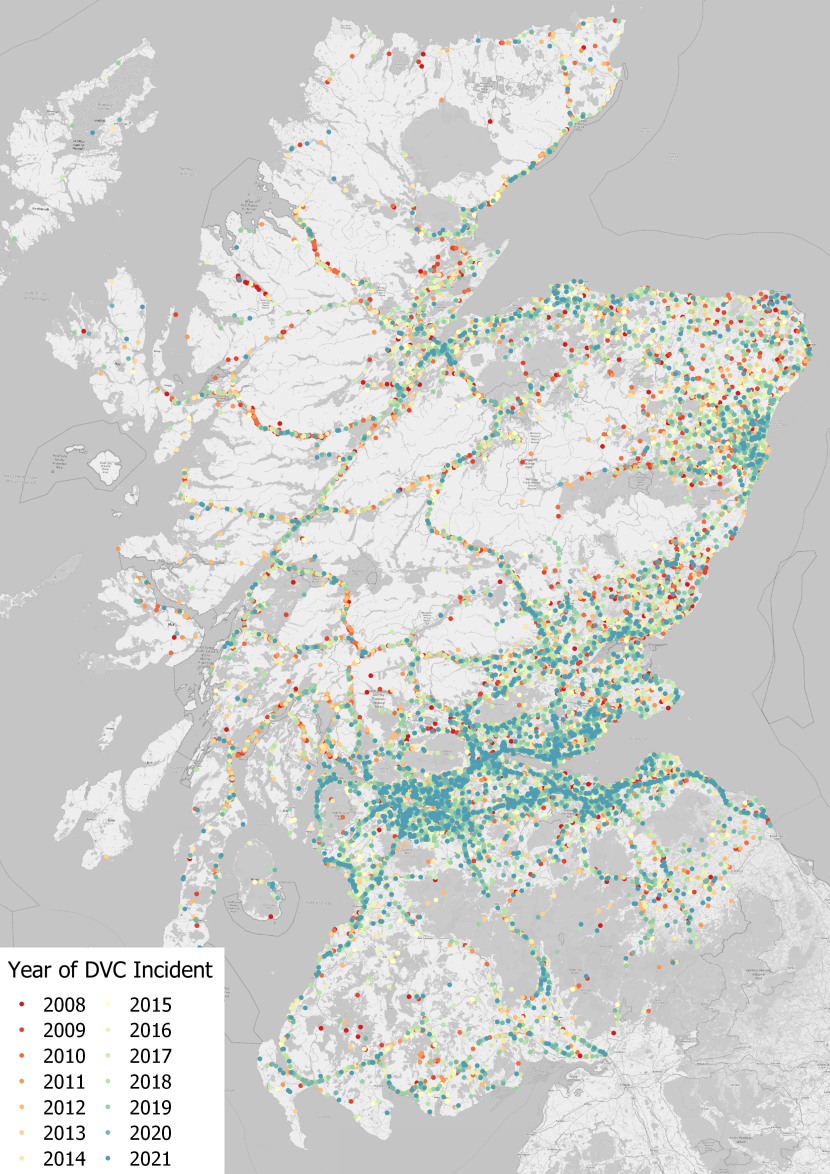
Figure 36. Distribution of Deer Vehicle Collision incidents per year in Scotland. © OpenStreetMap contributors. Contains Ordnance Survey Data © Crown copyright (and database rights) 2022.
Click for a full description
Map showing the locations of Deer Vehicle Collisions in Scotland as dots. Each dot is coloured by the year of the record, from red in 2008, through orange in 2011, yellow in 2015, green in 2018, to blue in 2021. Priority is given to showing more recent records where they obscure older records. Trunk roads are clearly distinguishable in the locations of the records, but there is also a scatter of records associated with non-trunk roads.
Annex 3 – Calibration of default blackspot analysis values
The default values included in the function are those presented in this report. These were determined through a combination of consultation and exploratory analysis, including test runs of the function using different parameters.
The most challenging decision was the choice of the maximum and minimum lengths to be considered, due to the need to be meaningful whilst also avoiding the bias towards short trunk road sections having higher numbers of DVCs per kilometre and including as much data in the analysis as possible.
A maximum length of 1,000 m was rejected, as 61.4% of trunk road sections were shorter than this and all trunk road sections less than 400 m in length (19.1% of the total) would need to be excluded to remove most of the bias. Kernal density estimation suggested a peak of trunk road section lengths of around 300-400 m, so attention was focused on shorter lengths.
Overall, 500 m appeared to be long enough to contain reasonable numbers of DVCs and be meaningful for mitigation purposes, whilst also reducing much of the bias towards shorter road sections. Shorter lengths were thought to be too short to be meaningful. 43.5% of trunk road sections were less than 500 m long and all sections less than 100 m long (1.4 % of the total) would need to be excluded to remove most of the bias. However, analysis showed that most of the extreme bias in DVCs per kilometre and normalized DVC risk index could be removed by excluding sections less than 50 m long. Additional bias could be removed if lengths with less than two DVCs were excluded, as these were unlikely to be blackspots. Furthermore, the use of 500 m maximum lengths led to a higher maximum number of DVCs per kilometre than if 1,000 m lengths were used.
It is nevertheless important to note that the need to balance meaningful results against bias reduction means that there is unlikely to be an ideal set of parameters. Those that have been selected still show bias in both average number of DVCs per kilometre per year (Figure 37) and normalized risk index (Figure 38). To partially overcome the remaining bias, where appropriate results are summarised for all trunk road lengths and only those 500 m long.
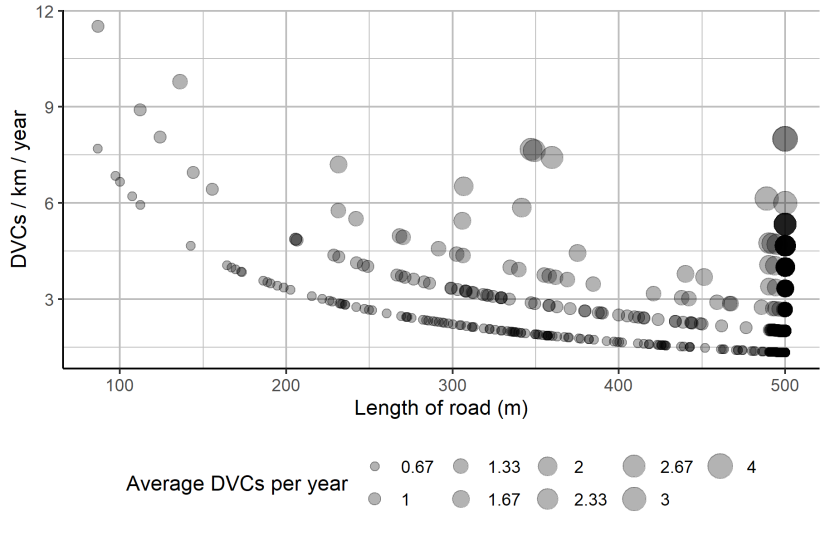
Figure 37. Distribution of possible blackspots (n = 1,142), showing the number of DVCs per kilometre per year by the length of road, calculated for 2019-2021 using the described PostgreSQL/PostGIS function and default values.
Click for a full description
Scatterplot showing the number of DVCs per kilometre per year for different lengths of roads. The y-axis is titled ‘DVCs per kilometre per year’ and ranges from 2 to 12, with labels at increments of three. The x-axis is titled ‘Length of road (m)’ and ranges from 50 to 500, with labels at increments of 100. Road lengths under 50 m long or containing less than two DVCs over the three years were excluded. The average number of DVCs per year for each trunk road part is indicated by the size of the point, ranging from 0.67 to four DVCs per year. The chart shows that the number of DVCs per kilometre per year generally increases as the length of road decreases, suggesting a bias towards shorter trunk road sections having a higher identified risk of DVCs.
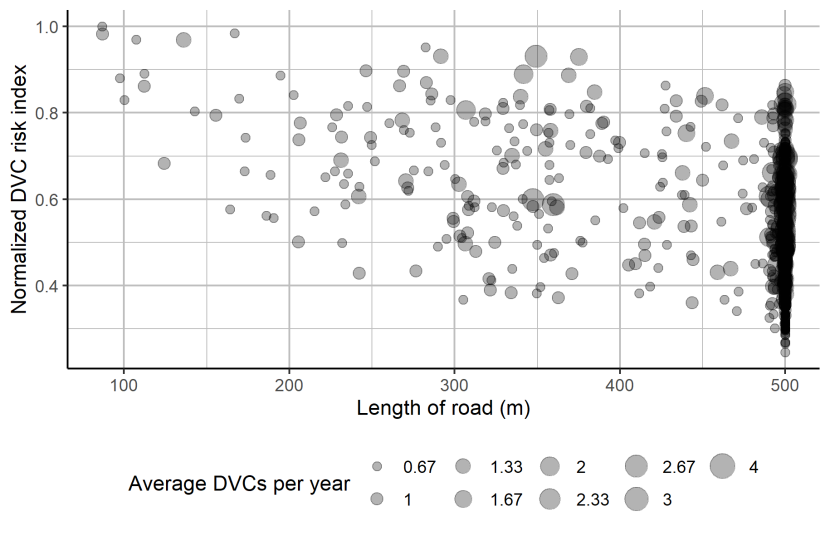
Figure 38. Distribution of possible blackspots (n = 1,142), showing the normalized DVC risk index by the length of road, calculated for 2019-2021 using the described PostgreSQL/PostGIS function and default values.
Click for a full description
Scatterplot showing the normalized DVC risk index for different lengths of roads. The y-axis is titled ‘Normalized DVC risk index’ and ranges from 0 to 1, with labels at increments of 0.2. The x-axis is titled ‘Length of road (m)’ and ranges from 50 to 500, with labels at increments of 100. Road lengths under 50 m long or containing less than two DVCs over the three years were excluded. The average number of DVCs per year for each trunk road part is indicated by the size of the point, ranging from 0.67 to four DVCs per year. The chart shows that the normalized DVC risk index is generally higher for shorter road lengths, but the bias towards shorter trunk road sections having a higher identified risk of DVCs is less pronounced than for the number of DVCs per kilometre per year (Figure 37).
Annex 4 – Accuracy of incident locations
Blackspots are identified based upon clusters of DVCs. For this to identify blackspots correctly, the location of each DVC needs to be accurately recorded at the incident. Allocation of records lacking accurate location information to the start, centre or end of trunk road sections will introduce bias and increase the likelihood of blackspots being identified.
Discussion with Transport Scotland staff confirmed that a bug existed in IRIS that meant that incidents that were not manually located on the map defaulted to the start of the trunk road section. This introduces bias into the DVC data from TROCs, but only where they do not, or do not routinely locate the incident on the map in IRIS. This bug has been fixed in AMPS, the replacement for IRIS.
An analysis was undertaken to determine the distribution of DVCs recorded by TROCs along sections from 2018 to 2021. DVCs from other sources were not considered, as they were not so directly related to the trunk road network. In order to analyse how particular TROCs record data, the analysis was split into the North East, North West, South East and South West units, plus the M6, M77, M8 and M80 DBFOs, and the Aberdeen Western Peripheral Route. The Forth Bridge Unit was included in the SE unit, although it was managed as a separate contract prior to August 2020.
The analysis considered repositioned records within 500 m of the relevant trunk road, reflecting the PostgreSQL/PostGIS function described in Development of a DVC blackspot analysis function, but records were not replicated onto nearby trunk road sections. Each record was allocated a percentage from 0% to 100%, based upon its position from the start to the end of the relevant trunk road section.
The box-whisker plots below represent the data as a box showing the median and the interquartile range for each month in 2018 to 2021. Whiskers extend from the ends of each box and represent the statistical minimum and maximum, excluding outliers. Black dots represent the individual incidents. The number of incidents for each month is shown below each box. Well distributed data would show a box and distinct whisker, with a scattering of DVCs between 0% and 100%. Poorly distributed data would show a box biased towards 0%, 50% or 100%, or occupying the full range, and/or distinct clustering of records.
Figures 39 and 40 show that DVCs in the North East and North West units were well distributed in 2018 and 2019. There was increasing evidence of bias towards section ends in 2020 and 2021, though this was not complete and likely indicates a mix of accurate and inaccurately positioned records. Overall, the evidence of bias was not considered to be strong enough to question the validity of DVC blackspots identified in the North East and North West units.
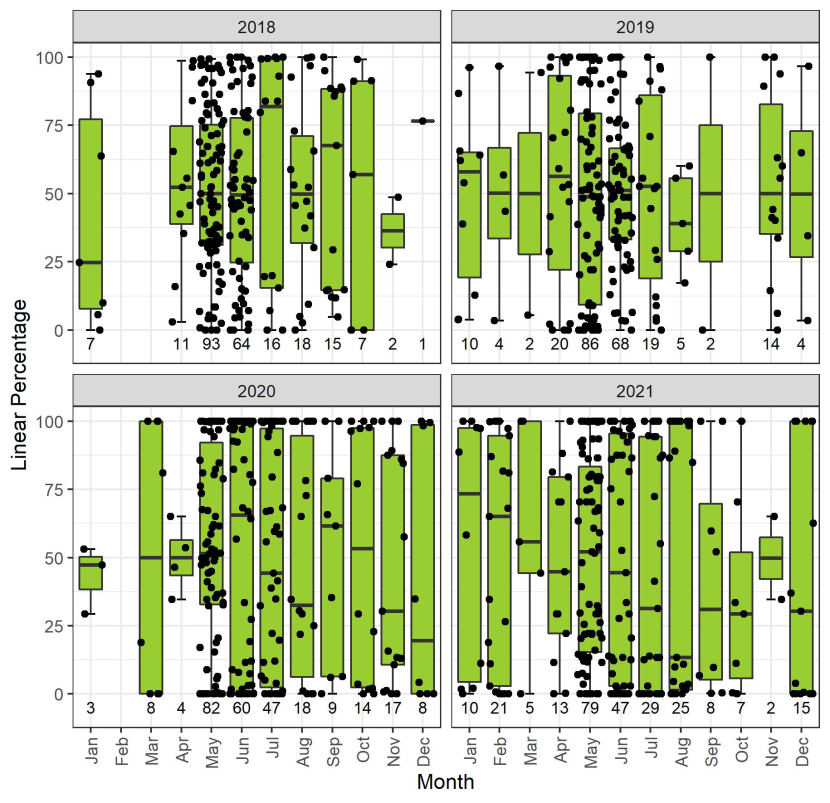
Figure 39. DVCs per month by percentage distance along the associated section for the North East Unit from 2018 to 2021.
Click for a full description
Four box and whisker plots showing the distribution of DVC locations reported by the North East trunk road unit in each month. DVCs are associated with trunk road sections based upon attributes in the original data or where they are within 500 m. Each plot represents a different year: 2018 in the top left, 2019 in the top right, 2020 in the bottom left and 2021 in the bottom right. The location is expressed as a percentage along the full section length. Location is shown on the y-axis on each plot, which is titled ‘Linear percentage’ and ranges from 0% to 100%. Months from January to December are shown on the x-axis on each plot. Each vertically aligned box shows the 25th, 50th (median) and 75th percentile. Whiskers extend from the top and bottom of boxes and show the statistical minimum and maximum values. Individual incidents are shown as black dots; where these are beyond the ends of the whiskers they represent outliers. Well distributed data would show a box and distinct whisker, with a scattering of DVCs between 0% and 100%. Numbers below each box indicate the number of incidents per month. The charts show that the data are well distributed in 2018 and 2019 but show some evidence of bias towards section ends in 2020 and 2021.
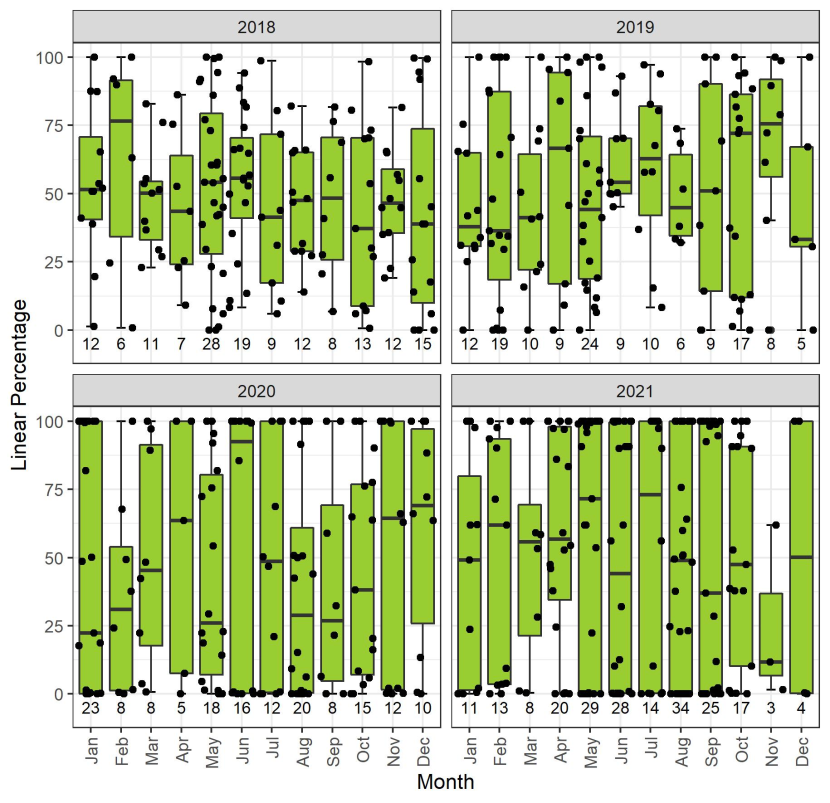
Figure 40. DVCs per month by percentage distance along the associated section for the North West Unit from 2018 to 2021.
Click for a full description
Four box and whisker plots showing the distribution of DVC locations reported by the North West trunk road unit in each month. DVCs are associated with trunk road sections based upon attributes in the original data or where they are within 500 m. Each plot represents a different year: 2018 in the top left, 2019 in the top right, 2020 in the bottom left and 2021 in the bottom right. The location is expressed as a percentage along the full section length. Location is shown on the y-axis on each plot, which is titled ‘Linear percentage’ and ranges from 0% to 100%. Months from January to December are shown on the x-axis on each plot. Each vertically aligned box shows the 25th, 50th (median) and 75th percentile. Whiskers extend from the top and bottom of boxes and show the statistical minimum and maximum values. Individual incidents are shown as black dots; where these are beyond the ends of the whiskers they represent outliers. Well distributed data would show a box and distinct whisker, with a scattering of DVCs between 0% and 100%. Numbers below each box indicate the number of incidents per month. The charts show that the data are well distributed in 2018 and 2019 but show some evidence of bias towards section ends in 2020 and 2021.
Figure 41 shows that DVCs in the South East unit were well distributed from 2018 to 2019, but there was clear evidence of bias towards the start and end of road sections in 2020 and 2021.
This was queried with Bear Scotland, who took over the contract on 16 August 2020 and supplied data for 2020 and 2021. They claim to record accurate coordinates and these are plotted on a map, but not for the first half of 2020, where DVCs in the unit were recorded by Amey. For the first half of 2020, coordinates were identified from the description in the call log, or where coordinates were not recorded in the call log the record was allocated to one end of the relevant trunk road section. Nevertheless, this does not explain why the data for the latter half of 2020 and 2021 also show bias towards the start and ends of road sections.
Given the evident bias in 2020 and 2021, any DVC blackspots identified within the SE region were regarded as suspect.
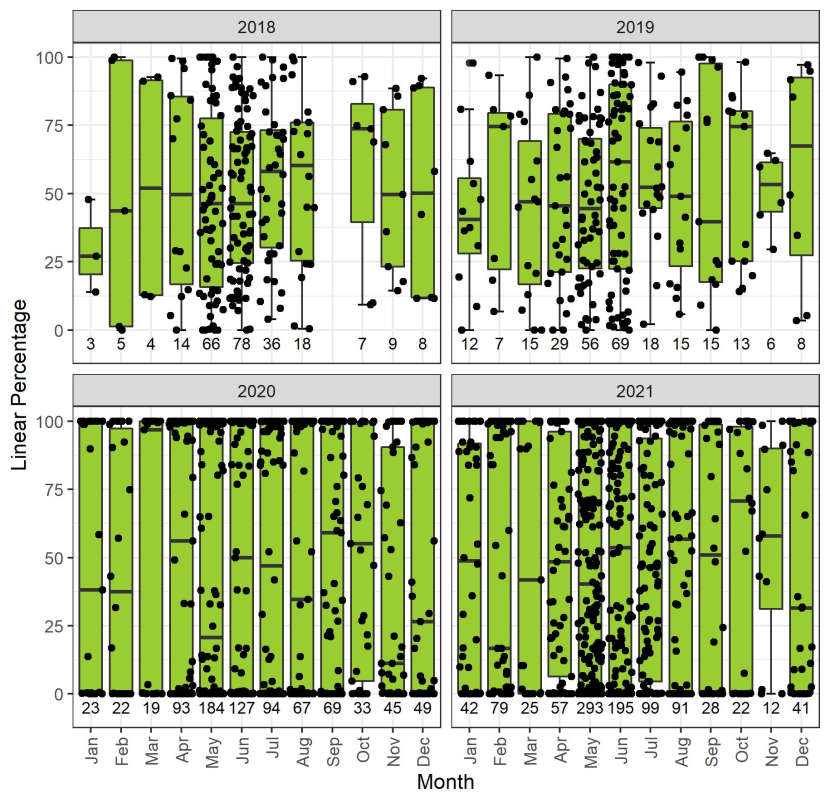
Figure 41. DVCs per month by percentage distance along the associated section for the South East Unit from 2018 to 2021.
Click for a full description
Four box and whisker plots showing the distribution of DVC locations reported by the South East trunk road unit in each month. DVCs are associated with trunk road sections based upon attributes in the original data or where they are within 500 m. Each plot represents a different year: 2018 in the top left, 2019 in the top right, 2020 in the bottom left and 2021 in the bottom right. The location is expressed as a percentage along the full section length. Location is shown on the y-axis on each plot, which is titled ‘Linear percentage’ and ranges from 0% to 100%. Months from January to December are shown on the x-axis on each plot. Each vertically aligned box shows the 25th, 50th (median) and 75th percentile. Whiskers extend from the top and bottom of boxes and show the statistical minimum and maximum values. Individual incidents are shown as black dots; where these are beyond the ends of the whiskers they represent outliers. Well distributed data would show a box and distinct whisker, with a scattering of DVCs between 0% and 100%. Numbers below each box indicate the number of incidents per month. The charts show that the data are well distributed in 2018 and 2019 but show clear evidence of bias towards section ends in 2020 and 2021. March 2020 and March 2021 are almost entirely clustered at section ends.
Figure 42 shows that DVCs in the South West were well distributed across all years. As such, there was no concern about bias in the data or the reliability of identified DVC blackspots.
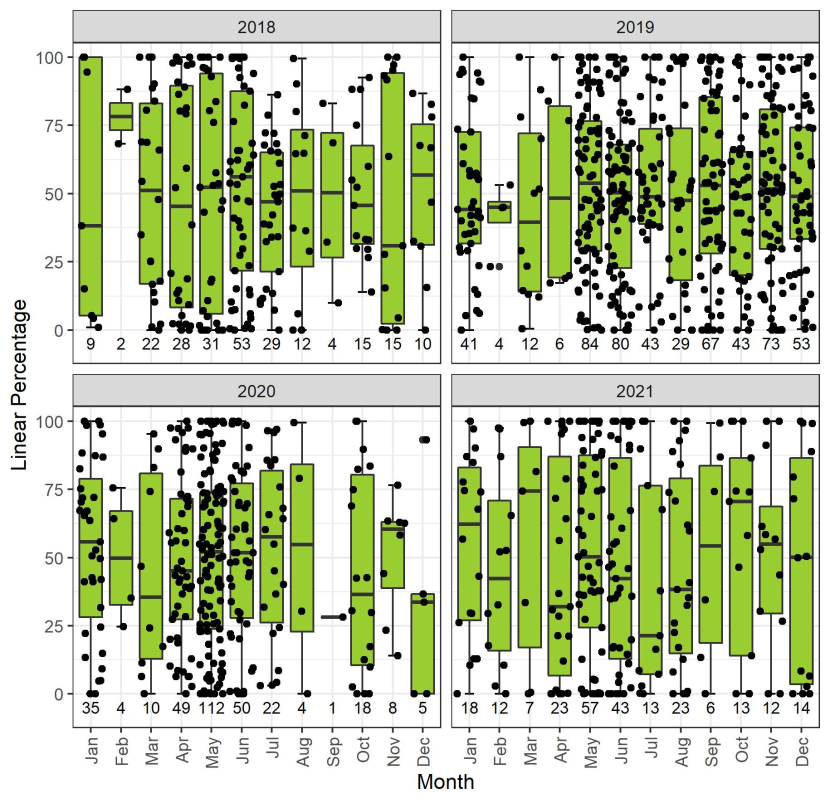
Figure 42. DVCs per month by percentage distance along the associated section for the South West Unit from 2018 to 2021.
Click for a full description
Four box and whisker plots showing the distribution of DVC locations reported by the South West trunk road unit in each month. DVCs are associated with trunk road sections based upon attributes in the original data or where they are within 500 m. Each plot represents a different year: 2018 in the top left, 2019 in the top right, 2020 in the bottom left and 2021 in the bottom right. The location is expressed as a percentage along the full section length. Location is shown on the y-axis on each plot, which is titled ‘Linear percentage’ and ranges from 0% to 100%. Months from January to December are shown on the x-axis on each plot. Each vertically aligned box shows the 25th, 50th (median) and 75th percentile. Whiskers extend from the top and bottom of boxes and show the statistical minimum and maximum values. Individual incidents are shown as black dots; where these are beyond the ends of the whiskers they represent outliers. Well distributed data would show a box and distinct whisker, with a scattering of DVCs between 0% and 100%. Numbers below each box indicate the number of incidents per month. The charts show that the data are well distributed in all months.
DVCs along the M6 and M8 DBFOs, and Aberdeen Western Peripheral Route appear to be well distributed (Figures 43, 44 and 45). Whilst there is some evidence of bias in the distribution of DVCs on the M80 DBFO in some months (Figure 46), the number of DVCs on this road is limited and the apparent bias is more likely due to randomness. This raised no or limited concerns over bias in the data for these parts of the trunk road network, though positioning of reports from the Aberdeen Western Peripheral Route relied upon manual interpretation of a description provided by the TROC.
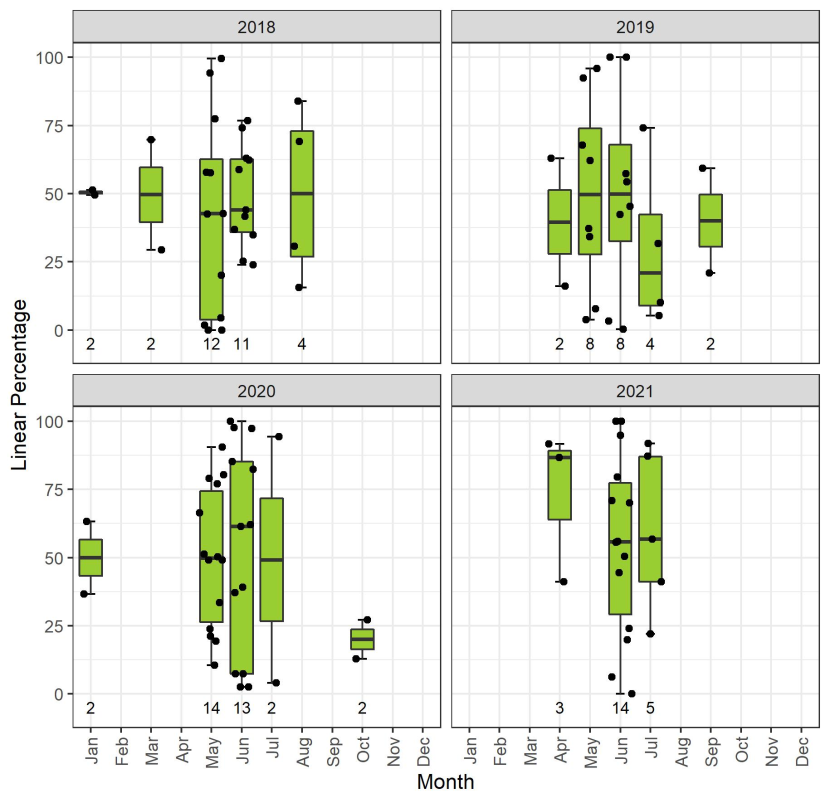
Figure 43. DVCs per month by percentage distance along the associated section for the M6 DBFO from 2018 to 2021.
Click for a full description
Four box and whisker plots showing the distribution of DVC locations reported by the M6 DBFO in each month. DVCs are associated with trunk road sections based upon attributes in the original data or where they are within 500 m. Each plot represents a different year: 2018 in the top left, 2019 in the top right, 2020 in the bottom left and 2021 in the bottom right. The location is expressed as a percentage along the full section length. Location is shown on the y-axis on each plot, which is titled ‘Linear percentage’ and ranges from 0% to 100%. Months from January to December are shown on the x-axis on each plot. Each vertically aligned box shows the 25th, 50th (median) and 75th percentile. Whiskers extend from the top and bottom of boxes and show the statistical minimum and maximum values. Individual incidents are shown as black dots; where these are beyond the ends of the whiskers they represent outliers. Well distributed data would show a box and distinct whisker, with a scattering of DVCs between 0% and 100%. Numbers below each box indicate the number of incidents per month. The charts show that the data are well distributed in all months.
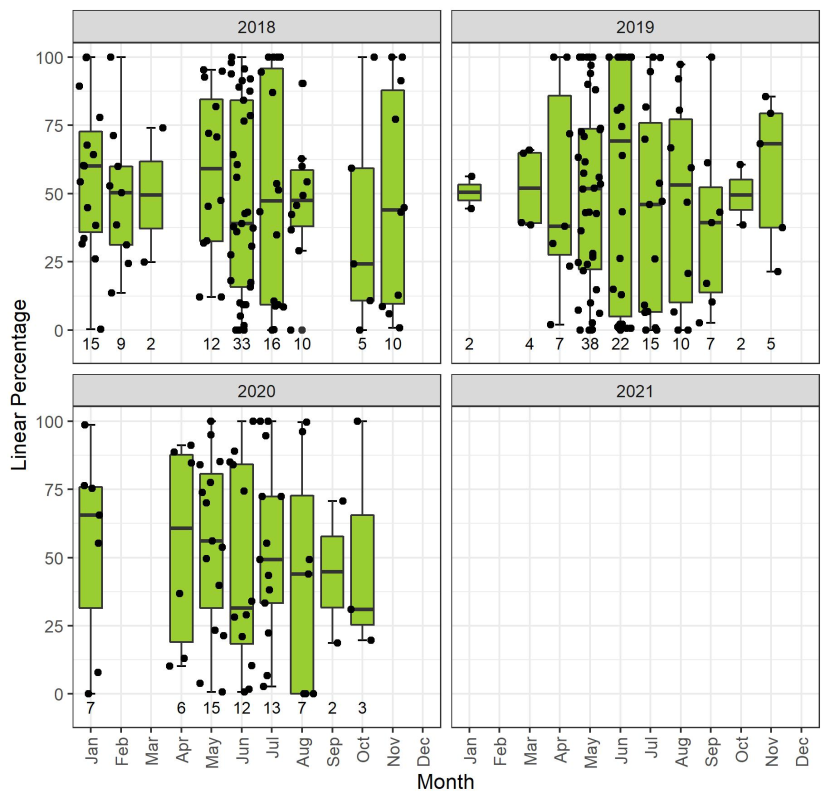
Figure 44. DVCs per month by percentage distance along the associated section for the M8 DBFO from 2018 to 2020.
Click for a full description
Four box and whisker plots showing the distribution of DVC locations reported by the M8 DBFO in each month. DVCs are associated with trunk road sections based upon attributes in the original data or where they are within 500 m. Each plot represents a different year: 2018 in the top left, 2019 in the top right, 2020 in the bottom left and 2021 in the bottom right. Data for 2021 are missing. The location is expressed as a percentage along the full section length. Location is shown on the y-axis on each plot, which is titled ‘Linear percentage’ and ranges from 0% to 100%. Months from January to December are shown on the x-axis on each plot. Each vertically aligned box shows the 25th, 50th (median) and 75th percentile. Whiskers extend from the top and bottom of boxes and show the statistical minimum and maximum values. Individual incidents are shown as black dots; where these are beyond the ends of the whiskers they represent outliers. Well distributed data would show a box and distinct whisker, with a scattering of DVCs between 0% and 100%. Numbers below each box indicate the number of incidents per month. The charts show that the data are well distributed in all months.
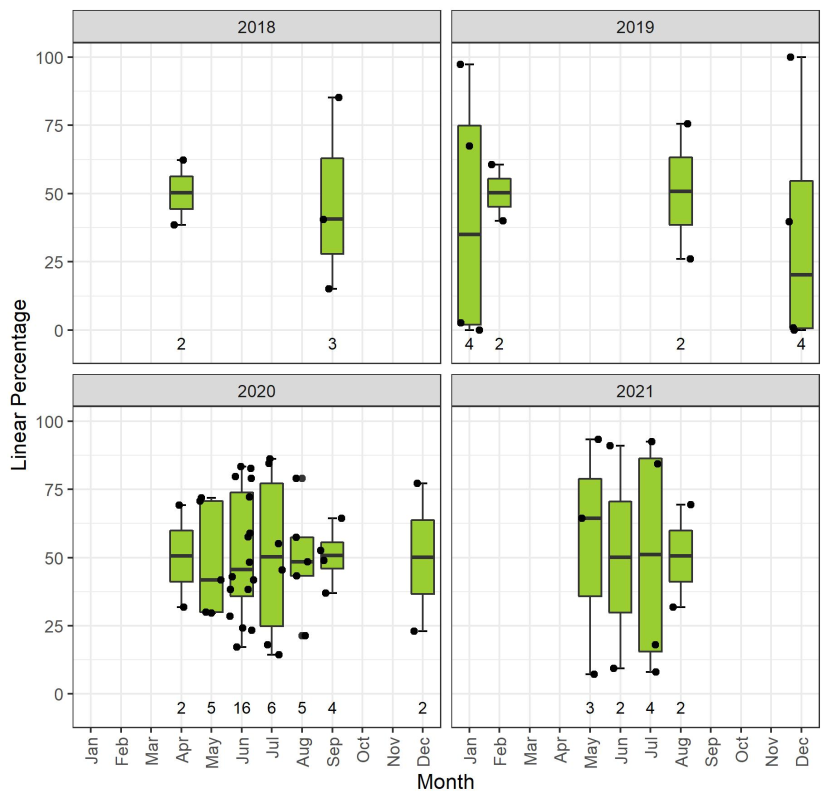
Figure 45. DVCs per month by percentage distance along the associated section for the Aberdeen Western Peripheral Route from 2018 to 2021.
Click for a full description
Four box and whisker plots showing the distribution of DVC locations reported by the Aberdeen Western Peripheral Route in each month. DVCs are associated with trunk road sections based upon attributes in the original data or where they are within 500 m. Each plot represents a different year: 2018 in the top left, 2019 in the top right, 2020 in the bottom left and 2021 in the bottom right. The location is expressed as a percentage along the full section length. Location is shown on the y-axis on each plot, which is titled ‘Linear percentage’ and ranges from 0% to 100%. Months from January to December are shown on the x-axis on each plot. Each vertically aligned box shows the 25th, 50th (median) and 75th percentile. Whiskers extend from the top and bottom of boxes and show the statistical minimum and maximum values. Individual incidents are shown as black dots; where these are beyond the ends of the whiskers they represent outliers. Well distributed data would show a box and distinct whisker, with a scattering of DVCs between 0% and 100%. Numbers below each box indicate the number of incidents per month. The charts show that the data are well distributed in all months.
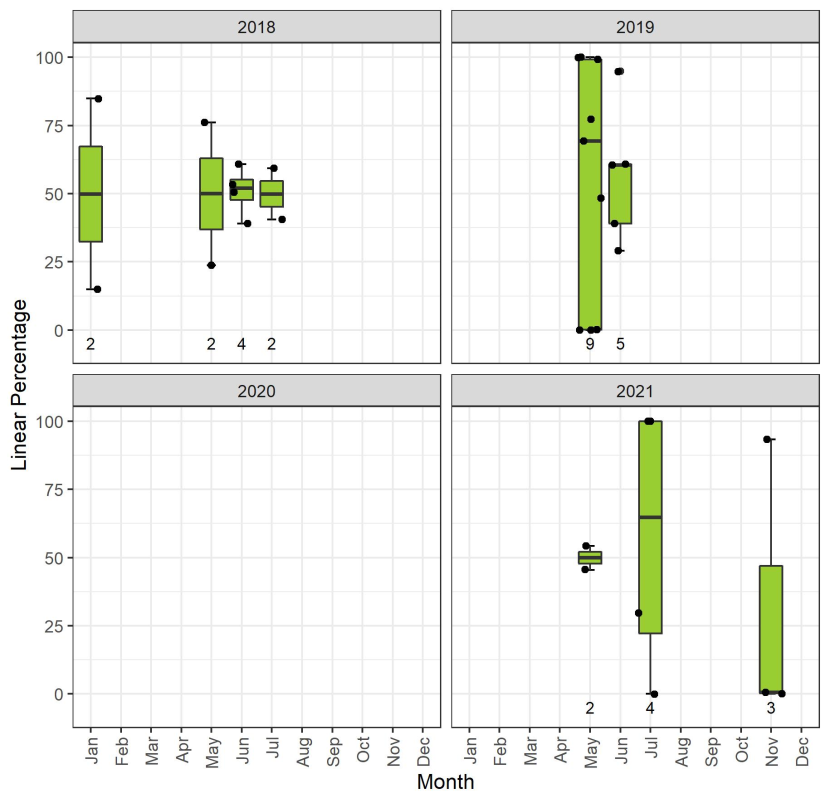
Figure 46. DVCs per month by percentage distance along the associated section for the M80 DBFO from 2018 to 2021.
Click for a full description
Four box and whisker plots showing the distribution of DVC locations reported by the M80 DBFO in each month. DVCs are associated with trunk road sections based upon attributes in the original data or where they are within 500 m. Each plot represents a different year: 2018 in the top left, 2019 in the top right, 2020 in the bottom left and 2021 in the bottom right. No DVCs were recorded in 2020. The location is expressed as a percentage along the full section length. Location is shown on the y-axis on each plot, which is titled ‘Linear percentage’ and ranges from 0% to 100%. Months from January to December are shown on the x-axis on each plot. Each vertically aligned box shows the 25th, 50th (median) and 75th percentile. Whiskers extend from the top and bottom of boxes and show the statistical minimum and maximum values. Individual incidents are shown as black dots; where these are beyond the ends of the whiskers they represent outliers. Well distributed data would show a box and distinct whisker, with a scattering of DVCs between 0% and 100%. Numbers below each box indicate the number of incidents per month. The charts show that the data are generally well distributed in all months.
DVCs along the M77 are well distributed in 2018 and 2019, but less so in 2020 and 2021 (Figure 47). The data in 2020 show a distinct bias towards the centre of each road section. In contrast, there is evidence of bias towards ends of road sections in 2021. However, this bias was introduced whilst the data were collated into the main DVC database, as in many cases only a section code was available and more accurate positioning was based on interpretation of a description of the location. This suggests that blackspots identified along the M77 should be regarded as potentially suspect.
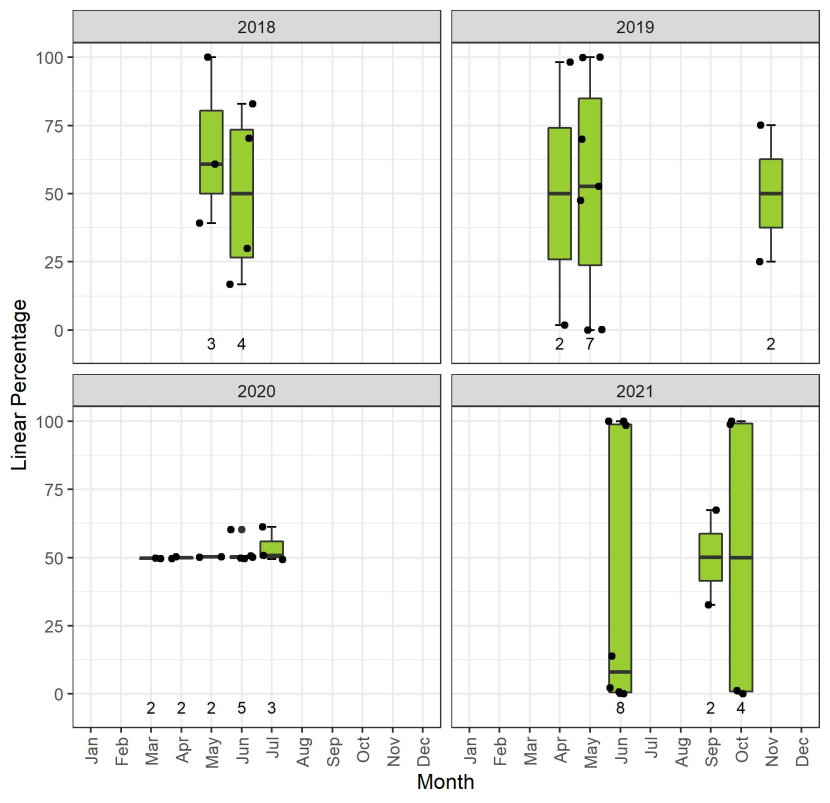
Figure 47. DVCs per month by percentage distance along the associated section for the M77 DBFO from 2018 to 2021.
Click for a full description
Four box and whisker plots showing the distribution of DVC locations reported by the M77 in each month. DVCs are associated with trunk road sections based upon attributes in the original data or where they are within 500 m. Each plot represents a different year: 2018 in the top left, 2019 in the top right, 2020 in the bottom left and 2021 in the bottom right. The location is expressed as a percentage along the full section length. Location is shown on the y-axis on each plot, which is titled ‘Linear percentage’ and ranges from 0% to 100%. Months from January to December are shown on the x-axis on each plot. Each vertically aligned box shows the 25th, 50th (median) and 75th percentile. Whiskers extend from the top and bottom of boxes and show the statistical minimum and maximum values. Individual incidents are shown as black dots; where these are beyond the ends of the whiskers they represent outliers. Well distributed data would show a box and distinct whisker, with a scattering of DVCs between 0% and 100%. Numbers below each box indicate the number of incidents per month. The charts show that the data are well distributed in 2018 and 2019, but not in 2020 where records clearly tend to be located at the midpoint along trunk road sections, or in 2021 where records tend slightly towards being located at the ends of trunk road sections.
Annex 5 – Maps of DVC blackspots for 2019-2021
The following maps (Figures 48 to 63) show the locations of the top 10 DVC blackspots based on data for 2019 to 2021 and using the PostgreSQL/PostGIS function described in Assessing DVC risk on the trunk road network. Blackspots are identified based on the normalised risk index only. The highest 20 blackspots of any length and highest 20 of 500 m length were combined, resulting in 38 blackspots due to overlaps between the two lists. These were manually reviewed to identify the 10 most severe blackspots that appear to be based on accurately located DVC records (Table 19). Maps are shown for each trunk road section with high normalised risk index, so blackspots identified based on more than one road section have multiple maps.
A78 East of Eglington Interchange
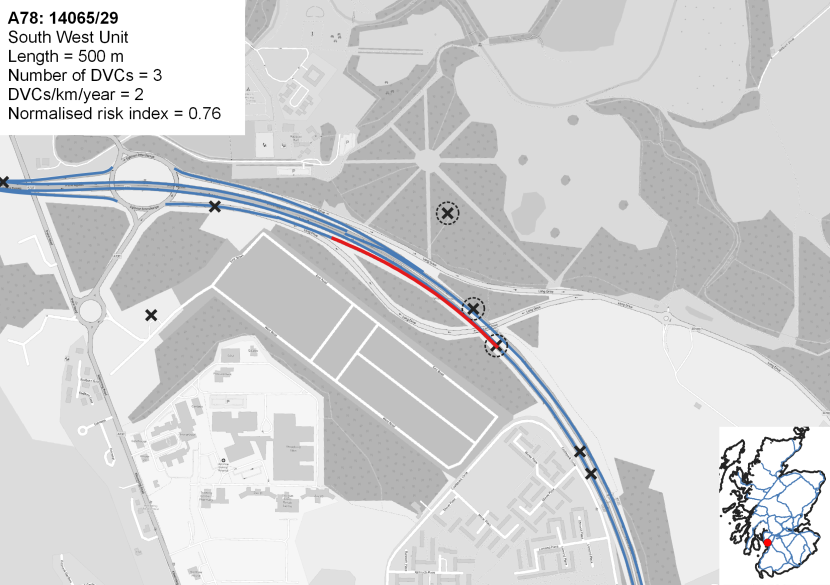
Figure 48. The Deer Vehicle Collision blackspot on the A78 east of the Eglington Interchange.
Click for a full description
Map showing the DVC blackspot on the A78 east of the Eglington Interchange in red. Other parts of the trunk road network are shown in blue. The original recorded locations of the DVC records from 2019 to 2021 are shown as black crosses, with those used to identify the blackspot circled, to allow interpretation of the validity of the blackspot. Note that DVCs can share a single location, in which case they may appear as a single DVC on the maps. The scale used is 1:10,000.
The following information is also shown:
- Trunk road number and section: A78: 14065/29
- Trunk road operating contract: South West Unit
- Blackspot length = 500 m
- Number of DVCs associated with the blackspot = 3
- DVCs per kilometre per year = 2
- Normalised risk index = 0.76
A78 North of Warrix Interchange
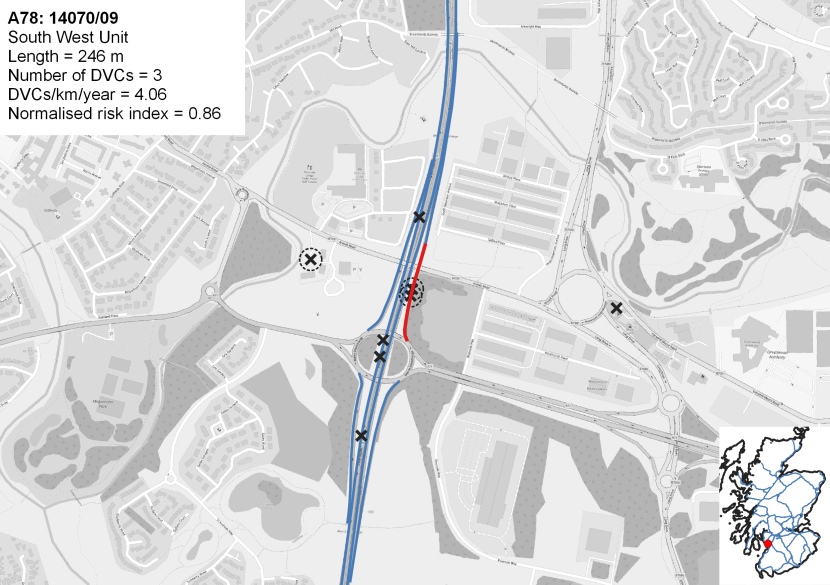
Figure 49. The Deer Vehicle Collision blackspot on the A78 north of the Warrix Interchange.
Click for a full description
Map showing the DVC blackspot on the A78 north of the Warrix Interchange in red. Other parts of the trunk road network are shown in blue. The original recorded locations of the DVC records from 2019 to 2021 are shown as black crosses, with those used to identify the blackspot circled, to allow interpretation of the validity of the blackspot. Note that DVCs can share a single location, in which case they may appear as a single DVC on the maps. The scale used is 1:10,000.
The following information is also shown:
- Trunk road number and section: A78: 14070/09
- Trunk road operating contract: South West Unit
- Blackspot length = 246 m
- Number of DVCs associated with the blackspot = 3
- DVCs per kilometre per year = 4.06
- Normalised risk index = 0.86
A82 Renton Junction
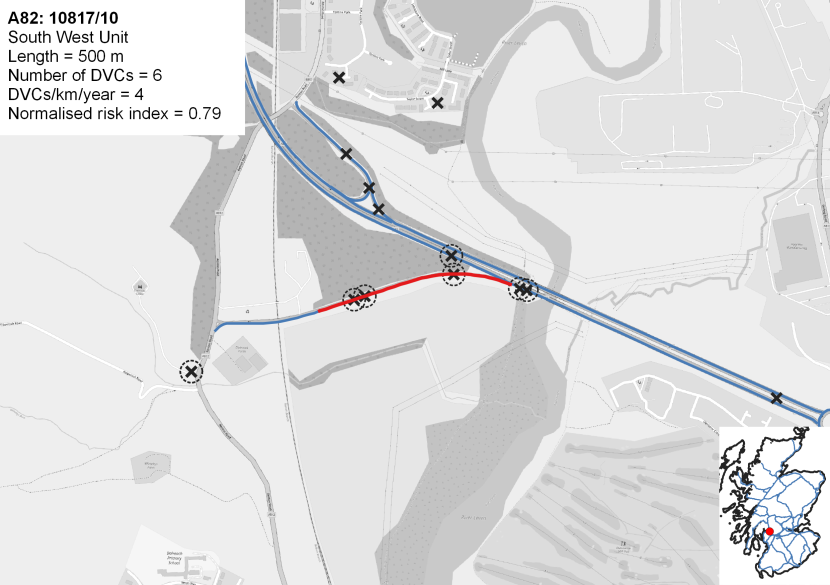
Figure 50. One of three Deer Vehicle Collision blackspots on the A82 at Renton Junction.
Click for a full description
Map showing one of three Deer Vehicle Collision blackspots on the A82 at Renton Junction in red. Other parts of the trunk road network are shown in blue. The original recorded locations of the DVC records from 2019 to 2021 are shown as black crosses, with those used to identify the blackspot circled, to allow interpretation of the validity of the blackspot. Note that DVCs can share a single location, in which case they may appear as a single DVC on the maps. The scale used is 1:10,000.
The following information is also shown:
- Trunk road number and section: A82: 10817/10
- Trunk road operating contract: South West Unit
- Blackspot length = 500 m
- Number of DVCs associated with the blackspot = 6
- DVCs per kilometre per year = 4
- Normalised risk index = 0.79
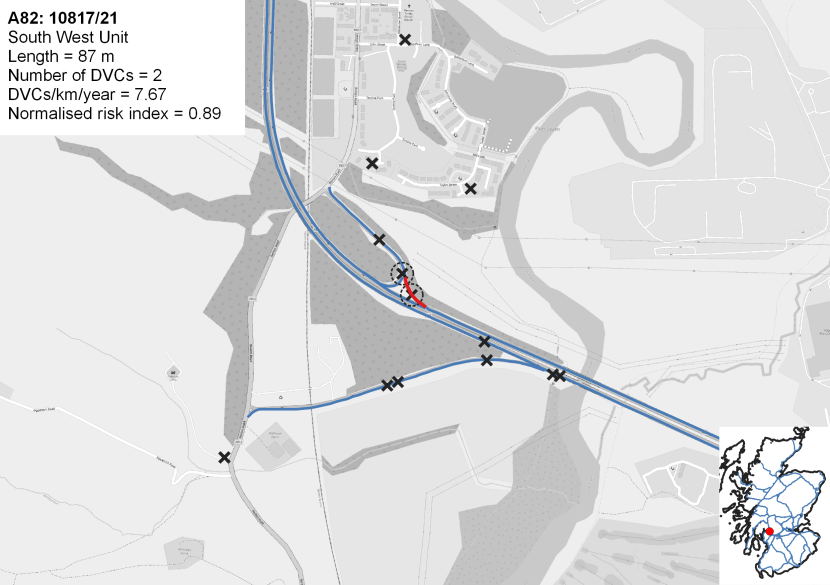
Figure 51. One of three Deer Vehicle Collision blackspots on the A82 at Renton Junction.
Click for a full description
Map showing one of three Deer Vehicle Collision blackspots on the A82 at Renton Junction in red. Other parts of the trunk road network are shown in blue. The original recorded locations of the DVC records from 2019 to 2021 are shown as black crosses, with those used to identify the blackspot circled, to allow interpretation of the validity of the blackspot. Note that DVCs can share a single location, in which case they may appear as a single DVC on the maps. The scale used is 1:10,000.
The following information is also shown:
- Trunk road number and section: A82: 10817/21
- Trunk road operating contract: South West Unit
- Blackspot length = 87 m
- Number of DVCs associated with the blackspot = 2
- DVCs per kilometre per year = 7.67
- Normalised risk index = 0.89
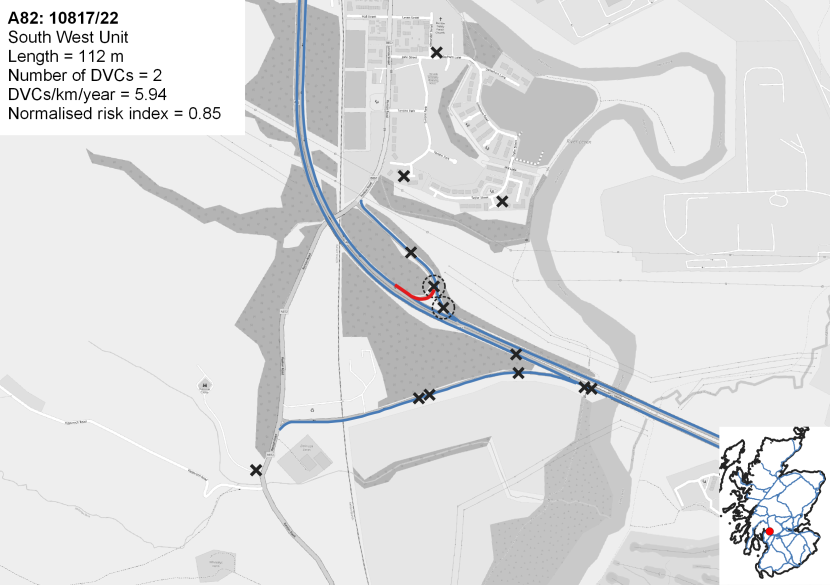
Figure 52. One of three Deer Vehicle Collision blackspots on the A82 at Renton Junction.
Click for a full description
Map showing one of three Deer Vehicle Collision blackspots on the A82 at Renton Junction in red. Other parts of the trunk road network are shown in blue. The original recorded locations of the DVC records from 2019 to 2021 are shown as black crosses, with those used to identify the blackspot circled, to allow interpretation of the validity of the blackspot. Note that DVCs can share a single location, in which case they may appear as a single DVC on the maps. The scale used is 1:10,000.
The following information is also shown:
- Trunk road number and section: A82: 10817/22
- Trunk road operating contract: South West Unit
- Blackspot length = 112 m
- Number of DVCs associated with the blackspot = 2
- DVCs per kilometre per year = 5.94
- Normalised risk index = 0.85
A9 Dunblane West Junction
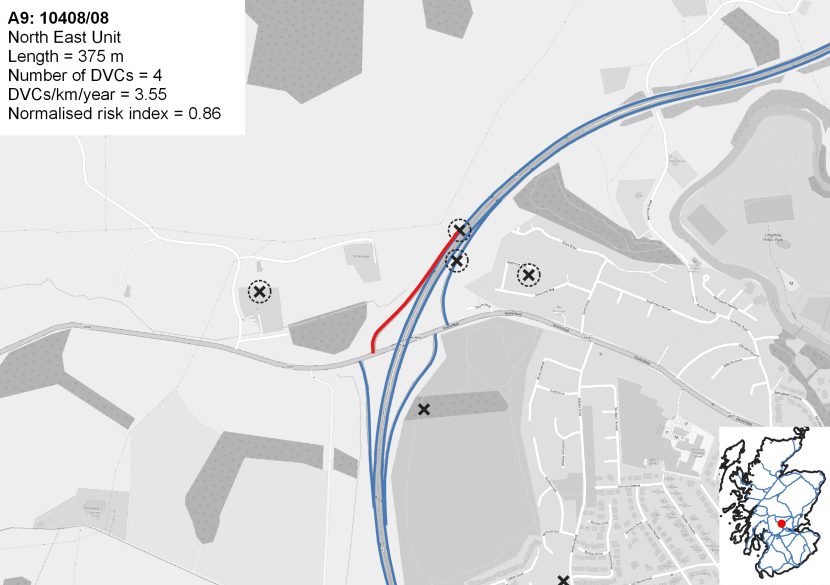
Figure 53. The Deer Vehicle Collision blackspot on the A9 at the Dunblane West Junction.
Click for a full description
Map showing the DVC blackspot on the A9 at the Dunblane West Junction in red. Other parts of the trunk road network are shown in blue. The original recorded locations of the DVC records from 2019 to 2021 are shown as black crosses, with those used to identify the blackspot circled, to allow interpretation of the validity of the blackspot. Note that DVCs can share a single location, in which case they may appear as a single DVC on the maps. The scale used is 1:10,000.
The following information is also shown:
- Trunk road number and section: A9: 10408/08
- Trunk road operating contract: North East Unit
- Blackspot length = 375 m
- Number of DVCs associated with the blackspot = 4
- DVCs per kilometre per year = 3.55
- Normalised risk index = 0.86
A9 North of Navidale Roundabout
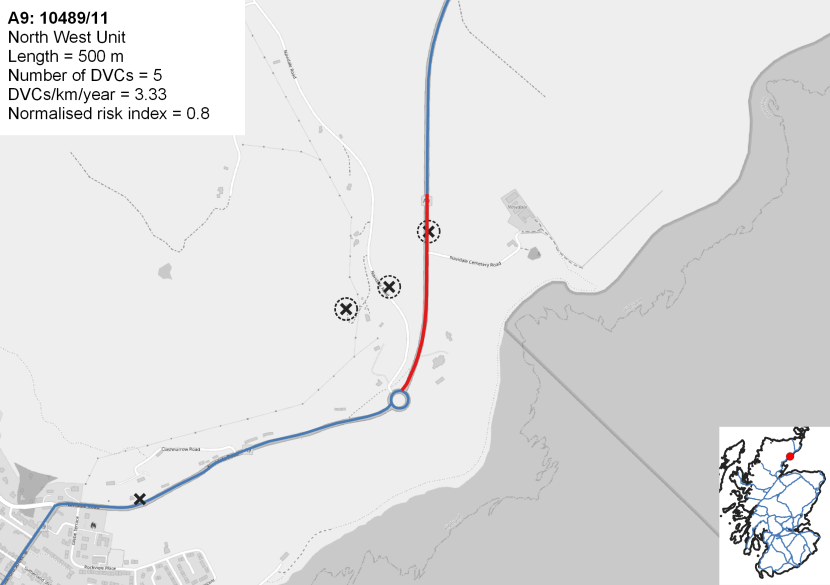
Figure 54. The Deer Vehicle Collision blackspot on the A9 north of the Navidale Roundabout.
Click for a full description
Map showing the DVC blackspot on the A9 north of the Navidale Roundabout in red. Other parts of the trunk road network are shown in blue. The original recorded locations of the DVC records from 2019 to 2021 are shown as black crosses, with those used to identify the blackspot circled, to allow interpretation of the validity of the blackspot. Note that DVCs can share a single location, in which case they may appear as a single DVC on the maps. The scale used is 1:10,000.
The following information is also shown:
- Trunk road number and section: A9: 10489/11
- Trunk road operating contract: North West Unit
- Blackspot length = 500 m
- Number of DVCs associated with the blackspot = 5
- DVCs per kilometre per year = 3.33
- Normalised risk index = 0.8
M8 North and West of Livingstone Interchange
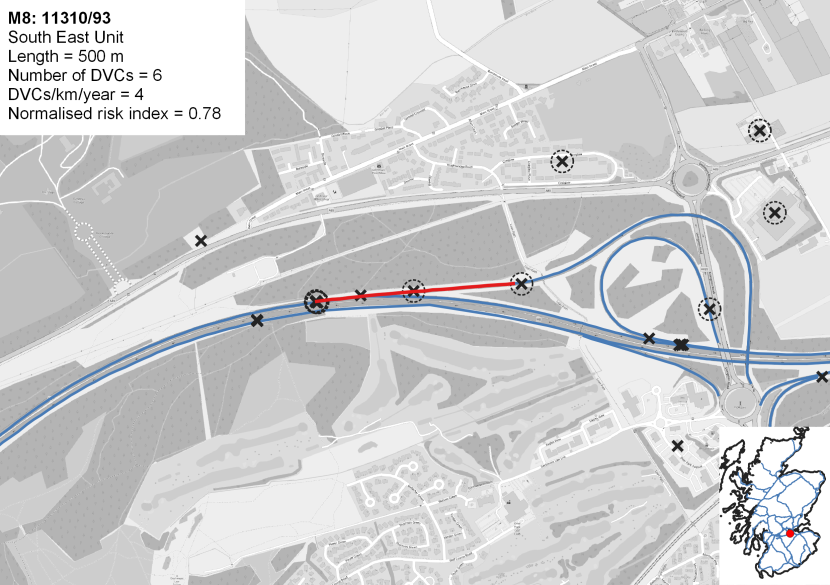
Figure 55. The Deer Vehicle Collision blackspot on the M8 west of the Livingstone Interchange.
Click for a full description
Map showing the DVC blackspot on the M8 west of the Livingstone Interchange in red. Other parts of the trunk road network are shown in blue. The original recorded locations of the DVC records from 2019 to 2021 are shown as black crosses, with those used to identify the blackspot circled, to allow interpretation of the validity of the blackspot. Note that DVCs can share a single location, in which case they may appear as a single DVC on the maps. The scale used is 1:10,000.
The following information is also shown:
- Trunk road number and section: M8: 11310/93
- Trunk road operating contract: South East Unit
- Blackspot length = 500 m
- Number of DVCs associated with the blackspot = 6
- DVCs per kilometre per year = 4
- Normalised risk index = 0.78
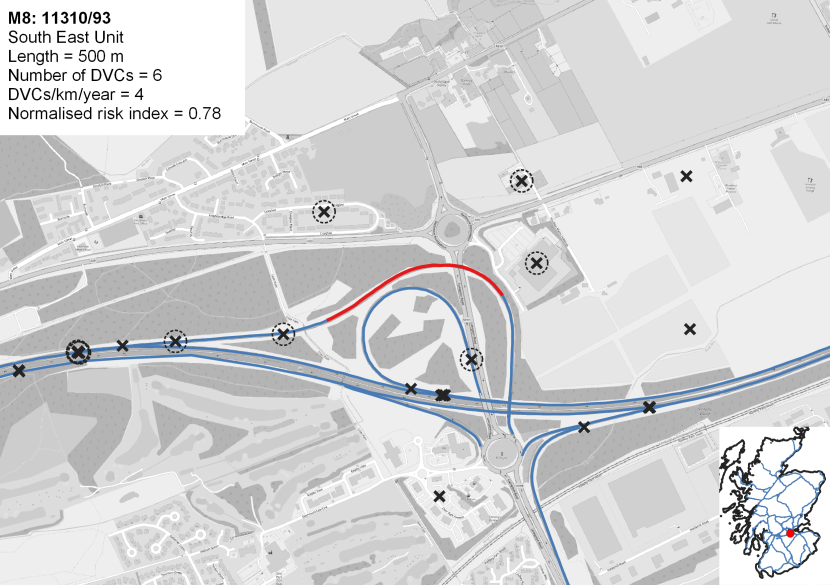
Figure 56. The Deer Vehicle Collision blackspot on the M8 north of the Livingstone Interchange.
Click for a full description
Map showing the DVC blackspot on the M8 north of the Livingstone Interchange in red. Other parts of the trunk road network are shown in blue. The original recorded locations of the DVC records from 2019 to 2021 are shown as black crosses, with those used to identify the blackspot circled, to allow interpretation of the validity of the blackspot. Note that DVCs can share a single location, in which case they may appear as a single DVC on the maps. The scale used is 1:10,000.
The following information is also shown:
- Trunk road number and section: M8: 11310/93
- Trunk road operating contract: South East Unit
- Blackspot length = 500 m
- Number of DVCs associated with the blackspot = 6
- DVCs per kilometre per year = 4
- Normalised risk index = 0.78
M8/A898 Craigton Interchange
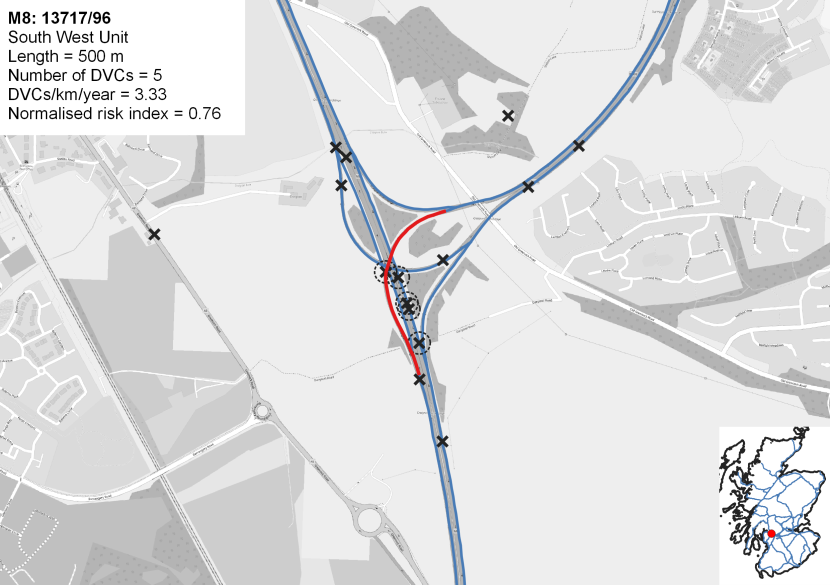
Figure 57. The Deer Vehicle Collision blackspot on the M8/A898 Craigton Interchange.
Click for a full description
Map showing the DVC blackspot on the M8/A898 Craigton Interchange in red. Other parts of the trunk road network are shown in blue. The original recorded locations of the DVC records from 2019 to 2021 are shown as black crosses, with those used to identify the blackspot circled, to allow interpretation of the validity of the blackspot. Note that DVCs can share a single location, in which case they may appear as a single DVC on the maps. The scale used is 1:10,000.
The following information is also shown:
- Trunk road number and section: M8: 13717/96
- Trunk road operating contract: South West Unit
- Blackspot length = 500 m
- Number of DVCs associated with the blackspot = 5
- DVCs per kilometre per year = 3.33
- Normalised risk index = 0.76
M823/M90 Pitreavie Interchange
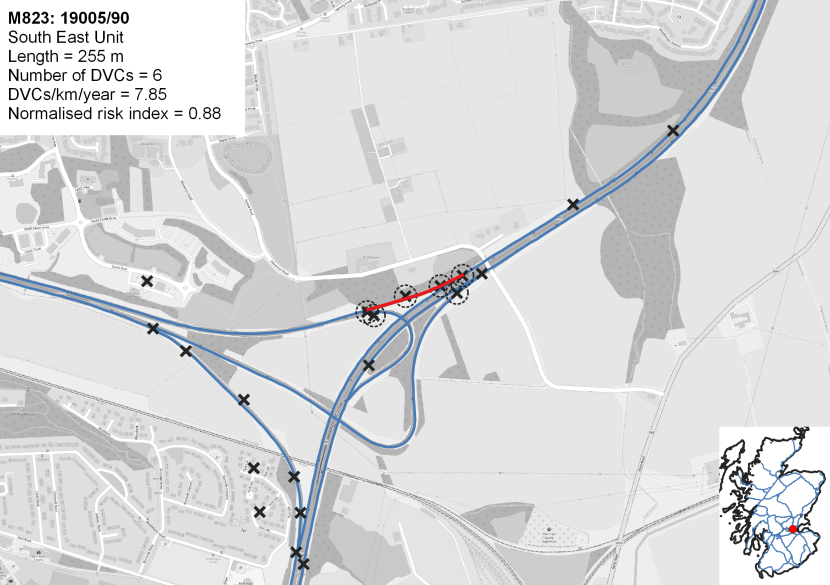
Figure 58. One of two Deer Vehicle Collision blackspots on the M823/M90 Pitreavie Interchange.
Click for a full description
Map showing one of two Deer Vehicle Collision blackspots on the M823/M90 Pitreavie Interchange in red. Other parts of the trunk road network are shown in blue. The original recorded locations of the DVC records from 2019 to 2021 are shown as black crosses, with those used to identify the blackspot circled, to allow interpretation of the validity of the blackspot. Note that DVCs can share a single location, in which case they may appear as a single DVC on the maps. The scale used is 1:10,000.
The following information is also shown:
- Trunk road number and section: M823: 19005/90
- Trunk road operating contract: South East Unit
- Blackspot length = 255 m
- Number of DVCs associated with the blackspot = 6
- DVCs per kilometre per year = 7.85
- Normalised risk index = 0.88

Figure 59. One of two Deer Vehicle Collision blackspots on the M823/M90 Pitreavie Interchange.
Click for a full description
Map showing one of two Deer Vehicle Collision blackspots on the M823/M90 Pitreavie Interchange in red. Other parts of the trunk road network are shown in blue. The original recorded locations of the DVC records from 2019 to 2021 are shown as black crosses, with those used to identify the blackspot circled, to allow interpretation of the validity of the blackspot. Note that DVCs can share a single location, in which case they may appear as a single DVC on the maps. The scale used is 1:10,000.
The following information is also shown:
- Trunk road number and section: M90: 15505/65
- Trunk road operating contract: South East Unit
- Blackspot length = 500 m
- Number of DVCs associated with the blackspot = 6
- DVCs per kilometre per year = 4
- Normalised risk index = 0.85
M9 East of Pirnhall Interchange (South)
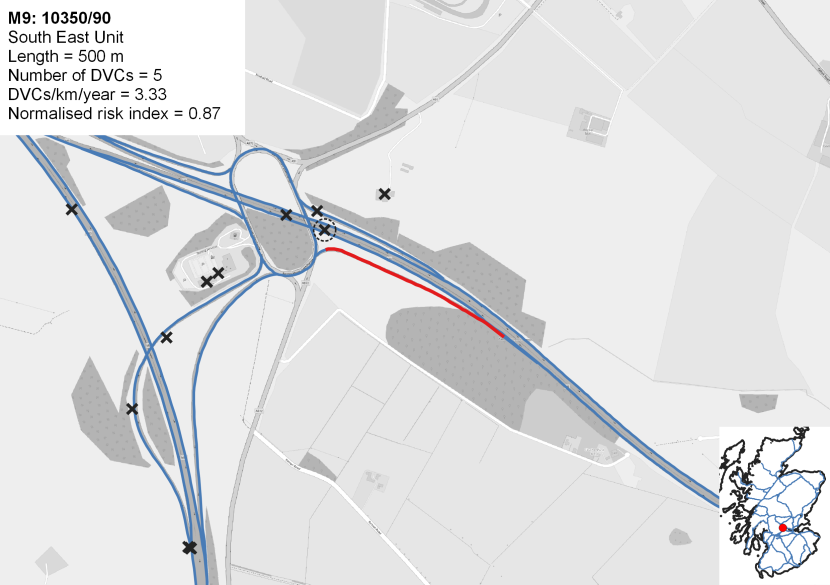
Figure 60. The Deer Vehicle Collision blackspot on the M9 east of the Pirnhall Interchange (South).
Click for a full description
Map showing the DVC blackspot on the M9 east of the Pirnhall Interchange (South)in red. Other parts of the trunk road network are shown in blue. The original recorded locations of the DVC records from 2019 to 2021 are shown as black crosses, with those used to identify the blackspot circled, to allow interpretation of the validity of the blackspot. Note that DVCs can share a single location, in which case they may appear as a single DVC on the maps. The scale used is 1:10,000.
The following information is also shown:
- Trunk road number and section: M9: 10350/90
- Trunk road operating contract: South East Unit
- Blackspot length = 500 m
- Number of DVCs associated with the blackspot = 5
- DVCs per kilometre per year = 3.33
- Normalised risk index = 0.87
M90 North of Muirmont Interchange
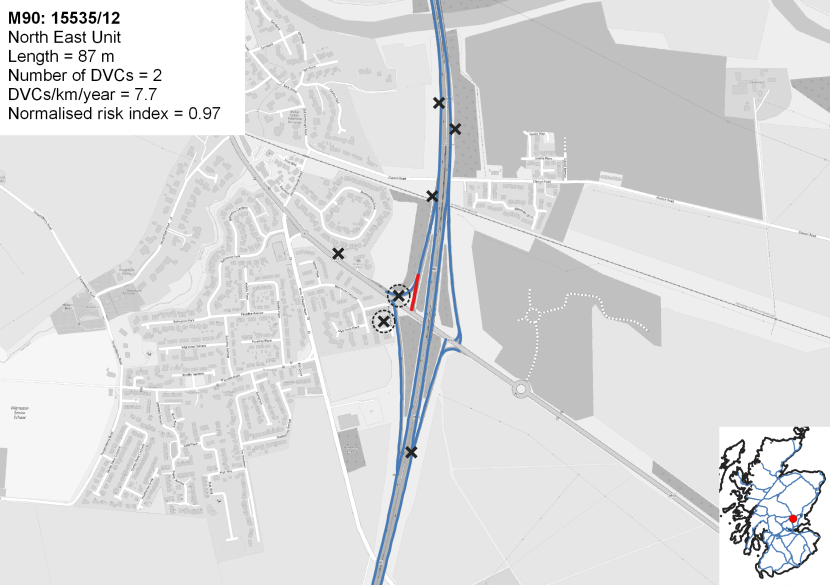
Figure 61. One of three Deer Vehicle Collision blackspots on the M90 north of the Muirmont Interchange.
Click for a full description
Map showing one of three Deer Vehicle Collision blackspots on the M90 north of the Muirmont Interchange in red. Other parts of the trunk road network are shown in blue. The original recorded locations of the DVC records from 2019 to 2021 are shown as black crosses, with those used to identify the blackspot circled, to allow interpretation of the validity of the blackspot. Note that DVCs can share a single location, in which case they may appear as a single DVC on the maps. The scale used is 1:10,000.
The following information is also shown:
- Trunk road number and section: M90: 15535/12
- Trunk road operating contract: North East Unit
- Blackspot length = 87 m
- Number of DVCs associated with the blackspot = 2
- DVCs per kilometre per year = 7.7
- Normalised risk index = 0.97
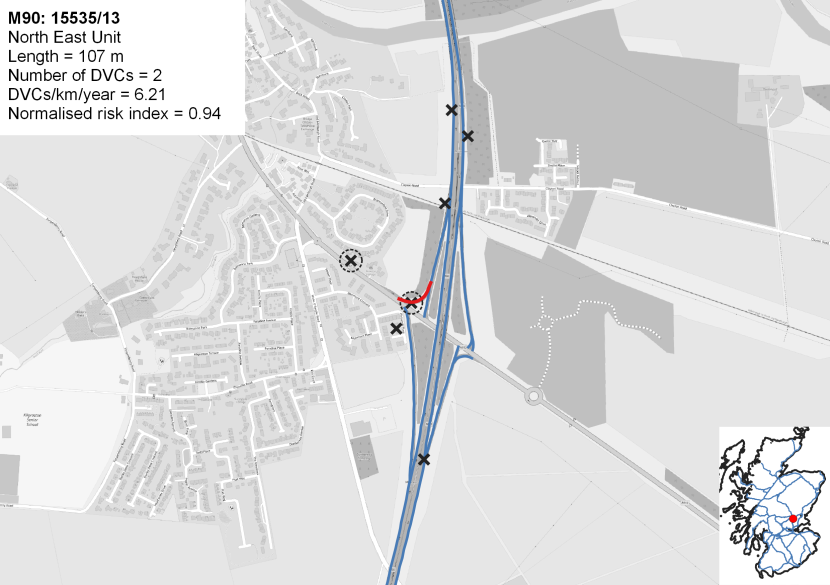
Figure 62. One of three Deer Vehicle Collision blackspots on the M90 north of the Muirmont Interchange.
Click for a full description
Map showing one of three Deer Vehicle Collision blackspots on the M90 north of the Muirmont Interchange in red. Other parts of the trunk road network are shown in blue. The original recorded locations of the DVC records from 2019 to 2021 are shown as black crosses, with those used to identify the blackspot circled, to allow interpretation of the validity of the blackspot. Note that DVCs can share a single location, in which case they may appear as a single DVC on the maps. The scale used is 1:10,000.
The following information is also shown:
- Trunk road number and section: M90: 15535/13
- Trunk road operating contract: North East Unit
- Blackspot length = 107 m
- Number of DVCs associated with the blackspot = 2
- DVCs per kilometre per year = 6.21
- Normalised risk index = 0.94
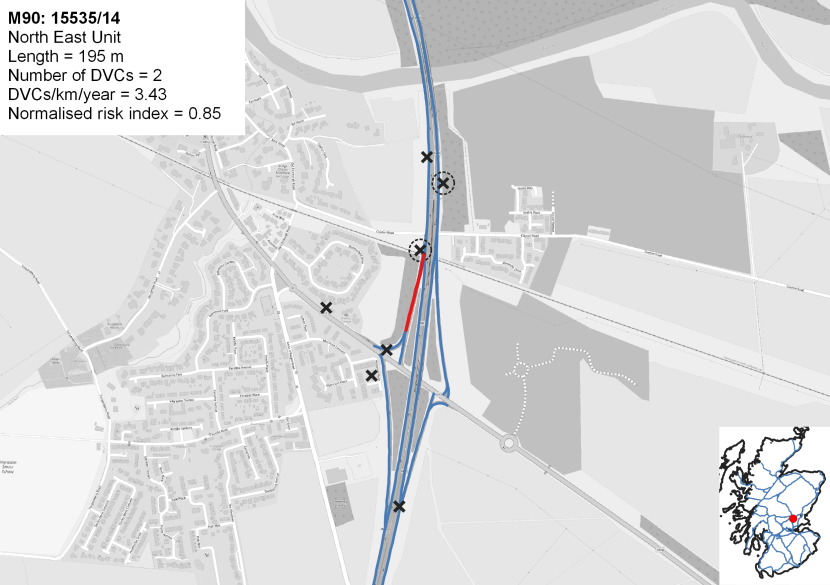
Figure 63. One of three Deer Vehicle Collision blackspots on the M90 north of the Muirmont Interchange.
Click for a full description
Map showing one of three Deer Vehicle Collision blackspots on the M90 north of the Muirmont Interchange in red. Other parts of the trunk road network are shown in blue. The original recorded locations of the DVC records from 2019 to 2021 are shown as black crosses, with those used to identify the blackspot circled, to allow interpretation of the validity of the blackspot. Note that DVCs can share a single location, in which case they may appear as a single DVC on the maps. The scale used is 1:10,000.
The following information is also shown:
- Trunk road number and section: M90: 15535/14
- Trunk road operating contract: North East Unit
- Blackspot length = 195 m
- Number of DVCs associated with the blackspot = 2
- DVCs per kilometre per year = 3.43
- Normalised risk index = 0.85