NatureScot Research Report 1350 - Cumulative collision impact modelling on bird species of Caithness and Sutherland Peatlands Special Protection Area (SPA) – within the context of the Proposed World Heritage Site
Published: 2026
Authors: Lucy Mitchell and Elizabeth Masden (Environmental Research Institute)
Cite as: Lucy Mitchell and Elizabeth Masden (Environmental Research Institute) Cumulative collision impact modelling on bird species of Caithness and Sutherland Peatlands Special Protection Area (SPA) – within the context of the Proposed World Heritage Site. NatureScot Research Report 1350.
Executive Summary
- In light of the bid by the Flow Country Partnership (FCP), for UNESCO World Heritage Status (WHS), and in the context of expanding renewable energy development in the region, it was agreed by members of the FCP WHS Executive Steering Group to conduct collision and displacement risk modelling for a number of vulnerable species to better inform future planning decisions in the region.
- Species were identified by filtering the WHS key attribute species list to those deemed to be vulnerable to direct mortality through collision with wind turbines and displacement from favoured habitat as a result of wind farm development, where enough information might exist to run an analysis.
- To assess potential population impacts of cumulative collision risk, we created Leslie Matrix Models (LMMs) assessed the population size and population growth rate for four species: Golden Eagle, Hen Harrier, Red- and Black-throated Divers, using both the Special Protection Area (SPA) and National Heritage Zone (NHZ) 5 population estimates.
- To assess impacts of displacement we mapped Golden Eagle, Greenshank, Golden Plover and Dunlin occurrence across the potential WHS area, and overlaid operational, under-construction, and in-planning wind farm boundaries to demonstrate interaction with wind farms.
- LMM model outputs comparing population size and growth rate demonstrated large impacts on Golden Eagle and Hen Harrier, but less so the Diver species, for both the SPA and NHZ populations. The Golden Eagle SPA population growth rate (PGR) declined from 0.975 to 0.973, resulting in an impacted to non-impacted population ratio of 0.996. This also gave an impacted population size that was 88% of the unimpacted population over 30 years. For the NHZ population, the impacted population was subjected to a higher rate of cumulative mortality leading to an impacted population that was just 75% of the unimpacted population.
- Hen Harrier PGR declined from 1.11 to 0.94, resulting in a predicted impacted SPA population size of just 44% of the unimpacted population over 30 years. For the NHZ population the impact was lower, due to a larger population and lower cumulative mortality rate, leading to an impacted population size that was 74% of the unimpacted one after 30 years. A reduction in Hen Harrier productivity due to collision through nest failure reduced the PGR from 1.06 to 0.97 over 30 years, leading to an impacted population that was 65% of the unimpacted one.
- Displacement mapping revealed strong bias in species occurrence data with hotspots in the area of RSPB Forsinard Flows and Gordonbush wind farm. This bias has not allowed us to accurately quantify how many pairs may be displaced, and as such we have attempted to make recommendations for further unbiased data collection to remedy this.
Introduction
The Flow Country of northern mainland Scotland is an internationally important example of blanket bog ecosystems, with a diverse bird community; however, many of the bird species are declining. Within the Flow Country, species experience multiple pressures, one of these being wind farms, which can impact birds though collision mortality as well as through disturbance and displacement. The number of wind farm developments in the north of Scotland continues to rise, so as part of the bid for the Flow Country World Heritage status to UNESCO it was deemed necessary to address some of the uncertainty around the cumulative impacts of the wind farms on birds, within the boundary of, or close to (within 5 kilometres), the potential World Heritage Site (WHS), as well as more widely across the Natural Heritage Zone 5 (NHZ5) area. The proposed World Heritage Site is an area of 1870 km2, approximately 417 km2 larger than the Caithness and Sutherland Peatlands SPA (Figure 1). Within the Natural Heritage Zone 5 area there are 256 wind turbines constructed, 205 of which are within 5 kilometres of the proposed World Heritage Site area. There are another 126 turbines approved (104 within 5km of the proposed WHS), 123 in planning (31 within 5km) and an additional 82 under construction (all within 5km) (source: Highland Council Wind Turbine Mapping; data last updated in December 2022).
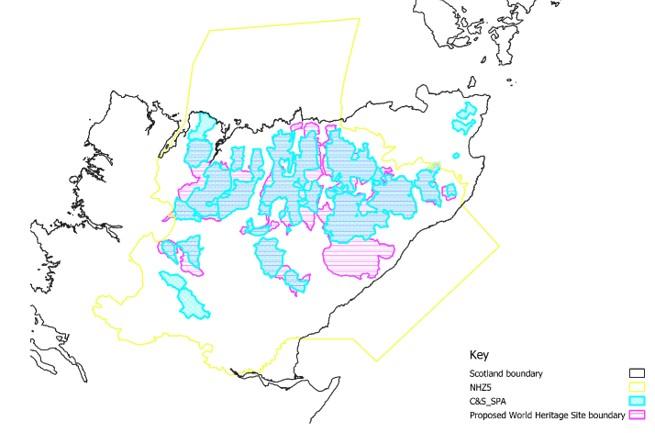
Figure 1: Proposed World Heritage Site boundary, alongside the already designated Caithness and Sutherland (C&S) Peatlands SPA and Natural Heritage Zone 5.
Click for a full description
A map showing Caithness and Sutherland, the World Heritage Site boundary, Natural Heritage Zone 5 and the Caithness and Sutherland Special Protection Area
Environmental Impact Assessments (EIAs) of recent wind farm planning applications have estimated high cumulative impacts for some of the SPA species, as a result of the combined collision risk of all the wind turbines around the SPA and in NHZ5. Collision risk is a product of both the species traits (e.g. morphology, movement and behaviour) as well as the size, height and location of the wind farm (Madders and Whitfield 2006; Thaxter et al. 2017). There are also displacement impacts from windfarms, identified both in EIAs and the wider literature. Displacement can occur as a result of direct habitat loss due to the physical footprint of the development, or due to disturbance from the wind farm construction and operations (Walker et al. 2005). This has been shown for kestrel and harrier species (Dohm et al. 2019), although it varies among species (Stevens et al. 2013). Several EIAs for wind farms constructed in and around the potential WHS area suggest that temporary displacement of species, such as breeding waders, divers and Hen Harrier, is likely in very low numbers, but is potentially mitigated by the availability of other suitable habitat in the region.
Aims and Objectives
There is a need to understand how changes in mortality and productivity, caused by collision and displacement from wind turbines, affects population size and population growth rate. The aim of this report is to estimate the cumulative impacts from operational wind turbines, as well as those under construction and in-planning, on populations of key SPA feature species, and explore the likely consequences for future populations. Barrier effects have not been included within this report due to a lack of resources and data for the identified species necessary to accurately quantify the impact.
Species of concern
Collision
There are four species within the proposed World Heritage Site area identified as being most vulnerable and of concern regarding collision risk; Hen Harrier (Circus cyaneus), Golden Eagle (Aquila chrysaetos), Red-Throated and Black-Throated Divers (Gavia stellata / arctica). These four species vary intra- and interspecifically in terms of collision risk. For example, male Hen Harrier are more likely than females to collide with turbines because they conduct extensive breeding display behaviours that occur at a higher level above ground than foraging and thus can overlap with the turbine rotor swept zone (Whitfield and Madders 2006; Wilson et al. 2015).
Displacement
There are four species that are vulnerable to displacement as a result of wind farm construction in the proposed World Heritage Site area. These are Golden Plover (Pluvialis apricaria), Dunlin (Calidris alpina), Greenshank (Tringa nebularia) and Golden Eagle (Aquila chrysaetos). Golden Plover and Dunlin have shown a reduction in abundance at wind farms during both construction and subsequent operation (Pearce-Higgins et al. 2008; Sansom et al. 2016). One of the most robust Golden Plover displacement studies found a 79% reduction in abundance up to 400 metres from the turbines, but the operation of turbines did not appear to affect hatching nor fledging of chicks, which suggests a behavioural avoidance of turbines that perhaps does not extend to population impacts (Sansom et al. 2016). A lack of robust Before-After-Control-Impact (BACI) studies and low densities of breeding waders means that the cumulative impacts of displacement at the population scale have rarely been properly quantified. We also included Golden Eagle in the displacement analyses because studies have pointed to desertion of territories by Golden Eagle (Fielding et al. 2022), and other eagle species (e.g. White-Tailed Eagle - Dahl et al. 2012). Where preferred habitat is removed or altered, especially if this habitat is already limited in availability, this could lead to population level effects through reduction of breeding pairs.
Methods
Population modelling
Population modelling can be used to predict, or simulate, the status of a population over time as well as assessing the relative change in a population because of future impact scenarios such as the development of wind turbines (Cook and Robinson 2017). A variety of methods are available for population modelling, and here we used Leslie Matrix Models (LMMs). LMMs combine the processes of birth and death (Newman et al. 2014), leading to the model structure in Figure 2. The baseline unimpacted models were parameterised using the values in Table 1. N0, tand N1, t represent numbers of juveniles 0-1 years and 1-2 years respectively, in the population at time t, whilst N2, t represents the numbers of adults at time t. Changes in abundance in the population were modelled as a functions of s0 the annual survival of juveniles from age 0 to 1, s1 the annual survival of juveniles from age 1 to 2, s2 the annual survival of adults and f, the annual productivity of adults i.e. the number of chicks produced. In some cases, such as Hen Harrier, there can be an additional measure of fecundity when birds aged 1-2 years enter the breeding population.
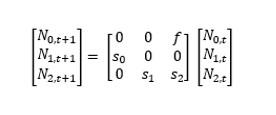
Figure 2: Structure of the Leslie matrix model used, representing juveniles (0-1 and 1-2 years) and adults (>2 years). f denotes fecundity, s denotes survival. N0,t and N1,t represent numbers of juveniles 0-1 years and 1-2 years respectively
Click for a full description
present in the population at time t, whilst N2,t represents numbers of adults at time t. A matrix equation showing that the population at a given time point is a product of abundance i.e. the number of animals in the previous time point, survival and fecundity
We did not include density dependence within the LMMs as density dependent survival or productivity is rarely recorded in raptor species (Fasce et al. 2011), and little in divers (Grear 2009), although may influence age of first breeding in some raptor species (Katzenburger et al. 2021). It is recommended not to include this aspect of population regulation where there is high uncertainty (Cook and Robinson 2016). We did however create stochasticity in the models, by adding a species-specific productivity error rate, as recommended by Cook & Robinson (2016). This allowed us to mimic natural environmental variation in productivity rates that might occur because of food shortages, etc.
A robust method for assessing the population level impacts of wind farms on birds is to use population modelling to calculate the expected population size with and without the expected effects of the wind farm on demographic rates (Green et al., 2016). When evaluated at the end of the lifetime of the wind farm, the ratio of the expected population size with the wind farm compared to that without (the counterfactual ratio of population size; CPS) is a robust metric for likely population impact (Jitlal et al. 2017). Similarly, the ratio of the expected population growth rate with and without the wind farm can be calculated (the counterfactual ratio of the population growth rate; CPGR). The calculation of these produces a ratio that can be used to assess the severity of an impact by comparing an impacted population with an unimpacted equivalent (Cook and Robinson 2016). Within this report we consider unimpacted to mean a population modelled assuming no wind farms and impacted to be a population modelled assuming an effect of wind farms. As a ratio, counterfactuals range from 0 to 1 with values closer to 1 representing a small difference between the two populations, whilst those closer to 0 represent a large difference between impacted and unimpacted populations. Here we used counterfactual ratios to estimate the impacts of collision on the populations of the species concerned in this study in relation to the proposed World Heritage Site.
For both the Caithness and Sutherland SPA and the NHZ5 populations of all four species, collision risk impacts were modelled within the LMMs as a modified survival rate. More specifically, the impact was modelled as a percentage of the mortality rate, rather than survival rates. When focusing on Hen Harrier, we also ran a model looking at impacts on productivity, where we assumed indirect impacts on Hen Harrier chick mortality due to death of an adult through collision. As Hen Harrier females undertake all of the incubating duties and are exclusively fed by the male during incubation and the early nestling period (Redpath et al. 2002), if the male is removed due to collision during this period, the nest will fail. Although for other species the female also does the majority of the incubation and brooding, they are not exclusively fed by the male and will leave the nest for short periods of time (e.g., Golden Eagle - Collopy 1984). Additionally, Hen Harriers have been recorded as polygynous (defined as a breeding male with more than one female partner, Picozzi 1984). The removal of a polygynous male through collision might induce the failure of more than one nest, on the assumption that the death of a parent means the failure of a nest. It is not known how many males may be polygynous so we modelled two differing scenarios of polygyny within the SPA population. Scenario 1: one male out of 13 is polygynous (7.6%); Scenario 2: 2 males out of 13 (15%).
We conducted all analyses using R (v. 4.2.2), and used code provided by Cook and Robinson (2016), which although originally produced for seabirds could be easily adapted for the relatively long-lived raptors and divers included in this study.
Collision data
All starting population estimates, cumulative mortality estimates, and demographic parameters are shown in Table 1 and were used to produce both CPS (counterfactual of impacted to unimpacted population size) and CPGR (counterfactual population growth rate). Impacts were modelled over 10, 20 and 30 years, to represent the expected lifetime of a wind farm.
Data on collision rates, and therefore cumulative collision risk for each species as a proportion of the population were retrieved and combined from the NatureScot cumulative impact spreadsheet (version as of April 2023). This spreadsheet compiles collision risk metrics for multiple raptor, wader, and seabird species across the north of Scotland, taken from individual wind farm EIAs (those included at the time of writing – the spreadsheet is updated as new reports come in), and calculated at NatureScot’s recommended avoidance rates (0.99 for Golden Eagle and Hen Harrier; 0.995 for Red- and Black-Throated Divers). The spreadsheet contains all operational, under construction and in-planning wind farms for which an EIA was completed (and therefore does not include scoping applications). It provides an estimate of collision numbers and the proportion (%) of the SPA and NHZ (2 & 5) populations that the collision numbers equate to, which we then used in the corresponding species models as part of the population modelling to represent a loss of adult birds from the population due to collision. Limitations of the spreadsheet include the fact that the data are not NatureScot derived but passed on from EIAs, and are therefore subject to error, as well as being subject to updates due to changes in population figures or collision rate estimates. Population sizes were taken from SPA and NHZ 5 designation criteria, but also from local field experts where uncertainty was present around the precise numbers.
Species | Caithness and Sutherland SPA population1 | Cumulative mortality as % of C&S SPA population | NHZ 5 population2 | Cumulative mortality as a % NHZ 5 population |
|---|---|---|---|---|
| Golden Eagle | 10 | 3.54 | 18 | 3.86 |
| Hen Harrier | 26 | 4.35 | 76 | 1.4 |
| Red-Throated Diver | 92 | 0.06 | 116 | 0.05 |
| Black-Throated Diver | 40 | 0.26 | 78 | 0.14 |
1 Number of individuals as of 2016 SPA designation; 2 Number of individuals, updated 2016.
Published species demographic data were also used, including BTO BirdFacts and numerous peer-reviewed publications. Data sources are listed as footnotes to Table 1. Mortality was apportioned to each population according to the NatureScot spreadsheet; either to Caithness and Sutherland Peatlands SPA and NHZ 5 jointly, or to NHZ 5 alone, if out with the SPA. Recent data have been obtained for Golden Eagle, and Hen Harrier, from local recorders, including the Highland Raptor Study group coordinators. This variation in population estimates allowed us to run several scenarios; in the main results section we have presented the results from models using SPA starting population numbers, and the corresponding mortality value. Appendix I contains models run using differing starting population numbers and mortality estimates, according to the variations described here.
Sensitivity analyses
For many of the species covered in this report there are insufficient demographic or population data. As a result, we have used data from external sources found in the literature, where necessary. We selected data hierarchically: where possible we selected regional level studies (i.e., those which covered the Highlands area of Scotland, or specifically Caithness and Sutherland) but where this was not available, we used a national level study and following that an international study. For example, data on productivity of Red-Throated Divers were not available within Scotland, but there were some detailed studies conducted in Scandinavia, which we used as surrogates for Scottish Red-Throated Divers, even though there is often strong geographical variation in these rates subject to habitat type and predation levels (Eberl and Picman 1993; Hemmingsson and Eriksson 2002). This represents a source of uncertainty and potential error (Cook and Robinson 2016), particularly where there are less data available.
Because of this uncertainty, we conducted a series of sensitivity analyses, whereby we modelled a change in one of the parameters of the model (e.g., productivity or survival) and observed the resulting change in the outputs (i.e., the population size or growth rate). These analyses allow us to understand the relative importance of the different elements of the model. In their testing of PVA metrics on seabird data, Cook and Robinson (2016) found counterfactual outputs (CPS, CPGR) to be relatively insensitive to parameter error, but that most sensitivity was encountered within the adult survival parameter when considering long-lived species. For this analysis, and following Cook and Robinson (2016), we varied adult survival, juvenile survival and adult productivity from 75% - 105% of the baseline values in 5% increments, over 30 years, to observe the effects on population size and growth rate. For Hen Harrier we also varied juvenile productivity by the same magnitude. We then quantified the sensitivity of each parameter by comparing the percentage change in each counterfactual with every 5% change in the designated parameter.
Mapping
Due to a lack of data on abundance, distribution, and demographic rates, it was not possible to undertake PVA in relation to displacement effects for the species of concern. Consequently, a decision was made to map available data in relation to 500 and 1000 metre buffers around wind turbines to determine overlap, and therefore potential disturbance and displacement. The density of birds per 1km2 was calculated to identify ‘hotspot’ areas. We mapped operational wind turbines, as well as those under construction, and in planning across the proposed World Heritage Site area. A wind turbine buffer of 500 metres was applied for Golden Plover, Dunlin and Greenshank (Pearce-Higgins et al. 2008; Sansom et al. 2016) and a 1000 metre wind turbine buffer was applied for Golden Eagle during the breeding season (Fielding et al. 2021Fielding et al. 2021).
We overlaid the buffers across a map of the proposed World Heritage Site boundary, in addition to sightings data obtained from the RSPB and NBN, for Golden Eagle, Greenshank, Dunlin and Golden Plover. We also integrated the most recent Landcover data (Marston et al. 2022) to quantify habitat types within the 500 and 1000m wind turbine buffers, which should help to identify important areas for all species and therefore indicate likelihood of displacement (Pearce-Higgins et al. 2008; Sansom et al. 2016; Fielding et al. 2022).
Data
Species records for Golden Eagle, Golden Plover, Greenshank, Dunlin between 2010 and 2023 were obtained from two sources; the RSPB data unit, and the National Biodiversity Network (NBN) gateway.
Data sourced from the RSPB data unit are a combination of different surveying categories including Roaming, Field Records, Breeding Bird Survey, Territory Mapping, and Annual Reserve Monitoring , collected by both volunteers and staff. These data therefore consist of records of individuals, pairs or territories, with the latter in some cases measured across a period of multiple months. This discrepancy among the scales of the different data types meant that not all records could be combined, and as a result we extracted only records of individuals and pairs, with a specific date and associated grid reference.
Data extracted from the NBN gateway represent a combination of submitted records from a variety of sources (see Appendix I), including the RSPB and the BTO. Where records did not have a specific date assigned, the data were not used. NBN data do not record numbers of individuals or pairs, only presence. Records of Golden Plover and Dunlin are not recorded at a scale smaller than 2km, and for Greenshank and Golden Eagle, only to 10km. Therefore, to combine the RSPB and NBN gateway data to look at overall density across the proposed WHS, they have been merged – on the basis that one point represents one occurrence - and density estimated at a 2km (Golden Plover, Dunlin) or 10km (Golden Eagle and Greenshank) square scale.
Data on the density of the three breeding wading bird species considered here were available for some of the Sites of Special Scientific Interest (SSSI) present within the SPA and NHZ areas, estimated by Bellamy and Eaton (2010). Updated figures from the Site Condition Monitoring (SCM) in 2015, for the three wader species, were also obtained from NatureScot. The SCM data were not combined with the other data, rather they were used to demonstrate the spatial bias in the other datasets.
We have not included the EIA data for mapping. As part of the EIAs for wind farms, data on bird species presence, including flight lines and where possible, territory placement, are collected through vantage point surveys. However, not only are the raw data not available, the time over which the data are collected, and the exact methods vary between the different EIAs. Furthermore, there is often no geographical information associated with the sightings (i.e., a grid reference) that would allow the EIA data to be integrated with the other datasets used here.
Results
Population modelling
Collision Risk – Caithness and Sutherland Peatlands SPA population
Impacts of collision risk were modelled cumulatively, from all operational, under construction, and in planning wind farms in the study area, on both population size and population growth rate (Table 3). Impacted population sizes and growth rates as a result of the collision risk were compared to an unimpacted population where the impact of windfarms did not exist, producing a ratio, or counterfactual, of population size (CPS) and population growth rate (CPGR) between the two populations. Additional predicted population size values (as opposed to the counterfactuals) are available in Table 9, Appendix IV. We ran a series of scenarios, to represent the different population levels (for either the Caithness and Sutherland Peatlands SPA or the NHZ 5 area, the latter), and the different threat levels associated with these populations. As well as population estimates associated with the protected area designations, for Hen Harrier and Golden Eagle only we ran several variations according to locally reported, more up-to-date information. Where the NS cumulative impact spreadsheet has been updated during the course of this work (most recent version of the spreadsheet April 2023, previous version April 2022), we have included both estimates (Tables 3 and 4, and Table 9, Appendix IV), but only for Golden Eagle and Hen Harrier; the two Diver species either had no, or very slight (<0.01% change) in the cumulative mortality impact on either the SPA or NHZ5 population.
Of the four species for which we modelled cumulative collision impact, Golden Eagle and Hen Harrier were most significantly impacted. SPA populations of these species are designated as 10 individuals (Golden Eagle) and 26 individuals (Hen Harrier) and have recently had their cumulative collision mortality estimates updated; both SPA populations are now estimated to experience a decreased cumulative mortality impact, from 3.5% to 3.26% for Golden Eagle, and from 4.5% to 3.84% for Hen Harrier. These decreases are due to a significantly reduced estimated Golden Eagle collision rate for Garvary wind farm, as well as the refusal and thus removal of Hen Harrier collision figures for both Drumhollistan and Bad Fearn wind farms. Using the reduced, updated figures, after 30 years, the population growth rate (PGR) of the Golden Eagle population has declined from 0.975 to 0.973, resulting in a ratio (CPGR) of 0.996. The impacted population size is therefore estimated to be 88% of the unimpacted population over the same time frame.
For Hen Harrier the impacts are larger; although only a slightly increased % impact compared to Golden Eagle (3.84% compared to 3.26%), after 30 years the population growth rate has declined from 1.11 to 0.94. As a result, the size of the impacted SPA population is just 44% of the unimpacted population. Information from local Highland Raptor Study Group recorders suggests that SPA populations of both Golden Eagle and Hen Harrier are both higher than the SPA citations purport. Despite using increased population estimates (and thus a reduced % population mortality; Table 3) for both species, our models demonstrate that declines are still evident. After 30 years, the population growth rate of an increased population of Hen Harrier (40 individuals; cumulative mortality now 2%, rather than 3.84%), has still decreased from 1.12 to 0.953 giving a ratio of 0.986 for CPGR and 0.66 for CPS.
Red- and Black-Throated Diver populations in the SPA receive much lower cumulative impacts from collision (Table 3). Red-Throated Diver maintains a PGR of just over 1, even after 30 years of cumulative wind farm impacts (1.06 for both impacted and unimpacted populations) giving a CPGR of 0.999, indicating a stable population. Black-Throated Diver PGR decreases from 0.89 to 0.85 over the 30-year time frame, resulting in a ratio of 0.999 as well, and a population size ratio of 0.973.
Impacts of collision on productivity, through a reduction of breeding individuals and failure of nests, were modelled for just Hen Harrier. This assumes that if a parent bird is killed, the nest will fail, particularly when female Hen Harriers are dedicated to incubating and the male to bringing the female food (Redpath et al. 2002). This impact may be larger where the male is polygynous, because multiple nests may fail as a result of the male’s death. Impacts on productivity were lower than those on survival, even though the percentage impact was larger on productivity (7.6% as opposed to 4.5% on survival; Table 4). Yet the magnitude of the impacts on productivity with regard to the population size are still notable; the decrease of 7.6% in productivity (here we have equated this with removing one breeding male from the population as a result of collision), lead to the impacted population being just 65% of the unimpacted population after 30 years (Table 4, Figure 4) and a decline in PGR from 1.06 to 0.97 (giving a CPGR of 0.984).
| Species | Population Size (individuals) / mortality % | CPS (10 yrs) | CPS (20 yrs) | CPS (30 yrs) | CPGR (10 yrs) | CPGR (20 yrs) | CPGR (30yrs) | Mean growth rate (impacted/unimpacted) | Mean growth rate in 30 yrs |
|---|---|---|---|---|---|---|---|---|---|
| Golden Eagle | 10 / 3.5% | 0.958 | 0.914 | 0.871 | 0.995 | 0.995 | 0.995 | 0.975/ 0.98 | 0.972/ 0.977 |
| Golden Eagle Updated April 2023 | 10 / 3.26% | 0.961 | 0.919 | 0.88 | 0.996 | 0.996 | 0.996 | 0.975/ 0.98 | 0.973/0.977 |
| Golden Eagle (14 individuals in C&S SPA) | 14/3% | 0.964 | 0.926 | 0.889 | 0.996 | 0.996 | 0.996 | 0.979/ 0.984 | 0.973/0.977 |
| Hen Harrier | 26 / 4.5% | 0.748 | 0.531 | 0.376 | 0.967 | 0.967 | 0.966 | 1.1 / 1.12 | 0.936 / 0.968 |
| Hen Harrier Updated April 2023 | 26 / 3.84% | 0.785 | 0.59 | 0.443 | 0.974 | 0.972 | 0.972 | 1.11 / 1.13 | 0.941 / 0.968 |
| Hen Harrier (40 individuals C&S SPA) | 40/ 2% | 0.883 | 0.762 | 0.656 | 0.986 | 0.986 | 0.986 | 1.12/ 1.11 | 0.953 / 0.967 |
| Red-throated Diver | 92 / 0.05% | 0.999 | 0.998 | 0.996 | 0.999 | 0.999 | 0.999 | 1.05/ 1.05 | 1.06/ 1.06 |
| Black-throated Diver* | 40 / 0.26% | 0.9916 | 0.982 | 0.973 | 0.999 | 0.999 | 0.999 | 0.89 / 0.89 | 0.854 / 0.855 |
Productivity impacts (based on number of polygynous males) | CPS (10 yrs) | CPS (20 yrs)
| CPS (30 yrs) | CPGR(10yrs) | CPGR (20 yrs) | CPGR(30yrs) | Mean population growth rate – impacted/ unimpacted (now) | Mean population growth rate – impacted/ unimpacted (30 yrs) |
|---|---|---|---|---|---|---|---|---|
7.6% (1 male) | 0.853 | 0.732 | 0.63 | 0.982 | 0.984 | 0.984 | 1.06 / 1.1 | 0.97 / 0.98 |
15% (2 males) | 0.760 | 0.585 | 0.451 | 0.971 | 0.972 | 0.973 | 1.06 / 1.13 | 0.94 / 0.97 |
Population variation – NHZ 5 and pers comm estimates.
As would be expected, population estimates for the NHZ 5 area are higher than those for the SPA. With the update in April 2023 to the NS cumulative mortality spreadsheet, the estimated cumulative mortality for Golden Eagle in NHZ5 however, has increased from 3.86% (of a population of 18 individuals), to 7.49% (Table 5, Table 10 in Appendix IV for predicted population size estimates rather than counterfactuals). This large increase is primarily a result of the addition of the Chleansaid wind farm collision risk modelling, which applies to NHZ birds only, as well as Kintradwell wind farm figures now being included. Such a high cumulative mortality impact reduces the PGR over 30 years from 0.97 to 0.967, resulting in a ratio of PGR 0.99 and a ratio of population size of 0.748. Highland Raptor Study Group surveyors suggest that the Golden Eagle population in NHZ 5 could extend to 25 pairs; crudely using 50 individuals as a starting population, the high mortality impact becomes 1% and results in a reduction of PGR of 0.981 to 0.976 over the 30-year time frame (a CPGR of 0.999, and CPS of 0.961).
For Hen Harrier, the population is much larger (76 individuals, as opposed to just the 26 in the SPA), and there is less mortality directly apportioned to NHZ 5 birds (cumulative mortality removing 1.46% of the birds per year, using updated mortality estimates from 2023). This results in a reduction from 1.11 to 0.957 in the PGR (CPGR of 0.999 and CPS of 0.736; Table 5). Thus, although the % cumulative mortality is lower, the population impacts are still high, and the impacted population is just 74% of the unimpacted one after 30 years, suggesting that there is some interaction between the additional mortality and the demographic values in the Hen Harrier model.
| Species | Population size (individuals) / mortality % | CPS (10 yrs) | cps (20 yrs) | cps (30 yrs) | CPGR (10yrs) | CPGR (20 yrs) | CPGR (30yrs) | Mean growth rate (impacted/unimpacted) | Mean growth rate in 30 yrs |
|---|---|---|---|---|---|---|---|---|---|
| Golden Eagle (NHZ5 est.) | 18 / 3.86% | 0.954 | 0.905 | 0.859 | 0.995 | 0.995 | 0.995 | 0.976/0.982 | 0.972 / 0.978 |
| Golden Eagle (NHZ5 est.) Updated April 2023 | 18 / 7.49% | 0.913 | 0.826 | 0.748 | 0.99 | 0.99 | 0.99 | 0.97 / 0.981 | 0.967 / 0.977 |
| Golden Eagle (pers comm NHZ 5 est.) | 50/ 1% | 0.988 | 0.974 | 0.961 | 0.998 | 0.999 | 0.999 | 0.981 / 0.982 | 0.976 / 0.977 |
| Hen Harrier (NHZ 5 est.) | 76 / 1.4% | 0.917 | 0.826 | 0.745 | 0.99 | 0.99 | 0.99 | 1.11 /1.11 | 0.957 / 0.967 |
| Hen Harrier (NHZ5 est.) Updated April 2023 | 76 / 1.46% | 0.914 | 0.821 | 0.736 | 0.9995 | 0.9995 | 0.9995 | 1.12 / 1.13 | 0.958 / 0.968 |
| Red-throated Diver (NHZ5 est.) | 115 / 0.05% | 0.999 | 0.999 | 0.998 | 0.9999 | 0.9999 | 0.9999 | 1.05 / 1.05 | 1.06 / 1.06 |
| Black-throated Diver (NHZ5 est.) | 78 / 0.14% | 0.995 | 0.99 | 0.985 | 0.999 | 0.999 | 0.999 | 0.888/0.889 | 0.854 / 0.855 |
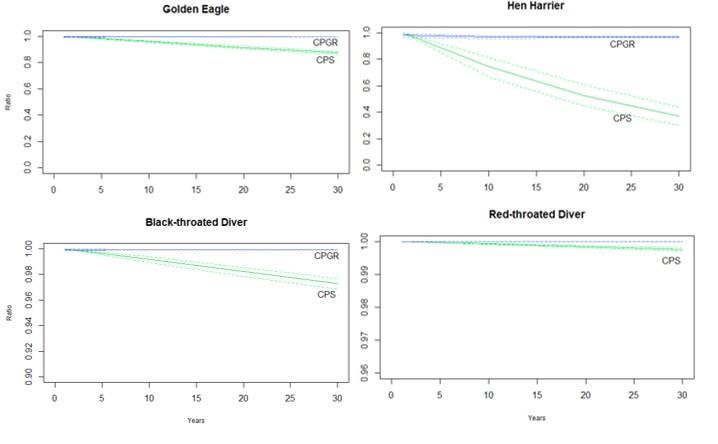
Figure 3: Change in the relationship between the impacted and unimpacted SPA populations of four species of bird species
Click for a full description
Change in the relationship between the impacted and unimpacted SPA populations of four species of bird: Golden Eagle, Hen Harrier, Red- and Black-Throated Diver, over 30 years (CPS – green; CPGR – blue; dashed lines represent 95% confidence interval), resulting from the addition of a direct impact on survival (i.e., collision-induced mortality). The exact % of mortality is dependent on the species and is detailed in the text. Note differing y scales according to the magnitude of the counterfactual, meaning the effect is less for the diver species.
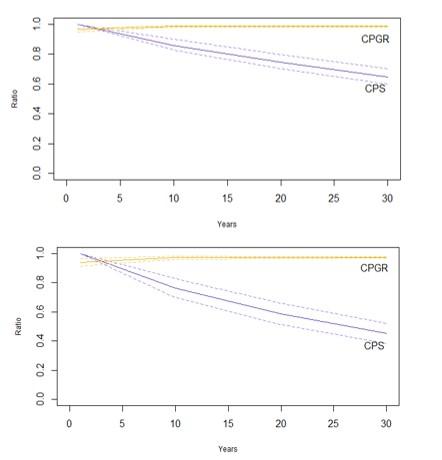
Figure 4: Counterfactuals of population size (CPS) and population growth rate (CPGR) when a reduction in Hen Harrier productivity is modelled
Click for a full description
Counterfactuals of population size (CPS) and population growth rate (CPGR) when a reduction in Hen Harrier productivity is modelled (i.e., a knock-on effect of collision mortality resulting in the failure of a nest) over 30 years. Top panel: results from a 7.6% reduction (equivalent to the loss of one nest/pair); Bottom panel: a 15% reduction (equivalent to the loss of two nests/pairs because the male is polygynous). Dashed lines represent 95% confidence interval
Again, for Red- and Black-Throated Diver, the cumulative mortality is low in NHZ 5 (Table 5) and therefore the difference between the impacted and unimpacted populations is small. For Red-Throated Diver the ratio of PGR between the impacted and unimpacted populations after 30 years is 0.999; and of population size: 0.998). As with the SPA population it maintains a PGR of >1. For Black-Throated Diver a cumulative mortality of 0.14% also results in a minimal difference between impacted and unimpacted populations, leading to a ratio of PGR of 0.999 and of population size of 0.985.
Sensitivity analysis
The sensitivity analyses demonstrated that parameter uncertainty can vary in the degree to which it influences CPS, dependent on the parameter and species concerned. For example, 5% error in Golden Eagle adult survival; the estimate we have used is 0.9512, but the actual value is 0.9, or 1, then the counterfactual changes by nearly 8% when modelled at the current hypothesised level of impact, over 30 years (Table 6). 5% error in Hen Harrier adult survival (for example using an estimate of 0.744 or 0.826 instead of 0.78), changes the resulting counterfactual by over 10%, so could potentially have quite an inflated impact over the 30-year time frame of the models. However, for the same 5% error in adult survival for both diver species, CPS only changed 0.08% and 0.62% for Red-Throated and Black-Throated Diver respectively.
For Hen Harrier, there is also some indication that other parameters concerning juveniles might influence the counterfactuals. Juvenile survival is clearly more important for this species due to birds in their first year being able to reproduce. We also tested the influence of error in juvenile productivity of Hen Harriers, and a 5% change in this parameter induced a 2% change in the counterfactual.
| Species | Impact mortality as % of population | Population estimate SPA (individuals) | Parameter estimated | Parameter sensitivity (%) * |
|---|---|---|---|---|
| Golden Eagle | 3.50% | 10 | Adult survival | 7.87 |
| Golden Eagle | 3.50% | 10 | Juvenile survival | 0.05 |
| Golden Eagle | 3.50% | 10 | Productivity | 0.34 |
| Red-throated diver | 0.06% | 92 | Adult survival | 0.08 |
| Red-throated diver | 0.06% | 92 | Juvenile survival | 0.02 |
| Red-throated diver | 0.06% | 92 | Productivity | 0 |
| Black-throated diver | 0.26% | 40 | Adult survival | 0.62 |
| Black-throated diver | 0.26% | 40 | Juvenile survival | 0.02 |
| Black-throated diver | 0.26% | 40 | Productivity | 0.03 |
| Hen harrier | 4.50% | 26 | Adult survival | 10.86 |
| Hen harrier | 4.50% | 26 | Juvenile survival | 2.59 |
| Hen harrier | 4.50% | 26 | Productivity | 1.09 |
| Hen harrier | 4.50% | 26 | Juvenile productivity | 1.98 |
When assessing the sensitivity of productivity counterfactuals to Hen Harrier demographic parameter error (Table 7), this pattern is still the same, yet markedly less severe. Here, 5% error in adult survival results in only a 3.6% change in the counterfactual. Interestingly, misspecification of juvenile productivity causes a larger change in the counterfactual output than misspecification of adult productivity, which requires further exploration of both the structure of the model and the estimates (including the associated error) being used within them.
Impact - reduction of productivity (%) | Parameter estimated | Parameter sensitivity |
|---|---|---|
7.6% | Adult survival | 3.58 |
| - | Juvenile survival | 1.85 |
| - | Productivity | 0.9 |
| - | Juvenile productivity | 1.98 |
Mapping
The amount of land contained within all operational, under construction and in-planning wind farms that also overlaps with the proposed World Heritage Site boundary totals 29km2, which in terms of direct habitat loss as a result of the wind farms appears to be quite small (Figure 5). Of the 29km2, 10.2km2 is heather grassland, 14.6km2 is bog habitat and 2.4km2 is coniferous woodland.
We did not include raw wind farm EIA data, and therefore, compared to the wider area there are very few species records that overlap with the wind farm 500m buffers, for any of the three wader species (Golden Plover, Dunlin, Greenshank) or Golden Eagle. The distribution of records across the proposed WHS area is biased towards particular areas, for example Forsinard Flows RSPB reserve and Gordonbush Wind Farm (Figure 5). Because of this bias, which is likely due to variation in survey effort, it is difficult to understand how many pairs of any species might be displaced and thus how much productivity might decline by, because we cannot accurately estimate their density across the whole area.
At such a large scale, mapping the density of a species is perhaps more useful than points, particularly where habitat variation also only occurs at a wide scale. Figures 7 – 10 show the density of Golden Eagle, Golden Plover, Dunlin, and Greenshank using RSPB-held and NBN records, mapped at a 2km, or 10km scale.
All wader species have a relatively similar distribution and higher density to the southwest of Loch Shurrery and Causeymire wind farm, as well as across to Forsinard RSPB reserve. The highest densities fall across the SSSIs of Loch Calium Flows, Strathmore Peatlands, East and West Halladale, Forsinard Bogs, and Sletill Peatlands. There is also a clear cluster within and around Gordonbush wind farm, which is also directly adjacent to the Coir’ an Eoin SSSI.
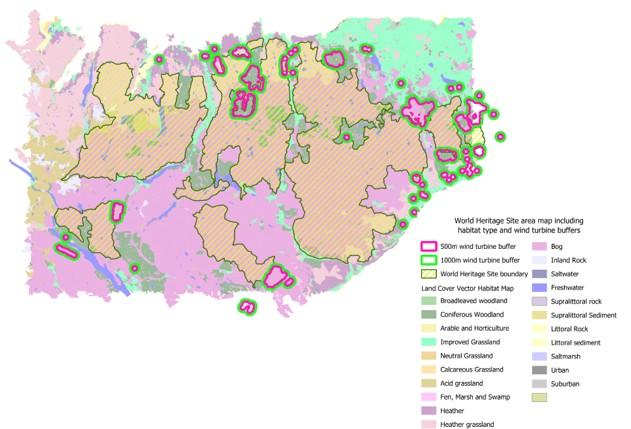
Figure 5: Map of wind turbine buffers in relation to proposed World Heritage Site boundary
Click for a full description
500m (pink outlines) and 1000m (green outlines) wind turbine buffers within 5km in relation to the proposed World Heritage Site boundary and in relation to mapped habitat types. Data on wind farms from the Highland Council Planning map and updated as of April 2023.
Work by Bellamy and Eaton (2010) estimated density of the same three species across SSSIs in the Flow Country, however the information is at a different spatial and temporal scale to that of the RSPB-held records. The authors estimate bird density per km squared across each of the SSSI sites, but as some of these sites are so large, the finer-scale variation in density is lost (Figure 11). Despite this, it is possible to see that high combined Dunlin, Golden Plover and Greenshank densities are present on some of the SSSI sites that correspond to high numbers of individual records (Figures 8-10) for example Sletill Peatlands, East Halladale and Strathmore Peatlands. There are also several SSSIs where the authors recorded high densities that are not represented in the RSPB-held data but are within the proposed World Heritage Site boundary, such as A’Mhoine, Cnoc an Alaskie, Strath Duchally, Syre Peatlands, Skinsdale and Badanloch Bogs.
This discrepancy suggests that survey effort bias caused variation in bird abundance and density across the Flow Country and highlights the need to improve survey coverage and consistency across this wide area.
Discussion
Implications of population modelling
This study has used best available demographic information from a number of sources, to parameterise a Leslie Matrix Model and produce counterfactual outputs. The structure of this model allowed age to be incorporated i.e., to model different juvenile and adult survival levels, and it allowed us to specify stochasticity, taking into account natural variation among years that might relate to weather conditions and food supply, which might disrupt productivity. For some of the species considered, there was adequate, relatively robust demographic information, though it should be noted that metrics such as adult survival and productivity can vary spatially and temporally; therefore, where we have used demographic information from a different area or country, we acknowledge that these may not be entirely representative of our study populations.
The implications of the population modelling on required demographic information are varied. The sensitivity analyses showed that for some species it is more important to have an accurate adult survival value, (e.g., Golden Eagle and Hen Harrier), whose counterfactual outputs vary 5 to 10% when the adult survival rate changes by 5% (see Results section on Sensitivity Analyses). Therefore, it is important to use an adult survival value that adequately reflects the birds in the study area. For Hen Harrier, there is also the additional consideration of requiring a juvenile productivity value, which is less studied and therefore less reliable than that of an adult productivity value (which is seemingly less influential on the counterfactual outputs as well). These potential inconsistencies mean that results for some of these species need to be interpreted with caution. It should also be noted that in many cases, we do not know exactly how many birds of each species are present and breeding in the proposed World Heritage Site area; we have used both the SPA and NHZ 5 population estimates for all species to incorporate this variation in the counterfactual outputs.
One limitation of the model is that it does not include immigration and/or emigration, which could be important for Golden Eagle and Hen harrier. Particularly in the case of Hen Harrier, population dynamics are less reliant on natal fidelity and more reliant on immigration and emigration (Picozzi 1984; Whitfield and Fielding 2009). Ideally, more data would be acquired on the Hen Harriers breeding in the Flow Country, even though this would require intensive survey effort. More data, of higher accuracy, on numbers of breeding birds, their locations, their relationships (polygynous or not), along with their ages, nest outcomes, and consequent movements (trying to understand dispersal/emigration etc.), would allow the creation of an individual-based model, better able to predict population outcomes over a designated time period, as Heinonen et al. (2014) did, and as has also been used for a number of seabird species.
At the current time, with population and demographic information as it is, it is very difficult to state what the population impact would be of additional mortality as a result of collision with turbines. Therefore, the results must be interpreted with caution here; however, it does at least demonstrate the larger threat of collision risk mortality to populations of both raptor species considered here – compared to the diver species - which should dictate where survey and monitoring efforts are directed, including during EIAs for future wind farm planning. Particularly for Hen Harrier, where the removal of one breeding adult per annum from the population as a result of collision could cause not only directly mortality but also a drop in productivity, both of which lead to a severe drop in population size (~ 50-65%) over the course of the 30-year lifespan of a wind farm.
This therefore dictates that Hen Harrier are prioritised during both pre- and post- consent monitoring. Collision risk modelling of Hen Harrier as part of the EIA remains vital and should automatically be assessed in the context of the cumulative collision risk impacts, at the time when the wind farm is acquiring consent to construct.
Implications of displacement mapping
Our mapping exercise in this study has highlighted the need for more comprehensive, standardised data collection on breeding species within the whole Flow Country World Heritage Site area, to begin to assess population level impacts of displacement. Although there are sporadic, opportunistic species records, along with annual RSPB breeding bird surveys, these are clearly limited mostly to Forsinard Flows RSPB reserve, and the more accessible SSSI and SPA areas, such as the area to the south of Loch More. The proposed World Heritage Site extends all the way west to between the Kyle of Tongue and Loch Eriboll, which means there are hundreds of square kilometres that have no regular or even opportunistic data collection. Some of these areas cover key SSSI sites for breeding waders, as highlighted by the last-published common standards monitoring survey, undertaken by Bellamy and Eaton in 2009. Although robust, this work is now over 14 years old, so using the values from these surveys in a Leslie Matrix Model for example, may introduce uncertainty. Likewise, the survey did not assess productivity, so whilst there may be a reasonable estimate of number of adult birds or pairs, there is no indication of how successful these birds are. For the wading bird species considered in this study, particularly Greenshank, the lack of demographic information such as productivity, adult and juvenile survival, prohibited the use of an LMM, to model population trends.
Information on the population-level impacts of displacement is also lacking, partly because empirical data on bird responses to wind farms in the short and long term are not available (Searle et al., 2018). Significant avoidance of turbines, often up to a distance of 500 metres from the turbines themselves, has been found in a number of studies including Pearce-Higgins et al. (2008) and Fielding et al. (2022). However, these studies do not extend to an assessment of population consequences. One high-profile study on White-tailed eagles (Haliaeetus albicilla) in Norway by Dahl et al. (2012) found decreased breeding success within a windfarm area because multiple pairs deserted their nest sites, either because of mortality of one partner, or because of disturbance from operation. This suggests windfarm construction could either temporarily or permanently reduce breeding success in an area, which points again to the need for more frequent, standardised monitoring (Fox et al., 2006).
Findings by Fielding et al. (2021) demonstrated that habitat influenced avoidance and displacement of Golden Eagles in Scotland. This ‘functional habitat loss’ may dissuade eagles from nesting and foraging in preferred areas, leading to birds establishing territories in lower quality areas and having a knock-on effect on productivity or fledgling quality. Therefore, further work during the scoping and screening phases of EIAs, taking into account the specific habitat available within a 1000m buffer of a wind farm will help to better estimate the number of birds affected. The interaction between wind farm placement and habitat management on Golden Eagle behaviour and subsequent population impact, as well as sporting management that is also difficult to quantify, should be studied carefully, to ensure cumulative impacts of these combined activities are avoided, or at least minimised.
Recommendations
Data gathering
As a result of the lack of data, particularly surrounding displacement of birds due to habitat loss or disturbance by the turbines, we have made a number of recommendations to fill the knowledge gaps we have identified. Most importantly, a comprehensive data gathering exercise needs to occur across the whole of the Flow Country, including but not exclusively, the proposed World Heritage Site area. The key steps regarding data gathering may be as follows:
- For both collision risk and displacement: A desk-based exercise to establish what information has been gathered by Environmental Impact Assessments (EIAs), and use this to identify, and prioritise, gaps from wind farm sites across the NHZ 5 area. This should be done for all stages of wind farm development (i.e., operational, under construction, in planning).
- For both collision risk and displacement: Identify gaps in the Site Condition Monitoring data available and planned, prioritise key survey areas across the SSSIs and SPA.
- For displacement: a detailed in person data gathering on and around wind farms themselves should concentrate on areas within a 500m buffer of the proposed, under construction and constructed wind farms for wading birds, and within 1000m for Golden Eagle. As these are estimated displacement distances, establishing the distribution and density of birds within these thresholds at operational wind farms can aid the estimation of how many birds may be displaced at sites where wind farms are under construction or at the planning stage.
- For collision risk: post-construction surveys for Hen Harriers flying and foraging near to wind turbines would substantially add to our knowledge of the risk of turbines to this species. Whilst these should occur during all seasons, the early breeding period when male Hen Harriers are displaying holds the highest importance, given the potential impacts of collision on both survival of adult birds and the subsequent survival of their offspring. Understanding space use of Hen Harriers more generally around the proposed World Heritage Site, as well as more widely across NHZ 5, is important in order to be able to apportion population impacts better.
This level of data collection is not a small undertaking and will require a dedicated team of observers over a large part of the breeding season; the work by Bellamy and Eaton (2009) covered a kilometre square in an average of 90 to 100 minutes. Some of the least surveyed SSSIs such as A’Mhoine, which is designated specifically for all of the wader species considered here, are >50km2, thus requiring several days of survey work alone. The freely available Landcover Map (Marston et al. 2022; see Figure 5) should be used to identify particularly suitable areas for all species, to not only direct survey and monitoring efforts but to better inform wind farm developments in the first place. For widely roaming birds especially, such as Golden Eagle and the most vulnerable species in this study, the Hen Harrier, it is difficult to ascertain exactly which areas they might use. Bright et al. (2008) identified Hen Harrier as a high sensitivity species across Caithness and Sutherland, because of the number of breeding sites with a wind farm within 2km. Only better understanding of their distribution and movements can facilitate better assessment of the likelihood that Hen Harriers will be impacted by the cumulative impact of the wind farms across the proposed World Heritage Site.
In terms of surveying remote areas such as the proposed Flow Country World Heritage Site that has a substantial portion of inaccessible terrain, it may be possible to use automated surveying devices, particularly acoustic recording units, or perhaps to consider surveying wading birds with Unmanned Aerial Vehicles (UAVs), possibly with the addition of Infrared cameras. Acoustic recorders are now widely used in the field of avian ecological research (Roark and Gaul 2021) and can be comparable to human observers in terms of number of species detected (Shonfield and Bayne 2017). Their low power usage and ability to record using an in-built, pre-set schedule allows them to autonomously monitor remote areas where there is a vocalising bird assemblage of interest, and where deploying numerous fieldworkers would be both time consuming and costly. Details of potential surveying protocols can be found in the literature, including consideration of the environmental factors that need to be accounted for when monitoring avian sound in a remote, windswept landscape such as the Flow Country (Priyadarshani et al. 2018).
UAVs have been used to identify certain colonial breeding species of larger body size (e.g., Sardà-Palomera et al. 2012), as well as smaller, more cryptic species, although these are often only identifiable using thermal imaging, rather than RGB (e.g., Lee et al. 2019). Thermal camera attachment to the UAV can allow detection of duck broods in dense inaccessible vegetation (Bushaw et al. 2021), but it would be pertinent to test the efficacy of this method in an area of known breeding density such as Forsinard Flows RSPB reserve, before trying to use it across the wider proposed World Heritage Site.
Demographic requirements
As well as population numbers, another limitation when conducting population viability analyses is the lack of demographic information for almost all of the species considered here. The key pieces of demographic information required are:
- Region-specific adult survival rates (collision risk - all species): Adult survival, particularly for long lived species, caused most change in the counterfactual output out of all the demographic parameters. Therefore, to ensure outputs are as accurate as possible, these should be calculated for the region (i.e., Caithness and Sutherland SPA/NHZ5) and ideally over a few years, to ensure we capture annual weather- or food-supply related variation. Although needed for all species, adult survival rates for Hen Harrier and Golden Eagle are the priority due to the magnitude of the change in output. Significant population change over 10 years is shown from our modelling for both species, so data collection across a period of minimum 5 years would be beneficial.
- Region-specific fecundity (collision risk - Hen Harrier, Golden Eagle): Studies based across the Caithness and Sutherland Peatlands SPA on breeding Diver species, along with more comprehensive population monitoring because of the provision of nesting rafts, give us more certainty in terms of fecundity for these species. However, for Hen Harrier, and to a lesser extent Golden Eagle, we need to understand more about fecundity, and the extent of polygyny across the proposed World Heritage Site area. Variation among polygynous and monogamous nests, as well as between adult and juvenile breeders could be important for producing a stochastic population model for a species with complex demographics such as the Hen Harrier. Again, estimating these parameters across a period of 5 years would be useful.
- Region-specific fecundity (displacement - Golden Plover, Dunlin, Greenshank): Demographic data for breeding wader species in Scotland is sparse, which means we require many data gaps to be filled. Key to the understanding of the impact of displacement is more certainty in the productivity/fecundity parameter – when disturbance or habitat loss displaces species from an area, it is possible that the displaced individuals will not breed, and that a reduction in overall productivity will occur, impacting population size and growth rate in the future. This may vary spatially across a large area such as the proposed WHS, because of habitat, topography, disturbance, and predation. As the impacts of displacement are little understood, it is vital that data are collected on productivity of breeding waders, prioritising Golden Plover and Greenshank – the latter of which also has only sparse distributional data across the proposed WHS area.
Additionally, as described in the methods section, we ran density independent PVA, as opposed to including a measure of density-dependent regulation. This is largely due to having no evidence of this process as occurring in the C&SP SPA, as well as it being rarely reported in the species we are considering. Research has identified an influence of density dependent regulation of the number of nesting pairs of Golden Eagles in Spain and Italy (Carrete et al. 2006, Fasce et al. 2011); further they identified a strong habitat configuration and heterogeneity aspect to this density dependence, whereby site-specificity in density dependence becomes important. Therefore, this is not entirely transferable to the C&SP SPA or NHZ 5 populations of Golden Eagle. It could be the case in this area of northern Scotland that an increase in numbers of Golden Eagles could lead to pairs occupying lower quality habitat and then experiencing a reduction in productivity, however it is not clear where this threshold may lie, because of a lack of data on number of pairs, territory size and productivity values. These issues extend to all species potentially, although the published literature presents no evidence of density dependence regulating Hen Harrier, Red- or Black-Throated diver populations (Nummi et al. 2013, Horswill and Robinson 2015). An attempt to understand how numbers, territory locations, productivity and then nearest neighbour distances vary across the study area and over time, should be undertaken in order to assess whether density dependence may be impacting the populations in the potential WHS.
Lastly, in this report we have not addressed barrier effects, due again to lack of data. However, this is a priority for future research in the proposed WHS area. Wind farms may cause migrating and commuting birds to divert their course, potentially increasing the amount of energy they are expending (Drewitt and Langston 2006). These are most relevant for Red- and Black-Throated Divers, as well as Common Scoter (Melanitta nigra), which are seen to avoid wind farm areas (sometimes up to several kilometres away - Kahlert et al. 2004), but also have regular commuting routes from nesting to foraging sites (Christensen et al. 2003). Ideally to answer these questions, visual, audio, as well as bird-borne tracking device studies (demonstrated to be useful to answer this question by Kikuchi et al. 2019) would take place, to gather movement data of both Divers and Scoters through wind farms of concern in the area. Two to three years of tracking data from known individuals from important breeding locations would provide vital, novel data investigating the impacts of wind farms as barriers for these species.
Our recommendations ultimately aim to highlight the lack of information available, both demographic and distributional, for all of the species covered in the report. This paucity of information means that we recommend and indeed encourage wind farm developers, as well as statutory bodies, to increase the amount of pre- and post-construction data collection for species at risk of collision and displacement.
Conclusions
We aimed to estimate precautionary cumulative collision risk and displacement impacts of current, future and potential windfarms across the potential WHS, to SPA feature species. Using PVA in the form of counterfactual estimation, we have identified strong but uncertain impacts of collision risk to Hen Harriers, and to a lesser extent Golden Eagle. The impacts on this species are greater due to their early breeding age, polygyny and associated productivity effects, and if realised could serve to reduce the population of hen harrier in the region by nearly 40%. Impacts to Red- and Black-Throated Divers are less severe, and both species have stable breeding rates on top of a low likelihood of collision.
Displacement mapping identified low overlap of windfarm buffer zones, where we would expect more severe disturbance impacts on birds. However, in the case of both the displacement mapping and PVA, a lack of and a strong bias in the data available to estimate disturbance and collision risk impacts meant that there is much uncertainty attached to these outputs.
As a result, we recommend a widespread data gathering exercise across the whole area included in the potential World Heritage Site. This includes both presence/absence and demographic data, to parameterise future models and provide a more coherent understanding of the impacts of wind turbines around the proposed WHS.
References
Bellamy PE, Eaton MA (2010) 2009 CSM bird monitoring of Caithness and Sutherland Peatlands SPA. Sandy, Bedfordshire
Bright J, Langston R, Bullman R, et al (2008) Map of bird sensitivities to wind farms in Scotland: A tool to aid planning and conservation. Biol Conserv 141:2342–2356.
Bushaw JD, Terry C V., Ringelman KM, et al (2021) Application of Unmanned Aerial Vehicles .and Thermal Imaging Cameras to Conduct Duck Brood Surveys. Wildl Soc Bull 45:274–281.
Carrete, M., A. Sánchez‐Zapata, J., L. Tella, J., M. Gil‐Sánchez, J. and Moleón, M., 2006. Components of breeding performance in two competing species: habitat heterogeneity, individual quality and density‐dependence. Oikos, 112(3), pp.680-690.
Chaudhary V, Oli MK (2020) A critical appraisal of population viability analysis. Conserv Biol 34:26–40.
Christensen TK, Hounisen JP, Clausager I, Petersen IK (2003) Visual and radar observations of birds in relation to collision risk at the Horns Rev offshore wind farm. Engineering 53
Cook ASCP, Robinson RA (2016) Testing sensitivity of metrics of seabird population response to offshore wind farm effects. JNCC Report No. 553, JNCC, Peterborough.
Dahl EL, Bevanger K, Nygård T, et al (2012) Reduced breeding success in white-tailed eagles at Smøla windfarm, western Norway, is caused by mortality and displacement. Biol Conserv 145:79–85. https://doi.org/10.1016/j.biocon.2011.10.012
Dohm R, Jennelle CS, Garvin JC, Drake D (2019) A long-term assessment of raptor displacement at a wind farm. Front Ecol Environ 17:433–438.
Drewitt AL, Langston RHW (2006) Assessing the impacts of wind farms on birds. Ibis (Lond 1859) 148:29–42.
Eberl C, Picman J (1993) Effect of nest-site location on reproductive success of red-throated loons (Gavia stellata). Auk 110:436–444.
Fasce, P., Fasce, L., Villers, A., Bergese, F. and Bretagnolle, V., 2011. Long‐term breeding demography and density dependence in an increasing population of Golden Eagles Aquila chrysaetos. Ibis, 153(3), pp.581-591.
Fielding AH, Anderson D, Benn S, et al (2022) Responses of dispersing GPS-tagged Golden Eagles (Aquila chrysaetos) to multiple wind farms across Scotland. Ibis (Lond 1859) 164:102–117.
Fielding AH, Anderson D, Benn S, et al (2021) Non-territorial GPS-tagged golden eagles Aquila chrysaetos at two Scottish wind farms: Avoidance influenced by preferred habitat distribution, wind speed and blade motion status. PLoS One 16:1–26.
Grear, J.S., Meyer, M.W., Cooley Jr, J.H., Kuhn, A., Piper, W.H., Mitro, M.G., Vogel, H.S., Taylor, K.M., Kenow, K.P., Craig, S.M. and Nacci, D.E., 2009. Population growth and demography of common loons in the northern United States. The Journal of Wildlife Management, 73(7), pp.1108-1115.
Green, R.E., Langston, R.H.W., McCluskie, A., Sutherland, R., Wilson, J.D., 2016. Lack of sound science in assessing wind farm impacts on seabirds. Journal of Applied Ecology 53, 1635–1641.
Heinonen JPM, Palmer SCF, Redpath SM, Travis JMJ (2014) Modelling hen harrier dynamics to inform human-wildlife conflict resolution: A spatially-realistic, individual-based approach. PLoS One 9
Hemmingsson E, Eriksson MOG (2002) Ringing of red-throated diver Gavia stellata and black-throated diver Gavia arctica in Sweden. Newsl Diver/Loon Spec Group, Wetl Int 4:8–13
Horswill C, Robinson RA (2015) JNCC Report No : 552 Review of Seabird Demographic Rates and Density Dependence February 2015 © JNCC , Peterborough 2015 British Trust for Ornithology ISSN 0963 8901
Jitlal M, Burthe S, Freeman S, Daunt F (2017) Testing and Validating Metrics of Change Produced by Population Viability Analysis (PVA). Scottish Mar Freshw Sci 8.
Kahlert J, Peterson IK, Fox AD, et al (2004) Investigations of birds during construction and operation of Nysted offshore wind farm at Rødsand. 1–80.
Katzenberger, J., Gottschalk, E., Balkenhol, N. and Waltert, M., 2021. Density‐dependent age of first reproduction as a key factor for population dynamics: stable breeding populations mask strong floater declines in a long‐lived raptor. Animal Conservation, 24(5), 862-875.
Kikuchi DM, Nakahara T, Kitamura W, Yamaguchi NM (2019) Estimating Potential Costs of Cumulative Barrier Effects on Migrating Raptors: A Case Study Using Global Positioning System Tracking in Japan. In: Bispo R, Bernardino J, Coelho H, Costa JL (eds) Wind Energy and Wildlife Impacts. Springer Nature Switzerland, pp 51–65
Lee WY, Park M, Hyun CU (2019) Detection of two Arctic birds in Greenland and an endangered bird in Korea using RGB and thermal cameras with an unmanned aerial vehicle (UAV). PLoS One 14:1–16
Madders M, Whitfield DP (2006) Upland raptors and the assessment of wind farm impacts. Ibis (Lond 1859) 148:43–56.
Newman KB, Buckland ST, Morgan BJT, et al (2014) Modelling Population Dynamics: Model Formulation, Fitting and Assessment using State-Space Methods.
Nummi, P., Väänänen, V.M., Pakarinen, R. and Pienmunne, E., 2013. The Red-throated Diver (Gavia stellata) in human-disturbed habitats-building up a local population with the aid of artificial rafts. Ornis Fennica, 90(1), p.16.
O’Brien SH, Cook ASCP, Robinson RA (2017) Implicit assumptions underlying simple harvest models of marine bird populations can mislead environmental management decisions. J Environ Manage 201:163–171.
Pearce-Higgins J, Stephen L, Langston RHW, Bright J (2008) Assessing the cumulative impacts of wind farms on peatland birds: a case study of golden plover Pluvialis apricaria in Scotland. Mires Peat 4:1–13
Picozzi N (1984) Sex ratio, survival and territorial behaviour of polygynous Hen Harriers Circus c. cyaneus in Orkney. Ibis (Lond 1859) 126:356–365.
Priyadarshani N, Castro I, Marsland S (2018) The impact of environmental factors in birdsong acquisition using automated recorders. Ecol Evol 8:5016–5033.
Roark E, Gaul W (2021) Monitoring migration timing in remote habitats: assessing the value of extended duration audio recording. Avian Conserv Ecol 16:art21.
Sansom A, Pearce-Higgins JW, Douglas DJT (2016) Negative impact of wind energy development on a breeding shorebird assessed with a BACI study design. Ibis (Lond 1859) 158:541–555
Sardà-Palomera F, Bota G, Viñolo C, et al (2012) Fine-scale bird monitoring from light unmanned aircraft systems. Ibis (Lond 1859) 154:177–183.
Shonfield J, Bayne EM (2017) Autonomous recording units in avian ecological research: current use and future applications. Avian Conserv Ecol 12:art14.
Stevens TK, Hale AM, Karsten KB, Bennett VJ (2013) An analysis of displacement from wind turbines in a wintering grassland bird community. Biodivers Conserv 22:1755–1767.
Thaxter CB, Buchanan GM, Carr J, et al (2017) Bird and bat species’ global vulnerability to collision mortality at wind farms revealed through a trait-based assessment. Proc R Soc B Biol Sci 284.
Walker D, McGrady M, McCluskie a, et al (2005) Resident Golden Eagle ranging behaviour before and after construction of a windfarm in Argyll. Scottish Bird 25:24–40
Whitfield DP, Fielding AH (2009) Hen harrier population studies in Wales. CCW Contract Science Report, No. 879. 42
Whitfield DP, Madders M (2006) A review of the impacts of wind farms on Hen Harriers Circus cyaneus and an estimation of collision avoidance rates
Wilson M, Fernández-Bellon D, Irwin S, O’Halloran J (2015) The interactions between Hen Harriers and wind turbines - WINDHARRIER. Cork
Appendix I
Species | Data source | Number of Records | Scale | Citation / More Information |
|---|---|---|---|---|
| Golden Eagle | Scottish Raptor Monitoring Scheme records of breeding raptors 2003-2020 | 308 | 10km | Records provided by Scottish Raptor Monitoring Scheme, accessed through NBN Atlas website. For more information |
| Golden Eagle | RSPB data unit (combined RSPB, SNH, SRSG) | 60 | 1 & 2km | Records provided by Royal Society for the Protection of Birds, procured from RSPB data unit. |
| Greenshank | RSPB Annual Reserve Avian Monitoring | 10 | 2 & 10km | Royal Society for the Protection of Birds (2023). RSPB Annual Reserve Avian Monitoring. Occurrence dataset on the NBN Atlas. For more information. Email [email protected] |
| Greenshank | Royal Society for the Protection of Birds | 767 | 1, 2 & 10km | Records provided by Royal Society for the Protection of Birds, procured from RSPB data unit. For more information. Email [email protected] |
| Greenshank | British Trust for Ornithology | 303 | 2 & 10km | Records provided by British Trust for Ornithology, accessed through NBN Atlas website. For more information: email [email protected], |
| Golden Plover | RSPB Annual Reserve Avian Monitoring | 5 | 1 & 2km | Royal Society for the Protection of Birds (2023). RSPB Annual Reserve Avian Monitoring. Occurrence dataset on the NBN Atlas, For more information. email [email protected] |
| Golden Plover | Royal Society for the Protection of Birds | 2240 | 1 & 2km | Records provided by Royal Society for the Protection of Birds, procured from RSPB data unit. For more information, email [email protected] |
| Golden Plover | Caledonian Conservation | 9 | 1 & 2km | Records provided by Caledonian Conservation, accessed through NBN Atlas website. For more information, email [email protected] |
| Golden Plover | British Trust for Ornithology | 655 | 1 & 2km | Records provided by British Trust for Ornithology, accessed through NBN Atlas website. For more information, email [email protected] |
| Dunlin | RSPB Annual Reserve Avian Monitoring | 10 | 1 & 2km | Royal Society for the Protection of Birds (2023). RSPB Annual Reserve Avian Monitoring. Occurrence dataset on the NBN Atlas. For more information,email [email protected] |
| Dunlin | Royal Society for the Protection of Birds | 2005 | 1 & 2km | Records provided by Royal Society for the Protection of Birds, accessed through NBN Atlas website. For more information, email [email protected] |
| Dunlin | Caledonian Conservation | 4 | 1 & 2km | Records provided by Caledonian Conservation, accessed through NBN Atlas website. For more information, email [email protected], |
| Dunlin | British Trust for Ornithology | 466 | 1 & 2km | Records provided by British Trust for Ornithology, accessed through NBN Atlas website. |
Appendix II – PVA alternative starting population scenarios – Figures 11 - 12.
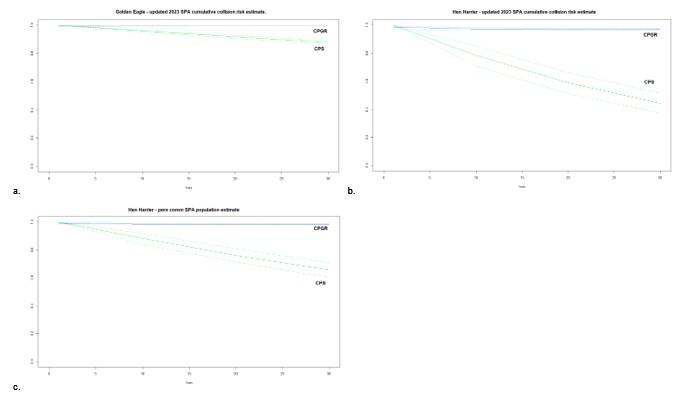
Figure 11: Change in the relationship between impacted and unimpacted populations (i.e., counterfactuals or ratios) of Golden Eagle and Hen Harrier over 30 years (CPS – green; CPGR - blue), resulting from the addition of a direct impact on survival
Click for a full description
(i.e., collision-induced mortality); a. counterfactual estimated using updated SPA cumulative collision risk estimate for Golden Eagle, b. counterfactual estimated using updated SPA cumulative collision risk estimate for Hen Harrier, c. pers comm SPA population estimate for Hen Harrier (40 individuals in SPA vs. 26 individuals from official designation). Note differing y scales according to the magnitude of the counterfactual.
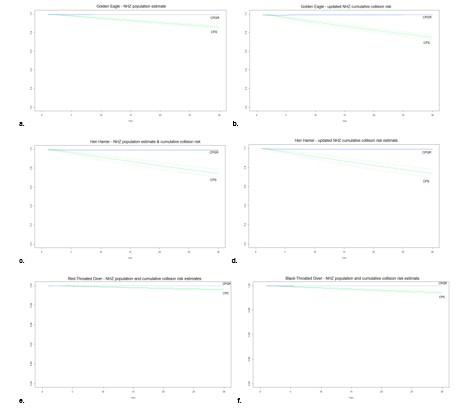
Figure 12: Change in the relationship between impacted and unimpacted populations
Click for a full description
(i.e., counterfactuals or ratios of population size and population growth rate - CPS – green; CPGR - blue), resulting from the addition of a direct impact on survival (i.e., collision-induced mortality), over 30 years, of a. Golden Eagle based on the NHZ5 population estimate (18 individuals – 3.86% cumulative collision risk), b. Golden Eagle based on the 2023 updated cumulative collision risk estimate for the NHZ5 population (7.49% cumulative collision risk), c. Hen Harrier based on the NHZ5 population estimate (76 individuals – 1.4% cumulative collision risk), d. Hen Harrier based on the 2023 updated cumulative collision risk estimate for the NHZ5 population (1.46%), e. Red-Throated Diver based on the NHZ5 population estimate (115 individuals – 0.05% cumulative collision risk), f. Black-Throated Diver based on the NHZ5 population estimate (78 individuals, 0.14% cumulative collision risk). Note differing y scales of the two Diver species, according to the magnitude of the counterfactual.
Appendix III – R code to run PVA
#### From Cook & Robinson 2016 ####
###############################
#### Modelling counterfactual of population size and population growth rate for 4 species ####
#### Golden Eagle, Hen harrier, Red throated diver, Black throated diver ####
#### model at 10, 20 and 30 years – life span of a wind farm ####
#### Set starting values for demographic parameters
#### Values in example code for Golden Eagle – other starting values available in Table 1 ####
init = 10 ## Starting population size in C&S SPA (N Breeding adults)
SexRatio = 0.5 ## Sex ratio males:females
juv.surv = 0.41 ## mean across northern Scotland as per Alan Fielding
ad.surv = 0.9512 ## as above
prod = 0.335 ## as above
prod.err = 0.075 ## error value
##prod.j = FOR HEN HARRIER ONLY
## prod.j.err = FOR HEN HARRIER ONLY
nyears = 30 ## Total number of years for estimations – model will calculate at intervals as well
niter = 1000 ## Number of iterations of the model
#### Stochastic Model for Counterfactual of Population Size ####
#### Model adds a margin of error into models to represent environmentally induced variation in productivity ####
## Survival impacts – note “surv” ##
surv.impact.HH = population.impact(init, SexRatio, #age1.surv,
##comment out any parameters that are not necessary, not all species need a 3 age class model ## juv.surv, ad.surv, prod, prod.err, nyears=30, niter, "surv", 0.035) ## 0.035 = 3.5% increased mortality ##
## Productivity impacts – note “prod” ##
prod.impact = population.impact(init, SexRatio, #age1.surv,
juv.surv, ad.surv, prod, prod.err, nyears=30, niter, "prod", 0.02)
## Produce and gather the estimates (means and upper and lower 95% estimates) of counterfactual of population size (CPX) for the various time periods – numbers represent number of years ##
## Survival – i.e. direct mortality ##
CPX1.surv = CPX(surv.impact$impact, surv.impact$base, 1)
CPX10.surv = CPX(surv.impact$impact, surv.impact$base, 10)
CPX20.surv = CPX(surv.impact$impact, surv.impact$base, 20)
CPX30.surv = CPX(surv.impact$impact, surv.impact$base, 30)
## Productivity – at the moment only for Hen Harrier ##
CPX1.prod = CPX(prod.impact$impact, prod.impact$base, 1)
CPX10.prod = CPX(prod.impact$impact, prod.impact$base, 10)
CPX20.prod = CPX(prod.impact$impact, prod.impact$base, 20)
CPX30.prod = CPX(prod.impact$impact, prod.impact$base, 30)
## Combine into a data frame ##
CPX.surv = data.frame(CPX1.surv$mean.cpx,CPX10.surv$mean.cpx, CPX20.surv$mean.cpx, CPX30.surv$mean.cpx)
CPX.surv.u95 = data.frame(CPX1.surv$u95.cpx,CPX10.surv$u95.cpx, CPX20.surv$u95.cpx, CPX30.surv$u95.cpx)
CPX.surv.l95 = data.frame(CPX1.surv$l95.cpx,CPX10.surv$l95.cpx,CPX20.surv$l95.cpx, CPX30.surv$l95.cpx)
CPX.prod = data.frame(CPX1.prod$mean.cpx,CPX10.prod$mean.cpx, CPX20.prod$mean.cpx, CPX30.prod$mean.cpx)
CPX.prod.u95 = data.frame(CPX1.prod$u95.cpx,CPX10.prod$u95.cpx, CPX20.prod$u95.cpx, CPX30.prod$u95.cpx)
CPX.prod.l95 = data.frame(CPX1.prod$l95.cpx,CPX10.prod$l95.cpx, CPX20.prod$l95.cpx, CPX30.prod$l95.cpx)
#### Plot outputs ####
jpeg("Pop Size Ratio/Pop Size Ratio through time.jpeg", width = 15, height = 10, units = "cm", res = 300)
## Create blank plot ##
plot(0,0,type = "n", xlim = c(0,30), ylim = c(0,1), xlab = "Years", ylab = "", main = "Stochastic", cex.lab = 0.75)
## Add in data ##
## ‘Seq’ element represents CPS estimates estimated from 1 to 30 years calculated every 10 years and must match in terms of number of points with number of items in CPS object ##
lines(c(1,seq(10,30,10)), CPS.surv[1,], col = rgb(250/255,128/255,114/255))
lines(c(1,seq(10,30,10)), CPS.surv.u95[1,], col = rgb(250/255,128/255,114/255), lty = 2)
lines(c(1,seq(10,30,10)), CPS.surv.l95[1,], col = rgb(250/255,128/255,114/255), lty = 2)
lines(c(1,seq(10,30,10)), CPS.prod[1,], col = rgb(39/255,64/255,139/255))
lines(c(1,seq(10,30,10)), CPS.prod.u95[1,], col = rgb(39/255,64/255,139/255), lty = 2)
lines(c(1,seq(10,30,10)), CPS.prod.l95[1,], col = rgb(39/255,64/255,139/255), lty = 2)
legend("bottomright", lty = 1, bty = "n", col = c(rgb(250/255,128/255,114/255), rgb(39/255,64/255,139/255)), legend = c("CIU Population Size", "CIU population growth rate"), cex = 0.5)
## Produce and gather the estimates (means and upper and lower 95% estimates) of counterfactual of population growth rate (CPGR) for the various time periods – numbers represent number of years ##
## Survival – i.e. direct mortality ##
CPGR1.surv = ratio.median.gr(surv.impact$impact, surv.impact$base, 1, 2)
CPGR10.surv = ratio.median.gr(surv.impact$impact, surv.impact$base, 1, 10)
CPGR20.surv = ratio.median.gr(surv.impact$impact, surv.impact$base, 1, 20)
CPGR30.surv = ratio.median.gr(surv.impact$impact, surv.impact$base, 1, 30)
## Productivity – at the moment only for Hen Harrier ##
CPGR1.prod = ratio.median.gr(prod.impact$impact, prod.impact$base, 1, 2)
CPGR10.prod = ratio.median.gr(prod.impact$impact, prod.impact$base, 1, 10)
CPGR20.prod = ratio.median.gr(prod.impact$impact, prod.impact$base, 1, 20)
CPGR30.prod = ratio.median.gr(prod.impact$impact, prod.impact$base, 1, 30)
## Combine into a data frame ##
CPGR.surv. = data.frame(CGR1.surv$ratio,CGR10.surv$ratio,CGR20.surv$ratio, CGR30.surv$ratio)
CPGR.surv.u95= data.frame(CGR1.surv$ratio.u95,CGR10.surv$ratio.u95, CGR20.surv$ratio.u95, CGR30.surv$ratio.u95)
CPGR.surv.l95 = data.frame(CGR1.surv$ratio.l95,CGR10.surv$ratio.l95, CGR20.surv$ratio.l95, CGR30.surv$ratio.l95)
CPGR.prod = data.frame(CGR1.prod$ratio,CGR10.prod$ratio, CGR20.prod$ratio, CGR30.prod$ratio)
CPGR.prod.u95 = data.frame(CGR1.prod$ratio.u95,CGR10.prod$ratio.u95,CGR20.prod$ratio.u95, CPGR30.prod$ratio.u95)
CPGR.prod.l95 = data.frame(CGR1.prod$ratio.l95,CGR10.prod$ratio.l95, CGR20.prod$ratio.l95, CGR30.prod$ratio.l95)
#### Plot outputs ####
plot(0,0,type = "n", xlim = c(0,30), ylim = c(0.95,1), xlab = "Years", ylab = "", main = "Stochastic", cex.lab = 0.75)
lines(c(1,seq(10,30,10)), CGR.surv[1,], col = rgb(250/255,128/255,114/255))
lines(c(1,seq(10,30,10)), CGR.surv.u95[1,], col = rgb(250/255,128/255,114/255), lty = 2)
lines(c(1,seq(10,30,10)), CGR.surv.l95[1,], col = rgb(250/255,128/255,114/255), lty = 2)
lines(c(1,seq(10,30,10)), CGR.prod[1,], col = rgb(39/255,64/255,139/255))
lines(c(1,seq(10,30,10)), CGR.prod.u95[1,], col = rgb(39/255,64/255,139/255), lty = 2)
lines(c(1,seq(10,30,10)), CGR.prod.l95[1,], col = rgb(39/255,64/255,139/255), lty = 2)
legend("topright", lty = 1, bty = "n", col = c(rgb(250/255,128/255,114/255), rgb(39/255,64/255,139/255)), legend = c("Impact on Survival", "Impact on Productivity"), cex = 0.5)
### Growth rate calculations ###
## First calculate growth rate of impacted pop, then base pop with no impact ##
impact.gr = growth.rate(surv.impact$impact,1,30) ## Number at the end represents time period over which you calculate growth rate ##
base.gr = growth.rate(surv.impact$base,1,30)
Appendix IV
| Species | Population size (individuals) / mortality % | Population size in 10 years (95% CI) | Population size in 20 years (95% CI) | Population size in 30 years (95% CI) |
|---|---|---|---|---|
| Golden Eagle | 10 / 3.5% | 9.58 (9.49 - 9.65) | 9.14 (9.03 - 9.24) | 8.72 (8.59 - 8.84) |
| Golden Eagle - Updated April 2023 | 10 / 3.26% | 9.61 (9.53 - 9.68) | 9.19 (9.08 - 9.29) | 8.8 (8.68 - 8.91) |
| Golden Eagle (14 individuals in C&S SPA) | 14 / 3% | 13.5 (13.4 - 13.58) | 13.01 (12.82 - 13.08) | 12.45 (12.29 - 12.59) |
| Hen Harrier | 26 / 4.5% | 19.45 (17.26 - 21.27) | 13.81 (11.65 - 15.9) | 9.78 (8.01 - 11.7) |
| Hen Harrier - Updated April 2023 | 26 / 3.84% | 20.41 (18.49 - 22.07) | 15.34 (13.31 - 17.19) | 11.52 (9.75 - 13.42) |
| Hen Harrier (40 individuals in C&S SPA) | 40 / 2% | 35.32 (33.64 - 36.76) | 30.48 (28.6 - 32.36) | 26.24 (24.16 - 28.4) |
| Red-throated Diver | 92 / 0.05% | 91.9 (91.9 - 91.95) | 91.85 (91.82 - 91.91) | 91.78 (91.72 - 91.81) |
| Black-throated Diver | 40 / 0.26% | 39.68 (39.56 - 39.76) | 39.28 (39.16 - 39.4) | 38.92 (38.72 - 39.08) |
| Species | Population size (individuals) / mortality % | Population size in 10 years (95% CI) | Population size in 20 years (95% CI) | Population size in 30 years (95% CI) |
|---|---|---|---|---|
| Golden Eagle (NHZ5 est.) | 18/ 3.86% | 17.17 (16.99 - 17.32) | 16.29 (16.07 - 16.51) | 15.46 (15.19 - 15.73) |
| Golden Eagle (NHZ5 est.) Updated April 2023 | 18/ 7.49% | 16.43 (16.11 - 16.7) | 14.87 (14.47 - 15.25) | 13.46 (13.03 - 13.86) |
| Golden Eagle (pers comm NHZ 5 est.) | 50 / 1% | 49.4 (49.25 - 49.5) | 48.7 (48.55 - 48.9) | 48.05 (47.85 - 48.25) |
| Hen Harrier (NHZ 5 est.) | 76/ 14% | 69.69 (67.34 - 71.59) | 62.78 (59.81 - 65.44) | 56.62 (53.5 - 59.81) |
| Hen Harrier (NHZ5 est.) Updated April 2023 | 76/ 1 .46% | 69.46 (67.18 - 71.44) | 62.4 (59.13 - 65.21) | 55.94 (52.74 - 59.28) |
| Red-throated Diver (NHZ5 est.) | 115/ 0.05% | 114.93 (114.91 - 114.94) | 114.85 (114.8 - 114.87) | 114.76 (114.72 - 114.8) |
| Black-throated Diver (NHZ5 est.) | 78/ 0.14% | 77.61 (77.53 - 77.76) | 77.22 (77.06 - 77.38) | 76.83 (77.45 - 76.99) |