
Welcome to the Peatland ACTION spatial data mapping tool.
Peatland ACTION spatial data has been added to ArcGIS Online (AGOL) to provide an interactive map based view of spatial data related to peatland restoration efforts across Scotland.
ArcGIS online typically provides users with access to a variety of data layers.
Users can zoom in and out of the map, pan to different locations, and select different data layers to explore. The portal also includes tools to download datasets, querying data, and creating custom maps.
Our map based online portal contains data derived from Peatland ACTION only and includes data on peat depth and condition surveys, hectares completed, completed projects and much more. Displaying our data in this way is helping to support peatland restoration efforts by providing access to valuable spatial data and analysis tools.
Note that this webmap portal is not a substitute to GIS software. This is a viewer that displays the data available on the Peatland ACTION Database. It also has extra functionality for example adding or downloading data. The user interaction with the data from the portal will be limited to the ArcGIS Online functionality. However, the user will be able to download the layers and use them on their own GIS systems.
Peatland ACTION open data resources
The Peatland ACTION Open Data page contains several datasets collected as part of Peatland ACTION projects.
The Data and Evidence Team are available to provide help and guidance when required. A list of Peatland ACTION contacts are available on the Peatland ACTION NatureScot website.
For an overview of what is ArcGIS Online (AGOL), please refer to ArcGIS’s official documentation.
Logging into view the map portal
You do not need an AGOL account to view the portal. However, if you have one, you can log in with your credentials.
The portal is available in ArcGIS Online (AGOL). From there, click on the view button or click on the thumbnail image to open the map.
Webmap portal overview and tips on how to use it
Navigation and panels
The portal is very similar to any other AGOL webmap application. It contains the main map window, links of interest on the main ribbon, some widgets to interact with the data, the layers, the legend and the attribute tables for each layer.
Widgets
The Peatland ACTION webmap portal uses a number of ArcGIS built-in widgets to improve the user experience. The widgets available on this portal are:
- Add data: This widget enables the user to add data from different sources, such as AGOL account, URL and also upload local files. This data will be displayed on the map for the current session only - it will vanish from the map after the session has finished.
- Base map gallery: This widget enables the user to choose a number of default base maps from ESRI.
- Select and export: Enables the user to select features by locations and export them into geojson file.
- Summary table for Peat Depth Surveys: Provides information on peat depth (total count of surveys, average of peat depth, max peat depth and min peat depth). Note this information refreshes every time a user zooms in our out of the map.
- Print to PDF: Exports the current view onto PDF format.
Layer list and legend
The layer list and legend are available from the top right menu. Please, note that there is a scale-dependent visibility on individual layers. This means that some layers will only become visible when zooming into the map.
The layers available on the map are:
- Peatland ACTION Reported hectares: This is a non-spatial table that shows completed reported hectares per project per year. This table also contains projects which still in progress but has reported hectares. If an user wants to know how many hectares per year has been reported since 2013, including projects in progress, this is the table to look at.
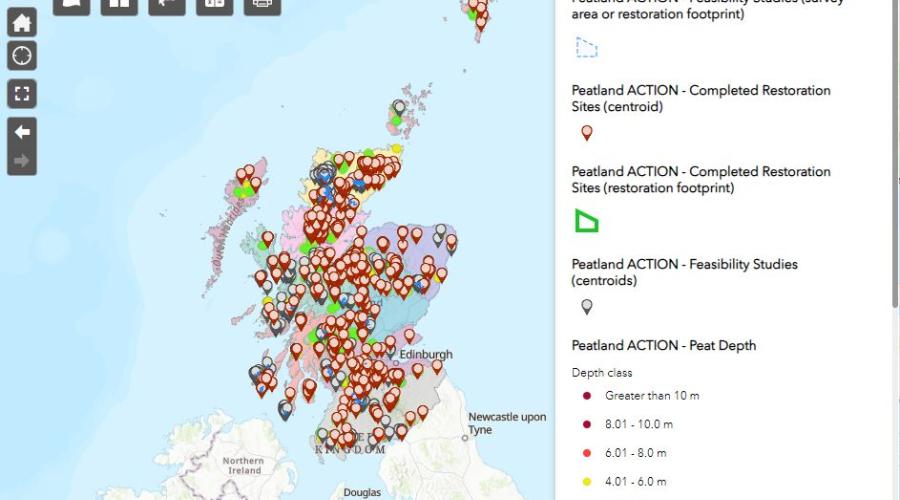
- Peatland ACTION Peat depth Survey: This layer shows the peat depth survey points categorised by peat depth classes. Source: Peatland ACTION.
- Peatland ACTION Peat condition Survey: This layer is a duplication of the peat depth survey layer but in this case, it also shows the peat depth survey point categorised by peat condition. Source: Peatland ACTION.
- Peatland ACTION Completed Project Locations (centroids): This table shows all Peatland ACTION completed project locations as centroid (centre point) of the project. The table might contain duplicate geometries when a project has been reported as multi-year project. For instance, grant ID 501284 was reported over 4 different years. This table might also contain projects with multiple subsites and the same restored hectares on each one. In those cases, the hectares of each subsite belong to the total hectares of the project. For instance grant ID 12481 has for each subsite 21 hectares. The total hectares of that project will be 21 hectares and not the sum of each individual subsite. Source: Peatland ACTION.
- Peatland ACTION Completed Project Locations (restoration footprint): This table shows all Peatland ACTION completed project polygons (only were the restoration footprint or any site outline is available). The table might contain duplicate geometries when a project has been reported as multi-year project. For instance, grant ID 501284 was reported over 4 different years. Source: Peatland ACTION.
- Peatland ACTION Feasibility Studies: Distribution of feasibility study project centroids and boundaries (when polygon is available). The table contains information about the feasibility study ID and hectares. Source: Peatland ACTION.
- Peatland ACTION Project Officer-Map: This dataset is the Project Officer Area map. Source: Peatland ACTION.
- Scotland’s Soil Carbon and Peatland 2016 layer: The layer shows the distribution of carbon and peatland classes across the whole of Scotland. It gives a value to indicate the likely presence of carbon-rich soils, deep peat and priority peatland habitat for each individually-mapped area, at a coarse scale. Source: Scotland’s soils website.
Attributes table
The attributes table is accessible from the grey expandable triangle at the bottom of the webmap. There is a tab for each existing table on the webmap.
Main features from the attributes table:
- Options: From the options button the user can filter the attributes, hide columns and export to CSV.
- Filter by map extent: If this button is activated, the user will only see the features that are visible on the map at that scale.
Filter
Filtering expressions is one of the main features the user can access from the attributes table option button. The user can add a single expression or a set of them.
You may find this video on filtering expressions helpful.
Download data
There are several ways to download data.
- CSV : Select the options button on the attribute table. Note that a CSV will not contain spatial definition of the downloaded features.
- Geojson: Alternatively, you can use the select and export widget to select features and export them as geojson (see section below for further details on this topic).
- Users with AGOL login accounts: There are additional export options when clicking on layer details.
Select and Export features
The select and export widget can be found in the widgets panel. This widget not only allows the user to select data, it also enables the user to export the data as either CSV or geojson (ready to be loaded into GIS software).
Before exporting specific data from a layer, the user must first select the desired information, such as projects with a particular grant_reference, to be saved onto their local computer.
A filter function is available in the attributes table. This allows the user to drill down further into the dataset. For example, having chosen the grant_reference project layer the filter allows the user to screen for a specific project(s) within the list.
Steps to select and export data:
- Click on the grey square at the beginning of the row; the row will go from grey to a light blue colour to indicate the project has been selected.
- Once desired rows are selected (light blue) the user can click on the select and export widget and click again on the three dots close to the layer name.
- After clicking on the three dots, a number of actions or options appear. One of them is Export to GeoJSON. This action will allow the user to save the data as GeoJSON onto a local computer and then load it into a preferred GIS software.
- Alternatively, the user can use the select widget to select data spatially and export it. Use the select button and choose the preferred way of selecting data spatially. The user can select sections of the dataset or the entire dataset.
- The features are selected when they turn from grey to a light blue colour. From here the user can export them by clicking on the three dots and choosing Export to GeoJSON.
Add data features
Add data from a local laptop
From the add data widget is it also possible to upload data [shapefiles, CSV, geojson, gpx and KML] to the map portal.
For example, to add a spatial data file to the map portal, take any shapefile layer (plus prj, dbf and shx files) and zip them all into a single file on a local device. Afterwards, the user may look for the file on their computer and upload the compressed ZIP file to the webmap portal.
Webmap Services
Instead of adding a local spatial data file such as shapefile, CSV, geojson, gpx or KML, the user can also add Webmap Services (WMS) – these include base maps, satellite imagery and other relevant data from a variety of sources.
Print a map
The print widget allows very basic export of a non-geospatial pdf map. For more resources on how to use the print a map widget refer to the ArcGIS website.
FAQ's
What is the purpose of this webmap portal?
The webmap portal serves as a centralised platform for visualising and analysing data related to Peatland ACTION funded peatland restoration efforts since 2013.
The purpose of this webmap portal is to provide easy access to this spatial data for the general public, Scottish government, public and private organizations, and partners of Peatland ACTION.
Which one of the tables will give me the reported hectares per year?
If you are after reported hectares per year since 2013, then use the non-spatial table called reported hectares. This table contains all reported hectares including those projects that do not have final spatial data submitted and are currently in progress. It is worth noting that there have been changes in reporting standards over time.
What kind of spatial data can be viewed on the portal?
The portal contains spatial data from Peatland ACTION restoration efforts. For more information, see section on layer list and legend in this guidance note.
Who is the intended audience for this portal?
The general public, Scottish government, public and private organisations, potential applicants to the Peatland ACTION Fund and their agents and partners of Peatland ACTION.
How frequently is the data on the portal updated?
We are working towards a spatial data infrastructure that allow us to update the data quarterly. The webmap portal for Peatland ACTION restoration efforts in Scotland is a dynamic tool that we are committed to keeping up-to-date. While we aim to update the data on the portal on a quarterly basis, it's worth noting that updates may not always be possible due to factors such as data availability and verification processes. Nonetheless, we will make every effort to ensure that the portal remains a valuable and informative resource for all users, and we appreciate your interest in staying up-to-date with the latest information on Peatland ACTION restoration efforts in Scotland.
Why are there duplicates on completed project centroids / restoration footprints tables?
Both tables might include duplicate geometries or duplicate grant IDs. When a project is reported as a multi-year project, the tables may include duplicate geometries. For example, grant ID 501284 could be reported across four different years. The tables may also include projects with multiple subsites, each with the same restored hectares. In such cases, the hectares of each subsite should be included in the total hectares of the project. For instance, if grant ID 12481 has several subsites, each with 21 hectares, the total hectares for the project should be 21 hectares, not the sum of each individual subsite.
Can I download the data from the portal for my own use?
Yes, but you must acknowledge Peatland ACTION in any communications relating to the data. For more information about how to do it, see section on select and export features widget.
Is there a mobile app available for this portal?
The link to the portal can be used on any tablet or mobile devices.
How do I navigate the portal and search for specific data?
To navigate the portal and search for specific data, the user can use the filters provided on the attributes table (see section filter in this guidance note). The user can also use the zoom and pan tools to navigate the map and explore different areas.
The portal has different layers of data, which can be toggled on or off using the layer control, the user can also adjust the layer transparency.
The user can click on individual features to access more detailed information about them.
Is there any training available for using the portal?
This guidance should cover every aspect of using the portal, including navigation, searching for specific data, filtering, type of data available, downloading data and accessing detailed information about individual features. For further information, ESRI website provides a good number of online resources on how to use the different widgets and elements of ArcGIS Online portals.
How is the data on the portal collected and verified?
Since 2020, a spatial data template using QGIS and ArcGIS Pro, has been put in place by the Peatland ACTION Data and Evidence Team at NatureScot to consistently record spatial data. This ensures that the data collected is of a high quality and more reliable for partners, applicants, and agents.
To verify the data, we conduct analysis of the data pre and post restoration. We also speak with stakeholders, contractors, agents, and project officers. This helps to confirm the accuracy and reliability of the data we publish on the portal. Overall, the use of a spatial data template and consistent data collection methods enhances the quality of the data, making it a more valuable resource for all stakeholders involved in peatland restoration efforts.
Are there any plans to expand the data on the portal to include other areas of peatland restoration efforts?
We are committed to continually improving the portal by adding new data and updating existing ones. However, the process of collecting and verifying the data is ongoing, and it may take some time before any new data is available on the portal.
Last updated: