Official Statistics - Marine and Terrestrial Species Indicators: Experimental Statistic
Published: 2022
An Experimental Official Statistics Publication for Scotland
This release shows changes in marine and terrestrial biodiversity in Scotland. The indicators help measure progress towards national biodiversity commitments, which include the Scottish Biodiversity Strategy and the national outcome to ‘value, enjoy, protect and enhance our environment’. It also helps measure progress towards commitments under the Convention on Biological Diversity and the UN Sustainable Development Goals.
Evidence
The indicators are based on trends in the occupancy and abundance of native species. In total trends of 2,803 species are used in this report from all regions and habitats, and including Scotland’s seas within the Exclusive Economic Zone (EEZ: up to 200 nautical miles from the Scottish coast). The trends in abundance (for 337 species) come from a range of established monitoring schemes, and trends in occupancy (2,466 species) from analyses of biological records held by the Biological Records Centre. Abundance trends reflect changes in the number of individuals of a species, whilst occupancy trends are based on the number of sites where a species is present, reflecting the size of the range within which it is found, and can be less sensitive to change than measures of abundance. Trends in abundance and occupancy may vary in different ways and at different rates within the same species, and so the two measures are reported separately. Two of the indicators measure change in terrestrial biodiversity, one for species’ abundance and one for species’ occupancy – note that the species compositions for these are very different. (Where trend data for a species is available for both abundance and occupancy, the abundance data are used.) A separate indicator based on seabird abundance represents trends in marine biodiversity. At present suitable occupancy data for marine species have not been analysed. In this update, data for the terrestrial occupancy indicator were not updated.
Any biodiversity indicator can only represent a sample of the species present. Overall, we have incorporated data for 2,803 species out of around 60,000 present in Scotland and its waters, and we have been able to include some the groups for which Scotland is internationally important such as seabirds, lichens and bryophytes. This is the most comprehensive set of indicators for Scotland’s species to date. There are significant biases in the representation of Scotland’s biodiversity; they are, however, the best possible based upon current knowledge and as data from other species groups are made available these will be incorporated in the future.
The indicators
When presenting the indicators a common end date of 2019 was selected for the terrestrial species and marine species (seabirds) indicators. No update was available for terrestrial occupancy.
Marine species’ abundance
From 1994 to 2019, the average abundance of 14 species of breeding seabird fell by 41%, with the decline occurring between 2000 and 2010. Between 2016 and 2019 the indicator declined by 8%.
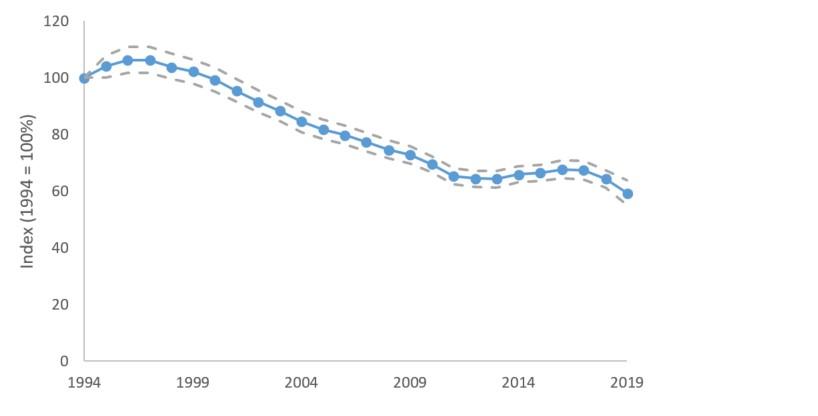
Derived from data for 14 seabird species. The dashed line shows 95% credible intervals.
From 1994 to 2019, the average abundance of 14 species of breeding seabird fell by 41%, with the decline occurring between 2000 and 2010. Between 2016 and 2019 the indicator declined by 8%.
Terrestrial species’ abundance
From 1994 to 2019, the average abundance of 337 species of bird, mammals, butterflies and moths was stable. Average abundance shows peaks in 1995, 2004, 2010 and 2019. Between 2016 and 2019 the indicator increased by 14%.
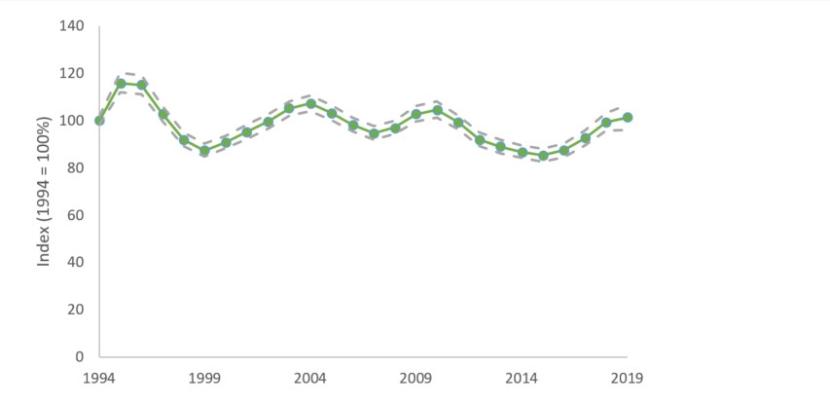
Derived from data for 133 birds, 25 butterflies, 9 mammals and 170 moths. The dashed line shows 95% credible intervals.
From 1994 to 2019, the average abundance of 337 species of bird, mammals, butterflies and moths was stable. Average abundance shows peaks in 1995, 2004, 2010 and 2019. Between 2016 and 2019 the indicator increased by 14%.
Terrestrial species’ occupancy
From 1994 to 2016, the average occupancy of 2,466 species of invertebrate, lichen and bryophyte increased by 24%. Between 2015 and 2016 the indicator was stable.
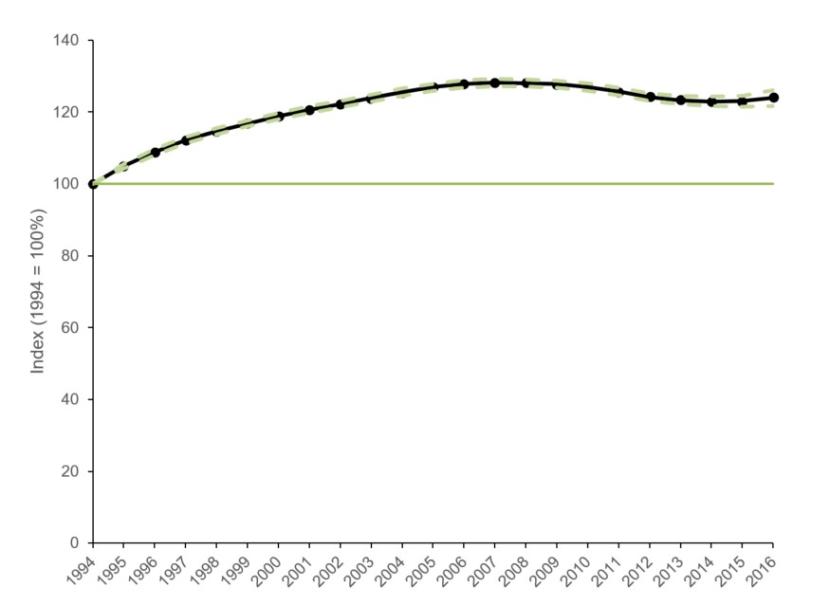
Derived from data for bryophytes (218 species), lichens (650 species), freshwater invertebrates (151 species), terrestrial insects (1,104 species), and terrestrial invertebrates (excluding insects) (343 species). Dashed line shows 95% credible intervals.
From 1994 to 2016, the average occupancy of 2,466 species of invertebrate, lichen and bryophyte increased by 24%. Between 2015 and 2016 the indicator was stable.
Assessment of trends in the three Scottish biodiversity indicators
Marine abundance indicator
- The indicator has shown a statistically significant decrease of 41% from 1994 to 2019.
- The indicator declined by 8% between 2016 and 2019.
Terrestrial abundance indicator
- The indicator has shown a stable trend since the start year of 1994.
- The indicator increased between 2016 and 2019 by 14%.
Terrestrial occupancy indicator
- The indicator has shown a statistically significant increase of 24% since the start year of 1994.
Additional information on indicator trends
The three indicators summarise trends from a large number of species across many taxa collectively found in most if not all of Scotland’s habitats and regions, and responding both positively and negatively to a range of drivers. We can gain understanding into the patterns and causes of change in Scottish biodiversity by disaggregating the headline indicators into trends for subsets of species. Here we have split the two terrestrial indicators by their main taxonomic groups to provide some additional insight. In addition, we provide trends in abundance for additional marine taxonomic groups; although seabird abundance alone is regarded as a better measure of marine biodiversity overall, these trends provide further context.
The indicators are the average of the constituent species’ trends, set to a value of 100 in the start year (the baseline). Changes subsequent to this reflect the average change in species abundance or occupancy; if on average species’ trends doubled, the indicator would rise to 200, if they halved it would fall to a value of 50. A smoothing process is used to reduce the impact of between-year fluctuations, such as might be caused by variation in weather, and so make underlying trends easier to detect.
Marine abundance indicators for additional species’ groups
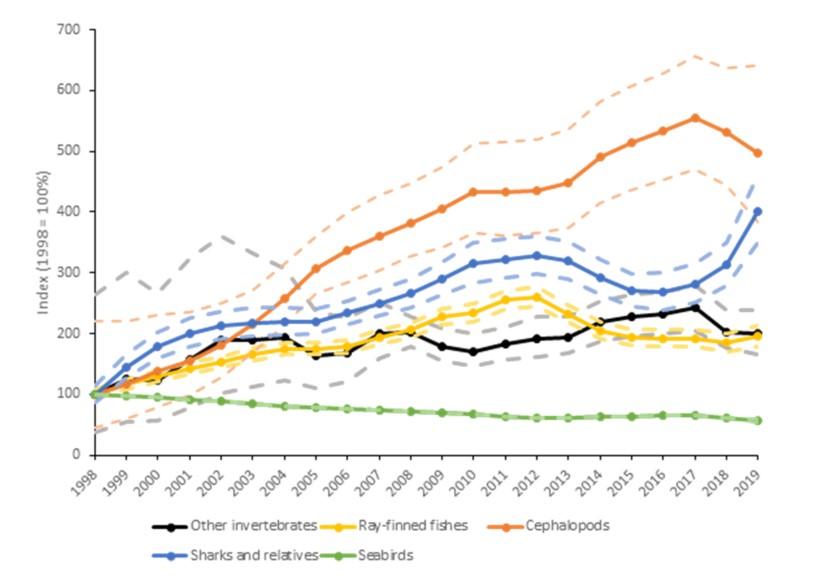
Mean abundance for cephalopods (11 species), ray-finned fish (Actinopterygii; 147 species), other invertebrates (6 species of crab, lobster and scallop recorded in trawl surveys), sharks and relatives (Elasmobranchii, a subclass of cartilaginous fish including sharks, rays and skates; 37 species), and seabirds (14 species). The dashed lines show 95% credible intervals.
Figure 4 shows the average trends for four taxonomic groups in addition to the seabird indicator used as the headline indicator for marine biodiversity. Note this figure starts from a baseline in 1998, not from 1994 as in figure 1, due to the later availability of some of the data sources. Four of the five groups show a significant increase in average abundance since 1998 with, most importantly, the group contributing the most species to the indicator and thus having the greatest influence on the overall change, ray-finned fish (Actinopterygii), increasing by 95% since the 1998 baseline. The other fish group, sharks and relatives (Elasmobranchii), increased by 301% over the same period, and cephalopods and a small grouping of other invertebrates (including bivalves and crustaceans) increased by 398% and 99% respectively. In marked contrast, seabird numbers have fallen by an average of 43% since 1998 (and by 41% since the baseline of 1994 shown in figure 1); they declined by 8% between 2016 and 2019.
Figure 4 shows the average trends for four taxonomic groups in addition to the seabird indicator used as the headline indicator for marine biodiversity. Note this figure starts from a baseline in 1998, not from 1994 as in figure 1, due to the later availability of some of the data sources. Four of the five groups show a significant increase in average abundance since 1998 with, most importantly, the group contributing the most species to the indicator and thus having the greatest influence on the overall change, ray-finned fish (Actinopterygii), increasing by 95% since the 1998 baseline. The other fish group, sharks and relatives (Elasmobranchii), increased by 301% over the same period, and cephalopods and a small grouping of other invertebrates (including bivalves and crustaceans) increased by 398% and 99% respectively. In marked contrast, seabird numbers have fallen by an average of 43% since 1998 (and by 41% since the baseline of 1994 shown in figure 1); they declined by 8% between 2016 and 2019.
Note that the 212 species included in this figure represent approximately 3.2% of the 6,500 species found in Scottish seas. While it represents the best indication that we can make with current information, this selection is heavily taxonomically biased and thus may not be representative of overall trends in biodiversity.
A separate indicator for seabirds encompassing both abundance and productivity data is published by NatureScot (NatureScot 2021); there are differences in the time period and analytical approach used to generate that indicator from the indicator presented here, and so there are some differences in the patterns and change shown.
Disaggregated terrestrial abundance indicator
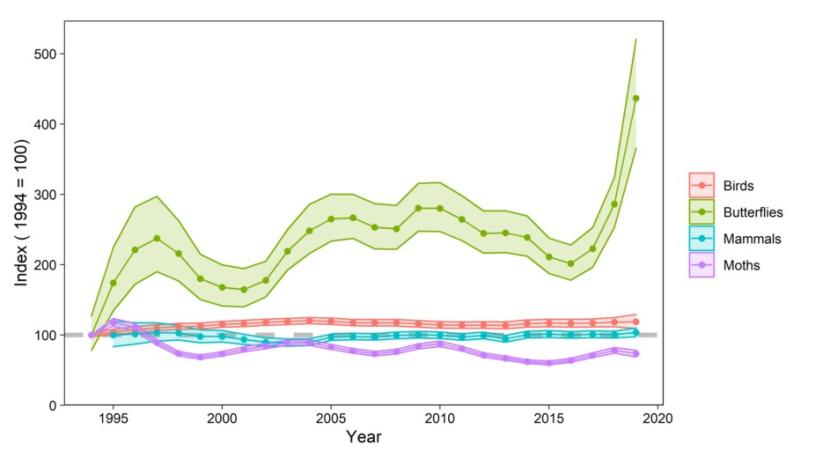
Mean abundance for birds (133 species), butterflies (25 species), mammals (9 species) and moths (170 species). The dashed lines show 95% credible intervals.
Figure 5 shows the headline terrestrial abundance split into average trends for four taxonomic groups, which show substantially different patterns of change since 1994. The indicator for birds rose from the 1994 starting point to a value of 20% above by 2004, but has stayed stable thereafter; it was 19% over the baseline level in 2019. The indicator line for butterflies has increased since 1994. Between 2016 to 2019, a rapid increase occurred from 101% above the baseline level to 337% above.
Figure 5 shows the headline terrestrial abundance split into average trends for four taxonomic groups, which show substantially different patterns of change since 1994. The indicator for birds rose from the 1994 starting point to a value of 20% above by 2004, but has stayed stable thereafter; it was 19% over the baseline level in 2019. The indicator line for butterflies has increased since 1994. Between 2016 to 2019, a rapid increase occurred from 101% above the baseline level to 337% above.
By contrast, the indicator for Scottish mammals has shown remarkably little change over the 25-year period, and in 2019 it was 3% over its 1994 baseline value. Finally, the moth indicator – which contains data from more species than the other lines, and so has the greatest influence on the headline indicator – has declined by 27% since 1994.
Note that the 337 species included in this indicator represent considerably less than 1% of the terrestrial and freshwater species found in Scotland; whilst this selection is heavily taxonomically biased and thus may not be representative of overall trends in biodiversity. they are, however, the best possible based upon current knowledge.
Note that separate indicators for wild birds (NatureScot 2021), moths (NatureScot 2021) and butterflies (NatureScot 2021) are published by NatureScot; there are some differences in the data sources and analytical approaches used to generate those indicators from the disaggregated indicators presented here, and so there are some differences in the patterns and scale of change shown. The publications for these separate indicators give further details on data sources, differing patterns of trends within them, and drivers of change.
Disaggregated terrestrial occupancy indicator
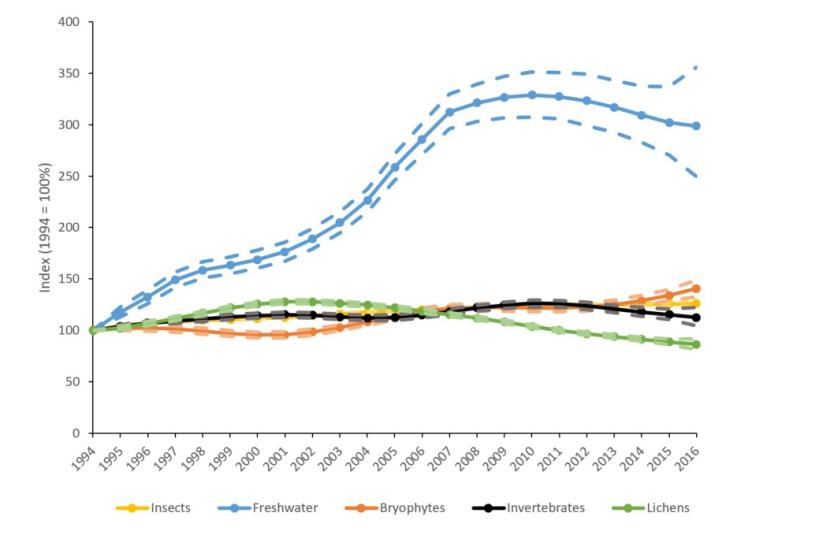
Mean occupancy for bryophytes (218 species), lichens (650 species), freshwater invertebrates (151 species), terrestrial insects (1,104 species), and terrestrial invertebrates (excluding insects) (343 species). The dashed lines show 95% credible intervals.
Figure 6 shows the headline terrestrial occupancy indicator split into average trends for five groups: bryophytes (218 species), lichens (650 species), freshwater invertebrates (151), terrestrial insects (1,104), and terrestrial invertebrates (excluding insects) (343). The occupancy of freshwater invertebrates decreased on average in recent years but was still 198% above the 1994 baseline level in 2015. Terrestrial invertebrates (excluding insects) show a similar pattern of recent downturn but the earlier increase was less substantial and so the line finishes 13% above the 1994 value. The average occupancy of terrestrial insects has increased slowly since 1994, finishing at 26% above the baseline, as has that for bryophytes, which ends 40% above the baseline whereas the indicator for lichens has fallen by 14% since 1994.
Figure 6 shows the headline terrestrial occupancy indicator split into average trends for five groups: bryophytes (218 species), lichens (650 species), freshwater invertebrates (151), terrestrial insects (1,104), and terrestrial invertebrates (excluding insects) (343). The occupancy of freshwater invertebrates decreased on average in recent years but was still 198% above the 1994 baseline level in 2015. Terrestrial invertebrates (excluding insects) show a similar pattern of recent downturn but the earlier increase was less substantial and so the line finishes 13% above the 1994 value. The average occupancy of terrestrial insects has increased slowly since 1994, finishing at 26% above the baseline, as has that for bryophytes, which ends 40% above the baseline whereas the indicator for lichens has fallen by 14% since 1994.
Note that the 2,466 species included in this indicator represent only a small proportion of the terrestrial and freshwater species found in Scotland. Whilst this selection is heavily taxonomically biased and thus may not be representative of overall trends in biodiversity, they are, however, the best possible based upon current knowledge and includes representatives of three main groups of life on land: plants; animals; and fungi.
Drivers of change in Scottish biodiversity
The changes in average abundance and occupancy of terrestrial species and in abundance of marine species have been caused by a wide range of drivers of change acting on species’ populations and the environments they live in; identifying drivers for each of the species is beyond the scope of this report. Below we have considered the likely impact of the five key drivers of change identified by the Intergovernmental Science-Policy Platform on Biodiversity and Ecosystem Services (IPBES) Global Assessment on Biodiversity and Ecosystem Services (IPBES 2019), as well as the positive impacts of conservation action taken to address biodiversity loss. A range of more comprehensive assessments of the impact of such drivers on Scottish biodiversity exist, such as The State of Nature Scotland 2019 report (Walton et al. 2019).
Changes happened to the Scottish landscape and its biodiversity before the start of the indicators given here. Although much evidence exists to the nature of these changes and their impacts on biodiversity, robust quantitative measures of change are lacking. However, Walton et al. (2019) reported a decline of 14% in an indicator of terrestrial species’ occupancy between 1970 and 1994 (the starting point for the indicator reported here), thus the increase in the terrestrial occupancy indicator presented here may represent a recovery from a decline since 1970. Similar evidence of declines in biodiversity have been shown through the Natural Capital Asset Index since 1950.
Land- and sea-use change
Positive impacts: recent agri-environment schemes have arrested declines for some farmland species; generalist woodland species have benefitted from afforestation; some species have benefitted from green and blue infrastructure.
Negative impacts: agricultural intensification has driven declines in many species; afforestation has resulted in the loss of other habitats; urbanisation has resulted in habitat loss and fragmentation.
Scotland’s land area has been heavily modified through centuries of management for human purposes such as the production of food, timber, minerals and other commodities, and providing homes and other infrastructure. In recent decades, whilst there have been some changes in broad categories of land use, such as increased urbanisation and afforestation, probably the biggest impacts on biodiversity have arisen from changes in the management within existing land-uses. These have included agricultural intensification which has affected the 70% of Scotland that is farmed, with for example the increased use of chemical inputs, changed sowing seasons, the loss of non-cropped habitats and changes in livestock densities (as well as wild deer). At a UK-scale such intensification has been demonstrated to have severe impacts upon many species (e.g. Burns et al. 2016), although trends in Scottish biodiversity, such as farmland birds, suggest that the impact may not have been as great as in the wider UK, at least in more recent years (NatureScot 2021). Biodiversity has also been shown to benefit from green and blue infrastructure, for example amphibians and invertebrates breed in Sustainable Drainage Schemes (SuDS). Recent research by Aberdeen University has found that Scotland’s rarest damselfly, the northern damselfly has colonised stormwater ponds in the Cairngorms National Park (Ponath in prep).
Support for wildlife-friendly farming through agri-environment schemes and High Nature Value farming has enabled the recovery of some target species such as Corn Bunting (Perkins et al. 2011) and biodiversity more widely (Wilkinson et al. 2012). A recent study on urban and agricultural birds (Martay & Noble, 2022) showed that some bird species had more positive trends on farmland compared with urban areas, highlighting the importance of agri-environment schemes.
Large-scale afforestation over past decades has supported increased populations and range expansions in generalist woodland species, such as some moths, particularly those that use conifer host-plants such as the Pine Carpet (Randle et al. 2019, SNH 2019). However, specialist woodland species across a wide range of taxa have declined in the absence of suitable management, for example woodland lichens (Pakeman et al. 2022). In addition, afforestation has led to the loss of upland peat bog habitat home to rare habitat specialist species, as well as having a range of other impacts on biodiversity (e.g. see Burton et al. 2018).
Climate change
Positive impacts: northward and altitudinal range expansions in many species leading to increases in abundance and occupancy.
Negative impacts: range retractions in northern and montane species; complex influences on ecosystems and foodwebs e.g. in Scotland’s seas.
Climate change is a significant and growing threat to biodiversity globally (IPBES 2019), and its impact is being increasingly detected in Scotland and its seas. The effects are many, and varied, with a mixed impact in biodiversity; presently, at least, many species are benefiting. For example, species are shifting ranges northwards, through Scotland, with consequent increases in abundance and range for birds such as nuthatches (Gillings et al. 2015) and butterflies including ringlets (Fox et al. 2015). A trend towards milder winters may have resulted in improved survival for bird species such as goldfinches. For many species, the influence of climate change may be serving to soften the impact of land-use changes and other adverse environmental changes. However, species with their southern range limits in Scotland, and those associated with cold montane habitats where, for example, duration of snow-lie is decreasing, are likely to undergo range contraction and possibly even extinction from Scotland (ASC 2016). Further threats arise from increased frequency and severity of storms and other extreme weather events, and the impact of sea-level rise on vulnerable coastal habitats.
In marine ecosystems climate change is having rapid and widespread effects through warming waters, salinity changes, acidification and seasonal stratification (MCCIP 2020). The impact of climate change is being felt through marine food webs, with changes in phytoplankton, feeding through to zooplankton (in which rapid northward shifts in range have been detected) to fish and top predators including large fish, seabirds and marine mammals. The substantial increases in fish abundance shown by the marine indicator may in part reflect increases in small-bodied non-commercial species such as the Boarfish in response to warming seas (Monterro-Serra 2015). Cephalopods too have expanded their ranges in the North Sea as a response to warming conditions (van der Kooij et al. 2016). Declines in seabirds such as Kittiwakes have been linked to climate change impacts upon food webs including key prey species such as Sandeels (Carrol et al. 2017).
Pollution
Positive impacts: levels of principal air and water pollutants have declined in Scotland in recent decades; recoveries in some bryophytes and invertebrates may have occurred in response.
Negative impacts: long-term effects of atmospheric pollutants on sensitive habitats remain evident and in addition, novel air and water pollutants are a concern.
There has been marked progress over the lifetime of the indicators presented here in reducing the principal sources of air and water pollution in Scotland; for example, levels of all the principal air pollutants have declined since 1990, substantially in most cases (Scottish Government 2020). However, many pollutants have had long-term impacts so the influence on sensitive habitats remains substantial; the impacts of nutrient enrichment and acidification remain, although some recoveries have been detected such as in sensitive bryophytes (Pakeman et al. 2019). The strong recovery in the occupancy of freshwater invertebrates between 2000 and 2010 suggests a beneficial impact of environmental regulations and consequent management changes in reversing biodiversity declines (Outhwaite et al. 2020). Nonetheless, concerns have been raised over the impact of a range of new pollutants, most notably plastic pollution in marine environments, but also light and noise pollution, and new chemical contaminants including novel agrichemical products. For a large part, the impacts of these newer pollutants on biodiversity have not yet been well quantified.
Natural resource use and exploitation
Positive impacts: recent changes in fisheries management, with an increasing number of commercial fish stocks being fished sustainably, have led to some signs of recovery albeit from very low baselines.
Negative impacts: fishing with bottom-towed gear continues to cause damage to sensitive seabed habitats. Long-term impacts from historic overfishing continues to affect fish populations in some areas.
Scottish marine waters hold important stocks of fish and shellfish, which are commercially exploited, and such fishing has had radical impacts on fish populations and thus marine ecosystems more widely over centuries, with a lengthy history of overexploitation. In recent decades, however, fisheries management has improved, although there is some way to go; in 2017, 54% of key Scottish fish stocks were assessed as being fished sustainably (Scottish Government 2018). There are welcome signs of recovery in fish stocks in both the North and Celtic Seas, as shown by existing indicators showing increases in species such as cod and haddock (Walton et al. 2019). In addition, fishing pressure in the deep seas off the west of Scotland has been decreasing since the early 2000s with the introduction of management measures (Mindel et al. 2018). Increases in fish abundance shown in the marine abundance indicator reported here may to some extent reflect increases of smaller, less commercially valuable species increasing in response to perturbation of fish communities by over-fishing, although this is not the case in the deep sea where size-based indicators have shown a positive recent trend (Mindel et al. 2018). The increasing trends in sharks and their relatives is also particularly encouraging, as this group is among the most highly threatened of all vertebrate groups (Dulvy et al. 2014). Bottom-towed fishing gear do, however, continue to cause extensive damage to vulnerable seabed habitats and populations of the species that occupy them; a recent expansion of the Marine Protected Area network to 22% of Scottish waters will hopefully make a substantial step towards protecting seafloor integrity.
Invasive species
Positive impacts: some projects have removed or reduced populations of invasive non-native species (INNS).
Negative impacts: numbers of INNS established continue to grow, with northward range shifts, and intensifying impacts on native wildlife.
Invasive non-native species (INNS) are recognised as one of the greatest threats to biodiversity globally, and numbers of species established in Great Britain are continuing to grow (JNCC 2020); to date 180 species have had a documented negative impact on biodiversity (Roy et al. 2017). Specific examples of negative impacts, such as on breeding seabirds from introduced mammalian predators (e.g. Towns et al. 2011), are well-documented; mechanisms range from predation on native species, competition, hybridisation, habitat damage and disease and pathogen transfer. At present impacts are limited mostly to certain groups of native species, and particular habitats such as islands, freshwater bodies and native woodlands, but the problems caused by INNS seem very likely to increase. Localised projects have provided significant benefits for native biodiversity by removing INNS, such as non-native black rats on the Shiant Islands (Main et al. 2019) enabling populations of seabirds such as storm petrels and Manx shearwaters to recover.
Conservation action
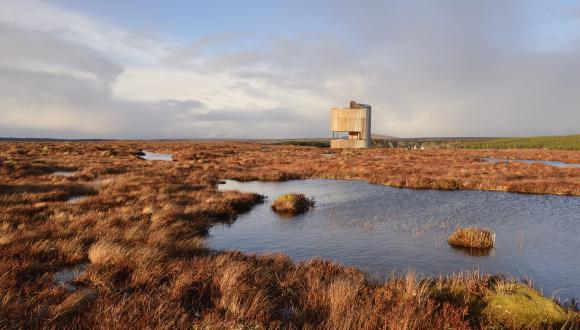
Over the twenty-plus years spanned by these biodiversity indicators, a wide range of conservation actions have helped biodiversity in Scotland. These include legislation and policies aimed at delivering broad environmental improvements. Examples include regulation that has driven down levels of damaging air pollution and delivered improvements in fisheries management. Other important action has been taken to designate and improve the management of Scotland’s most important sites and landscapes for wildlife. There has also been species-focused work, targeted at endangered species such as the corncrake, twinflower, marsh fritillary and Scottish wildcat. In some cases, we can identify species recoveries, in both abundance and range (i.e. as measured by changes in occupancy), which can be linked to conservation action. However, for the most part we lack knowledge on counterfactuals – what would have happened to species’ populations in the absence of conservation action – to adequately quantify the impact of such action. That said, we have evidence of local and population-specific benefits from conservation, such as the recovery of the white-tailed eagle, red kite, beaver, chequered skipper and great crested newt, and the restoration of large areas of degraded peat bog in the Flow Country, to give an understanding how conservation action has helped Scottish biodiversity over the period of these indicators.
The Nature Restoration Fund (NRF) is a competitive fund launched in July 2021, which specifically encourages applicants for projects that restore wildlife and habitats on land and sea and address the twin crises of biodiversity loss and climate change.
In 2021, funding was awarded to 54 projects alongside a direct allocation of £5m directly from Scottish Government to Local Authorities. On Nature Day at COP26 the Scottish Government announced an expansion to the Nature Restoration Fund, comprising at least a further £55m over the next four years, with at least £12.5m annually.
In July 2022, around £5m of funding was awarded to 46 projects in the £25k to £250k round of the fund. In addition, all local authorities, plus Scotland’s two National Parks, have received a share of £6.5 million directly from the Scottish Government’s Edinburgh Process Fund - the second stream of the annual Nature Restoration Fund.
Emerging threats to biodiversity in Scotland
The presence of Highly Pathogenic Avian Influenza in Scotland has the likelihood of altering the fortunes for waterbirds – particularly wintering geese and in 2022 had serious impacts on Scotland’s seabirds. This is a rapidly evolving situation and for seabirds which are already declining is likely to make population trends worse. Other diseases of concern include chytrid, which has devastated amphibian populations elsewhere in Europe, and novel tree pathogens including Phytophthora species.
Technical Background and Source Data
All the indicators presented measure change since 1994 with the exception of trends for marine species’ groups other than seabirds, for which sufficient data are only available from 1998. The data run to the most recent year for which they are available, this varies between the three indicators, due to differing lags in reporting between the main data sources. Although some longer time-series are available, this start year has been identified as the best balance between providing as long a time-series as possible, but keeping the taxonomic groups contributing to the index broadly consistent throughout. Trends in abundance from a range of established monitoring schemes and trends in occupancy from analyses of biological records held by the Biological Records Centre. Set rules, either imposed by those organisations that operate these monitoring schemes, or created for the purposes of this indicator, filter species trends for suitability for inclusion, ensuring individual species’ trends are robust.
There are considerable biases in the availability of species trends for incorporation in the indicator. For example, vertebrates are over-represented in the terrestrial abundance indicator in comparison to invertebrates, and vascular plants are absent entirely. Thus, these indicators are not perfect representations of change in all of Scotland’s biodiversity and have considerable biases; they are, however, the best possible based upon current knowledge.
The source data and statistical methods for creating these indicators are discussed in detail in the technical report describing the development of this indicator (Eaton et al. 2021).
In brief, each indicator is the geometric mean of multiple species’ trends (in either abundance or occupancy) for as many species of terrestrial and marine species for which Scottish-specific trends were available. The indicators are created using a new hierarchical modelling method for calculating multi-species indicators within a state-space formulation (Freeman et al. 2020), which offers some advantages over the more traditional geometric mean method. The method is robust, precise, adaptable to different data types, and can cope with the issues often presented by biological monitoring data, such as varying start dates of datasets and missing values. Species’ trends are entered into the indicators without weighting and each species has an equal impact upon the average indicator value.
Data on individual species came from a variety of sources, principally:
- Abundance-based data generated by well-established national monitoring schemes. For a few species of birds and moths, trends were available from more than one source. In such cases we have identified a hierarchy for identifying the most suitable trend for incorporation. Marine fish data came from long-term sampling programmes for deepwater and demersal fish.
- Occupancy-based metrics using more ad hoc presence-only biological records. Following several years of development and refinement of methods to produce such trends at the UK scale (e.g. Outhwaite et al. 2018), trends for the UK’s four constituent countries have been produced by the UK Centre for Ecology and Hydrology (UKCEH; previously the CEH). Whilst the production of such trends at a smaller (national-level) spatial scale means a reduction in sample size and a consequent reduction in the number of species for which sufficiently robust trends can be derived, this work presents a step change in the ability to report upon Scotland’s biodiversity. For Scotland 2,466 species have sufficient data to be included in an indicator.
Change in the indicators is reported over two periods; the long-term change since the start year of the indicator, and single-year change between the penultimate and final year of the sequence. Long-term changes were assessed by whether the values for the start and end year were statistically significantly different. Where the final year for indicators differs, the last year for which all indicators are available is used for comparison purposes. To measure whether single year changes were meaningful, we have applied percentage thresholds informed by previous variation in the indicator, and the measurement error around the indicator.
- The single-year change in the marine (seabird) indicator will be regarded as increasing if the final value is 5% greater than that for the penultimate year; decreasing if the final value is 5% lower; otherwise stable.
- The single-year change in the terrestrial abundance indicator will be regarded as increasing if the final value is 6% greater than that for the penultimate year; decreasing if the final value is 6% lower; otherwise stable.
- The single-year change in the terrestrial occupancy indicator will be regarded as increasing if the final value is 1% greater than that for the penultimate year; decreasing if the final value is 1% lower; otherwise stable.
Data for the indicators comes from a wide range of recording and monitoring schemes, as follows:
Marine abundance indicator: Seabird Monitoring Programme; ICES International Bottom Trawl Survey; Marine Scotland Science Deepwater Trawl Survey.
Terrestrial abundance indicator: BTO/JNCC/RSPB Breeding Bird Survey; Rare Breeding Birds Panel; BTO/JNCC/RSPB Wetland Bird Survey; Statutory Conservation Agency and RSPB Annual Breeding Bird Scheme; National Bat Monitoring Programme; UK Butterfly Monitoring Scheme; Rothamsted Insect Survey.
Terrestrial occupancy indicator: occupancy trends were derived from data held from the Biological Records Centre at the UK Centre for Ecology and Hydrology, submitted from a wide range of recording schemes and societies, namely: Aquatic Heteroptera Recording Scheme; Bees, Wasps and Ants Recording Society; British Arachnological Society - Spider Recording Scheme; British Bryological Society; British Lichen Society; British Myriapod and Isopod Group - Millipede Recording Scheme & Centipede Recording Scheme; Conchological Society of Great Britain and Ireland; Cranefly Recording Scheme; Empididae, Hybotidae & Dolichopodidae Recording Scheme; Fungus Gnat Recording Scheme; Gelechiid Recording Scheme; Grasshopper Recording Scheme; Ground Beetle Recording Scheme; Lacewings and Allies Recording Scheme; National Moth Recording Scheme; Riverfly Recording Schemes: Ephemeroptera; Riverfly Recording Schemes: Plecoptera; Riverfly Recording Schemes: Trichoptera; Soldier Beetles, Jewel Beetles and Glow-worms Recording Scheme; Soldierflies and Allies Recording Scheme; Staphylinidae Recording Scheme; Terrestrial Heteroptera Recording Schemes; UK Ladybird Survey; Weevil and Bark Beetle Recording Scheme.
The great majority of the contributing data sources above are collected through the efforts of expert and dedicated volunteer surveyors and recorders, without whom our knowledge of biodiversity in Scotland would be much poorer, and this indicator would not be possible.
This is an Experimental Official Statistics publication for Scotland and we would welcome comments and feedback. Please contact [email protected].
References
ASC (2017) UK Climate Change Risk Assessment 2017 Evidence Report, Summary for Scotland. Adaptation Sub-Committee of the Committee on Climate Change, London.
Burns, F. et al. (2016) Agricultural Management and Climatic Change Are the Major Drivers of Biodiversity Change in the UK. PLoS One. Available online.
Burton, V. et al. (2018) Reviewing the evidence base for the effects of woodland expansion on biodiversity and ecosystem services in the United Kingdom. Forest Ecology and Management, 430: 366-379. Available online.
Carrol, M. et al. (2017) Kittiwake breeding success in the southern North Sea correlates with prior sandeel fishing mortality. Aquatic Conservation, 27: 1164-1175. Available online.
Dulvy, N.K. et al. (2014). Extinction risk and conservation of the world’s sharks and rays. Elife, 3: e00590. Available online.
Eaton, M.A. et al. (2021) Development of a combined marine and terrestrial indicator for Scotland. Available online.
Fox, R. et al. (2015). The state of the UK’s Butterflies. Butterfly Conservation and the Centre for Ecology and Hydrology, Wareham, Dorset.
Freeman, S. et al. (2020) A Generic Method for Estimating and Smoothing Multispecies Biodiversity Indicators Using Intermittent Data. Journal of Agricultural, Biological and Environmental Statistics. 26. Available online.
GB Non-native species secretariat (2017). GB Non-native species report card 2017.
Gillings, S. et al. (2015) Directionality of recent bird distribution shifts and climate change in Great Britain. Global Change Biology, 21: 2155-2168. Available online.
IPBES (2019). Global assessment report on biodiversity and ecosystem services of the Intergovernmental Science-Policy Platform on Biodiversity and Ecosystem Services. IPBES secretariat, Bonn, Germany. IPBES Global Assessment online
JNCC (2020). UK Biodiversity Indicator B6 – Pressure from Invasive Species
Main, C.E. et al. (2019). Scaling down (cliffs) to meet the challenge: the Shiants’ black rat eradication. In Veitch, C.R. et al. Island invasives: scaling up to meet the challenge. Proceedings of the international conference on island invasives 2017: 138-146. IUCN, Gland, Switzerland.
Marine Climate Change Impacts Partnership (2020). Marine Climate Change Impacts Report Card 2020.
Martay, B. and Noble, D. 2022. Scoping the feasibility of developments to the Terrestrial Bird Indicator for Scotland – urban, farmland and wetland indicators. NatureScot Research Report 1300.
(Mindel et al. (2018). Size-based indicators show depth-dependent change over time in the deep sea. ICES Journal of Marine Science, 75: 113–121. Available online
Montero-Serra, I. (2015) Warming shelf seas drive the subtropicalization of European pelagic fish communities. Global Change Biology, 21: 144-153 Available online
NatureScot (2020a) Scottish Biodiversity Indicator S005 - Abundance of Breeding Seabirds 1986-2017
NatureScot (2020b). Terrestrial Insect abundance - butterflies
NatureScot (2021). Official Statistics for Terrestrial Breeding Birds 1994-2019
Outhwaite, C.L. et al. (2018) Prior specification in Bayesian occupancy modelling improves analysis of species occurrence data. Ecological Indicators, 93: 333-343. Available online
Outhwaite, C.L. et al. (2020). Complex long-term biodiversity change among invertebrates, bryophytes and lichens. Nat Ecol Evol., 4: 384–392 Available online
Pakeman, R.J. et al. (2019) Using species records and ecological attributes of bryophytes to develop an ecosystem health indicator. Ecological Indicators, 104: 127-136, Available online
Pakeman, R.J., O’Brien, D., Genney, D. and Brooker, R.W. 2022. Identifying drivers of change in bryophyte and lichen species occupancy in Scotland. Ecological Indicators, 139. Available online
Perkins, A. et al. (2011). Adaptive management and targeting of agri‐environment schemes does benefit biodiversity: a case study of the corn bunting Emberiza calandra. J. Appl. Ecol., 48: 514-522. Available online
Randle, Z. et al. (2019) Atlas of Britain and Ireland’s Larger Moths. Butterfly Conservation, Wareham, Dorset.
Scottish Government (2020) Cleaner Air for Scotland 2: environmental report.
Scottish Natural Heritage (2019) Trends of Moths in Scotland.
Towns, D.R. et al. (2011). Impacts of introduced predators on seabirds. In Mulder, C.P.H. et al. Seabird Islands: Ecology, Invasion, and Restoration. Oxford University Press, New York.
van der Kooij, J. et al. (2016). Climate change and squid range expansion in the North Sea. Journal of Biogeography, 43: 2285-98. Available online
Walton, P. et al. (2019). The State of Nature Scotland 2019. The State of Nature partnership.
Wilkinson, N.I. et al. (2012). Agri-environment management for corncrake Crex crex delivers higher species richness and abundance across other taxonomic groups. Agriculture, Ecosystems & Environment. 155. 27–34. Available online
