Indicators and Trends of Moths in Scotland
Published: 2021
Introduction
Moths play an important role in telling us about the health of our environment, since they are widespread and found in many different habitats, and have high sensitivity to environmental changes. Their value as part of the food chain, and in providing pollination services as well as in providing cultural services, make them useful indicator species.
Monitoring their numbers and distribution can provide clues to changes in the environment, such as the effects on wildlife of new farming practices, pesticides, air pollution and climate change.
This report updates the indicators and trends for moths in Scotland previously published in 2019 (Scottish Natural Heritage, 2019 and Dennis et al. 2019). Using the latest data available, the abundance indicator is updated to 2018 using data from an additional four years. The distribution indicator is updated to 2016 using records from an additional two years. With increasing data availability, the number of species for which trends may be estimated also increases. Overall patterns of change found previously for moths in Scotland continue, with ongoing declines in moth abundance but increases in overall distribution/occupancy.
Key points
- Abundance and/or distribution trends are presented for 290 species (an additional 46 species compared to the 244 species contributing to the previous indicators).
- On average, moth abundance has declined by 29% since 1975, and has almost halved since 1990 (46% decline to 2018). Over the last 29 years, almost five times as many species have significantly decreased in abundance compared to species showing significant increases (87 vs 18 species).
- Short-term trends in the abundance indicator suggest that the decline detected in the previous indicator continues to deepen (25% decrease for 2009-2018, compared to 16% decrease for 2005-2014).
- A multi-species indicator for moth distribution change shows that moth occupancy has increased by 16% for 1990-2016, with almost twice as many species significantly increasing than significantly decreasing in distribution (78 vs 41 species). Short-term change suggests that overall increases in occupancy continue (9% increase for 2007-2016).
- Differences between species’ changes in abundance and distribution may be explained by opposing influences of climate facilitating species’ range expansions, whilst for some species this is countered by negative impacts from habitat changes and land management practices which may be driving population declines.
- The species for which it was possible to produce trends are typically common and widespread species, whereas rare and range-restricted species are underrepresented due to a lack of sufficient data for the analysis methods used. However, Butterfly Conservation has recently instigated a programme of work to improve the monitoring of rare moths in Scotland to fill this gap.
Changes in Scottish moths - Abundance trends
The composite indicator (based on 254 species) of moth abundance shows a significant decline of 29% over the 44-year period (1975-2018) and a significant decline of 46% for 1990-2018. This pattern of decline corresponds with a recent assessment, which estimated a 22% decrease in the total abundance of larger moths in northern Britain for 1968-2017 (State of Britain’s Larger Moths Report – Fox et al. 2021).
Multi-species indicator of change in abundance of moths in Scotland for 1975-2018, with 95% confidence interval, and smoothed indicator shown in red. The indicator is scaled with respect to a 1990 baseline year.
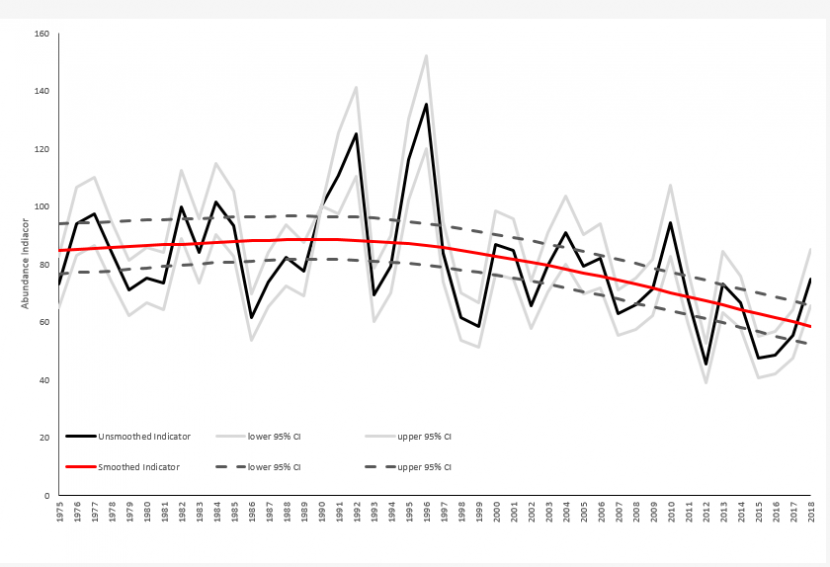
Figure 1: On average, moth abundance increased in the early half of the series (35% increase for 1975-1996), with the decline mostly in the latter half of the series (24% decrease for 1997-2018).
Click for a full description
In the shorter-term, moth abundance declined significantly by 25% from 2009-2018, suggesting a continuing decline, with the previous indicator showing a 16% decline for 2005-2014.
Over the long, medium and short-term, more species showed decreases in abundance than increases (59% of species showed negative change for 1975-2018, Figure 2; 70% for 1990-2018; 57% for 2009-2018). Focusing on species with significant trend estimates, 88 species (35% of the total) showed declines over the 44-year period, whereas 55 species (22%) of species had increased in abundance. Similarly, for the medium-term (1990-2018), 87 species (34%) showed decreases compared to 18 species (7%) with increases.
Long-term abundance trends for 254 species of moths in Scotland.
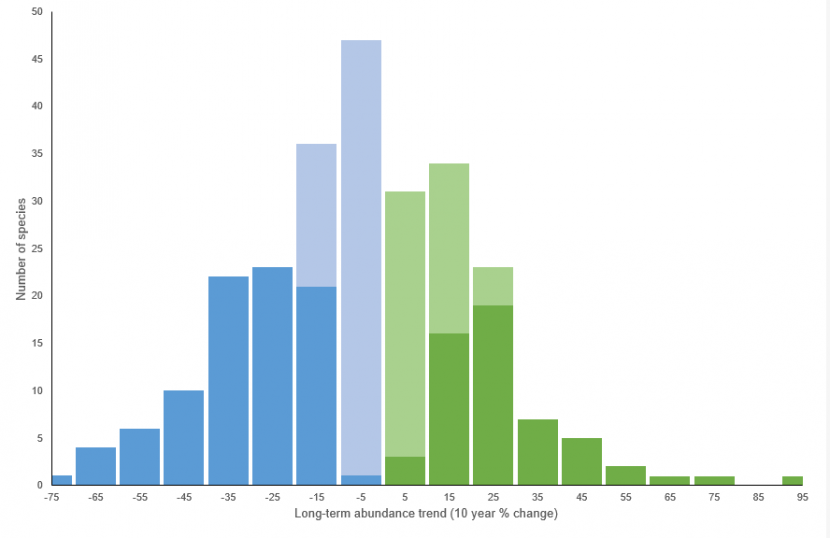
Figure 2: The species’ abundance changes are presented as the average 10-year rate of change across the period assessed, which varies from 33–44 years depending on the species.
Click for a full description
Statistically significant trends are shown in darker shades and non-significant trends in paler shades.
Changes in Scottish Moths – Distribution trends
The multi-species indicator based upon NMRS data for 253 species shows a significant increase of 16% for 1990-2016, as well as in the shorter-term (9% increase for 2007-2016).
Multi-species indicator of change in distribution (occupancy) of moths in Scotland for 1990-2016, with 95% confidence interval, and smoothed indicator shown in red. The indicator is scaled with respect to a 1990 baseline year.
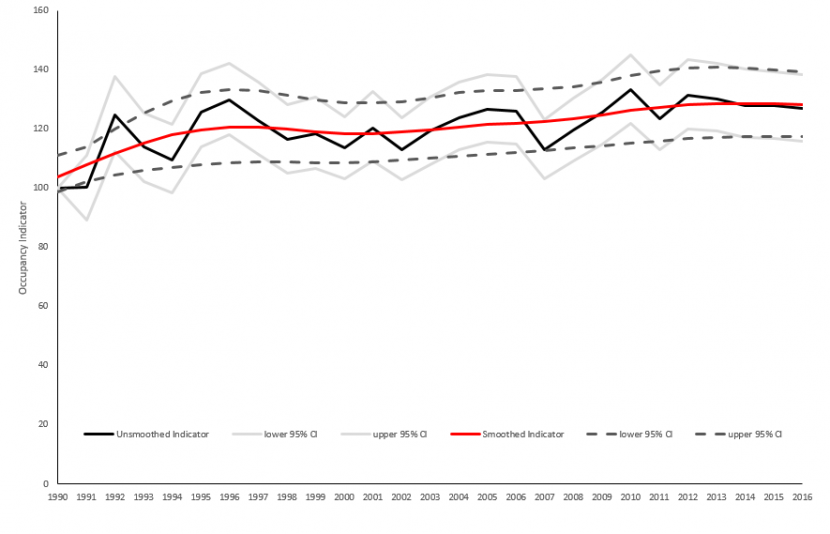
Figure 3: Over the medium and short-term, slightly more species showed increases in distribution than decreases (57% of species showed positive change for 1990-2016, Figure 4 and 62% for 2007-2016).
Click for a full description
For both time periods assessed, most species’ changes in distribution were not significant, but focusing on species with significant trend estimates, 78 species (31% of the total) showed increases over the 27-year period, whereas 41 species (16%) of species had decreased in distribution. Similarly, for the short-term (2007-2016), 31 species (12%) showed increases compared to 20 species (8%) with decreases.
Medium-term distribution trends for 253 species of moths in Scotland.
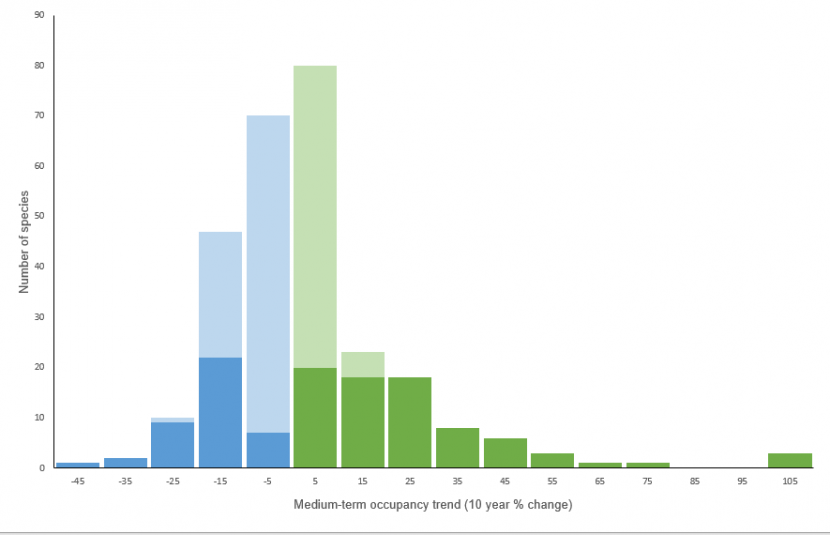
Figure 4: The species’ abundance changes are presented as the average 10-year rate of change across the period assessed (1990-2016).
Click for a full description
Statistically significant trends are shown in darker shades and non-significant trends in paler shades.
Drivers of change
Further research is needed to understand the drivers of recent changes in moth populations in Scotland. Habitat loss and degradation is likely to be a key driver of declines in moths in Britain (Fox, 2013). Changes in Scotland which may have negatively influenced moth populations include: commercial afforestation and associated drainage of blanket peat bog; decline in mixed farming; loss/declining quality of semi-natural grassland and moorland through liming, fertilizing, reseeding and overgrazing by livestock; increased extent of built land; loss of broad-leaved and mixed woodland habitat; increased deer grazing pressure and the greater fragmentation and isolation of semi-natural habitats. Climate change is likely to be a principal driver of species range expansions, but there is also evidence of negative impacts for some species (Fox et al. 2021). Artificial light at night has been shown to have diverse effects on various aspects of moth life cycles, but there is so far limited evidence linking artificial light to population-level changes (Fox et al. 2021).
Focus on species
In Scotland the Brindled Ochre (Dasypolia templi) is an upland species, particularly on moorlands in the east. Its long-term decline in both abundance and distribution is continuing. Its abundance fell 62% between 1975 and 2018 while its distribution fell 39% between 1990 and 2016.
In contrast the Frosted Orange (Gortyna flavago), a widespread species of rough grasslands, woodlands, and gardens, whilst stable in the rest of the UK, is expanding in Scotland. This species increased in abundance by 506% between 1975 and 2018 and increased in distribution by 135% between 1990 and 2016.
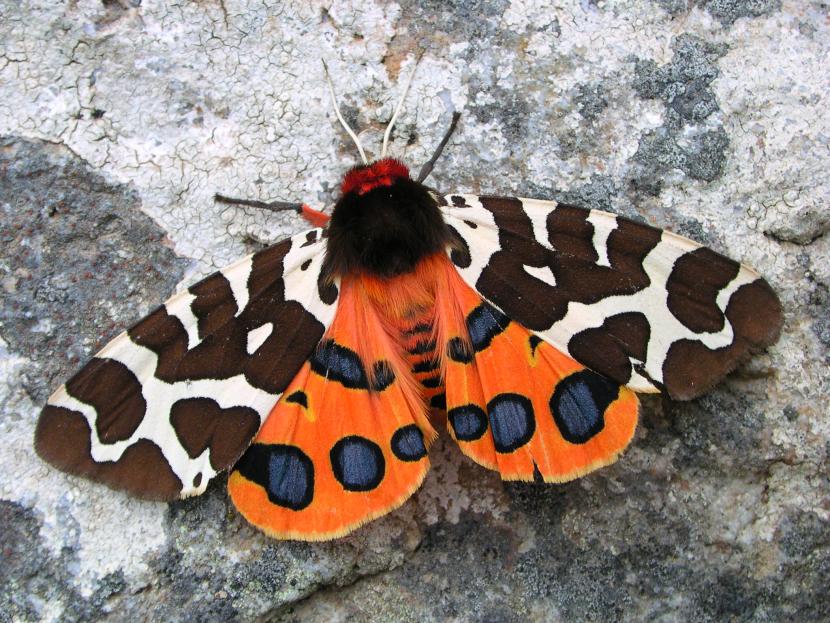
The distribution of Garden Tiger (Arctia caja) in Scotland is stable, but its numbers (abundance) have been falling for a long time, (85% decline between 1975 and 2018) with an increase in warm, wet winters due to climate change believed to be driving this decline.
Data sources and methods
Abundance data
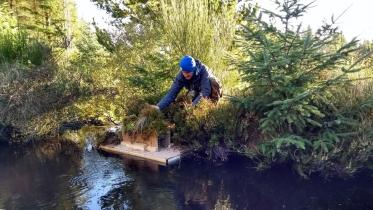
The Rothamsted Insect Survey (RIS) monitors nocturnal moth populations through a UK-wide network of standardised and automated light-traps that operate every night of the year (Storkey et al. 2016). Across the RIS network in Scotland, 527 species were recorded from 73 sites for the period 1975-2018, where 1975 was taken as the baseline year based on previous moth indicators for Scotland (Scottish Natural Heritage, 2019 and Dennis et al. 2019). Updated data were available for an additional four years (2015-2018), compared to the previous indicator. Abundance trends and indicators were produced using the same methodology as the previous moth indicator produced for Scotland (Scottish Natural Heritage, 2019), which is described in detail in Dennis et al. (2019). Any traps monitored in only a single year were excluded hence data from 66 traps were used in the analysis.
Abundance trends were calculated for 254 moth species identified as having sufficient data for trend analysis. This was based on having a total count of at least 250 individuals and, where a trend of large magnitude (>250%) was estimated, being counted on at least five sites in more than 20 years (Scottish Natural Heritage, 2019 and Dennis et al. 2019). In most cases the trends cover 1975-2018, but a shorter period (1986-2018) was taken for 12 species, following the approach taken in Randle et al. (2019) and Fox et al. (2021), to account for identification issues. Due to increased data availability, abundance trends were produced for a further 78 species compared to the previous indicator (Scottish Natural Heritage, 2019).
Distribution data
Species’ occurrence records for macro-moths in Scotland were obtained from the National Moth Recording Scheme database, which were collated from recording by volunteer observers. For Scotland, ~1.4 million records for 1970-2016, consisting of 545 species, were available from 12,106 1-km grid squares. This reflects the addition of approximately 225,000 records and enables the previous distribution indicator to be updated by a further two years (2015-2016).
Following the approach used in the previous moth indicator produced for Scotland (Scottish Natural Heritage, 2019 and Dennis et al. 2019), occupancy models were used to produce species distribution indices and trends which were then combined to produce an indicator. This indicator is again produced from a baseline year of 1990. For 1990-2016, ~1.1 million records were available for 538 species from 11,731 1-km grid squares.
Distribution trends are presented for 253 moth species which were identified as having sufficient data for trend analysis, based on criteria described in Dennis et al. (2019): being first recorded before 1995, recorded in at least 15 years of the 27 year period, and having an average of at least 30 records per year. Some species were also omitted or reduced to aggregate level due to their potential for misidentification, following the approach of Randle et al. (2019). Unlike in Dennis et al. (2019), initial filtering of species based on a list used in Fox et al. (2014) was not undertaken, but instead species taxonomy follows that of Randle et al. (2019). Due to increased data availability, distribution trends were produced for a further 23 species compared to the previous indicator (Scottish Natural Heritage, 2019).
Acknowledgements
The Rothamsted Insect Survey, a National Capability, is funded by the Biotechnology and Biological Sciences Research Council under the Core Capability Grant BBS/E/C/000J0200. We thank the staff and the many volunteers who have tirelessly contributed to the light-trap network. We thank all the recorders who contribute to the National Moth Recording Scheme. The National Moth Recording Scheme is funded by Butterfly Conservation and Natural England.
References
Dennis, E.B., Brereton, T.M., Morgan, B.J.T., Fox, R., Shortall, C.R., Prescot, T. & Foster, S. (2019). Trends and indicators for quantifying moth abundance and occupancy in Scotland. Journal of Insect Conservation, 23, 369–380.
Fox, R. (2013). The decline of moths in Great Britain: a review of possible causes. Insect Conservation and Diversity, 6, 5-19.
Fox, R., Parsons, M.S., Chapman, J.W., Woiwod, I.P., Warren, M.S. & Brooks, D.R. (2013). The State of Britain’s Larger Moths 2013. Butterfly Conservation and Rothamsted Research, Wareham, Dorset, UK.
Fox, R., Oliver, T.H., Harrower, C., Parsons, M.S., Thomas, C.D. & Roy, D.B. (2014). Long-term changes to the frequency of occurrence of British moths are consistent with opposing and synergistic effects of climate and land-use changes. Journal of Applied Ecology, 51, 949–957.
Fox, R., Dennis, E.B., Harrower, C.A., Blumgart, D., Bell, J.R., Cook, P., Davis, A.M., Evans-Hill, L.J., Haynes, F., Hill, D., Isaac, N.J.B., Parsons, M.S., Pocock, M.J.O., Prescott, T., Randle, Z., Shortall, C.R., Tordoff, G.M., Tuson, D. & Bourn, N.A.D. (2021). The State of Britain’s Larger Moths 2021. Butterfly Conservation, Rothamsted Research and UK Centre for Ecology & Hydrology, Wareham, Dorset, UK.
Randle, Z., Evans-Hill, L.J., Parsons, M.S., Tyner, A., Bourn, N.A.D., Davis, A.M., Dennis, E.B., O’Donnell, M., Prescott, T., Tordoff G.M. & Fox, R. (2019). Atlas of Britain & Ireland’s Larger Moths. Pisces Publications, Newbury, UK.
Scottish Natural Heritage (2009). Biodiversity Indicator: S9 Terrestrial insect abundance—moths.
Scottish Natural Heritage (2019). Trend Note 018 - Trends of Moths in Scotland.
Storkey, J., Macdonald, A.J., Bell, J.R., Clark, I.M., Gregory, A.S., Hawkins, N.J., Hirsch, P.R., Todman, L.C. & Whitmore, A.P. (2016). The unique contribution of Rothamsted to ecological research at large temporal scales. In: A J. Dumbrell, R L. Kordas & G. Woodward, eds. Advances in ecological research (Vol. 55, pp. 3–42), Chapter 1. Cambridge: MA: Academic Press.
Published: 2021
Document downloads
Last updated: