Scottish Biodiversity Indicator – The Numbers and Breeding Success of Seabirds (1986 to 2019)
Published: 2021
Scotland’s breeding seabirds are of international importance. Seabirds are useful and important indicators for assessing the state of the marine environment (Parsons et al. 2008). Although they rely on the sea, breeding on land makes them relatively easy to monitor. They respond to a range of factors such as changes in food availability, weather, predation and pollution. Being relatively long lived the numbers of breeding seabirds usually changes slowly over time. Breeding success (the number of chicks produced) provides an indication of food availability (generally fish and other marine species) and other factors such as predation during the breeding season. Breeding success typically varies far more from year to year than breeding numbers.
Monitoring Scotland’s Seabirds
The indicators of breeding numbers for 11 species, and breeding success for 11 species, (totalling 15 species, out of the 24 that breed in Scotland). The results are estimates from a representative sample of seabird colonies around Scotland, monitored as part of the UK Seabird Monitoring Programme, which started in 1986.
Indicator Assessment
From the start of the time series in 1986 to the most recent estimate in 2019:
- The mean numbers of 11 species of breeding seabirds in Scotland declined. By 2019, breeding numbers were 49% of the 1986 level.
- Mean breeding success of 11 breeding seabird species has fluctuated. In 2019, it was 6 percentage points higher than the long-term average of 75%.
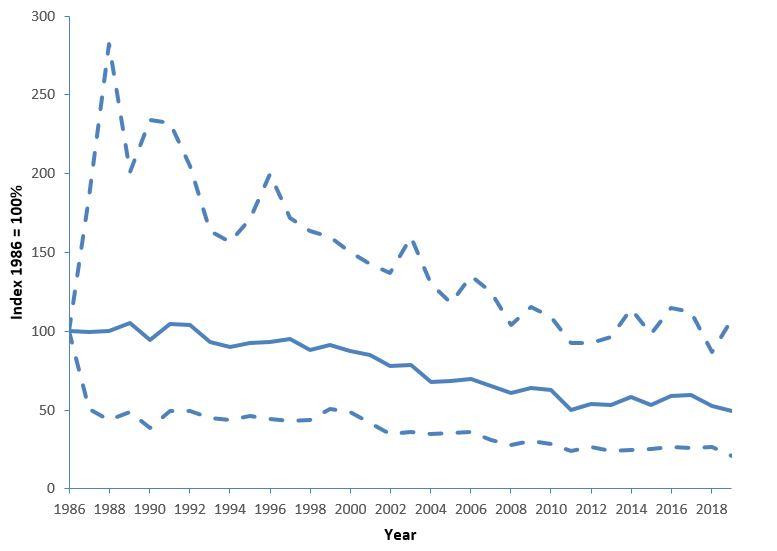
Figure 1: Seabird breeding numbers (1986 to 2019).
Click for a full description
The dashed line shows the 95% confidence limits.
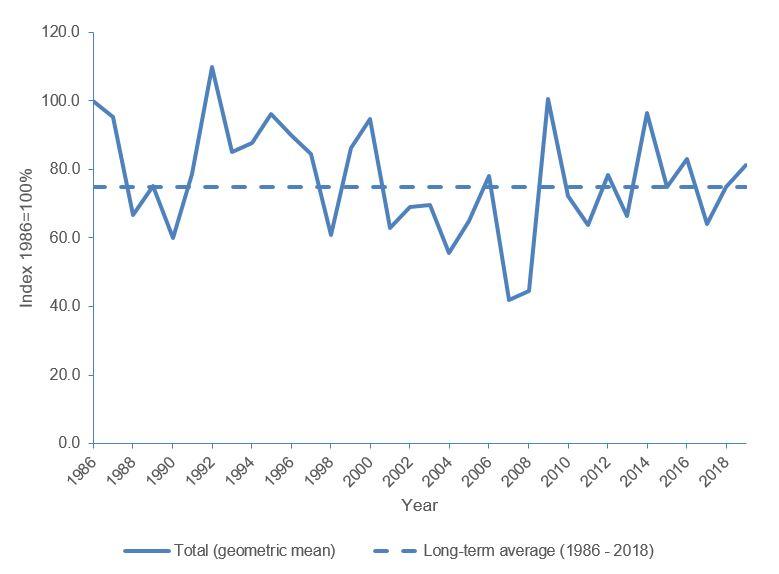
Figure 2: Seabird breeding success in Scotland (1986 to 2019).
Click for a full description
The dashed line shows the long-term average breeding success combined for all 11 species (1986 to 2018).
Reasons for Change
Overall Scotland’s seabirds have declined since 1986. The key drivers of change are fisheries, climate change and invasive non-native species. To a lesser extent, pollutants and offshore renewables may present some threats to seabirds. Work to develop the Scottish Seabird Conservation Strategy has provided information on the pressures and threats that Scotland’s seabirds face. This work is in progress and as it develops, it will help secure the future for Scotland’s seabirds.
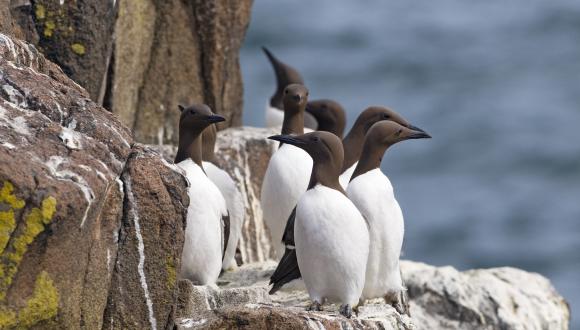
Breeding Numbers
Out of the 11 species assessed for breeding numbers from 1986 to 2019, Arctic skua continues to show the largest declines (81%). Reductions in the availability of sandeels and the effects this has upon species such as black-legged kittiwake is understood to be one to the main factors affecting Arctic skua. Increased predation from great skuas has also been linked to their decline (Perkins et al. 2018). Common terns have shown a sharp decline in 2019 to 48%. The number of terns attempting to breeding at sites can vary markedly from year to year (Ratcliffe, 2004), so to understand whether this is a trend future years of results are required. Guillemot numbers are increasing 17% since 2016. They are now at a similar level to the early 2000s. A number of our seabirds appear to be stabilising at lower levels than the 1986 baseline year. Early research indicates that for some species, for example herring gull, this may be reverting to typical levels prior to 1986 (Foster et al. 2017).
Breeding success
Breeding numbers typically change more slowly than breeding success and looking at breeding success helps us understand some of the immediate factors that cause changes in seabird numbers, such as food availability, weather events and predation. The 2019 results show that breeding success was higher than the long-term average. There was a mixed picture across the 11 species assessed. Arctic skua, Atlantic puffin, black-legged kittiwake and herring gull breeding success was higher in 2019 compared to their long-term averages. Great skua and Arctic tern breeding success was lower than the long-term average. For the remaining species, breeding success was around the long-term average.
Source data and updates
The indicator has been updated with data up to and including 2019. The trend for breeding numbers is based on 11 species and the breeding success trend on the 11 species for which sufficient data are available. Data are derived from the UK Seabird Monitoring Programme (SMP) and its partners. The SMP collects and collates data on breeding numbers, demographic parameters (including breeding success and survival rate), and diet from a sample of colonies around the UK. The data confidence has been reduced to medium as it is over fifteen years since the last national census. The census provides an accurate snapshot of seabird breeding numbers and allows us to benchmark the annual colony counts.
Updates are provided annually and the data are available from JNCC. Due to restricted fieldwork undertaken in 2020, the next update will be available in 2022 using data from 2021.
UK Indicators
JNCC reports on seabird population trends as an Official Statistic. As Scotland supports the majority of UK breeding seabirds, the UK trend is heavily influenced by trends in Scotland. Seabird abundance in the UK increased between 1970 and 1999 and has since declined.
References
Foster, S., Swann, R.L., and Furness, R.W. 2017. Can changes in fishery landings explain long-term population trends in gulls? Bird Study, 64, 90-97.
Parsons, M., Mitchell, I., Butler, A., Ratcliffe, N., Frederiksen, M., Foster, S., and Reid, J. B. 2008. Seabirds as indicators of the marine environment. ICES Journal of Marine Science, 65, 1520-1526.
Perkins, A., Ratcliffe, N., Suddaby, D. Ribbands, B., Smith, C., Ellis, P., Meek, E., and Bolton, M. 2018.Combined bottom‐up and top‐down pressures drive catastrophic population declines of Arctic skuas in Scotland. Journal of Animal Ecology. 87, 1573-1586.
Ratcliffe, N. 2004. Common Tern in Seabird Populations of Britain and Ireland: results of the Seabird 2000 Census (1998-2002). P. Ian Mitchell, Stephen F. Newton, Norman Ratcliffe and Timothy E. Dunn (Eds.). Published by T and A.D. Poyser, London.
| Species (link to JNCC SMP) | Breeding Numbers | Breeding Success |
|---|---|---|
|
Yes |
Yes |
|
|
Yes |
Yes |
|
|
No |
Yes |
|
|
Yes |
No |
|
|
Yes |
Yes |
|
|
Yes |
No |
|
|
Yes |
Yes |
|
|
Yes |
No |
|
|
Yes |
No |
|
|
No |
Yes |
|
|
Yes |
Yes |
|
|
Yes |
Yes |
|
|
No |
Yes |
|
|
Yes |
Yes |
|
|
No |
Yes |
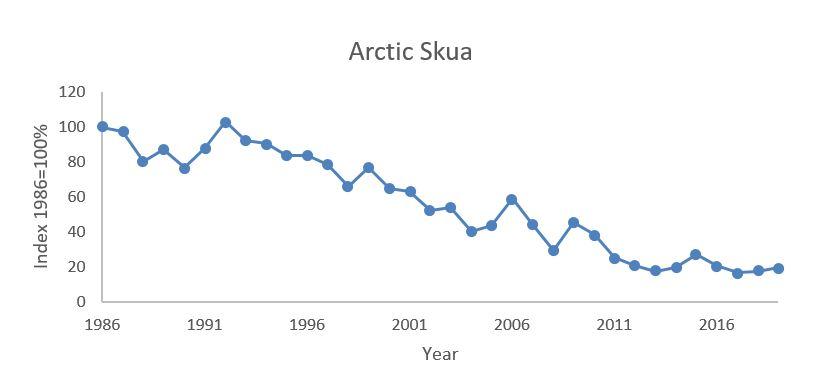
Figure 3: Arctic Skua - Breeding Numbers (1986-2018)
Click for a full description
The graph shows the declining trend in Arctic skua breeding numbers.
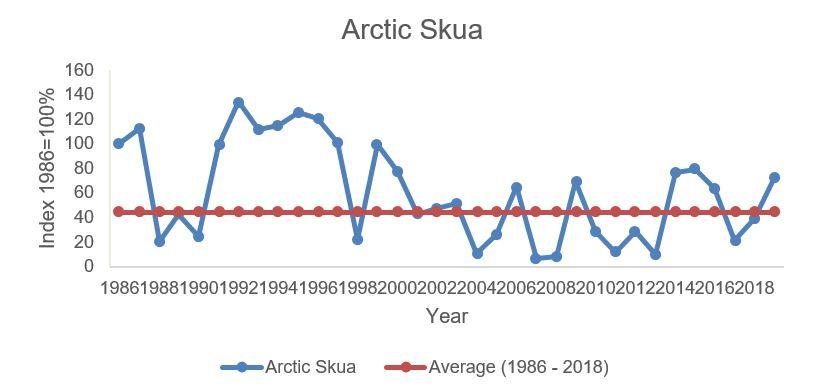
Figure 4: Arctic Skua - Breeding Success Average (1986-2018)
Click for a full description
The graph shows the fluctuating trend for Arctic skua breeding success. Breeding success in 2019 was higher than the long-term average.
| Key Pressures and threats | Arctic Skua |
|---|---|
|
Bycatch surface |
Low |
|
Bycatch pelagic |
Medium |
|
Bycatch demersal |
Low |
|
Bycatch aqua-culture |
Low |
|
Wind turbine collision mortality |
Medium |
|
Displacement by wind turbines |
Medium |
|
Wind turbines as a barrier to species movement |
Low |
|
Mortality by collision with underwater turbines etc |
Low |
|
Habitat loss from coastal infrastructure |
Low |
|
Marine litter |
High |
|
invasive predatory mammals |
High |
|
Reduction in prey by fishing |
High |
|
Disturbance from recreation, tourism and transport |
Medium |
|
Intentional taking of adults/eggs |
Low |
|
synthetic contaminants |
Medium |
|
Mortality from oil contamination |
High |
|
non-synthetic contaminants) |
Medium |
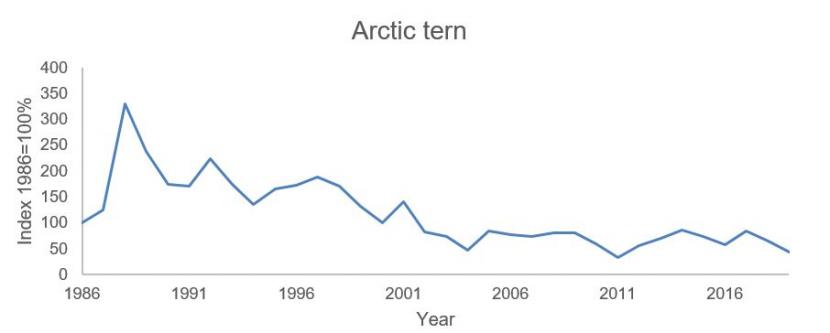
Figure 5: Arctic Tern – Breeding numbers and success (1986-2019)
Click for a full description
Graph showing Arctic tern breeding numbers.
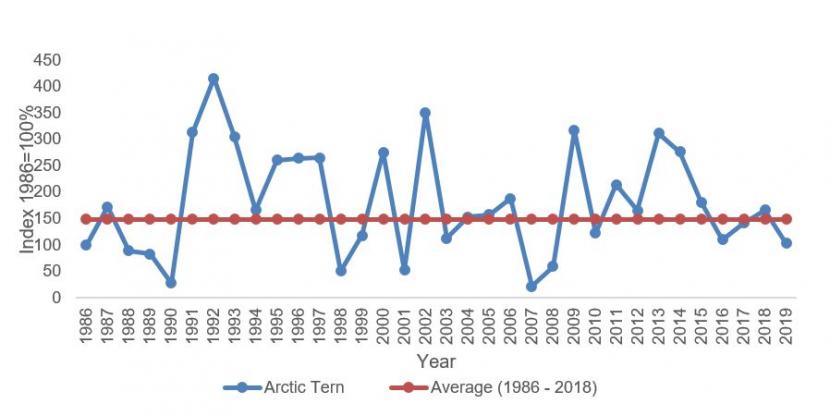
Figure 6: Arctic Tern - Breeding success Average (1986-2018)
Click for a full description
Graph showing Arctic tern breeding success.
| Key pressures and threats | Arctic Tern |
|---|---|
|
Bycatch surface |
Low |
|
Bycatch pelagic |
Low |
|
Bycatch demersal |
Low |
|
Bycatch aqua-culture |
Low |
|
Wind turbine collision mortality |
Medium |
|
Displacement by wind turbines |
Medium |
|
Wind turbines as a barrier to species movement |
Low |
|
Mortality by collision with underwater turbines etc |
Low |
|
Habitat loss from coastal infrastructure |
Low |
|
Marine litter |
High |
|
invasive predatory mammals |
High |
|
Reduction in prey by fishing |
High |
|
Disturbance from recreation, tourism and transport |
Medium |
|
Intentional taking of adults/eggs |
Medium |
|
synthetic contaminants |
High |
|
Mortality from oil contamination |
High |
|
non-synthetic contaminants) |
Medium |
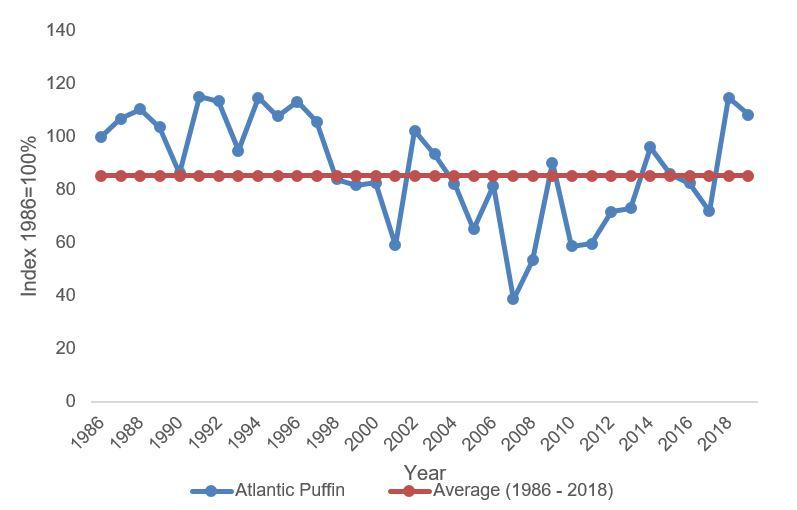
Figure 7: Atlantic Puffin - breeding success Average (1986-2018)
Click for a full description
Graph showing the trend in Atlantic puffin breeding success.
| Key pressures and threats | Atlantic Puffin- breeding | Atlantic Puffin – non breeding |
|---|---|---|
|
Bycatch surface |
High |
High |
|
Bycatch pelagic |
High |
High |
|
Bycatch demersal |
Medium |
Medium |
|
Bycatch aqua-culture |
Low |
Low |
|
Wind turbine collision mortality |
Low |
Low |
|
Displacement by wind turbines |
Medium |
Medium |
|
Wind turbines as a barrier to species movement |
High |
High |
|
Mortality by collision with underwater turbines etc |
High |
High |
|
Habitat loss from coastal infrastructure |
High |
Medium |
|
Marine litter |
High |
High |
|
invasive predatory mammals |
High |
NA |
|
Reduction in prey by fishing |
Low |
Low |
|
Disturbance from recreation, tourism and transport |
Medium |
Low |
|
Intentional taking of adults/eggs |
Low |
Low |
|
synthetic contaminants |
High |
High |
|
Mortality from oil contamination |
High |
NA |
|
non-synthetic contaminants) |
High |
High |
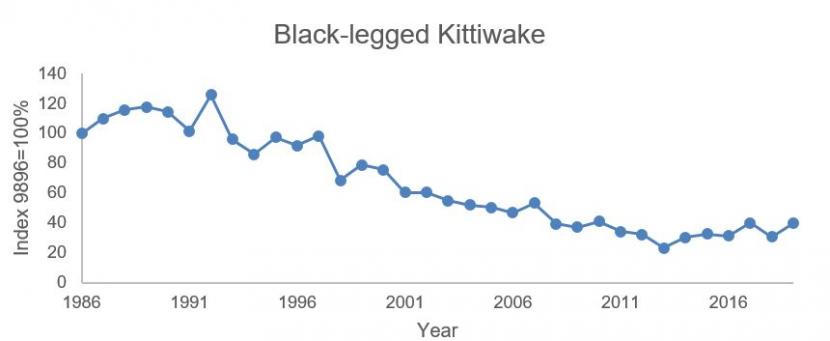
Figure 8: Black-legged Kittiwake - breeding numbers Average (1986-2018)
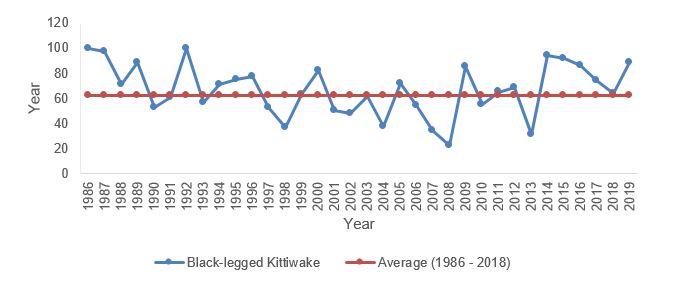
Figure 9: Black-legged Kittiwake - breeding success average (1986-2018)
Click for a full description
Graph showing trend of black-legged kittiwake breeding success.
| Key pressures and threats | Black-legged Kittiwake – breeding | Black-legged Kittiwake – non-breeding |
|---|---|---|
|
Bycatch surface |
Medium |
Medium |
|
Bycatch pelagic |
Medium |
Medium |
|
Bycatch demersal |
Low |
Low |
|
Bycatch aqua-culture |
Low |
Low |
|
Wind turbine collision mortality |
Medium |
Medium |
|
Displacement by wind turbines |
High |
High |
|
Wind turbines as a barrier to species movement |
Low |
Low |
|
Mortality by collision with underwater turbines etc |
High |
High |
|
Habitat loss from coastal infrastructure |
High |
High |
|
Marine litter |
High |
High |
|
invasive predatory mammals |
Low |
NA |
|
Reduction in prey by fishing |
High |
High |
|
Disturbance from recreation, tourism and transport |
High |
High |
|
Intentional taking of adults/eggs |
Low |
Low |
|
synthetic contaminants |
High |
Medium |
|
Mortality from oil contamination |
High |
High |
|
non-synthetic contaminants) |
Medium |
Medium |
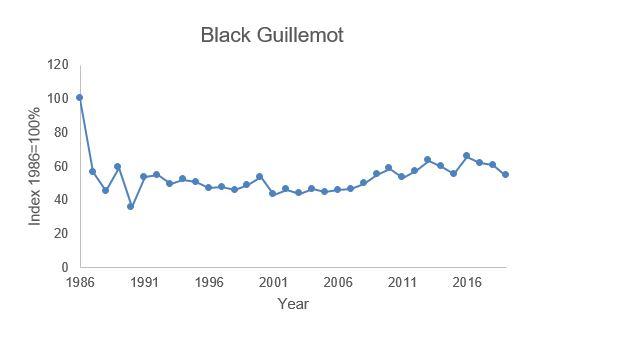
Figure 10: Black Guillemot - breeding numbers
Click for a full description
Graph showing trend in black guillemot numbers.
| Key pressures and threats | Black Guillemot |
|---|---|
|
Bycatch surface |
High |
|
Bycatch pelagic |
Low |
|
Bycatch demersal |
Medium |
|
Bycatch aqua-culture |
High |
|
Wind turbine collision mortality |
Low |
|
Displacement by wind turbines |
Low |
|
Wind turbines as a barrier to species movement |
Medium |
|
Mortality by collision with underwater turbines etc |
Medium |
|
Habitat loss from coastal infrastructure |
Medium |
|
Marine litter |
Medium |
|
invasive predatory mammals |
High |
|
Reduction in prey by fishing |
NA |
|
Disturbance from recreation, tourism and transport |
Medium |
|
Intentional taking of adults/eggs |
NA |
|
synthetic contaminants |
NA |
|
Mortality from oil contamination |
High |
|
non-synthetic contaminants) |
High |
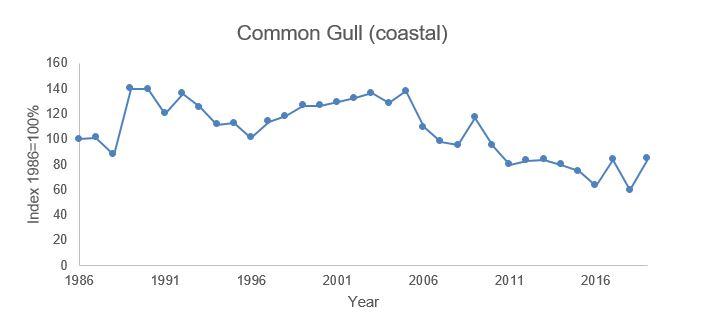
Figure 11: Common Gull - breeding numbers
Click for a full description
Graph showing trend in coastal breeding common gull numbers.
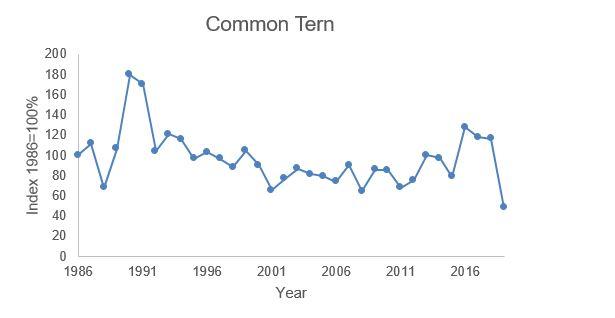
Figure 12: Common tern - breeding numbers
Click for a full description
Graph showing trend in common tern breeding numbers.
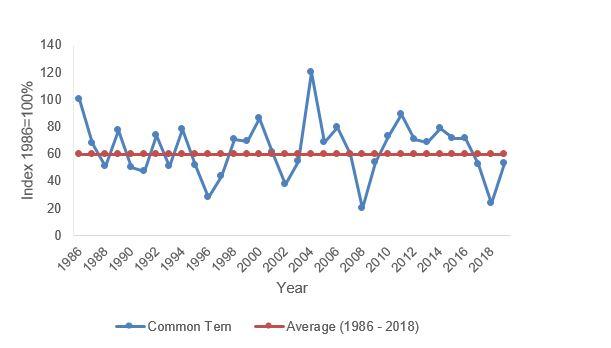
Figure 13: Common tern - breeding success
Click for a full description
Graph showing trend in common tern breeding success.
|
Key pressures and threats |
Common Tern |
|---|---|
|
Key pressures and threats |
Common Tern |
|
Bycatch surface |
Low |
|
Bycatch pelagic |
Low |
|
Bycatch demersal |
Low |
|
Bycatch aqua-culture |
Low |
|
Wind turbine collision mortality |
Medium |
|
Displacement by wind turbines |
Medium |
|
Wind turbines as a barrier to species movement |
Low |
|
Mortality by collision with underwater turbines etc |
High |
|
Habitat loss from coastal infrastructure |
High |
|
Marine litter |
High |
|
invasive predatory mammals |
High |
|
Reduction in prey by fishing |
Low |
|
Disturbance from recreation, tourism and transport |
Medium |
|
Intentional taking of adults/eggs |
Low |
|
synthetic contaminants |
NA |
|
Mortality from oil contamination |
NA |
|
non-synthetic contaminants) |
High |
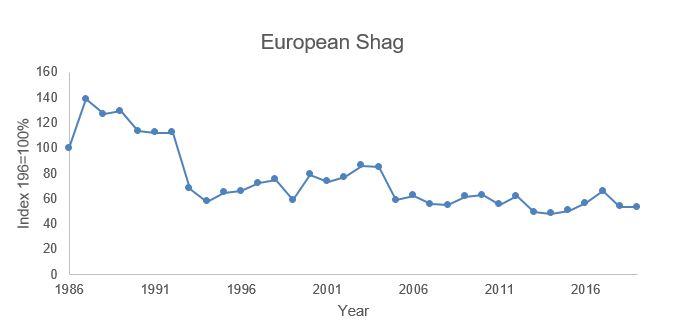
Figure 14: European Shag - breeding numbers
Click for a full description
Grahps showing the trend in European shag breeding numbers.
| Key pressures and threats | European Shag - breeding | European Shag – non-breeding |
|---|---|---|
|
Bycatch surface |
High |
High |
|
Bycatch pelagic |
Low |
Low |
|
Bycatch demersal |
High |
High |
|
Bycatch aqua-culture |
High |
High |
|
Wind turbine collision mortality |
Low |
Low |
|
Displacement by wind turbines |
Low |
Low |
|
Wind turbines as a barrier to species movement |
Low |
Low |
|
Mortality by collision with underwater turbines etc |
Medium |
Medium |
|
Habitat loss from coastal infrastructure |
High |
High |
|
Marine litter |
High |
High |
|
invasive predatory mammals |
Medium |
NA |
|
Reduction in prey by fishing |
High |
High |
|
Disturbance from recreation, tourism and transport |
Low |
Low |
|
Intentional taking of adults/eggs |
Low |
Low |
|
synthetic contaminants |
High |
High |
|
Mortality from oil contamination |
High |
High |
|
non-synthetic contaminants) |
High |
High |
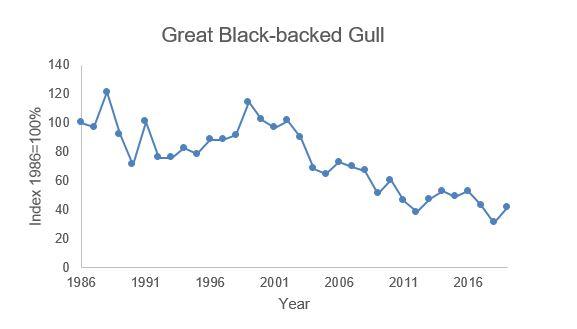
Figure 15: Great Black-backed Gull - breeding numbers
Click for a full description
Graph showing trend in breeding numbers for Great black-backed gull.
| Key pressures and threats | Great Black-backed Gull - breeding | Great Black-backed Gull – non-breeding |
|---|---|---|
|
Bycatch surface |
Medium |
Medium |
|
Bycatch pelagic |
Medium |
Medium |
|
Bycatch demersal |
Low |
Low |
|
Bycatch aqua-culture |
Low |
Low |
|
Wind turbine collision mortality |
Medium |
Medium |
|
Displacement by wind turbines |
Low |
Low |
|
Wind turbines as a barrier to species movement |
Low |
Low |
|
Mortality by collision with underwater turbines etc |
Low |
Low |
|
Habitat loss from coastal infrastructure |
Low |
Low |
|
Marine litter |
High |
High |
|
invasive predatory mammals |
Medium |
NA |
|
Reduction in prey by fishing |
Medium |
Medium |
|
Disturbance from recreation, tourism and transport |
Low |
Low |
|
Intentional taking of adults/eggs |
Low |
Low |
|
synthetic contaminants |
High |
High |
|
Mortality from oil contamination |
High |
High |
|
non-synthetic contaminants) |
High |
High |
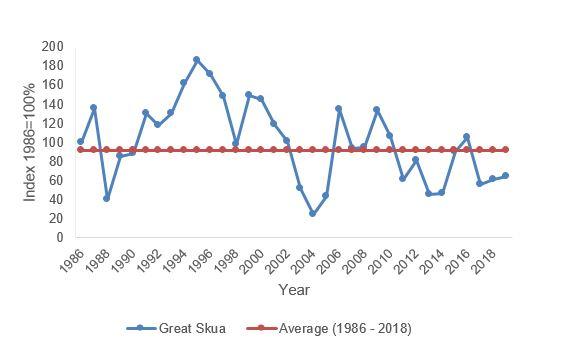
Figure 16: Great Skua - breeding success
Click for a full description
Graph showing trend in great skua breeding success.
| Key pressures and threats | Great skua – breeding | Great skua – non-breeding |
|---|---|---|
|
Bycatch surface |
Medium |
Medium |
|
Bycatch pelagic |
Medium |
Medium |
|
Bycatch demersal |
Low |
Low |
|
Bycatch aqua-culture |
Low |
Low |
|
Wind turbine collision mortality |
Low |
Low |
|
Displacement by wind turbines |
Medium |
Low |
|
Wind turbines as a barrier to species movement |
Low |
Low |
|
Mortality by collision with underwater turbines etc |
Low |
Low |
|
Habitat loss from coastal infrastructure |
Low |
Low |
|
Marine litter |
High |
High |
|
invasive predatory mammals |
High |
NA |
|
Reduction in prey by fishing |
Medium |
Medium |
|
Disturbance from recreation, tourism and transport |
Medium |
Low |
|
Intentional taking of adults/eggs |
Low |
Low |
|
synthetic contaminants |
High |
High |
|
Mortality from oil contamination |
High |
High |
|
non-synthetic contaminants) |
High |
High |
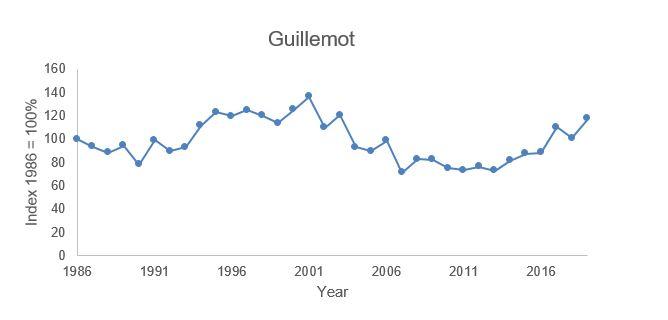
Figure 17: Common Guillemot - breeding numbers
Click for a full description
Graph showing trend in common guillemot breeding numbers.
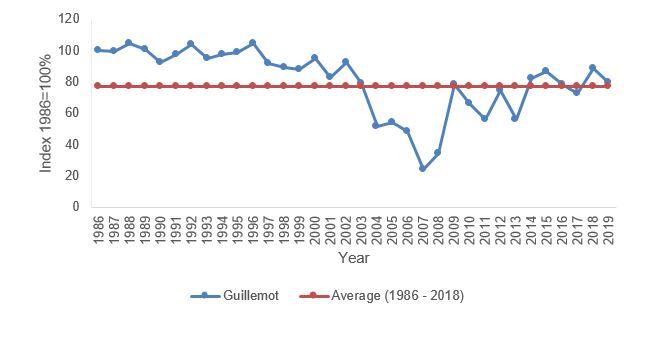
Figure 18: Common Guillemot - breeding success
Click for a full description
Graph showing trend in common guillemot breeding success.
| Key pressures and threats | Commom Guillemot – breeding | Common Guillemot – non-breeding |
|---|---|---|
|
Bycatch surface |
High |
High |
|
Bycatch pelagic |
High |
High |
|
Bycatch demersal |
High |
High |
|
Bycatch aqua-culture |
Low |
Low |
|
Wind turbine collision mortality |
Low |
Low |
|
Displacement by wind turbines |
Medium |
Medium |
|
Wind turbines as a barrier to species movement |
High |
High |
|
Mortality by collision with underwater turbines etc |
High |
High |
|
Habitat loss from coastal infrastructure |
High |
Medium |
|
Marine litter |
Medium |
Medium |
|
invasive predatory mammals |
High |
NA |
|
Reduction in prey by fishing |
High |
High |
|
Disturbance from recreation, tourism and transport |
Medium |
Medium |
|
Intentional taking of adults/eggs |
Low |
NA |
|
synthetic contaminants |
High |
NA |
|
Mortality from oil contamination |
High |
High |
|
non-synthetic contaminants) |
High |
High |
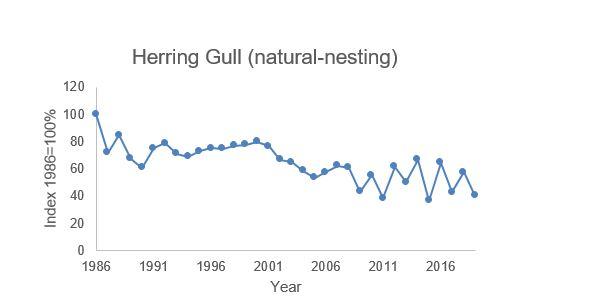
Figure 19: Herring Gull - breeding numbers
Click for a full description
Graph showing the trend in herring gull breeding numbers.
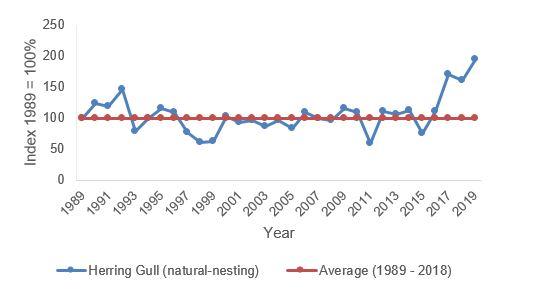
Figure 20: Herring Gull - breeding success
Click for a full description
Graph showing trend in herring gull breeding success. Note the graph starts at 1989.
| Key pressures and threats | Herring Gull - breeding | Herring Gull – non-breeding |
|---|---|---|
|
Bycatch surface |
Low |
Low |
|
Bycatch pelagic |
Medium |
Medium |
|
Bycatch demersal |
Low |
Low |
|
Bycatch aqua-culture |
Low |
Low |
|
Wind turbine collision mortality |
Medium |
Medium |
|
Displacement by wind turbines |
Low |
Low |
|
Wind turbines as a barrier to species movement |
Low |
Low |
|
Mortality by collision with underwater turbines etc |
Low |
Low |
|
Habitat loss from coastal infrastructure |
Medium |
Medium |
|
Marine litter |
High |
High |
|
invasive predatory mammals |
High |
NA |
|
Reduction in prey by fishing |
High |
High |
|
Disturbance from recreation, tourism and transport |
Low |
Low |
|
Intentional taking of adults/eggs |
High |
High |
|
synthetic contaminants |
High |
High |
|
Mortality from oil contamination |
High |
High |
|
non-synthetic contaminants) |
High |
High |
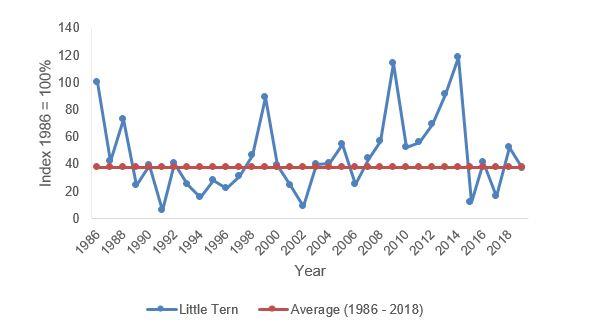
Figure 21: Little Tern - breeding success (1986-2018)
Click for a full description
Graph showing little tern breeding success.
| Key pressures and threats | Little Tern |
|---|---|
|
Bycatch surface |
Low |
|
Bycatch pelagic |
Low |
|
Bycatch demersal |
Low |
|
Bycatch aqua-culture |
Low |
|
Wind turbine collision mortality |
Low |
|
Displacement by wind turbines |
Low |
|
Wind turbines as a barrier to species movement |
Low |
|
Mortality by collision with underwater turbines etc |
Low |
|
Habitat loss from coastal infrastructure |
High |
|
Marine litter |
High |
|
invasive predatory mammals |
High |
|
Reduction in prey by fishing |
High |
|
Disturbance from recreation, tourism and transport |
Medium |
|
Intentional taking of adults/eggs |
Low |
|
synthetic contaminants |
Medium |
|
Mortality from oil contamination |
High |
|
non-synthetic contaminants) |
NA |
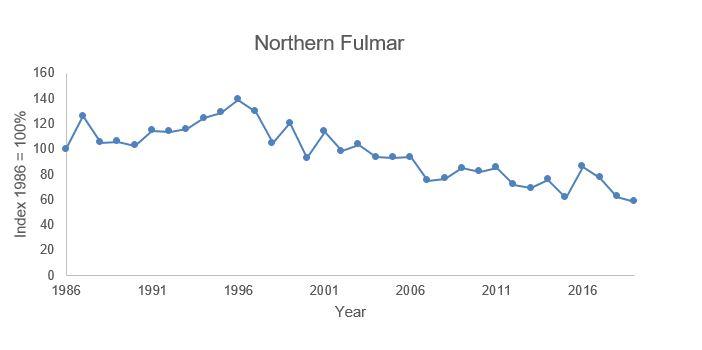
Figure 22: Northern Fulmar breeding numbers (1986-2016)
Click for a full description
Graph showing northern fulmar trend in breeding numbers.
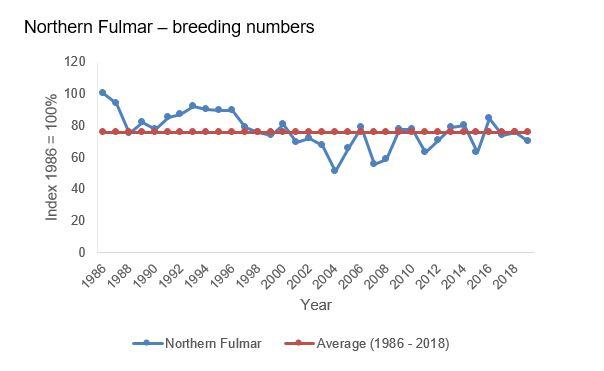
Figure 23: Northern Fulmar - breeding success average (1986-2018)
Click for a full description
Graph showing northern gannet breeding success trend.
| Key pressures and threats | Northern Fulmar - breeding | Northern Fulmar - non-breeding |
|---|---|---|
|
Bycatch surface |
High |
High |
|
Bycatch pelagic |
Medium |
Medium |
|
Bycatch demersal |
Low |
Low |
|
Bycatch aqua-culture |
Low |
Low |
|
Wind turbine collision mortality |
Medium |
Medium |
|
Displacement by wind turbines |
Medium |
Medium |
|
Wind turbines as a barrier to species movement |
Low |
Low |
|
Mortality by collision with underwater turbines etc |
Low |
Low |
|
Habitat loss from coastal infrastructure |
Low |
Low |
|
Marine litter |
Medium |
Medium |
|
invasive predatory mammals |
High |
NA |
|
Reduction in prey by fishing |
Medium |
Medium |
|
Disturbance from recreation, tourism and transport |
Medium |
Medium |
|
Intentional taking of adults/eggs |
Low |
Low |
|
synthetic contaminants |
Low |
Low |
|
Mortality from oil contamination |
Medium |
Medium |
|
non-synthetic contaminants) |
Low |
Low |
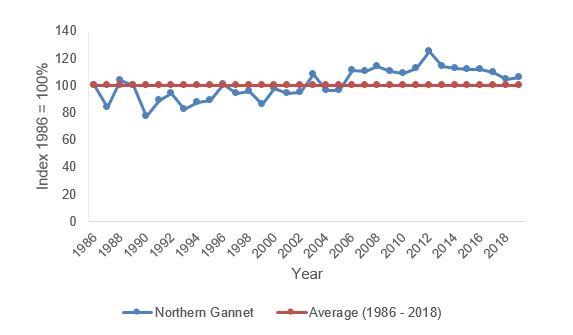
Figure 24: Northern Gannet - breeding success average (1986-2018)
Click for a full description
Graph showing the trend in herring gull breeding numbers.
| Key pressures and threats | Northern Gannet - breeding | Northern Gannet - non-breeding |
|---|---|---|
|
Bycatch surface |
High |
High |
|
Bycatch pelagic |
High |
High |
|
Bycatch demersal |
Low |
Low |
|
Bycatch aqua-culture |
Low |
Low |
|
Wind turbine collision mortality |
Medium |
Medium |
|
Displacement by wind turbines |
Medium |
Medium |
|
Wind turbines as a barrier to species movement |
Medium |
Medium |
|
Mortality by collision with underwater turbines etc |
Low |
Low |
|
Habitat loss from coastal infrastructure |
Low |
Low |
|
Marine litter |
Medium |
Medium |
|
invasive predatory mammals |
High |
NA |
|
Reduction in prey by fishing |
High |
High |
|
Disturbance from recreation, tourism and transport |
Medium |
Medium |
|
Intentional taking of adults/eggs |
Low |
Low |
|
synthetic contaminants |
NA |
High |
|
Mortality from oil contamination |
High |
High |
|
non-synthetic contaminants) |
High |
High |
Last updated: