NatureScot Research Report 1418 - Loch Ailort serpulids: diving, ROV, and multibeam survey 27th February – 3rd March 2023
Year of publication: 2026
Authors: Sayer-Mitchell, J.D., Roberts, K.C., Schulz, P.H., Brown, H (Tritonia Scientific Ltd)
Cite as: Sayer-Mitchell, J.D., Roberts, K.C., Schulz, P.H., Brown, H (Tritonia Scientific Ltd) Loch Ailort serpulids: diving, ROV, and multibeam survey. NatureScot Research Report 1418.
Keywords
Loch Ailort; serpulid worm; Serpula vermicularis; diving; ROV; multibeam sonar; photogrammetry; priority marine feature
Background
NatureScot had a requirement to repeat a series of surveys undertaken in 2017 of the serpulid reef communities found in Loch Ailort and reported in the document:
Kamphausen, L., Henderson, S., Kent, F., MacMinn, R., Beaton, J., Dodd, J., McGrath, O., James, B. 2018. Loch Ailort serpulid diving survey and drop-down video survey April 24-28, 2017. Scottish Natural Heritage post-survey summary.
Following discussions with NatureScot, SAMS Enterprise, and Tritonia Scientific, it was decided that the repeat surveys, to be conducted before the end of February 2023, would comprise a hybrid approach that firstly repeated the methods of the 2017 surveys (diving-based transects and manual measurement), and then secondly employed more advanced methodologies to enhance the data quality (multibeam echo sounding and georeferenced photogrammetry).
Main findings
- The survey window encompassed 27th February to 3rd March 2023.
- Three priority areas were surveyed using multibeam sonar techniques to an accuracy of 0.5m.
- The diver transects from the 2017 report were identified and repeated, with georeferenced video transects taken.
- The diver transects were repeated and extended using an ROV, and a fully georeferenced orthorectified “digital twin” of the transects was produced.
- No serpulid aggregations, live or dead, were identified on either the diver or ROV transects.
Acknowledgements
We would like to thank Ronnie and all the staff at MOWI Ardnish for access to their facilities and slipway.
Abbreviations
GPS – Global Positioning System
MBES – Multibeam Echo Sounder
PMF – Priority Marine Feature
ROV – Remotely Operated Vehicle
UGPS – Underwater Global Positioning System
UK BAP - UK Biodiversity Action Plan
Introduction
The serpulid worm (Serpula vermicularis) is a marine tubeworm that forms complex reef structures that grow up to 75cm high and 1m across, and at depth ranges of 6m – 10m. These serpulid reefs are designated as Priority Marine Features (PMFs) in Scotland, and as a UK Biodiversity Action Plan (UK BAP) habitat. The health of serpulid reefs appears to go through cycles of growth and collapse, and there has been evidence from other west coast sea lochs of a decline in health and population of this habitat (Moore et al., 2020).
Loch Ailort is a sea loch in Lochaber on Scotland’s west coast. There are a number of aquaculture developments within the loch, including a salmon fish farm, and a mussel farm. Serpulid reefs have been observed in this loch as recently as 2017 (Kamphausen et al., 2018). In 2023, Tritonia Scientific Ltd. were approached about repeating and expanding on the diver transects carried out by Kamphausen et al., 2018. It was proposed that the diver transects in 2023 would repeat the 2017 surveys using the same diver-based methodologies. The transects would be augmented using video, and the area covered by diving would be extended using ROV surveys. All video data collected would be fully georeferenced, and 3D digital twins of the seabed would be created. These surveys would be further supplemented by a MBES survey in the three priority zones shown in Figure 1a and 1b.
Methods
The survey design used three methods to collect data – diving, ROV, and MBES. The wider area was to be mapped using MBES, confined to three priority zones. Next, the divers repeated the 2017 survey transects. Finally, the ROV repeated the diver transects and extended the area of coverage. All video footage was used to create a 3D digital twin of the survey area. The three priority MBES areas, ROV survey area, and diver transects are detailed in Figure 1a and 1b.
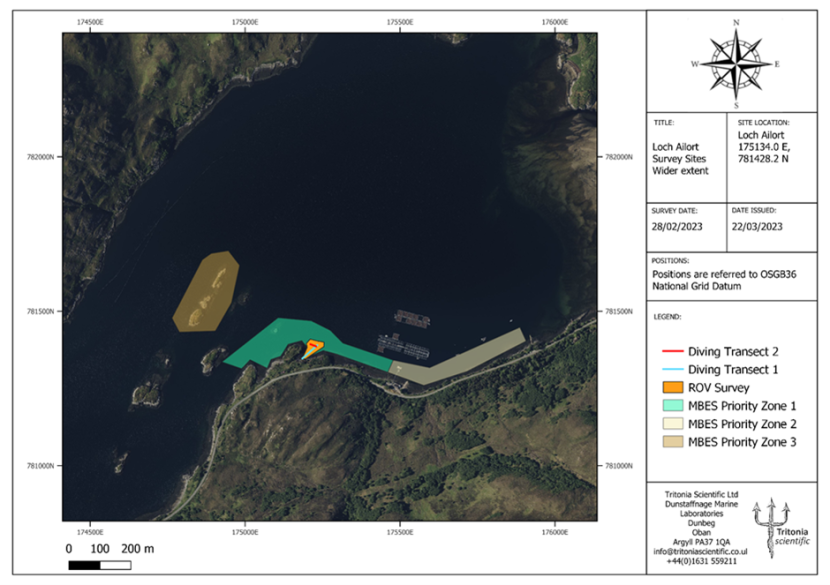
Figure 1a. Map detailing the 3 survey methods used in Loch Airlort and their area of coverage, and the location in relation to the Ardnish fish farm.
Click for a full description
Map of the head of Loch Ailort with the survey areas highlighted and the location of the Ardnish fish farm displayed.
Diver transect 1 is marked by a red line
Diver transect 2 is marked by a blue line
ROV survey area is marked in orange
MBES priority 1 is marked in light blue
MBES priority 2 is marked in off white
MBES priority 3 is marked in brown
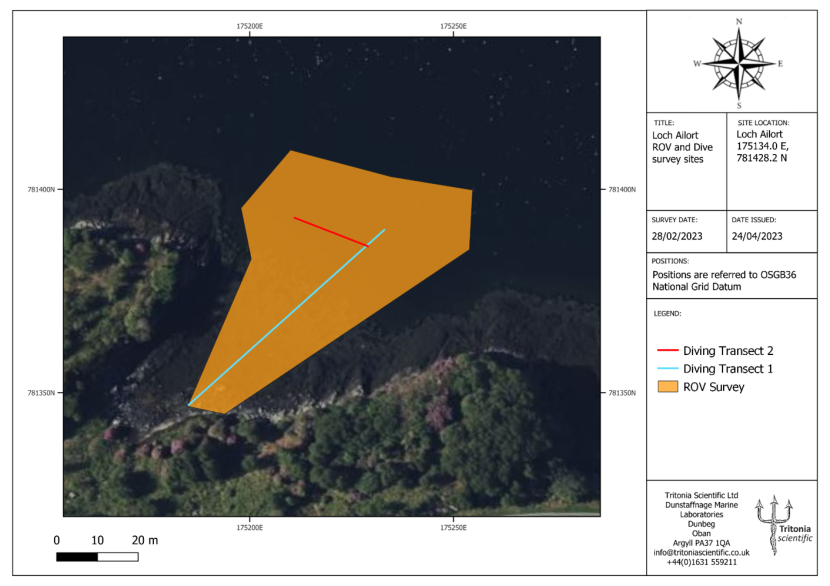
Figure 1b. Map detailing the 2 diver transects and the ROV survey area.
Click for a full description
Zoomed in map of the head of Loch Ailort with the ROV survey area and the diver transects highlighted.
Diver transect 1 is marked by a red line
Diver transect 2 is marked by a blue line
ROV survey area is marked in orange
Diver survey
The diver transects were carried out based on the locations outlined in Kamphausen et al., 2018. Two transects were videoed and any serpulid aggregations recorded and measured. Transect 1 began at the marker rock from 2017 and extended in the water at 045 degrees. This transect extended for 80 m and a depth of 9 m. Transect 2 was taken perpendicular from 60 m on transect 1, along the depth contour. Transect 2 extended for 30 m. The video transects were taken using a GoPro 9 camera and covered the transect plus 2 m either side.
MBES-based Bathymetry
WASSP S3Pr System: All bathymetry data were collected using a WASSP S3Pr multibeam echosounder (MBES). The wideband fairing transducer head and Ellipse Inertial Measurement Unit (IMU) Sensor were vertically side mounted to the 6 metre Rigid Inflatable Boat (RIB), Glaucus. Pings were collected using a 120-degree swath at a default centre frequency of 160 kHz. A WASSP IP66 DRX-32 was used for computation of the MBES data stream. These data were transferred to acquisition software using an RPM module on a fixed local IP. The Ellipse Dual Antenna Real-Time Kinematic (RTK) Global Navigation Satellite System (GNSS)/Inertial Navigation System (INS) was used to provide 0.2° heading and attain 1 cm RTK GNSS positioning. The Ellipse sensor box computes and corrects for pitch, roll and heave motion. To achieve RTK corrections, a ‘SmartNet’ license was attained from a third-party provider called ”The Survey Equipment Company”. A Valeport Sound Velocity Sensor (SVS) (max theoretical error ±0.017 m/s) was used to measure sound velocity at the transducer head and a Sontek castaway sound velocity profiler was used to obtain sound velocity profiles, which were subsequently used to correct the bathymetry data.
Correction for Sound Velocity and Transducer Offsets: After launching and berthing the Glaucus at MOWI Ardnish fish farm, the MBES system was set up, Sound Velocity Profiles (SVPs) were collected, and patch testing was carried out. Patch tests were caried out using the BeamworX software suite. The results of this are displayed in the calibration sections in Annex 1. Graphical displays of roll, heading and pitch calibrations are displayed in Annex 2. The SVP and calculated offsets were then applied to the survey configuration, meaning subsequently collected data were corrected during acquisition. For each of the designated survey areas, one SVP was acquired and applied at the deepest point prior to data acquisition. Since the sound velocity’s recorded at the transducer head throughout the rest of the survey were no more than ± 2 m/s different to the sound velocity recorded at the corresponding depth on the SVP, no additional SVPs were required. Real time corrections for tidal height were performed automatically by RTK positioning upon acquisition.
Data Acquisition: To maintain safe depths whilst operating the MBES, survey lines were first sailed along deeper contours (parallel to the shore). Subsequent lines were then sailed at increasingly shallower depths. Lines were also sailed to achieve a minimum of 50% swath overlap with previous lines to allow for the clipping of the outer extents of the swath during post-processing. The vessel speed varied with the sea state and depth: shallower areas sailing with the tide were faster (between 2 to 3 m/s) and deeper areas against the tide were slower (between 1.5 to 2.5 m/s). All data acquisition was carried out using the BeamworX software suite. Data were collected in the Ordnance Survey Great Britain 36 (OSGB36), ESPG:27700 Coordinate Reference System (CRS). A GPS Quality Indicator (QI) of 4 (RTK fix <2 cm) was retained throughout the duration of the survey.
Post-Processing: All bathymetry data were post-processed using the BeamworX software suite. All Z data were transformed from ordnance datum (OSGB36) to chart datum using a z-shift of ‘-2.39’ (recommended for location). All data displayed in this report are presented in chart datum. A comparison with corresponding admiralty depths was used as a gross error check.
The following filters were applied to the data to compensate for inevitable increased error at the outer extent of swaths:
- Slope filter (rejects points based on its mean slope to its neighbours)
- Clip outer beams (rejects 10% of the outer beams of the swath)
- Overlap fixer (corrects for refraction on file overlaps)
All presented data fits well within the Total Horizontal Uncertainty (THU) and Total Vertical Uncertainty (TVU) criteria for Special order S-44 compliance as stated in the 2020 IHO Standards for Hydrographic Surveys (I.E. THU must not exceed 2 m and TVU must not exceed 0.25 m).
Data for mean bathymetry and intensity (backscatter) were exported as geotiff files then imported and presented in Quantum Geographic Information System (QGIS).
ROV videography and photogrammetry
ROV, GPS and UGPS: A Blue Robotics ROV 2 with an 8 thruster Retrofit Heavy Configuration was used to perform all ROV transects. The ROV was connected to a 150 m Fathom Tether and Fathom-X Tether Interface junction box, which was subsequently connected to the control laptop for integration with Q Ground Control software. The ROV was fitted with a D1 Ping Sonar for safe navigation, a Water Linked DVL-A50 for improved stability and an A1 Locator for enhanced positioning.
For topside positioning and heading, a Simrad HS60 Satellite Compass was vertically side-mounted to the port side of Glaucus. Directly below, a Water Linked UGPS G2 antenna with four acoustic receivers was mounted below the waterline. Global positions of the locators are then computed using both the locators relative under water position and the Simrad HS60 topside position.
ROV Imagery: For each diving transect, the ROV was driven along the complete transect length followed by parallel passes in the surrounding area. The ROV was driven at a speed of 1 m/s with a distance of one metre from the seabed.
Source imagery for the construction of orthomosaics was captured using two downward facing GoPro Hero 10s. These images were captured at a rate of 1 per second. All imagery was georeferenced using the location of the Water Linked UGPS A1 locator which was mounted to the port side of the ROV. These images were then used to construct georeferenced orthomosaics using Agisoft Metashape v2.0.
Results
The charts, pictures and 3D digital twin from the survey are displayed in the section below. During the survey, no evidence of serpulid reefs, alive or dead, was found, by diver, ROV, or MBES. Of note were multiple large aggregations and individuals of the parchment worm (Chaetopterus variopedatus), and a species of large nudibranch (possibly Doris pseudoargus). Examples of this are displayed in Annex 4.
MBES bathymetry charts and backscatter plots
All MBES bathymetry charts and backscatter plots for priority zones 1 to 3, are shown in Figures 2 to 7.
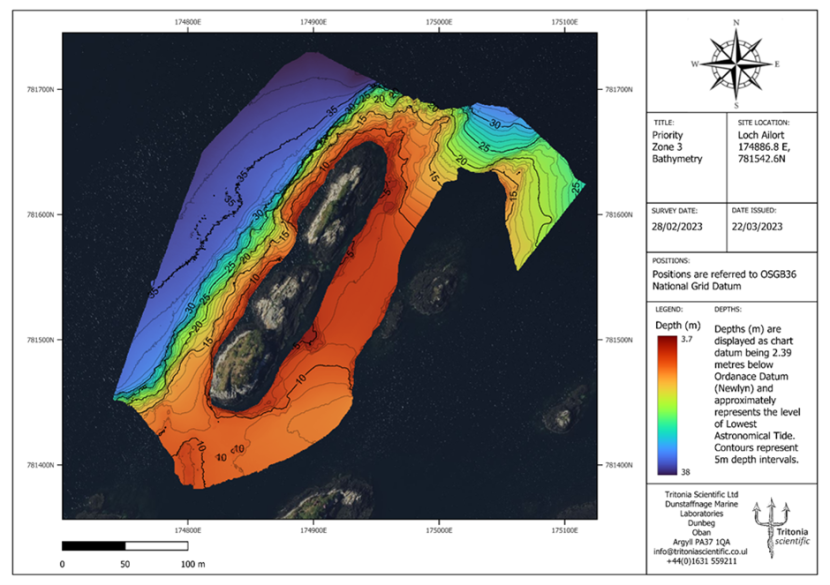
Figure 2. Priority zone 3 MBES bathymetry
Click for a full description
MBES priority zone 3 bathymetry chart. Depths are colour classified with dark red being the shallowest at 3.7 m, and dark blue being the deepest at 38 m. Contours represent 5m depth intervals.
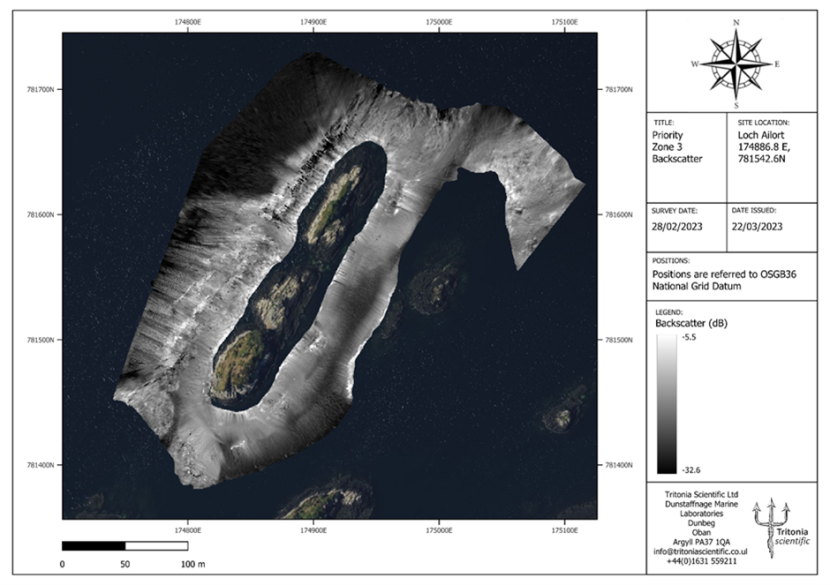
Figure 3. Priority zone 3 MBES backscatter plot
Click for a full description
MBES priority zone 3 backscatter plot. Backscatter is classified as white at the lower end of -5.5 decibels, fading to black at the upper end of -32.6 decibels.
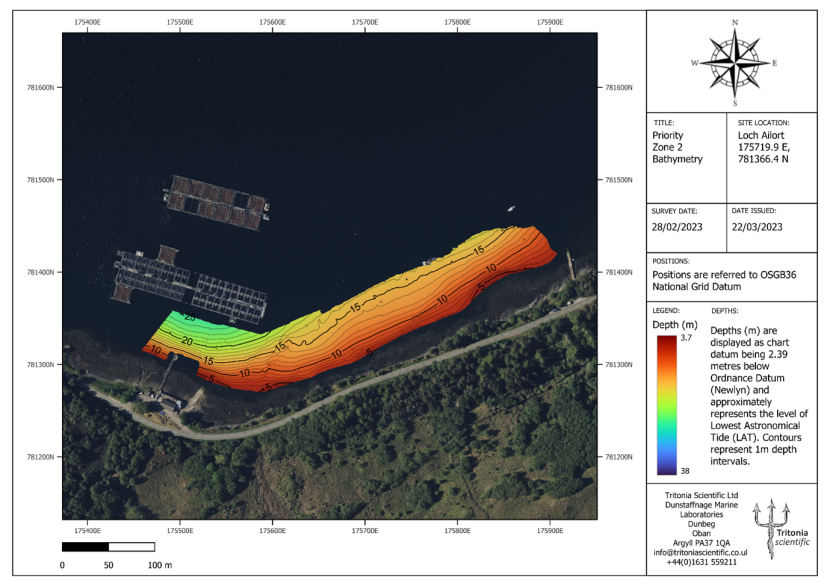
Figure 4. Priority zone 2 MBES bathymetry
Click for a full description
MBES priority zone 2 bathymetry chart on the southern shore of the loch, nearby the Ardnish fish farm. Depths are colour classified with dark red being the shallowest at 3.7 m, and dark blue being the deepest at 38 m.
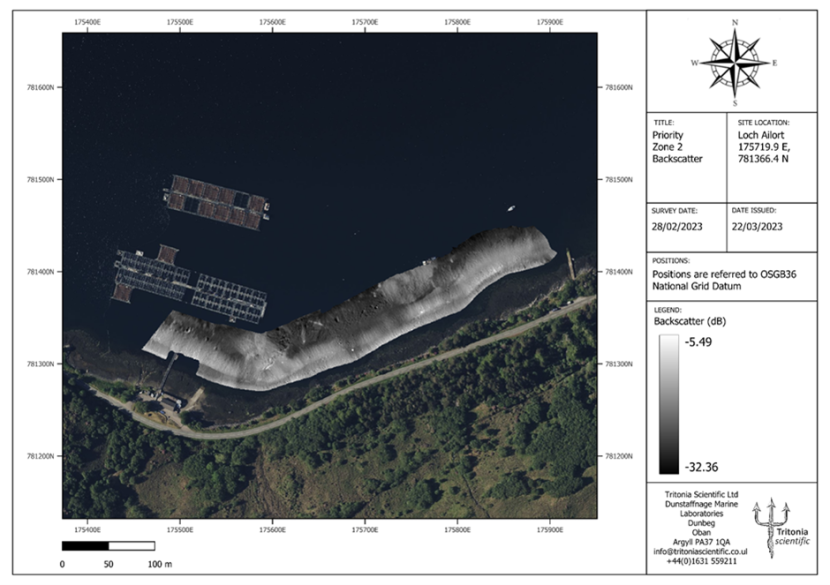
Figure 5. Priority zone 2 MBES backscatter plot
Click for a full description
MBES priority zone 2 backscatter plot. Backscatter is classified as white at the lower end of -5.5 decibels, fading to black at the upper end of -32.6 decibels. MBES Priority zone 2 is on the southern shore of the loch, nearby the Ardnish fish farm.
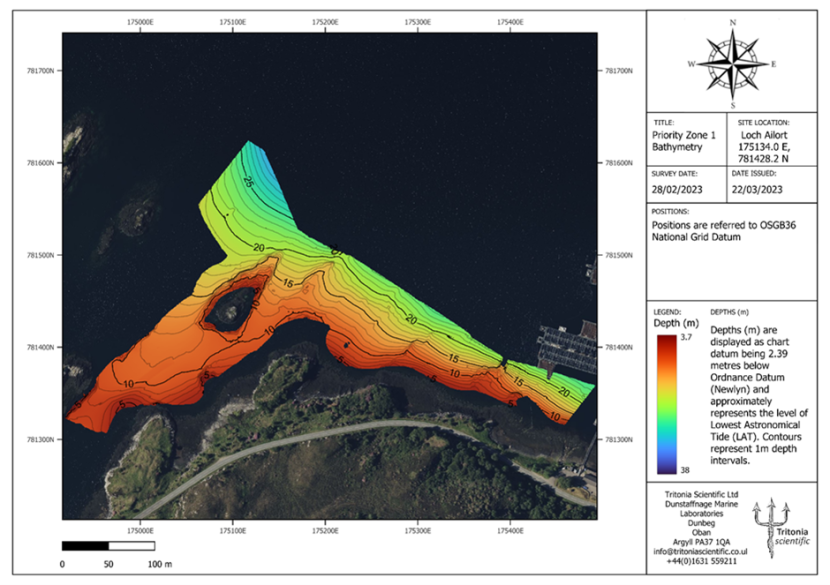
Figure 6. Priority zone 1 MBES bathymetry
Click for a full description
MBES priority zone 1 bathymetry chart extending from the Ardnish fish farm and around a skerry. Depths are colour classified with dark red being the shallowest at 3.7 m, and dark blue being the deepest at 38 m.
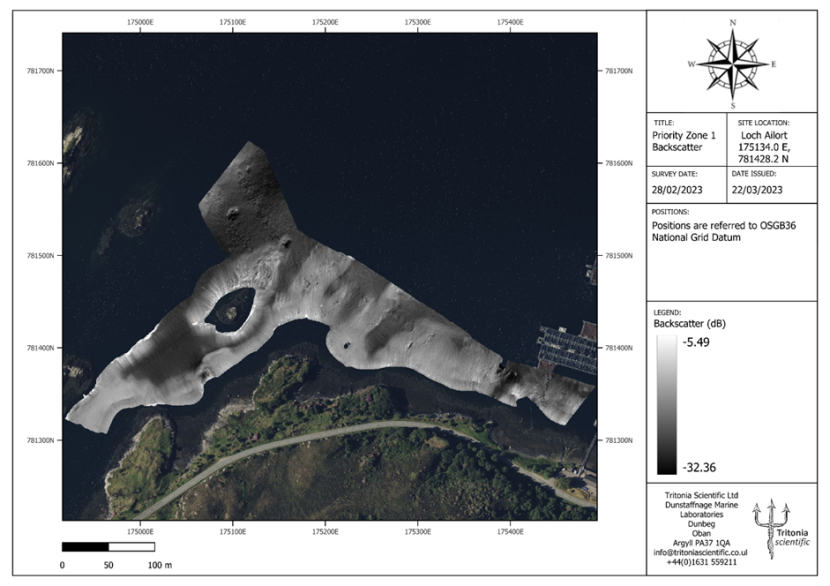
Figure 7. Priority zone 1 MBES backscatter plot
Click for a full description
MBES priority zone 1 backscatter plot extending from the Ardnish fish farm and around a skerry. Backscatter is classified as white at the lower end of -5.5 decibels, fading to black at the upper end of -32.6 decibels.
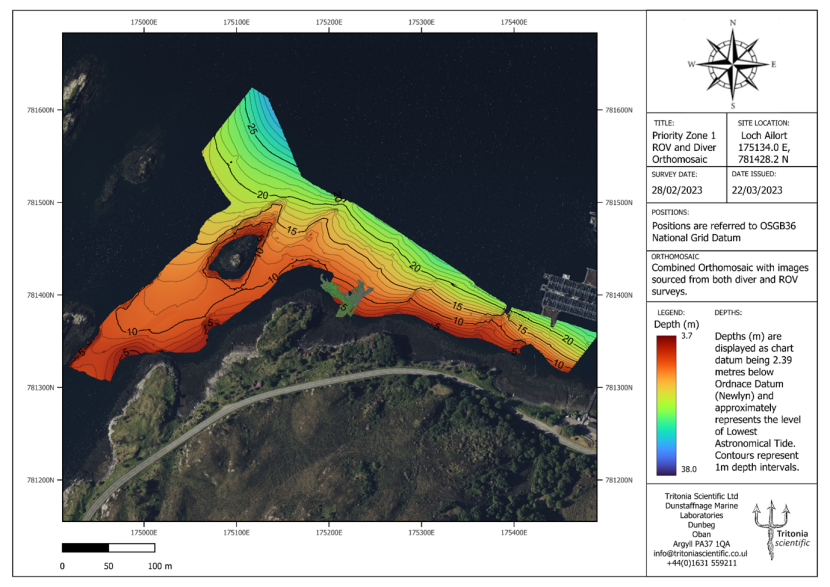
Figure 8. Priority zone 1 MBES bathymetry and photogrammetry orthomosaic
Click for a full description
MBES priority zone 1 bathymetry chart extending from the Ardnish fish farm and around a skerry. Depths are colour classified with dark red being the shallowest at 3.7 m, and dark blue being the deepest at 38 m. The orthomosaic generated from the video material attained during diver/ROV surveys is superimposed based on the georeferenced positioning data.
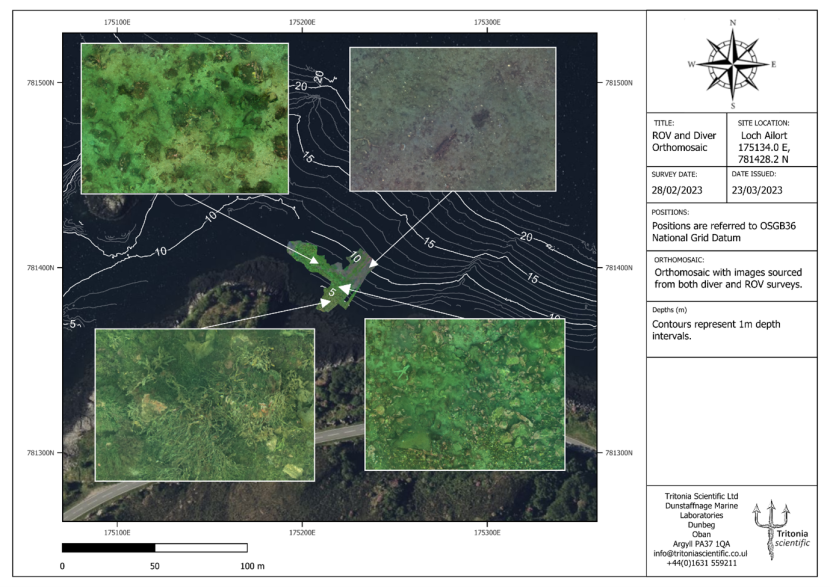
Figure 9. Diver/ROV survey seabed types
Click for a full description
The four main seabed types observed during the diver and ROV surveys are shown with arrows indicating their exact locations. In general, the seabed ranged from cobbles and boulders in the shallow water, to soft mud in deeper water. The orthomosaic is superimposed over the MBES bathymetry.
Diver video transects
The total lack of serpulid aggregations observed means that no diver-based maps were made, and no measurement data obtained.
The diver video transects can be viewed at the following YouTube Links. These are unlisted videos that are only visible by invitation.
3D digital twinning
ROV Transect video download links:
Note that to display telemetry on the ROV nav videos the .ass file should be in the accompanying folder of the mkv file and the mkv file should be opened with VLC media player.
The georeferenced combination of the orthomosaic with the priority zone1 MBES results is shown in Figure 8. The main seabed types identified from the orthomosaic are shown in Figure 9.
All UGPS, depth and time data from ROV and diver transects are attached in the appendix at the end of the report
Discussion
Combining the ROV and diver transects would have provided data to ground truth the MBES survey area. However, as no evidence of serpulids was found, it reduced the clarity provided by the MBES survey. No definitive evidence of live or dead serpulids were found by ROV, diver or MBES. More expansive ROV and diver surveying could be done in the bay to check if the population centres have shifted. A downward trend in population fits in with other evidence of serpulid populations in west coast sea lochs (Moore et al., 2020).
Conclusion
The population of Serpula vermicularis that was previously observed in Loch Ailort in 2017 was no longer evident over the same survey area in 2023.
References
Kamphausen, L., Henderson, S., Kent, F., MacMinn, R., Beaton, J., Dodd, J., McGrath, O., James, B. 2018. Loch Ailort serpulid diving survey and drop-down video survey April 24-28, 2017. Scottish Natural Heritage post-survey summary.
Moore, C.G., Harries, D.B., Tulbure, K.W., Cook, R.L., Saunders, G.R., Lyndon, A.R., Kamphausen, L., & James, B. 2020. The current status of serpulid reefs, horse mussel beds and flame shell beds in Loch Creran SAC and MPA. Scottish Natural Heritage Research Report No. 1156.
Annex 1. MBES Patch test calibration results
Please contact [email protected] if you would like to view annex 1 MBES Patch test calibration results. This is a series of tables presenting the configuration of the MBES for the patch test, the computation of the pitch, roll and heading calibration offsets and the results of these computations.
Annex 2. MBES calibration results
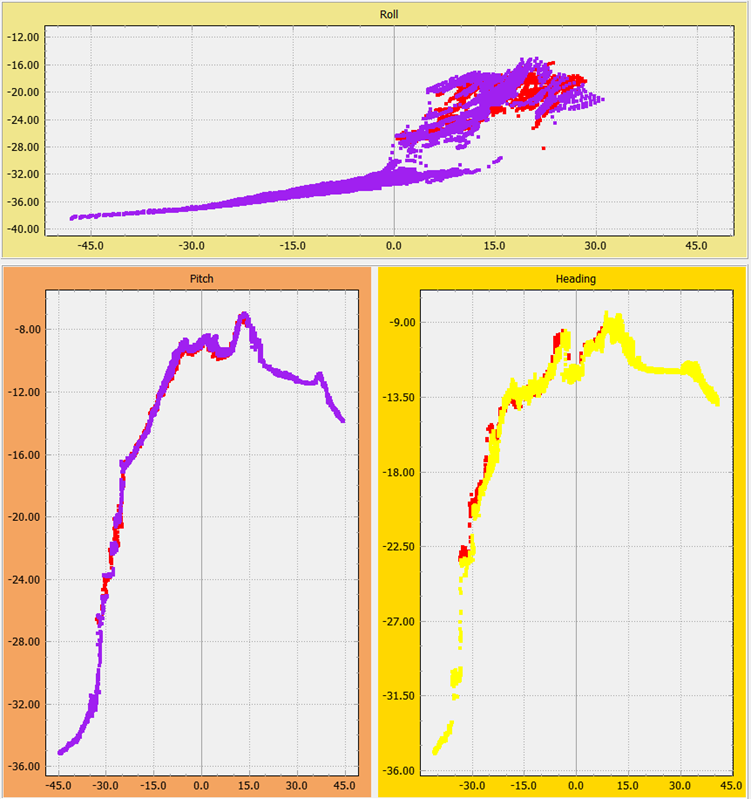
Annex 2: MBES patch test calibration results.
Click for a full description
Roll, pitch and heading profile charts for MBES patch test calbiration results. Charts display the corrected reciprocal seabed profile after the resulting transducer offsets have been applied. Y axis displays depth (m) and the X axis displays distance (m). The colours represent different recorded lines.
Annex 3. UGPS position track for diver and ROV surveys
Please contact [email protected] if you would like to view Annex 3: UGPS position track for diver and ROV surveys. This is a data table displaying the time/date, latitude, longitude, and depth of both the diver and ROV for diver transect 1; diver transect 2; ROV transect 1; and ROV transect 2.
Annex 4. Representative selection of stills from each transect and from the wider ROV survey
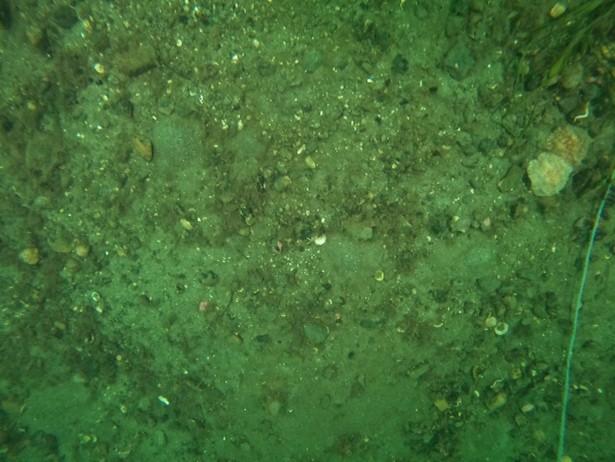
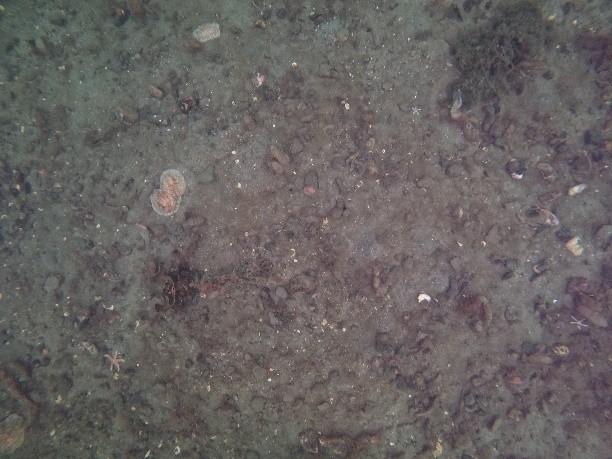
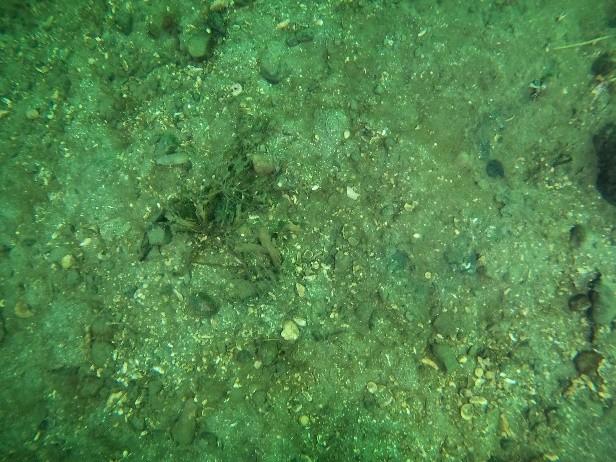
Annex 4a: Representative still of the seabed from diver transect 1.
Click for a full description
A still image showing the typical seabed type found on diver transect 1, taken from the image Diver_T1_Geo_Left (785).
Annex 4b: Representative still of a nudibranch from diver transect 1.
Click for a full description
A still image showing the typical nudibranch found on diver transect 1, taken from the image Diver_T1_Geo_Left (247).
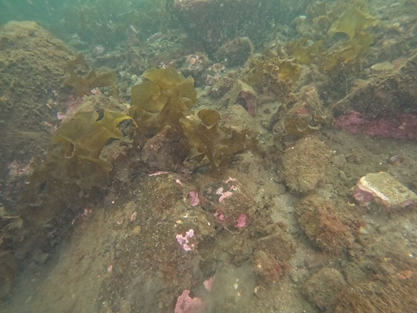
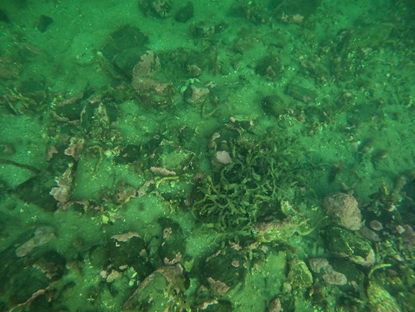
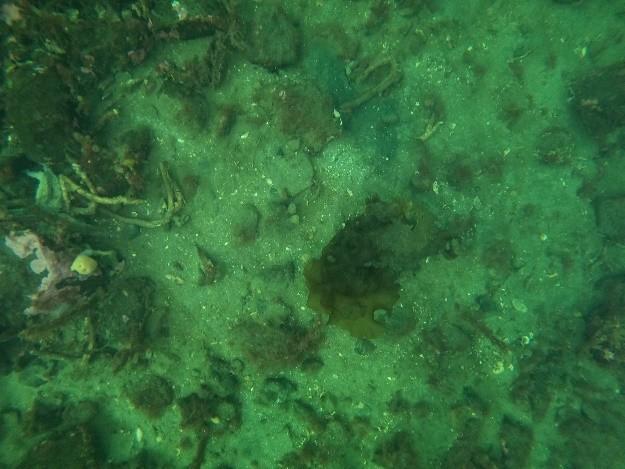
Annex 4c: Representative still of parchment worms from diver transect 1.
Click for a full description
A still image showing the typical parchment worm aggregations found on diver transect 1, taken from the image Diver_T1_Geo_Left (273).
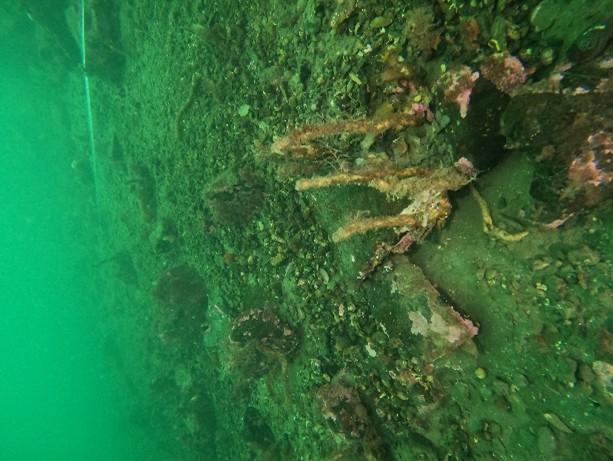
Annex 4d: Representative still of the seabed from ROV transect 1 wider area.
Click for a full description
A still image showing the typical still of the seabed from ROV transect 1 wider area, taken from the image ROV_T1_Geo_Right (13).
Annex 4e: Representative still of a nudibranch from ROV transect 1 wider area.
Click for a full description
A still image showing the typical nudibranch found on ROV transect 1 wider area, taken from the image ROV_T1_Geo_Right (687).
Annex 4f: Representative still of parchment worms from ROV transect 1 wider area.
Click for a full description
A still image showing the typical parchment worm aggregation found on ROV transect 1 wider area, taken from the image ROV_T1_Geo_Right (1131).
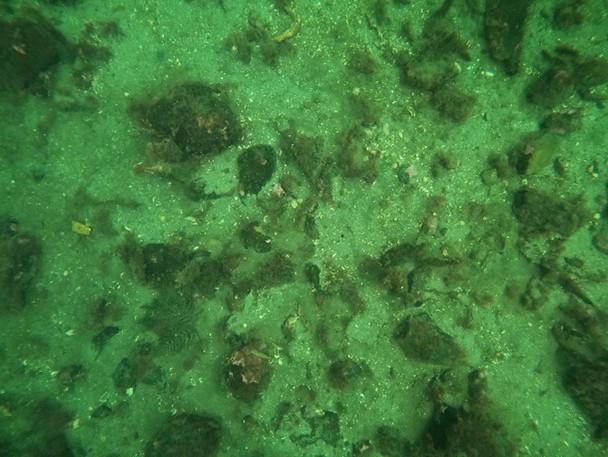
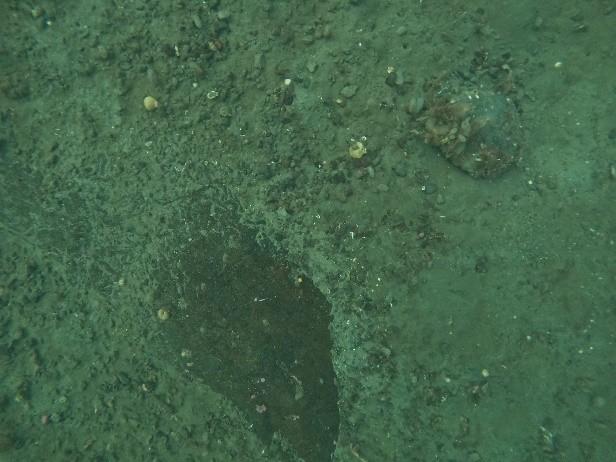
Annex 4g: Representative still of the seabed from diver transect 2.
Click for a full description
A still image showing the typical seabed type found on diver transect 2, taken from the image Diver_T2_Geo_Left (656).
Annex 4h: Representative still of parchment worms from diver transect 2.
Click for a full description
A still image showing the typical parchment worm aggregations found on diver transect 2, taken from the image Diver_T2_Geo_Left (1195).
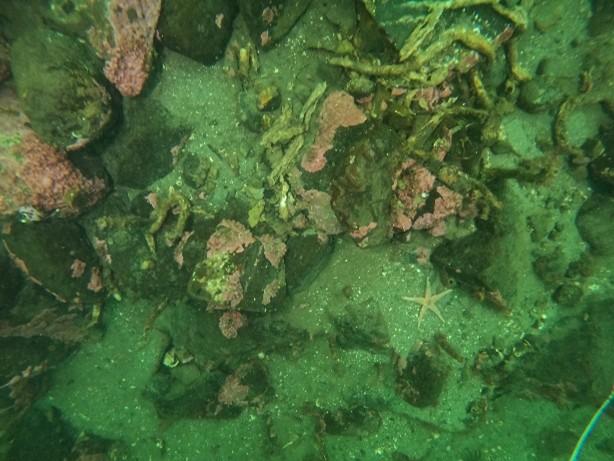
Annex 4i: Representative still of the seabed from ROV transect 2 wider area.
Click for a full description
A still image showing the typical still of the seabed from ROV transect 2 wider area, taken from the image ROV_T2_Geo_Right (444).
Annex 4j: Representative still of parchment worms from ROV transect 2 wider area.
Click for a full description
A still image showing the typical parchment worm aggregation found on ROV transect 2 wider area, taken from the image ROV_T2_Geo_Right (756).