NatureScot Research Report 1281 - Approaches to monitoring wintering waterfowl in Marine Protected Areas - Moray Firth pilot study winter 2019/20
Year of publication: 2023
Authors: Jen Graham and Kate Thompson (NatureScot)
Cite as: Graham, J. and Thompson, K. 2023. Approaches to monitoring wintering waterfowl in Marine Protected Areas - Moray Firth pilot study winter 2019/20. NatureScot Research Report 1281.
Keywords
seaduck, divers, grebes, inshore wintering waterfowl, European shags, citizen science, monitoring, Marine Protected Areas, Moray Firth Special Protection Area
Background
This report summarizes a programme of work undertaken to investigate different methods of monitoring inshore wintering waterfowl (divers, grebes, seaduck and European shag) in Marine Protected Areas (MPAs). Using the Moray Firth Special Protection Area (SPA) as a pilot area data were collected in the winter of 2019/2020 on the site’s 11 wintering qualifying features: great northern diver, red-throated diver, Slavonian grebe, greater scaup, common eider, long-tailed duck, common scoter, velvet scoter, common goldeneye, red-breasted merganser and European shag.
The focus of this report is the development, trial and evaluation of a bespoke Citizen Science Pilot survey to survey these birds. A separate report commissioned by NatureScot (Scott et al., 2022), details simultaneous digital aerial surveys and the development of analyses for comparison of data from these aerial surveys, the Citizen Science Pilot surveys, the Wetland Bird Survey (WeBS) and, historic vantage point surveys undertaken by the Royal Society for the Protection of Birds (RSPB).
This report applies the analyses developed by Scott et al. (2022) to all 11 wintering features and presents comparisons that inform recommendations on approaches to future monitoring of populations of wintering divers, grebes, seaduck and shags in MPAs.
Main findings
- Shore-based vantage point surveys were undertaken by citizen science volunteers across the Moray Firth SPA on 19th January and 8th March 2020, coincident with digital aerial surveys completed by HiDef Aerial Surveying Limited. (Scott et al., 2022). Field tests were undertaken in March 2020 to investigate differences between observers.
- 48 vantage points were surveyed in January and 28 in March. In total 10,806 birds were detected in the January survey and 11,072 in March.
- Relationships were characterised between: the aerial survey bird density models and the Citizen Science Pilot counts; the Citizen Science Pilot counts and contemporary WeBS counts; and, historic WeBS and RSPB shore-based (vantage point ) counts.
- Relationships between density estimates derived from the Citizen Science Pilot surveys and the Bayesian Model (derived from digital aerial survey data), were generally weak. However, distributions generally appear similar in inshore waters, which supports citizen science surveys as a means of understanding inshore distributions of these species.
- Comparative analyses between Citizen Science Pilot surveys and WeBS surveys in January 2020 were based on limited data and were inconclusive. However, historic targeted shore-based counts undertaken by the RSPB show moderate correlations with WeBS counts in the Moray Firth in the two sub-sectors analysed, suggesting that there is a relationship between the survey types for some species. The comparisons suggest that the RSPB shore-based counts provided consistently higher detection rates than WeBS counts in the same months.
- Volunteer feedback suggests that there is appetite for a bespoke long term monitoring of inshore wintering waterfowl (IWW) in the Moray Firth by Citizen Scientists.
- A suite of recommendations is made on the types of survey which are likely to yield the best detection rates for each of the qualifying features as well as on future monitoring of IWW in MPAs and further analysis of existing data sets.
Acknowledgements
The authors wish to thank the dedicated and enthusiastic volunteers, without whom this project would not have been possible. We would also like to thank the members of the Technical Advisory Group who provided particular assistance with the development and support of the project: Dawn Balmer, Ben Darvill and Liz Humphreys (British Trust for Ornithology), Mark Lewis (Joint Nature Conservation Committee), Colette Hall (Wildfowl and Wetland Trust), Linda Wilson (RSPB), Tom Evans (Marine Scotland), and Alex Banks (Natural England).
Some individuals provided particular advice and support to this project and we would like to thank them specifically: Alex Robbins, David Patterson, Martin Cook and Grant Humphries.
We are also extremely grateful for the support and assistance provided by data providers, as follows:
Wetland Bird Survey (WeBS): Data provided by WeBS, a Partnership jointly funded by the British Trust for Ornithology, Royal Society for the Protection of Birds and Joint Nature Conservation Committee, in association with the Wildfowl & Wetlands Trust, with fieldwork conducted by volunteers. Although WeBS data are presented within this report, in some cases (2018/19 and 2019/20 data) the figures may not have been fully checked and validated. Therefore, for any detailed analyses of WeBS data, enquiries should be directed to the WeBS team at the British Trust for Ornithology, The Nunnery, Thetford, IP24 2PU ([email protected]).
Royal Society for the Protection of Birds (RSPB): counts of divers, grebes and seaducks in the Moray Firth provided for the months of November, December, January, and March from 1998 to 2006. These data are reproduced by permission of RSPB. © RSPB 2019. All rights reserved.
Abbreviations
BioSS: Biomathematics and Statistics Scotland
BTO: British Trust for Ornithology
HiDef: HiDef Aerial Surveying Ltd.
IWW: Inshore Wintering Waterfowl
JNCC: Joint Nature Conservation Committee
MPA: Marine Protected Area
RPAV: Remotely Piloted Aerial Vehicle
RSPB: The Royal Society for the Protection of Birds
SCM: Site Condition Monitoring
SPA: Special Protection Area
TAG: Technical Advisory Group
UAV: Unmanned Aerial Vehicle
VSAS: Volunteer Seabirds at Sea scheme
WeBS: Wetland Bird Survey
WWT: Wildfowl & Wetlands Trust
Glossary
Inshore Wintering Waterfowl: species of divers, grebes and seaduck, including sawbills, that winter in notable numbers in inshore waters (within 12 nautical miles of the coast).
Marine Protected Area: defined geographical areas of the marine environment established and managed to achieve long-term nature conservation and sustainable use.
(marine) Special Protection Area: a type of MPA classified to protect populations of rare and vulnerable birds and regularly occurring migratory birds of European importance.
Introduction
Scotland’s marine environment is recognised as an area of outstanding importance for a number of European bird species, which use these productive temperate waters in the winter period as an area to moult, roost and feed.
The Birds Directive (EC Directive on the conservation of wild birds consolidated in 2009 as 2009/147/EC2, replacing the original 1979 Directive), requires Member States to establish a national network of Special Protection Areas (SPAs) on land and at sea. This is one of several conservation measures that contribute to the protection of rare, vulnerable and migratory bird species and has been a major driver of UK bird conservation action over the past three decades. In the terrestrial environment, the Scottish SPA network includes breeding seabird colony SPAs and estuarine SPAs for some sea duck and grebe species.
A more recent focus on the marine environment (Marine SPA selection process) has included classification, in December 2020, of 12 marine SPAs in Scotland for the protection of seabirds, divers, grebes and seaduck. Seven of these sites include one or more species of inshore wintering waterfowl (divers, grebes, seaduck) or European shag as qualifying features. Marine Protected Areas (MPAs), including SPAs, contribute towards achieving Favourable Conservation Status of vulnerable species and habitats across the Atlantic Biogeographic Region.
One of the conservation benefits of site protection is that the sites are monitored to assess feature condition and whether this is likely to be maintained. Conservation measures seek to address site-specific pressures and to enhance resilience to other anthropogenic threats, including climate change. The development and implementation of such measures requires information on populations and distributions of the qualifying features and the underlying causes of observed changes. Monitoring is also a key component of establishing whether the conservation objectives are being met.
There are significant challenges to monitoring mobile species in large marine sites. Multiple methods are available for conducting counts of waterfowl, such as visual aerial surveys, digital aerial surveys, boat based surveys and shore-based surveys, each of which have inherent strengths and limitations. Consideration of the available techniques and evaluating the most effective survey methods for each qualifying feature is important in order to make informed conservation decisions.
Digital aerial surveys are increasingly accepted as the best method for providing snapshot estimates of numbers and distributions of birds at sea. Using high-quality cameras to photograph or film the surface of the water, this technique is able to sample large marine sites in short time frames, overcoming the challenge of monitoring large expanses of open water. Furthermore, unlike previous visual aerial survey methods using human observers, the greater height at which the survey planes fly limits risk of disturbance to the target species. However, these techniques currently incur high costs, in part arising from the manual analyses of images, and consequently, digital aerial surveys are only likely to be commissioned infrequently, perhaps once every 10 winters per site to inform NatureScot’s Site Condition Monitoring (SCM) programme. The relative infrequency of such surveys therefore presents a challenge in the monitoring of wintering species whose populations and distributions may fluctuate or change significantly within or between winter seasons.
Boat based surveys may provide better identification rates for some species, and in common with aerial methods, also allow the survey of more offshore habitats in comparison with shore- based survey methods. However, boat based surveys are associated with a high disturbance rate, markedly reducing detection of some species such as divers and red-breasted merganser (Mendel et al., 2008; Jarrett et al., 2018), which results in low population estimates for such species. Furthermore boat based surveys are limited in access to the coastline where vessels may not be able to manoeuvre safely. Consequently, boat based surveys may under-record species which are more closely associated with the coast. Given these inherent limitations boat-based survey methods have not been considered further here.
Shore-based surveys are an alternative which are limited in their coverage of more offshore habitats, being restricted to nearshore waters, but can provide excellent value for money and extensive coverage around coastlines. The long-established Wetland Bird Survey (WeBS) has provided trends on wetland bird species across the UK using citizen scientists to observe and record species, on a monthly basis (Frost et al, 2017). However, it is recognised that WeBS methodologies have some limitations with respect to surveying marine IWW such as seaduck and divers for example a broader focus on wetland birds such as waders on the shoreline means that more offshore species of IWW might be undercounted (BTO, 2017). A bespoke shore-based methodology could have the benefit of focussing citizen science effort on IWW species and consequently may provide a complimentary method to digital aerial surveys by providing population count data more frequently.
Work program elements and structure
This report describes a program of work undertaken at the Moray Firth SPA in the winter of 2019/2020 to investigate future approaches to monitoring IWW in MPAs in Scotland. This program tied together multiple work packages, as detailed below and illustrated in Figure 2. The focus of this report is the development, trial and evaluation of a bespoke Citizen Science Pilot survey. Throughout this report, reference is made to (Scott et al., 2022), which details coincident digital aerial surveys and the development of analytical approaches for comparison of both contemporary and historic survey data collected using different methods.
The work program was developed by NatureScot, with input provided by a Technical Advisory Group (TAG) set up to advise on various aspects of the work. The TAG was chaired by NatureScot and comprised of representatives from the British Trust for Ornithology (BTO), Joint Nature Conservation Committee (JNCC), Marine Scotland, Natural England, Royal Society for the Protection of Birds (RSPB) and the Wildfowl and Wetlands Trust (WWT). The TAG provided advice throughout the development and implementation of the project, through meetings and correspondence and provided comments on an early draft of this report.
Using the Moray Firth SPA as a pilot area, data were collected on two occasions in the winter of 2019/2020 using simultaneous digital aerial survey and shore-based vantage point surveys, in order to gain directly comparable counts and trial a novel count method. The digital aerial survey work was commissioned by NatureScot and undertaken by HiDef Aerial Surveying Limited (HiDef) as detailed in Scott et al. (2022).
The shore-based vantage point survey (hereafter referred to as “Citizen Science Pilot”) was developed and led by the project officer, a NatureScot Graduate Placement recruited specifically for this project. Counts were undertaken by volunteers, managed and supported by NatureScot. The spatial sampling strategy for this aspect of data collection was commissioned by NatureScot from Biomathematics and Statistics Scotland (BioSS).
The final element of the work program was development of methods for comparative analyses of these and other data sets completed under a separate contract to NatureScot by HiDef with additional input from NatureScot. The results of the comparative analyses are detailed in Scott et al. (2022), but where relevant are summarised in this report, alongside a detailed evaluation of the Citizen Science Pilot, to inform an overarching evaluation of techniques and discussion of future monitoring approaches of IWW and wintering European shags in MPAs.
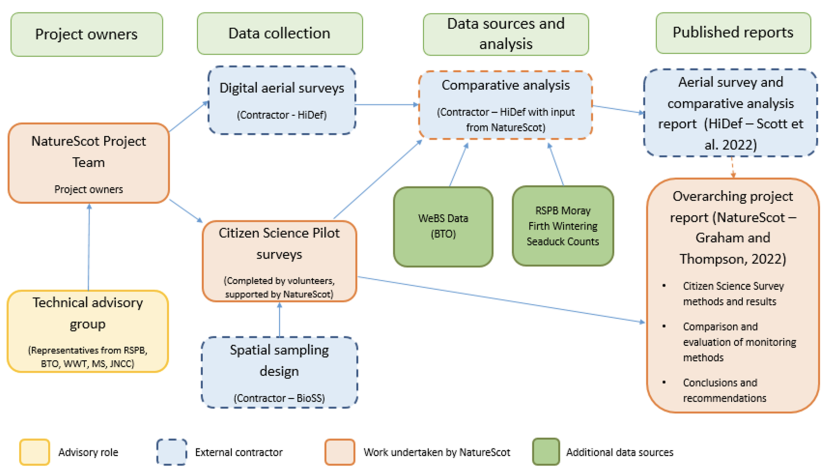
The work program was managed by NatureScot, with support from a Technical Advisory Group. NatureScot developed and undertook Citizen Science Pilot surveys, with the help of many volunteers. NatureScot commissioned BioSS to develop the sampling design for the surveys and HiDef to undertake the digital aerial surveys and develop the comparative data analyses which have supported and informed this report. The programme is fully described in the paragraphs above.
The Moray Firth SPA
The Moray Firth is a relatively sheltered, funnel-shaped body of water situated on the north-east coast of Scotland. The Firth is shallow water (less than 20 metres (m) depth) over a sandy substrate (Barne et al., 1996), with a deep channel (50 m) running east-west through muddy substrate (Tilbrook, 1986). Tidal flows are relatively weak with a maximum tidal range of 3 m (Harding-Hill, 1993). The Firth encompasses both an expansive stretch of open sea and a number of smaller firths including the Beauly Firth, Cromarty Firth, Dornoch Firth and Loch Fleet, with multiple tributary rivers, providing input of freshwater.
The Moray Firth SPA is an extensive site within the wider Firth, comprising a total area of 1,762.36 kilometres 2 (km) but excluding smaller subsidiary firths, many of which are also part of the existing SPA network (Figure 3). The Moray Firth SPA supports non-breeding populations of European importance of 11 species: great northern diver (Gavia immer), red-throated diver (Gavia stellata), Slavonian grebe (Podiceps auritus), greater scaup (Aythya marila), common eider (Somateria mollissima), long-tailed duck (Clangula hyemalis), common scoter (Melanitta nigra), velvet scoter (Melanitta fusca), common goldeneye (Bucephala clangula), red-breasted merganser (Mergus serrator), and European shag (Phalacrocorax aristotelis). Details of populations of these qualifying features in the Moray Firth SPA are provided in Table 1.
Table 1. Moray Firth SPA qualifying features and populations
Population estimates are based on the mean maximum population estimates provided in Lawson et al., 2015 for all non-breeding (nb) waterfowl and Kober et al., 2010, 2012 for breeding (b) and non-breeding European shag. Percentage of GB population uses reference populations from Musgrove et al., 2013 and Wetlands International, 2014.
|
Qualifying feature |
Population estimate (individuals) |
% of GB population |
|---|---|---|
|
Great northern diver (nb) Gavia immer |
144 |
5.8 |
|
Red-throated diver (nb) Gavia Stellata |
324 |
1.9 |
|
Slavonian grebe (nb) Podiceps auritus |
43 |
3.9 |
|
Common eider (nb) Somateria mollissima |
1733 |
2.9 |
|
Long-tailed duck (nb) Clangula hyemalis |
5001 |
45.5 |
|
Greater scaup (nb) Aythya marila |
930 |
17.9 |
|
Common scoter (nb)) Melanitta nigra |
5479 |
5.5 |
|
Velvet scoter (nb) Melanitta fusca |
1488 |
59.5 |
|
Common goldeneye (nb) Bucephala clangula |
907 |
4.5 |
|
Red-breasted merganser (nb) Mergus serrator |
151 |
1.8 |
|
European shag (b & nb) Phalacrocorax aristotelis |
5,494+ (b) |
10.2 |
The presence of high densities of IWW and wintering European shags in the Moray Firth is indicative of the importance and productivity of these waters during the winter months. Common eider and European shag are resident throughout the year, but long-tailed duck, great northern diver, common goldeneye, greater scaup and Slavonian grebe migrate long distances from more northerly breeding grounds. Wintering red-breasted merganser populations in Britain include both long-distance migrants and resident birds, which are typically short distance migrants, using coastal areas in winter.
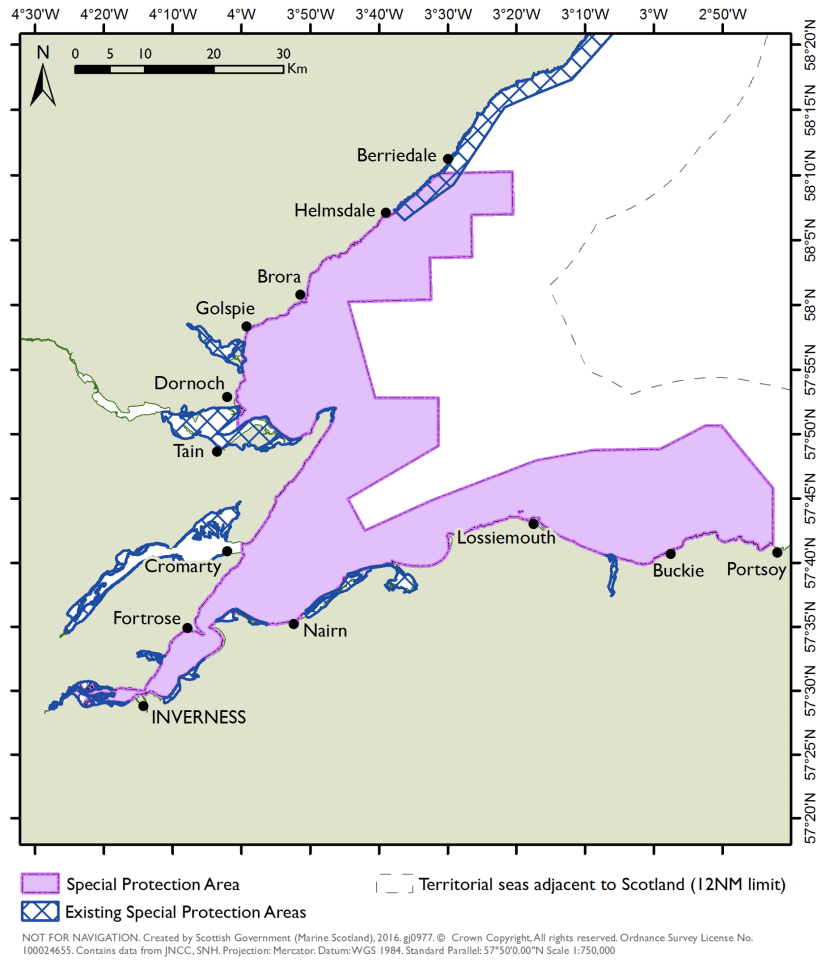
The SPAs deliniated in blue are: East Caithness Cliffs SPA, Dornoch Firth and Loch Fleet SPA, Cromarty Firth SPA, Inner Moray Firth SPA, Moray and Nairn Coast SPA. Created by Scottish Government (Marine Scotland) 2016. Crown copyright. All rights reserved. Ordnance Survey Licence No. 100024655. Contains data from JNCC, SNH.
The Moray Firth supports a wide variety of both pelagic and demersal fish and is an important spawning ground for several species. Shellfish, such as Norway lobster Nephrops norvegicus, and bivalves including blue mussel Mytilus edulis (Hopkins, 1986; Harding-Hill, 1993) also form part of the diverse fauna, all of which provide important prey for marine birds using the site. Divers, mergansers and European shags feed on a wide variety of fish, which they catch by diving from the surface and pursuing underwater (Guse et al., 2009; McCluskie et al., 2012).
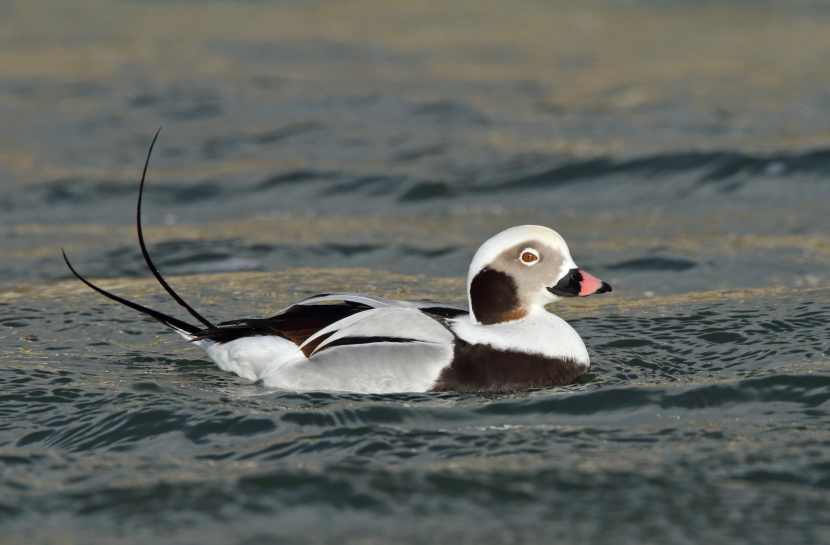
Slavonian grebes feed on small fish species but their diet also includes small amphipods and other crustaceans (Sonntag et al., 2009). Great northern divers (Figure 4) also feed opportunistically on crustaceans (Roycroft et al., 2007).
Common eiders, velvet scoters, common scoters, and long-tailed ducks feed almost exclusively on molluscs and small crustaceans, diving from the surface to find their prey on the seabed (Fox, 2013). Common goldeneye and greater scaup feed mainly on bivalves and amphipods in winter months. Diving activity varies among species but average foraging dive depths for most are shallower than 15 m (Jakubas, 2003; Robbins, 2017; Kirby et al., 1993).
The Moray Firth SPA was identified as an ideal site in which to investigate approaches to monitoring IWW, due to the size of the site, mix of qualifying features and crucially an abundance of existing IWW survey data. These data spanned multiple years and were gathered using a range of methodologies, providing an opportunity for comparative analyses in an important marine site.
Moray Firth data sets
The following data sets (depicted as green boxes in Figure 2) were used to underpin site selection of the Moray Firth SPA and were used to conduct comparative analyses to explore future methods of monitoring. Full descriptions of these data and their characteristics are provided in Scott et al. (2022).
BTO/RSPB/JNCC Wetland Bird Survey (WeBS) data
The Wetland Bird Survey (WeBS) is a long-term monitoring scheme of non-breeding waterbirds, including waterfowl and waders, coordinated by the BTO. Data is collected on a monthly basis throughout the UK by volunteers. The ‘core count’ (September – March) dates are pre-selected to enable a synchronised count across the whole country, in order to reduce double counting. The dates are selected with prioritization of tidal conditions for coastal surveys at high tide and generally take place on a Sunday. Surveys are undertaken at all wetland habitats used by waterbirds including lakes, reservoirs, canals, freshwater marshes as well as estuaries and sections of the open coast. Data collection began in 1947 and is ongoing which makes the WeBS data set enormously important in monitoring IWW and other waterbirds.
The WeBS core counts use a ‘look-see’ methodology, where the observer records all species within a given count sector. For shore-based count sectors this methodology therefore includes both waders on the shore and all marine birds (including waterfowl and seabirds). To participate in this survey observers must be familiar with all the target species of the survey, which include; swans, geese, ducks, divers, grebes, cormorants, herons, spoonbill, rails, cranes, waders and kingfisher, as well as optional counts of gulls and terns (WeBS Methods).
This methodology has some inherent limitations for counting IWW. The fixed count dates can result in weather and sea conditions which are not optimal for surveying these species. Furthermore, sustained observations are required to detect, identify and count IWW. The WeBS target species includes a large assemblage of birds which are found on the shoreline and other wetland habitats and therefore observer effort is divided, potentially resulting in undercounting for more offshore species.
In the Moray Firth, WeBS counts cover an area from Brora to Buckie. The coastal regions are divided into 60 sectors, of which 55 fall within the Moray Firth SPA (Figure 5). For the purposes of this research, WeBS data was drawn from 1998/99 to 2018/19 for the qualifying features of the Moray Firth SPA (see Acknowledgements). This period was chosen to coincide with the commencement of data collection for site selection of marine SPAs for inshore wintering waterfowl in Scotland. In winter 2019/20, WeBS core count dates in the Moray Firth included the 12th of January and 8th of March. Data from the January 2020 counts were included in the following analyses but data from the March 2020 counts were not available when these analyses were undertaken.
RSPB Moray Firth Wintering Seaduck Counts
Following the development of the Beatrice oil field in the Moray Firth, the RSPB set up annual monitoring of wintering waterfowl (Evans, 1998). In 1977/78 surveys were undertaken by The Nature Conservancy Council and the RSPB. These surveys established baseline post-construction information on the Moray Firth populations and distributions of wintering divers, seaducks and grebes. Surveys were continued and expanded by the RSPB through most winters until 1994/95. After a two year gap in monitoring between 1995 and 1997 surveys were resumed in the winter of 1997/98 up until 2005/06 (Kaletja-Summers and Butterfield, 2006). The surveys provided good coverage of the Moray Firth coastline, establishing 112 vantage points from Helmsdale to Spey Bay, including the inner firths (Dornoch Firth, Loch Fleet, Cromarty Firth and the Inner Beauly Firth) (Figure 5).
The RSPB employed a dedicated observer in each survey season who surveyed the vantage points across the Moray Firth each winter using a look-see methodology. This survey was targeted at marine species, including; seaducks, divers, grebes, sawbills and auks. As a result of using a single observer these surveys were not synchronised across the site, however efforts were made to complete counts of each sector within a day (Kaletja-Summers and Butterfield, 2006). Consequently, whole site surveys could take around two to three weeks to complete. Data from these surveys were generally used preferentially to WeBS counts, and in some instances in preference to visual aerial surveys, in the assessments of IWW populations that were used to underpin site selection (see Table 7), as they focussed specifically on the relevant species. These surveys provided the best available data for greater scaup, long-tailed duck, common scoter, velvet scoter, common goldeneye and red-breasted merganser (Lawson, et al., 2015).
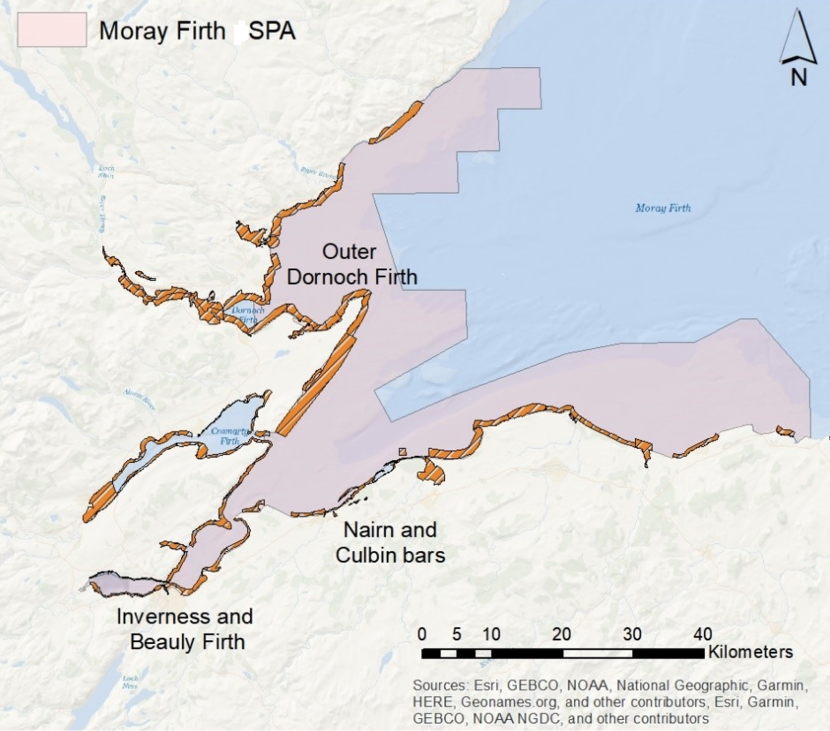
A map of the Moray Firth showing the boundary of the Moray Firth SPA and WeBS count sectors on the coastline in the Outer Dornoch Firth, the Inverness and Beauly Firths and at Nairn and Culbin Bars.
Sources: Esri, GEBCO, NOAA, National Geographic, Garmin, HERE, Geonames.org and other contributors.
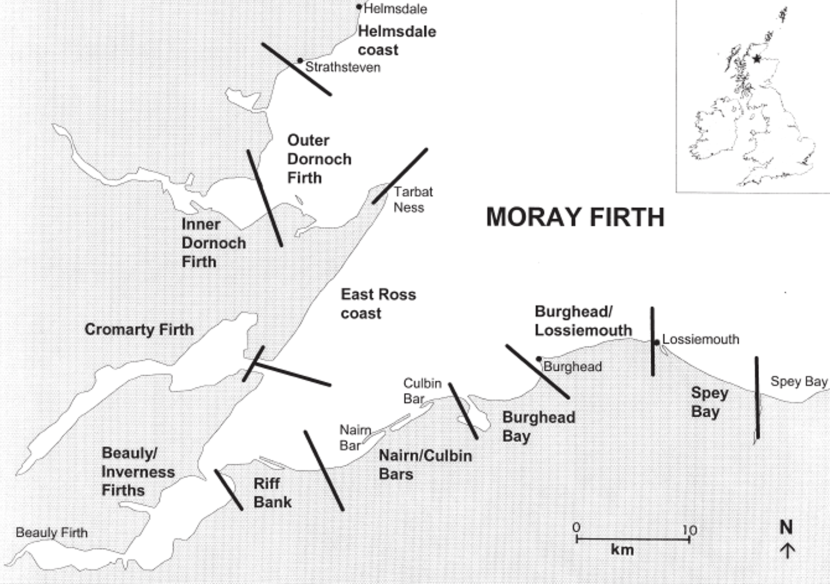
Map of the Moray Firth showing 11 RSPB count sectors delineated by black bands. Sectors are; Helmsdale coast, Outer Dornoch Firth, Inner Dornoch Firth, East Ross Coast, Cromarty Firth, Beauly/Inverness Firths, Riff Bank, Nairn/Culbin Bars, Burghead Bay, Burghead/Lossiemouth and Spey Bay. RSPB (Kalejta-Summers and Butterfield, 2006)
JNCC Visual Aerial Surveys
Visual aerial surveys were undertaken by JNCC between 2000 and 2007 for species of seaduck, divers, grebes and little gull in the Moray Firth. Nine surveys were conducted using line transects, assigning observations to three, and later, four distance bands. Two observers, made observations from each side of the plane, by recording data onto a cassette voice recorder. Aircraft used a cruising altitude of 76 m and 185km h-1 in order to enable observations whilst minimising disturbance to target species (Lewis et al., 2008).
These visual aerial surveys were used for the population estimates of red-throated diver, great northern diver and common eider in the data underpinning site selection of the Moray Firth SPA.
The role of citizen science
Citizen science has a long tradition in the data collection and monitoring of the natural environment, particularly within ornithology, with volunteer collected data underpinning much of our understanding about the populations and distributions of bird species.
Despite the surge in community based monitoring methods over the last few decades, concerns about the data quality and credibility remain (Crall, et al., 2011, Law et al., 2017). Some studies have found greater variability in volunteer collected data than in data collected by professionals (Belt & Krausman, 2012 and Moyer-Horner et al., 2012.). Other studies have found that there is little variability in data between the two (Hoyer, et al., 2001, and Oldekop, et al., 2011). For example, Chandler, et al. (2017) found that there were many examples of volunteer collected data which were no more problematic than those collected by professional scientists. During identification tests of invasive species, Crall, et al. (2011) found that self-identified comfort levels provided the most accurate predictor of correct species identification. Variability and bias in citizen science data is still poorly understood, and it is possible that any associated error or variability is dependent on the type of monitoring undertaken, the conditions, target species and characteristics of volunteers. As such, it is appropriate to undertake field tests to investigate the levels of error present in each citizen science project to allow adjustments to be made to methodologies and protocols in order to reduce this as far as possible and so increase levels of accuracy and precision.
IWW represent a challenging taxonomic group for monitoring by citizen scientists due to their distance from the shore, and similarity of appearance for some related species (e.g. scoter species, diver species and shags and cormorants). Consequently, detection and identification can be difficult leading to errors in counts and resulting population estimates. On top of this, there are environmental challenges in coastal environments, which must be taken into consideration.
Despite the challenges inherent in citizen science methods and in monitoring IWW there are significant benefits to this approach, for instance, enabling snapshot data collection from multiple coastal vantage points across multiple sites, and which can be continued over long temporal scales. These data sets can make huge contributions to our understanding of species population and distribution and enable monitoring of specific sites at relatively low cost. However, the benefits of a citizen science based monitoring program move beyond data collection. Citizen science can also be a valuable means of increasing stewardship and awareness of our natural environment and influencing conservation actions and advocacy. In a secondary sense, citizen science projects can help to develop communities, increase the knowledge and skills of participants and help connect people to the environment (MacPhail and Colla, 2020).
Citizen Science Pilot
A bespoke citizen science survey methodology was developed and trialled at the Moray Firth SPA in winter 2019/20 and the results evaluated to determine the potential value of such an approach to future monitoring of IWW in MPAs. The Citizen Science Pilot was intended to explore three distinct topic areas:
Topic A: Factors which influence the quality and repeatability of shore-based counts of IWW in MPAs.
We aimed to explore species-specific, environmental, and observer (including equipment) factors affecting quality and repeatability of shore-based counts of IWW and consider how these might be controlled for through survey design and data collection protocols.
Topic B: Potential (added) value of targeted shore-based counts of IWW to detection of long-term trends and shorter-term variations in the populations and / or distributions of IWW qualifying features in large MPAs.
We aimed to examine the potential of targeted shore-based counts of IWW to provide a consistent proxy indicator of overall populations of some or all species in large marine sites. A specific focus was on whether targeted shore-based counts have potential to add significant value to the information on the abundance and distribution of any IWW species as already collected by WeBS counts.
Topic C: Practicality of a bespoke citizen science model for monitoring of IWW within MPAs and approaches to development and delivery.
We aimed to explore whether there is likely to be sufficient volunteer support for this type of monitoring in both the short and long term and considered how a bespoke programme of citizen science shore-based monitoring of IWW in MPAs be co-ordinated and delivered in the future.
Annex 1 sets out a series of detailed questions and approaches that were identified within these topic areas and outlines the progress made on each.
Methods
The Citizen Science Pilot surveys and digital aerial surveys were undertaken in the Moray Firth SPA in the winter of 2019/2020. Surveys were closely coordinated in order to facilitate comparison of the results. Two rounds of surveying were completed using each technique. Survey rounds were planned to run in January and February, however, very poor weather conditions resulted in the delay of the second round which eventually took place in early March (Table 2). Both survey techniques collected data on the 11 qualifying features listed in Table 1. Some other marine birds were also recorded, such as auks and gulls.
Table 2. Survey rounds and dates Moray Firth 2019/20
Weather data are from historic weather logs for Moray Firth at timeanddate.com.
|
Count round |
Planned Survey Date |
Actual Survey date |
Wind speed and direction |
Precipitation |
Cloud cover |
|---|---|---|---|---|---|
|
1 |
18th / 19th January |
19th January |
16-27mph, SSW |
None |
Passing clouds (over 750m) |
|
2 |
15th / 16th February |
8th March |
11-16mph, SW |
Occasional light showers |
Passing clouds (over 750m) |
The weather requirements for the digital aerial survey and Citizen Science Pilot were slightly different, but both required low wind speeds, and good visibility. The digital aerial surveys required a cloud base of above 550m and the Citizen Science Pilot surveys required a sea state of four or less. In a large site like the Moray Firth SPA, conditions can vary significantly from one vantage point to another. During the first survey, this was the case, and many of the southern vantage points experienced higher wind speeds than the northern vantage points.
Citizen Science Pilot Survey Design
The NatureScot Citizen Science Pilot surveys were designed to target the qualifying features of the Moray Firth SPA from shore-based vantage points along the coastline. The survey was designed using a look-see methodology, at vantage points with a viewshed out to sea (Bibby et al., 2000 and Gilbert et al., 1998).
Recruitment for volunteer observers was undertaken by advertising with local bird groups and in NatureScot offices and using social media groups to find potential volunteers. Due to the challenges of monitoring IWW, we recruited volunteers who could already identify these species and around half of surveyed volunteers had previously participated in WeBS counts. The number of volunteers recruited dictated and constrained the number of vantage points surveyed on each count date with some volunteers conducting surveys from more than one vantage point. Volunteer observers were self-selected with the requirement that they must know how to identify the SPA qualifying features and have access to a telescope with which to conduct the surveys. All volunteers were provided with a copy of the survey protocol, information on the vantage points they were to survey and recording sheets. All volunteers were local to the Moray Firth area.
Count sectors and vantage points
The count sectors and vantage points used were derived from those previously used for the RSPB Moray Firth wintering seaduck counts. When developing the NatureScot Citizen Science Pilot, it was agreed that the original RSPB vantage points should be used where possible to aid comparisons of the data, and eliminate the need to select and quality assess many new vantage points. Some additions to the RSPB vantage points were required in order to include sections of coast which were not previously surveyed but which are within the Moray Firth SPA boundary. These additions were made prior to the surveys and were chosen based on appropriate distances between other vantage points and the likelihood of the site having a good viewshed. Similarly, some of the RSPB vantage points within the inner firths were excluded from the NatureScot survey design as they were not within the SPA boundary.
The Citizen Science Pilot consequently identified 84 potential vantage points within 11 count sectors (Figure 7 and Annex 2), substantially modelled on the sectors previously used by RSPB (Figure 6). The RSPB sectors were used to delineate sections of the Moray Firth coast and nearshore waters with distinct biological characteristics (e.g. more sheltered areas such as Inner Firth, areas of low water depth, such as the Riff Bank, and rocky shoreline such as between Burghead and Lossiemouth). The Citizen Science Pilot added a new sector to the east of Spey Bay (“Buckie to Portsoy”). In addition, the previous “Helmsdale Coast” was extended northwards to the Moray Firth SPA boundary and divided to create two sectors “Brora” and “Badbea to Lothbeg”. The RSPB “Cromarty Firth” sector, and associated vantage points, was omitted as it falls outside the Moray Firth SPA boundary.
Sampling methods and sector coverage
Although a whole site survey was desirable, it was not possible to survey every available vantage point due to the number of volunteer observers available at short notice to coordinate with the digital aerial survey. Consequently, only a selection of vantage points could be visited during each of the two survey rounds. Ensuring that the spatial sampling of the Citizen Science Pilot provided data which could be used for comparison with digital aerial survey was a key priority in designing the spatial sampling methods. A spatial sampling strategy for the Citizen Science Pilot was completed under contract to NatureScot by Biomathematics and Statistics Scotland (BioSS) whose (unpublished) report informed the spatial sampling described below.
To ensure good geographical coverage along the shoreline of Moray Firth and to facilitate comparisons with the WeBS and historical RSPB’s Moray Firth Wintering Seaduck counts, the sampling design was spatially stratified by the 11 sectors shown in Figure 7.
Up to three vantage points in each sector (17 in total) were initially identified as ‘essential’ (Table 3 and Figure 7). These were chosen based on knowledge of the Moray Firth distributions and sites that had high densities of the SPA qualifying features in the RSPB data. The number of additional vantage points to survey per sector was then determined according to the number of available volunteers. The intention was that simple random sampling would then be used to identify further vantage points to sample with the assumption that each volunteer could visit two vantage points. In allocating additional ‘non-essential’ vantage points, proportional allocation was used to randomly assign these to available volunteers.
In practice, as illustrated in Figure 7 and detailed in Table 3, the number and geographical distribution of volunteers and access issues for some vantage points, meant that it was not possible to cover all those originally identified as “essential”. However, in January, 12 “essential” vantage points and nearly 60% of all possible vantage points were covered by a total of 27 volunteers. Allocation of volunteers within sectors was as far as possible proportional to the number of vantage points identified in that sector. Exceptions were Badbea to Lothbeg and Burghead Bay, where only one vantage point was visited, and Buckie to Portsoy, where all vantage points were visited. In March, when only 11 volunteers were available, it was decided to omit two sectors (Badbea to Lothbeg and Riff Bank) and concentrate effort in the remaining sectors to provide adequate coverage within as many sectors as possible. Within these sectors, it was also decided where possible to prioritise those vantage points with greatest direct overlap with the digital aerial survey flight lines to facilitate direct comparisons. In March, volunteers re-surveyed 25 of the vantage points that were surveyed in January, including 10 of the original “essential” vantage points and 11 overlapping digital aerial survey flight lines. In some instances, vantage points were surveyed by volunteers but data was not submitted, in these cases we have treated the vantage points as not surveyed.
Table 3. Vantage points sampling design.
|
Shore of Moray Firth |
Sector |
Number of potential vantage points |
“Essential” vantage points codes a |
Vantage points overlapping digital aerial survey flight lines a |
Total vantage points surveyed in January |
Total vantage points surveyed in March |
|---|---|---|---|---|---|---|
|
North |
Badbea to Lothbeg |
6 |
1a [b] |
(Excluded from design in March) |
1 |
0 |
|
North |
Brora |
4 |
3 [a] |
3 [a] |
3 |
3 |
|
North |
Outer Dornoch Firth |
10 |
6 [a], 15 [a] |
(5), 7 [a], 19 [a] |
6 |
5 |
|
North |
Easter Ross Coast |
7 |
25 [a] |
22 [a], (24) |
4 |
3 |
|
Both |
Riff Bank |
10 |
34 [a], S1 [b], 39 [b] |
29, 33, 38 (Excluded from design in March) |
7 |
1 |
|
Both |
Inverness / Beauly Firth |
19 |
I/B5 [a], S7 [a] |
I/B2 [a], I/B7 [a], S2 [b], S3 [b] |
13 |
5 |
|
South |
Nairn and Culbin Bars |
6 |
(43) |
45 [a] |
3 |
4 |
|
South |
Burghead Bay |
5 |
50 [b] |
(48), 52 [b] |
1 |
2 |
|
South |
Burghead to Lossiemouth |
6 |
(56), 58 [a] |
57 [b], 58 [a] |
2 |
3 |
|
South |
Spey Bay |
7 |
(59), 62 [a] |
62 [a] |
5 |
2 |
|
South |
Buckie to Portsoy |
4 |
N3 [a] |
N4 [b] |
3 |
0 |
|
TOTAL |
– |
84 |
17 |
22 |
48 |
28 |
[a] indicates surveyed in both January and March; [b] indicates surveyed in either January or March; enclosed in brackets indicates not surveyed
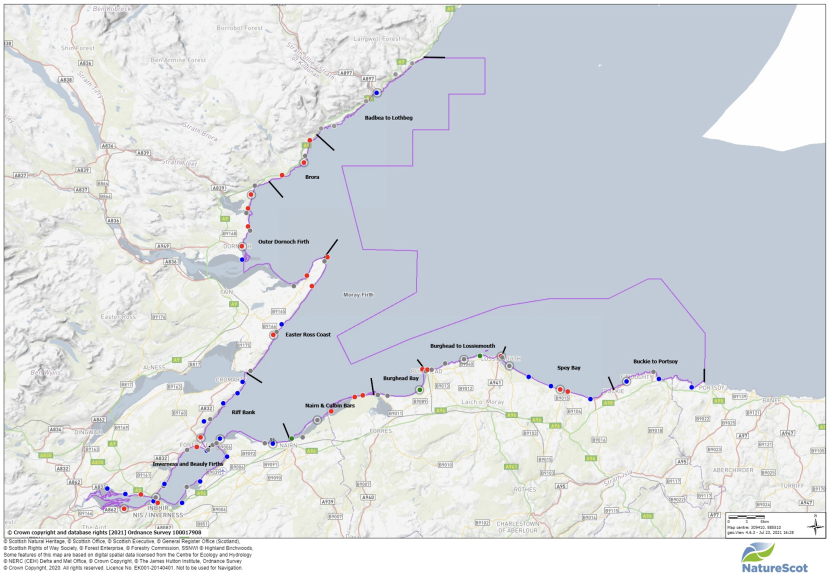
Map showing the Moray Firth SPA and indicating vantage points and when they were surveyed. Pink line indicates Moray Firth SPA boundary. Red vantage points were counted in both the January and March surveys (n=25), Blue in January only (n=23) and Black in March only (n=3). Grey vantage points were not surveyed. Vantage points initially identified as “essential” (Table 3) are circled.
© Crown copyright and database rights [2021]. Ordnance Survey 100017908. © Scottish Natural Heritage. © Scottish Office. © Scottish Executive. © General Register Office (Scotland). © Scottish Rights of Way Society. © Forest Enterprise. © Forestry Commission, SSNWI. © Highland Birchwoods. Some features on this map are based on data from the Centre for Ecology and Hydrology © NERC (CEH), Defra and Met Office. © Crown copyright. © The James Hutton Institute. Ordnance Survey. © Crown copyright 2020. All rights reserved. Licence No. EK001-20140401. Not to be used for navigation.
Recording methods and protocol
Volunteer observers were provided with a protocol to undertake the survey and a recording form on which to detail each survey (Annexes 3 and 4). Volunteer observers were asked to fill out recording sheets for each vantage point they visited.
Prior to beginning the survey observers were required to fill in sections of the form detailing their names, equipment used and the vantage point that they are surveying. We also asked that observers record the grid reference if the location of the vantage point was different from that provided. Observers were asked to make a judgement about the exact vantage point location on the day, as the project officer was not able to visit every vantage point in advance to assess viewshed and elevation. Volunteers were then asked to complete environmental information, including sea state (using Beaufort scale), visibility, cloud cover (measured in Oktas), glare and tidal state (details of the measurements used are provided in Annex 4). After completing this information volunteers were able to begin their survey, recording the date and time started. Once observers had finished the survey the finish time was also recorded in order to derive effort data.
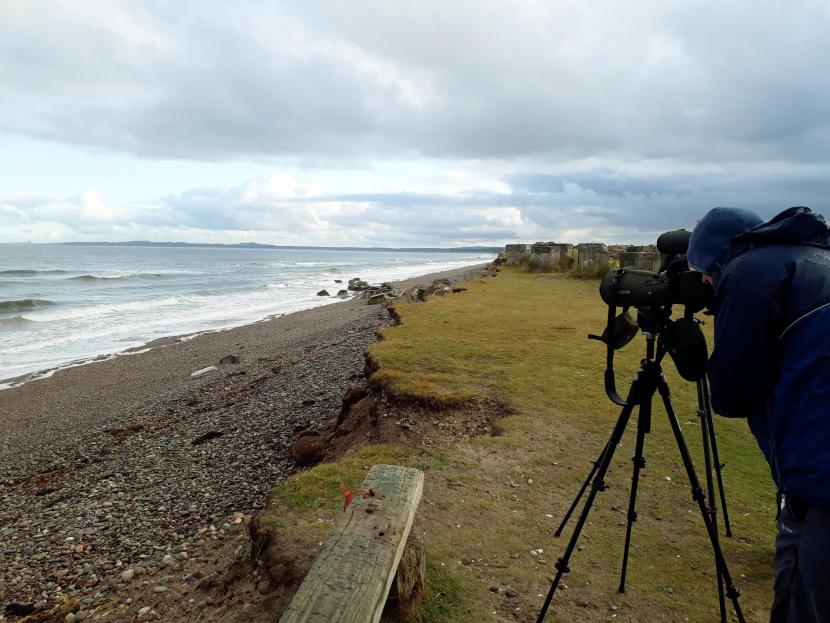
Observers were provided with a map of the vantage point and associated survey area (see example at Figure 8), which provided boundaries within which to complete their survey. Observers were encouraged to scan as methodically as possible using binoculars across the entire survey area (from left to right) to identify birds to be counted. Observers were then asked to use a telescope to identify and count all birds of the target species (Figure 9), and to scan further out to sea, where some species may not be found using binoculars only. Volunteers were permitted to count the birds in any way they chose e.g. using tally counters and techniques such as counting in 10s or 100s to estimate numbers in large flocks.
As the number of birds present differ with location and also time of day and tide height, observers were not restricted to a time limit for the survey, but were asked to stop surveying once they felt all the birds that were present during the first scan had been counted. This was to ensure that observers were not surveying the site for an extended period during which significant movement into or out of the survey area could occur.
Birds were identified to species level, where possible. However, if the species was unknown, observers were asked to indicate to lowest taxonomic rank possible, for example, ‘diver sp.’ or ‘scoter sp.’. Observers were asked to record all of the SPA qualifying features, scanning from left to right across the survey area. The protocol asked that no birds in flight were recorded unless they had taken off or landed in the survey area. Observers were asked to count flocks of over 50 individuals twice before recording the count or a third time where there was a large discrepancy between the first and second count. When recording the birds observed on the survey, the following information was recorded: species, number (count estimate), behaviour, bearing (for flocks of 50 or more) from vantage point, estimated distance from vantage point, count quality, comments and a map reference. Bearings to flocks and distance estimates were recorded in order to infer distribution within each vantage point survey area, and to restrict the data to within 2kms for analyses. We provided observers with maps in order to aid their estimation of distance to birds and to allow observers to show estimated locations of flocks.
Observers were asked to record their confidence in count quality (Good, Moderate or Poor) to gain more nuanced understanding of the quality of the data, and the certainty of the observers in their identification and counts.
We provided space on the recording form for comments, in case observers wished to note specific information about flocks which we did not anticipate (e.g. where they felt there may have been double counting, or notes on the identification of species).
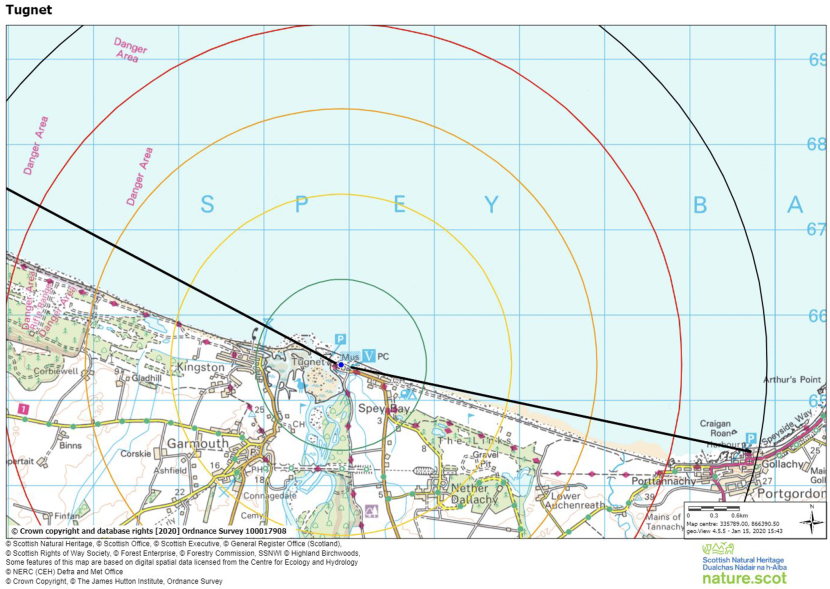
Map of a VP with viewshed out to sea and distance bands in concentric circles out to a distance of 5 km.
© Crown copyright and database rights [2020].
Mapping and distance recording
All shore-based survey methodologies for marine birds are limited by distance to target species. Distance from the observer is a factor which greatly affects the detection and identification of species. The distance over which a bird may be detected and identified will also be affected by the bird’s size, plumage pattern and behaviour and by extrinsic factors including weather conditions, observer experience and optical equipment. However, under good conditions, observers are generally able to identify and count birds at up to 2km from the shore (Jackson and Whitfield, 2011; Waggitt et al., 2014; Oedekoven et al., 2013, Webb et al., 1990). Some birds may be visible at a greater distance, although counts and identification of such birds might be far less accurate and far more difficult to obtain.
A challenge in developing the survey protocol was how to verify which observations were in fact of birds within 2km, such that more distant birds could be excluded from relevant analyses. One option was to ask observers to only record birds within the 2km limit. However, it was felt that this might inhibit the collection of data with observers having to establish whether a bird was in or outside of the 2km boundary prior to counting it. This would add further opportunity for error and different rules being applied by different observers or even on different occasions by the same observer. Furthermore, important contextual information would have been lost at certain vantage points where large aggregations of the qualifying features such as scoter and long-tailed duck can be present beyond 2km.
We therefore asked volunteers to record approximate distances and bearings to flocks of over 50 birds. Volunteers were provided with maps (see example at Figure 8) which showed 1km distance bands up to 5km distance and detailed the distance to any landmarks at sea such as buoys, headlands or skerries.
In estimating distance to objects at sea, range finders, or distance sticks, are considered an effective means of obtaining a rough estimate. However, distance sticks must be made to fit the observer, taking into account their height and arm length and the elevation of the vantage point. Some training would be required to allow observers to use this type of equipment. This was not felt to be a realistic method for the Citizen Science Pilot due to tight project time constraints and the requirement for observers to make this to specification prior to visiting the vantage point. Instead we chose to use the mapping approach, which, while having limitations, was easy to provide to observers and simple to use.
Corrections for potential double counts
The potential for double counting large numbers of birds from adjacent vantage points was identified when reviewing the spatial sampling design. If a whole site survey were undertaken, double counting would be a significant concern as several of the vantage points had viewsheds which overlapped within the 2km boundary. However, a significant portion of the potential vantage points were not surveyed due to limited numbers of volunteers. Consequently, the majority of the vantage points which were surveyed in January and March were at sufficient separation to eliminate the possibility of double counting.
A small number of the vantage points with overlapping viewsheds remained and were surveyed. These vantage points therefore had the potential for double counting to occur. This risk was mitigated by having the same observer survey adjacent vantage points. Consequently, the observer had knowledge of the adjacent site and would be more likely to identify potential instances of double counting the same bird or birds. Furthermore, volunteers were asked to mark large flocks on maps and to record distances and bearings to these flocks such that obvious instances of double counting could be readily identified.
Some inherent problems still exist in particular for species which have smaller populations and are more locally sparse.
Data compilation and quality assessment
All data from both Citizen Science Pilot surveys, including counts from vantage points with no observations of the SPA qualifying features, were compiled into a Microsoft Excel spreadsheet (extract available in Annex 5) and each observation was assigned a unique ID code. The data were quality assessed during the input process and a few records that were not collected using the standard methodology were excluded to enable comparison with other vantage points. When inputting data into the database, the project officer standardised elements of the observations e.g. all distance estimates were converted into meters. This process raised queries around how to categorise entries that straddled two coded choices. For example one observer stated that the sea state was ‘1-2’. The decision was made to record the information as the observer recorded it, so that potentially incorrect interpretations were not coded into the raw data.
In general information on distance was retained as records for the majority of cases data was recorded clearly e.g. 2800m. However in some instances distance recording was not clear e.g. 'up to 3000m' or '<3000m'. In order to enable identification of data at less than 2km, some assumptions were made. Any records which stated numbers "up to 3000m" were assumed to be within 1km of the upper limit e.g. between 2001m and 3000m. Numbers recorded as e.g.<3000m were assumed to be between 2001m - 3000m and those recorded as e.g. >1000 were assumed to be between 1001m and 2000m. These assumptions allowed us to filter data based on those records that were less than 2000m
One potential double count was identified by a volunteer and this was highlighted in the database. However the database was not systematically checked for double counts.
Citizen Science Pilot field test
Field tests enable investigation of factors that might influence the quality and repeatability of the Citizen Science Pilot surveys. In particular, key questions were developed about how species-specific, environmental and observer factors affected count quality and whether these factors can be controlled for through survey design and data collection protocol (Annex 4).
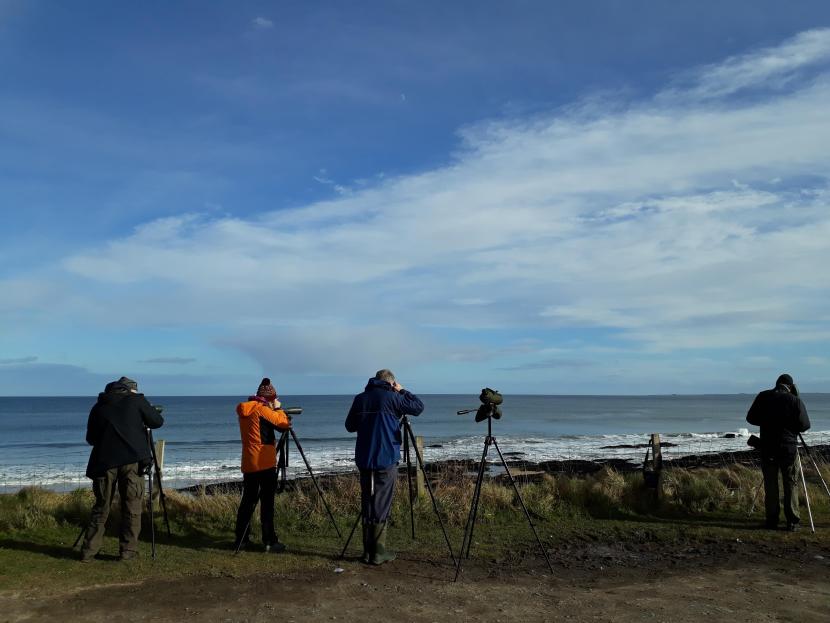
A field test was completed investigating inter-observer effects. Further field tests were planned seeking to investigate how environmental conditions might impact the quality of observations, but had to be cancelled due to the Covid-19 crisis. The field test was undertaken at Embo on the 3rd of March 2020, using six volunteers to assess how observers differ in count identification and estimation (Figure 10). All the observers were experienced ornithologists with knowledge of the SPA qualifying features and with some background in participating in organised counts. The volunteer observers were asked to answer some questions about their experience level.
Five of the participants were provided with the same telescope, a Swarovski ATS 65 with a 20-60x zoom lens. One participant used their own telescope (Nikon Fieldscope ED 82 with 30x wide angle eyepiece). The project officer, who organised the field test, was present to provide instructions, but did not participate in order to reduce the chance of any influence on the observers.
The field test was undertaken from a vantage point selected for the range and number of SPA qualifying features, as well as the presence of landmarks to aid observers in dividing the site. The viewshed of the field test vantage point was divided into four sections (Figure 11) in order to maximise the number of samples (6 observers x 4 sections = 24 samples). The sections were defined from the vantage point to certain distant landmarks. Sections were discussed and agreed with the volunteer observers before starting the field test.
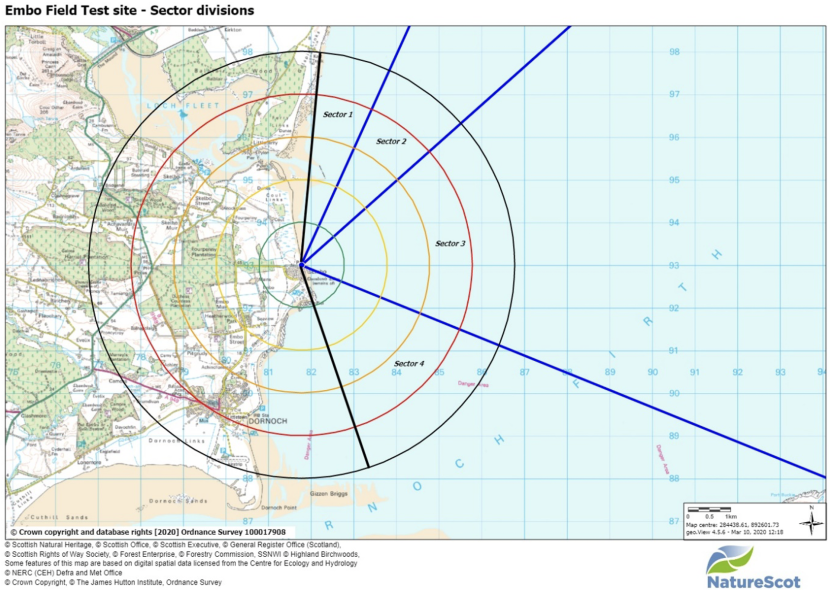
Map showing Embo test site with lines denoting the end of each sector and 1 km distance bands.
© Crown copyright and database rights [2020]. Ordnance Survey 100017908. © Scottish Natural Heritage. © Scottish Office. © Scottish Executive. © General Register Office (Scotland). © Scottish Rights of Way Society. © Forest Enterprise. © Forestry Commission, SSNWI. © Highland Birchwoods. Some features on this map are based on data from the Centre for Ecology and Hydrology © NERC (CEH), Defra and Met Office. © Crown copyright. © The James Hutton Institute. Ordnance Survey. © Crown copyright 2020. All rights reserved. Licence No. EK001-20140401. Not to be used for navigation.
Observers conducted synchronised counts of each section, all beginning their survey at the same time and counting clockwise from the start of the section to the end. However, observers were allowed to complete each section in their own time before resynchronising at the beginning of the next section. This was to allow for differences in speed of recording and consequently to ensure that each observer completed the survey of each section. Volunteer observers were asked to follow the standard count protocol (Annex 4). No tally counters were used during the field test to minimise potential differences among observers in count methods.
Field test analysis
Descriptive statistics were used to investigate differences among observers. The raw counts were used to compare observers by both species and sectors recorded. We used a coefficient of variation to examine how inter-observer variability affects species counts.
Observers were ranked on their experience based on their answers to two questions:
- How would you describe yourself? (a. Occasional birder; b. Active birder; c. Committed birder; d. Expert birder)
- How many waterfowl surveys (or similar) have you taken part in previously? Could you please name the survey type(s).
This method was chosen as it was felt that only one metric might provide a biased ranking of experience. We used this observer experience metric to qualitatively investigate how experience might impact observer counts and potential underlying reasons for any variation.
Citizen Science Pilot volunteer feedback
To ascertain the practicality of the bespoke NatureScot citizen science model for monitoring IWW within MPAs, an online questionnaire was developed to invite feedback from volunteers about their experience of participating in the pilot study. The full questionnaire is detailed in Annex 6.
The questionnaire was designed to target volunteers’ thoughts on their experience of the Citizen Science Pilot surveys, whether they had taken part in other similar surveys and whether they would be interested in participating in this type of survey in future. In order to identify how a bespoke programme of citizen science shore-based monitoring of IWW in MPAs might be coordinated and delivered in future, further questions were included to ascertain any difficulties encountered in completing the protocol, and if volunteers were happy with the communication and planning of the surveys.
The questionnaire was created using Survey Monkey (an online questionnaire platform) and distributed by email to all volunteers. Volunteers were asked to self-complete the questionnaire and the results were automatically and anonymously collated by Survey Monkey. Further feedback was ascertained through informal conversations between the project officer and volunteers.
The volunteer feedback questionnaire was analysed using descriptive statistics. Qualitative thematic analysis was used to investigate responses to open questions by identifying common recurrent themes in participant responses.
Digital aerial survey
The digital aerial survey design consisted of a series of parallel transects which were oriented approximately perpendicularly to the main gradients (bathymetry and proximity to coast) that were likely to affect bird distributions (Figure 12). This ensured that bird abundance was sampled across a wide range of these habitat values. A non-stratified approach was adopted with transects spaced at 3km distance apart. This spacing meant that with a 500 m survey swathe, approximately 16.7 % site coverage could be achieved (Table 4 and Figure 12), which was broadly similar to the effective coverage achieved in previous visual aerial surveys of the site described by Lawson et al. (2015).
The survey was split between two aircraft to ensure surveys could be completed in a day. Constraints imposed by the Ministry of Defence meant that flights had to take place at the weekend in order to achieve full coverage of the Moray Firth SPA. However, this fitted well with the availability of citizen science field workers for the concurrent vantage point watches. Weather considerations also limited surveys to days with no precipitation, cloud bases of at least 600m and wind speeds no higher than Beaufort force 6.
Table 4. Digital aerial survey effort across the Moray Firth SPA in 2019/20
|
Survey date |
Number of transects |
Total transect length surveyed (km) |
Area covered (km2) |
Percentage of SPA coverage |
|---|---|---|---|---|
|
19th January 2020 |
42 |
593.76 |
296.88 |
16.84% |
|
8th March 2020 |
42 |
597.76 |
298.88 |
16.96% |
The surveys were flown at approximately 220 km/hr at an altitude of ca. 550m (1800ft), providing a 2cm Ground Sample Distance (GSD) resolution. The resulting video footage was converted into a format for further analysis and images were manually reviewed by trained reviewers and then assessed and identified by a team of trained ornithologists. Further details are in Scott et al. (2022).
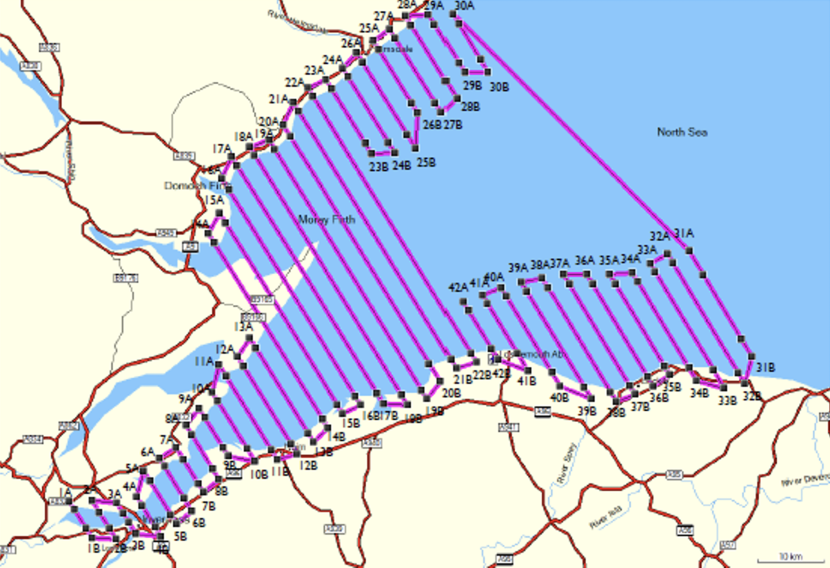
Map showing the Moray Firth SPA and the locations of the digital aerial survey transects.
Comparative analyses
The focus of this element of the project was on exploratory comparative analyses of data from contemporary and historic surveys of wintering waterbirds in the Moray Firth, namely:
- 2019/20 Digital Aerial surveys
- 2019/20 Citizen Science Pilot surveys
- Wetland Bird Survey (WeBS)
- RSPB Moray Firth Wintering Seaduck Counts surveys
These data sets differed in survey methods and spatial and temporal coverage (Figure 13). The focus of the analyses reported here was on investigating the potential of the different types of survey data to provide robust and consistent indices of changes in bird populations within and across the Moray Firth SPA.

Timeline of surveys on inshore wintering waterfowl in the Moray Firth and years for which data was used in comparative analysis (Orange = RSPB surveys, Purple = JNCC Visual Aerial Surveys, Green = WeBS, Blue = Digital Aerial surveys and Yellow = Citizen Science Pilot surveys). Data was extracted for analysis for years with solid bars, dotted lines indicate additional availability of given data set from 1977 (when RSPB surveys commenced). Data were extracted from RSPB surveys conducted from 1998 until 2006, JNCC visual aerial surveys from 2000 until 2007and the WeBS from 1998 until 2019. Data from the HiDef digital aerial survey and NatureScot Citizen Science surveys cover the period 2019/2020.
As detailed in Scott et al. (2022), comparative analyses methods were developed by HiDef under contract to NatureScot and applied to three of the Moray Firth SPA qualifying features; common scoter, common eider and red-throated diver. These three species were selected on the basis of their differing habits and distributions. Red-throated divers forage on fish in the water column and are widely dispersed across the Moray Firth SPA. Common eiders feed predominantly on benthic bivalves, such as blue mussels, and are moderately dispersed, predominantly in nearshore waters. Common scoters occur in a few large aggregations and exhibit simultaneous diving behaviour to forage on bivalves in soft sediments.
Where there were sufficient data, the same analyses were then applied to the remaining qualifying features by the NatureScot project officer, with technical guidance from HiDef. Data processing and analyses were completed using the R programming language (version 3.4.3). The most recent version of the annotated R code used to carry out these analyses is available on Github.
Data processing
The data included in the comparative analyses were variously spatially and temporally defined and aggregated and were stored in a range of formats. Consequently, as summarised in Table 5, considerable initial data preparation and manipulation was undertaken by HiDef (Scott et al., 2022) to enable subsequent statistical analyses and interpretation.
Table 5. Summary of data processing and extraction for comparative analyses.
|
Data set |
Spatial data extracted |
Count rate data extracted |
Notes |
|---|---|---|---|
|
Digital aerial survey (Jan & Mar 2020) |
Bayesian point pattern process used to predict bird densities across the SPA at a 1 x 1 km grid resolution. |
Not applicable |
Insufficient data to generate population estimates by this method for some species (Table 7) |
|
Citizen Science Pilot surveys (Jan & Mar 2020) |
Numbers of birds within 2km buffers around vantage points (Fig 13) |
Numbers of birds counted per hour |
Where spatial buffers overlapped, polygons were merged, and the average count taken. |
|
WeBS counts (1998/99 - 2019/20) |
Total numbers of birds counted within each count sector (Figure 5) for each monthly count |
Numbers of birds counted per hour in each count sector (Figure 5) for each monthly count |
For count rate, mean value of survey effort across all surveys used where not specified (69% of cases) |
|
RSPB vantage point surveys for Dec & Jan (1998 – 2006) |
No spatial analyses feasible. |
Mean count rates (birds/hr) in three broad sub-regions (The Outer Dornoch Firth, Nairn and Culbin Bars and Inverness and Beauly Firths; Figure 6) for each monthly count |
Some missing information on count locations. No information on the spatial effort. Limited data on count durations, survey effort in each sub-region inferred from approximate mean time for vantage point counts (c.0.4 hours). |
Count methods varied among data sets, and there were some gaps in the information captured with respect to on spatial coverage or survey effort. Consequently, some subsequent analyses were based on comparison of densities of birds within defined areas while others focused on comparative rates of observations. Where relevant, count rates were used to provide a measure of effort because raw count data cannot be used to reliably compare between methodologies (e.g. if in one method an observer counts 100 birds over two hours, but in another method the observer counts 10 birds over 15 minutes, the difference in counts reflects temporal effort).
Comparing the digital aerial survey models to Citizen Science Pilot survey counts
To compare the Citizen Science Pilot vantage point counts to the HiDef digital aerial survey data, the mean density in the 2km vantage point buffers (Figure 14) was compared to the mean modelled density of birds from the aerial surveys within the same areas. These comparisons were made using linear regression and correlation. The data were also examined on a log-log scale in case there were issues of magnitude differences in counts or estimates.
For each species in the two survey months (January and March 2020), the linear relationship (either natural scale or log-log scale) with the highest Spearman’s correlation coefficient was selected (Scott et al., 2022).
Comparing Citizen Science Pilot survey counts to contemporary WeBS counts
A spatial merge was performed on the Citizen Science Pilot vantage point counts of 19th January 2020 and WeBS counts of 12th January 2020 using the R programming language. The WeBS data for March 2020 were not available at the time when these analyses were undertaken. All Citizen Science Pilot vantage points that fell within the boundaries of a WeBS sector were combined and a mean density was calculated. The mean density of the WeBS counts for each sector were also calculated using the area of the WeBS sector polygons (Figure 5). These densities were compared using a linear comparison and a Spearman’s rank correlation coefficient was calculated.
Comparing historic RSPB counts to WeBS counts
The initial explorative analyses of the RSPB vantage point surveys described in Scott et al. (2022) included three sub-regions in two months (Table 5). The extension of these analyses was restricted to the Outer Dornoch Firth and the Nairn and Culbin Bars sub-regions (Figure 6) as for a number of species there were zero or few data within the Inverness and Beauly Firths sub-region (see e.g. Figures 38, 39, 44 and 45 in Scott et al., 2022). By contrast, both the Outer Dornoch Firth and the Nairn and Culbin Bars sub-regions are well known for higher numbers of observations and were well covered by both RSPB and WeBS counts.
WeBS sectors (Figure 5) which fell into these two selected RSPB sub-regions were merged.
The mean count rates of birds (birds/hour) were then calculated for each species for these two sub-regions in December for each year, as counts were made in this month in all years.
The time series of rates of counts in the WeBS data and the RSPB data were then compared using a standard linear model to obtain the Spearman’s rank correlation coefficient.
Results
Citizen Science Pilot surveys
January surveys covered 48 vantage points, while in March 28 vantage points were surveyed, 25 of which were sites which had been previously surveyed in January (Figure 14). See Annexes 2 and 5 for details of surveyed vantage points and an extract of the original data.
Table 6 summarizes the counts for both the January and March surveys. Distance from shore strongly influences bird densities for most species, however it was not feasible to correct for reduced detectability because observers estimates of distance were not consistent or reliable enough to do so. Hence, the observations from each surveyed vantage point will underestimate actual numbers of birds within the field of view. Furthermore, the Citizen Science Pilot vantage points covered discrete sections of the Moray Firth SPA coastal waters and should not be considered to offer a whole site survey. Therefore, the counts detailed should be considered a minimum estimate of the birds present in the survey site during each round of survey.
Table 6. Total numbers of qualifying features observed from shore-based vantage points in the Moray Firth SPA in January and March 2020. Figures in brackets are numbers judged by observers to be within 2km of the vantage point. Note that the overall coverage and vantage points differed between the two surveys (Figure 14 and text).
|
Species |
19th January 2020 |
8th March 2020 |
|---|---|---|
|
Great northern diver |
4 (4) |
2 (2) |
|
Red-throated diver |
28 (23) |
14 (14) |
|
Unidentified diver spp. |
4 (4) |
1 (1) |
|
Slavonian grebe |
8 (8) |
39 (22) |
|
Common eider |
1913 (1324) |
1745 (1739) |
|
Long-tailed duck |
2027 (1882) |
1326 (1226) |
|
Greater scaup |
60 (8) |
64 (63) |
|
Common scoter |
1412 (1395) |
552 (552) |
|
Velvet scoter |
58 (58) |
42 (42) |
|
Unidentified scoter spp. |
4712 (4710) |
6880 (380) |
|
Common goldeneye |
191 (187) |
13 (13) |
|
Red-breasted merganser |
152 (100) |
39 (36) |
|
Unidentified duck spp. |
100 (93) |
287 (287) |
|
European shag |
137 (116) |
68 (68) |
|
Total |
10806 (9964) |
11072 (4445) |
Table 7 summarizes the data from the 2020 digital aerial surveys and Citizen Science Pilot surveys as well as historic WeBS, RSPB, visual aerial survey and European Seabirds at Sea (ESAS) data underpinning identification and classification of the Moray Firth SPA. The data in this table do not provide a like for like comparison due to the differing areas surveyed, and methods used.
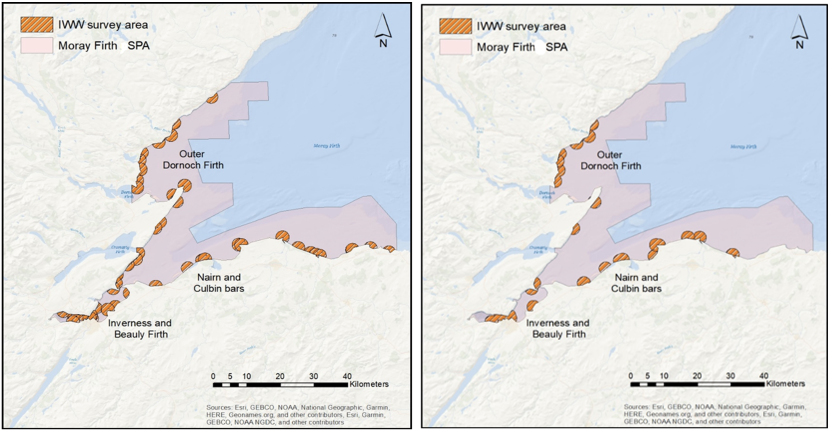
Maps of the Moray Firth SPA showing the locations of the two 2020 pilot citizen science surveys. More locations were surveyed in January than in March.
Sources: Esri, GEBCO, NOAA, National Geographic, Garmin, HERE, Geonames.org, and other contributors, Esri, Garmin, GEBCO, NOAA NGDC, and other contributors.
Table 7. Target species: total Citizen Science Pilot survey counts and digital aerial survey modelled population estimates in 2020 with comparison to data from previous surveys underpinning site selection (Lawson et al., 2015). Figures marked with [a] are the Moray Firth SPA citation population estimates (see Table 1). The coverage of the site varied between survey types and so the figures are not directly comparable between survey types and periods. Note in particular: a) under visual aerial surveys, the figures in parenthesis refer to the original Area of Search (Lawson et al, 2015), whereas those used in the SPA citation (marked by [a]) are corrected to the (smaller) final SPA boundary; and, b) the January 2020 WeBS count data were incomplete when supplied. The population estimates from the 2020 digital aerial surveys are derived using Bayesian models, with 95% Confidence Intervals shown in parenthesis (see Scott et al., 2022 for full details).
|
Survey and years |
Great Northern Diver |
Red-throated diver |
Slavonian grebe |
Common eider |
Long-tailed duck |
Greater scaup |
Common scoter |
Velvet scoter |
Common goldeneye |
Red-breasted merganser |
European shag |
|---|---|---|---|---|---|---|---|---|---|---|---|
|
Citizen Science Pilot Jan 2020 |
4 |
28 |
8 |
1913 |
2027 |
60 |
1412 |
58 |
191 |
152 |
137 |
|
Citizen Science Pilot Mar 2020 |
2 |
14 |
39 |
1745 |
1326 |
64 |
552 |
42 |
13 |
39 |
68 |
|
Digital aerial survey Jan 2020 |
180 |
254 |
Only 5 detected- no model |
3808 |
1624 |
Only 1 detected- no model |
9989 |
49 |
49
|
Only 8 detected- no model |
None detected |
|
Digital aerial survey Mar 2020 |
750 |
918 |
Only 4 detected- no model |
3355 |
4530 |
None detected |
2091 |
Only 2 detected- no model |
93
|
355 |
1762 |
|
WeBS Jan 2020 |
- |
13 |
4 |
1136 |
3001 |
114 |
1399 |
46 |
160 |
144 |
51 |
|
WeBS Mean of Peak 2006/07 – 2010/11 |
2 |
28 |
26 |
970 |
3,118 |
492 |
1,442 |
206 |
169 |
91 |
105 |
|
RSPB Mean of Peak 2001/02 – 2005/06 |
59 |
119 |
43 [a] |
1,435 |
5,001 [a] |
930 [a] |
5,479 [a] |
1,488 [a] |
907 [a] |
151 [a] |
- |
|
Visual Aerial Mean of Peak 2001/02; 2003/04 – 2006/07 |
144 [a] |
324 [a] |
0
|
1,733 [a] |
(3,167) |
0 |
(2,544) |
(249) |
(74) |
(90) |
- |
|
ESAS hotspot analyses of 1980 – 2006 data |
- |
- |
- |
- |
- |
- |
- |
- |
- |
- |
6,462 [a] |
Comparison with additional seaduck counts in the Outer Dornoch Firth
In the Outer Dornoch Firth, shore-based counts and distribution mapping of seaduck were undertaken by voluntary research from 2018-2020 (Patterson, 2019 & 2021). The methodology followed was similar to the Citizen Science Pilot methodology but prioritized counting large flocks of seaducks, divers and grebes over other species such as shag. Counts were undertaken regularly (weekly and opportunistically), from vantage points at Dornoch Golf Club, Golspie and Littleferry. Counts were scheduled to coincide with good weather conditions in which to survey.
These counts recorded 5,040 common scoter on the 26th of January 2020. The Citizen Science Pilot survey recorded 4,676 unidentified scoter species from the same VPs on the 19th of January. Table 8 details the counts by both David Patterson and the Citizen Science Pilot in 2020 for common scoter/scoter spp. Despite the ‘snapshot’ nature of the Citizen Science Pilot counts, the comparison suggests that the estimate is representative when compared to data from similar methods employed more regularly. Previous peak estimates from the RSPB seaduck surveys estimated common scoter at around 5,000 individuals.
Table 8. Counts undertaken by David Patterson (DP) and by Citizen Science Pilot (CS) in January, and February and March 2020.
|
Source |
Date |
Common Scoter count |
Scoter spp. count |
|---|---|---|---|
|
CS |
19th January |
4,676 |
– |
|
DP |
26th January |
– |
5,040 |
|
DP |
20th February |
7,050 |
– |
|
CS |
8th March |
– |
6,881 |
Field Test Results
During the field test, each sector was surveyed once by each of the six observers. All of the Moray Firth SPA qualifying features were recorded by at least one observer, with the exception of great northern diver. The results of the field test are illustrated below comparing the populations estimated by each observer across all four sectors (Figure 16) for each of the species. It is important to note that observers 1- 5 were all using the same scope (Swarovski HD 20x60) while observer 6 was using a Nikon Fieldscope ED 82 mm objective with 30x wide angle eyepiece.
Observations were highest in sector one, with 66% of total birds recorded observed in the first sector (Table 9). Sector three was the quietest section with only 117 total birds recorded from all observers.
Table 9. Embo field test observations per sector
|
Sector |
Observations |
Percentage of total |
|---|---|---|
|
1 |
16603 |
66.8 |
|
2 |
5859 |
23.6 |
|
3 |
117 |
0.47 |
|
4 |
2240 |
9.02 |
Table 10 shows total counts across all four sectors for each species and observer and Table 11 shows mean counts with associated coefficients of variation across observers for each species. Observer counts varied more in sectors one and two than in sectors three and four, perhaps reflecting the much higher overall numbers of birds, particularly scoters and common eiders present and associated counting challenges.
Table 10. Overall counts for each species across all sectors by observer (Obs)
|
Species |
Obs. 1 |
Obs. 2 |
Obs. 3 |
Obs. 4 |
Obs. 5 |
Obs. 6 |
|---|---|---|---|---|---|---|
|
Great northern diver |
0 |
0 |
0 |
0 |
0 |
0 |
|
Red-throated diver |
2 |
2 |
3 |
0 |
2 |
0 |
|
Slavonian grebe |
2 |
3 |
5 |
1 |
9 |
3 |
|
Common eider |
33 |
422 |
541 |
50 |
0 |
118 |
|
Long-tailed duck |
307 |
379 |
715 |
503 |
643 |
106 |
|
Greater Scaup |
0 |
0 |
0 |
3 |
3 |
0 |
|
Common scoter |
2 |
2243 |
2510 |
1219 |
2586 |
2481 |
|
Velvet scoter |
0 |
0 |
2 |
1 |
1 |
1 |
|
Scoter sp. |
3220 |
0 |
0 |
5470 |
1140 |
0 |
|
Common goldeneye |
0 |
0 |
1 |
2 |
2 |
0 |
|
Red-breasted merganser |
10 |
12 |
10 |
13 |
6 |
16 |
|
European shag |
4 |
1 |
4 |
0 |
6 |
1 |
|
All species |
3580 |
3062 |
3791 |
7262 |
4398 |
2726 |
Species related variation in counts
When all sectors were combined greater scaup, common eider and common goldeneye were amongst the most varied in counts (above 100% CV; Table 11). For greater scaup and common goldeneye, this very high level of variation was due to a small numbers present such that some observers may not detect the species. Velvet scoter, European shag, and Slavonian grebe showed the next highest variation between counts (between 70 and 82% CV; Table 11). The lowest variation within the site was for red-breasted merganser (27%; Table 11), alongside long-tailed duck, common scoter and red-throated diver (between 46 and 54%; Table 11).
In investigating the field test results it appears that the variability in counts reflects several different issues including detection or identification of birds, flock size estimation, delineation of boundaries between sectors and potentially movements of birds. For example, count variability between observers for greater scaup appears to be an issue of detecting or identifying greater scaup within the site as four observers did not record any. European shag were not recorded by all the observers and were only recorded in very small numbers across each sector. Those observers who did not record any European shag did record small numbers of great cormorant (Figure 16), which perhaps suggests that differentiating between these species was challenging.
All the observers recorded scoters in substantial, but varying numbers and to varying levels of identification to species (Table 10). Combining all scoter counts (including counts of scoter spp.) revealed a reduction in variation (Table 11), highlighting the similarity between the two species and consequent issues around identification between common and velvet scoter (Figure 15). The variation in counts for common scoter is therefore more a matter of count estimate than of detectability (on a presence/ absence basis) within the site.
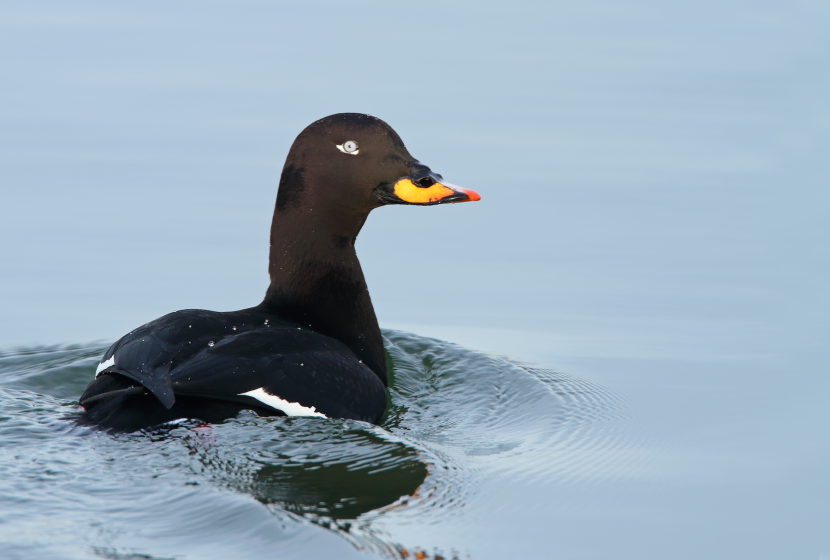
For some species the coefficient of variation was reduced by summing section one and two (e.g. red-breasted merganser) or across all sectors (common scoter). This might suggest that some of the variation between counts for this species can be accounted for, as a result of variation in observers’ delineation between the sectors, or potential movement of flocks across sectors.
The most surprising result in terms of overall estimates across the area is for common eider, given the relative visibility of this bird, and the consistency of estimates for other similarly visible species such as long-tailed duck. High variability in sectors 2 and 3 may reflect low absolute numbers present such that not all observers detected any common eider. However, the variation is also very high (107%) in sector 1 as a result of two very high estimates, between 400 and 520 birds from observers 2 and 3 respectively, and low or zero estimates from the other observers. A possible explanation for this is movement of a flock out of the sector (and potentially back again), or out of the count area entirely (e.g. further into Loch Fleet). This seems a likely explanation, given lower variation in common eider counts in sector 4 (47%). Alternatively this could be due to issues around distinguishing males and females, where males are being recorded more accurately due to their visibility and plumage but females may be recorded as something else, or missed entirely.
Table 11. Mean observations for each species per sector with the coefficient of variation, expressed as a percentage, in brackets. Note that the “all scoter combined” row includes birds not assigned to species.
|
Species |
Sector 1 |
Sector 2 |
Sector 3 |
Sector 4 |
Combined sectors |
|---|---|---|---|---|---|
|
Red-throated diver |
0.3 (141.4) |
0 (0) |
1.2 (91.5) |
0 (0) |
1.8 (54.4) |
|
Slavonian grebe |
2.3 (40.4) |
0.5 (152.8) |
0.7 (70.7) |
0.3 (223.6) |
4.0 (70.7) |
|
Common eider |
176.7 (116.2) |
0.7 (223.6) |
0.7 (111.8) |
16 (47.2) |
194 (107.8) |
|
Long-tailed duck |
326.0 (62.6) |
2.7 (80.0) |
3 (90.3) |
110.5 (31) |
442.2 (46.5) |
|
Greater scaup |
0.5 (223.6) |
0 (0) |
0.2 (223.6) |
0.33 (223.6) |
1.2 (122.5) |
|
Common scoter |
986.6 (84.6) |
695 (78.8) |
10.7 (73) |
147.83 (75.8) |
1840.2 (51.3) |
|
Velvet scoter |
0.3 (223.6) |
0.3 (141.4) |
0.2 (223.6) |
2.24 (0) |
0.8 (82.5) |
|
All scoter combined |
2253.7 (62.2) |
968.7 (33.2) |
11.7 (58.9) |
245.3 (28.0) |
3479.3 (47.9) |
|
Common goldeneye |
0.2 (223.6) |
0.3 (223.6) |
0.3 (223.6) |
0 (0) |
0.8 (107.7) |
|
Red-breasted merganser |
6.5 (42.4) |
3.0 (50.9) |
1.7 (74.8) |
0 (0) |
11.2 (27.6) |
|
European shag |
1.0 (100) |
0.7 (141.4) |
0.2 (223.6) |
0.83 (128.1) |
2.7 (80.0) |
That red-breasted merganser was the species with the least variability in count estimates is perhaps due an interplay between the inshore ecology of the species, and the unique plumage of this species, which is unlikely to be misidentified as any of the other Moray Firth SPA qualifying features.
Comparisons of results by observer
As illustrated by Figure 16 and Table 10, in general Observer 1 tended to count a bit lower than other observers. Observer 3 recorded the highest total counts for long-tailed duck, common eider and red-breasted merganser but the second lowest count for common scoter. Observer 4 had the highest total count; this was a result of very high estimates of scoter species relative to other observers. With the exception of scoter species, observer 4 generally recorded fewer of the other species, particularly common eider. Observer 1 tended to provide lower estimates for multiple species, for example Slavonian grebe, common eider and long-tailed duck. Observer 6 provided the lowest total count, perhaps as a result of different equipment used.
Observer 2 and Observer 6 detected the fewest species in general. Observer 2 did not record greater scaup, velvet scoter or common goldeneye where other observers did in low numbers. Observer 6 did not record any red-throated diver, greater scaup or common goldeneye where other observers did in low numbers. Observer 5 recorded the most species, but did not record common eider where others did and in most cases, in high numbers.
The observer with the most experience (Observer 3) tended to provide the highest estimates for large flocking species, for example, common eider and long-tailed duck. Observer 3 also recorded the most red-throated diver, and the second highest count of common scoter. This might reflect this observer’s experience with counting large flocks and species likely to be seen at some distance.
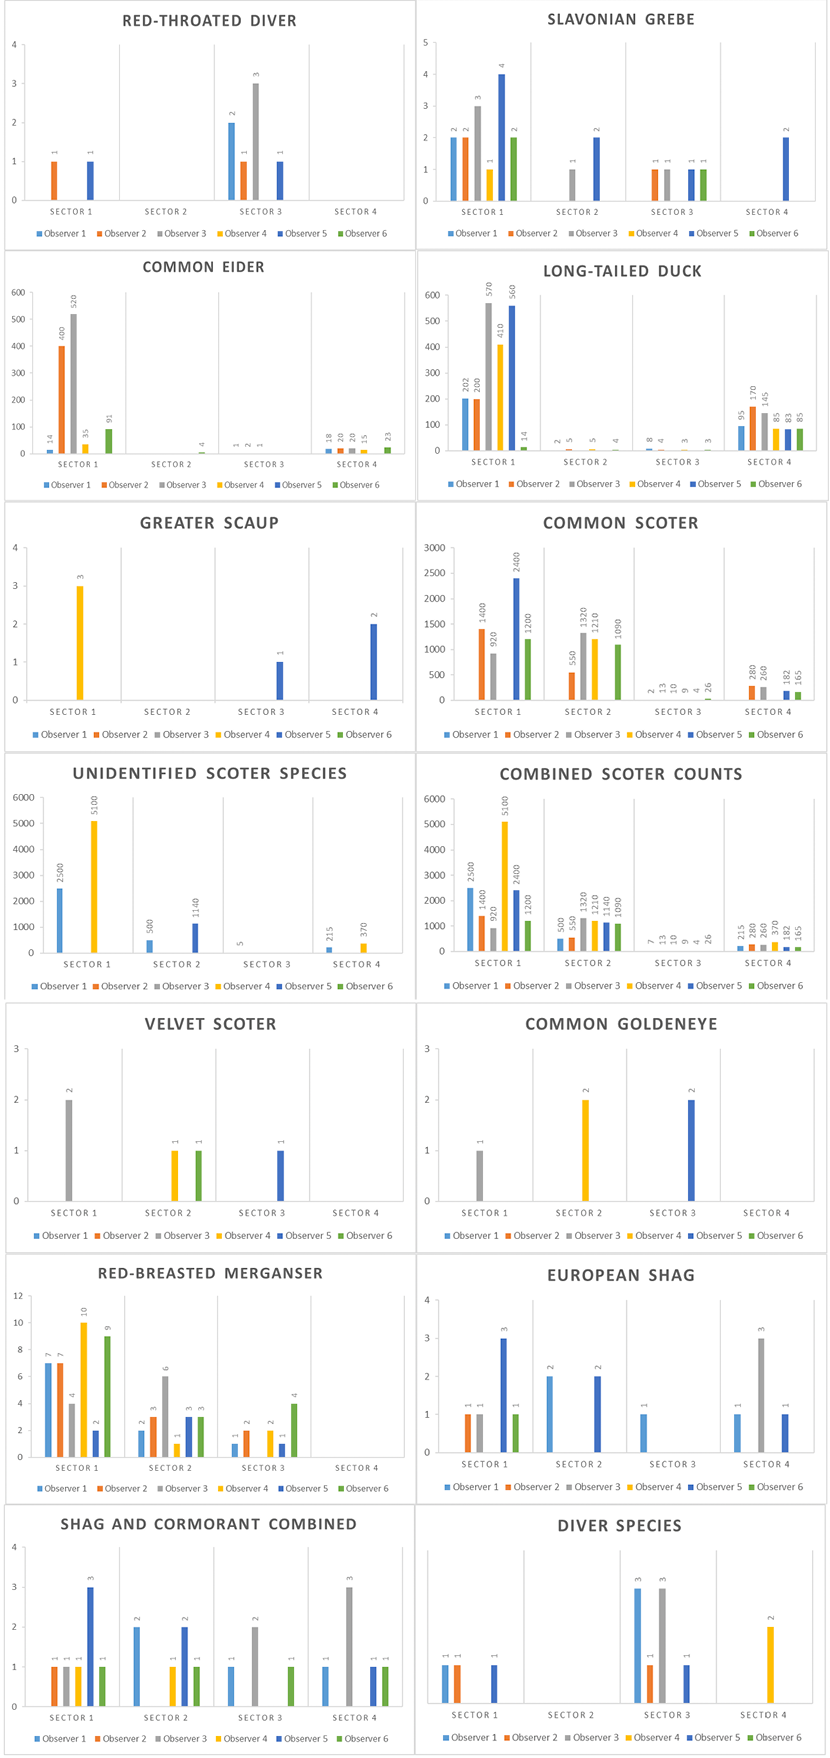
Bar charts showing estimates of species numbers by sector and observer for the following species: red-throated diver, Slavonian grebe, common eider, long-tailed duck, greater scaup, common scoter, unidentified scoter species, all scoter species combined, velvet scoter, common goldeneye, red-breasted merganser, European shag, shag and cormorant combined, and diver species.
The differences between the observers are described in the paragraphs under the heading “Comparison of results by observer”.
When scoter counts were removed from the analysis, Observer 3 (most experienced) clearly showed a larger estimate across all species (1281 individual birds). The lowest count across all species was from observer 6 (245 birds) who used a different telescope of a lower quality and zoom magnitude to the other observers. However, the other counts were not predictable based on experience, with the second most experienced observer (from survey experience) recording the second lowest count.
Observations were compared at multiple spatial scales, by restricting the data to observations reportedly made within 2km and 3km. These analyses did not reveal any consistent reduction in variation between counts. For instance, limiting the data analysed for common scoter to counts reportedly within 2km, resulted in larger variation between counters, perhaps because this species tends to flock further off the coast. This analysis perhaps more clearly reveals variation in distance recording, with observers ranging significantly in their estimation of the distance to a flock. For example, for common scoter, in sector one, only two observers agreed on the distance to the flock with estimates between all of the observers ranging from 2-4km.
It is possible that there is an interplay between experience of surveying and experience of bird watching or recreational birding. It is not clear from this data how this might affect either detection or counts.
Volunteer Feedback
We had 26 respondents to our questionnaire, which was sent to all of the volunteers who took part in the Citizen Science Pilot in January and March 2020 (Annex 6). Respondents answered questions about their experience undertaking surveys.
The majority of the volunteers heard about the survey from our email sent to local birding networks, or through their local bird club. Only a small fraction of the volunteers found out about the survey from posters and physical marketing. Recruitment from friends was common amongst volunteers.
We also asked if volunteers had taken part in any other waterfowl surveys (for example WeBS) and to provide details. Of 24 volunteers who responded to this question, 11 stated that they had not previously participated in any waterfowl counts and 11 that they had participated in other counts (two respondents skipped this question). All the respondents who had taken part in other waterfowl counts had participated in coastal WeBS to varying degrees. Other surveys that volunteers had participated in included: breeding wader surveys, RSPB Insh Marshes breeding bird survey, BTO Tawny Owl survey and inland WeBS counts. One volunteer also collects their own data on wintering waterfowl in their local area.
When asked if observers would be interested in volunteering for this type of survey again in future 25 of 25 respondents said yes. One respondent commented that they would be eager to be part of a coordinated SPA assessment. Another stated that they would be interested in participating in future, but not too often. Of the 25 respondents, 23 also stated that they would recommend this type of volunteering to a friend.
We also asked volunteers questions about the protocol and the management of the surveys. In relation to the protocol, observers generally noted that they found the protocol generally easy, but many found distance recording somewhat harder (13 out of 26 respondents found it difficult). This aspect was also mentioned explicitly by five respondents when asked if there were any aspects of the protocol they would change. To this question, one respondent answered that they would like to have had more of a community aspect to the surveys, stating: “It would be good to see a list of birders involved in the survey, […] This would instigate a more collective and team feeling of involvement.” Another respondent highlighted that they would have liked to complete the surveys with another volunteer to help to scribe and perhaps verify sightings.
We asked volunteers about how they found the communication and organisation of the pilot survey. 20 of 26 responses were positive about the communication and organisation of the surveys and were generally satisfied with how it was planned. Observers noted that having multiple possible dates established early on was useful and that they appreciated that late notice was down to weather constraints. Some observers noted that they would ideally have like a week’s notice prior to surveys. Another observer commented that they were: “a bit surprised that count locations weren’t agreed further in advance”.
We also asked for any feedback on enjoyable experiences during the surveys. Observers particularly noted an increased awareness of their local patches, getting to be out in nature and also citing an enjoyment in informing members of the public about what they were doing and why.
Comparing the digital aerial surveys to Citizen Science Pilot surveys
In order to ensure reasonable confidence in the density surfaces and associated distributions and local density estimates derived from the digital aerial surveys, instances where 10 or fewer birds were detected in total along the sample transects were excluded from these analysis (Table 12).
Table 12. Species and month combinations excluded from distribution mapping and density estimations for the digital aerial surveys, figures are numbers of sightings in the digital aerial surveys (from Scott et al., 2022).
| Species | January 2020 | March 2020 |
|---|---|---|
|
Slavonian grebe |
5 |
4 |
|
Greater scaup |
1 |
0 |
|
Velvet scoter |
Included |
2 |
|
Common goldeneye |
9 |
Included |
|
Red-breasted merganser |
8 |
Included |
|
European shag |
0 |
Included |
Distributions indicated by Citizen Science Pilot and Digital Aerial surveys
It was possible to produce basic distribution maps for all species and months for the Citizen Science Pilot, showing numbers of birds seen within the viewsheds of each vantage point visited. These maps are shown along with density distributions derived for species with sufficient observations (Table 12) from the coincident digital aerial surveys in Figure 17.
For several largely inshore species, most notably common eider, red-breasted merganser (March only) and common goldeneye (March only) there is general agreement in the overall distributions indicated by the Citizen Science Pilot and digital aerial surveys but the Citizen Science Pilot surveys appear to identify some additional near-shore areas which were not detected by the digital aerial surveys. In addition, the numbers of both red-breasted merganser and common goldeneye detected by the shore-based counts in January were substantially higher than in the digital aerial survey, for which too few birds were detected to enable robust distribution mapping. For long-tailed duck, there is similarly good agreement in near-shore areas, but the digital aerial survey also identified notable densities further offshore in some locations.
As might be expected the shore-based counts did not detect substantial offshore aggregations of great northern or red-throated divers. The visual comparison between the survey distributions for great northern diver clearly indicate that the digital aerial surveys identified important areas that were not detected by the Citizen Science Pilot survey, which only detected four and two individuals in January and March respectively (Table 6). However, for red-throated diver, there appears to be a substantial level of agreement in identification of near-shore areas with relatively high densities of birds between the two methods.
For velvet scoter in January, and European shag in March the Citizen Science Pilot survey detected some aggregations that were not also evident in the digital aerial surveys. In January, the digital aerial surveys detected no European shags, whereas substantial numbers were detected by the shore-based survey (Table 7) at locations throughout the Moray Firth (Figure 17). In March, the Citizen Science Pilot survey recorded small concentrations of velvet scoter in the south of the SPA but no birds were detected by the digital aerial survey.
For Slavonian grebe and greater scaup it was not possible to generate meaningful density maps from the digital aerial survey data (Table 12). However, the locations at which birds were detected by the digital aerial surveys (Scott et al., 2022) coincide with hotspots evident from the Citizen Science Pilot surveys. The shore-based surveys also detected birds at additional locations.
The shore-based counts also recorded low numbers of European shags close to shore across much of the site in January 2020, which were not detected at all by the digital aerial survey (Table 7). Conversely, in March 2020 a large concentration of European shags in the northern section of the site was missed by the limited shore-based survey (Figure 17).
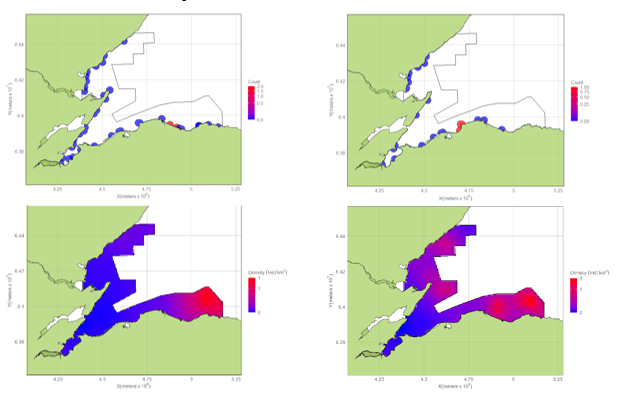
derived using Bayesian point modelling. Gridded map images showing observed bird densities in January and March in citizen science pilot vantage point surveys compared with predicted densities from digital aerial surveys for the following species: great northern diver. Enlarge this image.
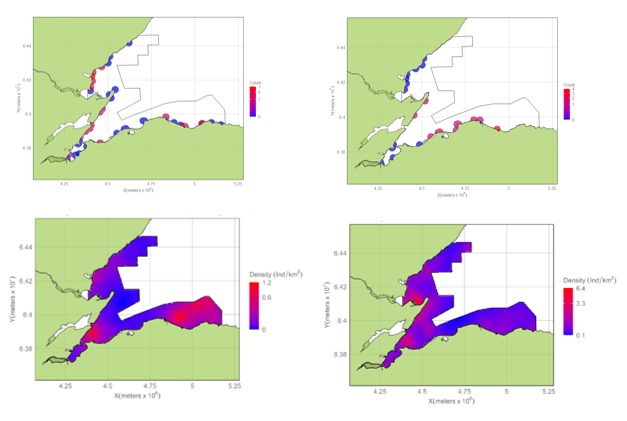
Gridded map images showing observed bird densities in January and March in citizen science pilot vantage point surveys compared with predicted densities from digital aerial surveys for the following species: red-throated diver. Enlarge this image
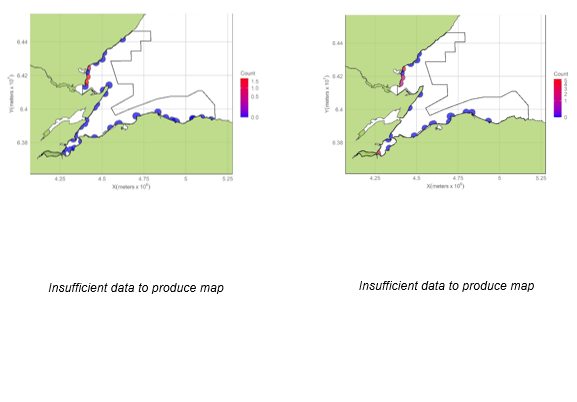
Gridded map images showing observed bird densities in January and March in citizen science pilot vantage point surveys compared with predicted densities from digital aerial surveys for the following species: Slavonian grebe (observed densities only). Enlarge this image.
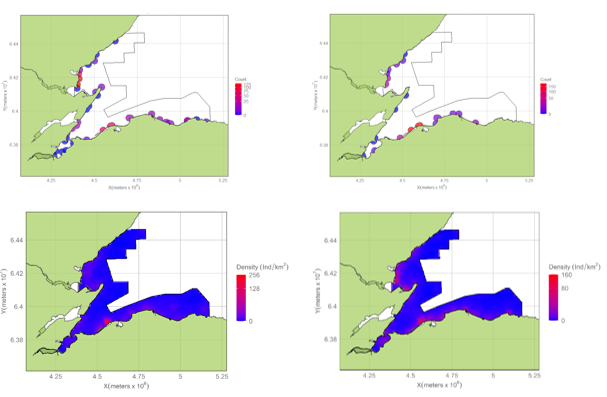
Gridded map images showing observed bird densities in January and March in citizen science pilot vantage point surveys compared with predicted densities from digital aerial surveys for the following species: common eider. Enlarge this image.
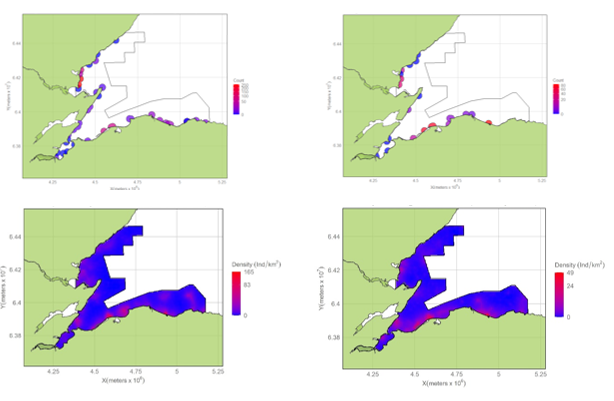
Gridded map images showing observed bird densities in January and March in citizen science pilot vantage point surveys compared with predicted densities from digital aerial surveys for the following species: long-tailed duck. Enlarge this image.
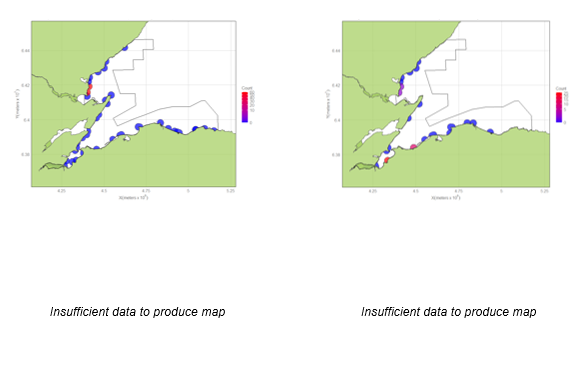
Gridded map images showing observed bird densities in January and March in citizen science pilot vantage point surveys compared with predicted densities from digital aerial surveys for the following species: greater scaup (observed densities only). Enlarge this image.
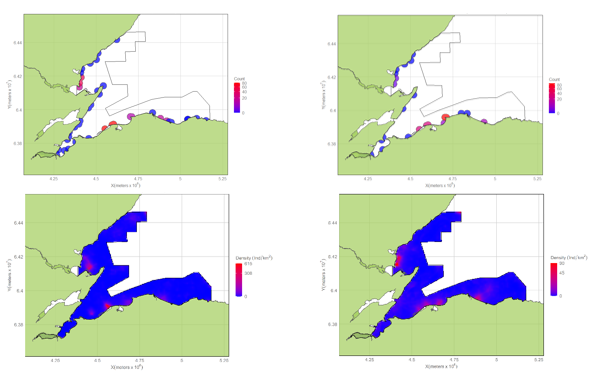
Gridded map images showing observed bird densities in January and March in citizen science pilot vantage point surveys compared with predicted densities from digital aerial surveys for the following species: common scoter. Enlarge this image.
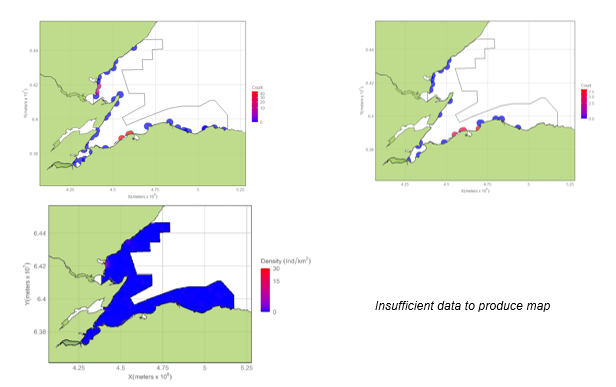
Gridded map images showing observed bird densities in January and March in citizen science pilot vantage point surveys compared with predicted densities from digital aerial surveys for the following species: velvet scoter (digital aerial survey January only). Enlarge this image.
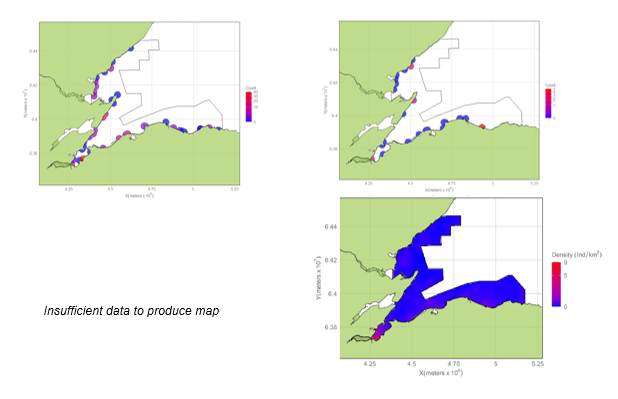
Gridded map images showing observed bird densities in January and March in citizen science pilot vantage point surveys compared with predicted densities from digital aerial surveys for the following species: common goldeneye (digital aerial survey March only). Enlarge this image.
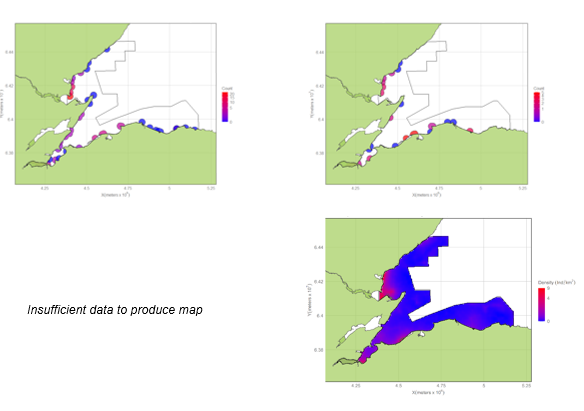
derived using Bayesian point modelling. Gridded map images showing observed bird densities in January and March in citizen science pilot vantage point surveys compared with predicted densities from digital aerial surveys for the following species: red-breasted merganser (digital aerial survey March only). Enlarge this image.
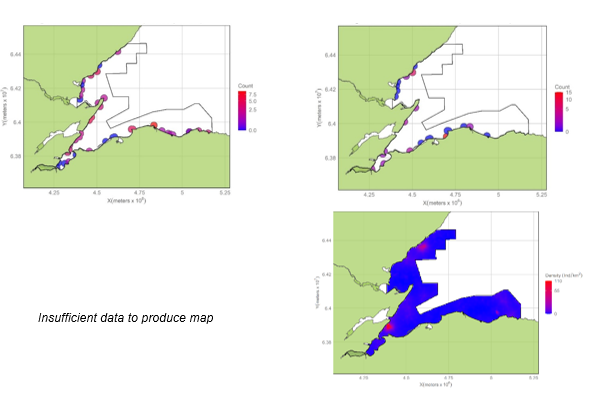
Gridded map images showing observed bird densities in January and March in citizen science pilot vantage point surveys compared with predicted densities from digital aerial surveys for the following species: European shag (digital aerial survey March only). Enlarge this image.
Densities indicated by Citizen Science Pilot and digital aerial surveys
Figures 18a and 18b illustrate the relationships, for January and March 2020 respectively, between mean densities in the 2km Citizen Science Pilot vantage point buffers (Figure 1) and mean modelled density of birds from the digital aerial surveys in the same areas. As detailed in Table 12, some species and survey combinations were excluded from these analyses given sparsity of digital aerial survey data. In addition, there were insufficient Citizen Science Pilot observations of great northern divers in either month (Table 6) to enable comparison of densities. The log-log comparisons found no magnitude differences in the comparisons and in general linear scales provided higher Spearman’s correlation coefficients than log-log scale comparisons and were consequently selected for presentation here.
The correlation coefficients associated with the plots in Figures 18a and 18b are shown in Table 13. These give an indication of the potential strength of these relationships. Values of 0.60 and above are indicated, but no formal estimates of statistical significance can be derived.
Table 13. Spearman’s correlation coefficients for linear relationships between bird densities from the digital aerial surveys and Citizen Science Pilot surveys. [a] indicates values of 0.60 or greater.
|
Species |
January 2020 |
March 2020 |
|---|---|---|
|
Great northern diver |
Insufficient data |
Insufficient data |
|
Red-throated diver |
0.30 |
-0.17 |
|
Slavonian grebe |
Insufficient data |
Insufficient data |
|
Common eider |
0.08 |
0.61 [a] |
|
Long tailed duck |
0.23 |
0.72 [a] |
|
Greater scaup |
Insufficient data |
Insufficient data |
|
Common scoter |
0.45 |
-0.02 |
|
Velvet scoter |
-0.04 |
Insufficient data |
|
Common goldeneye |
Insufficient data |
0.42 |
|
Red-breasted merganser |
Insufficient data |
-0.06 |
|
European shag |
Insufficient data |
0.27 |
In general, there was little evidence of strong linear relationships between the digital aerial survey models and the Citizen Science Pilot vantage point counts in either January or March. In January a very high degree of overlap was observed in the modelled densities from the digital aerial surveys (y-axes) at lower and upper ends of the Citizen Science Pilot density values (x-axes) for red-throated diver, common eider, long-tailed duck and velvet scoter. The poor relationship is reflected in the relatively low Spearman’s correlation coefficient values which range from 0.04 to 0.30.
For common scoter, there was some evidence of a positive relationship in January (Spearman’s correlation coefficient 0.45) but given the tendency of this species to form large flocks the number of data points was very low and consequently this result should be interpreted cautiously. A similar caveat applies to common goldeneye in March, as a total of only 13 birds were recorded, from a handful of vantage points, by the Citizen Science Pilot survey.
Common eider and long-tailed duck showed much higher correlation coefficients between the two surveys in March, but these are strongly influenced by one or two data points.
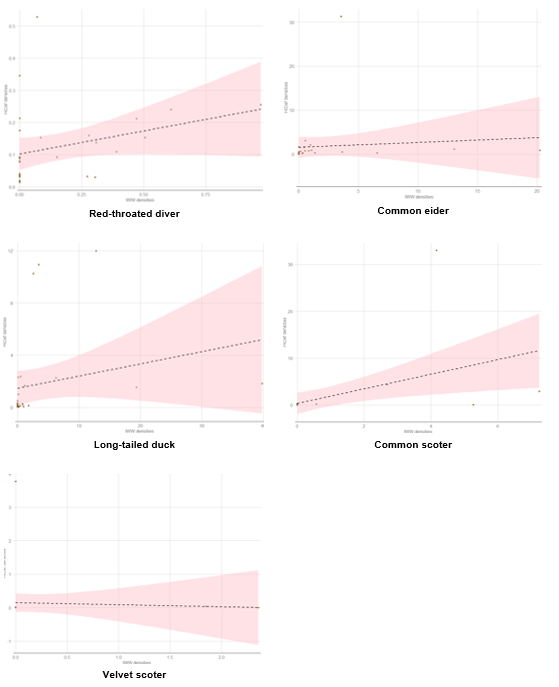
The panels depict the plotted points, a regression line and a band indicating the standard error estimates. The correlation are positive for red-throated diver, common eider, long-tailed duck and common scoter, and slightly negative for velvet scoter. Enlarge this image.
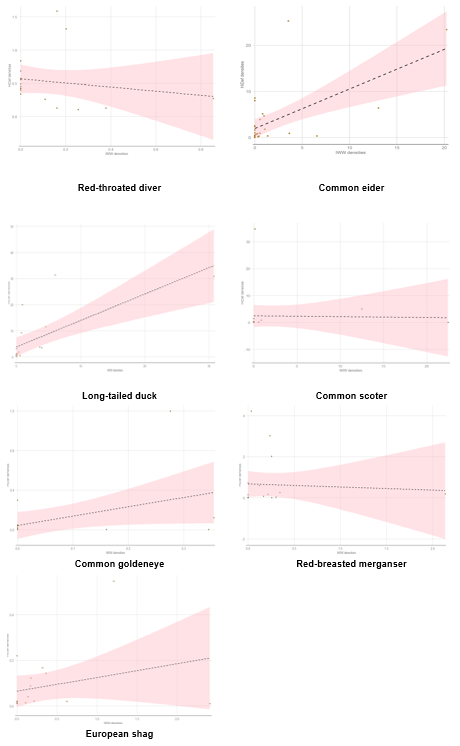
The pink bands denote the standard error estimates produced by the linear model. Negative standard errors are artefacts of data sparsity when some data are at or near 0. The panels depict the plotted points, a regression line and a band indicating the standard error estimates. The correlations are positive for common eider, long-tailed duck, common scoter, common goldeneye and European shag, and slightly negative for red-throated diver and red-breasted merganser. Enlarge this image.
Comparing the Citizen Science Pilot counts to contemporary WeBS counts
No discernible relationships were found between the mean densities of birds within WeBS count sectors as recorded by the Citizen Science Pilot and by WeBS surveys in January 2020 for any of the Moray Firth SPA qualifying features (Figure 19). However, the very small sample size available at the time of analysis (only January WeBS data was available with typically only three to eight comparable Citizen Science Pilot and WeBS count densities for each species) limited the potential to detect such relationships. The difference in count dates (seven days) and consequent potential for bird numbers and distributions to have changed between the WeBS and Citizen Science Pilot surveys, could also have contributed to the null result.
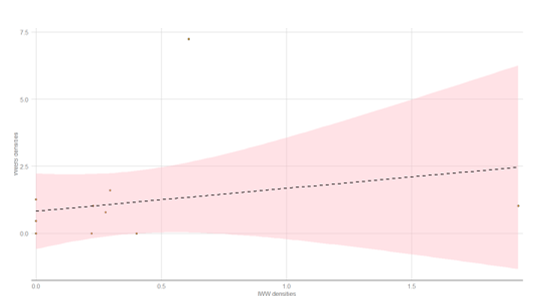
Negative standard errors are artefacts of data sparsity when some data are at or near 0. This plot is typical of the other species comparisons. A graph of a linear regression which shows a near horizontal line depicting the relationship between Citizen Science Pilot counts and WeBS for red-breasted merganser. Enlarge this image.
Comparison of historic RSPB and WeBS counts
Plots of WeBS and RSPB count rates in December for each species in two sub-regions between 1999 and 2005 are shown in Figure 20. Table 14 summarises the associated Spearman’s correlation coefficients.
Table 14. Spearman’s correlation coefficients for comparison of WeBS and RSPB count rates in two sub-regions in December as plotted in Figure 20. [a] indicates values of 0.60 or greater. NA not applicable.
|
Species |
Nairn and Culbin Bars |
Outer Dornoch Firth |
|---|---|---|
|
Great northern diver |
0.13 |
0.56 |
|
Red-throated diver |
0.63 [a] |
0.29 |
|
Slavonian grebe |
NA |
-0.29 |
|
Common eider |
-0.18 |
0.77 [a] |
|
Long-tailed duck |
0.97 [a] |
0.92 [a] |
|
Greater scaup |
0.97 [a] |
NA |
|
Common scoter |
0.99 [a] |
NA |
|
Velvet scoter |
0.99 [a] |
NA |
|
Common goldeneye |
0.82 [a] |
-0.12 |
|
Red-breasted merganser |
0.68 [a] |
0.78 [a] |
|
European shag |
-0.32 |
-0.09 |
The direction and strength of apparent relationships between the two data sets in these time series are highly variable, but in general, the RSPB rates were higher than those for WeBS counts (Figure 20).
In some instances, WeBS did not record species which were recorded in significant numbers in the RSPB Seaduck Surveys. For example common scoter and velvet scoter in the Outer Dornoch Firth and European shag in both sub-sectors. Other species were recorded with similar trends in populations but with many fewer birds per hour recorded, e.g. great northern diver, red-throated diver and common eider in the Outer Dornoch Firth and long- tailed duck in the Nairn and Culbin bars sub region.
Generally, the strongest apparent relationships were evident for the Nairn and Culbin Bars sub-region, with moderate (red-throated diver) or high (r>0.8) (long-tailed duck, greater scaup, common and velvet scoters, common goldeneye) correlations evident for a range of species (Table 14). Greater scaup and scoter species typically occur in discrete flocks and this is reflected in the observed patterns of observations (Figure 18). For long-tailed duck there were also an evident relationship between counts for the Outer Dornoch Firth and a positive correlation between counts was also evident for common eider in this area (Table 14).
Similar correlation values were also generated for red-breasted merganser in both sub-regions. However, given low absolute numbers recorded, the validity of these apparent relationships is uncertain.

These figures are comparative time-series plots of estimated rates of observations for WeBS and RSPB counts within two sub-regions between 1998 and 2005. In each panel the Nairn and Culbin Bars sub-region plot is shown above that for Outer Dornoch Firth. Note that y-axes scales vary. Enlarge this image.
Discussion
This discussion focuses on the results of the 2020 Citizen Science Pilot of inshore wintering waterfowl and the comparative analyses in relation to the overarching research topics identified at the project outset.
Due to time constraints and the lockdown measures introduced in March 2020 for Covid-19 we were not able to answer some of the specific research questions originally identified; the completion status for each is indicated in Annex 1.
Quality and repeatability of shore-based counts of IWW in MPAs
Variation in shore-based counts can be caused by many factors such as, the characteristics of the target species, environmental conditions and differences in observers or equipment used to undertake a count. Understanding and addressing the causes of variability, would allow us to develop more robust survey protocols and ultimately improve the quality and reliability of inferences made from this type of survey. Systematic exploration of these factors was limited to variation among observers, which is a particular issue when undertaking counts using citizen scientists (Spear et al., 2004).
The field tests run in March 2020 to investigate how observer factors affect the quality of shore-based counts, found significant inter-observer variation. Observers differed in their ability to detect birds, particularly when small numbers were present (e.g. greater scaup and common goldeneye), identify the species (e.g. common and velvet scoters, European shags and great cormorants), and count those birds that are detected. In the Citizen Science Pilot, there were particular challenges inherent to surveying mobile marine species, such as the distance to birds at marine sites, and ecology or behaviours, such as synchronised diving and movements of small flocks through and between count sectors, of some of the Moray Firth SPA qualifying features. The winter plumage of species such as Slavonian grebe makes detection challenging in anything but perfect conditions (Figure 21) (Frederick et al., 2003).
Similarly, some variation may have been caused by differing delineation between sectors depending on each observer’s viewing position. Additionally, the vantage point covered a large area, with very few landmarks present with which to provide useful markers for distance. This and other characteristics of the test site itself might have contributed to some of the variation in counts. The Embo site was chosen for its variety and large assemblage of birds in order to test observer variability over multiple species. Additionally, during the field test counts, there was a great deal of movement of scoter flocks and long-tailed duck and common eider flocks throughout the area. However, many of the other vantage points around the Firth support much smaller numbers and fewer species. Further field tests would be valuable to establish if this extent of variation is present between observers in different vantage points and investigate further methods to reduce variation.
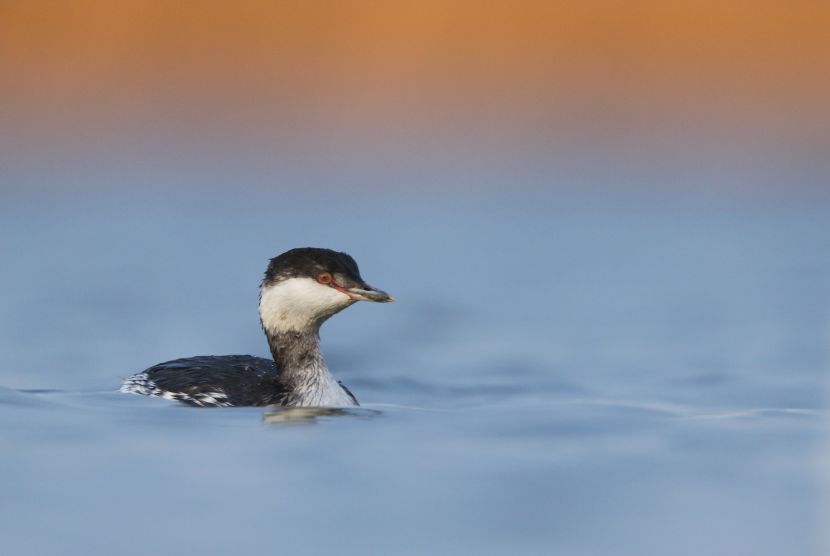
Observer experience appeared to have some impact on species counts, with the most experienced observer providing consistently higher estimates across the whole site; however this trend was not established throughout the observers. Interestingly this effect was not observed with common scoter, as has been found in other similar field tests (Banks et al., 2007). In practice, it was very difficult to gauge experience based on self-assessment, and this remains a crude means of comparing observers. Given that all the observers were either dedicated birdwatchers or professional ornithologists, any differences between them evident in self-assessment were quite slight. Moreover, an interplay may exist between observers with the most survey experience versus observers who have done more recreational birding, and it is unclear in this instance, which would therefore count as the most experienced.
Feedback from volunteers suggested that the distance recording aspect of the surveys was the most challenging aspect of the protocol. The distance recording method used was by no means exact and there were associated issues in both the estimation of these distances and the usefulness of the numbers recorded. Greater accuracy and precision in determining locations of birds observed would increase confidence in the data and facilitate comparisons and calibration with other surveys.
The inter-observer variation found here would require further investigation in future to understand and investigate methods to reduce the variation between counters. In future, it may be more valuable to focus recruitment on volunteers with an overall interest in participating in this type of survey and attempt to reduce any variation in counts through trainings in identification, survey techniques and data recording, or paired observer methods.
Value of targeted shore-based counts of IWW for population monitoring
Citizen Science Pilot and digital aerial surveys
Qualitatively, there was substantial overlap in the location of predicted hotspots from the digital aerial surveys and the observed hotspots from the Citizen Science Pilot vantage point counts for a number of species. This suggests that the Citizen Science Pilot surveys provide a good means of assessing distribution for the nearshore coastline for a number of species. However, for some species, such as great northern diver and red-throated diver (Figure 22), where the main extent of their distribution is beyond the scope of the Citizen Science Pilot surveys, the identification of ‘hotspots’ will be limited and potentially misleading as to their true distribution.
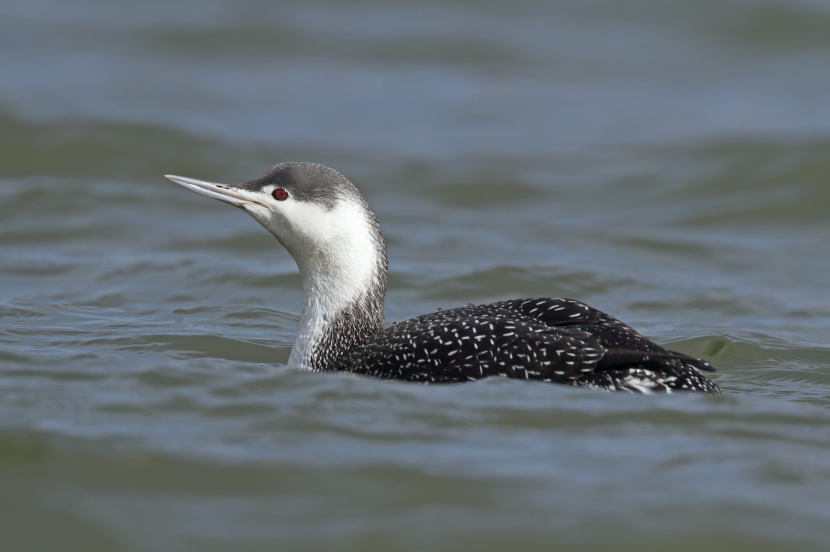
However, relationships between density estimates derived from the Citizen Science Pilot counts and the Bayesian Model (derived from the digital aerial survey data), were generally weak, characterised by low correlation coefficients, large confidence intervals and a few or single data points often driving any apparent relationships. Mismatch between count comparisons derived from vantage point counts and modelled distributions are likely due to a number of issues, particularly insufficient data, limitations of the methods used and ecological differences in the species. For a number of species the numbers of observations in either the digital aerial surveys or Citizen Science Pilot surveys were insufficient to enable robust or reliable comparisons of the two survey methods.
There are limitations to both of the methodologies which could partially explain the poor relationships between the survey types. One source of error comes from observer bias in the Citizen Science Pilot vantage point counts, which can have a large impact on count data (Spear et al., 2004). Another source of error comes from the lack of information on distance to observed birds, although some observers made rough estimates of distance to flocks or individuals these were not standardised, and there were many data gaps where observers simply did not record any information.
The digital aerial survey also had limitations, which might explain the poor comparative relationship. For instance, although the aircraft flew through many of the vantage point buffer zones (set at 2km), the areas covered within those vantage point zones was relatively small because the aircraft is only covering a strip with of 500m. Species with a restricted distribution or with a tendency to clump together such as scoter may be problematic for this type of comparison, as there are very few sites where common scoter will be recorded from shore-based vantage point surveys resulting in very small sample sizes with which to compare against digital aerial survey data. Clumped distributions may also have caused flocks to be missed by the digital aerial surveys. A similar comparison was done for common scoter in Camarthan Bay between visual aerial survey and shore-based surveys but was similarly inconclusive (Banks, 2007).
It is likely that the poor relationship between the two survey types is due, at least partly, to lack of sufficient data or limitations of survey types as discussed above. The underlying ecology of each species will also affect likelihood of birds being both present and readily detected by each survey method; particularly within the limited viewsheds around the Citizen Science Pilot vantage points (see Figure 14). For example, Slavonian grebe occur close inshore in low numbers and densities and their small size and plumage may limit detection in either or both surveys whereas densities of a more obvious and numerous inshore species such as common eider may be more readily compared.
Red-breasted merganser (Figure 23) and common goldeneye showed poor correlations between the digital aerial and Citizen Science Pilot surveys, which is perhaps unsurprising given inshore habits and hence high probability of detection in shore-based surveys versus a lower probability of detection in aerial surveys. However, the low overall densities of these species within the Moray Firth might reduce the efficacy of this type of comparison more generally. Red-throated diver comparisons showed generally poor correlations, which is possibly due to the offshore tendency of the species, resulting in poor detection from the shore-based surveys.
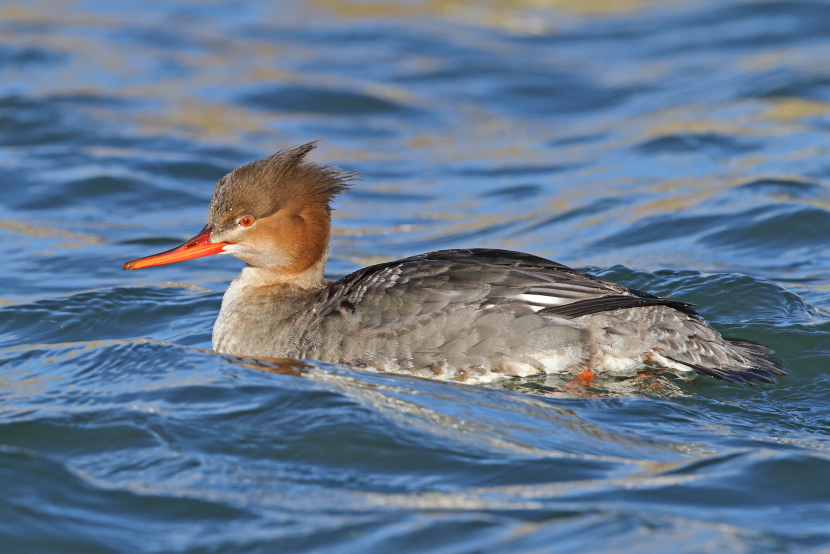
It is also possible that availability bias might confuse comparisons between the two surveys methods. Availability bias as a result of diving behaviour will likely be reduced when surveying from the shore, as the observer has a longer period within which to spot the bird.
The interplay between all of these issues is likely to cause problems in understanding the true relationship between the survey types for each species. Based on the current data analysis, we cannot conclude that the vantage point surveys would provide a proxy indicator for digital aerial surveys or vice versa based on the limited available count comparisons. However, the agreement between the distributions derived from the two surveys suggests that the Citizen Science Pilot surveys were able to detect key areas within the immediate coastal waters for the majority of the species and provide information on their distribution. However, it is clear that further investigation would be required in order to determine whether and for which species the relationships were reliable enough to provide a good proxy.
Vantage point counts and WeBS surveys
Comparative analyses between Citizen Science Pilot surveys and WeBS surveys in January 2020 were inconclusive due to the small number of available data points to compare. The 2020 Citizen Science Pilot surveys provided higher estimates than WeBS surveys for nine of the eleven Moray Firth SPA qualifying features in January 2020. However, the January WeBS survey data does not include all of the surveyed sites and the extent of ‘missing’ data is not known. Similarly, coverage was limited in the Citizen Science Pilot surveys due to volunteer availability and data from a small number of sites that were surveyed was not included in the total counts due to poor data recording. It would be inappropriate to draw any strong conclusions about the two survey types on this basis.
Although it was not possible to directly compare the Citizen Science Pilot vantage point technique with WeBS, general comparisons were possible between historic WeBS counts and the RSPB Seaduck counts (which used a very similar survey design to the Citizen Science Pilot surveys).
Targeted shore-based counts undertaken by the RSPB show moderate correlations with WeBS counts in the Moray Firth in the two sub-sectors analysed suggesting that there is a relationship between the survey types for some species. The comparisons suggest that the shore-based RSPB counts provided consistently higher detection rates than WeBS counts in the same months. The analyses presented here are limited to a few years and do not control for factors such as differences in dates and times of counts. However, they suggest that the RSPB seaduck survey protocol may provide better information on the abundance of inshore wintering waterfowl within large marine sites compared to WeBS. This is expected given the focus on marine bird species, which likely reduces observer distraction from counting other wetland birds such as waders.
Within certain sub-regions, the comparative analyses of December count rates revealed similarities in patterns of fluctuation over multiple seasons in the RSPB surveys and WeBS (e.g. Slavonian grebe, great northern diver and long-tailed duck in the Nairn and Culbin Bar sub-region). This perhaps suggests within certain sub regions the WeBS counts could serve as a proxy indicator. This could be explained by ecology and distribution of some species. For example, common scoter and velvet scoter tend to aggregate in large flocks in spatially restricted areas and past surveys suggest that the Nairn and Culbin Bars areas consistently have high numbers of observations for common scoter. There may have been generally high awareness of flocks of scoter at this location among both WeBS and RSPB surveyors with consequent focus on obtaining counts for scoter flocks close to shore.
However, the strong correlations for the two survey types in this area across species with varying ecologies suggest that perhaps it is the sub-region itself that has contributed to the relationship between the surveys. The Nairn and Culbin Bars area is very accessible with wide and open tracts of water. Much of the area is sandy substrate making the viewshed unobstructed, and allows for easy movement along the shore line. Much of the adjacent land is commercially wooded which might also provide shelter and calmer waters in the nearshore areas. The topography of this area therefore lends itself to marine surveys and it may be that WeBS surveyors were more focussed on the marine features of this site.
Given that we would expect there to be a relationship between the two survey types, it is perhaps surprising that there were not more species which showed strong correlations. For example in the Outer Dornoch Firth sub-region, only three of the eleven species showed evident positive correlations. Although there was some evidence of a relationship between the two survey types, for some species, there are some caveats to this approach. Most importantly is the very low sample size within each sub-region. Furthermore, there was only the time to look at two sub-regions of the Moray Firth SPA, and an analysis of all sites across the area might yield other strong relationships. Comparisons show that these patterns differ between sub-regions such that it appears unlikely that more consistent patterns would emerge across broader spatial scales. The other important issue it that there was not enough time in the scope of this work to build any more sophisticated type of time series model from which to make assessments. There was also a lack of information on important temporal aspects in the WeBS data (e.g. time of day of survey, tide heights, location of surveys and spatial surveying effort), all of which could have large impacts on the abundance of birds in a survey.
Given the similarity of the RSPB surveys and the 2020 Citizen Science Pilot methodologies there is potential that the Citizen Science Pilot survey might also provide higher detection rates. However, there are some key differences, such as the RSPB surveys used far fewer observers, who had proven experience of surveying this species. This is likely to have reduced any inter-observer variation but with the trade-off that the whole site could not be surveyed within one day, which may have resulted in greater double counting or undercounting as birds moved within the Moray Firth.
Future potential for citizen science monitoring of IWW in MPAs
Motivation and benefits for volunteers
The results from the volunteer feedback questionnaire and discussion with volunteer observers suggests that there is appetite for a bespoke long term monitoring of IWW in the Moray Firth. Half of the respondents to the survey indicated that they did not participate in WeBS surveys suggesting that there may be some untapped resource of volunteers not currently contributing to citizen science surveys. The volunteer survey also highlighted that many of the volunteers would tell a friend about the opportunity to complete these surveys and this could be harnessed to develop the volunteer resource and community of observers.
Careful consideration is required as to the feasibility of rolling this type of monitoring out to other MPAs where the appetite and motivation for this type of surveying may differ. This may particularly be the case where the assemblage of species is less diverse than the Moray Firth or less numerous, where volunteers may not find the same type of reward. Generally, observers comment that they feel it is most worthwhile and enjoyable where they see great numbers of the target IWW species or a diverse assemblage of birds.
As previously discussed there are key benefits to utilizing a citizen science approach to monitoring species of inshore wintering waterfowl from a data collection perspective, but there are also wider potential benefits to this approach, particularly developing individual and community stewardship for MPAs. In feedback from volunteers about their participation in the survey, it was highlighted that there was interest in being part a community of observers – perhaps in the form of an online group but also in person feedback sessions and talks. Training could also serve as a platform to develop a community for volunteers. This could have beneficial effects, both for volunteer engagement, training and retention but also deepen connections with the site though sharing images and stories and develop community stewardship for marine sites. This is evidenced by other citizen science monitoring projects e.g. Volunteer Seabirds at Sea, which suggests that this is a critical aspect of maintaining motivation for surveying and enhancing the stewardship of the site and/ or species (M. Lewis, pers comm).
There are also more general benefits from a citizen science approach in enabling volunteers to deepen their connection with nature. Connecting people with nature is vital to improve wellbeing and also engaging the public with the conservation issues that we face in Scotland. This was emphasised in the feedback from volunteers who mentioned that they enjoyed learning about their local sites and spending time in coastal and marine environments.
Practical considerations for delivery
In the feedback questionnaire, volunteers stated that they felt that the 2020 Citizen Science Pilot surveys were well coordinated and delivered, with particular reference to good communication and being valued as key elements which contributed to their enjoyment of the surveys. In coordinating and delivering this type of monitoring in future these elements should be carefully considered.
Although there is clearly an appetite for this type of monitoring opportunity in the Moray Firth a number of volunteers felt that a dedicated coordinator would be required to maintain motivation and take responsibility for the survey coordination and data input and handling. There was not the appetite for this to be volunteer led and it would be challenging for any volunteer to coordinate and support others given the challenges of these survey methods (e.g. need to mobilise at short notice in response to weather forecast and to match available volunteers to appropriate vantage points, and training requirements, including distance measuring). In addition, not all potential volunteers may be able to provide the optical equipment required for high quality counts. In the short term, it is clear that there would be an interest in participating in this type of monitoring. Long-term motivation is likely to need the support of a dedicated coordinator, and the development of a community. Further commitment is likely to be increased if volunteers are gaining something in return e.g. skills, empowerment, community. The officer could be responsible for recruiting, training, and supporting a community of volunteers, and be responsible for data management and analysis, as well as communications of long-term trends or findings from monitoring.
Future coordination of this type of surveying in future should make use of online platforms to develop a community that can support and motivate existing volunteers as well as provide feedback and foster a sense of community. Training is also likely to be a key aspect in the delivery of this type of monitoring in future.
A program of citizen science shore-based monitoring of IWW in MPAs is feasible and is likely to provide significant added value, particularly through providing potentially more accurate estimates of marine species from shore-based vantage points, than are likely available through existing schemes such as WeBS due to focussing on these species. However, any monitoring program should make use of links with WeBS and careful discussion and collaboration with BTO should underpin the future direction and development of any bespoke monitoring scheme. Although we found that around half of our surveyed volunteers had not taken part in WeBS, it is therefore the case that half had previously had experience of WeBS. Given the reputation of WeBS as one of the largest citizen science based surveys in the UK it is likely that any future volunteers will have heard of WeBS if not taken part themselves.
Although volunteers were generally happy to be organised (based around weather conditions) around a week prior to surveys, it is possible that in the long-term this could be harder to maintain for volunteers. As only two surveys were undertaken in the 2020 season, it is possible that this does not give an accurate reflection of the organisation of the survey over a longer period, and it might be difficult to maintain motivation for surveys if they are more frequent – e.g. monthly. The critical benefit of the Citizen Science Pilot method over that of WeBS is that optimal conditions can be chosen for observing IWW at sea potentially maximising detection. Moving to a fixed date monthly survey would significantly devalue this type of monitoring, but careful consideration will be needed in future to ensure the engagement of volunteers ‘last minute’. The use of ‘potential survey dates’ worked well in this pilot survey, but this must be communicated clearly and effectively with volunteers. Prior knowledge of assigned vantage points would be hugely beneficial to volunteers and to organisers and for consistency in the data. Similarly, it would be valuable to have a set team of volunteers (with minimal turnover in observers) in order to better control inter-observer variability and encourage observers to become more familiar with their vantage point or count sector. This would of course require significant long term dedication and buy-in to this type of project.
Conclusions and recommendations
Generally, our conclusions and recommendations follow what might be expected based on the ecology of the species. For instance our findings suggest that physically smaller species, which inhabit close inshore waters in small numbers tend to be better surveyed by vantage point methods (i.e. Slavonian grebe, greater scaup, common goldeneye and red-breasted merganser and European shag). Whereas species which are distributed out at sea, and generally in larger numbers are better surveyed by digital aerial surveys (Great northern diver, red-throated diver, common eider, long-tailed duck, common scoter, velvet scoter).
Direct comparisons of densities were not possible for some species and generally poor relationships were found for others. However, digital aerial surveys provided higher modelled estimates for seven of the eleven species and detected concentrations of birds which are not visible from vantage points. Many of these species’ counts could be supplemented by vantage point methodologies to develop a more fine scale resolution in the nearshore extent of the SPA to supplement the coarser scale sampling by digital aerial surveys. This could be particularly helpful in cases where the digital aerial survey transects did not record flocks of scoter or greater scaup and might also improve detection of Slavonian grebe and European shag. Similarly, shore-based counts could be beneficial for distinguishing between otherwise very similar species such as common and velvet scoter when flocks are found closer inshore. Future investigations could look at comparing presence and absence instead of counts to investigate any underlying relationship between the survey methods. For instance, the correlations show some clumping of zero values, suggesting that where the digital aerial survey model predicted low densities of birds, so did the Citizen Science Pilot surveys (for example red-breasted merganser, common eider, long-tailed duck, and common goldeneye, and Slavonian grebe). This might therefore suggest that comparing presence and absence might yield higher correlation values with lower confidence limits.
The 2020 Citizen Science Pilot surveys provided higher detection rates for IWW for nine of the eleven species than was recorded by WeBS in the same period. However, other factors including overall coverage and duration of surveys will also influence population estimates at site (MPA) levels. Historical, targeted shore-based counts have provided consistently higher detection rates of IWW in large marine sites, than WeBS within sub regions, and in some instances have detected species that were not observed by WeBS e.g. European shag. Although the two survey types show correlations for some species and in some sub-regions, the species population fluctuations identified by the targeted RSPB seaduck counts and WeBS do not always agree (Figure 18). Indeed in some instances the two surveys appear to be presenting different patterns between winters for species in certain regions, for example common goldeneye in the Outer Dornoch Firth sub region. This result highlights a potential problem if WeBS data were adopted as the sole indicator of possible changes in populations of some IWW species in large marine sites. Bespoke monitoring of these species may enable more accurate assessment of population changes to inform conservation management.
Great northern diver and red-throated diver are generally very poorly surveyed by shore-based methods due to their mostly offshore ecology. Shore-based surveys are best for surveying species at up to 2km from shore and as such recorded very few great northern divers and red-throated divers within the vantage point viewsheds. When taking into account the reduced site coverage from the 2020 Citizen Science Pilot surveys, a large disparity between these and the citation population was still apparent. The Bayesian modelled estimates in January were broadly comparable with the citation estimate, but the estimates in March were much greater than the citation, suggesting that these methods are able to detect greater numbers of this species, in line with previous finding (Žydelis et al., 2019). Alternatively, this could indicate over-estimation of densities from this method, but it is expected that digital aerial survey would be the most appropriate of the two survey types for this species. Bespoke shore-based methods (such as the RSPB counts and Citizen Science Pilot surveys) tend to provide higher estimates than WeBS but are still much lower than estimates from digital aerial surveys.
Slavonian grebe was poorly detected by the digital aerial survey methods, likely due to their size, inshore habits, indistinct winter plumage and the fact that they are present in relatively small numbers within the site. Shore-based vantage point surveys therefore provide the best alternative for surveying this species. WeBS counts in January 2020 were similar to Citizen Science Pilot counts but comparisons between WeBS and historic dedicated counts suggest that there is a poor relationship between the two survey types, and that generally dedicated surveys provide higher estimates.
Digital Aerial methods provided the highest estimates for common eider. However, Citizen Science Pilot vantage point surveys provided similar distributions and perhaps some vantage point counts and WeBS was evident but only in one of the two sub-regions studied and in general dedicated counts provided higher detection rates than WeBS. We suggest that digital aerial surveys are most appropriate for surveying this species but that shore-based vantage point surveys could provide useful data between years and provide fine-scale distributions in the nearshore areas of an MPA.
As with common eider, long-tailed duck population estimations are higher from digital aerial survey methods than vantage point surveys, although distributions are similar. Historic vantage point surveys and WeBS showed high correlations in the two sub-regions but estimates were generally higher for targeted counts over WeBS.
Our results suggested that European shag were best surveyed by vantage point methods, although we recognise that lower spatial coverage in March likely resulted in low detection rates for this species. This may have disproportionately affected counts of shag as vantage points near known hotspots for shag were not visited. However, both the digital aerial survey modelled estimates and Citizen Science Pilot estimates are substantially lower than the citation estimate, which was derived from analyses of boat based surveys (European Seabirds at Sea) spanning a substantial time period (Table 7). Given these difference in methodology, no firm conclusions can be drawn with respect to possible subsequent changes in the populations of wintering European shag in the Moray Firth SPA. However, European shag populations are subject to fluctuations arsing from mass mortality events or “wrecks” associated with prolonged periods of stormy weather (Frederiksen et al., 2008). It is recommended that European shag are surveyed using an adapted shore-based assessment which includes survey of the shores, islands and skerries where roosts on the shore may be present either adjacent or within the vantage points, and known hotspots within the site. Specific training on identification between European shag and great cormorant would also be valuable. However, this may be a species which benefits from multiple survey types to access different potential locations.
The Citizen Science Pilot approach is a valuable means of counting large marine sites within a short time span, as evidenced both here and in other citizen science projects like WeBS. In particular, this method provides a good value for money estimate of IWW populations, and provides added value to other shore-based surveys such as WeBS by providing more dedicated effort focussed on the target waterfowl and European shag features of the site. By using multiple observers there is the opportunity to provide a snapshot for the entire coastline of a large marine site which has benefits in reducing the likelihood of double counting or undercounting due to bird movement.
This method also provides the opportunity for public engagement with marine conservation and development of community stewardship. The fact that the counts could be undertaken within one day is a huge benefit for this type of study and lends itself well to comparison with other survey types. These surveys do however suffer from issues of observer bias, as with almost all observational surveys. There are multiple factors affecting detectability and variability in counts which are inherent to this type of survey. Although the inter-observer variation was quite high, the field tests have provided a baseline for which to compare once measures are taken to reduce variation.
Recommendations
The following sets out our recommendations for surveying IWW in MPAs with additional recommendations for improvements that could be made to further our understanding of the populations and distributions of these species.
We recommend that digital aerial survey methods are employed to monitor great northern diver, red-throated diver, common eider and long-tailed duck. We recommend that common scoter are monitored using digital aerial methods but are supplemented by vantage point methods. Whereas we recommend that vantage point methods are used to survey Slavonian grebe, velvet scoter, goldeneye, red-breasted merganser, greater scaup and European shag.
Table 15 summarises the basis for these conclusions with respect to recommended survey methods for each of the qualifying features of the Moray Firth SPA.
Table 15. Recommended survey methods for inshore wintering waterfowl in large MPAs
|
Species |
Key characteristics |
Survey method: Digital Aerial Survey (DAS) |
Survey method: WeBS |
Survey method: Vantage Point (VP) |
Notes |
|---|---|---|---|---|---|
|
Great northern diver |
Offshore ecology, large, in small numbers. |
Yes |
- |
- |
Very poorly surveyed by VP survey methodologies. DAS provides best option for surveying this species. |
|
Red-throated diver |
Distributed both inshore and offshore, large in size, can be confused with Great northern diver, but more numerous. |
Yes |
- |
- |
VP surveys for this species are improved compared to great northern diver however, DAS provide higher estimates and more detailed information on distribution of the species in more offshore areas. |
|
Slavonian grebe |
Generally more inshore, small and cryptic, Small numbers within the site. |
- |
- |
Yes |
Poorly detected by DAS. Comparisons between historic targeted counts and WeBS found no relationship. Generally higher detection rates from dedicated counts. |
|
Common eider |
Generally inshore, in large numbers. Distributed along the coast, visually distinct. |
Yes |
- |
- |
Detection rates for this species are higher from DAS methods. However, VP surveys do provide similar distributions to DAS. Some evidence of a relationship between historic VP counts and WeBS but only in one of the two sub-regions studied. Dedicated counts provided higher detection rates than WeBS. VP surveys could provide useful proxy between years. |
|
Long-tailed duck |
Medium sized bird, males have distinct plumage, present in moderate numbers. |
Yes |
- |
- |
Population estimations are higher from DAS methods than VP surveys, although distributions are similar between the surveys. Historic VP surveys and WeBS showed high correlations in the two sub-regions but estimates were generally higher for targeted counts over WeBS. |
|
Greater scaup |
Small numbers present, generally in inshore waters. |
- |
Yes |
Yes |
WeBS surveys in 2020 detected greater numbers of greater scaup than did the Citizen Science Pilot but this could be an artefact of survey dates. |
|
Common scoter |
Tends to aggregate in large numbers, in distinct locations. Dark plumage. |
Yes |
- |
Yes |
DAS detected higher numbers within the site, but this could be supplemented with VP counts between years. This supplementation could be particularly valuable as targeted surveys show that large flocks can be very mobile (see Table 8). Estimates from WeBS in 2020 were similar to Citizen Science Pilot counts. Some evidence of a relationship between historic VP counts and WeBS but only in one of the two sub-regions studied. Dedicated counts provided higher detection rates than WeBS. VP surveys could provide useful proxy between years. |
|
Velvet scoter |
Small numbers often amongst groups of common scoter, similarities in plumage mean that they are often confused for common scoter. |
- |
- |
Yes |
VP counts appear to be better able to identify velvet scoter in inshore flocks versus DAS, and detect higher numbers than WeBS. |
|
Common goldeneye |
Present in small numbers in the site, inshore. |
- |
- |
Yes |
Recorded in greater numbers by VP surveys in January but higher numbers from DAS in March. WeBS estimates in January were similar to VP survey counts. Tends to be recorded in higher numbers from historic RSPB seaduck counts than from WeBS. |
|
Red-breasted merganser |
Present in small numbers in the site, inshore. |
- |
- |
Yes |
Distributions recorded are similar to that of DAS, however, are more likely to be recorded by VP surveys. Historic WeBS surveys show correlations in some sub-regions with targeted counts but generally provide lower estimates. |
|
European shag |
Present in moderate to high numbers in the site. Large, obvious bird, but can be easily confused with great cormorant. |
- |
- |
Yes |
European shag were not detected by DAS methods at all in January, where VP surveys reported low detection rates. Conversely in March estimates from modelled DAS data were significantly higher. Given the possibility for DAS to miss this species we advise that a modified vantage point survey could be a useful alternative, ensuring coverage of nearshore areas including onshore roosts. |
Further analysis of existing data sets
- Further analysis is needed to better understand the relationship between shore-based Citizen Science Pilot surveys and digital aerial surveys, with particular attention paid to how these two data sources might be used together in the future in order to monitor IWW in large MPAs. In particular, analysis of the current data set investigating the relationship between presence-absence data would be valuable in the first instance. In addition, a raster-based approach could enable capture variability of the modelled distribution within the 2km buffer zones for comparison with locations of birds recorded within the Citizen Science Pilot surveys (Grant Humphries, pers. comm.)
- Similarly, further analysis of the entire available data sets for WeBS surveys and RSPB historic seaduck counts would be required to understand the relationship between these two survey types within the Moray Firth SPA.
- If existing vantage point count data are also available at other MPAs comparison with WeBS data could also be useful to developing our understanding of what estimates might be derived at other large marine sites from existing data.
- Investigate the feasibility of creating an IWW population index for the Moray Firth SPA from the RSPB historic data and 2020 Citizen Science Pilot data. This could provide a means of deriving information on population change from such survey methods without assuming that they provide accurate absolute population estimates. However, creation of such an abundance index would entail more detailed investigation around implicit assumption of consistency in direction and magnitude of any errors in count estimates over time.
Future Citizen Science Pilot surveys of IWW in large MPAs
- Should any further Citizen Science vantage point surveys be undertaken, we strongly recommend that volunteers are provided with training in order to reduce variability in counts between observers. Training should cover issues such as species identification, behaviour and ecology, survey protocol and counting methods and data recording and the opportunity to practice with an instructor.
- A change to the protocol advocating a species-by-species approach to counting (rather than left to right across the site) might also reduce the variation in counts, and could also reduce availability bias issues for each individual species. Additionally, standardised equipment might also improve accuracy and reduce variation between observer’s counts. For example, tally counters would allow observers to keep track of large flock counts more easily. Paired observers might also reduce variation in counts, with a second observer validating identification and counts or scribing, allowing another observer to give their attention completely to detection and counting.
- Undertake further field-tests to investigate the impact of environmental factors and alterations to the protocol. In particular we recommend that multiple observer protocols are trialled and field tests investigating the impact of training on variation between observers.
- If citizen science vantage point surveys are to be used for further survey years, we recommend that the surveys be supported by a paid coordinator to provide training, coordinate volunteers and allocate vantage points as well as support the community of observers.
- Develop more robust means of estimating distance to birds e.g. by using range sticks or reticule binoculars which have traditionally been used in estimating by marine mammal observers. Bangarang rangefinders have also been found to reduce variance in distance estimations (Keen et al., 2016). However, it should be noted that distance effects are likely to be conflated with the effects of environmental gradients such as distance from the shore and water depth, thus making it difficult to disentangle these effects from each other. Digital aerial surveys could provide a basis for understanding the gradient from shore, which might help to disentangle these effects. Despite these difficulties a more accurate distance recording method would be beneficial and would enable better comparisons with digital aerial survey methods (Scott et al. 2022) and provide a more fine scale distribution within the nearshore areas of the site.
- Any bespoke monitoring program for IWW in MPAs should make use of links with WeBS and careful discussion and collaboration with BTO should underpin the future direction and development of any such scheme to ensure synergy and mutual benefit and avoid risk of dilution of volunteer effort.
Other approaches
Investigate the use of digital camera systems mounted on Unmanned Aerial Vehicles (UAV’s) or Remotely Piloted Aerial Vehicles (RPAV’s) to verify shore-based surveys or as an alternative to conventional digital aerial surveys. Use of UAV’s/RPAV’s might be particularly valuable as an addition to shore-based surveys, and could provide information on fine-scale habitat use of species, particularly in near shore areas, to build a better picture of abundance and distribution.
References
Banks, A.N., Bolt,D., Bullock, I.D., Collier, M.P., Fairney, N.P., Hasler, C., Haycock, B., Maclean, I.M.D., Roberts, N.P., Sanderson, W.G., Schofield, R.A., Smith, L., Swan, J.M., Taylor, R.H.A., and Whitehead, S. 2007. Ground and aerial monitoring for Carmarthen Bay SPA 2004-07, s.l.: Countryside Council for Wales.
Belt, J. and Krausman, P. 2012. Evaluating population estimates of mountain goats based on citizen science. Wildlife Society Bulletin, 36(2), 264-276.
Bibby, C., Burgess, N., Hill, D. and Mustoe, S. 2000. Bird census techniques, 2nd Edition. s.l.:Elsevier.
BTO, 2017. Wetland Bird Survey: Survey Methods, Analysis & Interpretation.
Chandler, M. et al. 2017. Contribution of citizen science towards international biodiversity monitoring. Biological conservation, 213, 280-294.
Crall, A., Newman, G.J., Stohlgren, T.J., Holfelder, K.A., Graham, J., and Waller, D.M. 2011. Assessing citizen science data quality: an invasive species case study. Conservation Letters, 4, 433-442.
Evans, R.J. 1998. Numbers of wintering seaducks, divers and grebes in the Moray Firth, 1977 – 1995. Scottish Birds,19, 206-222.
Fox, A.D. 2013. Diet and habitat use of scoters Melanitta in the Western Palearctic – a brief overview. Wildfowl, 54, 163–182.
Frederick, P., Hylton, B., Heath, J. and Ruane, M. 2003. Accuracy and variation in estimates of large numbers of birds by individual observers using an aerial survey simulator. Journal of Field Ornithology, 74(3), 281–287.
Frederiksen, M., Daunt, F., Harris, M. P., and Wanless, S. 2008. The demographic impact of extreme events: stochastic weather drives survival and population dynamics in a long-lived seabird. Journal of Animal Ecology Article in Journal of Animal Ecology.
Frost, M.T., Austin, G.E., Calbrade, N.E., Holt, C.A., Mellan, H.J., Hearn, R.D., Stroud, D.A., Wotton, S.R. and Balmer, D.E. 2017. Waterbirds in the UK 2015/16: The Wetland Bird Survey (WeBS). pp 28-29.
Gilbert, G., Gibbons, D.W. and Evans, J. 1998. Bird Monitoring Methods: a manual of techniques for key UK species. Published by the RSPB in association with British Trust for Ornithology.
Guse, N., Garthe, S. and Schirmeister, B. 2009. Diet of red-throated divers Gavia stellata reflects the seasonal availability of Atlantic herring Clupea harengus in the southwestern Baltic Sea. J. Sea Res., 62, 268-275.
Hopkins, P. 1986. Exploited fish and shellfish species in the Moray Firth. Proceedings of the Royal Society of Edinburgh. Section B. Biological Sciences, 91, 57-72.
Hoyer, M., Winn, J. and Canfield Jr., D., 2001. Citizen Monitoring of Aquatic Bird Populations Using a Florida Lake. Lake and Reservoir Management, 17(2), pp. 82-89.
Jackson, D. and Whitfield, P. 2011. Guidance on survey and monitoring in relation to marine renewables deployments in Scotland. Volume 4. Birds. Unpublished draft report to Scottish Natural Heritage and Marine Scotland.
Jakubas, D. 2003. Factors affecting different spatial distribution of wintering Tufted Duck Aythya fuligula and Goldeneye Bucephala clangula in the western part of the Gulf of Gdansk (Poland). Ornis Svecica, 13, 75-84.
Jarrett, D., Cook, A. S. C. P, Woodward, I., Ross, K., Horswill, C., Dadam, D., and Humphreys, E. M. 2018. Short-Term Behavioural Responses of Wintering Waterbirds to Marine Activity: Quantifying the Sensitivity of Waterbird Species during the Non-Breeding Season to Marine Activities in Orkney and the Western Isles. Scottish Marine and Freshwater Science, 7(9), 88.
Kalejta-Summers, B. and Butterfield, D. 2006. Numbers and distribution of wintering divers, grebes and seaducks in the Moray Firth, Scotland, 1998/99-2003/04. Wildfowl, 56, 113-128.
Keen, E.M., Watson, K.B., Qualls, K.M. and Keen, R.M. 2016. A handheld rangefinder for seabird surveys in confined channels. Marine Ornithology, 44, 137-144.
Kirby, J.S., Evans, R.J. and Fox, A.D. 1993. Wintering seaducks in Britain and Ireland: populations, threats, conservation and research priorities. Aquatic Conservation: Marine and Freshwater Ecosystems, 3, 105-137.
Kober, K., Webb, A., Win, I., Lewis, M., O`Brien, S., Wilson, L, J. and Reid, J.B. 2010. An analysis of the numbers and distributions of seabirds within the British Fishery Limit aimed at identifying areas that qualify as possible marine SPAs. JNCC Report No 431.
Kober, K., Wilson, L. J., Black, J., O`Brien, S., Allen, S., Win, I., Bingham, C., and Reid, J.B. 2012. The identification of possible marine SPAs for seabirds in the UK: The application of Stage 1.1-1.4 of the SPA selection guidelines 85pp. JNCC Report No 461.
Law, E., Gajos, K.Z., Wiggins, A., Gray, M.L., and Williams, A. 2017. Crowdsourcing as a tool for research: Implications of uncertainty. Proceedings of the 2017 ACM conference on computer supported cooperative work and social computing. pp. 1544-1561.
Lawson, J., Kober, K., Win, I., Bingham, C., Buxton, N.E., Mudge, G., Webb, A., Reid, J.B., Black, J., Way, L. and O’Brien, S. 2015. An assessment of numbers of wintering divers, seaduck and grebes in inshore marine areas of Scotland. JNCC Report No 567. JNCC, Peterborough.
Lewis, M., Wilson, L.J., Söhle, I., Dean, B.J., Webb, A. and Reid, J.B. 2008. Wintering sea ducks, divers and grebes in UK inshore areas: Aerial surveys and shore-based counts 2006/07. JNCC Report, No. 414.
MacPhail, V.J. and Colla, S.R. 2020. Power of the people: A review of citizen science programs for conservation. Biological Conservation, 249, 108739.
McCluskie, A.E., Langston, R.H.W and Wilkinson, N. 2012. Birds and wave and tidal stream energy: an ecological review. RSPB Research Report No. 42.
Mendel, B, Sonntag, N., Wahl, J., Schwemmer, P., Dries, H., Guse, N., Müller, S. & Garthe, S. 2008. Profiles of seabirds and waterbirds of the German North and Baltic Seas: Distribution, ecology and sensitivities to human activities within the marine environment. Bonn, Bundesamt für Naturschutz.
Moyer‐Horner, L., Smith, M.M. and Belt, J. 2012. Citizen science and observer variability during American pika surveys. The Journal of Wildlife Management, 76(7), 1472-1479.
Musgrove, A., Aebischer, N Eaton, M., Hearn, R., Newton, S Noble S., Parsons, M., Risely, K. and Stroud, D. 2013. Population estimates of birds in Great Britain and the United Kingdom. British Birds, 106, 64-100.
Oedekoven, C.S., Mackenzie, M.L., Scott-Hayward, L.A.S., Rexstad, E. 2013. Statistical Modelling of Seabird and Cetacean data: Literature Review. University of St. Andrews contract for Marine Scotland; SB9 (CR/2012/05).
Oldekop, J., Bebbington, A.J., Berdel, F., Truelove, N.K., Wiersberg, T., and Preziosi, F. 2011. Testing the accuracy of non-experts in biodiversity monitoring exercises using fern species richness in the Ecuadorian Amazon. Biodiversity and Conservation, 20(12), 2615-2626.
Patterson, D. 2019. Monitoring trial of marine waterbirds – Dornoch Sector 2018/19 (Moray Firth). Voluntary report to Scottish Natural Heritage.
Patterson, D. 2021. Roosting behaviour of Common Scoters off Dornoch in the Moray Firth. Scottish Birds, 41, 121-125.
Robbins, A. 2017. Seabird Ecology in High-Energy Environments: Approaches to Assessing Impacts of Marine Renewables. PhD Dissertation, University of Glasgow.
Roycroft, D., Kelly, T.C. and Lewis, L.J. 2007. Behavioural interactions of seabirds with suspended mussel longlines. Aquac. Int., 15, 25–36.
Scott, M.S, Humphries, G, Irwin, C. Peter-Grundy, R. Vilela, R. & Southward, B. 2022. Inshore Wintering Waterfowl in Moray Firth Special Protection Area: 2019/20 digital aerial surveys and comparative analyses of aerial and shore-based surveys. NatureScot Research Report 1280.
Sonntag, N., Garthe, S. and Adler, S. 2009. A freshwater species wintering in a brackish environment: Habitat selection and diet of Slavonian grebes in the southern Baltic Sea. Estuar. Coast. Shelf Sci., 84, 186-194.
Spear, L.B., Ainley, D.G., Hardesty, B.D., Howell, S.N. and Webb, S.W. 2004. Reducing biases affecting at-sea surveys of seabirds: use of multiple observer teams. Marine Ornithology, 32, 147-157.
Tilbrook, P. J. 1986. Nature Conservation in the Moray Firth. Proceedings of the Royal Society of Edinburgh, 91B, 13-25.
Waggitt, J.J., Bell, P.S. and Scott, B.E. 2014. An evaluation of the use of shore-based surveys for estimating spatial overlap between deep-diving seabirds and tidal stream turbines. International Journal of Marine Energy, 8, 36-49.
Webb, A., Harrison, N.M., Leaper, G.M., Steele, R.D., Tasker, M.L. and Pienkowski, M.W. 1990. Seabird distribution west of Britain. Nature Conservancy Council, Peterborough.
Wetlands International, 2014. Waterbird Population Estimates.
Žydelis, R., Dorsch, M., Heinänen, S., Nehls, G. and Weiss, F. 2019. Comparison of digital video surveys with visual aerial surveys for bird monitoring at sea. Journal of Ornithology, 160(2), 567-580.
Annex 1 - Research questions and priorities for the Moray Firth Citizen Science project: topic areas, related questions, and specific questions that could be addressed by the pilot
Topic area: Factors influencing the quality and repeatability, of shore-based counts of IWW qualifying features
Question 1. How do species-specific, environmental, and observer (including equipment) factors affect quality and repeatability of shore-based counts of IWW?
1.1: How do species (size, plumage, behavioural etc.) and environmental (weather, tide, light etc.) factors together affect quality of shore-based counts of selected IWW?
Proposed approach: Literature review, discussions with experienced counters, preliminary field tests.
Status: Not completed (Planned field tests were cancelled due to Covid-19 restrictions).
1.2: To what extent does observer experience influence count quality and repeatability?
Proposed approach: Field test during pilot trial.
Status: Completed.
1.3: How does equipment (optics) influence count quality and repeatability?
Proposed approach: Field test during pilot trial.
Status: Not completed (Not possible due to Covid-19 restrictions).
Question 2. Can these factors be controlled for through survey design and data collection protocols?
2.1: What is the optimal survey design and data collection protocol for Citizen Science Pilot survey of IWW?
Proposed approach: Design pilot survey and draft data collection protocol with reference to results of preliminary field tests (see 1.1), trial with volunteers and seek volunteer feedback. Extract and analyse data. Identify strengths and weaknesses of trial approach.
Status: Completed.
Topic area: Potential (added) value of targeted shore-based counts of IWW to detection of long-term trends and shorter-term variations in the populations and / or distributions of IWW qualifying features in large MPAs
Question 3. Do targeted shore-based counts of IWW provide a consistent proxy indicator of overall populations of some or all species in large marine sites?
3.1 Are the species abundance estimates from targeted shore-based counts significantly correlated with abundance estimates obtained from digital aerial surveys in the Moray Firth SPA?
Proposed approach: Compare results from pilot targeted shore-based counts in January and February 2020 with those from digital aerial surveys.
Status: Completed.
3.2 Does the distributions from targeted shore-based count pilot study in the Moray Firth indicate similar distributions of SPA qualifying features to those derived from digital aerial surveys?
Proposed approach: Compare results from pilot targeted shore-based counts in January and February 2020 with those from digital aerial surveys.
Status: Completed.
Question 4. Do targeted shore-based counts of IWW produce significantly improved information on the abundance and distribution of any IWW species from that derived from WeBS?
4.1 How do species abundance estimates from historic and pilot targeted shore-based counts in the Moray Firth relate to abundance estimates from WeBS?
Proposed approach: Compare shore-based count data from historic RSPB surveys and current pilot with WeBS data from the same months/ years.
Status: Completed.
4.2 Do targeted shore-based counts indicate similar distributions of SPA qualifying features to WeBS in the Moray Firth?
Compare shore-based count data from historic RSPB surveys and current pilot with WeBS data from the same months/ years.
Status: Completed.
4.3 What conclusions can be drawn with respect to the potential added value of targeted shore-based counts over and above that of WeBS for monitoring of each of the IWW species in the Moray Firth?
Proposed approach: Collate and report on results from analyses above.
Status: Completed.
Topic area: Practicality and wider value of a Citizen Science model for targeted monitoring of IWW within MPAs and approaches to development and delivery
Question 5. Is there likely to be sufficient volunteer support for this type of monitoring in both the short and long term?
5.1 Is there interest / motivation for bespoke long term monitoring of IWW in the Moray Firth SPA to be sustained by communities/ volunteers?
Proposed approach: Seek and evaluate feedback from volunteers involved in the pilot; provide information for wider communities of potential future volunteers
Status: Completed.
5.2 Can members of the public be trained in identification and counting techniques to be able to provide a valuable count estimate?
Proposed approach: Supplementary trial events and evaluation of results.
Status: Work on this research question was not completed due to time constraints in the development of the surveys.
5.3 Are their wider benefits to a Citizen Science approach (e.g. around connection with MPAs and the species they are safeguarding)?
Proposed approach: Feedback from public engagement.
Status: Completed.
Annex 2 - Vantage points defined in Citizen Science Pilot
Table A2: Details of vantage points
|
Vantage point code |
Vantage point name |
Grid ref |
Sector |
Surveyed |
|---|---|---|---|---|
|
1 |
Kintradwell |
NC920073 |
Brora |
January and March |
|
2 |
Brora; N side river |
NC910039 |
Brora |
Not surveyed |
|
3 |
Brora; S side river |
NC910035 |
Brora |
January and March |
|
4 |
Strathsteven |
NC873014 |
Brora |
January and March |
|
5 |
Golspie pier |
NH829996 |
Outer Dornoch Firth |
Not surveyed |
|
6 |
Golspie golf course |
NH822982 |
Outer Dornoch Firth |
January and March |
|
7 |
Ferry links |
NH817959 |
Outer Dornoch Firth |
January and March |
|
12 |
Coul links |
NH815952 |
Outer Dornoch Firth |
Not surveyed |
|
13 |
Embo town |
NH818930 |
Outer Dornoch Firth |
January and March |
|
14 |
Embo pier |
NH821922 |
Outer Dornoch Firth |
Not surveyed |
|
15 |
Dornoch golf course |
NH807896 |
Outer Dornoch Firth |
January and March |
|
16 |
Dornoch point |
NH807873 |
Outer Dornoch Firth |
January |
|
19 |
Portnahomack |
NH915848 |
Outer Dornoch Firth |
January and March |
|
20 |
Tarbat Ness |
NH949878 |
Easter Ross Coast |
January and March |
|
21 |
Wilkhaven |
NH944872 |
Easter Ross Coast |
Not surveyed |
|
22 |
Rockfield |
NH924829 |
Easter Ross Coast |
January and March |
|
23 |
Hilton of Cadboll |
NH873767 |
Easter Ross Coast |
January |
|
24 |
Balintore |
NH865754 |
Easter Ross Coast |
Not surveyed |
|
25 |
Shandwick |
NH859748 |
Easter Ross Coast |
January and March |
|
26 |
Castlecraig |
NH821688 |
Easter Ross Coast |
Not surveyed |
|
29 |
South Sutor of Cromarty |
NH807671 |
Riff Bank |
January |
|
30 |
McFarquhar's Cave |
NH800652 |
Riff Bank |
January |
|
31 |
Ethie fishing station |
NH775635 |
Riff Bank |
January |
|
32 |
Learnie |
NH754608 |
Riff Bank |
Not surveyed |
|
33 |
Brown Hill |
NH742604 |
Riff Bank |
January |
|
34 |
Rosemarkie |
NH739578 |
Riff Bank |
January and March |
|
35 |
Chanonry Point East |
NH750557 |
Inverness / Beauly Firth |
Not surveyed |
|
36 |
Longman outfall, Inverness |
NH666469 |
Inverness / Beauly Firth |
January and March |
|
37 |
Fort George, west tip |
NH758566 |
Inverness / Beauly Firth |
Not surveyed |
|
38 |
Fort George, east tip |
NH764569 |
Riff Bank |
Not surveyed |
|
39 |
Point NE of Fort George |
NH770576 |
Riff Bank |
January |
|
40 |
Hilton of Delnies |
NH845568 |
Riff Bank |
Not surveyed |
|
41 |
Nairn pier |
NH889576 |
Nairn and Culbin Bars |
March |
|
42 |
Kingsteps |
NH907578 |
Nairn and Culbin Bars |
Not surveyed |
|
43 |
Nairn Bar, near the bothy |
NH932607 |
Nairn and Culbin Bars |
Not surveyed |
|
44 |
Culbin Bar, near the bothy |
NH955621 |
Nairn and Culbin Bars |
January and March |
|
45 |
West of Buckie Loch |
NH994645 |
Nairn and Culbin Bars |
January and March |
|
46 |
East of Buckie Loch |
NJ007648 |
Nairn and Culbin Bars |
January and March |
|
48 |
Findhorn Bay mouth |
NJ033649 |
Burghead Bay |
Not surveyed |
|
49 |
Findhorn east |
NJ049648 |
Burghead Bay |
Not surveyed |
|
50 |
Roseisle forest |
NJ102657 |
Burghead Bay |
March |
|
51 |
Burghead town |
NJ112688 |
Burghead Bay |
Not surveyed |
|
52 |
Burghead Point |
NJ107692 |
Burghead Bay |
January and March |
|
53 |
Burghead outfall |
NJ115691 |
Burghead to Lossiemouth |
January and March |
|
54 |
Point between Burghead and Cummingston |
NJ123691 |
Burghead to Lossiemouth |
Not surveyed |
|
55 |
Hopeman Harbour |
NJ145701 |
Burghead to Lossiemouth |
Not surveyed |
|
56 |
Gow's Castle |
NJ176708 |
Burghead to Lossiemouth |
Not surveyed |
|
57 |
Covesea lighthouse |
NJ203714 |
Burghead to Lossiemouth |
March |
|
58 |
Branderburgh harbour |
NJ238713 |
Burghead to Lossiemouth |
January and March |
|
59 |
East of Lossiemouth |
NJ252697 |
Spey Bay |
Not surveyed |
|
60 |
Boar's Head Rock |
NJ284679 |
Spey Bay |
January |
|
61 |
West of Kingston |
NJ321663 |
Spey Bay |
January |
|
62 |
Kingston |
NJ336658 |
Spey Bay |
January and March |
|
1a |
Helmsdale |
ND032152 |
Badbea to Lothbeg |
January |
|
1b |
Portgower |
ND013137 |
Badbea to Lothbeg |
Not surveyed |
|
1c |
Lothbeg Point |
NC960096 |
Badbea to Lothbeg |
Not surveyed |
|
I/B 1 |
Chanonry Point West |
NH748556 |
Inverness / Beauly Firth |
January |
|
I/B 2 |
Fortrose |
NH731562 |
Inverness / Beauly Firth |
January and March |
|
I/B 3 |
Fortrose Road/Avoch |
NH715557 |
Inverness / Beauly Firth |
Not surveyed |
|
I/B 4 |
East Kessock |
NH677501 |
Inverness / Beauly Firth |
January |
|
I/B 5 |
Kessock Bridge East |
NH663478 |
Inverness / Beauly Firth |
January and March |
|
I/B 6 |
Kessock Bridge West |
NH662478 |
Inverness / Beauly Firth |
Not surveyed |
|
I/B 7 |
Charlestown |
NH638483 |
Inverness / Beauly Firth |
January and March |
|
I/B 8 |
Coulmore |
NH612483 |
Inverness / Beauly Firth |
January |
|
N1 |
Tugnet |
NJ349654 |
Spey Bay |
January and March |
|
N2 |
Portgordon |
NJ387642 |
Spey Bay |
January |
|
N3 |
Strathlene Sands |
NJ447671 |
Buckie to Portsoy |
January |
|
N4 |
Bow Fiddle Rock |
NJ492687 |
Buckie to Portsoy |
Not surveyed |
|
N5 |
Cullen Sands |
NJ501675 |
Buckie to Portsoy |
January |
|
N6 |
Sandend |
NJ556662 |
Buckie to Portsoy |
January |
|
N7 |
Badbea |
ND091202 |
Badbea to Lothbeg |
Not surveyed |
|
N8 |
Cnoc na Stri |
ND062183 |
Badbea to Lothbeg |
Not surveyed |
|
N9 |
Lossiemouth Town East |
NJ240711 |
Spey Bay |
Not surveyed |
|
S1 |
Nairn Golfcourse |
NH858565 |
Riff Bank |
January |
|
S10 |
Drumancroy |
NH893831 |
Outer Dornoch Firth |
Not surveyed |
|
S12 |
Lothbeg South - Near Balinreach |
NC938091 |
Badbea to Lothbeg |
Not surveyed |
|
S2 |
Ardersier |
NH781546 |
Inverness / Beauly Firth |
January |
|
S3 |
Fisherton - Near Balnaglack |
NH737504 |
Inverness / Beauly Firth |
January |
|
S4 |
Alturlie Point |
NH714496 |
Inverness / Beauly Firth |
January |
|
S5 |
Milton |
NH706469 |
Inverness / Beauly Firth |
Not surveyed |
|
S6 |
South Kessock |
NH659472 |
Inverness / Beauly Firth |
January |
|
S7 |
Bunchrew |
NH610459 |
Inverness / Beauly Firth |
January and March |
|
S8 |
Redcastle |
NH582493 |
Inverness / Beauly Firth |
January |
|
S9 |
Kilmuir |
NH676497 |
Inverness / Beauly Firth |
Not surveyed |
Annex 3 - Citizen Science Pilot Survey Recording Form
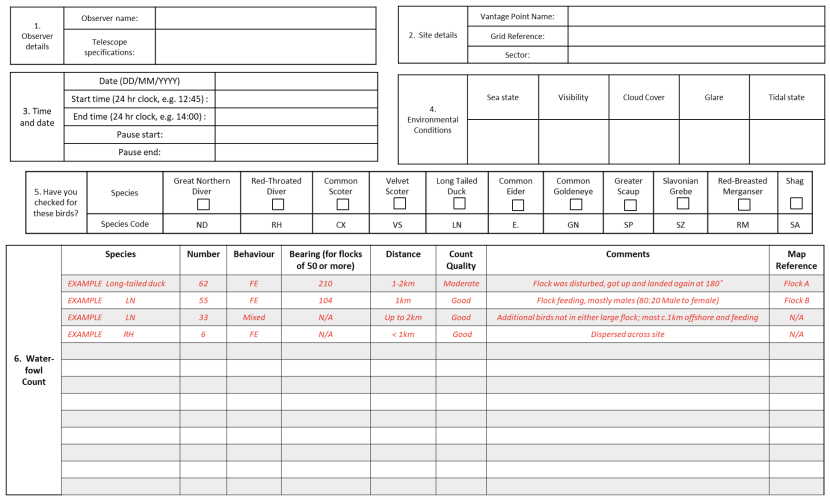
Example of the recording form used during the citizen science pilot surveys. The recording form requests the following information: 1.Observer details including observer name and telescope specifications, 2. Site details including vantage point name, grid reference and sector, 3. Time and date including date, start time, end time, pause start and pause end, 4. Environmental Conditions including sea state, visibility, cloud cover, glare and tidal state, 5. List of species to check for with check-box for confirmation 6. Waterfowl count including species, number, behaviour, bearing (for flocks of 50 or more), distance, count quality, comments and map reference. The table includes some examples.
Annex 4 - Citizen Science Pilot Volunteer Questionnaire
- How did you hear about the Moray Firth Waterfowl Count?
- Do you take part in any other waterfowl surveys e.g. WeBS? If so please provide details below.
- Did you enjoy participating in the wintering waterfowl monitoring this year?
- Would you be interested in participating in this kind of monitoring in the future?
- Would you recommend this volunteering to a friend?
- Please indicate how easy or difficult it was to follow / use the protocol provided for the surveys? See Table A4.
- Are there any aspects of the protocol you would change or improve?
- Did you have any particularly enjoyable moments during the surveys? E.g bird sightings etc.
- How did you find the communication and organisation of the Moray Firth waterfowl counts?
- Did you have enough prior notice of the survey dates? (If no, how long would you ideally like to know in advance?)
- What is your preferred method of communication (e.g. e-mail, phone, social media?)
- Would you be interested in attending a webinar about the project in the summer?
Table A4: For each element of the protocol, select the number that best indicates how easy or difficult it was to follow. 1 = very easy, 2 = easy, 3 = neither easy nor difficult, 4 = difficult, 5 = very difficult
|
Environmental conditions (sea state, visibility, cloud cover, glare, tidal state) |
1 |
2 |
3 |
4 |
5 |
|---|---|---|---|---|---|
|
Species |
1 |
2 |
3 |
4 |
5 |
|
Count (Number) |
1 |
2 |
3 |
4 |
5 |
|
Behaviour |
1 |
2 |
3 |
4 |
5 |
|
Bearing |
1 |
2 |
3 |
4 |
5 |
|
Distance |
1 |
2 |
3 |
4 |
5 |
|
Count quality |
1 |
2 |
3 |
4 |
5 |
|
Maps |
1 |
2 |
3 |
4 |
5 |
Annex 5 - Citizen Science Pilot Survey Protocol
Moray Firth Waterfowl Count
Thank you for assisting with our wintering waterfowl surveys! This pack has been pulled together to help you to conduct your survey at your vantage point(s).
This pack includes:
- An introduction to SNH’s Waterfowl Monitoring Pilot Study
- Key Contact details
- The Survey Methodology
- Recording forms
- What to do with your recording forms
- Safety information
- Biosecurity information
We really appreciate the time and effort that you put into surveying. We hope you enjoy completing the surveys with us in January and February 2020 and we can’t wait to share the results with you!
Kind regards,
Jen Graham
An introduction to the Waterfowl monitoring pilot
Scottish Natural Heritage (SNH) are carrying forward a programme of work to investigate the best method for surveying inshore wintering waterfowl in our marine Special Protection Areas.
To investigate this question we are running coordinated shore-based surveys from vantage points around the Moray Firth in January and February, and with your help we will be estimating the populations of inshore wintering waterfowl.
Species of interest
The Moray Firth pSPA has been proposed for the following species: red-throated diver, great northern diver, common scoter, velvet scoter, common goldeneye, common eider, long-tailed duck, greater scaup, Slavonian grebe, and red-breasted merganser as well as European shag. It is these species we are most interested in, although any data on other species seen on the water would be good also, particularly data-poor species such as white-billed diver.
What will we do with the data?
Our primary interest with this data is to understand the best means of surveying wintering waterfowl in our protected sites. Once we have collected all the data, we will run comparative analysis to look at how shore-based data compares with digital aerial survey data as well as how it compares with historic count data from the Moray Firth.
We will also be looking at how this dedicated methodology compares with the BTO’s Wetland Bird Surveys (WeBS), who are supporting and advising us with this project. We are not looking to duplicate effort or indeed in any way replace the WeBS counts, which provide an excellent long-term data set over a very large spatial scale. If we were to find that our methodology provided additional value to that of the WeBS survey for our target species then we will work with WeBS to find a suitable means of incorporating this methodology in a meaningful way. Observations will also be provided to WeBS as supplementary data, and will be stored in their database.
Key Contact Details
Jen Graham (Survey Coordinator)
Office: 01463 725063
Mobile: 07799342378
Kate Thompson (Project Manager)
Office: 01463 7001672
Coastguard: Dial ‘999’ and ask for the Coastguard
Survey Methodology
This method is used to estimate the population of species in a known area at sea. The technique is a ‘look-see’ method, in which the observer, with knowledge of where the species of interest are likely to be, surveys the whole of a predefined area, counting all birds seen within that site (Bibby et al. 2000).
SNH have defined the sites which we will be surveying for these species, you will be provided with the site name, access information, grid references and bespoke recording forms to allow you to survey this site.
This methodology will describe the equipment needed to undertake the survey, how to undertake your count and also how to fill in the recording form provided.
Equipment
Essential
- Binoculars
- A telescope and tripod
- A map of the site with vantage point, distance band and access points defined (provided by SNH)
- Recording sheet (provided by SNH)
- Pencil
- Compass or compass app (We suggest either ‘Digital Field Compass’ for Android phones or ‘Compass’ for iPhones)
- Warm and waterproof clothing, and a warm drink and snacks to enable the observer to be outside in cold, and potentially wet weather.
- Mobile phone (Phone number of coordinator listed in section 2.)
Desirable
- Tally counter
- Clipboard / weather writer
Before you start your survey
Once you have arrived at your allocated vantage point, and set up your telescope, please take a minute to fill in sections 1 - 3 of the recording form (Observer details, Site details, and Date).
Observer Details and Telescope specification
Please enter your name in the box provided. Please use separate recording sheets if two persons are counting simultaneously. There should only be one observer per recording form. We are also recording the specifications of your telescope; please include magnification, lens diameter and brand and model (if known).
Site details
Please enter the name of your site (Vantage Point). If the location which you are counting from differs from the grid reference provided to you for your Vantage Point, please record the grid reference actually used. Details on the Vantage Point name, grid reference and sectors will be provided to you prior to the survey.
Date
Please enter the date using the following format (DD/MM/YY). Do not enter the time until you are ready to start your count.
Assessing Environmental Conditions
Once you have completed the first part of the form, you can start to assess the environmental conditions at the site, to determine whether a count can be done. Please record environmental conditions on section 4 of the recording form.
Surveys should not be undertaken in conditions which would reduce the detection of the target species, for instance, in foggy conditions, severe weather or excessive glare on the water. We ask that that no counts are undertaken where there is a sea state of 4 or higher, and where visibility is less than 2km.
Sea state
The following Beaufort scale relates sea state to wind speed. Wind speed and consequent wave height can affect our ability to observe and record birds at sea. Please record Force from 0-7. If sea state is above 4, please do not carry out a count, however, it would be useful if you were to record the environmental conditions, and write in comments that a count was not completed.
Sea State - Beaufort Scale
|
Force |
Description |
Detailed description |
|---|---|---|
|
0 |
Calm |
Mirror-like water surface |
|
1 |
Light air |
Ripples with the appearance of scales are formed, no foam crests |
|
2 |
Light breeze |
Small wavelets, still short, but more pronounced. Crests have a glassy appearance. |
|
3 |
Gentle breeze |
Large wavelets. Crests begin to break. Foam of glassy appearance. |
|
4 |
Moderate Breeze |
Small waves becoming larger, fairly frequent white horses |
|
5 |
Fresh Breeze |
Moderate waves, taking a more pronounced longer form, many white horses are formed. Chance of some spray. |
|
6 |
Strong Breeze |
Large waves begin to form; white foam crests are more extensive everywhere. Probably some spray |
|
7 |
Near gale |
Sea heaps up and white foam from breaking waves begins to be blown in streaks along the direction of the wind. |
Visibility
Visibility also affects our ability to detect birds at our sites. Visibility is recorded on a scale of: 1 – 4, 1 being very poor visibility, and 4 being clear to the horizon. Please do not undertake a count when visibility is 1 or less.
|
Visibility |
Distance |
Description |
|---|---|---|
|
1 |
< 1km |
Poor |
|
2 |
1 - 5km |
Moderate |
|
3 |
5-10km |
Good |
|
4 |
> 10 km |
Excellent (clear to Horizon) |
Cloud Cover
This is measured in ‘Oktas’ or ‘eighths’. Total cloud amount is the fraction of the sky (expressed as eighths) covered by cloud of any type or height above the ground.
|
Cloud Cover (Oktas) |
Description |
|---|---|
|
0 |
Sky Clear |
|
1 |
Few Clouds |
|
2 |
Few Clouds |
|
3 |
Scattered |
|
4 |
Scattered |
|
5 |
Broken |
|
6 |
Broken |
|
7 |
Broken |
|
8 |
Overcast |
|
9 |
Sky obscured e.g. Fog |
Glare
Due to the danger of looking at the sun’s reflection, whilst using optics such as binoculars and telescopes, we ask that you do not count any sections where there is glare on the sea surface. Glare also affects our ability to detect birds on the water. If there is glare from the sun during your count, please record the percentage of the sea which you are unable to count, providing a bearing start and bearing end of glare in the comments if possible and/or by sketching on your Vantage Point Map.
Tidal State
Please indicate whether your count was undertaken at high or low tide.
The survey
Once you have recorded the observer details and environmental conditions, you are ready to start your count!
Time
Please record the time that you are starting your observation in 24h clock format e.g. 12:30. Record the start and end of any pauses you take during your observations.
Scanning
Observers are encouraged to scan as methodically as possible. It is advised that binoculars are used to identify the location of birds, including major flocks, to be counted. Please use binoculars to scan the entire survey area (from the left-most extent to the right-most extent of your survey area). The telescope should then be used to identify and count birds, and to scan further out to sea, where some species may not be found using binoculars only (e.g. red-throated divers).
How long to spend surveying
As the number of birds will differ based on sites and also time of day and tide height, we are not putting an exact limit on the time to be spent surveying at each vantage point. Instead we would ask that you stop surveying once you have counted all the birds which were present during your first scan. We anticipate that this would take no longer than an hour and a half.
Species identification and counting
Please ensure that you record any of the key species within your vantage point. The species of interest are listed on the recording form, with a check box as a prompt. You can record birds using either the species code provided on the form or the full species name.
Birds should be identified to species level, where possible. However, if the species is unknown, please indicate to lowest taxonomic rank possible, for example, ‘diver sp’ or ‘scoter sp.’. The data is much more valuable at this level than a potentially incorrect guess. Please do not record any birds in flight, unless they take off from or land in your sector. Where flocks are over 50 individuals please count twice before recording your count, or a third time where there is a large difference between the first and second count. We advise that observers use what they feel is their best estimate.
Distance recording and directional information
We are interested in recording the estimated distance of flocks from the Vantage Point. This will help us to understand how far out to sea our observers can identify and count birds. We know just how difficult it is to estimate distance at sea, so to help with this we have created maps of each vantage point with 1km distance bands out to sea. We have also highlighted the distance to landmarks and any known buoys which might help you to estimate distance out to sea. Please record the distance of flocks of over 50 individuals using the map and distance bands to help you. You can indicate where you think flocks are on the map provided also.
We are also interested in the area of the site which birds are using. Taking a compass bearing will allow us to gain a better understanding of where flocks are. Please record the bearing to the middle of the flock – for any flock of over 50 individuals.
If time allows any distance and directional information on smaller groups or even on individual birds would be very beneficial.
Behaviour
Behaviour can add useful contextual data to our surveys and also help to inform management.For that reason, we are asking that behaviour is recorded. Of course behaviour is variable between individuals, so when estimating behaviour, try to record the behaviour of the majority of the flock(s). Please use the behaviour code below to help.
|
Code |
Behaviour |
|---|---|
|
FE |
Feeding |
|
RW |
Roosting / resting on sea |
|
PR |
Preening/ bathing |
|
DI |
Courtship Display |
Count Quality
Here we are looking for an idea of how accurate you believe your count to be. Please use ‘Good’, ‘Moderate’ or ‘Poor’ to indicate the quality of your count. For example if the flock you were counting suddenly flew off during the middle of your count you might mark this as ‘Poor’. Whereas if you got a full count in before it flew off, but weren’t able to count a second time you might mark it as ‘Moderate’.
End Time
Once you have finished counting the birds present at your site, please remember to record the end time on your recording sheet.
If you have any queries during your survey, please don’t hesitate to contact Jen Graham.
Recording Form
See Annex 3.
What to do with your recording forms
Once you have completed your surveys please send a copy either by mail or a scanned version by email.
Post:
Scottish Natural Heritage
C/O Jen Graham
Marine Ecosystems
Great Glen House,
Leachkin Rd,
Inverness
IV3 8NW
Email: [email protected]
Please note that if scanning and sending by email, maps may not show up details clearly. Please annotate clearly any information which must not be lost.
Safety During surveys
Volunteer responsibility
As a volunteer, you are under no obligation to participate in or continue with a survey and you should not put yourself in a position that could place you, or others, in danger.
ALL VOLUNTEERS ARE REQUIRED TO SEND CONFIRMATION THAT THEY HAVE RECEIVED, READ AND UNDERSTOOD THE ATTACHED RISK ASSESSMENT PRIOR TO UNDERTAKING ANY SURVEYS.
If you have not received a copy of the risk assessment then please contact Jen Graham.
Biosecurity
The threat to our environment and economy from animal and plant diseases and invasive non-native species has never been greater. Increased global trade and movement of goods between countries has increased the risk of spreading non-native species, pests and diseases, and climate change makes it likely that new species will establish. Biosecurity is about following good hygiene practices to reduce and minimise the risks of introducing or spreading animal and plant pests and diseases, parasites and non-native species.
Basic biosecurity advice for field work:
- Arrive at the site with clean footwear and vehicle;
- Ensure footwear is clean (visually from soil and debris) before leaving the site;
- Ensure vehicle is kept clean - in particular remove any accumulated mud before leaving the site;
- Make use of any facilities provided on the site to clean footwear/equipment;
- Keep access to a minimum;
- If practical do not take vehicles onto the premises, keep to established tracks and park vehicles on hard standing;
- Where possible, avoid areas with livestock and areas with known plant disease; and
- Plan your trip so that you visit the most risky site last.
Please confirm that you have read and understood this Biosecurity notice by emailing the project officer (Jen Graham).
Disclaimer: Scottish Natural Heritage (SNH) has changed its name to NatureScot as of the 24th August 2020.
At the time of publishing, this document may still refer to Scottish Natural Heritage (SNH) and include the original branding. It may also contain broken links to the old domain.
If you have any issues accessing this document please contact us via our feedback form.
