NatureScot Research Report 1398 - A preliminary investigation into benthic physical disturbance associated with creel fishing and an assessment of potential impacts on biogenic habitats formed by Limaria hians
Published: 2026
Authors: Harries, D.B., Moore, C.G., Lyndon, A.R., Tulbure, K. and Philp, B.
Cite as: Harries, D.B., Moore, C.G., Lyndon, A.R., Tulbure, K. and Philp, B. A preliminary investigation into benthic physical disturbance associated with creel fishing and an assessment of potential impacts on biogenic habitats formed by Limaria hians. NatureScot Research Report 1398.
Contents
- Keywords
- Background
- Main findings
- 1. Introduction
- 2. Methods
-
3. Results
-
3.1 Creel dragging
- 3.1.1 Drag observed during creel deployment
-
3.1.2 Drag observed during creel recovery
- 3.1.2.1 Comparison of drag length of proximal and distal creels
- 3.1.2.2 Assessment of drag length in relation to creel orientation to prevailing boat drift
- 3.1.2.3 Assessment of drag length in relation to the number of creels on the array
- 3.1.2.4 Assessment of drag length in relation to water depth
- 3.1.2.5 Assessment of the influence of boat drift on creel dragging
- 3.1.2.6 Assessment of the influence of rope buoyancy
- 3.1.2.7 Assessment of how drag is influenced by snagging at the surface
- 3.2 Experimental creel dragging on Limaria
-
3.1 Creel dragging
- 4. Discussion
- Acknowledgements
- 5. References
Keywords
Limaria hians; flame shells; creeling; benthic disturbance; fishing
Background
Compared to the use of some other types of fishing gear, relatively little is known about the level of disturbance associated with creels. The sensitivity of benthic habitats to physical disturbance varies significantly and biogenic habitats are often among the most sensitive. This study aims to characterise physical disturbance associated with creel deployment and recovery and evaluate the impact of comparable levels of disturbance on biogenic habitats formed by the flame shell Limaria hians.
Main findings
- No dragging of creels on the seabed was evident during creel deployment regardless of whether the creels were self-shot or deployed by hand.
- Creel drag can occur during creel recovery but the extent of the drag is highly variable depending on specific circumstances.
- Drag extent is typically more pronounced for creels distal to the pick-up buoy whereas creels proximal to the buoy are often lifted with no dragging.
- There is tentative evidence that creel arrays aligned perpendicular to the direction of boat drift are more prone to dragging upon recovery compared to when the array is aligned to the direction of drift.
- Boat drift during recovery can significantly increase the extent of creel dragging.
- Observed drag length during recovery in a moderate current and light wind ranged from 0 - 4 m. Drag length during recovery in a strong breeze ranged from 3 - 6.5 m.
- Drag length did not differ depending on whether negatively or positively buoyant rope was used in the array but contact of the negatively buoyant rope with the seabed may cause some limited additional disturbance.
- Delays in the hauling process (e.g. due to surface entanglements) increase the extent of drag. The level of this will depend on the duration of the delay in hauling, the degree of boat drift and on the weight of deployed creel gear.
- Experimental creel drags by divers on Limaria beds resulted in no measurable decline in nest cover or abundance of Limaria.
- Visible disruption of nest material was evident as a result of the diver creel drags but the proportion of the area affected was low (often <1% and no higher than 5%).
- Limaria were exposed at the surface following disturbance by diver creel drags and were seen to be subject to predation.
- Significantly more Limaria were exposed by diver creel drags at a site with higher relief nest surfaces than was the case at sites with more even surface relief.
1. Introduction
The environmental impact of mobile demersal fishing gear on seabed biota is relatively well documented and generally acknowledged to be significant (e.g., Hiddink et al. 2006, Hinz et al. 2009, Kaiser and Spencer, 1996, Kaiser et al. 2000, Mazor et al. 2021, Thrush et al. 1998, van Denderen et al. 2014, van Denderen et al. 2024). In contrast, there are relatively little empirical data on the impacts of creel fisheries and in general their potential for causing significant environmental damage is acknowledged to be relatively limited (e.g. Eichert et al. 2018, Hammarlund et al. 2021, Leocadio et al. 2012, Morello et al. 2009).
Studies of creel fishery impacts have included those focussing on aspects such as impact on populations of the target species (e.g. Ziegler and Valentinsson, 2008), impacts associated with bait (e.g. Murray 2015, Spoors et al. 2021), impacts associated with ‘ghost fishing’ (e.g. Adey et al. 2008) and entanglement of marine mammals (e.g. Calderan et al. 2024). Relatively few studies have investigated the potential for direct physical disturbance by creel dragging during normal fishing operations (e.g. Adey 2007, Eno et al. 2001, Gall et al. 2020, Rees et al. 2018, Rees et al. 2021, Stevens 2021, Walmsley et al. 2015).
It is well established that the consequences of physical disturbance on benthic biota vary considerably depending on the nature of the habitat (e.g., Hiddink et al. 2006, Hiddink et al. 2019, Kaiser and Spencer, 1996, Kaiser et al. 2000, van Denderen et al. 2014). Highly dynamic unstable sands and gravels often display little or no community change attributable to physical disturbance. In contrast, stable or structurally complex seabed types tend to be more sensitive to physical disturbance and recovery from such events may be protracted.
Biogenic habitats fall into the category of structurally complex seabed types and are generally considered to have high sensitivity and low resilience to physical disturbance (e.g. Holt et al. 1998). Biogenic habitats are of conservation interest because of their rarity and high levels of associated biodiversity. Accordingly, the evaluation of disturbance impacts is relevant to conservation management decisions for protected sites.
This study has focussed on impacts on Limaria beds. There is historical evidence of long-term impacts from mobile fishing gear on Limaria beds in the Clyde (Hall-Spencer and Moore 2000). It has also been suggested that creeling activity may have been implicated in the decline of a Limaria bed at Port Appin (Moore et al. 2012).
The aims of this study fall into 2 distinct sections: Firstly, to investigate the nature and extent of accidental creel dragging during deployment and recovery of fishing gear. Secondly, to experimentally replicate similar disturbance events on Limaria beds and evaluate impacts.
2. Methods
2.1 Creel dragging
The approach taken was to attach GoPro cameras to creels and to deploy and recover the creel array using normal procedures. The dimensions of the creels were 70 cm by 52 cm base, 43 cm height and they weighed 16.7 kg (illustrated in Figure 2). The work was conducted from the 12 m, 10-ton creel boat Nemesis (BRD115) and recovery was made using a pot hauler. The video footage was subsequently scrutinised to assess if and how the creels dragged along the seabed. Different configurations of creel arrays were used and deployment and recovery procedures varied to assess differences in drag extent in different circumstances.
2.1.1 Creel deployments
A total of 18 creel deployments were made. Twelve were made in Loch Carron in 2021 in light winds (~F2). They were done during spring tides and there was a variable degree of tidal flow (0 to ~1 kn). The remaining 6 were made near the island of Pabay in 2024 when a strong breeze was present (F4 to 5) and tides were on neaps. A summary of these deployments is shown in Table 1.
Three different creel arrays were used. One with 2 creels, another with 3 creels and a third with 4 creels. The 4 creel array was further varied by use of negatively buoyant rope in some deployments and positively buoyant rope in others.
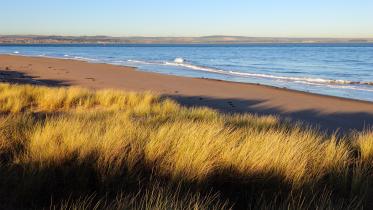
The 2 creel array was used for 3 deployments of differing orientation relative to tidal flow in Loch Carron in approximately 20 m of water. Cameras were attached to the front and back of each creel. A 5 kg end weight was attached to the distal creel and the spacing between the creels and between the distal creel and end weight was 15 m. Bridles connecting the creels to the main line were 2 m length. Creel configuration is shown in Figure 1.
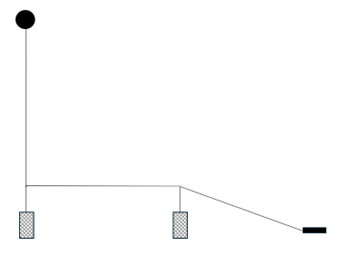
Figure 1. – Diagrammatic illustration of the 2 creel array used in Loch Carron.
Click for a full description
Diagram showing a surface buoy attached to a creel. A connecting line links to a second creel and a further connecting line attaches the second creel to a weight.
The 3 creel array was used for 9 deployments in Loch Carron. The first 4 of these deployments were made in approximately 12 m of water. The deployment orientation was varied in relation to the tidal flow and a surface snag was simulated for the 4th with the boat hanging on to the pick-up buoy for several minutes.
The remaining 5 deployments were made in approximately 18 m of water. The creel array was laid perpendicular to the tidal flow in all cases. The first deployment was made by hand but the following 3 were self-shot to assess if this procedure increases drag during the deployment phase. For the final deployment a surface snag was simulated with the boat hanging on to the pick-up buoy for several minutes.
Cameras were attached to the front and back of the proximal (1st) creel and the distal (3rd) creel. A 5 kg end weight was attached to the distal creel and the spacing between the creels and between the distal creel and end weight was 15 m. Bridles connecting the creels to the main line were 2 m length. Creel configuration is shown in Figure 2.
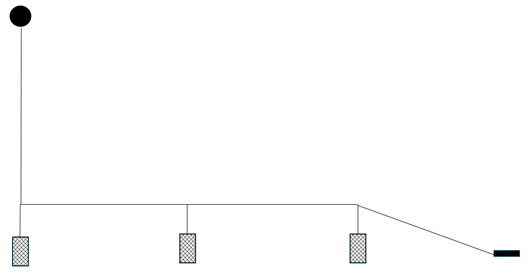
Figure 2. – Diagrammatic illustration of the 3 creel array used in Loch Carron.
Click for a full description
Diagram shows a surface buoy attached to a creel. This creel is attached to two further creels at intervals along a connecting line. The final creel is attached to a weight by a further connecting line.
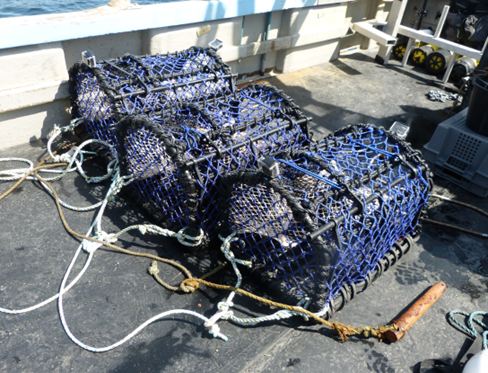
Figure 2. – Photograph of the 3 creel array used in Loch Carron.
Click for a full description
The photograph shows the 3 creels and the weight on the deck of the boat before deployment.
The 4 creel array was used for 6 deployments at Pabay in approximately 15 m of water. All deployments were aligned with the boat drift due to the prevailing strong wind. The first 3 deployments used positively buoyant rope on the array with negatively buoyant rope used for remaining deployments.
Cameras were attached to the front, back and the side of the proximal (1st) creel and the distal (4th) creel. Spacing between the creels was 15 m. Bridles connecting the creels to the main line were 1 m length. Creel configuration is shown in Figure 3.
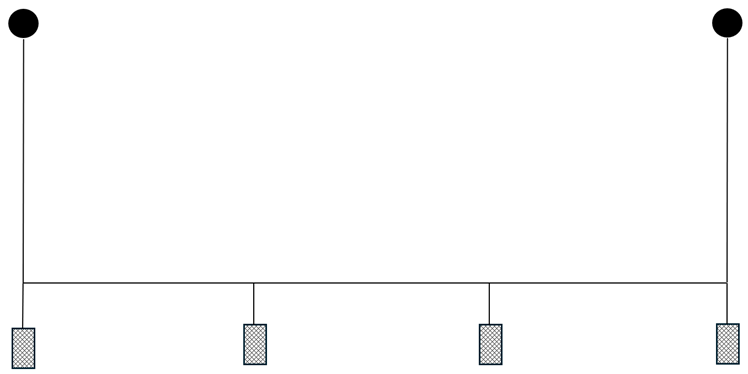
Figure 3. – Diagrammatic illustration of the 4 creel array used at Pabay.
Click for a full description
Diagram shows a surface buoy attached to a creel. This creel is attached to three further creels at intervals along a connecting line. The final creel is attached to a further surface buoy. The photograph shows the 4 creels on the gunwale of the boat before deployment.
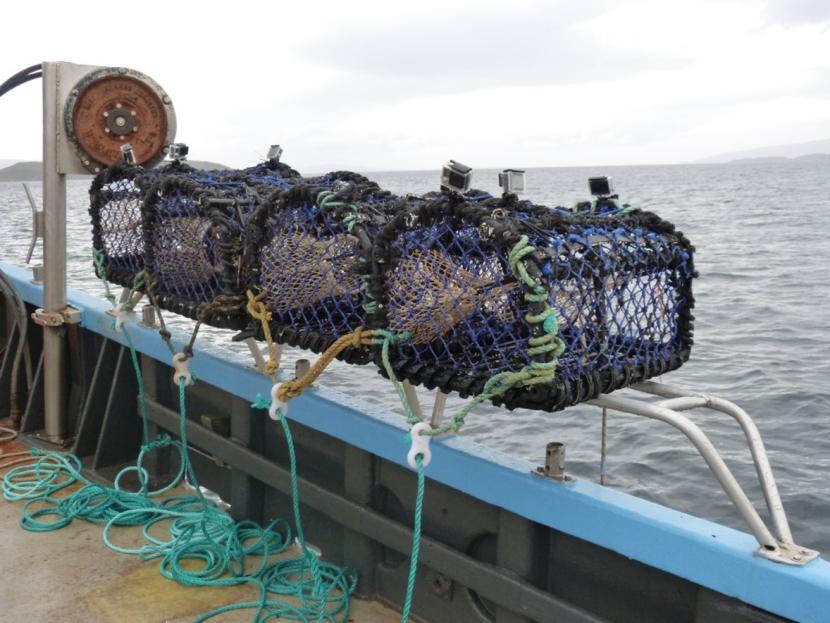
Figure 3. – photograph of the 4 creel array used at Pabay.
Click for a full description
The photograph shows the 4 creels on the gunwale of the boat before deployment.
| No. | Location | Rig | Depth | Deployment |
|---|---|---|---|---|
| 1 | Carron | 2 creel | 20 | Hand. Pick-up buoy downstream. Wind F2. Tide ~slack. |
| 2 | Carron | 2 creel | 20 | Hand. Pick-up buoy upstream. Wind F2. Tide ~slack. |
| 3 | Carron | 2 creel | 20 | Hand. Laid perpendicular to tide. Wind F2. Tide ~slack. |
| 4 | Carron | 3 creel | 12 | Hand. Pick-up buoy upstream. Wind F2. Tide ~peak flow. |
| 5 | Carron | 3 creel | 12 | Hand. Pick-up buoy downstream. Wind F2. Tide ~peak flow. |
| 6 | Carron | 3 creel | 12 | Hand. Laid perpendicular to tide. Wind F2. Tide ~peak flow. |
| 7 | Carron | 3 creel | 12 | Hand. Laid perpendicular to tide. Boat attached to buoy during recovery (simulated snag). Wind F2. Tide ~peak flow. |
| 8 | Carron | 3 creel | 18 | Hand. Laid perpendicular to tide. Wind F2. Tide ~peak flow. |
| 9 | Carron | 3 creel | 18 | Taut line (self-shot). Laid perpendicular to tide. Wind F2. Tide ~peak flow. |
| 10 | Carron | 3 creel | 18 | Taut line (self-shot). Laid perpendicular to tide. Wind F2. Tide ~peak flow. |
| 11 | Carron | 3 creel | 18 | Taut line (self-shot). Laid perpendicular to tide. Wind F2. Tide ~peak flow. |
| 12 | Carron | 3 creel | 18 | Taut line (self-shot). Laid perpendicular to tide. Boat attached to buoy during recovery (simulated snag). Wind F2. Tide ~peak flow. |
| 13 | Pabay | 4 creel | 15 | Hand. Positively buoyant rope. Wind F4 to 5. Tide ~slack. |
| 14 | Pabay | 4 creel | 15 | Hand. Positively buoyant rope. Wind F4 to 5. Tide ~slack. |
| 15 | Pabay | 4 creel | 15 | Hand. Positively buoyant rope. Wind F4 to 5. Tide ~slack. |
| 16 | Pabay | 4 creel | 15 | Hand. negatively buoyant rope. Wind F4 to 5. Tide ~slack. |
| 17 | Pabay | 4 creel | 15 | Hand. negatively buoyant rope. Wind F4 to 5. Tide ~slack. |
| 18 | Pabay | 4 creel | 15 | Hand. negatively buoyant rope. Wind F4 to 5. Tide ~slack. |
2.1.2 Estimating drag distance
The 18 deployments generated 84 sections of video footage (1 section per camera per deployment). Each video was viewed and time code noted for arrival on seabed, start and end points of any periods of dragging and point at which the creel was raised from the seabed. Time codes were tabulated with time of arrival on seabed aligned for each camera within each deployment. This was done partly to verify that observations correspond for the different cameras on a given creel (i.e. check for mistakes made when video processing). It also enabled timing of drag of proximal and distal creels to be compared (with allowance made for the fact that the arrival of the proximal creel on the seabed will have been 30 seconds to 1 minute later than that of the distal creel).
Where creel drags were observed, video clips were extracted with each clip beginning at the start of dragging and ending at the point where the creel became stationary or was raised from the seabed. For each of the video drag clips every 10th frame was extracted as a stills image.
For the forward and backward facing cameras (all deployments) the video drag stills were collated into a PowerPoint file as a series of consecutive slides. A 100 unit scale bar was placed on the initial image and orientated to reflect the apparent drag direction indicated by the shifting position of seabed features seen on successive images. The scale bar size was adjusted to approximate to 1 m (or 50 cm in some cases) distance on the seabed. These distances were estimated by visualising the viewpoint of a diver from some 30 cm above the seabed and made in reference to the estimated size of mollusc shells and algal fronds visible on the seabed. Scaling consistency was checked by verifying that the scale bar appeared to be appropriately scaled on several different images from the same video clip. Drag distance was estimated by scrolling through successive images and tracking the changing position of selected features in the field of view. The scale bar was used to estimate the distance between the apparent position of a feature at the start of a sequence of stills images and its apparent position at the end of the sequence (see Figure 4). The process was repeated for multiple sequences of stills images to give an overall estimate of dragged distance. The sequence of images were not predetermined, but rather selected on the basis of the presence of recognisable seabed features which could be used for distance estimates.
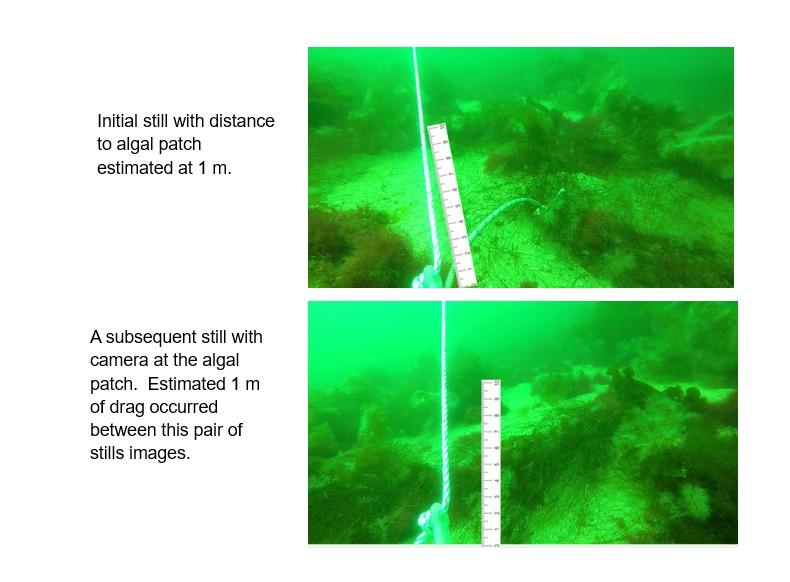
Figure 4. – Example of stills images used for estimating drag distance.
Click for a full description
Video stills of seabed with superimposed scale bar to illustrate approach taken to estimate distance the creel was dragged.
For the side facing cameras (deployments 13 to 18) the video drag stills were manually mosaiced to generate a side view of the seabed along the length of the drag. This was done by manually aligning images such that corresponding seabed features were superimposed to create a chain of overlapping images from left to right. A 100 unit scale bar was placed on the image mosaic in a horizontal orientation and was resized to approximate 1 m of seabed. The scaling was achieved by the same process as described above. Drag distance was estimated by relating the width of the image mosaic to the width of the 1 m scale bar.
Verification of consistency of drag length estimates was attempted by comparison of differences in drag length estimates from the different cameras placed on the same creel. A summary of those comparisons is in table 2. The overall conclusion is that estimates are consistent to at least 0.5 m where silt did not obscure visibility of seabed features.
| Dataset | Notes comparing camera drag estimates |
|---|---|
| Carron proximal | No drag on 6 of 12 deployments (1, 2, 4, 5, 6, 11) – comparison not applicable. Two deployments (3 and 8) – drag estimates near identical (<0.1 m difference) Two deployments (9 and 10) with longer drag on back than on front (by 0.5 and 1 m respectively) – due to front of creel tilting up and rear remaining dragging a little longer. Two deployments (7 and 12) with significantly longer drag on back than on front (by 2 – 2.5 m) – these were the simulated snag deployments where the front of the creel became suspended by the tension on the rope. |
| Carron distal | No drag on 1 deployment (2) – comparison not applicable. Four deployments (3, 5, 6 and 8) – drag estimates near identical (<0.1 m difference) Three deployments (1, 4 and 11) with small (~0.5 m) discrepancy between front and back cameras. In 2 of these cases it appeared genuine and due to the front camera rising ahead of the rear. Two deployments (9 and 10) with longer drag on back than on front (by 1 m) – due to front of creel tilting up and rear remaining dragging a little longer. Deployment 7 (simulated snag) with small (~0.5 m) discrepancy between front and back cameras. Deployment 12 (simulated snag) with significantly longer drag on back than on front (by several m) –the front of the creel became suspended by the tension on the rope and silt plume obscured rear view. |
| Pabay proximal | No drag on any of the deployments – comparison not applicable.
|
| Pabay distal | Rear facing camera footage obscured by silt in all deployments apart from deployment 13. Deployment 13 comparison of front, rear and side estimates all within 0.5 m. Remaining deployments (14 to 18) comparison of front and side camera all within 0.5 m. |
Some practical difficulties were encountered in use of the video footage to estimate drag distance. In all cases a trailing rope with graduated markings had been attached to the rear of each creel. This was done with a view to using the graduated markings to verify the size of the scale bar when processing the video. This was used effectively in some instances but on many occasions the trailing line became entangled with the creel during deployment and did not trail behind the creel during dragging as had been envisaged. Another issue with the backward facing cameras was that the silt plume trailing behind the dragging creel obscured both the trailing line and seabed features. In some cases, it was impossible to estimate distance because seabed features were entirely obscured for much of the drag period. This was a particular issue for the Pabay 2024 deployments, presumably due to the nature of the seabed sediment and the rapidity of the drags in the strong wind. It should also be noted that some differences in drag estimates from front and rear cameras are to be expected. The majority of drags occurred as creels were hauled by the boat. During this process the creel tilts with the front of the creel lifting from the seabed while the rear of the creel may remain in contact with the seabed for a short time longer. On three occasions at Pabay a camera captured no useful footage because it was displaced to tilt upward during the process of throwing the creel from the boat. This was of no consequence because drag length could be estimated from the other two cameras on the creel.
2.2 Experimental creel dragging on Limaria beds
Experimental creel drags were conducted in Loch Carron in 2021 and in Loch Sligachan in 2024. Methods are described separately for each location. Site coordinates are presented in Annex 1, Table 1.2.
2.2.1 Experimental creel drags at Loch Carron
Experimental creel drags were conducted at 3 locations within Loch Carron in 2021. It was intended that each would be on Limaria beds of differing characteristics. This was effective at site 1 and site 3 but site 2 was mistakenly located on an area with pebbles and red algal cover that resembled a Limaria bed based on remote video footage. The absence of Limaria did not become apparent until the site was set up. The attempt was not abandoned because it was thought useful as a means of assessing the level of visible seabed disturbance although of course it cannot be used to assess impact on Limaria. There was not time to locate an alternative site to replace site 2. Site 1 was characterised by high coverage (60-70%) of Limaria nest material with dense coverage of red algae. Site 3 had lower coverage of Limaria nest material (30-40%) and relatively sparse red algae. Another key difference was that the site 1 bed was ‘low relief’ with nest areas barely raised above the surrounding sediment. In contrast, the site 3 bed was ‘high relief’ with the nests forming distinct raised structures a few centimetres (roughly 3 to 6 cm) above the intervening sand patches and distinct miniature ‘cliffs’ of nest material at the boundaries between nest and sand (Figure 5).
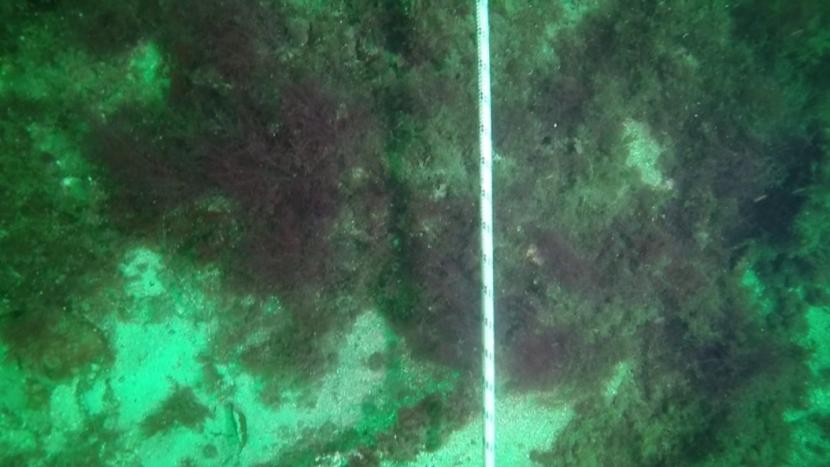
Figure 5. – Example images illustrating the characteristics of the three Loch Carron experimental sites. Site 1 – 60-70% low relief Limaria nest mosaic with dense cover of red algae.
Click for a full description
Video stills of seabed showing the contrasting characteristics of the three Loch Carron experimental sites.
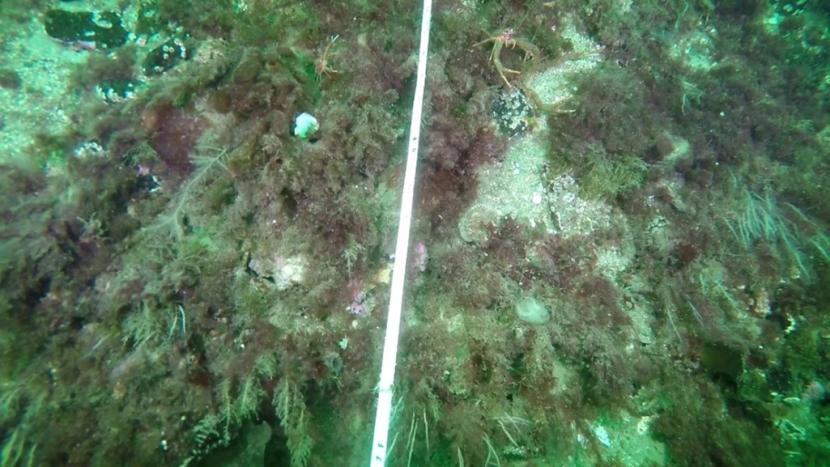
Figure 5. – Example images illustrating the characteristics of the three Loch Carron experimental sites. Site 2 – 40-50% pebble patches with dense cover of red algae.
Click for a full description
Video stills of seabed showing the contrasting characteristics of the three Loch Carron experimental sites.
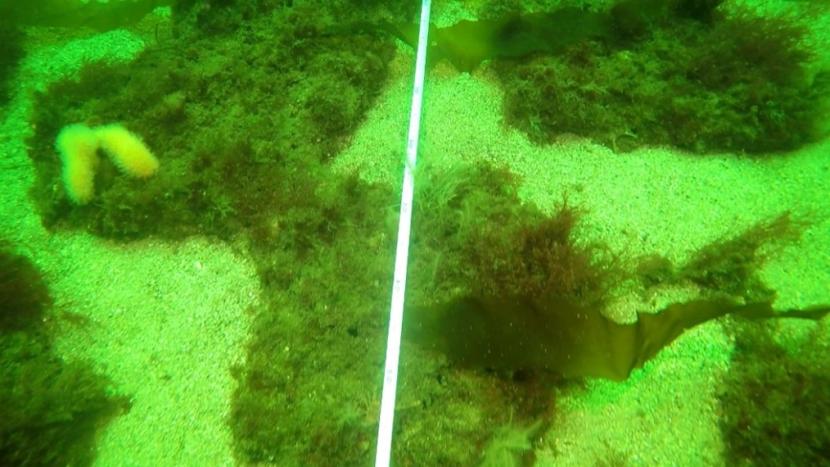
Figure 5. – Example images illustrating the characteristics of the three Loch Carron experimental sites. Site 3 – 30-40% high relief Limaria nest mosaic with sparse cover of red algae
Click for a full description
Video stills of seabed showing the contrasting characteristics of the three Loch Carron experimental sites.
The experimental plots were laid out in the configuration shown in Figure 6. A central point was marked with a tripod of road pins embedded in the sediment. This acted as a stable structure for a diver to brace themselves while hand hauling a creel. Four perpendicular radials were laid out from the centre point. Each radial was marked with a road pin 1 m away from the centre point and a further road pin 3 m beyond the first. The furthest road pin served to mark the start of the creel drag and the nearest road pin to mark the end point.
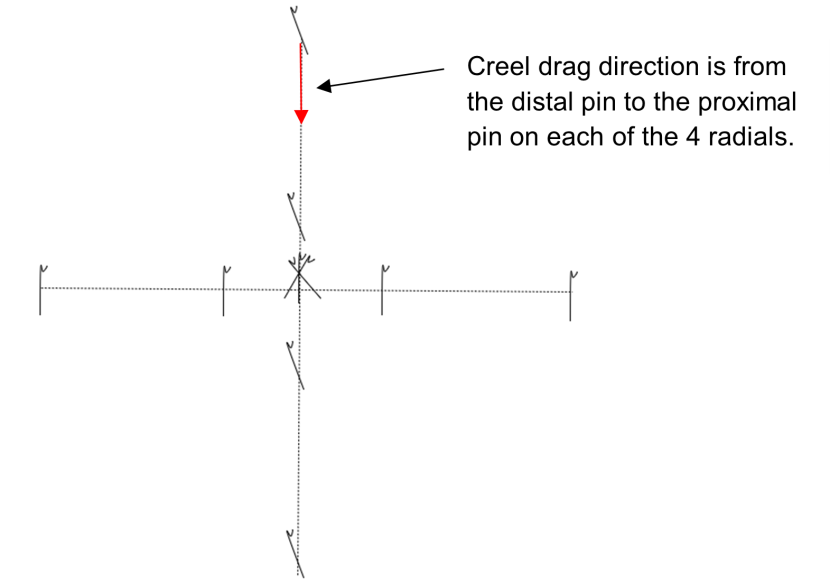
Figure 6. – Diagram illustrating the configuration of the experimental creel drag plots in Loch Carron.
Click for a full description
Diagram showing marker pegs arranged on 4 perpendicular radials around a central tripod of pegs.
Each of the 4 prospective creel drag tracks was videoed with a GoPro camera before the diver hauled the creel along the line from start to end road pin markers. After dragging the creels, visibility was allowed to clear for a few minutes before a second video was taken along each of the 4 tracks.
Two approaches were taken to assessing the video. Firstly, video was reviewed for each track and estimates made of Limaria nest cover (%), red algal cover (%), approximate area of visibly disrupted nest material (cm2) and counts were made of Limaria individuals exposed at the surface of the seabed from before and after videos. With this approach each of the 4 tracks are taken as replicates to allow comparison between pretreatment and post treatment condition within each site and between the 3 sites.
The second approach involved extracting 4 screen grabs from each track from each of the before/after videos. The screen grabs were haphazardly selected with the proviso that they were non-overlapping, adequately in-focus and not obscured by kelp fronds. For each screen grab, estimates were made of Limaria nest cover (%), sediment / pebbles overlying nest material (%), approximate area of visibly disrupted nest material (%) and counts were made of Limaria exposed at the surface of the seabed. Data derived from each set of 4 screen grabs were averaged to give a value for each track and those track values used as replicates to allow comparison between pretreatment and post treatment condition within each site and between the 3 sites.
2.2.2 Experimental creel drags at Loch Sligachan
Experimental creel drags were conducted at one Limaria bed location in Loch Sligachan in August 2024. The survey plan had intended to establish replicate experimental plots at each of at least two sites with each selected to represent Limaria beds of differing topography. Adverse weather and limited diver availability restricted the working time to a single day so the scope of the experimental work was severely constrained. The site was characterised by high coverage (~80%) of low relief (<3 cm) Limaria nest with dense coverage of red algae (Figure 7).
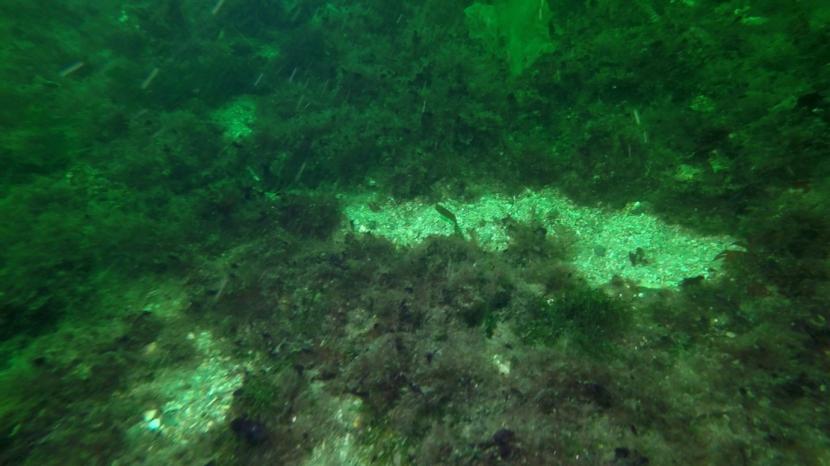
Figure 7. – Image illustrating the characteristics of the Loch Sligachan experimental site.
Click for a full description
Video still of seabed showing the characteristics of the Loch Sligachan experimental site.
The experimental plot was laid out in the configuration shown in Figure 8. A central point was marked with a tripod of road pins embedded in the sediment. This acted as a stable structure for a diver to brace themselves while hand hauling a creel. Three approximately equally spaced radials were laid out from the centre point. Each radial was marked with a road pin 1 m away from the centre point and a further road pin 3 m beyond the first. The furthest road pin served to mark the start of the creel drag and the nearest road pin to mark the end point.
Each of the three prospective drag tracks were assessed prior to the drag disturbance. Four replicate quadrats (0.1 m2) were placed haphazardly along each track. Within each quadrat a diver estimated % cover of Limaria nest, % of Limaria nest overlain by displaced substrate, % area of visibly disrupted Limaria nest and a count was made of Limaria individuals exposed on the sediment surface. The quadrats were also photographed for QA purposes and the drag track was videoed with a GoPro camera.
One radial was allowed to remain undisturbed, the second radial was subjected to a single drag of the creel along the track and the third was subject to multiple (five) drags of the creel along the same track. After a brief delay to allow visibility to clear the post disturbance assessment of the tracks was conducted. This involved a repeat of the pre disturbance quadrat counts, photography and video. Additionally, nest material was collected from 4 replicate quadrats from each track and placed in a lidded bucket for recovery to the surface. At the surface, the nest material from each replicate was carefully picked through and living Limaria removed. The Limaria were counted and each individual was measured to the nearest millimetre (maximum dorsoventral size) with digital vernier calipers and subsequently released.
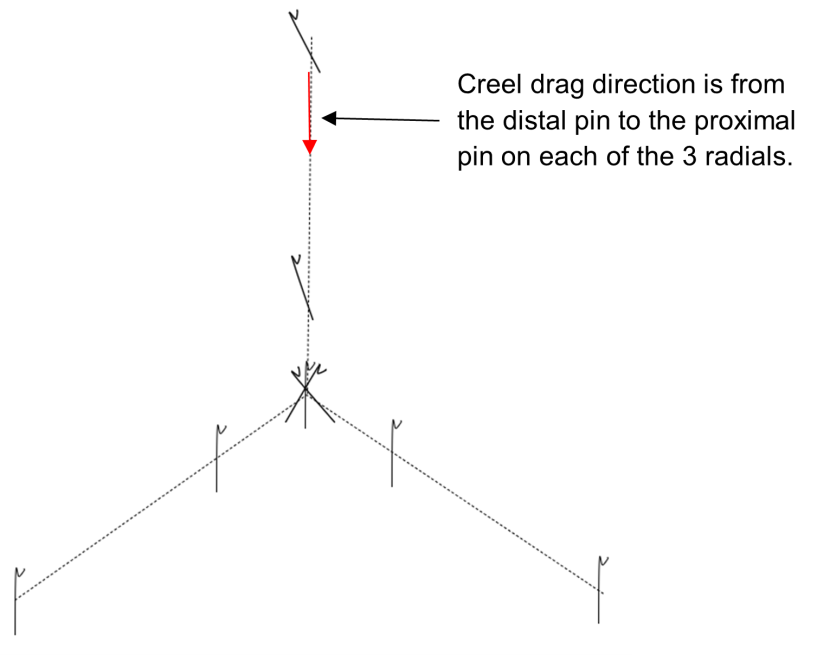
Figure 8. – Diagram illustrating the configuration of the experimental creel drag plots in Loch Sligachan.
Click for a full description
Diagram showing marker pegs arranged on 3 radials around a central tripod of pegs.
Quadrat data were compared between treatments and between pre and post disturbance samples. Quadrat clearance data were compared between treatments using the measures of total abundance and mean size. Comparisons were also made with the Loch Carron data where possible.
2.3 Data assessment
The available data were used to test a number of comparisons which are outlined in the Results section below. In the majority of cases where two data groups are compared a Mann-Whitney U test was applied using IBM SPSS Statistics for Windows. In one case (creel rope buoyancy) a t-test was applied after running Shapiro-Wilk test for normality and Levene's test of equality of variances. This was necessary due to limited sample replication in this case. Where three or more data groups are compared a Concordance test (Alcaraz et al. 2022) was applied and this was followed by Dunn's tests with Bonferroni correction if appropriate. The Loch Sligachan and Loch Carron creel drag experiments had a 2-way design and the nest cover data were assessed by Aligned Rank Transform ANOVA (Wobbrock et al. 2011). These remaining tests were applied with R and P<0.05 was regarded as significant in all cases.
3. Results
3.1 Creel dragging
3.1.1 Drag observed during creel deployment
None of the deployments indicated any evidence of significant creel drag on arrival on the seabed. The proximal creel of deployment 11 (deployed with taut line) showed a minor (<20 cm) shift as it settled on the seabed. The distal creel of this deployment and both creels of all other deployments settled on the seabed without any drag occurring during deployment.
It was anticipated that for creels deployed by hand there would be no obvious mechanism that might cause dragging during the deployment phase. However, it is common practice to self-shoot creels where each subsequent creel is pulled off the back of the boat by the taut line between it and the previously deployed creel. It was thought possible that this process had potential to cause some dragging of creels as they land on the seabed. No evidence of this was detected. Four self-shot deployments were made (deployments 9 to 12). Only one of the 8 creels in this dataset showed any movement on the seabed and the extent of that movement was negligible (<20 cm).
3.1.2 Drag observed during creel recovery
Overall estimated drag lengths of proximal and distal creels for the 18 deployments are shown in Table 3. Creel drags 1 to 12 were conducted in Loch Carron, drags 13 to 18 were conducted at Pabay.
| No. | Rig | Depth | Deployment | Proximal drag (m) | Distal drag (m) |
|---|---|---|---|---|---|
| 1 | 2 creel | 20 | Hand. Pick-up buoy downstream. | 0 | 4 |
| 2 | 2 creel | 20 | Hand. Pick-up buoy upstream. | 0 | 0 |
| 3 | 2 creel | 20 | Hand. Laid perpendicular to tide. | 2 | 3 |
| 4 | 3 creel | 12 | Hand. Pick-up buoy upstream. | 0 | 2 |
| 5 | 3 creel | 12 | Hand. Pick-up buoy downstream. | 0 | 2 |
| 6 | 3 creel | 12 | Hand. Laid perpendicular to tide. | 0 | 0.5 |
| 7 | 3 creel | 12 | Hand. Laid perpendicular to tide. Snagged. | 4 | 4.5 |
| 8 | 3 creel | 18 | Hand. Laid perpendicular to tide. | 0.5 | 0.5 |
| 9 | 3 creel | 18 | Taut line. Laid perpendicular to tide. | 1.5 | 1 |
| 10 | 3 creel | 18 | Taut line. Laid perpendicular to tide. | 2 | 2.5 |
| 11 | 3 creel | 18 | Taut line. Laid perpendicular to tide. | 0 | 1 |
| 12 | 3 creel | 18 | Taut line. Laid perpendicular to tide. Snagged. | 3 | 20 |
| 13 | 4 creel | 15 | Hand. Positively buoyant rope. | 0 | 6 |
| 14 | 4 creel | 15 | Hand. Positively buoyant rope. | 0 | 6.5 |
| 15 | 4 creel | 15 | Hand. Positively buoyant rope. | 0 | 6.3 |
| 16 | 4 creel | 15 | Hand. negatively buoyant rope. | 0 | 3 |
| 17 | 4 creel | 15 | Hand. negatively buoyant rope. | 0 | 4.5 |
| 18 | 4 creel | 15 | Hand. negatively buoyant rope. | 0 | 6.5 |
The two deployments where a snag was simulated (deployments 7 and 12) are a special case and will be examined separately. These deployments were intended to replicate the situation where an entanglement on the deck of the boat during deployment or recovery might result in the drifting boat dragging the string of creels along the seabed. This occurs rarely in practice (pers. obs.) and is unlikely to reflect the normal pattern of dragging seen while creeling. The data from these two deployments are not included in the numeric results presented below.
Attempts are made below to draw conclusions from the remaining 16 deployments. It should be noted that there are many factors with potential to influence the extent of creel dragging and testing the role of any one factor would require keeping all other factors constant while running replicate deployments differing only in terms of the factor of interest. This would require a very large number of deployments, and the current dataset does not allow for a fully robust assessment of the influence of the various factors although it can be regarded as indicative.
3.1.2.1 Comparison of drag length of proximal and distal creels
One clear pattern of difference can be seen between dragging extent of proximal and distal creels during recovery. On most occasions the proximal creel is pulled directly upward from the seabed as the pickup buoy is lifted and hauled from the surface. Sometimes the creel visibly twists as it lifts which may cause some additional disturbance to the benthos but this is negligible in extent being only marginally beyond the actual area covered by the creel base. The distal creels are more prone to dragging as the creel string is hauled onto the boat with the extent of the drag depending on the circumstances of the recovery.
Of the 16 deployments which did not feature a deliberate snag there were only 4 (25%) where the proximal creel dragged to some degree and 15 (~94%) where the distal creel dragged upon recovery. The average drag length for proximal and distal creels are shown in Figure 9. They are presented respectively for all deployments, Loch Carron deployments only and Pabay deployments only. For all three comparisons, the average drag lengths for the distal creels are significantly greater than those for the proximal creels (Mann-Whitney, P<0.05).
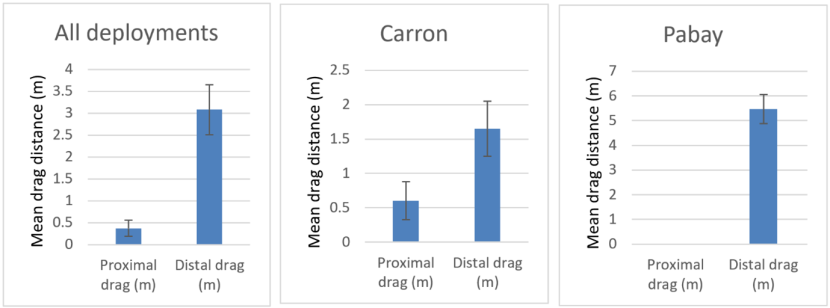
Figure 9. – Comparison of mean drag lengths during recovery of proximal and distal creels. Shown separately for all deployments, Loch Carron only and Pabay only. Error bars denote standard error of the mean.
Click for a full description
Three bar graphs are presented. The first includes all experimental creel deployments, the second includes only the Carron deployments and the third shows the Pabay deployments. All illustrate a greater mean drag distance upon recovery in the distal creel relative to the proximal creel.
It is possible that as the first creel is raised the remaining creels on the string sometimes act as an anchor on the seabed minimising the likelihood of drag. As successive creels are raised, those remaining on the seabed are likely to be more prone to drag as the anchorage effect is reduced.
3.1.2.2 Assessment of drag length in relation to creel orientation to prevailing boat drift
The propensity of the proximal creel to dragging during recovery also appears to be altered depending on the orientation of the creel string in relation to the likely direction of boat drift. At Pabay there was a stiff breeze and all six deployments were aligned with the wind direction on the day. Drag length of the proximal creel was zero in all cases. At Loch Carron the winds were light but the site was moderately tide-swept. Four deployments (deployments 1, 2, 4 and 5) were aligned with the tidal flow and the drag of the proximal creel was zero in all cases. Also at Loch Carron there were 6 deployments where the creel string was perpendicular to the tidal flow. Some drag of the proximal creel was evident in 4 of the 6 deployments. Drag length was limited, ranging from 0.5 m to 2 m with an average of 1 m.
The reason for the lack of proximal creel drag during recovery with aligned deployments is not obvious. Of the Loch Carron sites where creels were aligned to the tidal flow, two had the pickup buoy downstream and the other two had the pickup buoy upstream. For those with the buoy downstream it is possible the remaining creels could have the anchorage effect preventing drag of the proximal creel, but where the pickup was upstream there is no obvious reason why it should be any less likely that drag would occur than is the case for creels arranged perpendicular to the tide. In both cases the remaining creels cannot act as an anchor. It should be noted that there are rather too few replicate deployments made under identical conditions so it would be incautious to generalise the observations too broadly.
The influence of drag distance in relation to creel orientation can also be considered for the distal creel. The Pabay deployments should not be included in this because drag length was longer in all cases than in Loch Carron and this was certainly attributable to wind conditions. At Loch Carron drag distances are compared for the distal creel in Figure 10. There is no significant difference in drag length in relation to orientation of the creel line (Mann-Whitney, P>0.05). It is unlikely that tidal flow is a significant factor in these observations. Of the aligned creels, two were deployed at slack water and two deployed at peak flow. Of the perpendicular creels, one was deployed at slack water and five deployed at peak flow. So, there is no clear relationship between drag distance and current strength.
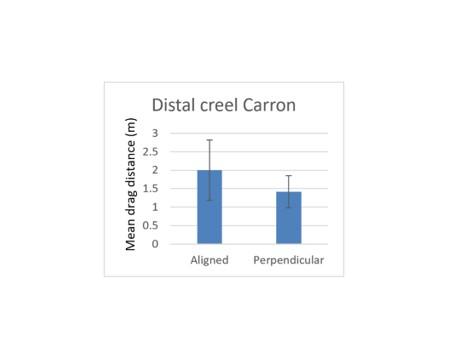
Figure 10. – Comparison of mean drag lengths during recovery of distal creels in arrays arranged in alignment with and perpendicular to the direction of boat drift at Loch Carron. Error bars denote standard error of the mean.
Click for a full description
The bar graph shows mean drag distance during recovery of the distal creel for deployments where the creel array was aligned with the direction of boat drift in comparison to the mean drag distance of the distal creel for deployments where the creel array was perpendicular to the direction of boat drift.
3.1.2.3 Assessment of drag length in relation to the number of creels on the array
The number of creels on the line are a potential factor influencing the level of dragging. Intuitively, this is more likely to create a difference for the proximal creel because a larger number of creels on the line are more likely to act as an anchor and reduce drag when recovering the creels. It is unlikely that the distal creel will differ because any additional creels will already be clear of the seabed at the point when tension comes on the line to the distal creel.
When drag distances for the proximal creels are compared between set ups with different numbers of creels (Figure 11) there is no significant difference (Concordance test P>0.05). For the distal creels there is a significant difference (Concordance test P<0.05), but the difference is only between the 4 creel set up used in Pabay and the 3 creel array used in Loch Carron (Dunn's test with Bonferroni correction). This was assuredly due to the wind strength at Pabay and is unrelated to the number of creels deployed.
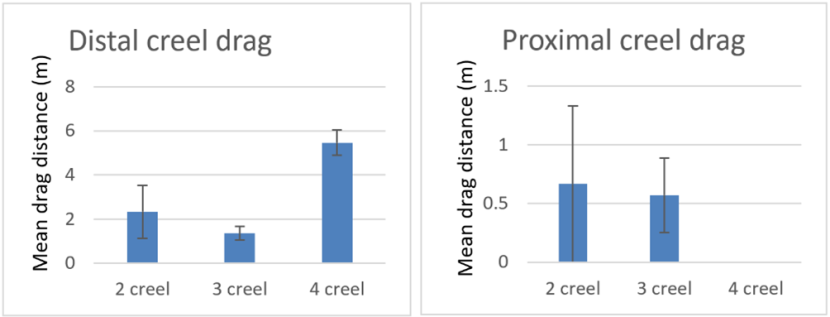
Figure 11. – Comparison of mean drag lengths during recovery of proximal and distal creels in arrays composed of different numbers of creels (includes 16 deployments, the 2 ‘snagged’ deployments are excluded). Error bars denote standard error of the mean
Click for a full description
Two bar graphs are presented. The first shows mean drag length of the creel distal to the pick-up buoy and the second shows mean drag length of the creel proximal to the pick-up buoy. Each graph shows drag lengths for a 2-creel, 3-creel and a 4-creel array.
3.1.2.4 Assessment of drag length in relation to water depth
Water depth is a potential factor which may influence creel dragging during recovery. The range of depths covered in the deployment trials are rather narrow (12 to 20 m water depth) and may not be sufficiently different to result in any observable difference in drag extent.
Drag lengths for the proximal creels are not significantly different for deployments made in the 4 different water depths (Concordance test P>0.05). The drag lengths of the distal creels do show a significant difference (Concordance test P<0.05), but this is entirely due to the Pabay deployments made in 15 m depth with a strong wind (Dunn's test with Bonferroni correction). With the Pabay deployments excluded there is no significant difference seen between drag extent during recovery at the 3 different water depths in Loch Carron (Figure 12).
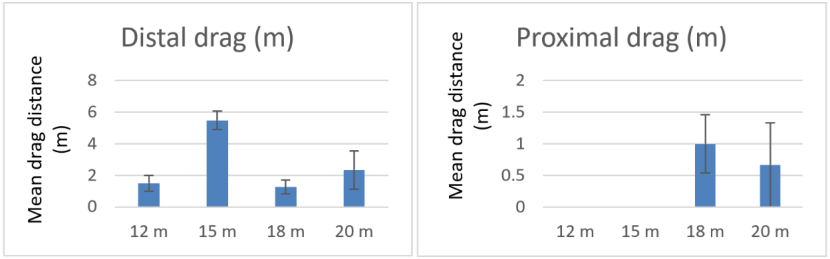
Figure 12. – Comparison of mean drag lengths during recovery of proximal and distal creels in arrays deployed in different water depths. Error bars denote standard error of the mean.
Click for a full description
Two bar graphs are presented. The first shows mean drag length during recovery of the creel distal to the pick-up buoy and the second shows mean drag length during recovery of the creel proximal to the pick-up buoy. Each graph shows drag lengths for 12 m, 15 m, 18 m and 20 m water depths.
3.1.2.5 Assessment of the influence of boat drift on creel dragging
There is significant potential for increased creel dragging during recovery in situations where the surface boat is drifting under the influence of wind or tidal currents. The deployments in Loch Carron were made at moderately tideswept locations on a day with low windspeed (~F2). Although some deployments were made at slack water and others during peak flow there is no clear pattern of differences in drag related to tidal flow. As previously noted, the conditions at Pabay were distinctly different in that there was a considerably stronger wind (F 4 to 5) than was the case in Loch Carron.
The effect of wind strength during recovery was evident in the extent of dragging of the distal creel. In Loch Carron, drag of the distal creel averaged under 2 m whereas at Pabay the average drag length exceeded 5 m (Figure 13). This difference is statistically significant (Mann-Whitney, P<0.05). It should be noted that drag extent is certain to vary considerably depending on the weight of the creel rig, size and windage of the boat and also the strength of prevailing current / wind.
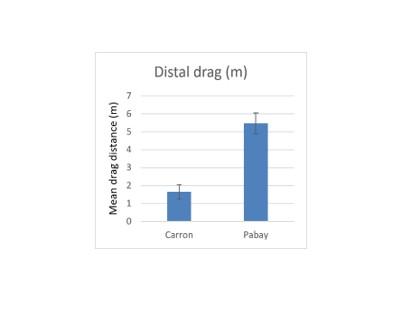
Figure 13. – Comparison of mean drag lengths during recovery of distal creels in arrays deployed at Loch Carron (low wind speed) and Pabay (high wind speed). Error bars denote standard error of the mean.
Click for a full description
The bar graph shows mean drag distance during recovery of the distal creel for deployments at Loch Carron where wind speed was low in comparison to the mean drag distance of the distal creel for deployments at Pabay where wind speed was high.
3.1.2.6 Assessment of the influence of rope buoyancy
The deployments at Pabay (Figure 14) were intended to directly test for an effect on dragging due to the buoyancy of rope used (positively or negatively buoyant). Positively buoyant rope is the normal choice because it costs less. However, negatively buoyant rope is being promoted to reduce entanglement hazard for marine mammals and reduce the risk of passive drag of creels by water movement. It is possible that the extent of creel dragging could be modified by the rope buoyancy.
There was no significant difference in drag extent during recovery between rope types (t test, P>0.05). However, the footage showed the negatively buoyant rope dragging over the seabed, so although the drag length of the creels may be unaffected by the use of this rope, the overall area of seabed subject to some level of disturbance will be significantly increased. It should be noted that this disturbance is likely to have a light impact and may be inconsequential on most types of seabed.
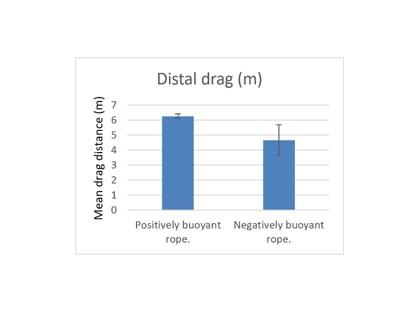
Figure 14. – Comparison of mean drag lengths during recovery of distal creels deployed at Pabay with rope of positive versus negative buoyancy. Error bars denote standard error of the mean.
Click for a full description
The bar graph shows mean drag distance during recovery of the distal creel for deployments using a creel array rigged with positively buoyant rope in comparison to the mean drag distance of the distal creel for deployments using a creel array rigged with negatively buoyant rope.
3.1.2.7 Assessment of how drag is influenced by snagging at the surface
In normal circumstances a line of creels will be recovered by more or less continuous hauling by the boat. However, it may sometimes be necessary to halt the hauling part way through the process. This may occur due to an entanglement with the pot hauler, the need to remove kelp caught on the gear or due to the need to remove catch from the creels as they arrive on the deck of the boat. Normally the pause in hauling will be brief but could be prolonged in certain circumstances. We simulated this on two deployments (deployments 7 and 12) by attaching the boat to the pickup buoy and allowing it to remain attached for several minutes with the engine in neutral before the creels were hauled to the surface.
In deployment 7 both the proximal and distal creels dragged for about 4 m along the seabed. This is greater than the drag lengths observed for ‘normal’ deployments in Loch Carron, but the difference is not substantial. Deployment 1 (without a simulated snag) recorded a similar drag length of 4 m on the distal creel although all other deployments were of more limited drag lengths.
The footage indicates that the proximal creel began dragging first with the distal creel starting to drag a short while later (presumably once the intervening line became taut). Once the distal creel was dragging the front of the proximal creel became raised above the seabed although the rear of the creel continued dragging for a time. Eventually, the distal creel stopped dragging and the proximal creel was entirely suspended above the seabed. The footage from the rear camera of the proximal creel shows it was stationary for much of the time while suspended.
The interpretation is that the boat drift caused initial drag of the proximal creel as tension came on the line. For a period of time the entire creel string was dragged on the seabed but then the more distal creels became snagged and began acting as an anchor and dragging ceased. Due to the tension on the line the proximal creel became suspended above the seabed but remained more or less stationary for the remainder of the time.
In deployment 12 the drag length was considerably greater being of the order of 20 m for the distal creel. Drag length for the proximal creel was considerably less (~3 m) because it became suspended when the line became tensioned and the distal creel dragged.
The pattern of movement was broadly similar to that observed for deployment 7. Dragging of the proximal creel began first followed by dragging of the distal creel once intervening lines became taut. Soon after the distal creel began dragging the taut line caused the proximal creel to become suspended above the seabed and it remained suspended until the creels were hauled up to the boat. Unlike deployment 7, it appears that dragging of the distal creel continued throughout and it did not become anchored. It only ceased dragging briefly during the period that creels were hauled up to the boat.
The increased drag length and lack of an ‘anchoring’ effect in deployment 12 is likely to be due to increased drift on the boat. The video footage indicates a considerably stronger tidal current running for deployment 12 than for deployment 7. It is clear that the ‘surface snag’ scenario will result in increased creel drag. However, the consequences of this will depend on the level of boat drift in different current speed or different wind speed. The type of boat will also be a factor with heavier boats or those with greater windage more likely to cause a sustained drag. The number and weight of creels deployed is also likely to be an important factor. A greater number of creels or heavier creels are more likely to act as an anchor halting the drift of the boat and preventing further drag.
3.2 Experimental creel dragging on Limaria
3.2.1 Experimental creel drags at Loch Carron
An initial comparison was made between the three sites based on pre-treatment values of Limaria nest and red algal cover (Figure 15). Limaria was apparently absent from site 2 but present at the remaining 2 sites. Estimates of percentage cover of nest material and red algal cover indicate both to be significantly greater at site 1 than at site 3 (ART ANOVA P<0.05 for ‘site’). It was also apparent that the algal coverage differed in terms of the proportion of nest material covered. At site 1 the nest material was entirely covered by algae whereas at site 3 about 40% of the nest material was relatively free of algae. No Limaria were visible on the sediment surface and no obvious substrate disruption was apparent prior to drag disturbance at any site.
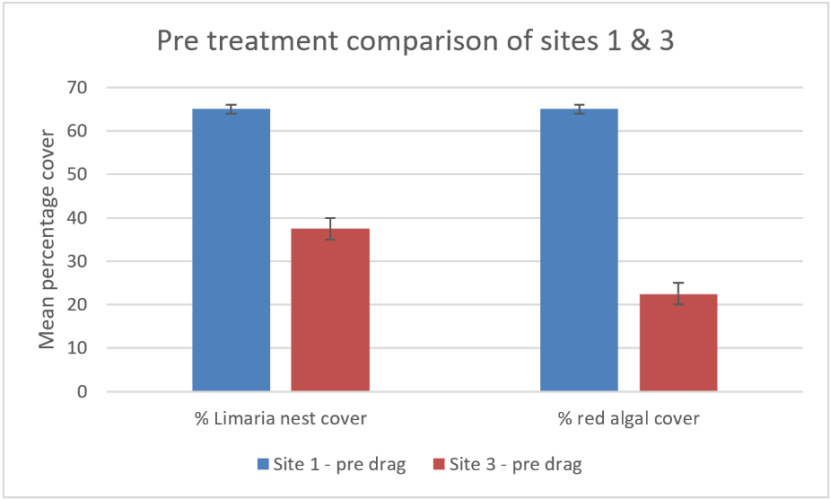
Figure 15. – Comparison of Carron sites 1 and 3 in terms of pre disturbance mean percentage cover of Limaria nest material and red algal turf. Error bars denote standard error of the mean.
Click for a full description
The bar graph shows percentage cover of Limaria nest and percentage cover of red algae at two experimental sites in Loch Carron prior to experimental creel dragging by divers. Site 1 is denoted by blue columns and site 3 is denoted by red columns.
A comparison of post treatment cover of Limaria nest material (Figure 16) and red algal coverage with pre-treatment levels showed no significant difference (ART ANOVA P>0.05 for ‘time’). It should be noted however, that because of the cryptic nature of the habitat the level of discrimination possible from such video estimates is limited.
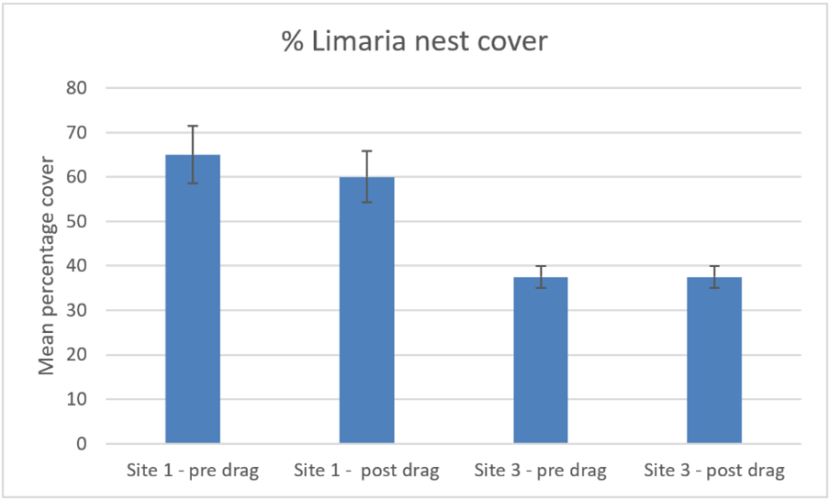
Figure 16. – Comparison of pre and post disturbance levels of mean percentage cover of Limaria nest at Carron sites 1 and 3. Error bars denote standard error of the mean.
Click for a full description
The bar graph shows percentage cover of Limaria nest before and after experimental creel dragging by divers at two experimental sites in Loch Carron. The first pair of columns shows pre and post drag data for experimental site 1 and the second pair of columns shows the corresponding data for experimental site 3.
Displaced Limaria were seen to be present on the surface following drag disturbance at both site 1 and site 3 (Figure 17). The number of these exposed Limaria was significantly (Mann-Whitney, P<0.05) greater at site 3 than at site 1. This is notable with respect to the apparently lower coverage of nest material at site 3 and it may be related to the visibly higher surface relief of the bed at site 3 compared to site 1 (estimated 3-6 cm compared to <3 cm); the lower nest coverage and higher relief of the nests presumably creates more edges where creels could catch, whilst on a more continuous bed, creels might be expected to skate over the surface, causing less damage. It should also be noted that predation on the exposed Limaria was immediately apparent. This was particularly notable at site 3 where predation by Munida sp. was seen on 2 of the 4 transects and predation by Inachus sp. on another.
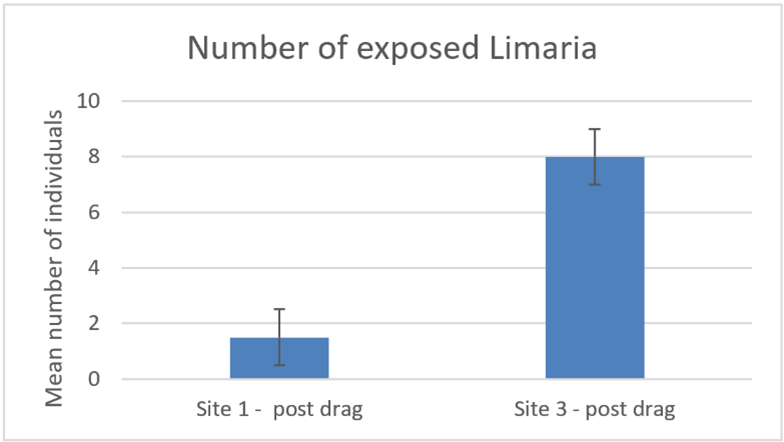
Figure 17. – Comparison of post disturbance mean numbers of Limaria exposed on the surface of the seabed at Carron sites 1 and 3. Error bars denote standard error of the mean.
Click for a full description
The bar graph shows mean number of Limaria exposed on the surface of the seabed after an experimental creel drag by divers at two experimental sites in Loch Carron. The first column shows the data from experimental site 1 and the second column shows the data from experimental site 3.
The quantity of visibly disrupted or overturned substrate (including nest material) was compared between all 3 sites (Figure 18). There was no significant difference between any of the sites (Concordance test P>0.05). Estimates showed considerable variation between groups of replicates and confidence in distinguishing between disturbed and undisturbed substrate was low. It should also be noted that visibly disrupted substrate constituted a very small percentage of the dragged area. Estimates of disrupted substrate range from zero to 3.3% of the dragged area and in 9 out of the 12 replicates the estimates were below 1%.
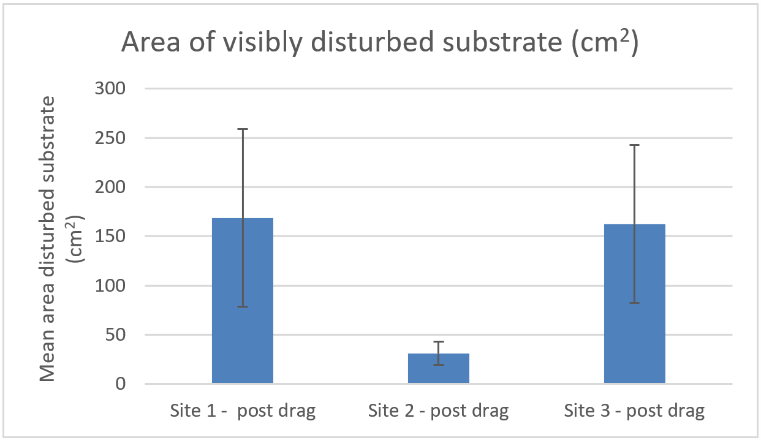
Figure 18. – Comparison of post disturbance mean area (cm2) of substrate visibly disturbed at Carron sites 1, 2 and 3. Error bars denote standard error of the mean.
Click for a full description
The bar graph shows the mean area of substrate (cm2) visibly disturbed after an experimental creel drag by divers at three experimental sites in Loch Carron. The first column shows the data from experimental site 1 and the second column is experimental site 2 and the third is experimental site 3.
The second approach of estimates made from video stills was partly conducted to facilitate comparison with the related experiment conducted in 2024 in Loch Sligachan. However, it also serves to validate the conclusions reached from the review of the entire video sequence.
In terms of percentage cover of Limaria nest material the outcomes are consistent between the two analysis methods. Site 1 had significantly higher cover of nest material than site 3 (Mann-Whitney, P<0.05) and cover of nest material did not differ between pre-treatment and post-treatment records at either site (Mann-Whitney, P>0.05).
Displaced Limaria on the sediment surface also show a consistent trend. At both sites no Limaria were exposed pre-treatment but several were present post-treatment. The number of exposed Limaria were significantly higher at site 3 (Mann-Whitney, P<0.05).
The values for the amount of displaced substrate are also consistent. At both sites no displaced substrate was noted pre-treatment but a small amount was present post-treatment. The amount of displaced substrate was not significantly different between site 1 and 3 (Mann-Whitney, P>0.05) and the overall amount was very low (less than 2% in all cases).
An additional measure was made from the video stills. This consisted of estimates of the amount of sand, gravel, pebbles or shell fragments overlying the Limaria nest material (Figure 19). Confidence in the precision of these estimates is limited. However, significantly more overlying material is present post-treatment than pre-treatment at each of the two sites (Mann-Whitney, P<0.05). Additionally, significantly more overlying material was recorded at the site 1 post-treatment replicates as compared to corresponding replicates from site 3 (Mann-Whitney, P<0.05). The amount of such material was limited in all cases (barely above 4% at most) and is thought unlikely to have a detectable biological impact.
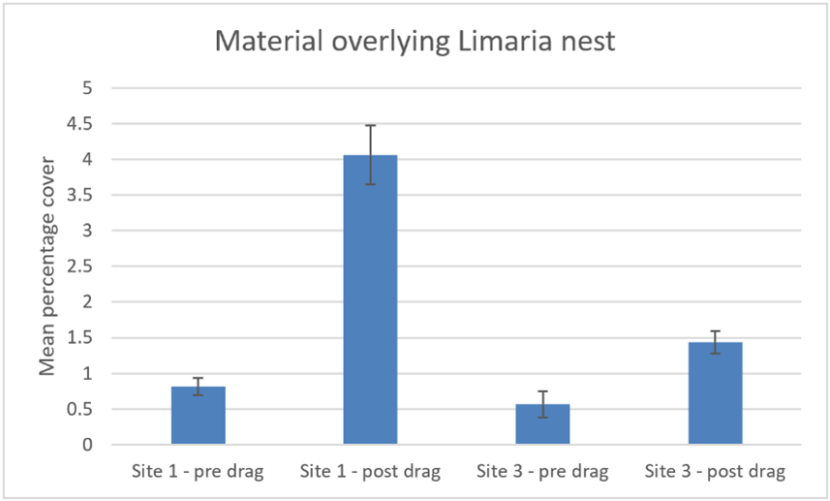
Figure 19. – Comparison of pre and post disturbance levels of mean percentage cover of sediment fragments overlying Limaria nest at Carron sites 1 and 3. Error bars denote standard error of the mean.
Click for a full description
The bar graph shows mean percentage cover of sediment fragments overlying Limaria nest before and after experimental creel dragging by divers at two experimental sites in Loch Carron. The first pair of columns shows pre and post drag data for experimental site 1 and the second pair of columns shows the corresponding data for experimental site 3.
3.2.2 Experimental creel drags at Loch Sligachan
The percentage cover of Limaria nest material (Figure 20) showed no significant difference between the control, single drag and multiple drag treatments or between pre and post disturbance data (ART ANOVA P>0.05) from Loch Sligachan. This result is consistent with corresponding data from Loch Carron.
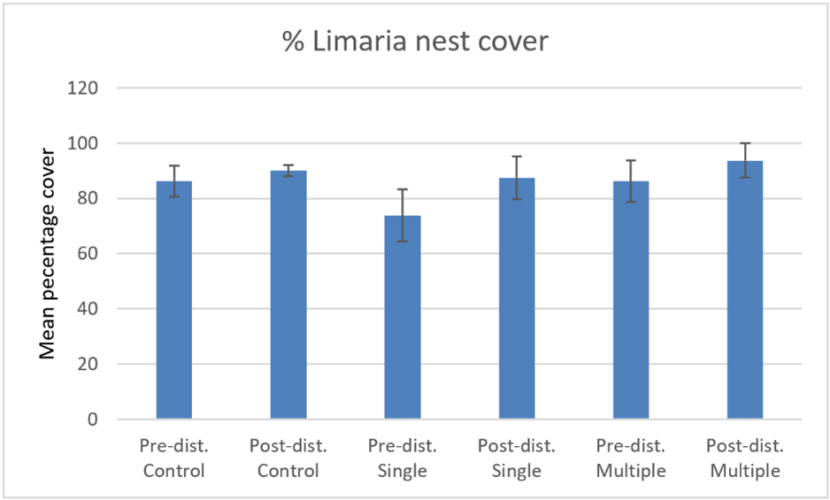
Figure 20. – Comparison of pre and post disturbance levels of mean percentage cover of Limaria nest on the control, single drag and multiple drag treatments at Loch Sligachan. Error bars denote standard error of the mean.
Click for a full description
The bar graph shows mean percentage cover of Limaria nest before and after experimental creel dragging by divers at the experimental site in Loch Sligachan. The first pair of columns shows pre and post drag data for the control treatment, the second pair of columns shows the corresponding data for the single drag treatment and the final pair of columns shows the corresponding data for the multiple drag treatment.
The measures of percentage of Limaria nest overlain by displaced substrate, percentage area of visibly disrupted Limaria nest and number of Limaria individuals exposed on the sediment surface were zero in every case apart from the post disturbance multiple drag treatment. The mean value for percentage of Limaria nest overlain by displaced substrate on the post disturbance multiple drag treatment was 31%. This is considerably higher than corresponding values from Loch Carron. However, it should be noted that the data are not fully comparable in that the Sligachan data is from a multiple drag whereas the Loch Carron data were from single drags. Also, the Sligachan estimates were made directly by a diver whereas the Loch Carron values were based on video screen grabs. The mean value for percentage area of visibly disrupted Limaria nest on the post disturbance multiple drag treatment was 4%. This is comparable with the Loch Carron data where the maximum values for percentage area of visibly disrupted Limaria nest was estimated as equivalent to ~3%. The mean value for number of Limaria individuals exposed on the sediment surface on the post disturbance multiple drag treatment was 0.25 individuals per 0.1 m2 (based on quadrat data). This value is not directly comparable to the Loch Carron data because of the variance introduced by the relatively small size sampling unit used at Loch Sligachan.
To facilitate a more direct comparison of the Loch Sligachan data with the Loch Carron data the Loch Sligachan videos (each treatment pre and post disturbance) were reviewed in a similar manner to the Loch Carron video assessment. Values estimated were percentage cover of Limaria nest material, area of visibly disrupted Limaria nest (cm2) and number of Limaria individuals exposed on the sediment surface. Full comparisons cannot be made because of the lack of replicate transects at Loch Sligachan but a subjective assessment is possible.
Initially, the values from the video assessment and quadrat data from the Loch Sligachan experiment can be assessed for consistency. The estimates of % cover of Limaria nest material from the video did not differ markedly between Loch Sligachan treatments and corresponded well to the estimates from the quadrats (ranging from 70 to 90%). The estimates of area of visibly disrupted Limaria nest material from the video differed slightly from those derived from the quadrats. There was disrupted material noted from the post disturbance single drag video whereas zero values were shown from the quadrats. However, this value was very low (0.2% when converted to percentage) and it is likely that the quadrats simply did not chance to fall upon the sparse patches of disrupted nest. Disrupted material was also noted from the post disturbance multiple drag video. This gave a slightly higher value (6.7%) than that derived from the quadrats (4%) but little significance can be attached to this in view of the methodological differences and lack of video replication.
When the Loch Sligachan and Carron video data are compared, it can be seen that levels of visible disturbance (area of disrupted turf) appear higher for the multiple drag treatment than for the single drags applied in Loch Carron. In Loch Sligachan the video estimate for post disturbance multiple drags was 6.7% and that for post disturbance single drags was 0.2 %. In Loch Carron, the single drag at both of the Limaria sites resulted in similar levels of disrupted turf ( ~1.4%). So it can also be noted that the Loch Sligachan bed showed less turf disruption as a consequence of a single drag when compared to the two Loch Carron sites.
The number of Limaria individuals exposed on the sediment surface can also be compared directly between Loch Sligachan and Carron based on the video data (Table 4). As was the case for Loch Carron, predation (by Necora) was observed on the exposed Limaria at Loch Sligachan.
| Site | No. exposed Limaria post disturbance | Estimated number exposed Limaria per m2 |
|---|---|---|
| Carron Site 1 (single drag, 4 replicates) | Mean 1.5 (range 0 – 3) | 0.96 |
| Carron Site 3 (single drag, 4 replicates) | Mean 8 (range 6 – 9) | 5.13 |
| Sligachan (single drag, 1 replicate) | 0 | 0 |
| Sligachan (multiple drag, 1 replicate) | 4 | 2.56 |
It can be noted that the counts from the single drag at Loch Sligachan falls within the range of counts seen at Carron site 1. Both Loch Sligachan and Carron Site 1 were characterised by a high cover of red algae and low relief Limaria nest material. The counts from Carron Site 3 are rather higher than even the multiple drag counts from Loch Sligachan. Loch Carron Site 3 had a relatively high relief nest mosaic and less cover of red algae.
The quadrat clearance data was evaluated (Figure 21) to assess if the post disturbance abundance in either of the drag treatments were deflated relative to the control and also to assess if mean size of Limaria individuals differed between treatments (i.e. if disturbance impact is emphasised at either end of the size range). Neither the mean abundance or size were significantly different between the treatments (Concordance test P>0.05).
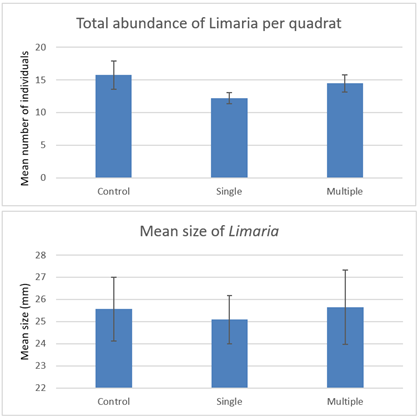
Figure 21. – Comparison of post disturbance mean abundance and mean size of Limaria on the control, single drag and multiple drag treatments at Loch Sligachan. Error bars denote standard error of the mean.
Click for a full description
The first bar graph shows mean abundance of Limaria based on quadrat clearances after experimental creel dragging by divers. There are three columns which respectively give values for the control, single drag and multiple drag treatments. The second bar graph shows mean size of Limaria based on quadrat clearances after experimental creel dragging. There are three columns which respectively give values for the control, single drag and multiple drag treatments.
4. Discussion
4.1 Creel dragging
The first aim of this study was to investigate the nature and extent of accidental creel dragging during deployment and recovery of fishing gear. The findings have limitations because drag distances could not be precisely measured and were based instead on visual estimates. Additionally, drag distance might be influenced by multiple factors. To robustly assess the role of a particular factor the remaining factors would need to be kept constant and replicate deployments made. This would require far more deployments than could be achieved. However, a number of conclusions can be reached.
We saw no evidence of creel drag occurring during deployment. This is unsurprising for hand deployed creels which will simply sink to the seabed with no lateral drag occurring. It was thought possible that ‘self-shot’ creel deployments might drag due to the tensioned rope pulling the creels off the boat. However, we made several deployments of this type and saw no evidence of creel drag.
Dragging did occur during creel recovery, but the extent of the dragging was variable and generally limited to a few metres at most.
The most significant variables affecting the extent of dragging are likely to be the degree of drift of the surface boat and rate at which the creels are hauled to the surface. Clearly, a strongly drifting surface boat is likely to put a lateral force on the creel line increasing the chance that creels drag across the seabed before they are lifted clear. This was seen in deployments 13 to 18 where the force 4 to 5 surface wind at Pabay caused the boat to drift dragging the final creel several metres over the seabed. Several factors will influence boat drift (wind speed, boat windage, current speed etc.) and these factors will be very well understood by most fishers.
The rate of hauling is likely to affect drag extent because slow or intermittent hauling will allow more potential that the drifting boat puts tension on the creel line and hence drags the creels. Delays during the hauling process might occur as a fisher removes the catch from each creel as it is brought onboard or occasionally because of entanglements with the pot hauler. We simulated such events in deployments 7 and 12. Both resulted in increased drag length relative to comparable deployments, but the effect was much more limited for deployment 7 than for deployment 12. We attribute this to the visibly stronger current running at the time of deployment 12. During deployment 7 there was initial limited dragging of proximal and distal creels but then the distal creels created an anchoring effect halting the boat drift which was causing the dragging. It appears that the current speed during deployment 12 was too strong for the creels to anchor the boat so dragging continued. It is likely that dragging due to hauling delays will be dependant on both the boat drift and the number and weight of creels on the seabed. If boat drift is negligible then it is likely that hauling delays have no consequence. Similarly, if the creel array is sufficiently heavy then it will act as an anchor arresting the boat drift such that limited dragging occurs. It is difficult to estimate the frequency at which such hauling delays occur. Removing the catch from creels as they are brought onboard is common practice, but this is likely to result only in relatively brief delays. The delays simulated in deployments 7 and 12 were more prolonged and more comparable with the situation arising from entanglements or other crises occurring on deck during creel recovery. It is reasonable to assume such situations are infrequent.
Another significant point illustrated by the data is that drag extent is variable between creels dependant on their position on the creel line. In most cases the proximal creel nearest the pick-up buoy was plucked direct from the seabed with little or no dragging. Where dragging occurred, it was normally limited to the distal creel at the end of the creel line. Two factors might contribute to this. Firstly, when the pick-up buoy is lifted, the boat will be relatively close to the proximal creel so the majority of the rope tension will be vertical rather than lateral and potential for drag is minimal. The distal creel however will be further away from the position of the pick-up buoy, so if the boat remains in the same position the tension on the line to the distal creel will have more of a lateral component and there will be a greater potential for dragging. This is of course complicated by the fact that some degree of boat drift is likely to occur. If that drift is away from the distal end of the creel line, then potential for dragging is likely to increase and if it is towards the distal end of the creel line then the boat will be closer to the creel and potential for dragging is likely to decrease.
The second factor to consider is the anchoring effect of the creel array. An array of several creels will have considerable ‘grip’ on the seabed and in normal conditions this may be sufficient to arrest any boat drift that might cause dragging. So the proximal creel may not drag because the boat drift is arrested by the anchoring effect of the full creel array but as successive creels are raised there are fewer on the seabed to act as an anchor and dragging of distal creels may occur.
The evidence suggests the first factor (boat position relative to creels) is more significant than the second factor (anchoring effect) as an explanation of the difference in drag length between proximal and distal creels. The lines between successive creels are generally slack while they are on the seabed. The anchoring effect of distal creels on proximal creels would only occur once those lines are taut. The expected pattern of events would be that the proximal creel drags to the point where the line linking it to distal creels becomes taut forming an ‘anchor’ at which point the proximal creel is lifted clear. This anchoring effect was not observed; the proximal creels tended to lift clear with no initial dragging to tension the line to the distal ‘anchor’. Also, the videos do not show the line at the front of the distal creel initially becoming taut running horizontal along the seabed as might be expected in the scenario described above. Instead, the line remained slack until the point it became taut and angled well above the seabed clearly due to tensioning from above. It should be noted that this account relates to normal creel recovery; in these cases it appears it was the boat position relative to creels that explains the difference in proximal and distal creel drags. The anchoring process described above (initial drag, tensioned inter-creel lines and arrest of drag), was observed when surface ‘snag’ and delay in recovery occurs as seen in deployment 7.
The significance of the observation is that estimates of overall drag extent cannot be made by simply assuming an ‘average’ drag length per creel and multiplying it by the number of creels deployed. Proximal creels drag less than distal creels and the drag differences between successive creels may depend on number of creels in the array and creel spacing. Current data does not allow an evaluation of how these factors might influence creel dragging for different creel configurations but it is reasonable to assume that they are relevant. We did attempt a comparison of dragging between arrays with different numbers of creels but could not detect a difference. This cannot be regarded as evidence of no effect because a range of other variables differed between the deployments made.
The data show tentative evidence that drag is increased where the creel array is orientated perpendicular to the direction of boat drift as compared to a creel array orientated in alignment with boat drift. This is consistent with the understanding that boat position relative to creel position is a key factor. Where the creels are laid perpendicular to drift direction then it will always be the case that drift will carry the boat away from each successive creel lifted resulting in a lateral pull on the line and hence increased creel drag. However, it would also be reasonable to expect that there would be a difference between arrays aligned with drift depending on if the pick-up buoy is ‘upstream’ or ‘downstream’ in relation to drift. This would make a difference because if the pick-up buoy is at the upwind / upstream end of the array the boat might tend to drift towards the more distal creels after lifting the pick-up buoy and this is less likely to cause drag. Conversely, if the pick-up buoy is at the downwind / downstream end of the array the boat will drift away from the distal creels while the array is being raised and drag is more likely. We did not detect such a difference in our data but this may simply be due to other factors varying between deployments and limited replication. However, regardless of how a creel array were deployed, there is a high probability that the direction of tide or wind will change between deployment and recovery so ensuring an optimal orientation of the array would be impossible.
Various features of the creel rigs may have potential to influence the extent of dragging. One of these is the buoyancy of the rope used in the array. In general, the standard practice is to use positively buoyant rope. However, there have been numerous incidents of marine mammal entanglement in creel ropes and the advantages of increasing the use of negatively buoyant rope is under consideration (Calderan et al. 2024). We compared the creel dragging using both types of rope and did not detect a difference in drag extent. However, the video footage did show that the negatively buoyant rope sometimes swept across the surface of the seabed as the ropes were tensioned during recovery. This will inevitably result in ropes physically contacting a greater area of seabed. The intensity of disturbance from the rope sweep will be relatively light and in many habitats the effects are likely to be entirely negligible. However, in areas with attached raised organisms (e.g. erect sponges, sea-fans, soft corals etc) then there is a high probability that these will be snagged by the rope and dislodged from the substrate. Ideally, negative ropes would be avoided in such habitats, but this is likely to be difficult to manage. In most situations it is likely that the advantage of reducing entanglement risk will outweigh the disadvantage of increased disturbance from ropes sweeping over the seabed.
Due to the range of variables that might influence the extent of dragging it is impossible to give a reliable estimate of area of seabed impacted by the drag of a typical creel deployment. It should be noted that the vessel used for this project (12 m, 10-ton) was towards the upper end of the size range of typical creel boats. Also, the creels used were lighter (~17 kg) than many in use commercially. Both of these factors might lead to increased dragging compared to that which would occur with a smaller boat and heavier creels. The average drag length of our 18 deployments was well under 1 m for the proximal creel and about 4 m for the distal creel (3 m if deliberate snag on the line was excluded). If this is converted to seabed area it gives a figure just under 2 m2 of seabed disturbed. We only measured drag on proximal and distal creels and it is reasonable to expect that some intermediate creels may also drag to some extent. Extrapolating our estimates to potential drag extent on a commercial creel array is problematic given that a commercial array may have 50 creels while our test arrays carried no more than 4 creels. The anchoring effect of a heavy commercial array might result in less average drag per creel than seen on the test array. Conversely, the greater distance between proximal and distal creels could result in a greater average drag per creel than estimated in the trials. However, it is undoubtedly the case that creel drag extent is negligible in comparison to the area impacted by demersal mobile gear.
The intensity of disturbance produced by a dragging creel is clearly minimal relative to that of heavy demersal mobile gear. The video shows small silt plumes raised behind the creel and small pebbles and cobbles are overturned. Clearly this will have some level of impact on the biota but in most environments it is likely to be minimal and transient. We would predict that if the benthic community were to be assessed before and after a creel drag it would be difficult to demonstrate any change in the community composition. However, raised sessile biota are likely to be more vulnerable than other members of the benthos. For example, our video shows small kelp plants overturned and dragged by the creels and occasionally these plants together with their associated biota became caught on the creels and raised to the surface. Impacts of creels on raised sessile biota have been noted elsewhere. For example, Adey (2007) comments on visible impacts on sea pens, Rees et al. (2021), Gall et al. (2020) and Eno et al. (2001) note impact on sea fans and Ross Coral and Stevens (2021) comments on damage to sponges and corals. So, there is visual evidence of impacts on raised sessile biota and it is intuitive that they are likely to be more vulnerable than other components of the benthos. However, empirical evidence of community level impacts is rather limited (Walmsley et al. 2015) with the most convincing evidence being that of the Lyme Bay studies (Rees et al. 2021).
Final evaluation would be that creel drag impacts are likely to be minimal in most habitats but in some situations with a stable community including raised sessile biota the disturbance effects may be significant and measurable. For example, if creels were deployed in an area of dense serpulid reefs significant damage would be inevitable.
4.2 Experimental creel dragging on Limaria
The second aim of the project was to experimentally replicate creel drag disturbance on biogenic beds formed by Limaria hians and evaluate potential impacts.
This was achieved through divers manually hand hauling creels over experimental plots. Video of the experimental creel drags in progress was compared with video taken during actual creel deployments. This indicated that the drag rate and visually apparent effects were comparable in each case. Experimental drags were conducted on Limaria beds with different characteristics and the impacts of repeated drag disturbance were compared to those arising from a single event.
A general observation was that although the disturbance resulted in visible flattening of biota and some disruption of nest material it was difficult to demonstrate a clearly measurable change. Overall coverage of nest material was not reduced irrespective of the type of Limaria bed and irrespective of whether single or repeated drags had been conducted over the area. Overall reduction in nest cover would only occur if the disturbance was severe enough to scrape nest material from the seabed and displace it from the path of the creel. This was not the case. The creel dragged over the surface of the nest material and occasionally caught and displaced fragments of nest material. Visual estimates were made of the proportion of displaced nest material, but it should be noted that it was sometimes difficult to confidently identify displaced material. The proportion of displaced material tended to be greater after disturbance then it was before disturbance and was greater on the multiple drag plot than on the single drag plot.
Following the experimental creel drags at the Loch Sligachan site nest material was collected to assess differences in Limaria abundance and size distribution which might have arisen as a consequence of the disturbance. Neither of these metrics were found to differ between control, single drag and multiple drag treatments. Taken together, the nest coverage data and the abundance data demonstrate that although the disturbance is sufficient to be visibly apparent it is insufficient to cause a measurable reduction in the extent of the habitat or the abundance of the habitat forming species.
The most informative metric of the disturbance effect proved to be the number of Limaria individuals visible on the sediment surface. In all cases there were no Limaria visible prior to the creel dragging. On most of the experimental drag sites there were a number of visible Limaria after the passage of the creel. It was clear that these were displaced from their galleries by the disturbance caused by the creel drag and it was also clear that many of them were subject to immediate predation by crabs and squat lobsters. This predation is significant. We have evidence that adult Limaria are capable of reconstructing nests in an aquarium setting but the process is slow, occurs mainly in the hours of darkness and may take a number of days to complete. If predation levels prevent this process occurring, then damaged nests will not be repaired, and a proportion of the adult individuals will be lost from the population.
The number of exposed Limaria differed between sites of differing characteristics and between plots subject to multiple as opposed to single drags. The Loch Sligachan site appeared to be the least vulnerable to disturbance and no Limaria were exposed due to the single creel drag. Of the single creel drags at Loch Carron, the 4 comparable plots at site 1 included one which also had no Limaria exposed but they were present on the remaining three plots (numbers ranging from 1 to 3). At Carron site 3 all 4 plots had exposed Limaria and the numbers exposed were rather higher (ranging from 6 to 9).
It would appear that the sites show a gradation in sensitivity to disturbance with Carron site 3 the most sensitive followed by Carron site 1 and Loch Sligachan the least sensitive. This difference is further emphasised by the data from the Loch Sligachan multiple drag plot. Here, unlike the adjacent single drag plot, there were exposed Limaria. Despite the increased level of disturbance on this plot the number of exposed Limaria were only marginally higher than seen at the Carron site 1 single drag plots and were rather lower than seen at the Carron site 3 single drag plots.
The apparent trend in sensitivity appears to negatively correlate with coverage of nest material. At Loch Sligachan nest cover was estimated at about 80%, at Carron site 1 it was 60-70% and at Carron site 3 it was 30-40%. Additionally, at Sligachan and Carron site 1 the nest material was covered by a dense turf of red algae. Red algae were also present at Carron site 3 but was relatively sparse. A final distinctive feature of Carron site 3 was the nests formed a well-defined mosaic with nest material raised a few centimetres above the surface of the intervening sand patches.
The sensitivity of Carron site 3 might be attributable to the high surface relief of the nest material which increases potential for the dragging creel to catch on raised surfaces, disrupt nest material and displace Limaria. The red algae at site 1 and at Loch Sligachan may also be a factor in binding the nest material and providing a degree of protection from abrasion from the creel.
It can be concluded that high relief nest mosaics are more vulnerable to disturbance than areas with more continuous coverage of nest material. Although the level of disturbance from a single creel drag is limited (and probably negligible in the long term) there is little known about the cumulative impacts of disturbance on such sites. It is possible that repeated small-scale disruption of the fabric of the nest mosaic could lead to measurable change to the habitat. Further study would be informative, but no suitable well developed Limaria mosaic sites are known outside the boundaries of areas already subject to statutory protection.
4.3 Recommendations for further work
The chief recommendation is to devise a methodology to efficiently and reliably measure creel drag distance in commercial deployments. This would allow us to measure creel drag for multiple deployments and recoveries on real-world working creel boats. As discussed above, there are multiple factors that might influence the degree of drag. Such factors might include creel type and weight, the number of creels in an array (including measuring how creel position on the array influences drag extent), rope buoyancy, orientation of deployment / recovery in relation to boat drift, boat type (windage and weight), haul rate and constancy, current speed, wind speed, water depth and seabed type. Gaining a full understanding of the influence of these variables with sufficient replication would require a very large number of deployments and it would be better addressed by deployment from a working creel boat using their normal equipment as opposed to basing it on an ‘experimental’ creel set-up.
This means that the equipment must be suitable for rapid attachment to working creels such that multiple deployments can be made within the available time. Methods involving deploying seabed receivers are likely to be too slow to allow sufficient deployments. Use of divers can be discounted for the same reason and for safety reasons. Use of accelerometers and depth loggers on creels holds some potential. The accelerometer data might indicate when the creel is in motion and the depth data would provide information on when the creel leaves the seabed during recovery. However, to know the drag extent it is also necessary to measure the speed of drag in addition to logging when it starts and stops moving along the seabed. This might be difficult to achieve without deploying units on the seabed (discounted for the reason given above) to acoustically communicate with units attached the creels. A further obstacle is likely to be the cost of such an approach. To get an understanding of the behaviour of a commercial array of 50 creels it would be necessary to have enough instruments to measure the behaviour of at least 10 creels at the same time. This is likely to incur substantial expense.
The use of relatively inexpensive GoPro cameras (as used in this study) is likely to be more cost effective and has the additional advantage of providing direct visual evidence of dragging. This study showed some difficulty with the approach due to sediment plumes created by the dragging creel. It is also constrained because estimating drag distance is based on skilled eye assessment of the size of objects on the seabed. The approach would be improved if distance estimates could be made on the basis of comparison with an object of known and measured size. A possible approach might be to devise a mount to support a downward pointing camera above the creel such that the creel appears in the field of view and constitutes the object of known size for estimating drag distance. However, there are a number of potential practical difficulties to overcome. For example, a raised mount might easily become fouled and displaced by the creel rope or due to the creel tipping over on the seabed. A further problem is that identifiable reference points need to be recognisable on the seabed so that distances can be estimated as the creel drags past them. If the seabed is relatively featureless or becomes obscured by plumes of silt from the sides of the dragging creel then it may not be possible to estimate drag distance. The approach offers good potential but would require careful testing and experimentation before rolling out for use on commercial creel boats.
Direct assessment of creel drag impacts on Limaria or other seabed habitats is best delivered by way of controlled field experiments conducted by divers at selected locations. This was the approach taken by this study and it has proved effective. Potential improvements might include increasing the drag length to gain a larger sample size and also to increase the number of replicate drags conducted to gain a better estimate of sample variance. In the case of Limaria it would be informative to cover a broader range of types of Limaria bed to further investigate the increased sensitivity of raised mosaic type beds to creel dragging. The main constraint on proceeding with this approach would be conservation concerns. It would require conducting potentially damaging experimental work on a larger area of Limaria bed and the need to include experimentation on well developed mosaic beds would require this to be conducted within existing protected areas.
Acknowledgements
Thank you to Kevin Scott of the St Abbs Marine Station for the generous loan of test creels. Thank you to the NatureScot staff for providing diving support in Loch Sligachan (Rie Pors, Peter Webster and Karen Ferry). Thank you also to Alex Robertson-Jones and Owen Paisley for dive support at Loch Carron.
5. References
Adey, J.M. 2007. Aspects of the sustainability of creel fishing for Norway lobster, Nephrops norvegicus (L.) on the West coast of Scotland. PhD thesis, University of Glasgow (United Kingdom).
Adey, J.M., Smith, I.P., Atkinson, R.J.A., Tuck, I.D. and Taylor, A.C. 2008. 'Ghost fishing’ of target and non-target species by Norway lobster Nephrops norvegicus creels. Marine Ecology Progress Series, 366: 119-127.
Alcaraz, J., Anton-Sanchez, L. and Monge, J.F. 2022. The Concordance Test, an Alternative to Kruskal-Wallis Based on the Kendall-tau Distance: An R Package, The R Journal, 2022.
Calderan, S., Cisternino B.,De Noia M.,Leaper R.,MacLennan E. and Philp, B. 2024. Successful collaborative trials of simple gear modifications to reduce entanglement of whales and other megafauna in Scotland’s static pot (creel) fisheries. ICES Journal of Marine Science , 0: 1–11
Eichert, M., Campos, A., Fonseca P., Lopes, P., Marques, L. and Castro, M. 2018. Effects of reallocating fishing effort from trawling to creels in a Norway lobster fishery. Marine Policy 93: 142–149.
Eno, N.C., MacDonald, D.S., Kinnear, J.A.M., Amos, C.S., Chapman, C.J., Clark, R.A., Bunker, F.St.P.D. and Munro, C. 2001. Effects of crustacean traps on benthic fauna. ICES Journal of Marine Science, 58: 11-20.
Gall, S.C., Rodwell, L.D., Clark, S., Robbins, T., Attrill, M.J., Holmes, L.A. and Sheehan E.V. 2020. The impact of potting for crustaceans on temperate rocky reef habitats: Implications for management. Marine Environmental Research 162 (2020) 105134.
Hall-Spencer, J.M. and Moore, P.G., 2000. Limaria hians (Mollusca: Limacea): a neglected reef forming keystone species. Aquatic Conservation – Marine and Freshwater Ecosystems 10, 267–277.
Hammarlund, C., Jonsson, P., Valentinsson, D. and Waldo, S. 2021. Economic and environmental effects of replacing bottom trawling with fishing with creels. Australian Journal of Agricultural and Resource Economics, 65: 94–118.
Hiddink, J.G., Jennings, S., Kaiser, M.J., Queirós, A.M., Duplisea, D.E. and Piet, G.J. 2006. Cumulative impacts of seabed trawl disturbance on benthic biomass, production, and species richness in different habitats. Can. J. Fish. Aquat. Sci. 63: 721–736.
Hiddink, J.G., Jennings, S., Sciberras, M., et al. 2019. Assessing bottom trawling impacts based on the longevity of benthic invertebrates. J Appl Ecol. 56:1075–1084
Hinz, H., Prieto, V. and Kaiser, M.J., 2009. Trawl disturbance on benthic communities: chronic effects and experimental predictions. Ecological Applications, 19(3): 761–773.
Holt, T.J., Rees, E.I., Hawkins, S.J. and Seed, R. 1998. Biogenic Reefs (volume IX). An overview of dynamic and sensitivity characteristics for conservation management of marine SACs. Scottish Association for Marine Science (UK Marine SACs Project).
Kaiser, M.J., Spence, F.E. and Hart P.J.B., 2000. Fishing-Gear Restrictions and Conservation of Benthic Habitat Complexity. Conservation Biology, 14: 1512–1525.
Kaiser, M.J. and Spencer, B.E., 1996. The effects of beam-trawl disturbance on infaunal communities in different habitats. Journal of Animal Ecology, 65: 348-358.
Leocadio, A.M., Whitmarsh, D. and Castro, M. 2012. Comparing Trawl and Creel Fishing for Norway Lobster (Nephrops norvegicus): Biological and Economic Considerations. PLoS ONE 7(7): e39567. doi:10.1371/journal.pone.0039567.
Mazor, T., Pitcher C.R., Rochester W., et al., 2021. Trawl fishing impacts on the status of seabed fauna in diverse regions of the globe. Fish and Fisheries, 22: 72–86.
Moore, C.G., Harries, D.B. and Trigg, C. 2012. The distribution of selected MPA search features within Lochs Linnhe, Etive, Leven and Eil: a broadscale validation survey (Part B). Scottish Natural Heritage Commissioned Report No.502.
Morello, E.B., Antolini, B., Gramitto, M.E., Atkinson, R.J.A. and Froglia, C. 2009. The fishery for Nephrops norvegicus (Linnaeus, 1758) in the central Adriatic Sea (Italy): Preliminary observations comparing bottom trawl and baited creels. Fisheries Research 95: 325–331.
Murray, A.G., 2015. Does the use of salmon frames as bait for lobster/crab creel fishing significantly increase the risk of disease in farmed salmon in Scotland? Preventive Veterinary Medicine, 120: 357–366.
Rees, A., Sheehan, E. V. and Attrill, M. J. 2018. The Lyme Bay experimental potting study: A collaborative programme to assess the ecological effects of increasing potting density in the Lyme Bay Marine Protected Area. A report to the Blue Marine Foundation and Defra, by the Marine Institute at the University of Plymouth.
Rees, A., Sheehan, E. V. and Attrill, M. J. 2021. Optimal fishing effort benefits fisheries and conservation. Scientific Reports, 11:3784.
Spoors, F., Mendo, T., Khan, N. and James, M. 2021. Assessing bait use by static gear fishers of the Scottish Inshore fisheries: A preliminary study. Fisheries Research, 240: 105974.
Stevens, B.G., 2021. The ups and downs of traps: environmental impacts, entanglement, mitigation, and the future of trap fishing for crustaceans and fish. ICES Journal of Marine Science 78(2): 584-596. doi:10.1093/icesjms/fsaal35.
Thrush, S.F., Hewitt, J.E., Cummings, V.J., Dayton, P.K., Cryer, M., Turner, S.J., Funnell, G.A., Budd, R.G., Milburn, C.J. and Wilkinson, M.R. 1998. Disturbance of the marine benthic habitat by commercial fishing: Impacts at the scale of the fishery. Ecological Applications, 8(3): 866–879.
van Denderen, P.D., Hintzen, N.T., Rijnsdorp, A.D., Ruardij, P. and van Kooten, T. 2014. Habitat-Specific Effects of Fishing Disturbance on Benthic Species Richness in Marine Soft Sediments. Ecosystems, 17: 1216–1226.
van Denderen, P.D., Plaza-Morlote, M., Vaz, S., Wijnhoven, S., Borja, A., Fernandez-Arcaya, U., Gonzalez-Irusta, J.M., et al. 2024. Complementarity and Sensitivity of Benthic State Indicators to Bottom-Trawl Fishing Disturbance. Ecological Applications 34(8): e3050
Walmsley, S.F., Bowles, A., Eno, N.C. and West, N. 2015. Evidence for Management of Potting Impacts on Designated Features. Report by ABP Marine Environmental Research Ltd, Eno Consulting and Centre for Environment, Fisheries and Aquaculture Science to Department for Environment Food and Rural Affairs (Defra). Contract Reference: MMO1086.
Wobbrock, J.O., Findlater, L., Gergle, D. and Higgins, J.J. 2011. The aligned rank transform for nonparametric factorial analyses using only ANOVA procedures. Proceedings of the ACM Conference on Human Factors in Computing Systems (CHI '11). Vancouver, British Columbia (May 7-12, 2011). New York: ACM Press, pp. 143-146.
Ziegler, F. and Valentinsson, D., 2008. Environmental life cycle assessment of Norway lobster (Nephrops norvegicus) caught along the Swedish west coast by creels and conventional trawls—LCA methodology with case study. Int J Life Cycle Assess, 13: 487–497.
ANNEX 1: STUDY SITE LOCATION DATA
| Deployment number | Location | Latitude | Longitude |
|---|---|---|---|
| 1 | Loch Carron | 57.36311 | -5.65053 |
| 2 | Loch Carron | 57.36311 | -5.65053 |
| 3 | Loch Carron | 57.36311 | -5.65053 |
| 4 | Loch Carron | 57.36375 | -5.64389 |
| 5 | Loch Carron | 57.36375 | -5.64389 |
| 6 | Loch Carron | 57.36375 | -5.64389 |
| 7 | Loch Carron | 57.36375 | -5.64389 |
| 8 | Loch Carron | 57.36260 | -5.64411 |
| 9 | Loch Carron | 57.36260 | -5.64411 |
| 10 | Loch Carron | 57.36260 | -5.64411 |
| 11 | Loch Carron | 57.36260 | -5.64411 |
| 12 | Loch Carron | 57.36260 | -5.64411 |
| 13 | Pabay | 57.28550 | -5.86917 |
| 14 | Pabay | 57.28550 | -5.87000 |
| 15 | Pabay | 57.28400 | -5.87133 |
| 16 | Pabay | 57.28550 | -5.86917 |
| 17 | Pabay | 57.28550 | -5.87000 |
| 18 | Pabay | 57.28400 | -5.87133 |
| Location | Latitude | Longitude |
|---|---|---|
| Loch Carron, site 1 | 57.36471 | -5.64809 |
| Loch Carron, site 2 | 57.36311 | -5.65053 |
| Loch Carron, site 3 | 57.36218 | -5.64838 |
| Loch Sligachan | 57.316952 | -6.114835 |