NatureScot Research Report 1394 Consolidation of previous investigations into the range, variation and interpretation of herbivore impact assessment methodologies currently in use in Scotland and distillation into a user-friendly practitioners’ guide
Published: 2026
Authors: Smith, S. W1., Hewison, R.L.1, Potts, J.M.2, Kyle, C.1, and Pakeman, R.J1
1The James Hutton Institute, Scotland, UK, 2Biomathematics and Statistics Scotland, UK
Cite as: Smith, S. W1., Hewison, R.L.1, Potts, J.M.2, Kyle, C.1, and Pakeman, R.J1 Consolidation of previous investigations into the range, variation and interpretation of herbivore impact assessment methodologies currently in use in Scotland and distillation into a user-friendly practitioners’ guide and technical annex. NatureScot Research Report 1394.
Smith, S. W1., Hewison, R.L.1, Potts, J.M.2, Kyle, C.1, and Pakeman, R.J1
1The James Hutton Institute, Scotland, UK, 2Biomathematics and Statistics Scotland, UK
Keywords
Deer management; Herbivore Impact Assessment; indicators; impact classes; open hill range; sampling design; stakeholder consensus; surveyor consistency
Background
NatureScot commissioned this project to consolidate information on the current range of Herbivore Impact Assessment (HIA) methods used across Scotland for a range of purposes and between practitioners, and to gain consensus to aid more informed application in the future.
The overall aim of the project was to produce a readily accessible document that guides practitioners on the various methods of HIA available, the variations on standard methods currently used and their purposes. The report should include guidance on how results should be interpreted and reference to desired outcomes. Compatibility and read across between the results of the methods should also be investigated.
The guide needed to be a pragmatic method of establishing the current level of grazing/trampling pressure, and one capable of detecting temporal change in herbivore pressure on open hill habitats. This work was to focus solely on upland open range habitats in Scotland. Woodland habitats were specifically excluded from the remit of this work as other work has regularly refined the Woodland HIA, although discussions with NatureScot and stakeholders highlighted the need to consider cross-over of indicators in the Woodland HIA guide specifically where there are woodland expansion objectives.
Specified deliverables as part of the contract were the following:
- To collate information on existing methods for HIA and the variances between them
- Rationalise HIA attributes to remove uninformative or difficult to apply ones
- Seek consensus on the most appropriate methods and attributes to use – with the involvement of key stakeholders (see below)
- Create a user’s guide to HIA methods, with a suggested revised attribute table to enable the creation of field forms and results analysis and interpretation
- Create a technical appendix detailing the basis for the above guidance and suggested revisions (testing and adoption will follow in later phases of the project, however stakeholder feedback will be sought on the revised provisional guidance)
Main findings
- Rationalising attributes and cross tabulation of Herbivore Impact Assessment (HIA) indicators identified limited overlap in indicators across existing HIA methods. For 76 indicators used across four habitat types, out of five HIA methods, only 7 indicators were shared across four or more HIA methods and 24 were shared across more than 2 HIA methods.
- Results from an online stakeholder survey found no difference in user preference of indicators between HIA methods. However, there were significant differences in how informative users viewed HIA for different habitat types. Indicators used to assess tussock grasslands were viewed as the least informative or useful and had the strongest need for improvement.
- Synthesising the results from the stakeholder survey and consultation as part of an in-person stakeholder workshop, we have set out a list of indicators that stakeholders and the James Hutton Institute project team have confidence in for the four habitat types: blanket bog, dwarf-shrub heath, smooth grassland and tussock grasslands (specifically purple moor grass dominated tussock grasslands). We have focused on these four dominant open hill range habitats, but future work may expand upon these habitat types, especially other types of tussock grassland and considering habitats of high conservation interest.
- These indicators require field-testing and comparison to common existing HIA methods. As many of the thresholds between impact classes have limited or no scientific underpinning, we recommend that the first field-tests record raw data rather than just impact class. For example, for heather browsing reporting the impact class and estimating the proportion of shoots browsed to nearest 5%. Recording raw data would allow further adjustments of thresholds and support statistical analysis. In addition, we suggest that a correlation analysis be carried out on raw data to assess if the indicators are picking out the same patterns.
- We also suggest that there is a study of between-surveyor consistency. Observation variation can be reduced by calibrating between surveyors at the start of a survey, for instance using images of proportion of browsed shoots. Field-testing can be used to assess surveyor-drift during a survey and the consistency of thresholds and scoring. Testing should include a diverse range of users (i.e., deer stalkers/estate managers, consultants, NGOs/government agencies) to assess if the methods work for all likely user-groups.
- Statistical approaches to analysing ordinal data are not straightforward. Formal statistical analysis may not be required at the estate level, but advice needs to be developed for formal analysis on what level of change is needed for a given sample size before it can be taken as change rather than noise (sampling variance) in impact data. This would require statistical analysis of some repeat HIA survey data.
- There was no consensus amongst stakeholders on the best sampling design. Utilising georeferenced locations from past surveys, a desk-based exercise could investigate potential differences in designs between fixed point versus walk-through HIAs. We suggest selecting fixed-points on a grid-intersect to capture a representative proportion of target habitats in the sample area and using a plot-based survey approach. This may not be appropriate or economic for surveying large areas, so additional thought would be needed, potentially using the sampling approach taken in the Macaulay Land Use Research Institute’s (MLURI) Rapid Assessment of Grazing and Trampling Impacts method, which is a grid-cell and walk-through survey method.
Acknowledgements
We would like to thank all stakeholders who answered our online survey, attended the workshop and especially those who provide constructive feedback on the draft of this report. Thank you to the members of the NatureScot Scientific Advisory Committee (SAC) Deer subgroup who provided valuable guidance and feedback on the project and report.
Abbreviations
Common Standards Monitoring (CSM)
Deer Management Groups (DMGs)
Herbivore Impact Assessment (HIA)
James Hutton Institute (JHI)
Macaulay Land Use Research Institute (MLURI)
Wild Deer Best Practice (WDBP)
Scientific Advisory Committee (SAC) Deer Subgroup
Contents
- Keywords
- Background
- Main findings
- Acknowledgements
- Abbreviations
- Methods
- Results
- Recommendations
- User guide
- Recommendations
- Recommendations
Introduction
What is a Herbivore Impact Assessment (HIA)?
Herbivore Impact Assessments (HIAs) are field survey-based methods to assess the impact of herbivores on habitats. Assessments are based primarily on identifying vegetation features that have changed as result of herbivore presence. For Scottish open hill rangelands, assessments seek to assign a level of herbivore impacts on habitats, focusing on impacts of dominant mammalian herbivores, namely deer, sheep, cattle and to a lesser extent smaller herbivores such as hares, rabbits and voles. Indicative features of herbivore impact, or indicators, include evidence of grazing or browsing of vegetation, changes in plant growth-form and species composition, evidence of disturbance and trampling, and dung deposition. Whilst all the HIA methods attempt to assign a level of grazing or trampling, others examine the impact as well. For a given indicator, the extent of herbivore impact is then assigned an impact class. For example, widespread grazing of preferred species has high impact compared to patchy grazing of preferred species which would be assigned a moderate impact. Impact classes are often delineated between two or three classes, e.g., high, medium, and low herbivore impact. An overall herbivore impact score is then assigned to the location of the habitat type. Impact classes for each habitat type are often visualised spatially or graphically.
What are the different types of open hill range HIA in used across Scotland?
As part of this project, we have assessed the following open hill range Herbivore Impact Assessments:
- Pre-MacDonald method – these were earlier HIA methods used by some private estates prior to the formulation and publication of the MacDonald et al. method (Rae, 1995, Rae, 1996).
- MacDonald et al. method (also referred previously as Scottish Natural Heritage method) used by NatureScot for HIA work across Deer Management Groups (DMGs) or individual holdings to assess habitat condition (MacDonald et al., 1998a, MacDonald et al., 1998b, MacDonald, 2007).
- Wild Deer Best Practice (WDBP) designed for open hill range and woodlands and targeted to be carried out by deer stalkers and estate managers on private estates or as part of surveys coordinated across DMGs with indicators derived and simplified from the MacDonald et al. method (Wild Deer Best Practice Guidance for Scotland, 2018).
- Putman method a non-plot-based assessment methodology used by several stalkers and managers and professional contractors on Scottish estates with recent research trials in northern England (Logan et al. unpublished). The method was partly developed by Professor Rory Putman, simplifying and developing the method from the MacDonald et al. method.
- Common Standards Monitoring (CSM) informs Site Condition Monitoring of designated sites such as Sites of Special Scientific Interest. This method assesses many aspects of site condition, including herbivore impacts (Joint Nature Conservation Committee, 2009).
Other variations and derivates of these methods were not the focus of this report. However, we did consult the Woodland HIA guide (Armstrong et al., 2023) and the Deer Initiative Woodland Impact method in England and Wales (The Deer Initiative, 2024) due to woodlands often being part of an open hill range habitat mosaic. Also, within Scotland there is an increasing interest in afforestation and reforestation with a need to understand herbivore impacts on these establishing treescapes.
What is the purpose of HIA?
The purpose of the different HIAs methods outlined above are diverse, albeit with a common theme of assessing herbivore impacts. A detailed, internal report commissioned by NatureScot entitled ‘Deer Management and Habitat Impact Assessment; review of the data’ (Mayne, 2021) reviews in detail the purposes of different HIA methodologies. Of the methods outlined above an exception is CSM which is designed as a pass or fail system for habitat condition of designated sites across Scotland, nevertheless, we include it in the current report as many indicators are shared.
As part of this project, a meeting with NatureScot staff across departments (online 22nd January 2025 with 20 attendees) identified common purposes for HIAs including: informing herbivore and deer management, understanding where management interventions are required, assessing the impact of interventions, and as evidence to support regulatory decisions. HIA assesses a specific herbivore pressure on habitats, but how it is interpreted, and hence informs management change decisions, will depend on the proposed herbivore management changes and habitat outcomes desired.
What are the current challenges with HIA?
Since the development of the MacDonald et al. method there have been many challenges and issues raised concerning HIAs. A main overarching concern for HIAs is a question over the robustness and consistency of results, particularly with different methodologies leading to differing results which has affected confidence in HIAs. This needs to be addressed as they can be used as the basis of regulatory approaches. Conflicting results following different HIA methods affects decision-making to inform management, interventions and regulation. Notably, conflicts arise between results from the MacDonald et al. method and the simpler WDBP, although comparisons between other methods have also resulted in different outcomes. At the same time, there is a strong desire for HIA methods to have widespread uptake by practitioners, thus simpler methods need to be as robust as more complex methods. These challenges sit within the context of changing environmental policy, with the Natural Environment (Scotland) Bill seeking to revise legislation and regulation around deer management. The Bill seeks to move away from interventions focussed on the existence or continuing of current herbivore damage to habitats towards the restoration of previously damaged habitats, that may, or may not, still be experiencing herbivore damage.
Previous work has explored several issues concerning the robustness and consistency of HIA methods. In brief, some major issues previously studied are detailed below:
- Spatial-scale and sampling design of HIAs: this issue related to two problems (1) the repeatability of results and, (2) the time and financial cost of undertaking surveys at large spatial scales, particularly across multiple land holdings as part of Deer Management Groups (DMGs). The original MacDonald et al. method did not outline a sampling design with the assumption that this followed principles of Phase I habitat monitoring based on polygon mapping units of habitats. Variations of HIA methods differ in using randomly sampled versus fixed points and permanently marked or unmarked points. Rapid assessment methodologies were developed, such as the Macaulay Land use Research Institute (MLURI) Rapid Assessment method, sampling 0.5 km x 0.5 km squares to optimise time and expense costs of surveying large areas (MacDonald, 2007).
- As part of this report, we have sought feedback from stakeholders on preferred sampling design and reviewed different methodologies in detail. Their feedback was not conclusive, and consequently we have recommended following a fixed-point and plot-based method using GPS relocation with the option of the MLURI Rapid Assessment method for large areas such as whole DMGs.
- Surveyor consistency: A surveyor field test conducted on the MacDonald et al. method in upper Strathspey concluded complete disagreement between surveyors was unlikely across two impact classes (low versus high). In the study, consistency varied by habitat and the highest agreement was found for dwarf-shrub heath and wind clipped heath and lowest agreement for springs and flushes (McConnell Associates, 2000, MacDonald, 2010). A potential caveat of the finding was that a disagreement was only considered for a difference of greater than two herbivore impact classes, when a difference in one impact class could be considered significant disagreement. In contrast, a more recent unpublished study found high surveyor consistency within plots using the MacDonald et al. method (Headley et al. unpublished data). Similarly, a survey consistency report for Woodland HIA also found significant inter-surveyor variation for woodland methods, that led to further refinements of the descriptions and user-guide information provided for the Woodland HIA method (Armstrong, 2021).
- As part of this report, we did not investigate inter-surveyor consistency, but any revision and refinement of open hill range HIA methods would require testing inter-surveyor consistency and surveyor ‘drift’ with time.
- Streamlining indicators: The MacDonald et al. method has many indicators which are rarely recorded in HIA reports. A review of eight HIA for blanket bogs identified indicators that performed poorly with regard to their universality, sensitivity, correlation with other indicators (Pakeman, 2009). Out of 12 blanket bog indicators assessed, statistical analysis found three indicators could be omitted without loss of information and a further two indicators had only moderate support for retention (Pakeman, 2009).
- As part of this report, our focus was streamlining indicators found across HIA methods using a combination of desk-based review and stakeholder consultation. Nevertheless, we stress revisions and refinement of open hill range HIA indicators would require field testing and statistical analysis.
Methods
Methods summary
To achieve the deliverables of the contract we combined a desk-based assessment of HIA indicators and stakeholder engagement. A summary of the approach is listed directly below with a more detailed description of methodology underneath the summary.
- Cross-tabulation of HIA indicators: we collated all indicators across existing HIA methods targeting four habitat types (blanket bog, dwarf shrub heath, smooth grassland and tussock grassland) which were the focus of multiple methods of assessment. The purpose of this exercise was to identify shared and non-shared indicators across HIA methods by habitat type.
- Online stakeholder survey: we created an online survey for stakeholders to provide general feedback on HIA methodologies and to evaluate indicators across HIA methods for three habitat types: blanket bog, dwarf shrub heath and tussock grassland. The purpose of the online survey was to obtain wider feedback on HIA methods and indicators beyond a stakeholder workshop. Smooth grassland had a strong agreement of indicators in cross-tabulation and was not included in the online survey. We decided that asking for input on more habitats would be likely to deter stakeholders from completing the survey.
- In-person stakeholder workshop: we organised a workshop targeting invitees to represent developers of HIA methods and users from a variety of backgrounds (consultants, government agencies, NGOS, estate managers). Informed by participant presentations and results from the online survey, stakeholders at the workshop discussed issues concerning (a) HIA methods raised in the survey, (b) selection of key indicators for blanket bog, dwarf shrub heath and tussock grasslands and (c) the description of impact classes within those indicators. We focussed on these three habitats to give attendees sufficient time to consider them during the workshop.
Ethical statement
The project received ethical approval from the human ethics committee at the James Hutton Institute for undertaking an online survey and in person stakeholder workshop (reference JHI - HRE - 0304 - 573 (v2)). All participants for both survey and workshop were required to provide consent.
Cross-tabulation of HIA indicators
We reviewed documentation of five herbivore impact assessments: (1) Pre-MacDonald et al. method; (2) MacDonald et al. (1998) method (MacDonald et al., 1998a, MacDonald et al., 1998b); (3) Wild Deer Best Practice method (WDBP); (4) Putman method and (5) Site Condition Monitoring (SCM). These were reviewed for four habitat types: (1) blanket bog, (2) dwarf shrub heath, (3) smooth grassland and (4) tussock grassland. These four habitats were selected as the focus of HIA evaluation because they cover the largest area of open hill range habitats across Scotland. Further, these habitats are shared across all HIA methodologies evaluated with the exception of tussock grassland not being in the pre-MacDonald method and a tussock grassland methodology was unpublished for WDBP method and not available online to practitioners (Wild Deer Best Practice Guidance for Scotland, 2018). Other habitats covered by open hill rangeland HIA methodologies were:
- wind clipped summit heath found in pre-MacDonald et al., MacDonald et al. and WDBP
- flush springs, tall herbs and scrub in MacDonald et al. and WDBP
- woodland in WDBP and the Putman method
- bracken in MacDonald et al., and wet heath which was differentiated from dry dwarf shrub heath and blanket bog in the Putman method.
Indicators were tabulated for each habitat, listing all indicators as rows and HIA method as columns. Rows were further divided for each indicator listing impact classes. Indicators were considered the same across HIA methods when there was only minor variation in wording and/or interpretable description. For example, trampling due to herbivores and trampling due to deer and sheep were listed as the same herbivore trampling indicator. Indicators were viewed as different if details were not shared and when similar indicators themselves were listed as separate indicators within a given HIA method, as often occurred in the MacDonald et al. method. For example, browsing of Calluna vulgaris and Vaccinium myrtillus, summer browsing of Calluna vulgaris and browsing of older woody shoot material from Calluna vulgaris and/or Vaccinium myrtillus were treated as separate indicators in the MacDonald et al. method. In our tabulation for the MacDonald et al. method, we collated all indicators listed under small-scale, large-scale and trend indicators sections. For the pre-MacDonald method we used the crib sheet in Rae 1995 & 1996 as our guide of indicator descriptions, since this was the oldest record, we had of a pre-MacDonald method (Rae, 1995, Rae, 1996).
Online stakeholder survey
The aim of the online stakeholder survey was to obtain feedback on HIA methodologies and seek consensus on the value and interpretation of indicators used across HIA methods.
The survey used the platform Qualtrics. and the survey was open to respondents for six weeks between 16th January and 28th February 2025. A key justification in creating the survey was to receive feedback from a wider pool of stakeholders beyond those attending the in-person meeting.
The survey focused on four commonly used HIA methods: (1) pre-MacDonald et al. method; (2) MacDonald et al. method; (3) Wild Deer Best Practice method and (4) Putman method. The survey focussed on three dominant open hill habitats: (1) blanket bog, (2) dwarf shrub heath, (3) tussock grassland. Smooth grassland was not included in the survey as this habitat had the greatest consensus of indicators across HIA methods (see results below) and to limit the complexity of the survey. The survey was advertised via social media, key stakeholder forums (e.g., Association of Deer Management Groups), and by word-of-mouth.
As part of our evaluation of indicators, respondents were presented with a table of indicators for a given HIA method and habitat type with four selectable options to evaluate each indicator: (1) I record this indicator most frequently; (2) I rarely or never record this indicator; (3) I find this indicator useful and/or informative to herbivore impact, and (4) I find this indicator easy to confuse with non-herbivore impacts (e.g., exposure and wind clipping, burning, water-based erosion). Multiple statements could be selected for each indicator, except for selecting an indicator as both frequently and rarely recorded. If a statement was not selected for an indicator, we informed respondents that we assumed that this meant the opposite meaning of the statement, and in the case of neither frequently nor rarely recorded the indicator was assumed to have moderate usage.
Responses to the survey on the frequency, rarity, useful/informative and ease of confusion with non-herbivore impacts for each indicator were expressed as a percentage representing the proportion of respondents selecting those categories. The analysis of proportion data used generalised linear models assuming a beta distribution for all analyses. We analysed the proportion of responses in each category in relation to HIA methods and habitat types. Across indicators we analysed the proportional response for each category in relation to one another. Finally, combining survey results and cross-tabulation of indications, we analysed the relationship between the number of times indicators were shared across HIA methods and the proportion of responses identifying the indicator as useful/informative. Proportion data was fitted in the models using the R package betareg (Cribari-Neto and Zeileis, 2010) in R (ver. 4.4.0, R Core Team 2024) (R Core Team, 2024).
Stakeholder workshop
The stakeholder workshop was an in-person event to share knowledge of different open hill range HIA methods, general challenges and potential improvements, and targeted input on indicators and impact classes. NatureScot provided a short-list of potential attendees which the project team added to. The diversity of attendees was designed to represent different HIA user groups with familiarity with different methodologies; the attendees encompassed HIA method developers, consultants, NGOs, estate managers/deer stalkers, and researchers. In advance of the workshop, attendees were requested to answer the online survey. The event was held at University of the Highlands and Islands, Inverness, on 4th February 2025. In total 16 people attended in person with two joining online.
The structure of the workshop was first knowledge sharing with presentations by participants on different HIA methods and some research evaluating methods and survey consistency followed by an open floor discussion. This was then followed by three sets of breakout sessions covering:
- Questions on general improvements of HIA methods with groups given three sets of questions: (i) ‘How to make HIA more accessible and user/practitioner friendly?’ (ii) ‘How do we improve the reliability of HIA?’ and (iii) ‘How to structure HIA in the landscape?’
- A question on ‘What indicators should HIA focus on for these habitats?’, which was repeated for three habitat types: (i) blanket bog; (ii) dwarf shrub heath, and (iii) tussock grassland. Participants were then asked to vote for the top three indicators identified collectively for each habitat type.
- A discussion on the development, wording and interpretability of impact classes of the top three indicators identified in the question above for each habitat type.
There were three groups of approximately five participants in each breakout group. All breakout groups were facilitated by a member of the JHI project team who transcribed discussion in the group verbatim onto a flip chart. Prior to the second breakout session participants were presented with results from the earlier desk-based cross tabulation of indicators and the online stakeholder survey. The first two breakout sessions had a carousel format (City St George's University of London, 2025). A group spent the longest time on the first question, or habitat, and moved around to other questions and habitats, contributing to input from the previous groups for a shorter time. After the second breakout session participants were given three sticky dots for each habitat and asked to vote for their choice of top indicators for that habitat. The workshop ended with an open floor discussion on HIA methods that was transcribed verbatim by the project team note takers. All flipcharts and voting scores of indicators were transcribed after the event and presented in the results.
Results
Cross-tabulation of HIA indicators
A total of 76 indicators were identified across the five HIA methods and four habitat types assessed. The MacDonald et al. method had on average three times more indicators than other HIA methods, noting that the pre-MacDonald method did not have tussock grassland indicators (Figure 1a). Across habitat types, blanket bog had the highest number of distinct indicators (27 indicators), followed by dwarf shrub (25 indicators), tussock grassland (22 indicators) and finally smooth grassland (18 indicators).
In total and across habitat types 44 indicators were not shared and used in only one HIA method (Figure 1b, c). The MacDonald et al. method had far the greater number of non-shared indicators totalling 31 indicators compared to 5 non-shared indicators for WDBP, 3 indicators for CSM and pre-MacDonald and 2 indicators for the Putman method (Figure 2b). Smooth grassland had most shared indicators with only 3 indicators non-shared between HIA methods, whereas dwarf shrub and tussock grassland had 15 non-shared indicators and blanket bog had 11 non-shared indicators (Figure 2b, c).
By each habitat type, there were three indicators, four indicators, 17 indicators and 24 indicators shared across all five, four, three and two HIA methods, respectively (Figure 1c). Distinct indicators shared across more than four HIA methods were as follows:
- Browsing of heather (Calluna vulgaris) and/or blaeberry (Vaccinium myrtillus) [blanket bog]
- Signs of grazing on leaves of palatable species (collectively) Agrostis canina, Festuca ovina, and F. vivipara [smooth grassland]
- Sward height and texture [smooth grassland]
- Amount of herbivore dung [dwarf shrub heath]
- Heather stem breakage due to large herbivore trampling [dwarf shrub heath]
- Amount of bare ground [smooth grassland, tussock grassland]
It is worth noting that HIA methods could share indicators however impact class descriptions within indicators could differ for a shared indicator between HIA methods. Due to the greater consistency of indicators across HIA methods for smooth grassland, these were not assessed by stakeholders using the online survey or stakeholder workshop, which also helped simplify and reduce time required for the online survey and in-person workshop.
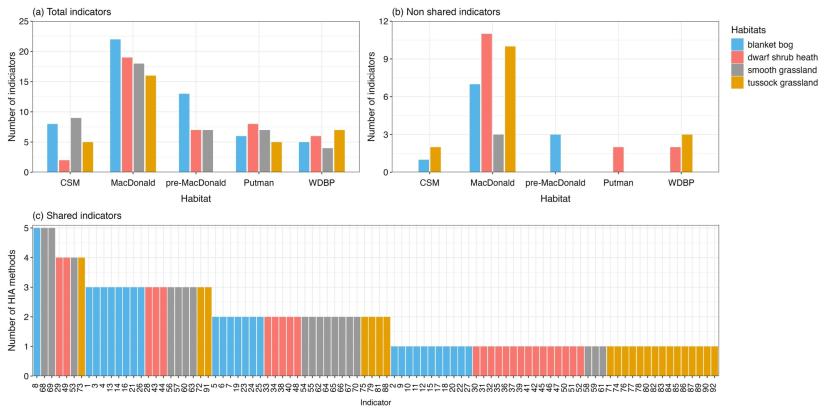
Figure 1. (a) The total number of herbivore impact indicators and (b) the number of non-shared indicators by Herbivore Impact Assessment (HIA) method
Click for a full description
and habitat type and (c) the number of HIA methods that share the same indicator separated by habitat types. In panel (c) for brevity indicators are shown with an index number rather than written in full. The bar charts show the total number of indicators and number of shared indicators between methods for the 5 main assessment methods. The distribution patterns are discussed in the previous paragraphs.
Online stakeholder survey
In total, 39 respondents answered the survey and of these 30 respondents provided answers to indicator questions. Occupations of those answering the survey encapsulated the diverse user range of HIA users, including: 30% estate manager/estate owner/deer stalker (9 respondents), 27% consultants (8 respondents), 23% government organisations/agencies (7 respondents), 20% researchers (6 respondents) and the remaining respondents identified as a mixture of these professions. Field experience of HIA users ranged from 2 to 30 years with a mean 12.5 years and median 10 years HIA user experience.
Respondents were asked to select up to two HIA methods they were most familiar with using, thus in total the survey had 40 sets of answers for indicators across different HIA methods. Respondents were most familiar with WDBP comprising 55% (22 responses), followed by MacDonald et al. method 38% (15 responses), and Putman method 7% (3 responses). There were no responses for the pre-MacDonald method.
We found little differences between HIA methods in whether stakeholders recorded indicators frequently or rarely, viewed them as useful or informative or viewed them as easily confused with non-herbivore impacts (Figure 2). The only difference was indicators were selected more frequently for the Putman method compared to MacDonald method (Figure 2a, Table 1); however, the Putman method only had three responses.
Comparing habitat types, indicators for tussock grasslands were viewed as less useful and informative and selected less frequently than other habitat types (Figure 2a & c; Table 1). It is worth noting that tussock grasslands in all HIA methods represented a range of tussock grassland types, for instance tussock grassland dominated by purple moor grass (Molinia caerulea), mat grass (Nardus stricta) and tufted hair grass (Deschampsia cespitosa) as such indicators may not be universally relevant, e.g., indicators with species present that are not relevant to all tussock grasslands. Further, the WDBP tussock grassland indicators presented in the survey has not been published by NatureScot, so respondents that were familiar with WDBP, may not have been familiar with the WDBP tussock grassland indicators. Dwarf shrub heath indicators were recorded more frequently than the other two habitat types (Figure 2a; Table 1). There were no significant differences across habitat types in whether indicators were viewed as easily confused with non-herbivore impacts (Table 1).
Overall, across HIA methods and habitat types, existing indicators average 52 ± 13 % (mean ± standard deviation, median 56%) usefulness and informativeness score highlighting significant scope for the improvement and refinement of indicators. The strongest difference was by habitat type, with indicators for tussock grasslands having the lowest usefulness score averaging 39% (median 44%) compared to similar dwarf shrub heath at 58% (median 59%) and blanket bog 60% (median 57%) usefulness scores. Thus, the survey identified tussock grasslands as having the fewest number of useful indicators and thus the strongest need for improvement.
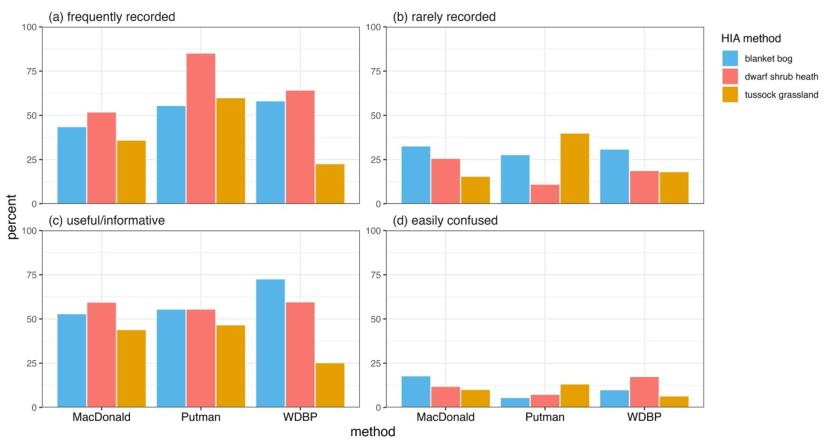
Figure 2. Stakeholder responses on the value of Herbivore Impact Assessment (HIA) indicators across HIA methods and separated by habitat types.
Click for a full description
The proportion of responses selecting whether an indicator was (a) frequently recorded, (b) rarely recorded, (c) useful or informative, and (d) easily confused with non-herbivore impacts. HIA methods differ in the number of respondents, WBDP n= 22, MacDonald et al. n= 15 and Putman n =3. Four bar graphs illustrating percentage of stakeholder responses on the value of HIA indicators per habitat. The results are discussed in the previous 3 paragraphs.
| - | Coefficient estimate | Std. Error | z value | P-value |
|---|---|---|---|---|
| Frequently recorded - (Intercept) | -0.277 | 0.246 | -1.126 | 0.260 |
| Frequently recorded -HIAmethod: Putman method | 1.006 | 0.280 | 3.594 | <0.001 |
| Frequently recorded -HIAmethod: WDBP | 0.175 | 0.271 | 0.645 | 0.519 |
| Frequently recorded - Habitat: Dwarf shrub heath | 0.625 | 0.277 | 2.260 | 0.024 |
| Frequently recorded - Habitat: Tussock grassland | -0.566 | 0.272 | -2.077 | 0.038 |
| Rarely recorded (Intercept) | -0.796 | 0.274 | -2.900 | 0.004 |
| Rarely recorded HIAmethod: Putman method | 0.053 | 0.311 | 0.173 | 0.863 |
| Rarely recorded HIAmethod: WDBP | -0.077 | 0.316 | -0.244 | 0.808 |
| Rarely recorded Habitat: Dwarf shrub heath | -0.680 | 0.318 | -2.135 | 0.033 |
| Rarely recorded Habitat: Tussock grassland | -0.344 | 0.303 | -1.137 | 0.255 |
| Useful/informative (Intercept) | 0.421 | 0.239 | 1.761 | 0.078 |
| Useful/informative HIAmethod: Putman method | 0.017 | 0.261 | 0.064 | 0.949 |
| Useful/informative HIAmethod: WDBP | 0.011 | 0.261 | 0.043 | 0.966 |
| Useful/informative Habitat: Dwarf shrub heath | -0.104 | 0.261 | -0.400 | 0.689 |
| Useful/informative Habitat: Tussock grassland | -0.903 | 0.262 | -3.437 | <0.001 |
| Easily confused with non-herbivore impacts (Intercept) | -1.842 | 0.250 | -7.380 | <0.001 |
| Easily confused with non-herbivore impacts HIAmethod: Putman method | -0.514 | 0.293 | -1.753 | 0.080 |
| Easily confused with non-herbivore impacts HIAmethod: WDBP | -0.199 | 0.275 | -0.726 | 0.468 |
| Easily confused with non-herbivore impacts Habitat: Dwarf shrub heath | 0.105 | 0.280 | 0.373 | 0.710 |
| Easily confused with non-herbivore impacts Habitat: Tussock grassland | -0.159 | 0.294 | -0.540 | 0.589 |
There were strong correlations between the different evaluation categories assigned to indicators by stakeholders (Figure 3; Table 2). If stakeholders viewed an indicator as frequently recorded, then the same indicator was viewed as useful and informative as evident by a significant and positive correlation between the proportion of stakeholders assigning frequency of use and usefulness and informative to an indicator (Figure 3a: Table 2). Unsurprisingly, indicators that were frequently recorded were also not recorded rarely (Figure 3b; Table 2) and rarely recorded indicators were viewed as less useful and informative to assess herbivore impacts (Figure 3c; Table 2). There was no significant correlation for indicators being viewed as easily confused with non-herbivore impacts with any other evaluation category (Figure 3d; Table 2; other correlations not shown). If an indicator was viewed as useful/informative or frequently recorded it was significantly and positively correlated with the number of times that indicator was shared across HIA methods (see above cross-tabulation of indicators) (Figure 3e useful / informative correlation only; Table 2). Therefore, the most useful and informative (and most frequently used) indicators were the ones most likely to be found in several, or all, of the existing HIA methods.
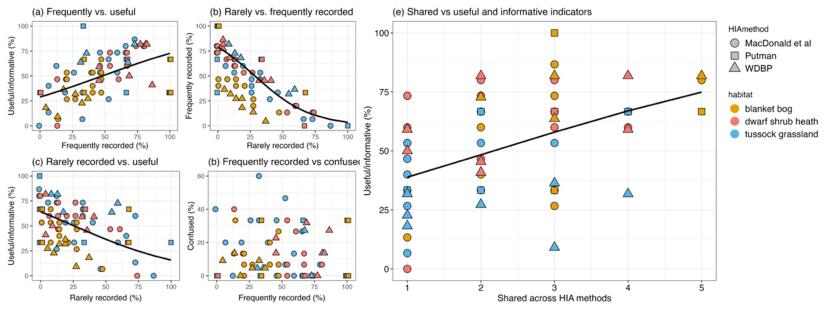
Figure 3. Proportion of response per indicator in relation to evaluation categories; (a) relationship between frequently recorded and useful/informative indicators, (b) relationship between rarely recorded and frequently recorded indicators,
Click for a full description
(c) relationship between rarely recorded indicators, (d) relationship between frequently recorded and easily confused indicators, and (e) relationship between shared indicators across HIA methods and proportion of responses as useful/informative. 5 scatter graphs illustrating the survey results for correlations between frequency of use and reported value of usefulness/informativeness. A separate analysis of the indicators shared across methods is shown. the relationships and trends are discussed in the previous paragraphs.
| - | Coefficient estimate | Std. Error | z value | P-value |
|---|---|---|---|---|
| Useful/informative vs frequently recorded (Intercept) | -0.904 | 0.201 | -4.511 | <0.001 |
| Useful/informative vs frequently recorded Frequently record | 1.884 | 0.355 | 5.310 | <0.001 |
| Frequently recorded vs. rarely recorded (Intercept) | 1.324 | 0.163 | 8.131 | <0.001 |
| Frequently recorded vs. rarely recorded Rarely recorded | -4.639 | 0.499 | -9.298 | <0.001 |
| Useful/informative vs. rarely recorded (Intercept) | 0.581 | 0.134 | 4.330 | <0.001 |
| Useful/informative vs. rarely recorded Rarely recorded | -2.264 | 0.408 | -5.544 | <0.001 |
| Easily confused vs. frequently recorded (Intercept) | -1.680 | 0.240 | -6.990 | <0.001 |
| Easily confused vs. frequently recorded Frequently recorded | -0.712 | 0.393 | -1.812 | 0.07 |
| Shared indicators vs. useful/informative (Intercept) | -0.839 | 0.218 | -3.845 | <0.001 |
| Shared indicators vs. useful/informative Shared indicator | 0.386 | 0.089 | 4.360 | <0.001 |
| Shared indicators vs. frequently recorded (Intercept) | -0.721 | 0.279 | -2.584 | 0.009 |
| Shared indicators vs. frequently recorded Shared indicator | 0.402 | 0.113 | 3.549 | <0.001 |
Stakeholder workshop
The general points resulting from the stakeholder workshop were:
- There was agreement between stakeholders that HIA methods need to be robust and repeatable, whilst at the same time methodologies that will be widely used by practitioners are sufficiently simple for wide stakeholder uptake. However, several stakeholders thought these two aims could not be achieved in single HIA method for both professionals and practitioners.
- Amongst some stakeholders there was an openness to revising HIA methods, for instance, an acknowledgement that the WDBP method had not been revised for many years and this needed addressing.
- Although there was a willingness for some revisions, there were concerns about changing methods as these would not be compatible with previous surveys to assess change.
- Several participants noted a lack of rigorous testing of all HIA methods aside from some work on surveyor consistency. If a HIA method is required to inform deer management and enforce deer regulation greater testing would strengthen the validity of the approach, for example in-depth field testing with quantitative herbivore utilisation approaches; although stakeholders raised that the latter is time consuming and expensive.
- For HIA methods to be adopted by estate managers and deer stalkers requires ‘buy in’, a shared understanding of the objective of the HIA, use of language relevant to practitioners (i.e., use terms like impact rather than damage), and a sense of connection to data collection and analysis such as smart phone applications. Stakeholders raised the issue of a current mismatch in the language between proposed revised deer management legislation using terms such as deer damage compared to the assessment terminology of impact. Participants preferred retaining the current terminology of ‘impact’ as this is less subjective.
- There was no consensus on a sampling approach comparing fixed/non-fixed, marked/unmarked. It was noted that if stratifying by habitat, practitioners need GIS skills/local knowledge.
- There was a discussion around the idea of ‘habitat fluidity’ of having a HIA method without grouping by habitat type with the reason being open hill range vegetation is in a constant state of transition, for example between heathlands to grassland or dwarf shrub to woodland, with several states in between. Another argument for a non-habitat orientated HIA method was that deer stalkers and estate managers use the geography of deer movement (i.e., summer/winter hefting ground) rather than habitat types per se. There was disagreement on this topic of habitat fluidity because habitat types operationally give a defined plant community that differs in potential herbivore preference and impact, and dominant vegetation types provide a way to spatially scale up recorded impacts. Whilst a habitat-fluid method would be interesting to test, the consensus was to keep structuring HIAs around habitat type.
- Stakeholders noted that the Woodland HIA has been regularly updated over two decades in contrast to the open hill rangeland HIA, and this has been strongly driven by ecologist Helen Armstrong and funded by NatureScot, Forest Land-use Scotland and Scottish Forestry. This has allowed stronger stakeholder consensus on methodical approaches. In the Woodland HIA indicators have been refined based upon expert knowledge and interpretability of indicators refined through surveyor consistency tests (Armstrong, 2021). Although, like the open hill range HIA, there are no scientific publications supporting the Woodland HIA, and some stakeholders thought linking indicators / impact classes with detailed measures of herbivore impact would give stronger grounding for thresholds and the future prognosis of habitat condition following herbivory.
- Areas suggested for future development of open hill range HIA included: (1) skills and training to improve the reliability of HIA outcomes from designing surveys to data handling and analysis. Earlier funding for HIA training by NatureScot to DMGs had widespread uptake of over 40 DMGs (NatureScot, 2019); (2) regular updates to the open hill rangeland method; (3) a central accessible database for HIA data, although stakeholders did note a previous initiative to compile a deer management database led by NatureScot (formerly SNH) through Supporting Wide Area Range Management for Deer (SWARD) (NatureScot, 2019); (4) testing of different methods and surveyor variation, and (5) development of application for smart phones / tablets, to engage deer stalkers and estate managers, including aspects of sampling design, data input and processing, and data interpretation i.e., would give the impact class based on data input.
General principles of revising indicators and harmonising indicators were identified:
Accessible language for practitioners
Clear description of indicators to reduce variation in surveyor interpretation
Widen the number of impact classes (sensu MacDonald et al. method addendum (MacDonald, 2007) and Woodland HIA (Armstrong et al., 2023))
Inclusion of an impact class that is described as ‘no impact’ or ‘negligible impact’
Highlight scientific underpinning of indicators, particularly for the impact of herbivores in relation to sustaining a habitat type, habitat feature or specific plant species
Consideration of differential herbivore impacts on herbivore preferred and unpreferred species (stakeholders used terms of palatable and unpalatable species)
Harmonisation of indicators with the Woodland Herbivore Impact Assessment
Desire for more quantitative indicators, but keep measurement approach simple
Workshop indicators by habitat type
As part of the workshop, stakeholders discussed indicators and impact classes relating to three habitat types: blanket bogs, dwarf shrub heath and tussock grassland. Within each habitat type, stakeholders voted on the most useful/informative indicator and further described impact classes within those indicators. The exercise raised 14 alternative indicators not already existing in HIA methods for those habitats and gave insights into the required description indicators and impact classes. Below we list the indicators identified for each habitat type and notes on impact classes for indicators and votes in parenthesis.
Blanket Bog
Indicators
- Trampling / hoof prints in bare peat and vegetation and severity and extent of tracking by herbivores (12 votes)
- Assessment of browsing patterns and severity of browsing on Calluna vulgaris, Vaccinium myrtillus and Myrica gale bushes should be able to assess both current and longer-term trends in herbivore impacts. There was debate about excluding V. myrtillus as an indicator as it is not a common component of Scottish blanket bogs (10 votes)
- The grazing / browsing levels on less palatable species can be useful where impacts are relatively high – a palatability index of the most common plants in such habitats would be useful (9 votes)
- Extent and severity of trampling damage specifically on Sphagnum lawns and hummocks (8 votes)
- Dung counts in walked transects or plots can be relatively quick and useful data to collect to compare herbivore presence over time and identify the type of herbivore presence. Over the long-term higher dung counts could have ecological consequences, such as soil nutrient enrichment (1 vote)
Impact class
- Indicator: Trampling/hoof prints in bare peat and vegetation and severity and extent of tracking by herbivores.
Impact class: Add an Absent / No Impacts category, e.g. if areas fenced off or exceedingly low impacts are present. The other three levels of impacts described in MacDonald are OK as they are. - Indicator: Assessment of browsing patterns and severity of browsing on Calluna vulgaris and Vaccinium myrtillus bushes
Impact class: Could be changed from two classes in MacDonald to three classes. - Indicator: The grazing/browsing levels on less palatable species can be useful where impacts are relatively high.
Impact class: Maintain the two classes of MacDonald here but consider adding a palatability index of the most common plants to help the objectivity of assessing impact levels.
Dwarf shrub heath
Indicators
- Proportion of browsed dwarf shrub shoots across palatable classes (19 votes)
- From most palatable to least palatable – blaeberry (Vaccinium myrtillus) (most palatable) > heather (Calluna vulgaris) > cross-leaved heather (Erica tetralix )/ cowberry (Vaccinium vitis-idaea) > crowberry (Empetrum nigrum) (least palatable)
- Hierarchical monitoring of least palatable species first to see if any browsing
- Separate heather from blaeberry (Calluna vulgaris from Vaccinium myrtillus) and/or dropping blaeberry. Several argued this indicator should be split as heather is browsed by deer in winter, whereas blaeberry by herbivores (sheep, cattle, deer) in the summer. Some argued for an adaptive approach where blaeberry is a very minor understorey component to a heather-dominated canopy, this species should be dropped but assessed when an equal or greater component to heather cover.
- Proportion of browsed shoots should relate to percent utilisation and the percentage of annual production removed – and this links to what the habitat type can sustain
- Spatial extent of C. vulgaris needs to be accounted for in this indicator. If there is blanket cover of C. vulgaris across a wide area, impacts of a given density of deer are diluted. If C. vulgaris is sparse within the sward and represented only by a few stray stems here and there, then (whatever the density of deer) it will always return an apparently high impact because it is preferentially selected (this is also an issue with sparse C. vulgaris in Molinia caerulea dominated tussock grasslands)
2. Flowering and/or number of seed heads of heather – particularly measuring seed heads as a measure of survival of long-shoots after winter browsing (8 votes)
3. What to do about the trees? For example, dwarf shrub heath that is the understorey of birch trees (5 votes)
4. Trampling impact on bryophyte carpets (3 votes)
5. Tramping deer / sheep hoof prints (3 votes)
- Intersect transect method over larger area – walking track and monitor at random points
6. Hard fern browsing on leaves (2 votes)
- Not in current open hill range HIA, but links through to Woodland HIA
7. Growth-form of heather i.e. drumstick / topiary / carpet – this is a measure of longer-term herbivore impact (2 votes)
8. Juniper shrub browsing (1 vote)
- Not in current open hill range HIA, but links through to Woodland HIA
9. Flowering/fruiting of Eriophorum vaginatum – particularly summer when fruiting
- Better than E. angustifolium as an indicator (0 votes)
10. Grazing on the very palatable herb species that can come in if burning stops and grazing pressure is low e.g., Angelica, Grass of Parnassus, Valerian, Meadowsweet, Raspberry, Bramble, Globeflower etc. (0 votes)
Problematic indicators
- Vegetation/dwarf shrub heath height not informative
- Many reasons for differences in vegetation height
- Vegetation height is highly spatially variable even in a few centimetres of measurements
- Stem breakage – differs between heather of different heights
- Taller heather more likely to have visible stem breakage – some do not record stem breakage for shorter heather
- Colour of dwarf shrub heather
- Heather colouration is not necessary a herbivore impact, for instance colour varies seasonally but also linked to nutrient stress or waterlogging.
- Presence of spider webs
- This indicator was viewed as highly seasonal, more apparent in warmer months with spider activity rather early spring. Also, a rarely recorded indicator.
Impact class
- Proportion of browsed dwarf shrub shoots for each species palatability class:
- The measured indicator of proportion of shoots browsed should be matched by the percentage off-take by herbivores that related to thresholds for sustainable levels of herbivore off-take
- Utilisation thresholds of 33% / 33-66% / >66% indicate what is sustainable for heather
- Angus MacDonald provided different threshold levels for where the annual incremental growth was less than 4 cm/year. This distinction is important for greater nuance, where there is much slower growth than the same level of grazing may have a greater impact
- Levels of browsing varies by species
- What is the sensitivity of the 33% proportion of browsed shoot threshold?
- Judging between 30 and 40% is tricky
- How does this compare with the Woodland HIA with thresholds of No impact, <25% , 25-75% , 75-90% and >90% browsing damage on tree shoots
- WHIA thresholds have a larger middle section to remove ambiguity
2. Flowering / fruiting of heather – evidence of survival of long shoots/winter browsing. Impact classes: Use those from MacDonald et al.
3. What to do about trees? Impact classes: Match protocol with Woodland HIA
Tussock grasslands
Indicators
- Browsing of dwarf shrubs, recording each species separately (though not sure if all users could do this) (13 votes)
- Prescence, flowering and grazing of tall herbs (e.g., Meadowsweet [Filipendula ulmaria], Devil's bit scabious, [Succisa pratensis], wild angelica [Angelica sylvestris]) (11 votes)
- Browsing of Bog myrtle (Myrica gale) (7 votes)
- Grazing of mat grass (Nardus stricta) (least palatable grass where it grows) (4 votes)
- Level of browsing damage or presence of trees (3 votes)
- Grazing of purple moor grass (Molinia caerulea) flowers (2 votes)
- Grazing of tufted-hair grass (Deschampsia cespitosa) (1 votes)
- Grazing of rushes (Juncus spp.) (1 vote)
- Grazing of wood rush (Luzula sylvatica) leaves or flowers (1 vote)
- 10. Dominant species (maybe top three) to give context, or even full cover recording of all species (1 vote)
Impact class
- Browsing of dwarf shrubs
Impact class: Record all species from most preferred (Vaccinium myrtillus) to least preferred (Empetrum nigrum) if present at high enough density to give useful information (a couple of stems present would not be that useful, unless, as for the Woodland HIA, the amount of information collected was also asked for).
Two thoughts on scales
- Stick to current proportion of stems browsed 0-33%, 33-66% and 66-100%
- Acknowledged that this doesn’t cover the range adequately and should include very low and very high, e.g., 0-10%, 10-40%, 40-60%, 60-90%, 90-100%
- Tall herbs – presence / grazing / flowering.
Impact class: Use / modify the current indicator from the flush habitat
- Browsing of Myrica gale
Impact class: Copy other dwarf shrub impact classes
Smooth grassland
This habitat was not the subject of the questionnaire and was not discussed at the stakeholder meeting. Therefore, indicator selection and revisions are informed by literature and the expert knowledge of the project team.
Synthesis
Harmonisation of indicators into a revised HIA method
A core aim of this project was to produce a readily accessible document that guides practitioners on the various HIA methods available, highlighting compatibility and read-across between the results of the methods. The collective results from this project outlined above instead highlight difficulties in achieving comparability and read across between existing HIA methods, particularly with a lack of overlap of indicators between methods.
Amongst stakeholders there was no significant difference in the perceived usefulness of different HIA methods, however, there remains limited explicit testing of different HIA methods by the same surveyors and at the same site (except (MacDonald, 2010)). Individually HIA methods have been tested against fixed point quadrat methods and found to be strongly correlated with herbivore impacts methods for the MacDonald method (Moore et al., 2015, Moore et al., 2018) and Putman method (Thomas Logan unpublished data). At the same time, there seems to be a difference in herbivore impact outcomes between HIA methods, notably inconsistencies between the ’full’ MacDonald and its simpler version the WDBP (NatureScot, 2019).
Rather than outlining comparability between existing methods, we have sought to create a single revised HIA method drawing upon existing methods. HIA indicators have been selected across existing methods based on stakeholder survey and workshop, and cross referencing to wider literature and expert knowledge. In selecting indicators, we have adopted primarily a consensus approach. An alternative approach would be to evaluate reports and survey records in the consistency and correlation of indicators, as has previously be analysed for on the MacDonald et al. method for blanket bogs (Pakeman, 2009).
The stakeholder survey identified tussock grasslands as having the lowest confidence in indicators. In part this may be due to tussock grasslands in the MacDonald et al. method including a range of tussock grassland types with varying herbivore tolerances and responses encompassing mat grass (Nardus stricta), purple moor grass (Molinia caerulea) and tufted hair grass (Deschampsia cespitosa) grasslands. In our indicator selection, we have focused on indicators relevant to purple moor grass (Molinia caerulea) since this is the tussock grassland of interest in west coast Scotland and stakeholders raised as needing to be differentiated from wet dwarf shrub heath (which is currently not differentiated under the WDBP). However, we acknowledge that mat grass (Nardus stricta) would be another common tussock grassland that is widespread in the south and east of Scotland that would potentially require a separate set of habitat-specific indicators.
In the first round of indicator selection, we used results from the stakeholder survey and cross-tabulation of indicators. Indicators were first selected if there was >50% consensus on being useful/informative and shared by more than one HIA method. Indicators were rechecked to include those with >75% useful/informative percentage scores if used in only in one HIA method. Indicators were also selected if they were shared across 3 or more HIA methods. This resulted in selecting 33 indicators across four habitat types (30 distinct indicators): 12 indicators for blanket bog, 7 indicators for dwarf shrub heath, 5 indicators for tussock grassland, and 9 indicators for smooth grassland. This methodological approach did not exclude useful indicators that were potentially recorded rarely.
In the second round of indicator selection, we used new indicators identified during the stakeholder workshop. This resulted in an additional 14 indicators: 5 for dwarf shrub heath and 9 for tussock grassland. Finally, we reconsidered potentially relevant indicators important for changes in habitat condition not selected via the above methods. This resulted in 4 indicators being reconsidered for selection (one indicator for dwarf shrub heath and three for smooth grassland). In total, 51 indicators were considered for selection in a revised HIA method (Table 4).
| Index | Indicators | Habitat | Survey selected | Workshop selected | Guide selected | Reason for inclusion or omission in revised user guide |
|---|---|---|---|---|---|---|
| 1 | Abundance of hoof prints in bare peat | blanket bog | Y | Y | Y | Many peatland plant species have low preference by herbivores, and as such herbivore impacts tend to manifest through herbivore trampling and disturbance. We suggest including it and merging it with other trampling and disturbance indicators for blanket bogs. |
| 2 | Amount of herbivore dung | blanket bog | Y | Y | N | This is a measure of herbivore presence not of impact. We suggest not including this indicator. |
| 3 | Browsing of heather (Calluna vulgaris) | blanket bog | Y | Y | Y | Heather can be a dominant component on many blanket bog habitats and likely the main attraction to herbivore browsing. Selecting this indicator agrees with stakeholder principles of including herbivore preferred plant species. We suggest including it and aligning this browsing indicator of heather with thresholds used in other habitat types. |
| 4 | Abundance of heath rush (Juncus squarrosus) and its growth | blanket bog | Y | N | Y | J. squarrosus tolerates heavy grazing and is quickly outcompeted following herbivore exclusion. In the MacDonald et al. method the performance of J. squarrosus is used as an indicator of trends in grazing pressure and thus an indicator of historic or past grazing pressure. We recommend retaining this indicator. |
| 5 | Browsed shoots on bog myrtle (Myrica gale) | blanket bog | Y | Y | N | Bog myrtle can often be found in blanket bogs, but rarer above 300m. Bog myrtle is viewed as a moderately palatable species in the Woodland HIA (Armstrong et al., 2023). However, a review of HIA surveys on blanket bogs found browsing of Bog myrtle was rarely recorded by surveyors (Pakeman, 2009). We suggest omitting this indicator from the main method yet listing this as an indicator for surveyors to note if present. Field testing should include this indicator. * |
| 6 | Sheep, deer, cattle paths | blanket bog | Y | N | N | Herbivore disturbance is an important indicator in blanket bogs, but there are several disturbance indicators short-listed. We suggest merging this indicator with hoof prints in bare ground as a single indicator. |
| 7 | Browsing bearberry (Arctostaphylos uva-ursi), crowberry (Empetrum nigrum), cross leaved heather (Erica tetralix) or cowberry (Vaccinium vitis-idaea) | blanket bog | Y | Y | Y | Browsing of non-preferred of dwarf shrub species is a sign of heavy grazing in blanket bogs and other habitats. Selecting this indicator aligns stakeholder principles of recording browsing on unpreferred species. However, we note previously in MacDonald et al. this indicator may poorly correlate with other indicators in determining herbivore impact class outcomes (Pakeman, 2009). Field testing should also separate out unpreferred species as stakeholders noted that these species are likely to differ in potential herbivore preference. |
| 8 | Amount of bare ground | blanket bog | Y | N | N | This measure is similar to the abundance of hoof prints, tracks from herbivores, and trampling/ grazing pools of pool systems. Equally these features could be caused burning and /or erosion. We suggest omitting this indicator. |
| 9 | Trampling of Sphagnum moss hummocks and lawns | blanket bog | Y | Y | Y | We suggest including this indicator given consensus across survey and workshop. |
| 10 | Browsing dwarf birch (Betula nana) | blanket bog | Y | N | N | A review of HIA surveys found browsing of Betula nana was recorded in less than 0.1 % of records by surveyors and this indicator was poorly correlated with herbivore impact outcomes (Pakeman, 2009). We suggest omitting this indicator from the main HIA suite of indicators. As this indicator may be useful, we suggest listing this as an indicator for surveyors to note if present and including it in field testing.* |
| 11 | Trampling and grazing of pool systems and water tracks | blanket bog | Y | N | N | This indicator is similar to the abundance of hoof prints, tracks from herbivores, and bare ground. We suggest omitting this indicator. |
| 12 | Flowering of cotton grasses (Eriophorum spp.) | blanket bog | Y | N | N | A review of HIA surveys found this indicator poorly correlated with the overall HIA score (Pakeman, 2009). We suggest omitting this indicator. |
| 13 | Browsing of heather (Calluna vulgaris) and/or blaeberry (Vaccinium myrtillus) | dwarf shrub heath | Y | Y | Y | Heather and blaeberry are the dominant plant species in dwarf shrub heaths and subject and viewed as preferred species by herbivores during different seasons of the year. Selecting this indicator also agrees with stakeholder principles of including plant species preferred by herbivores. However, some stakeholders strongly recommended splitting heather that is viewed as less palatable and grazed by deer in winter compared to blaeberry that is more palatable and grazed in the summer. There were also concerns raised of accounting for the spatial coverage of heather than modulates the herbivore impact. We suggest including this indicator, but field testing a separate assessment of dwarf shrub species. |
| 14 | Amount of herbivore dung | dwarf shrub heath | Y | N | N | This is an indicator of herbivore presence not of impact. We suggest not including this indicator. |
| 15 | Amount of bare ground | dwarf shrub heath | Y | Y | Y | Including hoof prints/trampling/tracks in this indicator will reflects disturbance by herbivores and likely correlates (negatively) with litter accumulation. However, surveyors should not any recent burning. We suggest including this indicator with clarification to the description. |
| 16 | Browsing bearberry (Arctostaphylos uva-ursi), crowberry (Empetrum nigrum), cross leaved heather (Erica tetralix) or cowberry (Vaccinium vitis-idaea) | dwarf shrub heath | Y | Y | Y | Browsing of non-preferred dwarf shrub species is a sign of heavy grazing pressure. Selecting this indicator aligns stakeholder principles of using unpreferred species |
| 17 | Browsing of older woody shoot material from heather (Calluna vulgaris) and/or blaeberry (Vaccinium myrtillus) | dwarf shrub heath | Y | N | N | This indicator is similar to other indicators of browsing on heather. We suggest omitting this indicator. |
| 18 | Summer browsing of heather (Calluna vulgaris) | dwarf shrub heath | Y | N | N | This indicator is similar to other indicators of browsing on heather. We suggest omitting this indicator. |
| 19 | Flowering (or fruit) on heather (Calluna vulgaris) and/or blaeberry (Vaccinium myrtillus) | dwarf shrub heath | Y | Y | Y | Heather and blaeberry are dominant species in dwarf shrub heath. There is a known trade-off between regrowth following grazing and reproductive output. However, some stakeholders recommend splitting these species. We suggest including this indicator. |
| 20 | Growth-forms of heather (Calluna vulgaris) including "drumstick", "topiary" or "carpet" grazing induced growth forms | dwarf shrub heath | Y | Y | Y | Changes in dwarf shrub structure is a known response to high herbivore pressure as a long-term impact. Different methods have used this indicator differently. Across impact classes, MacDonald used the spatial extent of these features whereas Putman differentiated different growth form features into impact classes. We suggest including this indicator and, also, clarifying the impact classes. |
| 21 | Stem breaking due to large herbivore trampling (check hoof prints) | dwarf shrub heath | Y | N | N | Whilst identified as useful in the survey, this indicator was viewed as problematic in the stakeholder workshop because stem breakage depends on heather height. This indicator could be recorded when applicable if heather is of a certain height where breakage is visible. We suggest omitting this indicator from the main method, but fielding testing this indicator and listing this as an indicator for surveyors to note if present.* |
| 34 | Collective abundance of non-planted, naturally colonising tree seedlings and saplings | dwarf shrub heath | N | Y | Y | Natural tree colonisation is part of a changing Scottish open hill range landscape. Following stakeholder workshop principles, this indicator would be a point of connection with the woodland HIA. This would be a long-term indicator of change, however, browsing damage of trees would represent a current measure of herbivore impact and a stronger connection to the Woodland HIA. We suggest including this indicator and field testing colonisation versus browsing damage. |
| 35 | Trampling impact on bryophyte carpet | dwarf shrub heath | N | Y | N | Whilst the extent and luxuriance of feather mosses and Sphagnum is an indicator is referred to in the MacDonald method, recording trampling damage of bryophytes is a new indicator for dwarf shrub heath. As several stakeholders did not view that bryophytes were important indicator in dwarf shrub heaths in the online survey we suggest omitting this indicator. |
| 36 | Hard fern (Blechnum spicant) browsing on leaves | dwarf shrub heath | N | Y | N | Browsing of hard fern was suggested as an indicator that could link to the Woodland HIA. In the Woodland HIA has Hard fern as a moderately palatable species and an easy indicator to assess. However, we would envision this indicator to be a rarely recorded indicator in many dwarf shrub heaths and suggest the exclusion as main indicator, but one for surveyors to note during field testing*. |
| 37 | Juniper (Juniperus communis) shrub browsing | dwarf shrub heath | N | Y | N | Juniper is present in drier dwarf shrub heaths in North-east Scotland, but we would envision browsing of Juniper to be a rarely recorded indicator in many dwarf shrub heaths and suggest the exclusion of this indicator. |
| 38 | Flowering of Cotton grasses (Eriophorum spp.) | dwarf shrub heath | N | Y | N | This indicator is rarely recorded in blanket bogs, and we would expect this to be similar, or even less commonly recorded, for dwarf shrub heath. We suggest omitting this indicator. |
| 39 | Extent of grass intrusion into heather (Calluna vulgaris) [as an indicator of past grazing history] | dwarf shrub heath | N† | N | Y | An indicator from the Putman method. This indicator is a key for determining whether dwarf shrub heath is transitioning into grassland and vice versa if there is sufficient dwarf shrub individuals and seed source. This is an indicator of past herbivore pressure, and we suggest including it in a revised impact assessment. |
| 22 | Amount of bare ground | tussock grassland | Y | N | Y | This indicator reflects disturbance by herbivores in Molinia-dominated tussock grassland. This indicator likely correlates with plant litter depth. We suggest including this indicator. |
| 23 | Signs of grazing on mat-grass (Nardus stricta) tussocks when sheep/deer principal grazers | tussock grassland | Y | Y | N | This indicator is specific to Nardus strica-tussock grassland and would not be found in purple moor Molinia-dominated tussock grasslands. Our focus is on Molinia-dominated tussock grasslands, but acknowledge stakeholders viewed Nardus strica tussock grasslands cover large parts of Scottish upland and merit a separate set of indicators. We suggest omitting this indicator. |
| 24 | Signs of grazing of less palatable species other than tussock formers, e.g., rush (Juncus spp.), thistle (Cirsium spp.), heath bedstraw (Galium saxatile), tormentil (Potentilla erecta) and mosses | tussock grassland | Y | N | N | These species form a minor component of Molinia-dominated tussock grassland biomass. Further, this indicator is technical and requires expert knowledge on plant species. However, as this indicator is rarely recorded, it may be useful on rare occasions, so we list this indicator as one for surveyors to note if present.* |
| 25 | Accumulation of dead plant litter | tussock grassland | Y | N | Y | For Molina-dominated tussock grasslands indicator is a quantitative indicator with research support under differing grazing pressures (Todd et al., 2000). However, there are stakeholder concerns that this indicator will vary by season as Molinia is deciduous with larger litter beds in the winter. We suggest including this indicator but field testing the sensitivity of the timing of this indicator. |
| 26 | Flowering of associated herbs in inter-tussock vegetation (June - August) | tussock grassland | Y | N | N | Whilst viewed as useful, this indicator was identified as rarely recorded. We suggest omitting this indicator. |
| 40 | Browsing of heather (Calluna vulgaris) and/or blaeberry (Vaccinium myrtillus) | tussock grassland | - | Y | Y | Heather and blaeberry are species that will be preferentially browsed in Molinia-dominated tussock swards and are likely a useful indicator. Currently, browsing of heather/blaeberry are not in tussock grassland methods, except the cover of heather in MacDonald et al. method. This indicator aligns with other habitats and aligns with stakeholder principles of including herbivore preferred plant species. However, in tussock grasslands dwarf shrubs can be infrequent. We include this indicator with caution that it would need adequate field testing in tussock-dominated grasslands. |
| 41 | Prescence, flowering and grazing of tall herbs (e.g., Meadowsweet [Filipendula ulmaria], Devil's bit scabious, [Succisa pratensis], wild angelica [Angelica sylvestris]) | tussock grassland | - | Y | N | These herb species are rare, and we would expect them to be rarely recorded except in more nutrient rich situations. Further these species require expert knowledge and likely to have poor uptake by deer stalkers. We suggest omitting this indicator from the main list of indicators. However, as this indicator may be useful although rare, we follow the principles of Putman method listing this as an indicator for surveyors to note if present.* |
| 42 | Browsed shoots on bog myrtle (Myrica gale) | tussock grassland | - | Y | Y | Bog myrtle is a common component of wet Molinia-dominated tussock grasslands and its inclusion diversifies dwarf-shrubs recorded in Molinia-dominated grasslands beyond an overreliance on heather (Calluna vulgaris). We suggest including this indicator. |
| 43 | Collective abundance non-planted, naturally colonising tree seedlings and saplings | tussock grassland | - | Y | Y | Natural tree colonisation is part of a changing Scottish open hill range landscape. This would be a long-term indicator of change, however, browsing damage of trees would represent a current measure of impact and a stronger connection to the Woodland HIA. We suggest inclusion of this indicator, but the indicator requires field testing in comparison to tree browsing damage. |
| 44 | Grazing of purple moor grass (Molinia caerulea) flowers | tussock grassland | - | Y | Y | This indicator has some research support due to the trade-off between regrowth following grazing and reproductive output. Further, this is a potential indicator that links to indicator of flowering of heather in dwarf shrub heath. We suggest including this indicator. |
| 45 | Grazing of tufted hair grass (Deschampsia cespitosa) | tussock grassland | - | Y | N | The focus of tussock grassland indicators will be on Molinia-dominated tussock grasslands, therefore tufted hair grass would be a minor component |
| 46 | Grazing of rush species (Juncus spp.) | tussock grassland | - | Y | N | We envision rush species to be a rare component of most Molinia-dominated tussock grassland. We suggest omitting this indicator. |
| 47 | Grazing of wood rush (Luzula sylvatica) leaves or flowers | tussock grassland | - | Y | N | This indicator would link to the Woodland HIA, however, we envision that this indicator is a rare component of most Molinia-dominated tussock grasslands. |
| 48 | Dominant species (maybe top three) to give context, or even full cover recording of all species | tussock grassland | - | Y | N | This indicator is likely very context dependent and challenging to compare across sites. We suggest omitting this indicator. |
| 27 | Signs of grazing on leaves of palatable species (collectively) Agrostis canina, Festuca ovina, and F. vivipara | smooth grassland | Y | - | Y | Species in this indicator form most of the biomass of the sward and are the focus of much of the grazing in this habitat. Although specific identification of species may require some expert knowledge. We suggest inclusion of this indicator. |
| 28 | Sward height and texture | smooth grassland | Y | - | Y | Sward height and texture are attractive indicators. The intermediate disturbance hypothesis (Connell and Slatyer, 1977) and the general level of evidence that grazing promotes diversity at intermediate levels of grazing in non-arid areas with a long history of grazing (Milchunas et al., 1988) would argue for impact being lowest at intermediate levels of impact. However, information on where to set the height thresholds is conflicting and requires amending. We suggest inclusion of this indicator but field assessment of thresholds. |
| 29 | Amount of bare ground | smooth grassland | Y | - | Y | This indicator reflects disturbance by herbivores and aligns with the indicator in other habitat types. In smooth grassland bare ground is more likely to be due to herbivores only as opposed to being confused with burning in other habitat types. We suggest including this indicator. |
| 30 | Cover and frequency of small, rosette-forming, creeping or mat-forming herbs (e.g., Bellis perennis, Galium saxatile, Helianthemum nummularium, Minuartia sedoides, Polygala serpyllifolia, Potentilla erecta, Saxifraga oppositifolia, Sibbaldia procumens, Silene acaulis, Thymus polytrichus, Viola palustris) or dwarfed plants of taller growing species | smooth grassland | Y | - | N | This list is perhaps an unnatural grouping of species. Data that was used in developing [29] shows that Bellis perennis is a feature of more heavily grazed situations whereas Potentilla erecta and, possibly, Viola palustris are more frequent where there is less grazing. Galium saxatile is less affected by grazing and in different experiments was promoted by different levels of grazing. Polygala serpyllifolia was found at highest cover at intermediate levels of grazing in the one experiment it was present at.The other species in this list were not present in that dataset. We recommend that this indicator be either removed or reassessed by bringing evidence or expert judgement together to review the future form it could take. |
| 31 | Cover of mosses, particularly "feather" mosses such as Rhytidiadelphus squarrosus, Pleurozium schreberi, Pseudoscleropodium purum, Hypnum cupressiforme and Hylocomium splendens (Ctenidum molluscum may be abundant in lime rich situations) | smooth grassland | Y | - | N | As for the vascular plants mentioned in the previous indicator, this may not be a useful grouping of species. Analysis of the data used in [29] indicates that the behaviour of Hylocomnium splendens in the one experiment it was present in was not obviously controlled by the level of grazing, Hypnum jutlandicum was associated with grazed treatments in one experiment but was unaffected by grazing in another. Pleurozium schreberi was not linked to grazing in one experiment but declined at high levels of grazing in another. Similarly, Psuedoschleropodium purum was found at highest cover in the ungrazed plots in the one experiment it was present in. Rhytidiadelphus squarrossus was also inconsistent in behaviour between experiments, promoted by grazing in one experiment, but promoted by reduced grazing in the other it occurred in. We recommend that this indicator be removed or revised in line with data or expert opinion. |
| 32 | Flowering of grasses and forbs other than very small, creeping or cushion forming species, in which the flowers are carried at heights of < 3 cm, or less palatable species | smooth grassland | Y | - | Y | This is a straightforward indicator, but there is no information on how well this indicator correlates with other indicators for this habitat.
|
| 33 | Seedlings and saplings of trees and shrubs > 5 cm | smooth grassland | Y | - | Y | We suggest retention this indicator as point of connection with the Woodland HIA. This indicator also connects to addition in dwarf shrub heath and tussock grasslands. However, this is a measure of past grazing pressure and would need field testing in comparison to recording browsing damage on trees of potential different herbivore preference. |
| 49 | Uprooted bundle of grass tillers | smooth grassland | N‡ | - | Y | A high degree of tiller uprooting does suggest a high herbivore impact, but there is a need to check these thresholds against other indicators to assess if they are appropriate. There will also be seasonal issues with end of summer when growth will have replaced lost tillers, and previously uprooted tillers may have rotted or otherwise broken up. We suggest including this indicator, but it requires better field testing. |
| 50 | Signs of grazing of unpreferred species Alchemilla alpina, Juncus squarrosus, Nardus stricta, Prunella vulgaris, Sibbaldia procumbens or Thymus polytrichus | smooth grassland | N‡ | - | Y | This indicator does identify areas where grazing is high enough to force animals to consume less preferred species. Some of the indicators may not be identifiable by deer stalkers, although some are general. We suggest including this indicator. |
| 51 | Presence of "weedy" species such as creeping thistle (Cirsium arvense), soft rush (Juncus effusus), common ragwort (Senecio jacobaea) or chickweed (Stellaria media) in dense, extensive patches and weedy species as common daisy (Bellis perennis) and creeping buttercup (Ranunculus repens) | smooth grassland | N‡ | - | Y | These are easily recognisable species and indicate either substantial levels of past disturbance allowing establishment or high levels of nutrient input (Stellaria media) but require some expert knowledge. This indicator strongly aligns with Condition Site Monitoring and an indicator of historic impact. We suggest including this indicator. |
† For dwarf shrub heath grass intrusion was not selected in either online survey or stakeholder workshop but represents an indicator of transition of dwarf shrub heath to grassland following grazing. ‡Three indicators were selected for smooth grassland that were present in more than two HIA methods. Several indicators overlapped between HIA methods and CSM and we selected three of the simpler indicators that deer stalkers could apply.
*Five indicators were excluded that were viewed as useful by surveyors, but rarely recorded, two in blanket bog, two in dwarf shrub heath and the other in tussock grassland. On rare occasions these indicators may be useful, and we have listed them for surveyors to note in the user guide.
Statistical considerations
An individual survey at one point in time reveals important information about current levels of herbivore impact. However, much more information can be gained by analysing changes in impact through time.
Largely, analysis has focussed on the changing number of points within habitats that are classified in the different impact categories. Alternative approaches have turned the categories into a numeric scale, but this makes the considerable assumption that the scale is linear.
Herbivore Impact Assessments (HIA) generate ordinal data, categorical variables that have an order or hierarchy, i.e., from low to high herbivore impact. There are statistical methods that have been developed for ordinal data, so that changes through time can be assessed to see if they are robust. This is likely not necessary for assessing change through time for an individual land holding, but it would be best practice to use appropriate statistical methods for large scale comparisons. It is also useful to be able to assess change using data on individual indicators as well as on overall impact classes to better identify what is driving change.
Formal statistical analysis of ordinal data is not straightforward and may not be necessary at the level of a land holding. However, it would be useful to create guidelines for how to interpret data, in effect, providing guidance on whether a level of change for a given sampling intensity is likely to reflect real change or statistical noise. Larger-scale analyses would require more formal testing.
Stakeholder feedback
On 5th April 2025, the draft report, user guide and technical annex was shared with stakeholders who attended the workshop and Scientific Advisory Committee Deer Subgroup for NatureScot for feedback. A total of ten stakeholders reviewed the documents and provided feedback. We thank all stakeholders for their feedback. Feedback was used to revise and improve the body of text, nevertheless we summarise major concerns raised below:
- Does HIA need revising? Some stakeholders asked the question what evidence is there that existing HIA methods do not work? Stakeholders from the ecological consultancy community highlighted a lack of transparency from SNH / NatureScot and JHI of a comprehensive analysis showing issues with existing HIA methods. Going further, some stakeholders requested HIA should be assessed by an academic institution outside of Scotland to ensure full independence of any findings. In response to this point, NatureScot raised the tender for this project due to inconsistencies in HIA outcomes from using different HIA methods. Data analysis of inconsistencies in HIA methods was not part of this tender. We have recommended to NatureScot that issues of these inconsistencies due to HIA methods should be analysed and published to highlight the problem and ensure stakeholder support for revisions to existing HIA methods.
- A stronger distinction between what HIA methods achieve: some stakeholders stressed the point that HIA assesses the level of grazing / trampling, and not the impact of herbivores on the species composition or structure of the vegetation. The critique of this report was that a failure to understand this difference undermined the rigour in the whole approach to this study. We do not agree with this criticism as different indicators used in HIA method attempt to assess either or both grazing / trampling levels and vegetation impact.
- Differences between HIA user groups: some professional consultants raised concerns that they did not think it possible to obtain both a robust method for assessing herbivore impact and one that is easily accessible and used by stalkers and estate managements from the same method. Their justification being highly experienced ecologist are required to take account of many indicators and the environmental context to make an overall assessment of the levels of grazing / browsing or trampling and how these may result in change of the vegetation. Instead, practitioners have more experience and understanding of the behaviour of large animals, but usually less knowledge of vegetation dynamics and ecosystem processes. Several professional consultants believe a two-tiered approach would be required as a single method may not be adequate for all parties (consultants, estate managers, deer stalkers) surveying. Others raised issues more generally that different user groups have different agendas, and as a result produce consistently different results to suit respective aims. In the current form, the two-tiered HIA methods is contributing to inconsistent HIA outcomes. At present, we have devised a single method, and leaned more towards simplifying the method, this could be split in two, but with the need to ensure strong alignment between the assessments provided by the different HIA methods.
- Reductionist approach and dumbing down will reduce robustness: stakeholders raised concern on the focus of reducing indicators. They noted loss of potentially rare but useful indicators have been removed and note the value of species-specific indicators or grouping by palatability. Field testing could incorporate a wider suite of indicators found in Table 4 and compare this wider suite to a reduced subset.
- Spatial methods - walk-through, permanent plots and MLURI rapid assessment method: our recommendation of using fixed-point plot-based was strongly disagreed with by some stakeholders who would have preferred a walk-through method. Whilst a random walk-through method likely produces similar results to fixed-point sampling, there is the issue that the randomness brought in during the walk-through method reduces the power available to detect change compared to revisiting fixed points (Barker, 2001). We agree with the point of potential loss of time looking for marked fixed points and thus suggested the use of GPS devices to relocate previously sampled points. Some stakeholders raised the issue that the MLURI rapid assessment method was not shared with stakeholders, and they would like further consultation on this design.
- Terminology and use of the term ‘damage’: stakeholders said it was unclear from the report the role of HIA in NatureScot's regulatory decision making. Previously HIA assessments have been used to judge whether Section 7 agreements were working. However, on NatureScot’s website the terminology is stated as ‘damage’ to the Natural Heritage. Stakeholders point out that there seems to be no read-across of the use of ‘damage’ in proposed changes to HIA, and thus what then is the purpose of HIA? Is it the case that the workshop should have been focused on discussing Site Condition Monitoring and not HIA? We have outlined at the start of the report that NatureScot uses HIA in regulatory decision making. We have also highlighted as general feedback from the workshop that wording is important and current wording in legislation of ‘damage’ will be problematic for stakeholders and does not have read across of ‘impact’ used in HIA.
- ‘Danger’ of relying too heavily on measurements on heather (Calluna vulgaris) as an indicator. ‘Over-reliance’ on heather alone can be very misleading since browsing impact is heavily frequency-dependent. If there is a blanket of heather across a wide area, impacts of a given density of deer are diluted. If heather is sparse within the sward and represented only by a few stray stems here and there, then (whatever the density of deer) it will always return an apparently high impact because it is preferentially selected. We are aware of such heather-abundance deer-impact effects and highlighted them as consideration in field-testing.
- Tussock grasslands focused on purple moor grass (Molinia caerulea): several stakeholders raised concern on the focus on purple moor tussock grasslands on two grounds: (1) herbivore value and (2) omission of other tussock grasslands. On herbivore value, stakeholders viewed purple moor grass-dominated grasslands as a form of degraded wet heath or degraded blanket bog, thus the existence of this habitat is evidence itself of long-term high herbivore impact and of limited survey value and a better approach would be to look at historic increases in this habitat land cover. On the second, mat grass (Nardus stricta) tussock grasslands are widespread in south of Scotland, these grasslands can be an important grassland in protected areas and a habitat that may show quicker response to herbivore reduction/removal compared to purple moor grass-dominated grassland. The justification for our focus on purple moor grass-dominated tussock grassland is that it covers an extensive land area across the west and north of Scotland and currently is not covered in WDBP leading to it being grouped into either dwarf shrub heath or blanket bog and so contributing to inconsistencies in HIA outcomes. Further, the grouping of indicators for different tussock grasslands in MacDonald method are not universally shared due to different types of tussock grassland, which has in part reduced the usefulness of many of these indicators. If other tussock grasslands are of interest to HIA we suggest habitat-specific development of indicators, for instance for Nardus strica dominated tussock grasslands.
- Mixing of current and historic indicators: some stakeholders raised concern that selected indicators mix current and past / long-term herbivore impacts. These will need to be distinguished and potentially analysed separately as they provide different information about herbivore impacts.
NatureScot Scientific Advisory Committee (SAC) Deer Subgroup feedback
Feedback from the SAC Deer Subgroup was generally positive, particularly achieving the project in a short duration. Generally, feedback was the following:
- Questions around the processing and analysis of indicators, for example are indicators equally weighted? what to do with data? what ordinal analysis to apply? This was not part of the remit of this tender, but it will be integral to the next phase of field-testing.
- Aggregation versus separation of indicators: the committee recommended keeping indicators separate when analysing and minimising aggregation, because individual indicators could provide different sources of information on herbivore impact. This was based on committee members experience with reviewing indicator methodologies for windfarm impacts on seabirds.
- Improve the user-guide interface so that it could be clearly interpreted by a new user rather than someone familiar with the report and details in the annex. It was agreed further refinement of user-guide could wait until after field-testing.
Recommendations
We make the following recommendations for next steps in this process:
- There should be field-testing using the indicators suggested. Given that many of the indicators have thresholds that are not based on clear ecological evidence, such a test would include noting the raw data for each indicator to better revise the thresholds for each indicator. For instance, for browsing of heather, instead of recording which category browsing fell into at a point, recording the estimated level of browsing would allow for better comparison of thresholds between indicators. Correlation analysis of raw data would also identify indicators that were not behaving in the same way as other indicators.
- Field testing should also consider the wider breadth of indicators selected in this user guide. Several indicators have been dropped due to rarity of use but should still be considered in field testing. Stakeholders raised a number of issues around splitting or amending some indicators and split and/or amended versions should also be investigated during field testing.
- Field-testing could assess the consistency of recorders. Assuming that recorders see the same thing, then inconsistency would indicate different interpretations of the thresholds for the indicator. The language used in the descriptions could then be improved.
- Field-testing should include a range of likely users, from NatureScot staff, deer stalkers/estate managers and consultants, so that views on the operation of the consolidated methods is gathered from a diverse group of users.
- Desk-based testing is required to investigate whether sampling designs at different spatial scales can be amalgamated and produce consistent results, namely investigating sample selection of walk-through versus fixed point sampling designs and comparing sampling designs for smaller and larger estates.
- Field-testing should also consider user-friendly approaches to data recording and processing. For example, standardised templates for recording and excel templates with supporting formulae that allow easy analysis of collected data. Field-testing should integrate both assigned categories and raw data in analysis.
- On circulation of the report, user guide, and technical annex to the stakeholder community, several concerns were raised which we suggest NatureScot take on board. One of importance would be analysis and publication of the proportion or extent of inconsistencies of HIA outcomes from different HIA methods that formed the basis of this tender. Publication of such information would allow transparency of the issues underlying existing HIA and the need for revisions.
- After field-testing and a period of bedding-in of a refined HIA method several stakeholders expressed an ambition for the HIA method to be translated into a smartphone and tablet application. An App would support uptake by a diverse range of practitioners and would benefit deer stalkers and estate managers that collect, analyse and view data in real time and compare to previous survey results. We stress at the open-hill range HIA needs field testing and refinement, but an app would be an ambition to keep in mind for later development.
User guide
Introduction
The purpose of this Herbivore Impact Assessment (HIA) is to determine the impact of herbivores on open-hill ranges’ vegetation using features that have changed as a result of herbivore presence. The main herbivores of interest are deer, sheep, cattle and to a lesser extent smaller herbivores such as hares, rabbits and voles. As part of the HIA a surveyor records indicators, including evidence of grazing or browsing of vegetation, changes in plant growth-form and species composition, evidence of disturbance and trampling. For each indicator there are different severities of herbivore impact which are then assigned an impact class. This indicator method builds on previous HIA methods, including MacDonald et al. method (also referred previously as the Scottish Natural Heritage method) (MacDonald et al., 1998a, MacDonald et al., 1998b, MacDonald, 2007); Wild Deer Best Practice (WDBP) (Wild Deer Best Practice Guidance for Scotland, 2018), and the Putman method. The method has been designed for open hill rangeland habitats in Scotland, specifically blanket bogs, dwarf shrub heaths, tussock grasslands and smooth grasslands.
In support of this user guide, there is a technical annex that provides reasoning for the spatial design, habitat description and indicators selected.
Sampling design
For an entire estate or within-estate survey, it is recommended that the selection of sampling points be based on a grid intersect method. This sampling approach reduces bias (e.g., bias of sampling through accessibility along roads or paths) and ensures random selection of points when background knowledge of habitat type distribution is unknown. This can be done by overlaying an Ordnance Survey map or similar with a uniformly spaced grid to select sampling points at each grid intersect. The minimum number of survey points should ideally be above 30 – 50 points per habitat type to be statistically robust, but the exact number and density will depend on the area to be surveyed and cost and labour time. Software such GIS/qGIS software can be used to look at OS maps, an accompanying aerial photograph and overlaying grid lines. There are alternatives to GIS software which are freely available online such as Where's The Path 3 (example survey designs in Figure 4).
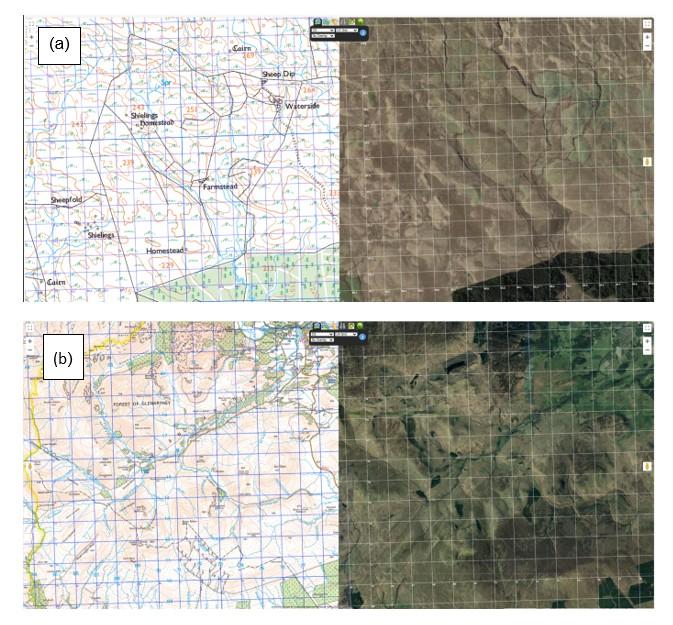
Figure 4. An example of a Where’s The Path 3 map and aerial photograph of (a) small area and (b) larger area.
Click for a full description
In the small area sampling can be 100m or 200m grid intersect might be chosen if the area within the main hill dyke is the area in question. In the larger area, wider spaced grid can be adopted, perhaps 1km square grid intersects.
Once a suitable number of grid points at an appropriate scale are selected, they can be listed into a survey recording form and/or downloaded into a GPS device as waypoints. The surveyor then visits all the grid intersect points by the most efficiently deemed route and records herbivore impact assessments at each point. This will require an initial assessment, once the location is reached, as to which habitat type the point should be assessed. There is no requirement to permanently mark plots as points can then be relocated using GPS. Where previous HIAs have already been carried out on smaller estates with known georeferenced locations we recommend that these locations are resurveyed to ensure consistency and detecting changes in herbivore impact.
At the sampling point, most indicators in the method should be assessed in a 2 m x 2 m quadrat area. Some indicators, such as tree seedling densities and/or herbivore impact on tree seedlings should be assessed in a wider 10 m radius area around the quadrat.
For large estates and entire Deer Management Group (DMG) surveys, size from around 20,000 hectares (200 km-sq.) to 200,000 hectares (2000 km-sq.), we recommend the grid-cell and walk-through Rapid Assessment of Grazing and Trampling Impact method developed by the Macaulay Land Use Research Institute. Sampling selection is similar to the grid intersect method but involves surveying randomly selected ¼-km2 squares (sample squares) stratified by management unit and vegetation type. Sample squares are based on the Ordnance Survey National Grid. The number of squares sampled for each vegetation category is a function of the total sample and the area of each vegetation category within each management unit. The total number of sample squares depends on the resource available, although minimum of 15% of the total area to be surveyed.
The surveyor gets to the square and walks through recording indicators for dominant habitat types found within the square to assign an impact class of habitats walking through the square. In order to simplify the assessment: all impact classes which covered less than 25% of a square are ignored; the highest impact class is recorded if this covered more than 50% of the square; and an intermediate impact class is recorded if the highest class covered less than 50%, but more than 25%. Where vegetation mosaics are recorded as a unit, the impact class on blanket bog is given precedence over impacts on dwarf-shrub heath, which in turn take precedence over impacts on other habitat types. The overall impact class for a vegetation type is calculated by taking the mean of the impact classes for the sample squares in which the vegetation type occurred.
Timing of Survey
It is important to decide the timing of the HIA survey. Herbivore impact indicators are based on vegetative features that will vary seasonally and depend on the dominant habitat type and herbivore of interest. For example, shrub and tree seedling browsing by deer will be strongest during the winter, in contrast, smooth grassland deer and sheep browsing impacts may be highest at the late summer. The timing of the survey should reflect the estate managers herbivore(s) of interest and dominant habitat type. For many estates interested in detecting deer browsing impacts we suggest April and early May to detect browsing overwinter before the new seasons’ growth masks the previous seasons impact.
Indicators
Below are Herbivore Impact Assessment indicators for four dominant open hill range land habitats. Each habitat indicator has a code (e.g., BB1) that corresponds to an evidence statement in the technical annex. In total, there are 26 indicators across habitat types: 5 for blanket bogs, 7 for dwarf shrub heath, 6 for tussock grassland and 8 for smooth grassland.
Blanket bog
Disturbance
| Main Indicator | Impact class |
|---|---|
| Conspicuous and extensive hoofprints and/or tracks | High |
| Patchy/occasional hoofprints present and/or tracks | Moderate |
| Rare examples of hoofprints and/or tracks | Low |
| Hoofprints and tracks absent | Negligible |
| Main Indicator | Impact class |
|---|---|
| Most Sphagnum broken by hoof prints | High |
| Patchy occurrence of Sphagnum broken by hoof prints | Moderate |
| Most Sphagnum surface intact | Low |
| No evidence of disturbance to Sphagnum | Negligible |
Browsing and grazing
| Main Indicator | Impact class |
|---|---|
| Extensive browsing, particularly of crowberry | High |
| Patchy/sparse | Moderate |
| Rare examples/inconspicuous | Low |
| None | Negligible |
| Main Indicator | Impact class |
|---|---|
| > 66% shoots browsed | High |
| 33-66% shoots browsed | Moderate |
| 5-33% shoots browsed | Low |
| < 5% shoots browsed | Negligible |
Species composition
| Main Indicator | Impact class |
|---|---|
| Juncus squarrosus conspicuous, frequent and competing vigorously | High |
| Juncus squarrosus conspicuous, patchy but overgrown | Moderate |
| Juncus squarrosus sparse and overgrown | Low |
| Juncus squarrosus rare to absent and overgrown | Negligible |
Other indicators to note for blanket bog:
(1) Prescence and browsing of dwarf birch (Betula nana); (2) Type of herbivore dung present (deer, sheep, cattle, hare); (3) Tree/shrub species and seedlings present.
Dwarf shrub heath
Disturbance
| Main Indicator | Impact class |
|---|---|
| Conspicuous and extensive hoofprints and/or tracks | High |
| Patchy/occasional hoofprints present and/or tracks | Medium |
| Rare examples of bare ground or hoof marks | Low |
| None | Negligible |
*Surveyors should note if areas have been subject to muirburn or wildfires
Browsing and grazing
| Main Indicator | Impact class |
|---|---|
| Extensive/conspicuous, particularly crowberry | High |
| Patchy/sparse | Moderate |
| Rare examples | Low |
| None | Negligible |
| Main Indicator | Impact class |
|---|---|
| > 66% shoots browsed | High |
| 33-66% shoots browsed | Moderate |
| 5-33% shoots browsed | Low |
| < 5% shoots browsed | Negligible |
| Main Indicator | Impact class |
|---|---|
| None | High |
| Rare examples/inconspicuous | Moderate |
| Sparse/patchy | Low |
| Abundant | Negligible |
| Main Indicator | Impact class |
|---|---|
| Frequent | High |
| Patchy/sparse | Medium |
| Rare examples/inconspicuous | Low |
| None | Negligible |
*Surveyors should note if areas have been subject to muirburn or wildfires, as this can form carpet growth-forms
Species composition
| Main Indicator | Impact class |
|---|---|
| Heather present as individual plants within tussock grassland or smooth grassland matrix | High |
| Heather patches show widespread to patchy grass/intrusion, i.e., ‘fingers’ of grass encroaching into dwarf shrub heath | Medium |
| Heather continuous cover with sparse grass intrusion | Low |
| Heather as continuous cover, or [where muirburn mosaic] continuous at least within heather patches | Negligible |
| Main Indicator | Impact class |
|---|---|
| 0 tree seedlings | High |
| 1-15 tree seedlings | Moderate |
| 15-30 tree seedlings | Low |
| >30 tree seedlings | Negligible |
Other indicators to note for dwarf shrub heath:
(1) browsing of bog myrtle (Myrica gale); (2) stem breakage of heather (Calluna vulgaris); (3) Type of herbivore dung present (deer, sheep, cattle, hare); (4) Muirburn/burning
Tussock grassland
Disturbance
| Conspicuous and extensive hoofprints and/or tracks | High |
|---|---|
| Patchy/occasional hoofprints present and/or tracks | Medium |
| Rare examples of hoof marks and/or tracks | Low |
| None | Negligible |
*Surveyors should note if areas have been subject to muirburn or wildfires
| < 1 cm plant litter | High |
|---|---|
| 1-3 cm plant litter | Moderate |
| 3- 6 cm plant litter | Low |
| > 6 cm plant litter | Negligible |
Browsing and grazing
| Extensive/conspicuous | High |
|---|---|
| Patchy/sparse | Moderate |
| Rare examples/inconspicuous | Low |
| None | Negligible |
| None | High |
|---|---|
| Rare examples/inconspicuous | Moderate |
| Patchy/sparse | Low |
| Abundant | Negligible |
| > 66% shoots browsed | High |
|---|---|
| 33-66% shoots browsed | Moderate |
| 5-33% shoots browsed | Low |
| < 5% shoots browsed | Negligible |
Species composition
| 0 tree seedlings | High |
|---|---|
| 1-15 tree seedlings | Moderate |
| 15-35 tree seedlings | Low |
| >35 tree seedlings | Negligible |
Other indicators to note for tussock grassland:
(1) Signs of grazing of less preferred species other than tussock formers, e.g., rush (Juncus spp.), thistle (Cirsium spp.), heath bedstraw (Galium saxatile), tormentil (Potentilla erecta) and mosses; (2) Presence, flowering and grazing of tall herbs (e.g., Meadowsweet [Filipendula ulmaria], Devil's bit scabious, [Succisa pratensis], wild angelica [Angelica sylvestris]); (3) Hard fern (Blechnum spicant) browsing on leaves; (4) spatial extent of heather (continuous, patchy, sparse); (5) Type of herbivore dung present (deer, sheep, cattle, hare); (6) Muirburn/burning
Smooth grassland
Disturbance
| Main Indicator | Impact class |
|---|---|
| Conspicuous and extensive hoofprints and/or tracks | High |
| Patchy/occasional hoofprints present and/or tracks | Medium |
| Rare examples of hoof marks and/or tracks | Low |
| None | Negligible |
| Main Indicator | Impact class |
|---|---|
| Abundantly scattered uprooted grass tiller bundles over surface sward | High |
| Patchy/sparse uprooted grass tiller bundles | Moderate |
| Rare examples of uprooted grass tiller bundles | Low |
| No uprooted grass tiller bundles | Negligible |
Browsing and grazing
| Main Indicator | Impact class |
|---|---|
| Very short, even, very smooth sward, distinctly green < 4 cm | High |
| Short but somewhat uneven sward, some scattered tufts (4 to 8 cm) | Moderate |
| Longer, patchily uneven sward, rough surfaced from well-developed plant clumps and tufts, pale straw-coloured tinge to sward in winter due to plant litter (> 8 cm) | Low |
| Grass tussocks or tufts are fully developed and long tillers/internodes | Negligible |
| Main Indicator | Impact class |
|---|---|
| Greater than 10% leaves cropped, edges of Nardus tussock with some leaves grazed | High |
| Less than 10% leaves grazed and only margins of patches, isolated leaves, Nardus largely ungrazed | Moderate |
| Very few leaves grazed | Low |
| No evidence of grazing | Negligible |
| Main Indicator | Impact class |
|---|---|
| Greater than 75% leaves grazed | High |
| Between 25% - 75% leaves grazed | Moderate |
| Less than 5- 25% leaves grazed | Low |
| < 5% leaves grazing | Negligible |
| Main Indicator | Impact class |
|---|---|
| Sparse or no flowers | High |
| Scattered but noticeable flowering shoots | Moderate |
| Moderately abundant flowering (collectively) | Low |
| Abundant flowering (collectively) | Negligible |
Species composition
| 0 tree seedlings | High |
|---|---|
| 1-15 tree seedlings | Moderate |
| 15-35 tree seedlings | Low |
| >35 tree seedlings | Negligible |
| Greater than 1% cover of other species and/or greater 10% cover J. effusus | High |
|---|---|
| Less than 1% cover of other species and/or less than 10% cover J. effusus | Moderate |
| Other species not present but >0% and/or < 1 % cover J. effusus | Low |
| Not present | Negligible |
Other indicators to note for smooth grassland:
(1) Type of herbivore dung present (deer, sheep, cattle, hare)
References
ALONSO, I. & HARTLEY, S. E. 1998. Effects of nutrient supply, light availability and herbivory on the growth of heather and three competing grass species. Plant Ecology, 137, 203-212.
ARMSTRONG, H., BLACK, B., HOLL, K. & THOMPSON, R. 2023. The Woodland Herbivore Impact Assessment Guide Version 5th April 2023.
ARMSTRONG, H. M. 2021. Observer variation in the use of a method of assessing current herbivore impacts in woodland. NatureScot Research Report No.1190.
BARKER, P. 2001. A technical manual for vegetation monitoring, Citeseer.
BARTHRAM, G. 1986. Experimental techniques: the HFRO sward stick. In:Hill Farming Organisation Biennial Report 1984-5. Edinburgh, UK.
BATES, D., MäCHLER, M., BOLKER, B. & WALKER, S. 2015. Fitting Linear mixed effects models using lme4. Journal of Statistical Software, 67.
CHAPMAN, S. J., BELL, J., DONNELLY, D. & LILLY, A. 2009. Carbon stocks in Scottish peatlands. Soil Use and Management, 25, 105-112.
CITY ST GEORGE'S UNIVERSITY OF LONDON. 2025. Small group teaching activities [Online] [Accessed 31/3/2025].
CONNELL, J. H. & SLATYER, R. O. 1977. Mechanisms of Succession in Natural Communities and Their Role in Community Stability and Organization. The American Naturalist, 111, 1119-1144.
CRIBARI-NETO, F. & ZEILEIS, A. 2010. Beta Regression in R. Journal of Statistical Software, 34, 1 - 24.
GRANT, S. A., TORVELL, L., COMMON, T. G., SIM, E. M. & SMALL, J. L. 1996. Controlled Grazing Studies on Molinia Grassland: Effects of Different Seasonal Patterns and Levels of Defoliation on Molinia growth and Responses of Swards to Controlled Grazing by cattle. Journal of Applied Ecology, 33, 1267-1280.
GULLETT, P. R., LESLIE, C., MASON, R., RATCLIFFE, P., SARGENT, I., BECK, A., CAMERON, T., COWIE, N. R., HETHERINGTON, D., MACDONELL, T., MOAT, T., MOORE, P., TEUTEN, E. & HANCOCK, M. H. 2023. Woodland expansion in the presence of deer: 30 years of evidence from the Cairngorms Connect landscape restoration partnership. Journal of Applied Ecology, 60, 2298-2308.
HESTER, A. J. & BAILLIE, G. J. 1998. Spatial and Temporal Patterns of Heather Use by Sheep and Red deer Within Natural Heather/Grass Mosaics. Journal of Applied Ecology, 35, 772-784.
HULME, P. D., PAKEMAN, R. J., TORVELL, L., FISHER, J. M. & GORDON, I. J. 1999. The effects of controlled sheep grazing on the dynamics of upland Agrostis–Festuca grassland. Journal of Applied Ecology, 36, 886-900.
JOINT NATURE CONSERVATION COMMITTEE 2009. Common Standards Monitoring Guidance for Upland habitats, Peterborough, UK, JNCC.
KUZNETSOVA, A., BROCKHOFF, P. B. & CHRISTENSEN, R. H. B. 2017. lmerTest Package: Tests in Linear Mixed Effects Models. Journal of Statistical Software, 82, 1 - 26.
MACDONALD, A., STEVENS, P., ARMSTRONG, H., IMMIRZI, P. & REYNOLDS, P. 1998a. A Guide to Upland Habitats Surveying Land Management Impacts. Volume 2: The Field Guide, Edinburgh, UK, Scottish Natural Hertiage.
MACDONALD, A., STEVENS, P., IMMIRZI, P. & REYNOLDS, P. 1998b. A Guide to Upland Habitats; Surveying Land Management Impacts Volume 1: Background Information and Guidance for Surveyors, Edinburgh, UK, Scottish Natural Heritage.
MACDONALD, A. J. 2007. Addendum to The Guide to Upland Habitats: Surveying Land Management Impacts. Battleby, Perth, Scotland.
MACDONALD, A. J. 2010. Testing the reliability of assessment of land management impacts on Scottish upland vegetation. Plant Ecology & Diversity, 3, 301-312.
MAYNE, C. 2021. Deer Management and Habitat Impact Assessment; review of the data.
MCCONNELL ASSOCIATES 2000. Testing the Consistency of Field Assessments Made Using SNH Field Guide to Upland Habitats.
MILCHUNAS, D. G., SALA, O. E. & LAUENROTH, W. K. 1988. A Generalized Model of the Effects of Grazing by Large Herbivores on Grassland Community Structure. The American Naturalist, 132, 87-106.
MOORE, E. K., BRITTON, A. J., IASON, G., PEMBERTON, J. & PAKEMAN, R. J. 2015. Landscape-scale vegetation patterns influence small-scale grazing impacts. Biological Conservation, 192, 218-225.
MOORE, E. K., IASON, G. R., PEMBERTON, J. M., BRYCE, J., DAYTON, N., BRITTON, A. J. & PAKEMAN, R. J. 2018. Habitat impact assessment detects spatially driven patterns of grazing impacts in habitat mosaics but overestimates damage. Journal for Nature Conservation, 45, 20-29.
MORRIS, J. M. 2006. An assessment and evaluation of herbivore impacts on upland habitats in the Creag Meagaidh Special Area of Conservation. Scottish Natural Heritage Commissioned Report No. 159 (ROAME No. F02AC202/3).
NATURESCOT 2019. Review of SNH’s Responsibilities for Managing Deer Data.
PAKEMAN, R. 2009. Are patterns of herbivore impacts on blanket bog habitats predictable? An analysis of impact data from recent surveys. Inverness, Scotland.
PAKEMAN, R. J. 2004. Consistency of plant species and trait responses to grazing along a productivity gradient: a multi-site analysis. Journal of Ecology, 92, 893-905.
PAKEMAN, R. J., FIELDING, D. A., EVERTS, L. & LITTLEWOOD, N. A. 2019. Long-term impacts of changed grazing regimes on the vegetation of heterogeneous upland grasslands. Journal of Applied Ecology, 56, 1794-1805.
PAKEMAN, R. J. & NOLAN, A. J. 2009. Setting sustainable grazing levels for heather moorland: a multi-site analysis. Journal of Applied Ecology, 46, 363-368.
R CORE TEAM 2024. R: A language and environment for statistical computing. Vienna, Austria: R Foundation for Statistical Computing.
RAE, S. 1995. Cairngorms moorland and montane assessment survey and condition assessment - Carn Dearg, Geldie and Braemar survey areas. Contract report.
RAE, S. 1996. Cairngorms project: Continuation of moorland montane habitat survey and condition assessment - South Geldie area. Contract report.
SCOTT, D., WELCH, D., THURLOW, M. & ELSTON, D. A. 2000. Regeneration of Pinus sylvestris in a natural pinewood in NE Scotland following reduction in grazing by Cervus elaphus. Forest Ecology and Management, 130, 199-211.
SCOTTISH FORESTRY. 2024. Protecting and managing soil in forests [Online] [Accessed 5/4/2025].
SCOTTISH GOV 2024. Wildlife Management and Muirburn (Scotland) Act. Scottish Parliament
THE DEER INITIATIVE. 2024. Woodland Impact Survey [Online]. Available
THORNTON, B. & BAUSENWEIN, U. 2000. Seasonal protease activity in storage tissue of the deciduous grass Molinia caerulea. New Phytologist, 146, 75-81.
TODD, PHILLIPS, PUTWAIN & MARRS 2000. Control of Molinia caerulea on moorland. Grass and Forage Science, 55, 181-191.
WATTS, S. 2020. Revegetation of upland eroded bare peat using heather brash and geotextiles in the presence and absence of grazing. Mires and Peat, 26.
WELCH, D. 1984. Studies in the Grazing of Heather Moorland in North-East Scotland. I. Site Descriptions and Patterns of Utilization. Journal of Applied Ecology, 21, 179-195.
WELCH, D. 1998. Response of bilberry Vaccinium myrtillus L. stands in the Derbyshire Peak District to sheep grazing, and implications for moorland conservation. Biological Conservation, 83, 155-164.
WELCH, D., SCOTT, D., MOSS, R. & BAYFIELD, N. 1994. Ecology of blaeberry and its management in British moorlands, Institute of Terrestrial Ecology.
WILD DEER BEST PRACTICE GUIDANCE FOR SCOTLAND. 2018. Habitat Impacts [Online]. Available [Accessed]
Technical Annex
Sampling design and Spatial scale
There are differences in the spatial sampling procedures used by different HIA methods. They can be divided into methods used for relatively small areas, such as smaller estates (or specific parts of larger estates), and those used for very extensive areas of the uplands.
Smaller estate surveys
Pre-MacDonald and early MacDonald et al. approaches to the spatial design of sampling methods: These assessed the spatial patterns and severity of herbivore impacts by mapping polygons of the same impact class across the area or categorising impact levels for raster feature (e.g., 1 km x 1 km grid square). Such approaches were time consuming and expensive to undertake.
Later MacDonald et al. approaches to the spatial design of sampling methods: Most impact surveys since the publication of MacDonald et al. have been based on more objective sampling methodologies included in the unpublished addendum [10]. Random sampling provides a robust, objectively justifiable method from which estimates of precision and cost can be calculated. The most important factor affecting the precision of results from random sampling is the absolute number of samples, rather than the proportion of the population, or ground, which is sampled. Stratification of sampling can be used to improve the precision of estimates by taking account of potentially important sources of variation, e.g., topography, vegetation type
Wild Deer Best Practice methodologies: The approach requires defining the boundaries of each habitat, selecting random points within each habitat area – as a minimum 30 – 50 points within each habitat area (equivalent to 2 to 3 plots per 100 ha). Putnam devised a method of determining the random locations in the field for WDBP HIAs by throwing a tennis ball over one’s shoulder at regular intervals throughout the area under inspection.
The Woodland Herbivore Impact Assessment methodologies: Assessment areas are defined by land use type and/or land management type and/or habitat type depending on the nature of the site and the objectives of management. We suggest ten inspection stops to gain a good idea of the overall impact in an assessment area even if the impacts vary between stops, regardless of the size of the area under investigation. If impacts vary considerably between stops, or insufficient examples of indicators are found at the first ten stops, additional stops may be needed. The methodology doesn’t specifically state how the location of stops is determined. Stops do not need to be a set distance apart however they should be evenly spread out so that they provide good coverage of the area to be assessed. The stops may be, but do not have to be, at the same locations as those used for any previous assessment.
As there is no consensus on sampling approach, we have suggested a grid insect method principle to avoid bias in habitat sampling for smaller scale surveys.
Larger estate and Deer Management Group (DMG) scale surveys
The Macaulay Land Use Research Institute’s Rapid Assessment of Grazing and Trampling Impacts method: This method was developed specifically for cost-effective HIA over very extensive areas of upland vegetation. The method is intended to provide a baseline description of the main habitats in terms of the current impacts of grazing and trampling in relation to large herbivores, and information on the extent of the major vegetation types that are present. It also provides a means of extrapolating impact levels across the wider landscape. The method involves surveying randomly selected 0.5 km x 0.5 km squares that are stratified based on the management unit and vegetation type. The total sample is determined by the resources available for the fieldwork, but this provided an expected level of accuracy.
In the absence of an alternative and given that it is a robust statistically based approach, we suggest that the Macaulay HIA survey methodology, or a sampling approach adapted from it, be used for large-scale surveys.
Considerations of using plot and polygon recording methodologies for Habitat Impact Assessments
Pre-MacDonald and early MacDonald methods: Polygon mapping, analogous to vegetation mapping was originally used along with 0.5 km x 0.5 km square raster-based mapping which required impact surveys to be carried out across the full area under investigation.
Later MacDonald approaches to the spatial design of sampling methods: Sampling was generally based on pre-determined, random, point locations within mapped habitat polygons. Different approaches have been used in individual commissioned surveys as to whether point impact data only is reported, or the point data is averaged across a habitat polygon.
Wild Deer Best Practice methodologies: This method involves randomly selected points where permanent inspection plots are set up within each habitat area – as a minimum 30 – 50 points within each habitat area (equivalent to 2 to 3 plots per 100 ha).
The Woodland Herbivore Impact Assessment methodologies: Detailed guidelines exist for this method. It involves walking a route with pre-determined GPS marked locations where individual records are taken within a circular area of around 25m radius. The locations are not permanently marked but should be in approximately the same locations on each subsequent survey.
It is difficult to recommend ‘a one method fits all’ approach to this question as most surveys are likely to be driven by resource availability and once a system has been set-up, in any individual study, it will probably be most appropriate to carry on using that system in most circumstances. The advantages and disadvantages of different sampling approaches are summarised in Table 5. When setting up new small scale Herbivore Impact Assessment, we would recommend using non-permanently marked plots that are relocatable to within a few metres by modern GPS devices. We recommend that plots are large enough so that they are likely to be recording approximately the same area as previous surveys (e.g., 5 m x 5 m). For a large-scale survey, the Macaulay protocols, or an adaptation of them, would be more appropriate.
| Data collection method | Strengths | Weaknesses |
|---|---|---|
Walk over survey This method involves the surveyor determining the location of the inspection/sampling points within a sampling polygon at irregular intervals based on knowledge, judgement and expertise.
| The data is collected as the surveyor walks through the vegetation polygon and is not precisely georeferenced, although it can be, if deemed necessary. The process is quick as once the rough extent of the sample polygon has been ascertained. It involves walking across the area and recording the approximate percentage of impact classes. | Less statistically robust. Relies on a certain level of expertise and experience to be able to make such judgements quickly with a relatively high degree of confidence, particularly if impacts are patchy. Walk overs tend to follow tracks and areas of higher impacts as it is easy to gravitate towards these areas due to ease of walking. |
Permanent plots This method involves surveyors assessing impacts in various sizes of permanently marked and precisely relocatable plots as in Wild Deer Best Practice method. | The data is collected from the exact same vegetation plot every time a survey is carried out which reduces the spatial variability of records. | These are onerous to set up and can attract herbivores. It can take time to relocate plots. Using the exact same location for plots is likely to cause some trampling damage to the vegetation over the long term. |
Non-permanent plots relocated to within a few metres of the original This is basically the same as the previous method other than the plots being relocated by GPS to roughly the same location. | Significantly quicker than using permanent plots as relocation does not have to be very precise. No plot marking materials and procedures required. Has a similar advantage as permanent plots in consistency of sampling location through time, reducing variability and allowing the same previously generated random points to be used. | Relocation reliant on technology with some minor drift depending on accuracy of GPS devices, but approximate relocation will be quicker than searching for markers.
|
Habitat type definitions
We recommend following the habitat definitions described in MacDonald et al. method (MacDonald et al., 1998b). Below we outline additional considerations to those habitat definitions.
Blanket bog
Peatlands in Scotland are defined based on a thickness of > 50 cm peat depth following the Soil Survey Scotland (Chapman et al., 2009). Recent changes following the Wildlife Management and Muirburn (Scotland) Act (Scottish Gov, 2024) define peatlands at a shallower depth of 40 cm peat. Meanwhile, the threshold of > 50 cm peat thickness is still applied for forestry and planning guidelines in Scotland (Scottish Forestry, 2024). For the time being, we have defined blanket bogs as having a peat thickness of > 50 cm. In our habitat types we do not differentiate between dry dwarf shrub heath and wet dwarf shrub heath. Similar to recommendations in the Addendum of the MacDonald et method (MacDonald, 2007), we recommend that if the surveyor views a habitat as wet dwarf shrub heath with peat depth > 50 cm and blanket bog species are present (e.g., Sphagnum lawns), then they should apply the blanket bog indicators. We note that peat depth thresholds used to define blanket bogs may change to a shallower depth in time.
Dwarf Shrub heath
In the MacDonald et al. method wet heath was treated as either a form of dry dwarf shrub heath or blanket bog (MacDonald et al., 1998b). Dry dwarf shrub heath is generally dominated by heather (Calluna vulgaris) or blaeberry (Vaccinium myrtillus) whereas wet heath has significant contributions of cross-leaved heather (Erica tetralix) and deergrass (Trichophorum germanicum) but there are many instances where wet and dry dwarf shrub heath are undifferentiated based on plant species composition.
Deciding on whether to treat wet heath as blanket bog or dwarf shrub heath was explicitly addressed in the MacDonald et al. addendum (MacDonald, 2007). The guidance was that the surveyor decision should be based on a combination of peat depth and National Vegetation Classification (NVC) type. So peat depth greater than 50 cm and National Vegetation Classification types M15c, M15d, M17, M18, M19, M20 and M21 should be treated as blanket bog, M15b should be treated as blanket bog irrespective of peat depth (MacDonald, 2007). As regards to other HIA methods, the Putman method separates dry heath and wet heath, however, there is limited definition on how these habitat types are defined. In the WDBP wet heath is only mentioned under dwarf shrub heath guidance and is assumed to be surveyed as dry dwarf shrub heath. Recognising there can be species differences between dry and wet dwarf shrub heath, Pakeman & Nolan (2009) found no difference between dry dwarf shrub heath versus wet dwarf shrub heath in their response to herbivore utilisation with sites encompassing drier H12 and wetter M15 NVC types (Pakeman and Nolan, 2009).
Feedback during the stakeholder workshop was that dry dwarf shrub versus blanket bog should be based on peat depth and plant species under NVC type. Therefore, we recommend applying blanket bog indicators when both peat depth is greater 50 cm and indicative species and NVC communities are present outlined in MacDonald et al.
Tussock grassland
The focal type of tussock grassland type for the revised HIA is nutrient poor grassland dominated by Purple Moor Grass (Molinia caerulea). Tussock grassland is frequently found on acidic organo-mineral and peaty soils across Scottish open hill ranges and is particularly a dominant moorland habitat in west Scotland. Purple moor grassland is often viewed as a degraded form of wet heath and tend to have lower occurrence of heather and other dwarf shrub individuals.
In MacDonald et al. (MacDonald et al., 1998b), the habitat classification of ‘tussock grasslands’ covers different types of tussock grassland, namely those dominated by mat grass (Nardus stricta), purple moor grass (Molinia caerulea) or tufted hair grass (Deschampsia cespitosa) grasslands. These tussock habitat types have likely derived from different types of previous vegetation, have different preference by herbivore and respond differently to herbivory. The focus of this assessment is on nutrient poor and wet purple moor tussock grasslands.
Molinia-dominant tussock grasslands are challenging to change as a habitat through grazing. Cattle with 66% utilisation can open the Molinia tussock sward and increase floristic diversity (Grant et al., 1996). Although cattle grazing in that experiment only ran for six years it is thought that if Molina-dominant grassland is grazed sufficiently hard by cattle it will open to smooth grassland. Sheep do not have a similar impact (Pakeman et al., 2019), while controlled long-term impacts of deer are unknown.
Indicators
In revising the user guide to open hill range HIA we have justified our descriptions of the indicator and impact classes below. Each indicator has a code that is shared between the user guide and technical annex. Some indicators are shared across habitat types, and these have been grouped. For each indicator we provide a comparability statement, which is the comparability and read across of the indicator to existing HIA methods.
Disturbance
BB1, DSH1, TG1, SG1: Herbivore disturbance as hoof prints and/or tracks
Comparability: the indicator is present in MacDonald et al. method, WDBP and Putman method. Impact classes in MacDonald and Putman have a categorical description of spatial extent of hoof prints, whereas WDBP uses a proportion of hoof prints detected in quadrats. We recommend using the categorical impact class description with our justification outlined below. We have standardised this herbivore disturbance indicator across habitat types.
We have opted to standardize this indicator across all habitat types because bare ground with evidence of herbivore trampling is a consist indicator of loss of vegetation. Trampling has been linked to sustaining specific habitat vegetation cover, for instance, in dwarf shrub heath at lower herbivore densities trampling can have a greater impact in reducing heather than grazing, but as herbivore densities increase the relative importance of grazing impact increases (Hester and Baillie, 1998). For smooth grasslands, there is a clear relationship between the amount of bare ground due to herbivore trampling and the level of grazing (Pakeman, 2004). There can also be variation in the threshold between habitat types, for instance hoofprints may be more visible in damper habitats. For peatlands, existing HIA methods several indicators refer to different components of ground disturbance, including trampling on peat, hoofprints, path and track development, bare peat, trampling of pools. For this indicator we have merged trampling hoof prints and path and tracks into a single indicator.
The trampling threshold will be different for different habitats and depending on the management objectives of habitat, for example if disturbance is required for creating gaps for new plant species establishment. We found no quantitative thresholds in the literature for bare ground and habitat condition, and this would require further evidence. Currently we recommend using impact class descriptions in MacDonald and Putman rather than WDBP. For WDBP, there is limited empirical data for thresholds to inform trampling impact classes on peat. As part of a peatland restoration project, surveys found >25 deer hoof prints per 2 m x 2 m inhibited peatland revegetation (Watts, 2020). The WDBP impact classes adopt a proportion of the 2 m x 2 m quadrat showing visible trampling to inform impact class thresholds, but we found no supporting evidence of these thresholds. A quadrat approach could help produce a more quantitative impact class but requires further evidence to support impact class thresholds.
BB2: Trampling of Sphagnum moss hummocks and lawns
Comparability: the indicator is present in MacDonald et al. method, WDBP and Putman method. Impact classes in MacDonald and Putman have a categorical description of spatial extent of trampling, whereas WDBP uses a proportion of quadrat with visible trampling detected in quadrats. We recommend using the categorical description with our justification outlined below.
The extent and health of Sphagnum is important for the functioning of this habitat. The suggestion is to merge the descriptions of MacDonald, WDBP and Putman to ensure consistency. For impact classes, like the hoofprint indicator (BB1) we found no support for quadrat thresholds and thus have recommended categorical impact classes. A quadrat approach used in WDBP could enable a quantitative approach, but thresholds require further evidence.
TG2: Accumulation (depth) of plant litter between tussocks
Comparability: the indicator is present in MacDonald et al. method and WDBP. Impact classes are quantitative in MacDonald et al. based-on litter depth but are categorical in WDBP. Litter depth thresholds differ between pre-MacDonald and MacDonald, and we have merged these based on scientific literature and recommend a quantitative indicator.
Accumulation of plant litter is a measure of herbivore disturbance and can reflect greater biomass removed by herbivores, which has reduced plant litter deposition. Inter-tussock plant litter depth was a consistent indicator across HIA methods: however, impact classes were inconsistent across HIA methods. For example, for low herbivore impact, pre-MacDonald uses a threshold >3 cm litter, the MacDonald et al. method uses > 6 cm, (with moderate as 3 cm – 6 cm), and WDBP refers to deep litter without a quantitative threshold, and as reference CSM refers to >10% coverage of thatch/felt litter. These different thresholds may reflect different types of tussock grassland, and in the revised methodology we are targeting Molinia-dominated tussock grasslands.
We have merged these impact classes across existing HIA methods. Sheep grazing experiments across England on Molinia-dominated tussocks grasslands partly corroborate impact class thresholds, with light sheep grazing having litter depths of between 1 – 3 cm, and lower sheep grazing pressure > 3 cm deep (Todd et al., 2000). Rather than have bare ground as an impact class embedded in this indicator, we have included this as a separate indicator. Field testing would be required to investigate how strongly litter accumulation and bare ground indicators correlate with one another.
SG2: Uprooted bundle of grass tillers
Comparability: the indicator is present in MacDonald et al. method and in CSM. In these existing HIA methods there are effectively two impact classes high versus moderate/low. We recommend expanding these impact classes.
Both MacDonald and CSM use the indicator but neither method attempts to differentiate Moderate from Low impact class and the CSM guidance of 10 % of tillers being disturbed as the boundary between Low and High suggests a very high level of disturbance. Numbers of uprooted tillers may vary seasonally between the end of winter when disturbance is high and the end of summer when growth will have replaced lost tillers, and previously uprooted tillers may have rotted or otherwise broken up. A high degree of tiller uprooting does suggest a high impact, but there is a need to check these thresholds against other indicators to assess if they are appropriate. We recommend a revision of the MacDonald et al. descriptions, but impact class thresholds need checking.
Browsing and grazing
BB3, DSH2, TG3: Browsing shoots of unpreferred dwarf shrub species: crowberry (Empetrum nigrum), cross-leaved heather (Erica tetralix), cowberry (Vaccinium vitis-idaea) and bearberry (Arctostaphylos uva-ursi) and unpreferred bog myrtle (Myrica gale)
Comparability: the indicator is present in blanket bog for MacDonald et al. and WDBP, and dwarf shrub heath for MacDonald et al. only. MacDonald et al. only differentiates high impact versus moderate/low impact. We suggest merging the indicator descriptions in MacDonald et al. and WDBP to ensure consistency and expanding the impact classes.
Grazing on species such as crowberry (Empetrum nigrum) or cross-leaved heather (Erica tetralix) indicates that animals are short of more preferred plant species, and thus levels of herbivore consumption are high. At a stakeholder workshop, expert knowledge suggested that within these unpreferred dwarf shrub species, crowberry (Empetrum nigrum) is almost never browsed and cross-leaved heather (Erica tetralix) is very rarely browsed. Browsing of unpreferred bog myrtle (Myrica gale) was raised an indicator for tussock grasslands but is currently in MacDonald method for blanket bogs. Some stakeholders wished to separate these dwarf shrub species further into a hierarchy of herbivore (un)preference, but we have grouped species into a single indicator to maximise detection in the field. We note that this indicator is good for detection of high herbivore pressure but less so for low or negligible herbivore impacts. Following field testing the impact classes may need to be amended to reflect that the indicator reflects higher herbivore impact.
BB4, DSH3, TG5: Browsing shoots of current year’s heather (Calluna vulgaris) and blaeberry (Vaccinium myrtillus)
Comparability: the indicator is already present in MacDonald et al., WDBP, Putman and as a reference partly in CSM, the latter only using 33% threshold. There is a difference in description of the indicator in WDBP referring to long shoots rather than specifically to current year’s growth. We suggest merging the description of this indicator from MacDonald et al. and WDBP and standardising the impact classes using existing thresholds that have scientific underpinning.
Heather and blaeberry can comprise the majority of plant biomass in open hill range habitats and thus measuring browsing on these dwarf shrubs is key indicator of herbivore impact. There is scientific underpinning for this indicator relating to sustaining heather cover. A meta-analysis of ten grazing experiments on dry heath, wet heath and blanket bog (Pakeman and Nolan, 2009) provided a link between levels of herbivore utilisation (proportion of current season’s growth consumed) and the balance of competition between heather and other species (mainly grasses). An unpublished analysis of data from this meta-analysis (outlined below) supports a relationship between herbivore utilisation (sheep and deer) of heather and the proportion of heather shoots with browsing damage.
In existing HIA methods, the boundaries already in use in the MacDonald et al. method, WDBP and Putman methods approximate to key thresholds of sustainable utilisation of heather. In the meta-analysis 66 % of shoots browsed corresponds to the 95 % upper confidence level of 40% utilisation by sheep and deer above which results in loss of heather cover and high impact (Pakeman and Nolan, 2009). Meanwhile, the threshold of 33 % of shoots browsed corresponds to the lower 95 % confidence interval of 20% utilisation and no loss of heather cover, so that levels below 33 % indicate a low herbivore pressure. A moderate herbivore pressure is, therefore, assigned to between these 33 % and 66 % limits. In addition to these key thresholds, we recommend adding a negligible impact class if <5% of shoots are browsed.
For dwarf shrub heath, the MacDonald et al. method (MacDonald et al., 1998a) adjusts thresholds based on underlying fertility of the dwarf shrub heath. If heather growth is >4 cm per year then the proportion shoot browsed should be: >66%, 33-66% and <33%. However, if heather is slower growing <4 cm per year then shoot proportion browsed should be lower <33%, 16-33% and <16%. The meta-analysis of sustainable thresholds of herbivore off-take found consistent effects across various heather sites, so no underlying adjust was required for site fertility. Nevertheless, access to historic HIA data for sites with multiple HIA and records of any changes in heather cover would be able to determine whether such underlying habitat fertility adjustments are necessary.
Apart from blanket bogs, in which we have selected only heather as blaeberry is usually found on drier habitats, we have combined heather and blaeberry in a single indicator. A stakeholder workshop suggested heather and blaeberry be separated, however, we have combined them to maximise use of this indicator. Field testing should consider the separation of this indicator as there is evidence that sheep preferentially graze blaeberry over heather (Welch, 1998). and feedback It is important to note that there is not the same scientific underpinning of thresholds for blaeberry as heather. A study comparing primarily sheep off-take of heather and blaeberry found these to be similar on an annual basis but differ in seasonal patterns (Welch et al., 1994). Further, thresholds for other key herbivores, notably cattle are unknown.
For tussock grasslands, the relative importance of an indicator of heather browsing needs field testing and sensitivity analysis. If heather is rare in a tussock landscape, heather browsing may be disproportionately higher on remaining heather plants, so inflating herbivore impact outcomes. This indicator has the potential to be omitted from tussock grasslands following field testing.
Analysis converting percentage of shoots browsed into percentage utilisation of heather
Data source: Hester & Baillie (1998) (Hester and Baillie, 1998) described a grazing experiment with sheep and deer on dry heath. Data from this provided the means to calculate the proportion of current season’s shoot growth consumed from the proportion of shoots grazed.
Analysis: Linear mixed model with plot as a random factor using all the data to show the relationship between “GrazingIndex” (the percentage of shoots grazed) and utilisation (the percentage of current season’s shoots consumed). Model fitted with lme4 (Bates et al., 2015) lmerTest (Kuznetsova et al., 2017) in R (ver. 4.4.0, R Core Team 2024)(R Core Team, 2024).
| - | Estimate | Std. Error | df | t value | P |
|---|---|---|---|---|---|
| Intercept | -0.309 | 0.100 | 398 | -3.094 | 0.002 |
| GrazingIndex | 0.584 | 0.006 | 398 | 103.1 | <0.001 |
The intercept is close to zero, so it appears that if 10% of shoots are browsed then this corresponds to approximately 5.53 % of new biomass utilisation by herbivores. The random term does not explain much of the variation, but it has been retained in the model to address any potential differences between plots.
Grazer differences: Two of the plots only had deer and two only sheep. Ignoring the two plots which had both sheep and deer grazing together, an interaction between grazer and index can be fitted to see if there are differences between the grazers in terms of impact of grazing on utilization – effectively if they eat, how big is the bite of each one (Figure 5).
| - | Estimate | Std. Error | df | t value | P |
|---|---|---|---|---|---|
| (Intercept) | -0.499 | 0.183 | 269 | -2.723 | 0.007 |
| GrazingIndex | 0.598 | 0.010 | 269 | 57.27 | <0.001 |
| Sheep | 0.569 | 0.266 | 269 | 2.141 | 0.033 |
| GrazingIndex x Sheep | -0.046 | 0.015 | 269 | -3.031 | 0.003 |
The slope for deer alone is slightly steeper, but the intercept is slightly more negative so 10 % of shoots browsed equates to 5.48 % utilisation. For sheep at 10 % the utilisation is 5.58%. At 50 % of shoots browsed, deer are removing 29.4 % of new biomass whereas sheep are removing slightly less (27.7 %).
Conclusion: Though the model suggests that deer remove slightly more of a shoot when it is grazed, the differences over realistic levels of grazing mean that they are effectively indistinguishable. Converting the levels of utilisation identified in Pakeman & Nolan (2009) into percentage of shoots grazed using the simple relationship in the first analysis provides the following conversions.
Upper 95 % CI 41.4 % utilisation equates to 71.5% shoots browsed
No-effect level 31.6 % 54.7 %
Lower 95 % CI 22.5 % 39.1 %
Consequently, the ranges in MacDonald of 0-33, 33-66 and more than 66% are slightly conservative, but give a reasonable correspondence to the meta-analysis results. However, these relationships are for sheep and deer only, and the impact of cattle will differ as they have a larger bite depth than the other two herbivores.
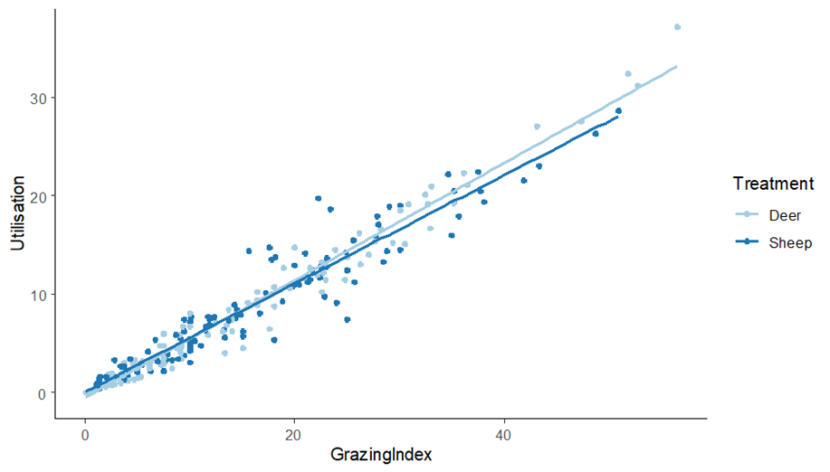
Figure 5. The relationship between the proportion of shoots grazed (GrazingIndex) and the percentage of current season’s shoots consumed (Utilisation) for sheep and deer.
Click for a full description
Grazer differences: Two of the plots only had deer and two only sheep. Ignoring the two plots which had both sheep and deer grazing together, an interaction between grazer and index can be fitted to see if there are differences between the grazers in terms of impact of grazing on utilization – effectively if they eat, how big is the bite of each one (Figure 5).
DSH4: Amount of flowering or fruiting of heather (Calluna vulgaris) and blaeberry (Vaccinium myrtillus)
Comparability: the indicator is present MacDonald et al. and Putman, but not WDBP. We recommend merging this indicator across methods. The amount of heather flowering/fruiting is easily identifiable indicator for deer stalkers and estate managers.
Sheep and deer grazing of heather and blaeberry can directly remove flowers or result in plant resource allocation to regrowth and reduce fruiting (Alonso and Hartley, 1998). There is temporal lag to this indicator, as heavy winter browsing of heather is thought to reduce the following summers flowering and fruiting. The amount of flowering and fruiting can also be influenced by weather patterns. The MacDonald et al. and Putman methods used three impact classes; we have expanded this to include a ‘negligible’ impact class. There are no quantitative thresholds for this indicator currently.
DSH5: Abundance of herbivore impacted growth-forms of heather (Calluna vulgaris) – flat topped/carpet, smooth cushion/ topiary effect/ drumsticks
Comparability: the indicator is present in the MacDonald et al. and Putman methods, but not WDBP. We recommend merging this indicator across methods. The growth form is a potentially easily identifiable indicator for deer stalkers and estate managers with some representative images. Impact classes for this method differ between MacDonald and Putman and we have suggested using the MacDonald method impact classes for reasons outlined below.
Changes in heather growth form following browsing and grazing are known from expert knowledge. Impact classes for this indicator in the MacDonald method assess the spatial extent of heather growth form, whereas the impact classes in Putman method differentiate the impact based on the type of growth form, namely carpet growth-form as high impact and drumsticks as moderate impact. We have found no evidence in the literature that assigns specific impact with certain growth forms, we have therefore grouped these growth forms to assess their spatial extent following the MacDonald et al. method. Some stakeholders raised concerns this indicator is historic impact rather than current impact. It is important to note that muirburn will result in a carpet-like heather growth form that can be maintained via herbivore browsing post-burn.
TG4: Amount of flowering or seeding of purple moor grass (Molinia caerulea)
Comparability: this indicator is new and not present in any pre-existing HIA method.
We have adopted this indicator based on expert knowledge highlighted at a stakeholder workshop. The principle of this indicator is similar to impacts on heather, in that browsing is presumed to lead to a reduction in flowering and fruiting (see DSH4). Purple moor grass stores nutrient reserves in grass internodes over the winter (Thornton and Bausenwein, 2000), therefore it is unclear whether this indicator would detect winter grazing (as it does for heather) but instead reflect more direct spring and summer grazing impacts on leaves. Previous indicators for tussock grassland in the MacDonald et al. and Putman methods focused on flowering of inter-tussock vegetation, but these indicators were not viewed as useful to stakeholders. This indicator requires field testing, particularly the relevance of timing of this indicator.
SG3: Grassland sward height
Comparability: this indicator is present in MacDonald et al, Putman and WDBP and as a reference CSM. Sward height thresholds used across HIA methods are consistent with the exception that WDBP does not provide a clear height threshold. Pre-MacDonald method used slightly different threshold than other methods. We suggest merging indicator descriptions from these methods and for this to be a quantitative indicator with a caveat that height thresholds will differ with underlying fertility of smooth grassland.
Sward height and texture are attractive indicators, and the indicator is based on the underlying premise that grazing and sward height reduction is required to achieve maximal diversity following the intermediate disturbance hypothesis (Connell and Slatyer, 1977). Whilst we have kept existing impact class thresholds of current HIA methods, the underlying scientific underpinning for these thresholds remains unclear. The general level of evidence that grazing promotes diversity at intermediate levels of grazing in non-arid areas with a long history of grazing (Milchunas et al., 1988) would argue for impact being lowest at intermediate levels of impact. However, information on where to set the height thresholds is conflicting. In the two experiments described in Hulme et al. (1999) (Hulme et al., 1999), the more fertile site saw the least plant species turnover when sward height was kept at 4.5 cm compared to the less fertile site that had the lowest species turnover at 6 cm (other treatments were 3 cm and ungrazed). In terms of heterogeneity of the sward, a higher heterogeneity, all other things being equal, would bring the highest level of beta diversity and hence overall diversity. But it is unknown how this relationship would change as average sward height changed. It would be possible to reanalyse the Pakeman (2004) (Pakeman, 2004) data set to assess how alpha diversity is affected by grazing. In line with the restricted evidence available, we recommend the amalgamation of existing HIA methods to a common set of height ranges, however, this is tentative.
An important point for this indicator is to measure sward height in a consistent method. There exists a variety of measurements approaches (e.g., ruler, sward stick, drop-down plate meters). The MacDonald method provides no guidance on the method to measure sward height (MacDonald et al., 1998b, MacDonald et al., 1998a). WDBP provides a description of using the drop-down method using a ruler (rather than a pasture stick) (Barthram, 1986), where the surveyor runs their hand down a ruler held vertical on the ground surface and records the first ‘hit’ on the sward (Wild Deer Best Practice Guidance for Scotland, 2018). We recommend using the drop-down method with a ruler or sward stick.
SG4: Signs of grazing of unpreferred species Alchemilla alpina, Juncus squarrosus, Nardus stricta, Prunella vulgaris, Sibbaldia procumbens or Thymus polytrichus
Comparability: this indicator is present in the MacDonald et al. method and CSM. We recommend retaining existing thresholds.
This indicator does identify smooth grassland areas where grazing is high enough to force animals to consume less preferred species. However, there is a need to test whether the thresholds correlate with other indicators to establish if the descriptions need revision. Deer stalkers and other users of WDBP may not recognise all the species on this list, so it may be that two forms of this indicator are provided for different users; a long list of species for ecologists and a short-list for a cut down method that may only include Nardus stricta. We have no evidence for the quantitative indicator for 10% leaves loss but have retained this percentage.
SG5: Signs of grazing on leaves of preferred species (collectively) Agrostis canina, Festuca ovina, and F. vivipara
Comparability: this indicator is shared across the MacDonald et al. method, WDBP and Putman methods. However, for each of these HIA methods impact class thresholds differ markedly across these methods. We recommend merging the indicator and standardising the impact classes.
Species in this indicator form most of the biomass of the sward and are the focus of much of the grazing in this habitat. However, the thresholds used across the different HIA methods are not consistent. The threshold for high herbivore impact for MacDonald is 66 %, but for WDBP it is “nearly 100% leaves grazed”, and for the Putman method it is greater than 75% leaves grazed. These grasslands typically are the most preferred feeding areas in open hills and consequently will often be grazed when other habitats are not. However, the proportion of shoots grazed is not the way most survey or experimental work is recorded. Instead, experiments have either set the numbers of grazing animals in a plot and measured the resulting vegetation height (e.g., (Pakeman et al., 2019)) or have manipulated the numbers of animals to maintain a set height across the plot (see (Pakeman, 2004)).
We suggest that the MacDonald and WDBP thresholds are brought into alignment. In the revised indicator we use the thresholds suggested by the Putman method, which are tentative and need to be checked with fieldwork.
It would be beneficial to conduct a study that would allow conversion between percentage of shoots grazed and percentage utilisation, like that for heather browsing (see BB4, DSH3, TG5).
SG6: Flowering of grasses and forbs other than very small, creeping or cushion forming species, in which the flowers are carried at heights of < 3 cm, or of less preferred species (e.g., thistles)
Comparability: this indicator is present in MacDonald et al. and Putman method, but not WDBP.
This is a straightforward indicator and potentially easy to identify for deer stalkers and estate managers. We suggest merging across HIA methods.
This indicator is similar to the herbivore impacts on flowering in other indicators such as heather and purple moor grass. However, there is no information on how well this indicator correlates with other indicators for this habitat and this would require testing.
Species composition
BB5: Abundance of heath rush (Juncus squarrosus) and its growth
Comparability: this indicator is only found in the MacDonald et al. method and only has two impact classes with a high and low herbivore impact class that would need expanding.
In the MacDonald et al. method the abundance of heath rush is used as proxy of the trend of herbivore impact. Heath rush is ranked low in herbivore preference, generally only being browsed in early spring (Welch, 1984), and so under heavy grazing it occurs at higher abundance. Heath rush is used in the MacDonald method as a trend indicator, thus if high in abundance herbivore impact is increasing but if declining in abundance and overgrown by competing plant species then herbivore pressure is declining. As a trend indicator it was not assessed in a review in frequency of use in surveying blanket bogs (Pakeman, 2009); however, surveyors noted the indicator is reported rarely but when reported it is useful (Morris, 2006). Despite being rarely recorded, this indicator was viewed as useful by stakeholders and we suggest retaining it in a revised HIA method. Heath rush is an easy to distinguish species and thus could be surveyed by deer stalkers and estate managers.
DSH6: Extent of grass intrusion into heather (Calluna vulgaris) [historic/long-term herbivore impacts]
Transability: This indicator has been taken from the Putman method on the extent of heather cover. It is not found in other HIA methods but represents an important indicator of the balance between heather and grasslands.
Heavily grazed heather moorlands can transition into grass-dominated moorlands (Pakeman and Nolan, 2009, Hester and Baillie, 1998), thus an indicator is necessary to explicitly address this transition. WDBP had an indicator on heather cover, but the Putman method explicitly draws out the balance between heather and grass in impact classes which we recommend adopting. This indicator needs to be assessed at the landscape scale, so wider radius outside of quadrat including considering margins or interface between heather and grass where grass is often seen ‘intruding’ into heather as the heather shrinks from the edges under the higher grazing pressure.
DSH7, TG6, SG7: Collective abundance of non-planted, naturally colonising tree seedlings and saplings (> 10 cm and <200 cm height) (e.g., rowan (Sorbus aucuparia), willows (Salix spp.), birch (Betula spp.), Scots pine (Pinus sylvestris)) within 10 m radius
Comparability: For smooth grasslands, the abundance of tree seedlings and saplings is in the MacDonald et al. method, WDBP and CSM methods. For all three of these HIA methods this indicator there are only two impact classes where seedlings/saplings being present is low impact. Browsing of tree seedlings and saplings is in MacDonald et al. method for dwarf shrub heath. As a first measure, we suggest a tree seedling/sapling abundance indicator is used in dwarf shrub heath, tussock grassland and smooth grassland. This indicator has the potential to be quantitative following a growing evidence base of natural tree colonisation surveys.
Given the changing open hill range landscape, natural tree colonisation is occurring across many open hill range habitats and in many instances with continued grazing of the landscape. High natural tree colonisation is generally a sign of lower herbivore pressure, but this depends on many factors such as proximity of nearby seed source. Early tree species colonizers are typically rowan (Sorbus aucuparia), willows (Salix spp.), birch (Betula spp.) and Scots pine (Pinus sylvestris)). Willows and birches tend to have higher colonising densities than Scots pine and Rowan.
The densities of trees can vary considerably but there is growing evidence linking potential thresholds of tree densities with herbivore impact. We have used the following thresholds of tree densities. Surveys of natural tree colonisation across estates in the Cairngorms highlight open woodland > 200 seedlings ha-1 and > 400 seedlings ha-1 high tree colonisation following deer culling to 3-4 deer km-2 (Gullett et al., 2023). Below this threshold tree colonisation under varying grazing regimes can be variable averaging 17 to 119 trees ha-1 across low-high livestock grazing pressure and low-moderate deer pressure at Glen Finglas (Cornell et al. unpublished data), as low as 3 trees ha-1 for Scots pine under summer sheep grazing but reduced deer densities (Scott et al., 2000).
Using the relationships between tree densities and survey radius we have translated these thresholds for the number of tree seedlings in a 10 m radius to reflect the following tree densities: 0 trees as high impact, 1 – 15 trees (~1 to ~200 trees ha-1) as moderate herbivore impact, 15 to 35 trees (~200 to ~400 trees ha-1) as low herbivore impact, and greater than 35 trees (~400 trees ha-1) as negligible herbivore impact. These thresholds are based on limited evidence and would need further evaluation and field testing. It should be noted, that if there is no seed source close to where the survey is undertaken, then an absence of tree seedlings may not reflect high grazing.
Natural tree colonisation is likely to differ between habitats. Smooth grasslands will be the focus of most of the grazing in the landscape, and so tree colonisation will be lower in this habitat compared to dwarf shrub heath and tussock grasslands. Consequently, tree colonisation will only happen at very low levels of herbivore offtake, and, in most situations, this will be at the lowest extreme of low impact.
We opted for an indicator of tree seedling presence and density rather than browsing damage, since if trees were absent then a browsing indicator would be rarely recorded. At the same time, we have concerns that the presence and densities of tree seedlings results from factors other than grazing, particularly proximity to a seed source. The MacDonald method has an indicator of tree seeding browsing in dwarf shrub heather. Preferred tree species such as rowan may be strong indicators of herbivore browsing, particularly winter browsing by deer whereas non-preferred species such as Stika spruce will so no browsing impact. Some stakeholders viewed this indicator as historic impact and instead browsing separated by tree species preference should be used akin to the Woodland HIA. Field testing should evaluate whether a tree browsing indicator would be more informative than the abundance of colonising tree seedlings.
SG8: Presence of "weedy" species such as creeping thistle (Cirsium arvense), soft rush (Juncus effusus), common ragwort (Senecio jacobaea) or chickweed (Stellaria media) in dense, extensive patches (10's m2 or more in size)
Comparability: this indicator is used in the MacDonald et al. method and CSM. We suggest using the indicator species outline in MacDonald et al. method and omitted several species used in CSM common, namely daisy (Bellis perennis) and creeping buttercup (Ranunculus repens).
These are easily recognisable species and indicate either substantial levels of past disturbance allowing establishment or high levels of nutrient input, i.e., in the case of Stellaria media. However, neither MacDonald or CSM do not provide a description of what makes moderate herbivore impact, and hence the indicator is not particularly useful as it stands. We expand the impact classes using soft rush (Juncus effusus) as a benchmark species as is it is easily recognisable by deer stalkers and estate managers. The suggested impact class descriptions are tentative as work is needed to see how they match with the thresholds for other indicators.


