Official Statistics - Scottish Terrestrial Breeding Birds 1994 – 2023
Published: February 2025
An Official Statistics Publication for Scotland
Scotland’s terrestrial breeding birds occupy a wide range of habitats including farmland, upland, woodland and urban areas. Some species show a strong preference for a particular habitat, for example coal tit is a typical woodland bird. Others use a wider range of habitats. Skylark occupies lowland arable land as well as farmed and semi-natural upland areas. Great tit is a familiar species of woodland but also occupies the woodland and hedgerow components of farmland and gardens. Bird populations can respond relatively quickly to drivers, such as changes in habitat extent or condition, through effects on breeding success, survival and dispersal (moving from one area to another). Since birds are well surveyed in the UK through volunteer-based and professional surveys, and many are widespread and abundant, they are often used as indicators of environmental change.
Assessment
Since the start of the time series in 1994 to the most recent estimate in 2023:
- Of the 66 bird species 36 increased, 23 declined and 7 remained stable (i.e. within 5% of 1994 value) (Table 1).
- The all-species (smoothed) index increased steadily up to the mid-2000s to 20% above the baseline, but subsequently declined, it is currently 10% higher than in 1994.
- The smoothed woodland bird index increased significantly, by 58%, although it has been relatively stable since its peak in 2016.
- The smoothed farmland bird index increased steadily up to the late-2000s, peaking at around 25% above the 1994 index value. It is currently 7% higher than in 1994. The pastoral bird index is currently 21% higher than in 1994 and the wooded farmland bird index is 7% higher than 1994. The arable and wet farmland bird indices have declined by 13% and 18% respectively since 1994.
- The smoothed upland bird index decreased by 20%.
- The smoothed urban bird index increased steadily until the mid-2000s, followed by a steady decline. It is currently 14% higher than in 1994.
- The unsmoothed data show that, between 2022 and 2023 (the short-term change), the urban bird index remained stable (i.e. has not changed more than 5% since last reported). The all-species, farmland, woodland and upland bird indices increased (6%, 11%, 6% and 7% respectively).
Evidence
We monitor terrestrial breeding bird populations primarily through the volunteer-led Breeding Bird Survey (Heywood et al., 2023). Most of the sample is composed of randomly located 1km survey squares that are visited twice each breeding season (April to July). A subset of upland sites are visited only once per season in the Upland Rover initiative to boost coverage of squares in more remote areas. These squares are intended to be representative of Scottish landscapes including farmland, woodland, upland and urban habitats. We examined bird population trends in each of these habitats. Within farmland, we examined bird population trends in four sub-categories: arable, pastoral, wooded farmland and wet farmland. Trends for ten of the 66 species were based on the findings of targeted surveys, as these species are either too scarce for reliable trends to be produced through BBS or are better monitored by specialised surveys.
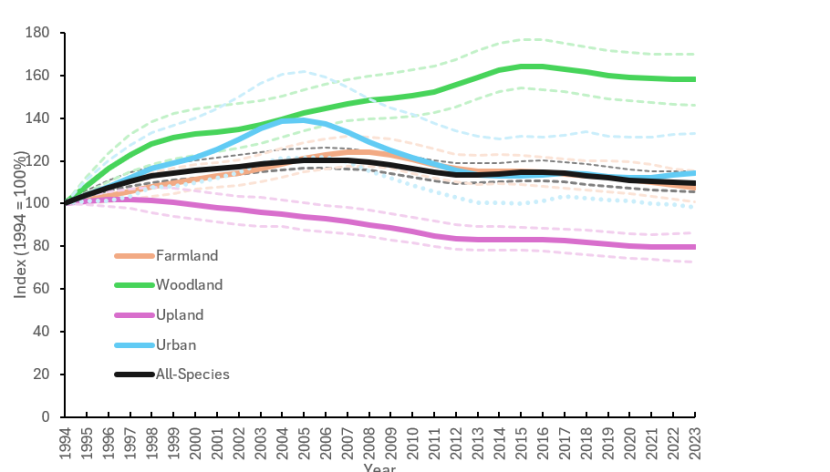
Figure 1. Smoothed index of abundance for 66 species of terrestrial breeding birds, 1994 – 2023, Scotland, UK. The solid and dashed lines represent average smoothed model predictions ± 95% confidence intervals.
Understanding the changes
In this commentary, ‘long-term’ refers to the period from 1994 to 2023 while ‘short-term’ refers to changes between 2022 and 2023. Longer-term changes since the 1970s, analogous to those reported for the UK (e.g. DEFRA, 2024; Heywood et al., 2023) are not available for Scotland due to low levels of monitoring coverage prior to the start of the BBS in 1994. The main drivers of population change are often unclear, but information is provided, where available, that may help to explain some of the likely causes. Breeding bird populations in Scotland are, as elsewhere, affected by conditions in all parts of their range; in the non-breeding, as well as the breeding season. For example, a summer migrant to Scotland may be affected by conditions in Scotland, along its migration route, and/or on its wintering grounds. Long-term and short-term changes for individual species are assessed using unsmoothed trends. Due to annual variability in the individual species trends, populations are considered to have increased or decreased only when the change is at least 5%. Individual species trends are shown in Table 1. A further 46 terrestrial species regularly breed in Scotland but are too scarce to be monitored by the BBS effectively and are not covered by species-specific surveys. Among these species are several woodland, farmland and upland specialists of current conservation concern (Eaton et al., 2015) such as wood warbler, spotted flycatcher and whinchat.
The latest results show the smoothed all-species index steadily increased since 1994, peaking in 2006 then becoming more variable after this time (Figure 1). In 2023, it was 9% below the peak in 2006 and 10% higher than in 1994. The two indicators with notable long-term changes since 1994 were woodland, which increased by 58%, and upland, which declined by 20%.
Woodland
The woodland bird indicator has shown a significant long-term increase (+58%) (Figure 1). The indicator increased for 22 years (1994 – 2015, +64%) however, since 2016, this has been stable (-4%). The indicator includes 23 species of bird (long term trend: 20 increased, 3 decreased; short-term trend: 11 increased, 4 decreased, 8 stable). Chiffchaff (+1428%), blackcap (+593%), great spotted woodpecker (+699%) and Bullfinch (+136%) have experienced large long-term increases in woodlands. Capercaillie (-75%), chaffinch (-13%) and common buzzard (-6%) experienced long-term declines. Treecreeper (+40%), mistle thrush (+30%) and siskin (+25%) have experienced large short-term increases, while redpoll (-15%) has experienced a large short-term decline (Table 1).
Willow warbler and chiffchaff are among Scotland’s most common woodland migrant birds. Increases in these species are likely to be driven by increasing temperatures (Martay et al., 2022). Bullfinch numbers have increased, although the reasons are not well understood. The 2007-11 Bird Atlas (Balmer et al., 2013) revealed that bullfinch populations on the east of Scotland fared better than in the west. Chaffinches are one of our commonest birds and a regular species in gardens and woodland but recently have undergone declines linked to the disease Trichomonas gallinae (Robinson et al., 2010). A study in 2018 highlighted the effects of providing food for birds such as chaffinches (Lawson et al., 2018) recommending that care was taken to ensure only sufficient food was provided for 1 to 2 days at a time with regular cleaning of bird feeding stations. Capercaillie declines have been linked to death from collisions with fences and potentially a negative effect of rising temperatures (Moss et al., 2001).
Farmland
Overall, there has been a long-term increase of 7% among the species trends that contribute to the farmland bird indicator. This increase was largely due to positive population trends in areas dominated by pastoral farmland, where the index increased by 22%. Long-term changes in Scottish and UK farmland bird populations have also been contributed to by a range of factors including agricultural intensification, reduced diversity of crop types at the within-farm scale and reductions in spring-sown crops (Donald et al., 2001; Bell and Calladine, 2017). Looking across the four farmland categories (Pastoral; Arable; Wet; and Wooded) reveals differences (see Technical Annex). For two increasing species, great tit increased more rapidly in Arable compared with Pastoral and Wooded areas, whereas goldfinch increased more rapidly in Pastoral and Wooded compared to Arable. Starling showed a decline in Arable populations, and an increase in Pastoral. Farmland waders (oystercatcher and lapwing) have seen the largest declines, these have been linked to changes in farming practices. However, there are considerable efforts to reverse the trends for breeding waders across Scotland through projects such as Working for Waders and by dedicated farmers such as at Threepwood Farm.
The farmland bird indicator includes 27 species of bird (long-term trend: 15 increased, 9 decreased, 3 stable; short-term trend: 19 increased, 2 decreased, 6 stable) and identified no significant long-term or short-term trend over time (Table 1, Figure 1). Goldfinch (+405%), whitethroat (+150%) and great tit (+139%) have experienced the largest long-term increases on farmland while lapwing (-63%), greenfinch (-64%) and kestrel (-66%) have experienced the largest long-term declines. Greenfinch (+68%) and kestrel (+73%) have also experienced relatively large short-term increases while magpie (-8%) and oystercatchers (-7%) have experienced the largest short-term declines (Table 1).
Upland
As a group upland birds have shown the largest declines (-20%). Long-term changes in upland bird populations have been contributed to by several factors including climate change, forest expansion, and changes in site-based management practices such as grazing and predator control (Buchanan et al., 2017). Changes in numbers of golden plover have been linked to climate change, in part due to the negative impact of increasing temperatures on the abundance of craneflies (an important source of food for these birds during the breeding season; Pearce-Higgins et al., 2010). Likewise, curlew populations may benefit from cooler temperatures and higher summer rainfall (Franks et al., 2017).
The upland bird indicator includes 17 species of bird (long-term trend: 6 increased, 10 decreased, 1 stable; short-term trend: 8 increased, 3 decreased, 6 stable) and identified a significant long-term decline (-21%,) over time (Table 1, Figure 1). Raven (+177%) and cuckoo (+147%) have experienced the largest long-term increases within upland habitats while dotterel (-72%), black grouse (-63%) and curlew (-60%) have experienced large long-term declines. Raven (+57%), hooded crow (+28%) and hen harrier (+26%) have experienced relatively large short-term increases while common sandpiper (-14%) and wheatear (-23%) have experienced the largest short-term declines (Table 1). Smoothed upland bird indicator values remained relatively stable for four years (1994 – 1997, +2%) but subsequently decreased for 26 years (1998 – 2023, -22%, Figure 1).
Urban
Since 1994, there has been an increase of 14% among the species trends that contribute to the urban bird indicator. This is largely due to an increase until the mid-2000s, which was followed by a slow decline. The greatest long-term increases have been for jackdaw (+246%), magpie (+225%), goldfinch (+142%), woodpigeon (+134%) and great tit (+132%). There have been some substantial long-term decreases in other urban bird populations, however, including declines of more than 50% for greenfinch, swift and collared dove, and 25-50% declines for blackbird and starling. The urban bird indicator includes 18 species of bird (long-term trend: 11 increased, 7 decreased; short-term trend: 8 increased, 8 decreased, 2 stable) and identified no significant trends over time (Table 1, Figure 1). Jackdaw (+252%) and goldfinch (+237%) have experienced relatively large long-term increases in urban environments while greenfinch (-82%) and swift (-71%) have experienced larger long-term declines. Song thrush (+41%) and goldfinch (+32%) have experienced relatively large short-term increases while swift (-32%) and carrion crow (-28%) have experienced the largest short-term declines (Table 1). Possible drivers of the trends include changes in bird communities due to increased garden bird feeding (Plummer et al., 2019), loss of green space and the impacts of diseases such as trichomoniasis (Robinson et al. 2010).
Swift is experiencing a substantial long-term decline (-60%) which may be related to the reduced availability of suitable nesting sites on buildings (Woodward et al., 2018), though a reduction in availability of flying insects may also play a role (Hallmann et al., 2017). Swifts are long-distance migrants and there may also be factors that influence their survival outside the breeding season during migration or on their wintering grounds. Tracking studies in the UK and elsewhere in Europe have revealed that European swift populations have high migratory connectivity, with swifts breeding at northern latitudes overwintering in different parts of sub-Saharan Africa than those breeding further south (Åkesson et al. 2020).
Data sources
Sixty-six bird species were included in the indicators, data for 56 species were derived from the Breeding Bird Survey (BBS) while data for the remaining ten originated from species-specific, specialist surveys.
The BTO/JNCC/RSPB UK Breeding Bird Survey (BBS) is an annual scheme for monitoring the relative abundance of breeding birds across the UK (1994 – present, Heywood et al., 2023). Scottish BBS squares are representative of the landscape and as such are dominated by farmland, woodland, upland and urban habitats. Population trends were assessed in each broad habitat category (i.e., farmland, woodland, upland, urban) and within four sub-categories of farmland habitat (arable, pastoral, wooded, wet, e.g., Martay and Noble, 2022).
Trends for common sandpiper and dipper were derived from the BTO Waterways Bird Survey and the Waterways Breeding Bird Survey. Grey heron trends were derived from the Heronries Census and trends for golden eagle, hen harrier, peregrine, dotterel, corncrake, black grouse and capercaillie were estimated from periodic, single-species surveys as part of the SCARABBS (Statutory Conservation Agency/RSPB Annual Breeding Bird Scheme) programme.
A further 46 terrestrial species regularly breed in Scotland (being found in at least 100 10km squares in Bird Atlas 2007-11), but insufficient data were available through current monitoring schemes to permit their inclusion in these indicators. Scottish multi-species indicators cannot be extended to the period before BBS started (i.e., 1994) as monitoring and coverage of many terrestrial bird species were poor in Scotland up until this point. Changes reflected by these indicators therefore exclude any influence of changes that occurred prior to 1994. Based on UK data, these included population declines in many farmland and woodland species.
| Species | All species94-23 | All- Species 22-23 | Woodland 94-23 | Woodland22-23 | Farmland 94-23 | Farmland 22-23 | Upland 94-23 | Upland 22-23 | Urban 94-23 | Urban 22-23 |
|---|---|---|---|---|---|---|---|---|---|---|
| Chiffchaff | 1428 | 19 | 1428 | 19 | - | - | - | - | - | - |
| Great Spotted Woodpecker | 699 | 18 | 699 | 18 | - | - | - | - | - | - |
| Blackcap | 589 | -10 | 593 | -7 | - | - | - | - | - | - |
| Goldfinch | 291 | 10 | - | - | 405 | 9 | - | - | 237 | 32 |
| Stonechat | 217 | -9 | - | - | - | - | - | - | - | - |
| Raven | 177 | 57 | - | - | - | - | 177 | 57 | - | - |
| Whitethroat | 150 | 9 | - | - | 150 | 9 | - | - | - | - |
| Bullfinch | 136 | 18 | 136 | 18 | - | - | - | - | - | - |
| House Martin | 131 | 8 | - | - | - | - | - | - | 131 | 8 |
| Magpie | 113 | -9 | - | - | 96 | -8 | - | - | 165 | -21 |
| Cuckoo | 108 | 17 | 38 | 5 | - | - | 147 | 17 | - | - |
| Wren | 98 | 12 | 98 | 12 | - | - | - | - | 136 | 17 |
| Corncrake | 88 | 4 | - | - | 88 | 4 | - | - | - | - |
| Treecreeper | 81 | 40 | 81 | 40 | - | - | - | - | - | - |
| Great Tit | 76 | 2 | 66 | -6 | 139 | 6 | - | - | 127 | -6 |
| Reed Bunting | 76 | 4 | - | - | 76 | 4 | - | - | - | - |
| Tree Pipit | 70 | 4 | 70 | 4 | - | - | - | - | - | - |
| Jackdaw | 60 | 5 | - | - | 56 | 14 | - | - | 252 | -4 |
| Willow Warbler | 48 | -9 | 48 | -9 | - | - | - | - | - | - |
| Goldcrest | 46 | 10 | 46 | 10 | - | - | - | - | - | - |
| Snipe | 41 | 14 | - | - | - | - | 41 | 14 | - | - |
| Siskin | 40 | 25 | 40 | 25 | - | - | - | - | - | - |
| Song Thrush | 35 | -3 | 47 | -4 | 47 | -3 | - | - | 42 | 41 |
| Sedge Warbler | 31 | 21 | - | - | 31 | 21 | - | - | - | - |
| Golden Eagle | 31 | 1 | - | - | - | - | 31 | 1 | - | - |
| Blue Tit | 25 | 3 | 20 | -4 | 34 | 8 | - | - | 32 | -12 |
| Lesser Redpoll | 23 | -16 | 23 | -16 | - | - | - | - | - | - |
| Dunnock | 23 | 8 | 45 | 7 | 1 | 3 | - | - | 6 | -10 |
| Mistle Thrush | 22 | 30 | 22 | 30 | - | - | - | - | - | - |
| House Sparrow | 19 | -9 | - | - | - | - | - | - | -22 | -10 |
| Blackbird | 17 | 1 | 10 | -3 | 39 | -1 | - | - | -48 | -4 |
| Hen Harrier | 16 | 26 | - | - | - | - | 16 | 26 | - | - |
| Buzzard | 16 | 4 | -6 | 3 | 19 | 12 | - | - | - | - |
| Collared Dove | 15 | 36 | - | - | - | - | - | - | -47 | 30 |
| Coal Tit | 13 | 9 | 13 | 9 | - | - | - | - | - | - |
| Yellowhammer | 11 | 13 | - | - | 11 | 13 | - | - | - | - |
| Robin | 4 | 0 | 9 | -4 | - | - | - | - | 36 | -18 |
| Carrion Crow | -1 | 10 | - | - | 10 | 13 | - | - | -22 | -28 |
| Woodpigeon | -2 | 7 | - | - | -12 | 3 | - | - | 184 | 16 |
| Skylark | -2 | 9 | - | - | -14 | 18 | 10 | 8 | - | - |
| Golden Plover | -2 | 22 | - | - | - | - | -2 | 22 | - | - |
| Linnet | -4 | 16 | - | - | -4 | 16 | - | - | - | - |
| Swallow | -5 | 16 | - | - | -5 | 16 | - | - | - | - |
| Meadow Pipit | -7 | 3 | - | - | - | - | -7 | 3 | - | - |
| Starling | -9 | 8 | - | - | 10 | 9 | - | - | -31 | 27 |
| Mallard | -10 | 12 | - | - | - | - | - | - | - | - |
| Chaffinch | -10 | 3 | -13 | 3 | -10 | 5 | - | - | - | - |
| Red Grouse | -15 | 26 | - | - | - | - | -15 | 26 | - | - |
| Peregrine | -22 | -1 | - | - | - | - | -22 | -1 | - | - |
| Pied Wagtail | -22 | 6 | - | - | -22 | 6 | - | - | - | - |
| Rook | -25 | 13 | - | - | -25 | 13 | - | - | - | - |
| Hooded Crow | -26 | 28 | - | - | - | - | -26 | 28 | - | - |
| Wheatear | -29 | -23 | - | - | - | - | -29 | -23 | - | - |
| Grey Heron | -38 | -9 | - | - | - | - | - | - | - | - |
| Dipper | -39 | -7 | - | - | - | - | -39 | -7 | - | - |
| Grey Wagtail | -39 | -42 | - | - | - | - | - | - | - | - |
| Oystercatcher | -42 | -7 | - | - | -42 | -7 | - | - | - | - |
| Common Sandpiper | -50 | -14 | - | - | - | - | -50 | -14 | - | - |
| Curlew | -60 | 1 | - | - | - | - | -60 | 1 | - | - |
| Lapwing | -63 | 9 | - | - | -63 | 9 | - | - | - | - |
| Black Grouse | -63 | -3 | - | - | - | - | -63 | -3 | - | - |
| Greenfinch | -66 | 46 | - | - | -64 | 68 | - | - | -82 | 29 |
| Kestrel | -66 | 73 | - | - | -66 | 73 | - | - | - | - |
| Swift | -71 | -32 | - | - | - | - | - | - | -71 | -32 |
| Dotterel | -72 | -5 | - | - | - | - | -72 | -5 | - | - |
| Capercaillie | -75 | 1 | -75 | 1 | - | - | - | - | - | - |
Technical Annex
Farmland - Arable
The arable farmland bird indicator includes 23 species of bird (long-term trend: 9 increased, 13 decreased, 1 stable; short-term trend: 13 increased, 4 decreased, 6 stable) and identified no significant trend over time (Table 2, 2a). Great tit (+234%), goldfinch (+181%) and whitethroat (+174%) have experienced relatively large long-term increases on arable farmland while greenfinch (-79%), lapwing (-79%) and oystercatcher (-66%) have experienced larger long-term declines. Greenfinch (+83%) and sedge warbler (+55%) have experienced relatively large short-term increases while lapwing (-39%) and goldfinch (-11%) have experienced the largest short-term declines (Table 2). Smoothed arable farmland bird indicator values decreased for six years (1994 – 1999, -5%), increased for 9 years (2000 – 2008, +12%) and decreased for 15 years (2009 – 2023, -20%). The value is currently -13% lower than in 1994 and significantly lower than the pastoral farmland bird indicator value (-27%,) but no different from both the wooded and wet farmland bird values (Figures 2a-d).
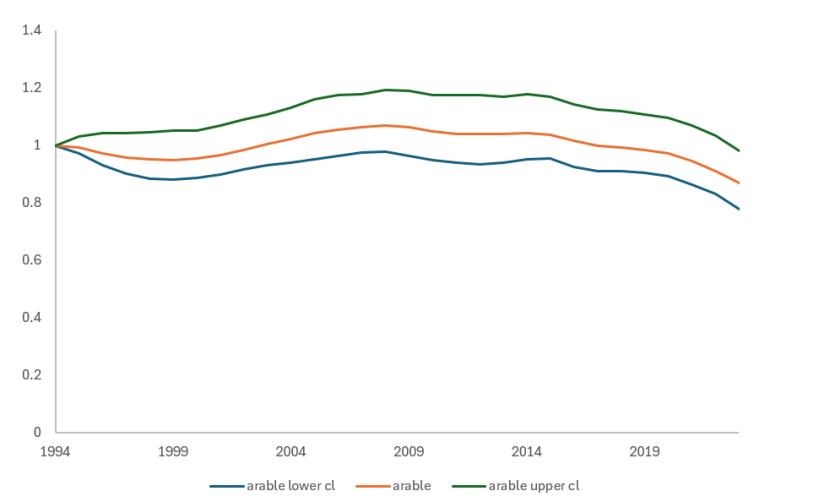
Figure 2a. Smoothed index of abundance for 23 species of arable farmland breeding birds 1994 – 2023, Scotland, UK.
Farmland - Pastoral
The pastoral farmland bird indicator includes 26 species of bird (long-term trend: 16 increased, 6 decreased, 4 stable; short-term trend: 13 increased, 4 decreased, 6 stable) and identified a significant long-term increase (+21%, p < 0.05) in values over the study period (Table 2, Figure 2b). Goldfinch (+441%), reed bunting (+163%) and whitethroat (+124%) have experienced relatively large long-term increases on pastoral farmland while greenfinch (-67%) and lapwing (-62%) have experienced large long-term declines. Greenfinch (+94%) also experienced relatively large short-term pastoral increases while reed bunting (-39%) and magpie (-24%) have experienced the largest short-term declines (Table 2). Smoothed pastoral farmland bird indicator values increased for 15 years (1994 – 2008, +44%), decreased for five years (2008 – 2013, -10%) and remained stable for two (2014 – 2015, +2%) before decreasing for eight years (2016 – 2023, -15%). The value is currently +21% higher than in 1994 and is significantly higher than the arable (+36%) and wet farmland (+46%) bird indicators (Figures 2a-d). There is no significant difference between current pastoral and wooded farmland bird indicator values.
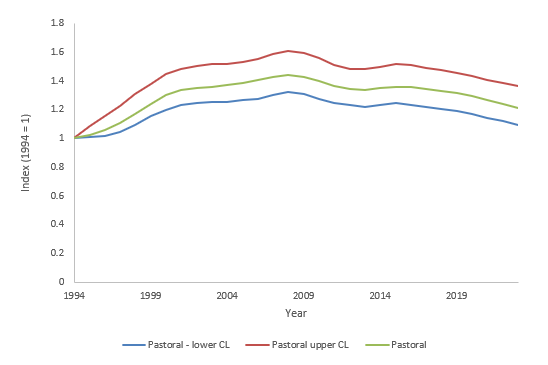
Figure 2b. Smoothed index of abundance for 26 species of pastoral farmland breeding birds, 1994 – 2023, Scotland, UK
Farmland - Wet
The wet farmland bird indicator includes 11 species of bird (short-term trend: 3 increased, 8 decreased; short-term trend: 5 increased, 4 decreased, 2 stable) and detected no long-term trend over time (Table 2, Figure 2c). Reed bunting (+112%) have experienced relatively large long-term increases on wet farmland while lapwing (-62%) and oystercatcher (-49%) have experienced larger long-term declines. Sedge warbler (+28%) have experienced relatively large short-term increases on wet farmland, while oystercatcher (-13%) have experienced the largest short-term decline (Table 2). Smoothed wet farmland bird indicator values initially decreased for 4 years (1994 – 1997, -7%), increased for 10 years (1998 – 2007, +18%) and decreased for 16 years (2008 – 2023, -29%). The value is currently -18% of that in 1994 and is significantly lower than the pastoral (-32%) but no different from both the wooded and arable farmland bird indicators (Figures 2a-d).
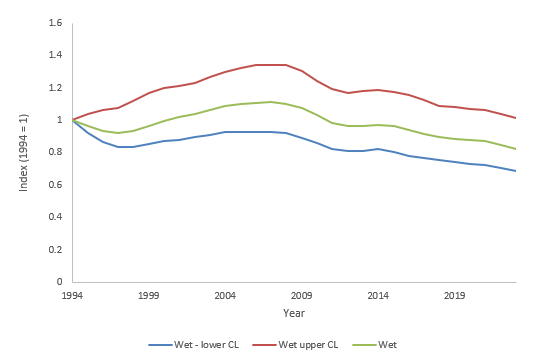
Figure 2. Smoothed index of abundance for 11 species of wet farmland breeding birds, 1994 – 2023, Scotland, UK.
Farmland - Wooded
The wooded farmland bird indicator includes 23 species of bird (long-term trend: 11 increased, 7 decreased, 5 stable; short-term trend: 11 increased, 3 decreased, 9 stable) and detected no long-term trend over time (Table 2, Figure 2d). Goldfinch (+508%), reed bunting (+188%) and whitethroat (+125%) have experienced large long-term increases on wooded farmland while greenfinch (-77%) and lapwing (-73%) have experienced large long-term declines. Greenfinch (+94%) and lapwing (+45%) have experienced large short-term increases on wooded farmland, while starling (-20%) and magpie (-15%) have experienced large short-term declines (Table 2). Smoothed wooded farmland bird indicator values increased for 9 years (1994 – 2002, +25%), remained stable for eight years (2003 – 2008, -1%) before decreasing for 13 years (2009 – 2023, -18%). The value is currently +6% relative to that in 1994 and is not significantly different from the other farmland indicators (Figures 2a-d).
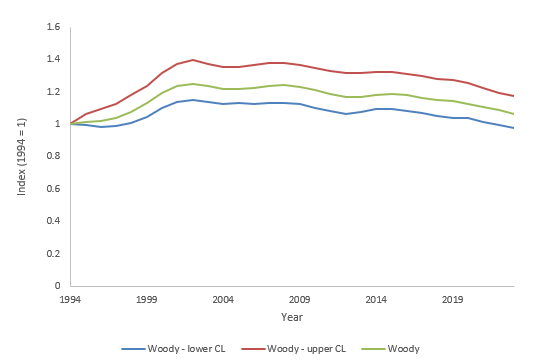
Figure 2d. Smoothed index of abundance for 23 species of wooded farmland breeding birds, 1994 – 2023, Scotland, UK.
| Species | Arable 94-23 | Arable 22-23 | Pastoral 94-23 | Pastoral 22-23 | Wooded 94-23 | Wooded 22-23 | Wet 94-23 | Wet 22-23 |
|---|---|---|---|---|---|---|---|---|
| Great Tit | 234 | 13 | 77 | -5 | 96 | -3 | - | - |
| Goldfinch | 181 | -10 | 441 | 14 | 508 | 11 | - | - |
| Whitethroat | 174 | 8 | 124 | -2 | 125 | -5 | - | - |
| Song Thrush | 76 | -1 | 52 | 2 | 78 | -1 | - | - |
| Blue Tit | 55 | 21 | 20 | 7 | 35 | 8 | - | - |
| Jackdaw | 35 | 22 | 76 | 5 | 88 | 5 | - | - |
| Blackbird | 29 | 2 | 50 | 2 | 45 | 2 | 13 | -9 |
| Sedge Warbler | 27 | 55 | 36 | 11 | 27 | 22 | 38 | 28 |
| Yellowhammer | 27 | 30 | -6 | -15 | 5 | 12 | - | - |
| Skylark | 3 | 20 | -31 | 23 | - | - | -14 | 18 |
| Buzzard | -5 | 0 | 32 | 20 | 1 | 5 | - | - |
| Dunnock | -7 | 1 | 14 | 8 | -9 | 0 | - | - |
| Starling | -10 | 10 | 21 | 5 | 2 | -20 | - | - |
| Rook | -14 | 21 | -33 | 4 | -3 | 27 | - | - |
| Carrion Crow | -14 | 25 | 37 | 14 | 6 | 3 | -27 | 6 |
| Chaffinch | -19 | 13 | -2 | 0 | -18 | 4 | -17 | 5 |
| Swallow | -23 | -6 | 10 | 18 | -4 | 14 | -41 | 15 |
| Woodpigeon | -28 | 16 | -2 | -3 | -24 | 4 | -37 | 0 |
| Pied Wagtail | -49 | -9 | 2 | 4 | -38 | -7 | -22 | 2 |
| Linnet | -50 | 3 | -2 | -5 | -34 | 29 | - | - |
| Oystercatcher | -66 | 4 | -42 | -14 | - | - | -49 | -13 |
| Lapwing | -79 | -39 | -62 | 4 | -73 | 45 | -62 | -7 |
| Greenfinch | -79 | 83 | -67 | 94 | -77 | 94 | - | - |
| Reed Bunting | - | - | 163 | -31 | 188 | 0 | 112 | -11 |
| Corncrake | - | - | 88 | 4 | - | - | - | - |
| Magpie | - | - | 55 | -24 | 79 | -15 | - | - |
Analyses
The survey design combines a one km2 grid of the UK with regionally stratified random sampling to ensure even coverage. The survey protocol expects two visits per year between April and June (breeding season for most species) during which surveyors walk two 1 km line transects across the 1 km2 square (BBS square) and record all adult birds encountered (heard or seen). A small number of sites include an additional adjacent 1 km2 square (and therefore a 2 km transect) to maximize the number of records in remote areas (e.g., upland habitat) where the overall density of birds is relatively low. In the current study annual abundance was recorded for each species and square as the maximum count from the two visits and all counts were weighted based on the number of BBS 1km squares in the region for each year.
Species-specific population abundances were estimated for each habitat using Generalised Linear Models (GLMs) in which counts (continuous, log transformed) were modelled as a function of year (factor) and habitat (factor) with a Poisson distribution and log link function. Species-specific confidence intervals were estimated for each habitat via bootstrapping (n = 200, resampling with replacement on site) using the same model structure. Annual, species-specific model estimates (log transformed) were then averaged (i.e., geometric mean) across each indicator habitat (e.g., farmland, woodland) and year to produce indicator values. The same process was repeated for each bootstrap replicate to calculate 95% confidence intervals of the annual habitat-specific geometric mean. All trends and confidence intervals were additionally smoothed to capture the underlying trend (i.e., reduce the influence of variability and sampling error) following Fewster et al., (2000). The smoothed indices were used to assess the significance of long-term change, and the unsmoothed indices were used to assess the significance of short-term changes.
Species trends were presented as the percentage change over one year (2022 – 2023) and 30 years (1994 – 2023). Species trends were considered increasing when they were > 5%, decreasing when < -5% and stable when <= 5% and >= -5%. Indicator trends were presented as the percentage change over 28 years (1995 – 2022) and were considered statistically significant where the 95% confidence limits of values in 1995 and 2022 did not overlap. Annual habitat-specific indicator values were considered statistically different from each other where 95% confidence limits of values did not overlap.
Index of Abundance for Scottish Terrestrial Breeding Birds, 1994 to 2022 - Pre-release Access List
Disclaimer: We realise that some of the graphs on this page may not be fully accessible. The content of the graphs should be explained in the text and/or in the caption below the graph. If you require further assistance with this, please contact: [email protected]
References
Åkesson, S., Atkinson, P.W., Bermejo, A., de la Puente, J., Ferri, M., Hewson, C.M., Holmgren, J., Kaiser, E., Kearsley, L., Klaassen, R.H. and Kolunen, H., 2020. Evolution of chain migration in an aerial insectivorous bird, the common swift Apus apus. Evolution, 74(10), pp.2377-2391.
Balmer, D.E., Gillings, S., Caffrey, B.J., Swann, R.L., Downie, I.S., & Fuller, R.J. 2013. Bird Atlas 2007-11: the breeding and wintering birds of Britain and Ireland (Thetford: BTO Books).
Bell, M.V. & Calladine, J. 2017. The Decline of a Population of Farmland Breeding Waders: a twenty-five year case study. Bird Study 64: 264-273.
Buchanan, G.M., Pearce-Higgins, J.W., Douglas, D.J.T. & Grant, M.C. 2017. Quantifying the importance of multi-scale management and environmental variables on moorland bird abundance. Ibis 159: 744-756.
DEFRA 2024. Wild Bird Populations in England, 1970 to 2023. National Statistics, 12 November 2024.
Eaton, M., Aebischer, N., Brown, A., Hearn, R., Lock, L., Musgrove, A., … & Gregory, R. 2015. Birds of Conservation Concern 4: the population status of birds in the UK, Channel Islands and Isle of Man. British Birds 108: 708-746.
Donald, P.F., Green, R.E. & Heath, M.F. 2001. Agricultural intensification and the collapse of Europe’s farmland bird populations. Proceedings of the Royal Society B: Biological Sciences 268: 25-29.
Fewster, R.M., Buckland, S.T., Siriwardena, G.M., Baillie, S.R., Wilson, J.D., 2000. Analysis of Population Trends for Farmland Birds Using Generalized Additive Models. Ecology 81, 1970–1984. https://doi.org/10.1890/0012-9658(2000)081[1970:AOPTFF]2.0.CO;2
Fraixedas, S., Lindén, A., Piha, M., Cabeza, M., Gregory, R., Lehikoinen, A., 2020. A state-of-the-art review on birds as indicators of biodiversity: Advances, challenges, and future directions. Ecological Indicators 118, 106728. https://doi.org/10.1016/j.ecolind.2020.106728
Franks, S.E., Douglas, D.J., Gillings, S. & Pearce-Higgins, J.W. 2017. Environmental correlates of breeding abundance and population change of Eurasian Curlew Numenius arquata in Britain. Bird Study 64: 393-409.
Gregory, R.D., Noble, D., Field, R., Marchant, J., Raven, M., Gibbons, D., 2003. Using birds as indicators of biodiversity. Ornis hungarica 12, 11–24.
Gregory, R.D., van Strien, A., Vorisek, P., Gmelig Meyling, A.W., Noble, D.G., Foppen, R.P.B., Gibbons, D.W., 2005. Developing indicators for European birds. Philosophical Transactions of the Royal Society B: Biological Sciences 360, 269–288. https://doi.org/10.1098/rstb.2004.1602
Gregory, R.D., Vořišek, P., Noble, D.G., Strien, A.V., Klvaňová, A., Eaton, M., Meyling, A.W.G., Joys, A., Foppen, R.P.B., Burfield, I.J., 2008. The generation and use of bird population indicators in Europe. Bird Conservation International 18, S223–S244. https://doi.org/10.1017/S0959270908000312
Gregory, R.D., Willis, S.G., Jiguet, F., Voříšek, P., Klvaňová, A., Van Strien, A., Huntley, B., Collingham, Y.C., Couvet, D., Green, R.E., 2009. An Indicator of the Impact of Climatic Change on European Bird Populations. PLoS ONE 4. https://doi.org/10.1371/journal.pone.0004678
Hallmann, C.A., Sorg, M., Jongejans, E., Siepel, H., Hofland, N., Schwan, H., Stenmans, W., Müller, A., Sumser, H., Hörren, T. and Goulson, D., 2017. More than 75 percent decline over 27 years in total flying insect biomass in protected areas. PloS one, 12(10), p.e0185809.
Heywood, J., Massimino, D., Balmer, D., Kelly, L., Noble, D., Pearce-Higgins, J., Woodcock, P., Wotton, S., Gillings, S., Harris, S., 2023. The Breeding Bird Survey 2022. BTO Research Report 756.
Lawson, B., Robinson, R.A., Toms, M.P., Risely, K., MacDonald, S. & Cunningham, A.A. (2018) Health hazards to wild birds and risk factors associated with anthropogenic food provisioning. Phil. Trans. R. Soc. B 373:20170091.
Martay, B., Noble, D.G., 2022. Scoping the feasibility of developments to the Terrestrial Bird Indicator for Scotland - urban, farmland and wetland indicators | NatureScot (Research No. 1300). NatureScot.
Massimino, D., Johnston, A., Noble, D.G., Pearce-Higgins, J.W., 2015. Multi-species spatially-explicit indicators reveal spatially structured trends in bird communities. Ecological Indicators 58, 277–285. https://doi.org/10.1016/j.ecolind.2015.06.001
Pearce‐Higgins, J.W., Dennis, P., Whittingham, M.J., & Yalden, D.W. 2010. Impacts of climate on prey abundance account for fluctuations in a population of a northern wader at the southern edge of its range. Global Change Biology 16: 12-23.
Plummer, K.E., Risely, K., Toms, M.P. & Sirawrdena, G. M. 2019. The composition of British bird communities is associated with long-term garden bird feeding. Nature Communications 10: 2088.
Robinson, R.A., Lawson, B., Toms, M.P., Peck, K.M., Kirkwood, J.K., Chantrey, J., ... & Cunningham, A.A. 2010. Emerging infectious disease leads to rapid population declines of common British birds. PLoS one 5: e12215.
Scholefield, P., Firbank, L., Butler, S., Norris, K., Jones, L.M., Petit, S., 2011. Modelling the European Farmland Bird Indicator in response to forecast land-use change in Europe. Ecological Indicators, Spatial information and indicators for sustainable management of natural resources 11, 46–51. https://doi.org/10.1016/j.ecolind.2009.09.008
Woodward, I. D., Massimino, D., Hammond, M. J., Harris, S. J., Leech, D. I., Noble, D. G., Walker, R. H., Barimore, C., Dadam, D., Eglington, S. M., Marchant, J. H., Sullivan, M. J. P., Baillie, S. R., & Robinson, R. A. (2018). BirdTrends 2018: Trends in numbers, breeding success and survival for UK breeding birds. Research report 708. BTO.


