NatureScot Research Report 1393 - Pine Marten Surveillance in Strathspey
Published: 2026
Author: Jenny MacPherson (Vincent Wildlife Trust)
Cite as: Jenny MacPherson (Vincent Wildlife Trust) Pine Marten Surveillance in Strathspey. NatureScot Research Report 1393.
Keywords
Pine marten, Martes martes, capercaillie, Tetrao urogallus, Strathspey
Background
A report published in February 2022 by the NatureScot Scientific Advisory Committee Sub-Group highlighted the ongoing decline of capercaillie populations, attributing this trend to multiple pressures including habitat loss, human disturbance, predation, climate change, and collisions with deer fencing (NatureScot 2022). In response, the Minister for Green Skills, Circular Economy & Biodiversity issued a request in June 2023 for a survey of pine marten populations, recognising the need for improved understanding of their distribution within key capercaillie habitats.
Following a review of potential methodologies, a field-sign based survey was identified as the most cost-effective approach for tracking changes in pine marten activity across the core capercaillie range in Strathspey. This method, designed to be repeated periodically, will produce an index of activity that may serve as a proxy for an index of relative abundance.
The project had two primary objectives:
- To establish a baseline for long-term monitoring of pine marten populations in Strathspey, enabling the development of trend indices and targeting areas of overlap with capercaillie (Tetrao urogallus).
- To revisit and replicate previous detailed surveys conducted within six forest sites, incorporating these transects into a broader monitoring framework for future use.
It is important to note that this survey did not aim to produce precise population estimates or offer guidance on species management. The survey results provide an index of marten activity which is subject to a number of caveats.
Main findings
- Evidence of pine marten activity was widespread throughout Strathspey
- However, this was not uniformly distributed with approximately a third of the survey transects having no signs of pine marten activity
- The number and density of scats recorded was also very variable, being higher in some of the forests under conservation management but significantly lower elsewhere.
- A relatively high proportion (78%) of recorded scats was sent for DNA analysis and species confirmation
- The success rate of DNA species confirmation at 95.2% was very high compared with previous surveys. This could be due to a combination of factors including the experience of the surveyor, ideal weather conditions for preserving DNA in scats and the triple assay method used for DNA extraction and analysis.
Acknowledgements
We would like to thank Dr Henry Schofield and Max Henderson for their help with surveys as well as RSPB, FLS and all the landowners who gave permission for vehicle access to their land. Genetic analyses were carried out by Dr Niall McKeown at Aberystwyth University. Thank you to Rob Raynor for help in designing the survey and for commenting on the draft version of this report. We would also like to thank an anonymous reviewer whose comments greatly improved the report.
Introduction
The pine marten (Martes martes) is a medium sized mustelid associated primarily with woodland habitats across its European range. In Britain, pine martens show a strong preference for structurally complex woodland, particularly mature native and mixed forests, although they also use commercial plantations, scrub and fragmented landscapes where suitable cover and den sites are available (MacPherson 2024, Birks 2025,). Key habitat features include tree cavities, fallen timber or windthrow, and dense understorey vegetation that provide resting and denning sites (Caryl et al 2012)
Pine martens maintain relatively large home ranges that vary with sex, habitat quality and population density. Males typically occupy larger ranges than females, with reported home range sizes in Britain ranging from approximately 5-33km2 (Caryl, 2008; Balharry, 1993; Bright & Smithson, 1997; Halliwell, 1997). The species is predominantly solitary and territorial, with individuals defending exclusive or semi-exclusive home ranges, particularly among same-sex conspecifics (Powell, 1979). Territoriality is maintained through a combination of spatial avoidance and scent marking. Pine martens use scats, urine and anal gland secretions as scent marks, often deposited along linear features such as tracks, forest roads or paths and habitat boundaries (Lockie 1964, Birks et al, 2005, Birks 2025).
Pine martens were once widespread throughout Scotland. However, by the late 19th century, populations had been extirpated across much of lowland Scotland, as well as throughout southern Britain due to extensive habitat loss, hunting, and trapping as vermin (Langley and Yalden, 1977). By the early 20th century, viable populations were only found in the north-west Highlands (Ross-shire, Sutherland, and Inverness-shire) with some animals possible persisting in south-west Aberdeenshire, Perthshire, and North Argyllshire (Langley & Yalden, 1977).
The Scottish Highlands remained the species’ principal refuge in Britain, with numbers here exceeding those in the few fragmented populations that remained in England and Wales. The population in Scotland began to show signs of a slow recovery in the 1930s, attributed to a decline in gamekeeping and associated trapping during and after the First World War (Lockie, 1964). By 1946, the species had reached the northern shores of Loch Ness and had established populations south of the Caledonian Canal by the early 1960s (Lockie, 1964). During this time pine martens continued to be subject to lethal control, albeit to a lesser extent. The first national pine marten distribution survey (1980–1982) reported 230 dead specimens, with trapping, shooting, and snaring identified as the predominant causes of mortality (Velander, 1983). Nonetheless, this survey also documented continued range expansion, although some localised extinctions were noted in the north-west.
By the early 1980s, pine martens had extended their range eastward to the Monadhliath Mountains and southward to Glencoe and Dalmally, with sporadic records from Speyside and Deeside (Velander, 1983). However, prior to the species’ legal protection in 1988 under Schedule 5 of the Wildlife and Countryside Act (1981), there was only a small increase in reported range. Data from the Global Biodiversity Information Facility (GBIF) show that pine martens were recorded in 57 hectads (10km x 10km grid squares) between 1929 and 1958, increasing only to 94 hectads between 1959 and 1988 (MacPherson, 2024).
In the years following legal protection, the species showed a marked increase in range. Between 1988 and 2018, evidence of pine marten presence (scat or sightings) was recorded in 448 hectads, reflecting a substantial recovery. The second national survey in 1994 confirmed recolonisation beyond the Highlands into central and eastern Scotland (Balharry et al., 1996). More recent distribution surveys carried out by Vincent Wildlife Trust in partnership with SNH (NatureScot) in 2012 and 2013 documented further range expansion into Sutherland, Caithness, Aberdeenshire, Perthshire, southern Argyll, Stirlingshire, parts of western Angus and Fife, and even sections of the industrialised Central Belt (Croose et al., 2013, Croose et al., 2014).
A study was carried out in 2009 to investigate changes in the distribution and relative abundance of both pine martens and red foxes (Vulpes vulpes) in the Scottish Highlands over a 14-year period (Baines et al., 2013). Researchers revisited 11 forest sites originally surveyed in 1995 and added five new sites in 2009, using consistent field methods across both time points. To improve the reliability of abundance indices derived from field-identified scats, scats were collected and species confirmed using DNA analyses which were used to develop correction factors for field-identified scats. After applying corrections, the marten sign index showed a 3.9-fold increase since 1995. It was suggested that these results reflected a substantial rise in the activity or presence of both species over recent decades, with pine martens showing a particularly pronounced increase. By using the same tracks and sampling regime, the authors considered that comparisons between the 1995 and 2009 surveys reflected changes in abundance rather than activity levels. However, with only two survey years available, it was difficult to determine whether the observed differences represented a population trend or merely interannual variation.
Scat surveys have been used in wide-scale or national pine marten distribution surveys in Scotland (Velander 1983; Balharry et al. 1996; Croose et al. 2013; 2014) and Ireland (O'Mahony et al., 2012), as well as for dietary studies (Coope, 2007, Caryl et al., 2012, Kubasiewicz, 2014) and genetic population assessments (Mullins et al., 2010, Croose et al., 2016). The standardised method for scat surveys involves surveying transects along tracks or paths in forestry, where pine martens commonly deposit scats (Balharry 1993). Transects for earlier surveys were typically 1km (Balharry et al. 1996; Croose et al. 2013; 2014) however, it has been shown that, for pine martens, the probability of detecting the species during a survey if it is truly present at the site (known as detection probability) is notably higher for 1.5km transects (0.58) than for 1km transects (0.35) (McHenry et al., 2016). The increased transect length samples a greater area and increases opportunities for encounter, thereby improving detectability and reducing the likelihood of false absences. Using longer transects therefore improves inference on site occupancy while reducing bias associated with imperfect detection. Seasonal variation may influence the results of pine marten scat surveys. It has been observed that scat density (scats/km) varies greatly from month to month, being more than 100 times greater in July than in January (Velander, 1986). This fits the prediction that marking activity should be highest during the summer (July/August), when adults are mating and the population is increased by the presence of newly independent young. Conversely, pine marten activity is greatly reduced during the winter months (Zalewski, 2000).
In areas where pine martens occur at low densities, territorial scent marking behaviour may be reduced (Birks et al, 2005, Birks, 2025). Although Lockie (1964) first proposed a relationship between number of scats and pine marten abundance, subsequent evidence has been inconclusive. A review of nine scat surveys from the UK and Spain found that the relationship between scat abundance on transects and pine marten numbers was yet to be established (Birks et al, 2005). A more recent study by Sheehy et al (2014) found that scat density was higher in areas of higher pine marten abundance, but regression analysis failed to define this possible relationship. Kubasiewicz et al (2017) also urged caution in inferring pine marten density from scat abundance. They found a significant negative non-linear relationship between pine marten home range size and scat counts, suggesting a positive effect of population density on scat abundance but only at relatively low densities.
Scat counts, for the purposes of monitoring pine martens, provide a relative index of activity or use, not abundance. They reflect a combination of marten presence, intensity of use of the transect area, defecation behaviour and the persistence/removal of scats (i.e. from deterioration or scavenging).
Methods
Survey area
The targeted survey area comprised of the 14 hectads covering the forests along Strathspey, corresponding with the current range of Capercaillie in Strathspey. These were NH70, NH80, NH81, NH82, NH90, NH91, NH92, NJ01, NJ02, NJ03, NJ13, NN79, NN88 and NN89 (shown in Figure 1).
The longer transects of up to 10km used in previous assessments of 1995 and 2009 were within hectads NH81, NH82, NH90, NH91, NJ01 (see Baines, et al., 2004 and 2011). Maps of these transects were provided by NatureScot, so that these transects could be repeated to enable a direct comparison with the earlier surveys. The transect data could then be used in two separate analyses: (a) the main suite of all hectads, covering a large area and (b) a subset of these that include Rothiemurchus, Craigmore, Inverlaidnan, Kinveachy, Abernethy and Glenmore forests (the “key forests”).
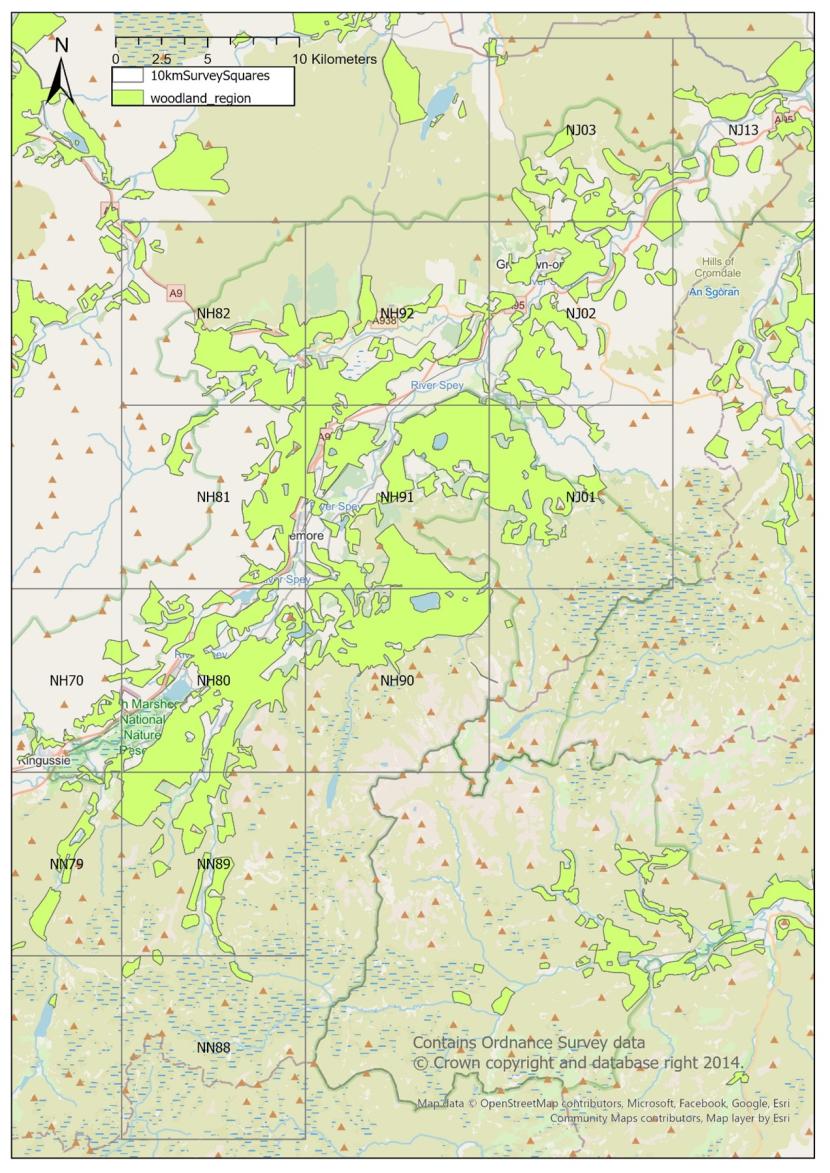
Figure 1. Map showing the survey area and variable extent of woodland habitat for pine martens within each of the hectads (10km x 10km square).
As shown in figure 1, some of the specified hectads contain large amounts of woodland (i.e. NH80, NH91), whereas others (such as NN88) contain hardly any. The remainder contain varying amounts of woodland clustered in part of a hectad (i.e. NN79, NH90). Because of the clumped distribution of woodland, each hectad was further divided into tetrads (2km x 2km square) and in each hectad that contained more than 50% woodland, the aim was to survey a transect of 1.5km.
Within five hectads covering the key forests, transects were included within one or more longer transects of up to 10km as used in previous assessments (Baines et al., 2004, Baines et al., 2013) and replicated, as closely as practicable, the routes followed in these earlier surveys. In order to maximise comparability with the earlier (April) surveys of the six key forests, all surveys were carried out during the same month of April.
Each transect was allocated a unique identifier number (UID) matched to a 10 figure National Grid Reference using a GPS corresponding to the start point of the transect (these are shown in Table 1). In addition to the 1.5km transects selected in each hectad, a series of reserve transects was also selected at random in case any of the first choice transects could not be surveyed for any reason (e.g. access unsafe, woodland clearance in progress). All data were stored in ArcPro 3.5.0.
Diversionary feeding or other significant external factors could influence pine marten activity. At the time the survey was commissioned, diversionary feeding (DF) was planned in Glen Feshie (Wildlands), Rothiemurchus, Glenmore/Loch Morlich, Abernethy and Craigmore, with the potential addition of Invereshie/Inshriach and Dell woods (by Abernethy). While there is no evidence that DF would actually skew the marten survey results, as a precaution we avoided the period when DF takes place. It was confirmed by liaison with the Cairngorms Connect Predator Project that this was not going to commence until the beginning of May, by which time our surveys were concluded.
In most of the survey sites, daytime restrictions applied to avoid disturbing lekking capercaillie so that surveys could only take place along tracks between 10am and 5pm.
Selection of transect routes
Transects were routed along forest tracks, footpaths or trails within woodland. In order to complete the surveys within the time frame, they were sited at locations with easy access for surveyors, such as close proximity to a public road or a forest track with landowner permission for vehicular access (examples of transects are shown in figure 2).
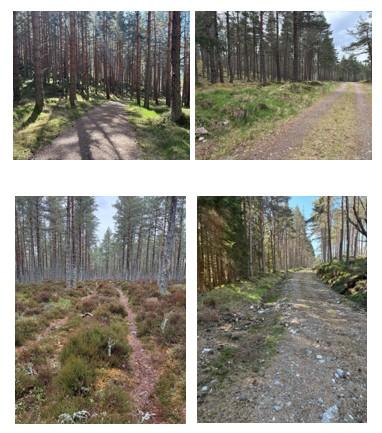
Figure 2. Photos of some of the transect routes showing the types of forest roads and tracks surveyed.
Transects were preselected from OS maps prior to surveys commencing. These were sent to NatureScot and the RSPB Capercaillie Advisory team at RSPB in order that they could highlight any issues with potential disturbance to leks and suggest alternative routes. If surveyors arrived at a transect to find it unsuitable for scat survey (e.g if woodland was no longer present) or inaccessible due to harvesting operations or access constraints, then an alternative transect was surveyed unless no suitable replacement was available. The final set of surveyed transects is shown in figure 3.
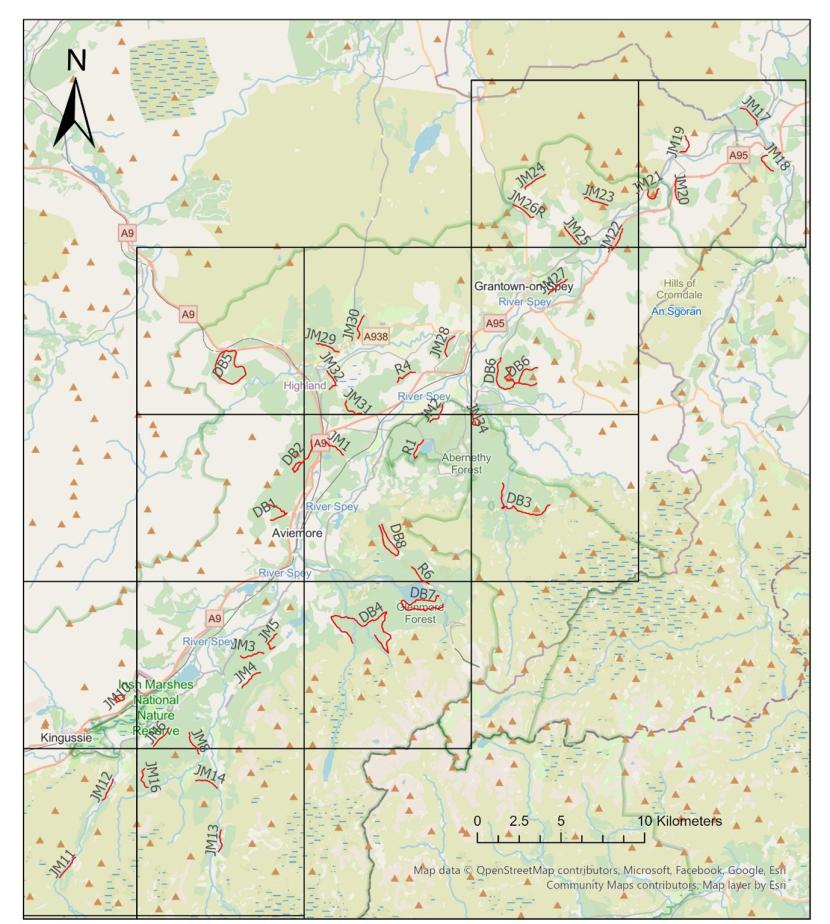
Figure 3. Showing all surveyed transects (red). Those with the prefix JM or R(reserve) were 1.5km in length, whereas those with the prefix DB were transects from the previous surveys and were of variable lengths of up to 10km (details in table 1).
Survey methods
Scat surveys were carried out between 8th and the 30th of April 2025. The same highly experienced surveyor (JM) carried out all surveys, accompanied by a trained volunteer (HS or MH). The surveyors walked each transect for 1.5km, measured using a handheld GPS unit, or for the longer distance of the repeat transects following maps of the previous survey routes provided by NatureScot. Surveyors counted and recorded all possible marten scats, including scats that could be from pine marten, but where there was low confidence. Scats were classified as high, medium or low confidence. High confidence was defined as relatively fresh scat with a defined coiled or twisted shape characteristic of marten scat and with a discernible sweet ‘marteny’ odour or no obvious fox smell. Medium confidence scats were those that morphologically looked like classic marten scat, but where no odour could be discerned. Low confidence scats were those that were old or squashed with no clear twisted shape and no smell, which therefore might have been from pine marten or fox. A representative sample of each category was collected for DNA analysis. Each scat was collected using a new, pre-labelled sample bag to avoid any contamination and recorded, along with date and grid reference. Samples were frozen the same day and kept frozen until they were sent for DNA analysis at the University of Aberystwyth for species identification. Any obvious fox scats (those with a strong and distinctive fox odour) were counted and recorded. The scats that were classified as ‘low confidence’ included those where the surveyors could not be certain if they were from pine marten or fox.
Each of the six key forests where the longer (DB#) transects were resurveyed has a history of capercaillie productivity monitoring. The two previous studies undertaken in 1995 and 2009 assessed predator activity along ca.10km of transects in each, based on scat counts (for pine marten and fox). We carried out a single repeat survey of each of these transects to partially replicate the methodology of Baines, et al. (2011), enabling a degree of comparison with this earlier work. However, the predator indices used in Baines, et al., 2004 and 2011 were calculated from five visits to each site, including an initial scat clear-up round in April, and expressed as no. scats/10km/day x 100. For the current survey, only one visit was required, and scat counts are therefore expressed as a basic encounter rate (no. scats/km) corrected for identification error (from DNA testing). Comparison with the earlier data will therefore be restricted to the count data from 1995 and 2009 initial clear-up rounds only.
DNA analysis
DNA was extracted from individual scat samples using the QIAamp Fast DNA stool kit (Qiagen) following manufacturer's instructions. Species identity was investigated by subjecting samples to a series of polymerase chain reactions (PCRs) using different primer combinations to remove any biases due to false negatives.
Stage 1: The first set of PCRs involved combinations of primers commonly used in previous pine marten studies. Specifically, PCRs were performed with the primer H16498 (5’- CCTGAAGTAAGAACCAGATG-3’) and LRCB1 (5’-TGGTCTTGTAAACCAAAAATG-3’) and where these did not yield products, the samples were repeated using H16498 alongside the primer LRCB3 (5’-AGACTCAAGGAAGAAGCAAC-3’).
Stage 2: Any samples not yielding PCR products at this stage were then subjected to PCRs using newly designed (from publicly accessible genome sequences) primers PMCRF (5’-GCACCCAAAGCTGACATTC-3’) AND PMCRR (5’-CTGTGCGATGCGGATAAATG-3’).
Stage 3: As all PCR products generated by previous stages were > 300bp an important consideration was that negative PCR results could reflect false negatives due to DNA degradation rather than true species sequence divergence. Therefore, as a final stage, new primers were designed to enable efficient amplification of short sequence reads and thus, better suited to analysis of degraded DNA. All samples which provided no PCR amplicons as parts of stage 1 and stage 2 were subjected to PCR using these new primers. The short read primer sequences for pine marten were 5’-ACTTTTTCCCCACCCCTATG-3’ and 5’- CGGAGCGAGAAGAGGTACAC-3’. At this stage, samples were also tested using similar short read primers for fox, as this was considered the most likely species leading to misidentification (forward primer = 5’- ATTACTGCTATGCCCCATGC-3’ and reverse primer = 5’-CGAGGCATGGTGATAAATCC-3’).
PCR products generated at each stage were sequenced using Big Dye technology on an AB3500 sequencing platform (Life Technologies). Sequencing reactions used the first listed primer in each case. DNA sequence reads were analysed using the software Chromas and BioEdit. Species identity was confirmed using BLAST.
Results
The weather throughout the survey period was warm and dry. A total distance of 94km was surveyed, consisting of 41 transects across Strathspey. Details of surveyed transects are shown in Table 1. Hectad NN88 was not included in the survey due to the small amount of woodland. Of the transects initially proposed, JM26 was not surveyed due to capercaillie activity but was replaced by JM26R, JM7 had been clearfelled and no replacement was found. JM8 was moved as there were high levels of disturbance along the original transect. R6 was surveyed in place of JM33 and the remaining three reserve transects (R2, R3 and R5) were not used.
| transect_ID | transect length (km) | Total scats recorded | Number of scats collected | start grid ref | scats/km |
|---|---|---|---|---|---|
| DB1 | 2.6 | 1 | 1 | NH8799813675 | 0.38 |
| DB2 | 3.5 | 9 | 8 | NH9044818485 | 2.57 |
| DB3 | 5.6 | 10 | 8 | NJ0473314574 | 1.78 |
| DB4 | 10 | 8 | 8 | NH9278406626 | 0.8 |
| DB5 | 6.3 | 23 | 14 | NH8584323811 | 3.65 |
| DB6 | 5 | 19 | 16 | NJ0178723367 | 3.8 |
| DB7 | 7 | 10 | 10 | NH9803709110 | 1.43 |
| DB8 | 4.5 | 15 | 10 | NH9557811565 | 3.33 |
| JM1 | 1.5 | 1 | 1 | NH9123418365 | 0.66 |
| JM10 | 1.5 | 5 | 5 | NH7877402746 | 3.33 |
| JM11 | 1.5 | 1 | 1 | NN7633993488 | 0.66 |
| JM12 | 1.5 | 0 | 0 | NN7854998166 | 0 |
| JM13 | 1.5 | 4 | 0 | NN8487893813 | 2.66 |
| JM14 | 1.5 | 0 | 0 | NN8353198080 | 0 |
| JM16 | 1.5 | 3 | 2 | NN8048198809 | 2 |
| JM17 | 1.5 | 2 | 2 | NJ1713937347 | 1.33 |
| JM18 | 1.5 | 0 | 0 | NJ1770235512 | 0 |
| JM19 | 1.5 | 3 | 2 | NJ1241435693 | 2 |
| JM2 | 1.5 | 0 | 0 | NH9828420556 | 0 |
| JM20 | 1.5 | 3 | 3 | NJ1228634074 | 2 |
| JM21 | 1.5 | 3 | 3 | NJ1055533444 | 2 |
| JM22 | 1.5 | 0 | 0 | NJ0838629821 | 0 |
| JM23 | 1.5 | 0 | 0 | NJ0676332916 | 0 |
| JM24 | 1.5 | 0 | 0 | NJ0324033484 | 0 |
| JM25 | 1.5 | 8 | 7 | NJ0650030149 | 5.33 |
| JM27 | 1.5 | 2 | 2 | NJ0461527167 | 1.33 |
| JM28 | 1.5 | 0 | 0 | NH9854723464 | 0 |
| JM29 | 1.5 | 0 | 0 | NH9208223728 | 0 |
| JM3 | 1.5 | 3 | 2 | NH8758405689 | 2 |
| JM30 | 1.5 | 0 | 0 | NH9321324523 | 0 |
| JM31 | 1.5 | 4 | 3 | NH9342720082 | 2.66 |
| JM32 | 1.5 | 0 | 0 | NH9136722620 | 0 |
| JM34 | 1.5 | 0 | 0 | NJ0011620085 | 0 |
| JM4 | 1.5 | 3 | 2 | NH8626603620 | 2 |
| JM5 | 1.5 | 1 | 0 | NH8826506101 | 0.66 |
| JM6 | 1.5 | 7 | 7 | NH8192601257 | 4.66 |
| JM8 (moved) | 1.5 | 6 | 3 | NN8371699691 | 4 |
| R1 | 1.5 | 0 | 0 | NH9714818461 | 0 |
| R4 | 1.5 | 4 | 4 | NH9665022513 | 2.66 |
| R6 FOR JM33 | 1.5 | 4 | 2 | NH9745809865 | 2.666666667 |
| JM26R | 1.5 | 0 | 0 | NJ0373831820 | 0 |
| totals | 94 | 162 | 126 | - | - |
The number of putative marten scats recorded was 162 plus 30 definite fox scats. Fox scat was recorded on 10 transects but not collected. Of the 162 presumed pine marten scats, 126 (78%) were sent for DNA extraction and species identification. From DNA analysis, 120 of the 126 (95.2%) were confirmed as being pine marten, 3 (2.4%) were fox and a further 3 (2.4%) could not be determined. These are shown in table 2. As a result of the high accuracy and the high proportion of scats sent for DNA confirmation, a correction factor was not applied to the remaining scats. The surveyor’s confidence level was reflected to some extent in the DNA confirmation of species with only 87.9% of the low confidence scats being pine marten but the correct assignment to species in the field of the medium and high confidence scats was very similar (98% and 97% respectively) and one fox scat was identified in each of the confidence categories. However, all three scats where species could not be identified were in the low confidence category.
| Category | n | Confirmed pine marten (%) | Confirmed fox (%) | Species not determined (%) |
|---|---|---|---|---|
| Low confidence | 33 | 29 (87.9) | 1 (3.03) | 3 (9.1) |
| Medium confidence | 62 | 61 (98) | 1 (1.6) | 0 (0) |
| High confidence | 31 | 30 (97) | 1 (3.2) | 0 (0) |
| Totals | 126 | 120 | 3 | 3 |
Pine marten scat was found on 27 of the surveyed transects, whereas the remaining 14 transects had no evidence of pine marten activity. This is shown in figure 4.
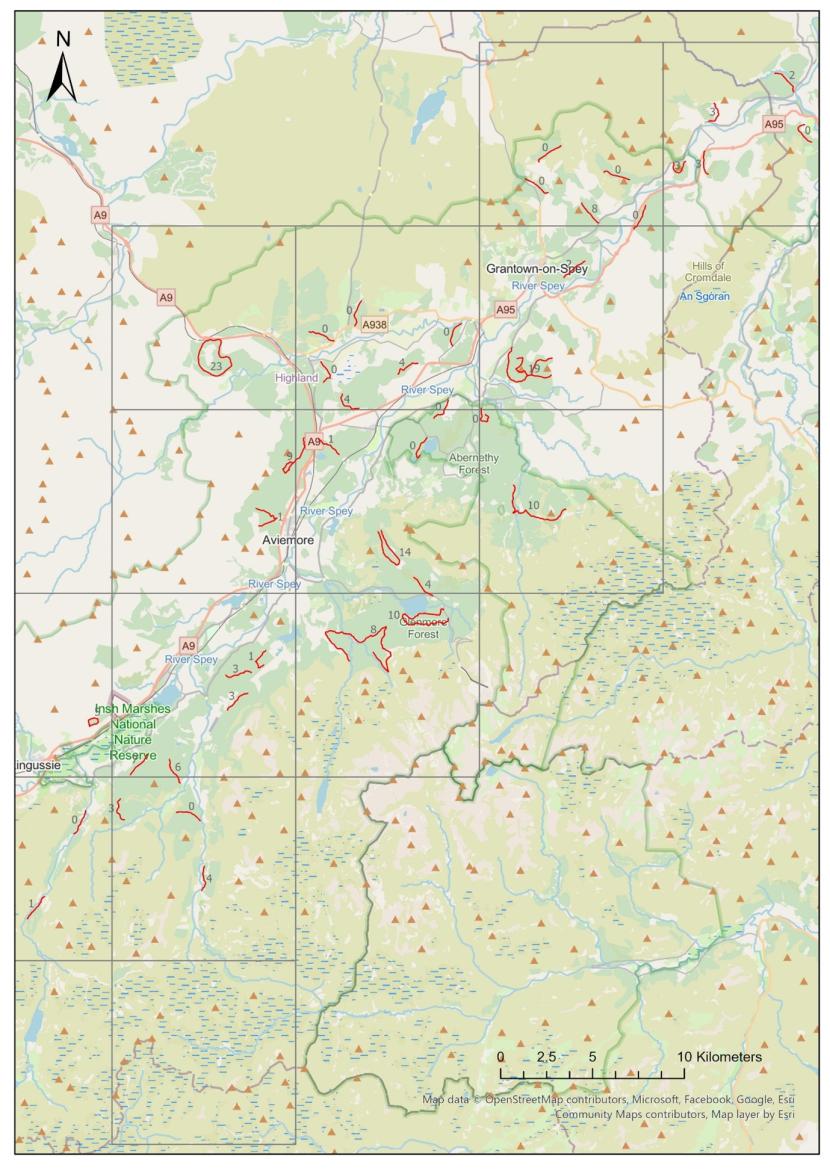
Figure 4. Showing the total number of pine marten scats found on each surveyed transect.
Click for a full description
Map of Strathspey with all surveyed transects labelled with the total number of pine marten scats found on each one.
The mean density (number per km surveyed) of marten scats across all transects was 1.52 (SD=0.2), with a minimum of 0 and a maximum of 5.3.
Evidence of pine marten activity across Strathspey was variable with the highest densities of scats found on transects in forests under conservation management. These corresponded with transects repeated from the earlier surveys. A Mann-Whitney U test indicated that there was a significant difference in mean scats per km surveyed between the repeat (DB) transects and the new (JM/R) transects (W=246, p=0.0001, DB mean=2.22, JM/R mean=1.39).
The density of pine marten scats found on the repeat survey transects in the six key forests was very similar in 2025 to the numbers recorded on the 2009 survey. This is shown in table 3.
| forest | Length surveyed 2009 | Marten scats/km 2009 | Length surveyed 2025 | Marten scats/km 2025 |
|---|---|---|---|---|
| Abernethy | 11 | 3.9 | 5.6 | 1.8 |
| Craigmore | 5 | 4 | 5 | 3.8 |
| Glenmore | 11.5 | 2.2 | 11.5 | 2.2 |
| Kinveachy | 6.5 | 1.8 | 6.5 | 1.5 |
| Rothiemurchus | 10 | 0.4 | 10 | 0.8 |
| Seafield/Inverlaidnan | 6.3 | 3.3 | 6.3 | 3.6 |
The only difference was in Abernethy but this may be due to the shorter length surveyed in 2025 as a result of restrictions due to active capercaillie leks and one path no longer being accessible. Densities of scats classified as fox in 2009 and 2025 are shown in table 4. This was lower at one forest (Craigmore) and higher at another (Kinveachy), but broadly similar at the remaining four forests.
| Forest | Fox scats/km 2009 | Fox scats/km 2025 |
|---|---|---|
| Abernethy | 0.27 | 0.2 |
| Craigmore | 1.6 | 0 |
| Glenmore | 1.3 | 1.1 |
| Kinveachy | 0.31 | 1.1 |
| Rothiemurchus | 0.2 | 0.1 |
| Seafield/Inverlaidnan | 0.32 | 0.32 |
The total length surveyed per hectad was related to the amount of woodland within each square. However, Spearman’s rank correlation indicated no association between total length surveyed and scat density per hectad (p =0.10, p=0.723, n=14) suggesting that variation in survey effort did not systematically influence density estimates (shown in table 5).
| OS Grid square | Total length surveyed (km) | Density of marten scats (no./km surveyed) 2025 |
|---|---|---|
| NH70 | 1.5 | 3.33 |
| NH80 | 7.5 | 2.67 |
| NH81 | 4.35 | 1.15 |
| NH82 | 6.3 | 3.65 |
| NH90 | 17 | 1.06 |
| NH91 | 11.5 | 2.17 |
| NH92 | 9.75 | 0.82 |
| NJ01 | 10.6 | 2.74 |
| NJ02 | 1.5 | 1.33 |
| NJ03 | 7.5 | 1.07 |
| NJ07 | 1.5 | 0.00 |
| NJ13 | 7.5 | 1.47 |
| NN79 | 3 | 0.33 |
| NN89 | 4.5 | 1.56 |
Discussion
Monitoring elusive carnivores like the pine marten is essential for conservation and management, especially in regions where populations are recovering or expanding. Traditional methods such as live trapping and radio telemetry, while effective, are often costly, invasive, and logistically challenging. Scat surveys, such as the one presented here, offer a non-invasive alternative. The advantages of scat surveys are that they avoid stress and risk to the animals while still providing some ecological insights (Birks et al., 2005). Compared with other non-invasive methods such as camera trapping, scat surveys require minimal equipment and can be carried out by trained field staff or volunteers. This makes them suitable for large scale or long-term monitoring programmes (Croose et al., 2019).
Nonetheless, scat surveys do present challenges and have their own limitations. Pine marten scats are morphologically similar to those of other carnivores such as foxes, therefore without genetic confirmation, species misidentification is a risk, particularly if less experienced surveyors are used. Scat counts can be useful for confirming species presence and mapping distribution. However, detection is not perfect, scat density does not directly translate to individual numbers and scat density is only a crude proxy for animal density or abundance. It should rather be interpreted as a relative index of activity. Scat deposition is influenced by individual behaviour, territorial marking and habitat use. Some individuals may defecate more frequently or in more detectable locations, skewing results. Scat detectability also varies with weather, terrain and vegetation. Rain, snow and leaf litter can obscure or degrade scats, while seasonal changes in movement and diet can affect deposition rates (Birks et al 2005).
Despite limitations, when combined with genetic tools, scat surveys remain a valuable non-invasive method for monitoring elusive carnivores and have been instrumental in documenting pine marten recovery and guiding conservation management. The survey presented here was designed to provide a baseline for future monitoring of pine marten distribution and activity across the Strathspey region. By expanding on previous surveys which focussed on a small number of forests within the region, this has provided a bigger picture and suggests that pine marten activity is not distributed uniformly throughout the region. Evidence of pine marten presence varied across the study area, with the greatest concentration of scats observed along transects located in forests managed primarily for conservation, with the exception of Inverlaidnan. Other studies have also reported that pine marten densities show strong spatial heterogeneity across landscapes, largely driven by habitat quality and land-use patterns (Hobson, 2023; Bartolommei et al. 2016). At study sites across four regions of Scotland including the Cairngorms, Hobson (2023, 2025) found that the amount of forest had a positive effect on pine marten densities but proximity to large gamebird shoots had a negative effect.
Adult pine martens typically show high fidelity to established home ranges, which remain broadly consistent across years. Nonetheless, they often make seasonal adjustments in how they use these areas, including modest shifts in range centres and variation in range size. Telemetry studies have demonstrated that adults use the same general area from year to year (O’Mahony, 2014; Larroque et al, 2018). but with home ranges of both males and females being up to 25% larger in spring-summer than autumn-winter (Zalewski et al., 2004). Other seasonal changes do occur, but these usually involve shifting the focal parts of the range (such as foraging and denning sites) rather than relocating to entirely new areas. One multi-site study reported a mean seasonal shift in range centres of only ~0.25 km, indicating strong territorial stability (Zalewski et al 2006).
In the survey carried out in 2009 (Baines et al, 2011, 2013), DNA analysis confirmed that surveyors had correctly identified 77% of scats to species (fox or pine marten) but, of the scats incorrectly identified in the field, there was a bias towards identifying marten scats as fox scats. When a correction factor was applied, the corrected marten sign index showed an increase of 3.9 fold since the preceding survey in 1995. It should be noted that this survey also included forests in Aberdeenshire, Moray, Perthshire and Easter Ross.
In 2025, the number and density of pine marten scats recorded along the repeat transects in the six principal forests within Strathspey closely matched the figures documented at the first clear up round during the 2009 survey. With the exception of Abernethy, these particular transects followed exactly the routes surveyed in earlier studies. This suggests that there has been no increase in marten activity at these sites since 2009. However, it is suggested that an in-depth analysis should explore this with the full dataset from the 1995 and 2009 surveys held by NatureScot. For the 2025 survey, all scats that could potentially be from pine marten were recorded. This included those that could either have been from pine marten or fox. A much higher proportion of these was sent for DNA analysis in 2025 than in 2009 (78% compared with 30%) and the surveyor accuracy of species identification for pine marten was very high (95.2%). Nonetheless, only 2% of the collected scats were confirmed as fox and a further 2% could not be identified from DNA. Scats were only recorded in the field as fox if they had a very strong and distinctive fox odour, and therefore we have high confidence that these were not misidentified, however they were not collected for DNA verification. At the sites repeated from surveys in 2009, the numbers and densities of scats recorded as fox was very similar in 2025.
The present study employed a tiered approach to DNA analysis for pine marten detection. Initially, Assay 1 used PCR and sequencing with a commonly used primer pair, but samples that failed to yield results were then tested with Assay 2, which utilized a different standard primer set. Despite these efforts, some samples remained inconclusive, likely due to degraded DNA and the difficulty of amplifying larger PCR products. To address this, Assay 3 was developed using pine marten-specific primers that produce a small, easily amplifiable product. This assay does not require sequencing to confirm pine marten presence, making it more cost-effective. To further ensure accuracy, a similar assay was designed for fox DNA, allowing for cross-verification as pine marten DNA does not amplify with fox primers and vice versa. This final step successfully resolved some previously ambiguous samples and improved overall detection reliability.
The survey presented here provides a useful baseline for future monitoring, but it is suggested that repeat surveys are complemented with studies using methods such as camera trapping and/or hair traps combined with individual genotyping to derive population estimates. Croose et al (2019) found that not all individuals present in an area were detected by a single method such as scat surveys. Live trapping and hair tube methods tended to detect more male pine martens, while scat sampling showed a bias toward female detections. However, that study's genotyping success rates for non-invasive samples were relatively low (44% for hair samples and 32% for scats) leading to the conclusion that additional individuals were likely present but went undetected due to poor DNA quality that prevented successful amplification and genotyping.
The success rate for species identification from scats collected in our survey was high compared with previous, similar studies. Since the survey by Baines et al in 2009, DNA analysis techniques have advanced significantly, enhancing both the sensitivity and efficiency of wildlife genetic studies. Improvements in polymerase chain reaction (PCR) protocols and the development of species-specific primers have increased the success rate of amplifying DNA from degraded or low-quality samples, such as those found in environmental scat surveys. High-throughput sequencing technologies now allow for faster and more cost-effective processing of large sample sets, while also reducing the need for sequencing when species-specific assays are used. Additionally, the integration of multiplex PCR and real-time qPCR has streamlined workflows and improved accuracy in species identification. These innovations have made non-invasive genetic monitoring more accessible and reliable, particularly for elusive species like the pine marten. One interesting result from our survey is that the surveyor level of confidence in samples recorded in the field was not reflected in the accuracy rate. There was only a very slightly lower rate of DNA confirmation as pine marten in the low confidence category (87.9%) compared to the medium (98%) and high (97%) confidence categories.
As methods for DNA amplification and genetic analyses advance and costs reduce, there could be benefits of using DNA analysis and genotyping to identify scats to individuals in future surveys. This might identify potential biases in the data if some individuals or sexes are over or under-represented in scat surveys. Previous work has shown that some individuals are not detected at all in scat surveys, but do show up in hair tubes and vice versa (Croose et al, 2019), highlighting differences in behaviour that may be related to human disturbance, territoriality, dominance hierarchies, neophobia or other factors.
To maximise the long-term value of this survey, it is recommended that it be repeated periodically using the same methods and transects. This consistency would enable the resulting dataset to be analysed using Generalised Linear Mixed Models (GLMMs), which are particularly well suited to repeated ecological surveys. GLMMs allow trends to be assessed while explicitly accounting for the non-independence of repeated observations from the same sites and can accommodate common survey response variables such as presence-absence or counts. By modelling natural variation between sites or years as random effects rather than ignoring it, GLMMs provide a more realistic and statistically robust framework for detecting change over time. Repeating the survey in this way would therefore support reliable trend detection and strengthen confidence in conclusions.
References
BAINES, D., AEBISCHER, N., MACLEOD, A. & WOODS, J. 2011. Assessing the activity of predators in relation to capercaillie hen densitites and breeding performance. Scottish Natural Heritage Commissioned Report No. 415.
BAINES, D., AEBISCHER, N., MACLEOD, A. & WOODS, J. 2013. Pine marten Martes martes and red fox Vulpes vulpes sign indices in Scottish forests: population change and reliability of field identification of scats. Wildlife Biology, 19, 490-495.
BAINES, D., MOSS, R. & DUGAN, D. 2004. Capercaillie breeding success in relation to forest habitat and predator abundance. Journal of Applied Ecology, 59-71.
BALHARRY, E., MCGOWAN, G., KRUUK, H. & HALLIWELL, E. 1996. Distribution of pine martens in Scotland as determined by field survey and questionnaire. SNH Research Survey and Monitoring Report
BALHARRY, D. 1993. Factors affecting the distribution and population density of pine martens (Martes martes L. in Scotland. PhD, University of Aberdeen.
BARTOLOMMEI, P., MANZO, E. & COZZOLINO, R. 2016. Seasonal spatial behaviour of pine marten Martes martes in a deciduous oak forest of central Italy. Mammal Research 61, 319–326.
BIRKS, J., MESSENGER, J., BRAITHWAITE, T., DAVISON, A., BROOKES, R. & STRACHAN, C. 2005. Are scat surveys a reliable method for assessing distribution and population status of pine martens? Martens and fishers (Martes) in human-altered environments: an international perspective. Springer.
BRIGHT, P. W. & SMITHSON, T. J. 1997. Species Recovery Programme for the Pine Marten in England: 1995-96. English Nature Research Report No. 240. Peterborough: English Nature.
CARYL, F. M., QUINE, C. P. & PARK, K. J. 2012a. Martens in the matrix: the importance of nonforested habitats for forest carnivores in fragmented landscapes. Journal of Mammalogy, 93, 464–474.
CARYL, F. M., RAYNOR, R., QUINE, C. P. & PARK, K. 2012b. The seasonal diet of British pine marten determined from genetically identified scats. Journal of Zoology, 288, 252-259.
CARYL, F. M. 2008. Pine marten diet and habitat use within a managed coniferous forest. PhD, University of Stirling.
COOPE, R. 2007. A preliminary investigation of the food: and feeding behaviour of pine martens Martes martes in productive forestry from an analysis of the contents of their scats collected in Inchnacardoch forest, Fort Augustus. Scottish Forestry, 61.
CROOSE, E., BIRKS, J. D., MARTIN, J., VENTRESS, G., MACPHERSON, J. & O’REILLY, C. 2019. Comparing the efficacy and cost-effectiveness of sampling methods for estimating population abundance and density of a recovering carnivore: the European pine marten (Martes martes). European Journal of Wildlife Research, 65, 37.
CROOSE, E., BIRKS, J. D., O’REILLY, C., TURNER, P., MARTIN, J. & MACLEOD, E. T. 2016. Sample diversity adds value to non-invasive genetic assessment of a pine marten (Martes martes) population in Galloway Forest, southwest Scotland. Mammal Research, 61, 131-139.
CROOSE, E., BIRKS, J. D. S. & SCHOFIELD, H. W. 2013. Expansion Zone Survey of Pine Marten (Martes martes) Distribution in Scotland. Scottish Natural Heritage Commissioned Report No. 520.
CROOSE, E., BIRKS, J. D. S., SCHOFIELD, H. W. & O'REILLY, C. 2014. Distribution of the pine marten (Martes martes) in southern Scotland in 2013. Scottish Natural Heritage Commisioned Report No. 740.
HALLIWELL, E. C. 1997. The ecology of red squirrels in Scotland in relation to pine marten predation. PhD, University of Aberdeen
HOBSON, K. 2023. Recovering native predators in multi-use landscapes: an ecological and social case study of the pine marten in the UK. PhD, University of Aberdeen
HOBSON, K., SUTHERLAND, C., WAGGERSHAUSER, C.N., DAWSON, D. and LAMBIN, X., 2025. Both forest cover and land management practices explain variation in recovering pine marten densities
KUBASIEWICZ, L. M. 2014. Monitoring European pine martens (Martes martes) in Scottish forested landscapes. PhD, Stirling University.
KUBASIEWICZ, L. M., QUINE, C. P., SUMMERS, R. W., COOPE, R., COTTRELL, J. E., A'HARA, S. W. & PARK, K. 2017. Non-invasive genotyping and spatial mark-recapture methods to estimate European pine marten density in forested landscapes. Hystrix, the Italian Journal of Mammalogy, 28, 265–271.
LANGLEY, P. & YALDEN, D. 1977. The decline of the rarer carnivores in Great Britain during the nineteenth century. Mammal Review, 7, 95-116.
LARROQUE, J., RUETTE, S., VANDEL, J.M. and DEVILLARD, S., 2018. Home-range size and fidelity of two sympatric Martes species. Canadian Journal of Zoology, 96(11), 1272-1277.
LOCKIE, J. 1964. Distribution and fluctuations of the pine marten, Martes martes (L.), in Scotland. The Journal of Animal Ecology, 349-356.
MACPHERSON, J. 2024. Stoats, weasels, martens and polecats, London, Harper Collins.
MCHENRY, E., O'REILLY, C., SHEERIN, E., KORTLAND, K. & LAMBIN, X. 2016. Strong inference from transect sign surveys: combining spatial autocorrelation and misclassification occupancy models to quantify the detectability of a recovering carnivore. Wildlife Biology, 22, 209-216.
MULLINS, J., STATHAM, M. J., ROCHE, T., TURNER, P. D. & O’REILLY, C. 2010. Remotely plucked hair genotyping: a reliable and non-invasive method for censusing pine marten (Martes martes, L. 1758) populations. European Journal of Wildlife Research, 56, 443-453.
NATURESCOT 2022. Review of Capercaillie conservation and management - report to the Scientific Advisory Committee. NatureScot.
O'MAHONY, D., O'REILLY, C. & TURNER, P. 2012. Pine marten (Martes martes) distribution and abundance in Ireland: A cross-jurisdictional analysis using non-invasive genetic survey techniques. Mammalian Biology, 77, 351-357.
O’MAHONY, D.T., 2014. Socio-spatial ecology of pine marten (Martes martes) in conifer forests, Ireland. Acta theriologica, 59(2), pp.251-256.
POWELL, R. A. 1979. Mustelid spacing patterns: variations on a theme by Mustela. Zeitschrift für Tierpsychologie, 50, 153–165.
SHEEHY, E., O’MEARA, D. B., O’REILLY, C., SMART, A. & LAWTON, C. 2014. A non-invasive approach to determining pine marten abundance and predation. European Journal of Wildlife Research, 60, 223-236.
VELANDER, K. 1983. Pine Marten Survey of Scotland, England and Wales, 1980-1982, Vincent Wildlife Trust.
VELANDER, K. 1986. A study of pine marten ecology in Inverness-shire. Peterborough: Nature Conservancy Council.
ZALEWSKI, A. 2000. Factors affecting the duration of activity by pine martens (Martes martes) in the Białowieża National Park, Poland. Journal of Zoology, 251, 439-447.
ZALEWSKI, A., JEDRZEJEWSKI, W. and JEDRZEJEWSKI, B., 2004. Mobility and home range use by pine martens (Martes martes) in a Polish primeval forest. Ecoscience, 11(1), pp.113-122.
ZALEWSKI, A. and JEDRZEJEWSKI, W., 2006. Spatial organisation and dynamics of the pine marten Martes martes population in Białowieza Forest (E Poland) compared with other European woodlands. Ecography, 29(1), pp.31-43)