NatureScot Research Report 1374 - Scoping a wintering sawbill duck survey for Scottish salmon rivers
Published: 2026
Authors: Calladine, J.1, Wetherill, A.1, Darvill, B.1, Willis, S.1, Carss, D.N.2 and Wernham, C.1
1 BTO Scotland
2 UKCEH
Cite as: Calladine, J., Wetherill, A., Darvill, B., Willis, S., Carss, D.N. and Wernham, C. 2026. Scoping a wintering sawbill duck survey for Scottish salmon rivers. NatureScot Research Report 1374.
Contents
- Keywords
- Background
- Main findings
- Acknowledgements
- Abbreviations used in text
- 1. Introduction
- 2. Review of survey methods used in Wales
- 3. Methods and metrics for surveying winter riparian sawbill populations in Scotland
- 4. Results
- 5. Discussion
- 6. Recommendations and conclusions
- References
-
Annexes
- Annex 1: Instructions provided to volunteers for the trial surveys of river birds in the winter of 2021/22
- Annex 2: Examples of completed recording sheets and field map
- Annex 3: Post-survey maps showing river sections that were and were not surveyed and locations of vantage points within each section
Keywords
sawbill; survey; monitoring; riparian birds; volunteer engagement; Mergus species; goosander
Background
An improved monitoring method for wintering sawbill Mergus spp. ducks in Scotland is needed to inform their licenced control and its impact on their conservation status. Control of sawbills aims to minimise damage to salmonid fisheries and a number of methods have been, and continue to be, used to provide data to support licence applications across different river catchments in Scotland. This report specifically reviews the results from an extensive survey of six salmon rivers in Wales in winter 2020-21 to assess whether a similar approach, to that used in Wales could also be deployed in Scotland. Also reported on is a trial sample survey using counts from vantage points that could be used to supplement established data collection methods where access or the availability of surveyors may be limiting. The trials deployed volunteer surveyors who undertook sample timed point counts along four rivers, the Forth, Teith, Spey and Conon, in November 2021 to February 2022.
Main findings
- There appears to be no practical reason why the survey methods used in Wales could not be applied in Scotland. However, they do not represent the most cost-effective way of obtaining suitable information for assessing the conservation status of sawbills, inform licencing requests and measure the impacts of any management in Scotland.
- A principal limitation of the survey methods used in Wales is the periodicity at which surveys could be repeated and therefore the capacity to adapt management in response to any changing status of sawbills.
- Compared to the outputs from the surveys in Wales, sample timed point counts can deliver indices of population abundance that have a comparable statistical power to detect change or differences in Goosander abundance between areas or between two points in time. In addition, this method has the potential to repeat sample surveys at more frequent periodicity (e.g. annually) and through the seasons (e.g. monthly) permitting the determination of trends with an enhanced power to detect change in timescales appropriate to inform management, as well as to assess whether any changes correspond to key times for any potential conflict.
- Uptake of the trial survey by volunteer surveyors was very good and their feedback after taking part was largely favourable as to whether they enjoyed the survey and were likely to repeat similar surveys in the longer term. Most volunteers were from a ‘traditional pool’ of bird surveyors with an existing relationship with the BTO. While attempts to engage with people from fisheries interest groups were restricted by available time, they were successful enough to demonstrate the potential for volunteers from different interest groups to work together to carry out surveys in future.
- Sample timed point count surveys would be a valuable supplement to established monitoring programmes where access along rivers is difficult or where the availability of surveyors is currently limited. Calibration of point counts with data from other survey methods is required to allow metrics from different survey methods to be combined as part of a broader integrated monitoring programme. Calibration would also inform how abundance indices derived from sample counts relate to empirical population densities.
- Enhanced monitoring of sawbills could also deliver enhanced monitoring for other riparian birds and potentially other taxa if established as a longer-term survey.
Acknowledgements
We are indebted to the volunteer surveyors who participated in the trial survey, providing both data and feedback on methods. We are also grateful to the relevant fisheries boards and trusts, landowners and members of the BTO’s regional network who facilitated access and disseminated information about the trial survey to potential volunteers.
Abbreviations used in text
Organisations
BTO - British trust for Ornithology
JNCC - Joint Nature Conservation Committee
NRW - Natural Resources Wales
RSPB - Royal Society for the Protection of Birds
UKCEH - UK Centre for Ecology and Hydrology
Surveys (organised primarily by the BTO)
BBS - Breeding Bird Survey
WeBS - Wetland Bird Survey
WBBS - Waterways Breeding Bird Survey
Local Fisheries Organisations
CFB - Cromarty Fishery Board
DSFB - District Salmon Fishing Board
FRT - Forth River Trust
SFB - Spey Fisheries Board
1. Introduction
The aim of this scoping research project was to assess how best to obtain reliable baseline population estimates and/or trends for wintering sawbill ducks Mergus spp. in Scotland (at both the national level and within specific ‘key’ catchments), and with estimates being robust enough to have the potential for modelling future population trends. The main driver for this evidence need was the licenced control of a limited number of key piscivorous bird species over the winter and early spring on Scottish rivers to prevent ‘serious damage’ to fisheries for Atlantic salmon Salmo salar populations, with the associated requirement to understand any impact of any licensed control on the conservation status of the bird species concerned. The scoping work also has wider future value however, in terms of developing appropriate survey methods (suitable for use by volunteers and other stakeholder groups like fisheries staff) for improving knowledge of populations of riverine bird species in Scotland – a group of birds for which current monitoring coverage is recognised by BTO and NatureScot as requiring improvement.
The potential impact of sawbills and also Cormorant Phalacrocorax carbo on stocks and catches of fish of commercial value is reported to be an issue across Europe including Scotland, where the principal bird and fish species of concern are Goosander Mergus merganser and Cormorant, and Atlantic Salmon, Brown Trout S. trutta and Grayling Thymallus thymallus (Marquiss & Carss, 1994: Russel et al., 1996; Carss, 2003; Humphreys et al., 2016). Reviews have concluded there is generally a lack of unequivocal scientific evidence for the impact of these piscivorous birds on fisheries (e.g. Harris et al., 2008; Humphreys et al., 2016). However, this is not necessarily because there is no impact but rather because impact is difficult to quantify at a fish ‘stock’ or population level (Carss et al., 2012) as there are often limitations in the quality of available fish data (e.g. Marquiss et al., 1998; Carss et al., 1997; Wires et al., 2003). In addition to concerns around the potential impact of predation on declining fish populations (e.g. Salmon Business, 2018), there are also reports that the presence of some foraging fish-eating birds at a site can also have a negative influence on fish behaviour and levels of stress, leading to reduced catches at aquaculture, commercial and recreational fisheries (Carss, 2003). Consequently there are licensing arrangements in place, regulated by the relevant country agencies, allowing legal control of fish-eating birds at sites where conflicts are considered to occur. Licences in Scotland are issued by NatureScot and are granted to permit the killing or taking of wild birds to prevent ‘serious damage’ to fisheries (and also the ‘conservation of flora and fauna’); they are issued on the basis of shooting as an aid to scaring. Applicants for licences are required to complete an application form each year detailing the problems experienced, details of non-lethal scaring activities undertaken (methods used and duration) and supported by current bird count data.
Since 2017, licences to shoot sawbills as an aid to scaring have been issued on more than 20 Scottish river catchments. Current breeding population estimates for sawbills are based on a mid-1980s survey (Gregory et al., 1997), a 1997 partial resurvey (Armitage et al., 1997) and The New Atlas of Breeding Birds in Britain and Ireland: 1988-91 (Gibbons et al., 1993). Since those previous surveys, populations have been estimated by extrapolation from those baselines using BTO/JNCC/RSPB Breeding Bird Survey (BBS) and Waterways Breeding Bird Survey (WBBS) data (Harris et al., 2021), alongside the most recent Atlas data. It should be acknowledged that confidence in many of these population estimates is not high because of imprecision associated with the original estimates, exacerbated by the imprecision of trends used for subsequent extrapolations. The impact of imprecision becomes more marked when considering populations at finer geographical scales, such as individual catchments. The numbers of sawbills wintering on Scottish rivers is even less well understood. Some data are provided by DSFBs/Fishery Trusts to support licence applications but these counts are not always carried out consistently between catchments or between years in the same catchment (Humphreys et al., 2016). Counts carried out for the BTO/RSPB/JNCC Wetland Bird Survey (WeBS; Frost et al., 2021) are also not comprehensive on most Scottish rivers. Without reliable population estimates (and knowledge of population trends) for piscivorous birds, the impact of licensed control on their conservation status cannot be reliably assessed.
A method for surveying sawbills in winter was developed for salmon rivers in Wales (Taylor & Noble, 2017) and deployed in an extensive survey of six salmon rivers in Wales in winter 2020-21 (Taylor et al., 2021). Here we first assess whether that method would be appropriate and practical for use in Scotland and then, based on that assessment, consider and test other options for wider use in Scotland. The practical feasibility and statistical robustness of outputs to underpin licensing conditions for sawbills are considered.
2. Review of survey methods used in Wales
The project Statement of Requirements (SoR) specifically asks for a review of Taylor & Noble (2017) survey methods, which were designed for mid-winter surveys of Goosander and Cormorant in Wales, in the context of the terrain and weather conditions in Scotland. In addition to this key question, it is important to consider whether the derived population estimate is the most appropriate metric to inform potential impacts on the conservation status of piscivorous birds. Relevant to the latter will be:
- the power to detect change in population densities;
- the practicalities (including costs) of repeating surveys to detect any change and therefore to potentially inform management (facilitating adaptive management); and
- a better understanding of what population densities or sizes are considered sufficient to be a risk to salmonid species.
Integral to these issues is the question of suitability of methods to be used by volunteer surveyors, including those associated with fishery interests.
2.1 Development of survey protocols used in Wales
Taylor & Noble (2017) describe a method used for surveying piscivorous birds in winter on the Welsh River Dee in January 2017. The intensity of survey sampling using this approach was reviewed to determine the likely precision of population estimates (Taylor et al., 2020), which were then used in the design of an extensive survey of piscivorous birds in Wales in winter 2020/21 (Taylor et al., 2021).
The 2017 survey of the Welsh Dee involved walking on one bank of the river recording all Cormorant and Goosander (on the river, on its banks and flying over) with all observations and their behaviour recorded and plotted onto maps. A total of 146 km of the River Dee was surveyed, divided into 10-km long survey sections that were covered by a single observer in one day walking up-river. The use of single direction counting (upriver) aimed to maximise consistency in any errors associated with double counting if birds had any tendency to fly off in any one particular direction if disturbed. The aim was for rapid, near-continuous survey to minimise risks associated with potential double counting of individuals. The survey required 15 person-days to complete over eight days starting on 24th January 2017 and recorded 119 Cormorant and 49 Goosander (Taylor & Noble, 2017).
Empirical data from the 2017 survey of the Welsh River Dee and winter Bird Atlas 2007-11 data (Balmer et al., 2013) were used to model the expected precision of a proposed extensive survey of Cormorant and Goosander on all rivers in Wales considered potentially important for salmonids (Taylor et al., 2020). This modelling approach considered alternative scenarios of complete and partial coverage of main channels and tributaries. Acknowledging that a rapid and near-continuous approach was not practical on such an extensive scale, the assessment considered the role of repeat surveys to quantify the potential for change (i.e. the difference in counts obtained from repeat surveys) and therefore the associated precision of survey estimates. Introducing a repeat survey of 50% of the main river channels was estimated to reduce the 95% confidence intervals of a survey estimate from ± 15% to ± 10% for Cormorant and from ± 20% to ± 15% for Goosander (Taylor et al., 2020).
2.2 The 2020/21 survey in Wales
In the three months December 2020 to February 2021, BTO surveyors worked 289 field days to survey about 2,280 km of rivers across 10 systems identified as principal salmonid river systems in Wales (Taylor et al., 2021). Coverage achieved 92% of the target with some areas unsurveyed because of access refusal by landowners/occupiers, topography and vegetation limiting access and/or visibility, and severe flooding. Most of the main channels were covered once in December. Samples of tributaries were surveyed and repeat counts of 50% of the main channels were undertaken in January and February. A total of 564 Cormorant and 522 Goosander were recorded with 73% and 70%, respectively, of these totals being recorded on the three catchments of Dee, Wye and West Cleddau, which combined made up 43% of the 2,280 km target river length. Modelling of the bird densities found on river count segments, was undertaken to account for the variation in numbers detected during surveys and to permit extrapolation to account for birds in unsurveyed areas. This process gave total winter population estimates on the river systems of 1207 (95% confidence intervals 1035 – 1420) Cormorant and 991 (894 – 1097) Goosander. These represent confidence intervals of -14% to +18% around the mean for Cormorant and -10% to +11% for Goosander which are close to the predicted expectations from the original modelling of earlier data from the Dee.
In addition to the river surveys, the 2020/21 Welsh survey included counts from a sample of still waters (undertaken by Natural Resources Wales (NRW) staff) and estuaries (data taken from the long term monitoring programme for non-breeding wetland birds, the Wetland Bird Survey (WeBS); e.g. Frost et al., 2021). Statistical modelling of data from still waters considered the time of day of counts, amongst other variables, to minimise the potential of double counting of individuals from rivers, as Goosanders in particular were expected to use still waters especially for night time roosting (for full details see Taylor et al., 2021). Modelled population estimates for birds using still waters across Wales were 184 (135 – 241) Cormorant and 416 (293 – 580) Goosander. For estuaries, the modelled population estimates were 1503 (1410 – 1598) Cormorant and 53 (36 – 73) Goosander.
Combined, the national winter population estimates for Wales in 2020/21 were thus 2894 (2580- 3258) Cormorant and 1460 (1223 – 1750) Goosander with the confidence intervals given here being the simple sum of those for each of three survey sources. These represent confidence intervals of -11% to +13% around the mean for Cormorant and -16% to +20% for Goosander.
2.3 Applicability of methods used in Wales for Scotland
Key questions in the project SoR concern whether the methods which were designed for mid-winter surveys of Goosander and Cormorant in Wales were appropriate in the context of the terrain and weather conditions in Scotland, and whether the methods would be attractive and practical for use by volunteer surveyors. The survey in Wales was exclusively undertaken by paid fieldworkers (with the exception of the estuarine counts) and achieved a very high level of coverage despite some challenging topography and weather conditions during the survey winter. There is unlikely to be any particular reason why the terrain and weather conditions in Scotland should themselves be obstacles to conducting a similar survey. However, Scotland has a considerably greater length of rivers for any similar survey and to achieve comparable coverage to the Welsh survey would require proportionately greater total survey effort. Furthermore, there will be more rivers in more remote areas, which would also add to travel times and logistics needed in order to complete a comparable survey using paid field staff. Some rivers already have established protocols for surveying piscivorous birds, often using teams of volunteers (Humphreys et al., 2016). While methods used on different river systems can vary, it is feasible that the teams involved could be engaged with a common approach to contribute to a national survey. The use of 10-km count segments for surveys might, however, prove unattractive. While this was achieved in Wales where fieldwork was undertaken exclusively by paid surveyors, the return walk to vehicles after surveying did prove to be especially onerous and would likely be a large disincentive for volunteers. The logistics of sharing vehicles to reduce time for return walks might alleviate some of these concerns but would certainly add a level of complexity to logistics, which again would likely become a disincentive to potential volunteers.
Options to overcome these issues would be using shorter segments of river as count units for any volunteer contributions, and greater numbers of paid fieldworkers who would be instructed to survey longer lengths. Alternatively, a national survey could sample a reduced portion of the river systems, with appropriate statistical extrapolation to estimate numbers within the unsurveyed areas. Surveying a reduced sample of the river systems would inevitably lead to a reduced level of precision of any national or catchment population estimates (wider confidence intervals around the mean).
As with the survey in Wales, alternative approaches for still and estuarine waters would also be required in Scotland. As in Wales, the use of WeBS count data could be supplemented with additional volunteers and paid fieldworkers to fill gaps (river stretches without established WeBS coverage). The principal estuaries and many lowland still waters are reasonably well covered by WeBS, however there remain many upland still waters and also large numbers of sea lochs and coastal stretches that are not.
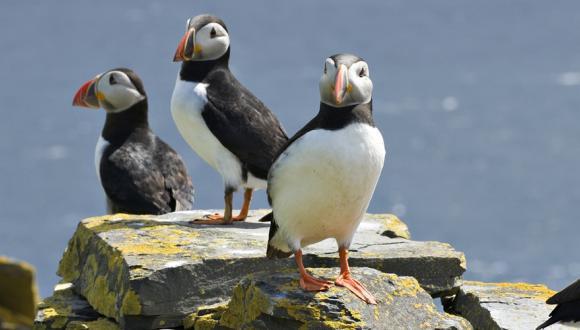
Coverage of coasts and sea lochs would be especially important for a meaningful census of Red-breasted Mergansers Mergus serrator (Figure 1). Any winter sawbill duck survey that was focussed on Scottish salmon rivers would effectively be a survey of wintering Goosander only as it would miss most wintering Red-breasted Merganser.
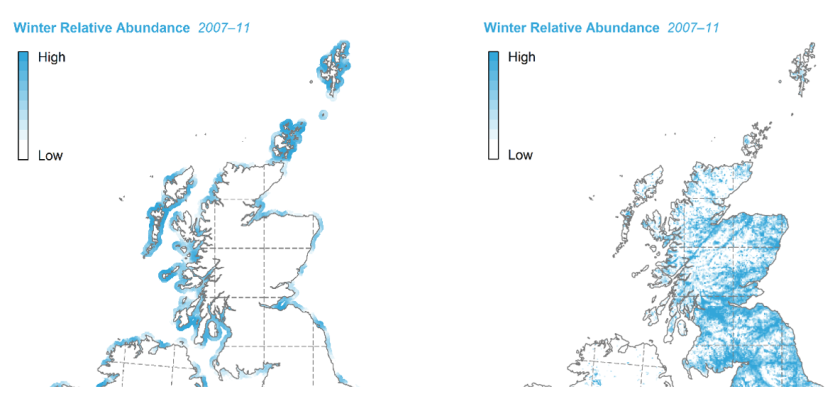
Figure 1. The relative abundance in winter (November – February inclusive) of Red-breasted Merganser (left) and Goosander (right) in Scotland, 2007-11 (from Balmer et al. 2013).
Click for a full description
Two maps of Scotland are shown side by side. The winter abundance is shown by graduated colour with darkest colour being the greatest density. One map shows the abundance of red-breasted merganser with the highest relative abundances on the west coast, Western Isles and Northern Isles. The other shows the abundance of goosanders with the greatest densities along the main rivers, particularly in south, central and eastern of Scotland.
2.4 Power of a national survey to measure changes the abundance of sawbills
In addition to assessing whether the survey protocols used in Wales are applicable to Scotland, it is important to assess whether any national or catchment population estimates are actually the most appropriate or best metrics with which to assess the conservation status of sawbills on rivers (effectively Goosander only, see above) and their potential conflict with salmonid conservation and fisheries.
Important questions are:
- What is the power to detect change in population densities and what are the minimum time periods over which surveys should be conducted in order to detect population change?
- What are the practicalities of repeating surveys to detect change and potentially inform management, including facilitating adaptive management?
- What population densities or sizes are considered to sufficient to be a risk to salmonid species? While a relevant question, this remains outside the scope of reporting here.
- Could alternative approaches work well/better and also lead to wider benefits in terms of improving the overall monitoring of riparian birds in Scotland?
Assuming a similar level of survey coverage could be achieved in Scotland as for Wales, it is reasonable to assume a similar level of precision could be achieved for any derived population estimates. The precision of the population estimate for Wales gave 95% confidence intervals for Goosander of -16% to +20% around the mean. To have a 95% probability (the broadly accepted threshold for statistical significance) of detecting a difference between two estimates in different years requires that the confidence intervals of the two estimates do not overlap in value. Therefore, to detect a statistically significant change, in this case in the population size of Goosanders between two survey periods, this implies that the actual population size would have to change by about twice those proportions (i.e. so that the confidence intervals for the two separate estimates do not overlap in value). Thus using comparable survey methods in two separate time periods, it can be expected that there would be the statistical power to reliably detect a decline of 32% or an increase of 40% between those survey periods. In reality, there are more refined ways to detect statistically significant changes over time, for example by using a Bayesian framework whereby estimating the probability of an event also considers the likelihood of any apparent difference being real. For example, if the overlap between confidence intervals becomes less, then the likelihood of that difference being real is considered - rather than using the simple and fixed threshold of non-overlapping 95% confidence intervals. However, the precision associated with any population estimate for Scotland is likely to be lower than that found for Wales (see Section 1.3) and therefore considering a simple pair-wise comparison of means with comparable confidence intervals as found for Wales arguably gives a realistic indication of any power to detect change from similar survey data for Scotland.
The precision of the survey estimates for Welsh river systems only was greater than that for the overall national estimate for Wales, perhaps in part driven by the greater uncertainty associated with movements of birds between rivers and still waters. With 95% confidence intervals for Goosander on rivers of -10% to +11% around the mean, the implication is that there would be power to detect a decline of 20% or an increase of 22% between two survey periods that are restricted solely to river habitat.
As well as considering the power to detect population change, the time period during which this change can be measured also needs to be assessed. The resources associated with deriving a national population estimate are considerable (see Section 5.4), so it is important to question whether repeated surveys of such magnitude are realistic, as well as whether the power to detect change is acceptable. For example, if a national survey was to be repeated at six or twelve year intervals (the timescale for some comparable single species surveys currently), would the capability to detect changes of 20% or more in population size over that period be adequate to inform the conservation status and impact of any potential management on the target species? Furthermore, the findings of surveys undertaken in single years can be impacted by stochastic events, such as atypical weather, which could be more likely for a winter survey when the abundance and distribution of birds in Scotland could be influenced by weather conditions across the whole of Europe. It is therefore whether the metric of a national population estimate is the most appropriate, or practical, for assessing the conservation status and potential management of sawbills across Scotland.
3. Methods and metrics for surveying winter riparian sawbill populations in Scotland
While there appears to be no practical reason why the survey methods used in Wales could not also be applied in Scotland, there remains a question as to whether the outputs from such a survey would provide the best (or most cost-effective) information that could be obtained to assess the conservation status of sawbills, inform licencing requests and measure impacts of any management in Scotland (see Section 2). In order to be able to detect changes in population densities within timescales that could inform adaptive management, we tested a field method to derive alternative indices of bird abundance. The objectives of the method used were to:
- employ methods that are practical and sufficiently enjoyable to attract large numbers of volunteers to repeatedly contribute to surveys;
- be readily repeatable in terms of where and for how long data are collected;
- be suitable for recording data in sufficient detail that alternative metrics can be derived as needed over time (e.g. potentially sub-sampling from birds showing particular behaviours or distributions); and
- have the potential to be expanded to other times of year, to include times coincident with the seasonal timing of conflicts between sawbills and salmonids.
3.1 Site selection
The approach adopted included some stretches of river that were within or close to areas covered by established monitoring schemes (WeBS and/or bespoke surveys for fisheries boards) and also was designed to assess how attractive an alternative approach was to new potential surveyors (for areas with lower levels of coverage by established schemes). Four river systems were chosen to represent a broad suite of riverine conditions, previous survey coverage and varying distances from population centres. Sites chosen were the Forth, Teith, Spey and Conon (Annex 3). For the purposes of the trial survey, tributaries of each river system were excluded, and only the main channel of each named river from the tidal limit to the upper limit (according to Ordnance Survey) was included. Each river was divided into sections of 5 km in length, starting at the tidal limit. Where there were standing bodies of water, such as reservoirs and lochs, these were not included in the survey. Methods for monitoring waterbirds on still waters are well established (Frost et al., 2021) and the principal aim of this study was to assess an alternative approach for use on rivers which tend to be a less adequately monitored habitat. As a result, some sections of river that were immediately downstream of a standing body of water were therefore shorter than 5 km. Annex 3 shows overview maps of each of the rivers divided up into their sections.
Volunteer surveyors (for recruitment details, see Section 3.3) were asked to pick which 5-km section they wanted to survey and to then identify between one and five vantage points from which to conduct counts. Instructions given to volunteers regarding vantage point selection suggested bridges, high points on the river bank or clear bends in the river, all points where at least 100 m of water could be seen both up and downstream.
3.2 Survey methods
Timed point counts (from vantage points) were used to survey birds on the four study rivers in December 2021 – February 2022 inclusive (after Call & Hunter, 2017). Upon arriving at the selected vantage point location within the 5-km river section, the surveyor marked on the map the bounds of visibility from the vantage point location, noted the time, and then started the count. Each count lasted 10 minutes, divided into two 5-minute count windows. The surveyor had the option of extending the count by further 5-minute blocks if they considered it to be useful. This design allowed some assessment of the influence of count duration on the data collected and also on how long surveyors were prepared to spend at each point. For each species on the list, a simple count of individuals present at the start of the count was made in the box corresponding to the species and time window. Individual birds arriving into the visible area of the river were counted separately and the number circled on the recording sheet. Birds flying up or downstream and not alighting on the count area were also counted separately, and denoted as such with an arrow indicating flight, along with a direction indicator. Where possible, surveyors were asked to count males and females separately, particularly for sawbills. Optionally, surveyors could also record extra details of bird behaviour, including roosting/loafing, feeding or courtship. If no birds were seen in any 5-minute window, then surveyors were asked to write “No Birds” at the top row of the sheet.
To avoid flushing birds into, or out of, a survey area, surveyors were asked to avoid walking along the river bank to their selected point count location wherever possible. However, in many cases the safest and easiest access would be along riverside paths. In these cases, to enable a rough assessment of the effects of flushing, surveyors were given the opportunity to record incidental sightings of riverine bird species in the fourth column of the field sheet, as well as marking on the map where the incidental sighting was made.
This survey could be carried out in a variety of weather conditions, but surveyors were asked not to survey in foggy conditions or heavy, persistent rain where visibility would be impaired. If the river had significantly burst its banks during flooding, this was also highlighted as a time not to survey, as much for the safety of participants but also because birds may be displaced away from the main channel of the river and be uncountable.
In advance of surveys, each surveyor was supplied with a map of the survey section and field sheets for recording observations. An example of a completed field sheet and map is given in Annex 2. Volunteers needed binoculars, a writing implement and a clipboard or weather-writer as equipment for the survey.
Surveys took place in the winter months, from 1st December 2021 to 28th February 2022, with surveyors being asked to carry out one visit to their selected river section each month. Surveys could start at any time during daylight hours, between an hour after first light and an hour before darkness. These are times during which birds may be leaving or arriving at communal roosts could be avoided; their inclusion could have made data interpretation more difficult.
The field sheet contained a list of the primary target species for this survey, which were 29 riverine species thought to be the most likely to be seen on Scottish rivers in winter (see Table 4). The field sheet also included an option to record other riverine bird species seen, as well as three species of riverine mammal (Eurasian Otter Lutra lutra, American Mink Neogale vison and Eurasian Beaver Castor fiber) and/or their signs (where the surveyor was confident of having seen these).
A copy of the survey instructions for volunteers is included in Annex 1.
3.3 Survey engagement
3.3.1 Recruitment of volunteers
A number of different approaches were used to reach volunteers who might help with the survey trial. These varied slightly depending on the river catchment and our knowledge of user groups and individuals in the area. The main stakeholder groups approached broadly fell into the following categories: existing BTO volunteers / birdwatchers; contacts via the local fisheries organisations / proprietors; and landowners (where these were known).
Forth and Teith
Birdwatchers: In this area there is already a very well established network of Wetland Bird Survey (WeBS) surveyors who collectively cover many of the river stretches included in the pilot study. With the help of the WeBS Local Organiser, we contacted these individuals in the first instance to see if they would be interested in helping out with the pilot survey. Six of these volunteers agreed to help, many of them carrying out the trial survey method while visiting these sites to undertake their monthly WeBS count.
Fisheries interests: Forth Rivers Trust was contacted to request help reaching their network of staff, volunteers, fisheries proprietors and other relevant contacts. They forwarded the details of the project and the survey instructions. Contacts included Stirling Council fisheries staff, Eas Gobhain fishery and Loch Venachar fishery. The Forth Rivers Trust estimated that around 15 anglers were contacted directly, and others may have heard about the project if details were shared more widely.
Landowners: Estates and landowners/managers with fishing interests on the Teith were contacted via Forth Rivers Trust, including representatives from Blair Drummond Estate, Moray Estate, Lanrick Estate, Cambusmore Estate, Drumardoch Estate, and staff from the Loch Lomond & Trossachs National Park. Forth Rivers Trust estimated that around 30 people with land management / conservation interests were contacted directly. In mid-November a member of staff from BTO Scotland also met with the owner of Blair Drummond Estate who is on the District Salmon Fishing Board and a Trustee of Forth Rivers Trust, in order to promote and discuss the project. Contacting landowners along the Forth was more challenging, as land ownership here is more complex, and the fishing interests are not as strong as on the Teith.
Spey and Conon
Birdwatchers: These rivers are considerably less well covered by WeBS than are the Forth and Teith. WeBS Local Organisers and/or the BTO Regional Representatives were contacted to get their input on how best to target potential local volunteers. Where possible, we followed up on their advice by sending out survey information and appealing for help. We also contacted the c. 450 people on the BTO database who lived within 50 km of Grantown-on-Spey and within 50 km of Inverness in order to reach those within reasonable striking distances of the catchments in question. These people were sent a personalised email appealing for help with the pilot study.
Fisheries interests: Cromarty Fishery Board was contacted with regard to helping recruit volunteers for the River Conon. The Cromarty Fishery Board Biologist kindly passed on details of the survey to ten of their contacts in the Conon catchment, as well as the local angling club. We also arranged an introduction between BTO Scotland staff and the Director of the Spey Fishery Board, and thereafter he kindly circulated details of the project to all proprietors, ghillies, angling associations and staff members at the Board, approximately 150 people in total. If the individual angling associations subsequently informed their members, then we estimate that up to 300 people with fisheries interests on the Spey may have heard about the project through this route.
Landowners: In addition to those contacted by the Cromarty and Spey Fisheries Boards, one proprietor from the Conon was contacted directly. This contact was possible as a proprietor from the Teith passed us their details and made introductions. The Proprietor on the Conon helped make contact with two ghillies from the Fairburn Estate.
As outlined above, in contacting fisheries volunteers and landowners we were greatly assisted by Cromarty Fishery Board, Spey Fishery Board and Forth Rivers Trust who passed on details of the survey to their contact lists of staff, volunteers, angling clubs, and fisheries proprietors. Many will, in turn, have shared details with individual anglers. This approach allowed us to quickly reach many more people with fisheries interests than would have been the case had we attempted to contact them directly. It does mean, however, that it is difficult to know more precisely how many people from these stakeholder groups became aware of the pilot survey, beyond the broad estimates provided above.
3.3.2 Volunteer management
Any volunteers who expressed interest in participating in the pilot were sent the survey instructions (Annex 1) and overview maps of the relevant catchments. They were then asked to choose which section/s of river they wanted to survey. In many cases more than one surveyor came forward for a given section of river. Multiple volunteers for the same river sectors were not considered a problem because this allowed us to collect a larger amount of data, and to gather feedback from more volunteers. However, if two volunteers were already allocated to cover a particular section, then any subsequent volunteers for these sections were encouraged to consider alternative ones nearby, in order to maximise coverage throughout the catchment.
Once a volunteer agreed to take on a survey section, they were sent a digital copy of a 1:25,000 Ordnance Survey map with the start and end of the 5-km section clearly marked. They were also sent a field recording sheet (see Annex 2) and an annotated example of how a completed field sheet should look once the survey had been completed. If requested, the paperwork was printed and sent to individual volunteers by post.
Data were returned by post or by scanning and emailing the field sheets and accompanying maps. There was regular email correspondence with all the volunteers throughout the period of the pilot survey, and volunteers who submitted data were thanked for their contributions in a timely manner.
3.3.3 Training
Two ‘virtual’ training events were held in December to promote the survey, give some background, and to provide training on both the survey method and relevant bird identification skills to prospective volunteers. Training by video conferencing (Zoom®) was a time-efficient way of reaching potential volunteers from all four river catchments. A total of 42 people attended these virtual training events (including six people with fisheries interests), and everyone who had expressed an interest was sent a recording of one of the sessions (as some could not attend the video conference sessions due to other commitments).
An offer of face-to-face training was made during the virtual training sessions and in a separate email to all participants, but only one person expressed an interest in attending if an event was going ahead. Nevertheless, a face-to-face training session was offered on Sunday 6th February in Aberlour on the Spey and advertising was targeted with the aim of increasing participation from within the fishing community. Despite this advertising, no-one booked on this training course and it was therefore cancelled.
3.4 Analyses of bird data
Summary data on all riparian species recorded are provided to illustrate the broader potential of surveys to monitor river birds, however formal analyses are restricted to sawbills and, in effect, are restricted to Goosander.
Generalised linear models (GLMs) were used to assess the detection rates of Goosanders from vantage points and their variation. The dependent variable was the number of birds seen within a five-minute count period. Within the full model, independent factors included in the model were ‘river’ (n = 4: Forth; Teith; Spey; Conon), ‘month’ (n = 4: November; December; January; February) and ‘count window’ (n = 4; the first, second, third or fourth five-minute count period undertaken). All factors were categorical variables and the interaction term between river and month was also included, to assess whether patterns of seasonal change differed between rivers. The most parsimonious models (i.e. those that best fitted the data as assessed by AIC ‘goodness of fit’ criteria) used a Poisson error distribution with a log-link function and so it was these that were used throughout. Depending on the statistical significance of the month-river interaction and count window terms, reduced models were subsequently used to calculate encounter rates (numbers detected within a 5-minute survey window) for the whole data set or for individual rivers and months as appropriate. Mean encounter rates and their standard errors were determined by back-transformation of the least mean squares derived from the relevant GLMs with all analyses undertaken using SAS version 9.4 (SAS Institute 2013).
3.5 Assessing engagement effectiveness – feedback questionnaire
In order to collect structured feedback from pilot survey volunteers (and potentially non-participants too), a feedback questionnaire was designed. The questionnaire included quantitative / objective questions, along with opportunities for free-form feedback. We were particularly interested in knowing about the background of participants, their survey experience, how they found the survey paperwork, and their overall feelings about participating in the pilot survey. The questionnaire was sent out electronically to over 60 people who had expressed interest in the survey, signed up for a river section, or who had helped us to contact stakeholders.
4. Results
4.1 Survey engagement
A total of 54 potential volunteers registered an interest in participating in the survey (Table 1), of which 41 had submitted data at the time of writing. The majority were from a ‘traditional pool’ of surveyors affiliated with the BTO however, of particular relevance was the participation by ‘new’ volunteers affiliated to the ‘fisheries community’.
Table 1. A summary of potential volunteer participants who registered an interest in the pilot survey of river birds. Most were from the ‘traditional pool’ of surveyors affiliated with the BTO but of particular relevance is the interest registered by ‘new’ volunteers affiliated with the ‘fisheries communities’. Note that not all potential participants subsequently took part in the survey and submitted data.
| - | Number of 5km sections | Number of sections allocated to volunteers (%) | Total number of volunteers | Number of volunteers known to be from the fisheries community (%) |
|---|---|---|---|---|
| Conon | 4 | 4 (100%) | 12* | 3 (25%) |
| Forth | 12 | 10 (83%) | 10 | 2 (20%) |
| Spey | 33 | 24 (73%) | 23 | 1 (4%) |
| Teith | 5 | 5 (100%) | 9* | 5 (56%) |
* Note that it was possible for more than one volunteer to be allocated to any given section of river
4.1.1 Feedback from survey participants
A total of 43 people had responded to the questionnaire at the time of writing, of which four identified as being anglers or Fisheries Trust supporters (9% of respondents). Interestingly, of the four respondents with fisheries interests, two also identified as being birdwatchers/BTO supporters. The other two fisheries respondents were a Forth DSFB staff member and someone who was both an active angler and a Fisheries Trust member. Responses to date have come from volunteers who surveyed all four catchments: the Spey (47% of responses); the Conon (21%); the Forth (19%); and the Teith (14%). Responses to questions are summarised below:
How did you hear about the survey?: Most respondents (almost two-thirds) heard about the survey by direct e-mail contact from BTO Scotland and a further 20% via a BTO Regional Representative (Figure 2).
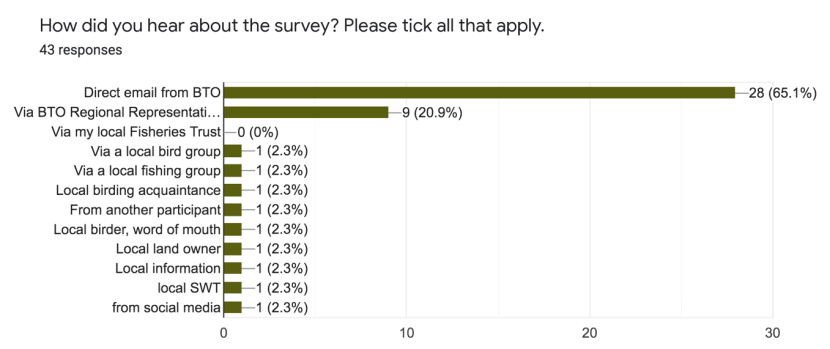
Figure 2. Routes by which surveyors were first heard about the current pilot survey of river birds.
Click for a full description
The figure is a bar graph that has been converted into the following table:
| Response | Number of respondents | Percentage of respondents |
|---|---|---|
| Direct email from BTO | 28 | 65.1 |
| Via My Local Fisheries trust | 0 | 0 |
| Via a local bird group | 1 | 2.3 |
| Via a local fishing group | 1 | 2.3 |
| Local birding acquaintance | 1 | 2.3 |
| From another partcipant | 1 | 2.3 |
| Local birder, word of mouth | 1 | 2.3 |
| Local landowner | 1 | 2.3 |
| Local SWT | 1 | 2.3 |
| From social media | 1 | 2.3 |
| Total respondents | 43 | 100 |
Previous bird survey experience: respondents were asked to indicate if they had previously taken part in bird surveys. Only one respondent had no prior experience (2.4% of respondents). The BTO/JNCC/RSPB Breeding Bird Survey was mentioned by 58.5% of respondents, followed by BirdTrack (54%), the RSPB Big Garden Birdwatch (54%), the Wetland Bird Survey (46%) and BTO’s weekly Garden BirdWatch survey (44%). Six respondents (14.6%) had previously taken part in a bird survey organised by a Fisheries Trust / Angling Club. Only two (4.9%) had previously taken part in the Waterways Breeding Bird Survey.
Bird identification confidence: Twenty-three of the 42 people who responded to this question could confidently identify all of the species on the recording form prior to taking part in the survey (55% of respondents). Fourteen respondents indicated that although they didn’t know all of the species, they could confidently identify both male and female Goosander and Red-breasted Merganser prior to taking part in the survey (33% of respondents), and of these eleven indicated that they had learned about other species while taking part. These groups together include all those who indicated that they could identify both sawbill species prior to taking part, and constitute 88% of respondents.
Five respondents indicated that initially they were not confident with their ability to identify sawbills but had learned through taking part and, of these, two respondents indicated that they were still not confident about identifying some of the species included in the pilot survey list.
Training needs: Respondents were asked ‘How important do you think these training types are for helping people like you do this survey in future?’. Training in the survey method was considered to be the most important, with only five of 42 respondents (12%) feeling this was not needed, and 20 respondents (47.6%) feeling this was very important. Waterbird identification training by video conference (VC) was felt to be ‘not needed’ by 21% of respondents, and ‘very important’ by 45% of respondents. Practice sessions on the riverbank were the least popular of the options presented, with 50% of respondents feeling these were ‘not needed’, and only 12% considering these to be very important. This was in keeping with the lack of request for / uptake of face-to-face training when we offered this during the pilot survey work.
Free-form text feedback about the Zoom® training sessions was overwhelmingly positive, with respondents saying that they found both the content and style of delivery very useful. For example: “Excellent and relaxed presentation, and a good way to get a sense of the scope of the survey and the network of volunteers - plus some refresher ID tips.” One respondent said that they would have valued field training to back up the VC learning, and one respondent suggested that a ‘YouTube® video’ could be produced to explain the survey method and provide bird identification pointers.
Clarity of survey paperwork: Eighty-six percent of respondents found the survey method very clear, with the remainder having found it moderately clear. The reasons for running the survey were very clear to 75% of respondents, with only two people feeling that the explanation was unclear. Respondents indicated that the recording form had room for improvement, with 31% finding it only moderately clear, although the remaining respondents (69%) found it very clear.
Free-form text feedback on the survey paperwork is summarised as follows (comments expressed by more than one responder are highlighted as such):
Instructions:
- Summarise what to record as bullet points rather than one paragraph.
- Guidance on what to do if there is an island in the river and the main channel is on the other side and inaccessible.
Recording form:
- Need more space on the form in which to record birds and activity (boxes not big enough).
- Have tick boxes for bird activity.
- Add a general comments box.
- Needs additional space on the form for recording the section number and vantage point.
- Make the key at the bottom about behaviour more prominent.
- More space at top to enter observer ID.
- Needs a space/category to enter the river section that was watched, since some areas split between observers in different stretches and some observers looked at two separate parts of the one long stretch.
Data entry:
- Build an ‘app’. (2 respondents).
- Lack of printer at home problematic given the requirement for using paper forms.
- Would have preferred online data entry. (4 respondents)
- Would have liked to complete an ‘Excel’ spreadsheet for data entry. (2 respondents)
- Prefer to use notebook in the field.
- Tick boxes if filling in form electronically.
General comments / recommendations:
- Allow more species to be recorded.
- Record disturbance.
Levels of participation: 79% of respondents made more than one survey visit, with the remaining 21% only taking part once.
Ease or difficulty of taking part: Participants were asked to rate the ease or difficulty of taking part on a sliding ten-point scale, from one (difficult) to 10 (easy). The vast majority (91%) of respondents selected eight or higher, giving a clear signal that most participants found the survey easy to take part in. Only two participants selected ‘5’, and no respondents indicated that they had found it particularly difficult.
Free-form text feedback on any difficulties that volunteers experienced is summarised as follows:
- Finding sites with good visibility of the river was a bit tricky mainly due to riverside trees. (4 respondents)
- Time spent in advance finding suitable vantage points well worthwhile. (2 respondents)
- Relationships with farmers would be important (2 respondents). Without it, access to some sites involved long walks up farm tracks. One volunteer was refused permission to park due to concerns about disturbance to sheep.
- Getting to the riverbank to your spot to view without spooking birds was difficult. (2 respondents)
- High water / flooding in February. (2 respondents)
Enjoyment of the survey: Participants were asked to rate their enjoyment of the survey from 1 (‘I didn’t enjoy it at all’) to 10 (‘I enjoyed it a lot’). Responses were overwhelmingly positive, with 79% of respondents selecting level 8 or higher. Only two respondents selected level 5 or lower (Figure 3).
This enjoyment translated into an enthusiasm for taking part in similar future surveys, with 85% of respondents saying ‘yes’ they would take part, and the remainder of respondents (15%) selecting ‘maybe’. In a follow-up e-mail, one of the anglers who took part stated: “As far as surveys go this was a really nice and simple survey to take part in - sometimes getting to spying position without disturbing small sections of the river wasn't the easiest but other than that a really user-friendly survey.”
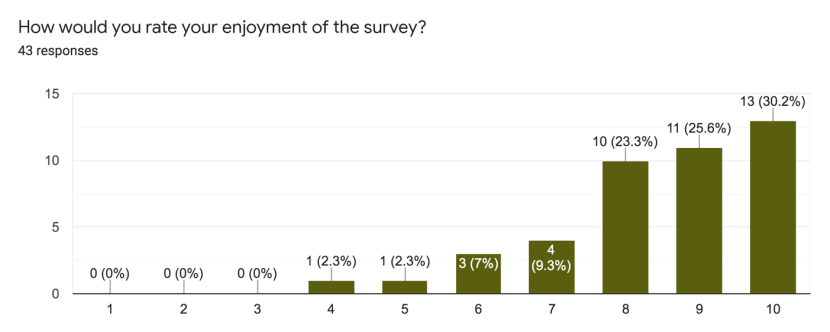
Figure 3. Ratings provided by volunteer participants on their overall enjoyment of the current pilot survey of river birds.
Click for a full description
The figure is a bar graph that has been converted into the following table:
| Response | Number of respondents | Percentage of respondents |
|---|---|---|
| 1 | 0 | 0 |
| 2 | 0 | 0 |
| 3 | 0 | 0 |
| 4 | 1 | 2.3 |
| 5 | 1 | 2.3 |
| 6 | 3 | 7.0 |
| 7 | 4 | 9.3 |
| 8 | 10 | 23.3 |
| 9 | 11 | 25.6 |
| 10 | 13 | 30.2 |
| Total respondents | 43 | 100 |
Suggestions for changes / modifications: Participants were asked ‘Do you have any suggested changes that might encourage more people like you to get involved in the survey in future?’ and responses are summarised as follows:
- Make data entry electronic.
- More 1:1 support for volunteers, especially those who were participating for the first time. For example, an email asking how things were going.
- Needs to be more than a long walk to a point, then survey.
- Would like to meet others who could help me improve on my bird ID.
- Would prefer to walk a section rather than visiting particular points and standing still for 10 or more minutes.
- I like it as it is - no suggested changes (6 respondents). One commented: much of the joy of this survey was the fact you got to watch the birds and what they were doing, rather than continually walking. Also it felt much more accessible, only needing to access a couple of spots, so I picked the areas which I could get to easily.
- More communication / promotion of the survey so that more people would take part. (4 respondents)
- Ease of access was important (including by bike).
- Need more reassurance regarding access rights. A volunteer was anxious about where to park, and also climbing over a locked gate.
- Concerns about getting cold standing still for too long in winter (consider only 5 minutes at each point, but visiting each point twice?).
- Is winter the right time of year to be doing this?
- Get information from anglers who are present on the river for much of the day and who see more than can be gathered in ten-minute slots.
- It could even be a more sociable affair and more enjoyable with multiple volunteers visiting together.
- Reduce the lengths of the river survey sections.
- Publish results to a wider audience, making it clear how easy it is to take part in the survey.
- People like me are already committed to participating in this kind of thing
- more prior notice is needed to plan/choose a survey area - no time to do a December survey.
- Needed to survey the riverbank first on a separate day to select the best vantage points.
- Volunteers should not attempt to survey on a day when the river is very high. Chosen calm quiet stretches of river were fast flowing. Birds had almost all dispersed to flooded fields/grassland.
4.2 Bird recording results
4.2.1 Survey coverage
Data were submitted by 39 independent volunteers (plus an additional two who were known to work as one of a pair) covering at least one of the four months (November 2021 to February 2022). Surveys were undertaken in all available 5-km sections of the Teith (5 sections) and Conon (4 sections) in at least one month. Eleven out of the available 13 sections of the Forth similarly included surveys from at least one month as did 20 out of the 33 sections available on the Spey. Most of the unsurveyed sections of the Spey were in the higher reaches of the river, south of Kingussie (see maps in Annex 3). A total of 128 vantage points were sampled at least once within 40 of the 55 available river sections (Table 2). Most surveyors carried out multiple visits with just four carrying out single visits only. Of the 39 surveyors, 11 chose to extend the survey to a third 5-minute window.
Table 2. The number of sections available and surveyed for each river, with the total number of vantage points (VPs) from which sample counts were undertaken, November 2021 – February 2022.
- | Total number of 5-km sections available | Number of 5-km sections surveyed | Total number of VPs covered |
|---|---|---|---|
Conon | 4 | 4 | 18 |
Forth | 13 | 11 | 30 |
Spey | 33 | 20 | 59 |
Teith | 5 | 5 | 21 |
Total | 55 | 40 | 128 |
The number of vantage points surveyed on each river differed between months (Table 3). As expected very little data were provided for November as recruitment for volunteers was only able to start in that month. Levels of participation were high in December and January and then slightly lower for February, the latter likely because of limitations associated with imminent reporting deadlines. On average there were three vantage points per river section surveyed, but this varied from just one vantage point to up to five (note that vantage points within allocated river sections were selected by the surveyors themselves).
Table 3. Descriptive parameters of vantage points (VPs) from which river birds were surveyed in winter 2021-22. Note the locations of river sections are shown in Annex 3.
River Section number | Number of VPs | Total length viewed (m) | Percentage of section viewed | Length surveyed (m) December | Length surveyed (m) January | Length surveyed (m) February |
|---|---|---|---|---|---|---|
C01 | 3 | 1860 | 37 | 1860 | 1860 | 1860 |
C02 | 5 | 3247 | 65 | 2711 | 3247 | 1312 |
C03 | 5 | 1063 | 21 | 619 | 619 | 1063 |
C04 | 5 | 3022 | 60 | 2294 | 2572 | 0 |
F01 | 5 | 2397 | 48 | 2397 | 2397 | 2397 |
F02 | 5 | 3429 | 69 | 0 | 0 | 3429 |
F04 | 2 | 895 | 18 | 0 | 0 | 895 |
F05 | 1 | 495 | 10 | 0 | 0 | 495 |
F06 | 1 | 278 | 6 | 0 | 278 | 278 |
F07 | 3 | 1272 | 25 | 453 | 897 | 1272 |
F08 | 3 | 992 | 20 | 0 | 992 | 992 |
F09 | 2 | 737 | 15 | 0 | 737 | 737 |
F10 | 2 | 757 | 15 | 0 | 757 | 757 |
F11 | 1 | 380 | 8 | 0 | 380 | 0 |
F12 | 5 | 1390 | 28 | 0 | 1390 | 1390 |
S01 | 3 | 2103 | 42 | 0 | 1483 | 2103 |
S03 | 5 | 3205 | 64 | 0 | 3205 | 3205 |
S07 | 2 | 1840 | 37 | 1840 | 1840 | 1840 |
S08 | 2 | 1270 | 25 | 1270 | 1270 | 1270 |
S10 | 5 | 2032 | 41 | 2032 | 2032 | 2032 |
S11 | 4 | 2916 | 58 | 0 | 2916 | 2916 |
S12 | 3 | 1824 | 36 | 0 | 1824 | 1824 |
S13 | 3 | 2025 | 41 | 0 | 2025 | 2025 |
S14 | 4 | 2810 | 56 | 970 | 2810 | 2810 |
S15 | 5 | 3135 | 63 | 3135 | 3135 | 3135 |
S16 | 2 | 1606 | 32 | 1606 | 1606 | 1606 |
S17 | 4 | 2530 | 51 | 2530 | 2530 | 2530 |
S18 | 1 | 834 | 17 | 834 | 834 | 0 |
S20 | 3 | 1750 | 35 | 0 | 1750 | 1750 |
S23 | 2 | 1210 | 24 | 0 | 1210 | 1210 |
S24 | 2 | 1657 | 33 | 0 | 1657 | 1657 |
S25 | 2 | 728 | 15 | 0 | 728 | 728 |
S26 | 2 | 841 | 17 | 0 | 841 | 841 |
S32 | 3 | 1938 | 39 | 1938 | 1938 | 1938 |
S33 | 2 | 1277 | 26 | 1277 | 1277 | 1277 |
T01 | 5 | 2613 | 52 | 2613 | 2613 | 2613 |
T02 | 4 | 3109 | 62 | 1443 | 1443 | 1443 |
T03 | 4 | 2918 | 58 | 2918 | 2918 | 2918 |
T04 | 4 | 2100 | 42 | 600 | 1500 | 0 |
T05 | 4 | 1740 | 35 | 1740 | 1740 | 0 |
Volunteers were asked to draw the areas of the river that were visible to them from each vantage point on the field maps provided; where they did not do this, the length of visible river at each VP was calculated manually using Q-GIS (QGIS.org 2022) and Ordnance Survey 1:25000 maps. Using the grid reference provided by the volunteer for the vantage point (VP), a straight line was drawn up- and down-stream of the point, to the furthest bank, up to a limit of 1 km. The visible river length could not exceed 2 km, as this is the distance at which some birds were deemed not identifiable with certainty. The average river length visible across all VPs in individual section was 1.8 km. This ranged from just 6% of section F06 viewed, to 69% of section F02 (Table 3).
4.2.2 Birds and mammals recorded
There were 20 riverine bird species recorded during the trial survey, with the Spey having the most species and Conon the fewest (Table 4). During the first 5-minute recording window, 1658 individual birds were identified to species level (Conon n = 46, Forth 441, Spey 966, Teith 205) and 1212 individual birds identified to species level in the second 5-minute time window (Conon n = 50, Forth 313, Spey 714, Teith 135). In total, 158 birds were recorded as being flushed during the survey, 147 of which were in the first 5-minute window.
There were 298 5-minute count windows in which no river birds were recorded (50% of all counts recorded). Zero counts were recorded for 44% of counts during the first 5-minutes of surveying, 56% for the second count window and 52% for the third count window.
Under the category “other river birds”, one volunteer recorded a hybrid Mallard Anas platyrhynchos, and a few volunteers used this category to record other, non-riverine species such as Red Kite Milvus milvus or Fieldfare Turdus pilaris (this was usually on sections where there were no other river bird species observed). The category “Unidentified sawbill” was used only twice by the same volunteer; this was on sections of the Spey where the volunteer had recorded both Goosander and Red-breasted Merganser.
Otters were recorded on six occasions, on each of the rivers with the exception of the Conon. Beaver signs were recorded on the Teith. There were no records of American Mink.
Table 4. The numbers of individual species recorded during vantage point (VP) surveys along four rivers in each month, November 2021 to February 2022.
Forth
| Species | - | Dec | Jan | Feb |
|---|---|---|---|---|
| Mute Swan | Cygnus olor | 8 | 5 | 16 |
| Whooper Swan | Cygnus cygnus | 0 | 0 | 0 |
| Greylag Goose | Anser anser | 0 | 0 | 168 |
| Canada Goose | Branta canadensis | 0 | 0 | 143 |
| Wigeon | Mareca penelope | 0 | 0 | 45 |
| Teal | Anas crecca | 0 | 54 | 80 |
| Mallard | Anas platyrhynchos | 39 | 36 | 63 |
| Tufted Duck | Aythya fuligula | 0 | 0 | 2 |
| Goldeneye | Bucephala clangula | 0 | 6 | 0 |
| Red-breasted Merganser | Mergus serrator | 0 | 0 | 0 |
| Goosander | Mergus merganser | 6 | 6 | 9 |
| Little Grebe | Tachybaptus ruficollis | 2 | 7 | 3 |
| Cormorant | Phalacrocorax carbo | 0 | 2 | 1 |
| Grey Heron | Ardea cinerea | 4 | 6 | 7 |
| Moorhen | Gallinula chloropus | 0 | 0 | 4 |
| Coot | Fulica atra | 0 | 3 | 0 |
| Oystercatcher | Haematopus ostralegus | 2 | 0 | 31 |
| Kingfisher | Alcedo atthis | 0 | 1 | 0 |
| Grey Wagtail | Motacilla cinerea | 0 | 0 | 0 |
| Dipper | Cinclus cinclus | 0 | 0 | 0 |
| Number of VP surveys | - | 6 | 22 | 35 |
| Number of river sectors surveyed | - | 2 | 8 | 10 |
Teith
| Species | - | Nov | Dec | Jan | Feb |
|---|---|---|---|---|---|
| Mute Swan | Cygnus olor | 0 | 14 | 22 | 0 |
| Whooper Swan | Cygnus cygnus | 0 | 0 | 2 | 0 |
| Greylag Goose | Anser anser | 0 | 0 | 0 | 0 |
| Canada Goose | Branta canadensis | 0 | 0 | 0 | 0 |
| Wigeon | Mareca penelope | 0 | 0 | 0 | 0 |
| Teal | Anas crecca | 0 | 0 | 0 | 0 |
| Mallard | Anas platyrhynchos | 46 | 97 | 86 | 9 |
| Tufted Duck | Aythya fuligula | 0 | 0 | 0 | 0 |
| Goldeneye | Bucephala clangula | 0 | 5 | 2 | 0 |
| Red-breasted Merganser | Mergus serrator | 0 | 0 | 0 | 0 |
| Goosander | Mergus merganser | 20 | 38 | 15 | 16 |
| Little Grebe | Tachybaptus ruficollis | 0 | 5 | 6 | 2 |
| Cormorant | Phalacrocorax carbo | 0 | 4 | 0 | 1 |
| Grey Heron | Ardea cinerea | 2 | 6 | 6 | 7 |
| Moorhen | Gallinula chloropus | 0 | 5 | 5 | 2 |
| Coot | Fulica atra | 0 | 0 | 0 | 0 |
| Oystercatcher | Haematopus ostralegus | 0 | 0 | 0 | 1 |
| Kingfisher | Alcedo atthis | 0 | 0 | 2 | 1 |
| Grey Wagtail | Motacilla cinerea | 2 | 1 | 1 | 0 |
| Dipper | Cinclus cinclus | 1 | 5 | 7 | 2 |
| Number of VP surveys | - | 4 | 18 | 18 | 13 |
| Number of river sectors surveyed | - | 1 | 5 | 5 | 3 |
Spey
| Species | - | Dec | Jan | Feb |
|---|---|---|---|---|
| Mute Swan | Cygnus olor | 1 | 2 | 5 |
| Whooper Swan | Cygnus cygnus | 6 | 0 | 1 |
| Greylag Goose | Anser anser | 6 | 27 | 2 |
| Canada Goose | Branta canadensis | 0 | 0 | 0 |
| Wigeon | Mareca penelope | 0 | 11 | 90 |
| Teal | Anas crecca | 27 | 34 | 507 |
| Mallard | Anas platyrhynchos | 227 | 215 | 276 |
| Tufted Duck | Aythya fuligula | 0 | 0 | 10 |
| Goldeneye | Bucephala clangula | 27 | 47 | 70 |
| Red-breasted Merganser | Mergus serrator | 0 | 5 | 10 |
| Goosander | Mergus merganser | 8 | 41 | 17 |
| Little Grebe | Tachybaptus ruficollis | 3 | 1 | 8 |
| Cormorant | Phalacrocorax carbo | 2 | 4 | 1 |
| Grey Heron | Ardea cinerea | 6 | 8 | 3 |
| Moorhen | Gallinula chloropus | 1 | 0 | 0 |
| Coot | Fulica atra | 0 | 0 | 0 |
| Oystercatcher | Haematopus ostralegus | 0 | 10 | 135 |
| Kingfisher | Alcedo atthis | 2 | 0 | 0 |
| Grey Wagtail | Motacilla cinerea | 0 | 0 | 0 |
| Dipper | Cinclus cinclus | 11 | 24 | 15 |
| Number of VP surveys | - | 36 | 68 | 70 |
| Number of river sectors surveyed | - | 10 | 20 | 19 |
Conon
| Species | - | Dec | Jan | Feb |
|---|---|---|---|---|
| Mute Swan | Cygnus olor | 0 | 2 | 0 |
| Whooper Swan | Cygnus cygnus | 0 | 0 | 0 |
| Greylag Goose | Anser anser | 0 | 0 | 0 |
| Canada Goose | Branta canadensis | 0 | 0 | 0 |
| Wigeon | Mareca penelope | 0 | 0 | 0 |
| Teal | Anas crecca | 0 | 0 | 0 |
| Mallard | Anas platyrhynchos | 5 | 1 | 2 |
| Tufted Duck | Aythya fuligula | 2 | 0 | 0 |
| Goldeneye | Bucephala clangula | 13 | 44 | 3 |
| Red-breasted Merganser | Mergus serrator | 3 | 0 | 0 |
| Goosander | Mergus merganser | 10 | 7 | 0 |
| Little Grebe | Tachybaptus ruficollis | 1 | 0 | 0 |
| Cormorant | Phalacrocorax carbo | 7 | 3 | 2 |
| Grey Heron | Ardea cinerea | 5 | 2 | 0 |
| Moorhen | Gallinula chloropus | 0 | 0 | 0 |
| Coot | Fulica atra | 0 | 0 | 0 |
| Oystercatcher | Haematopus ostralegus | 0 | 0 | 0 |
| Kingfisher | Alcedo atthis | 0 | 0 | 0 |
| Grey Wagtail | Motacilla cinerea | 0 | 0 | 0 |
| Dipper | Cinclus cinclus | 0 | 0 | 0 |
| Number of VP surveys | - | 16 | 20 | 13 |
| Number of river sectors surveyed | - | 2 | 8 | 10 |
4.2.3 Reporting rates of sawbills
As the only sawbill species recorded in sufficient numbers, analyses are restricted to the recording rates of Goosander (Table 4). The full model showed statistically significant effects on counts of Goosander of ‘river’ (Χ2 = 30.45, P <0.0001), ‘month’ (Χ2 = 93.29, P <0.0001), ‘count window’ (Χ2 = 15.07, P = 0.002) and the ‘river*month’ interaction term (Χ2 = 20.99, P = 0.002).
Counts of Goosander during the first 5-minute count window (mean 0.54; 95% confidence interval 0.43 – 0.69) were significantly higher than those during the second (0.32; 0.24 – 0.43), as assessed by post-hoc pairwise-comparisons of least square means derived from the models (z = 3.45, P = 0.006). Comments from surveyors suggest that counts during the second count windows were compromised by disturbance from the surveyors. Similarly, counts during the third count window were low (0.18; 0.06 – 0.57) and the difference between second and third counts to those from the first was close to being statistically significant (z = 1.84, P = 0.06) with the power to detect a difference limited by the small number of such counts available. The number of fourth count windows completed was even more restricted. Consequently, all subsequent analyses were restricted to count data from the first five-minute count windows only because of these differences and limitations.
Counts of Goosander were significantly higher on the Teith than on the other three rivers, which did not differ significantly between each other (Figure 4). Counts in the early part of the winter (November and December) were higher than in the later part (January and February) across all four rivers surveyed (Figure 5), however relatively high counts in February on the Teith were responsible for the statistically significant the ‘river*month’ interaction term.
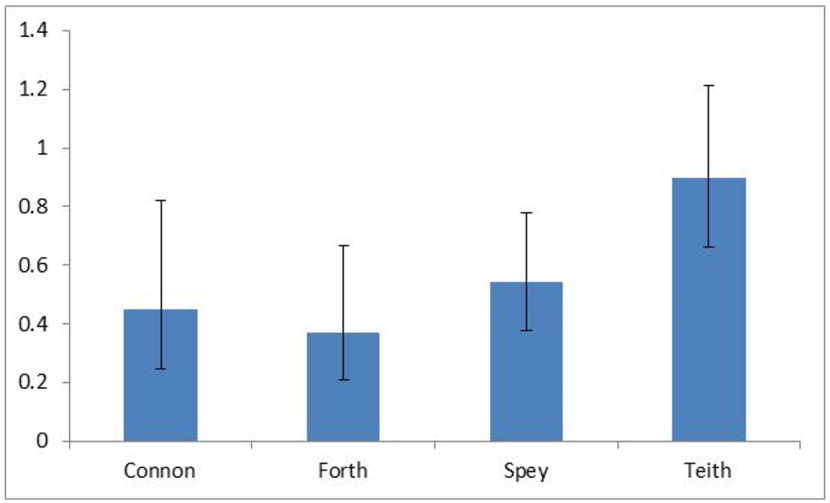
Figure 4. Mean counts (with 95% confidence intervals) of Goosanders per 5-minute sampling period from vantage points on four rivers in Scotland, November 2021 – February 2022.
Click for a full description
The figure is a bar graph. It shows the Teith had a mean count of approximately 0.8 compared to the other three rivers where the mean count was closer to 0.4.
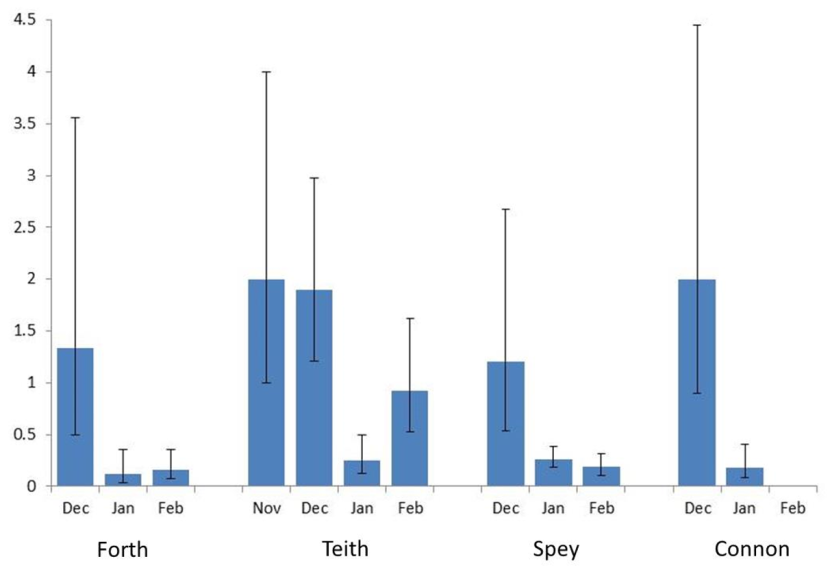
Figure 5. Mean counts (with 95% confidence intervals) of Goosanders per first 5-minute sampling period from vantage points on four rivers in Scotland in each month November 2021 – February 2022. Note, counts in November were undertaken on the Teith only.
Click for a full description
The figure is a bar graph. It shows the peak mean counts for all the rivers was in December. In addition the Teith, showed a smaller peak in February not shown by the Forth of Tay, that were also counted in February. There was no count for the Conon in February.
Counts from rivers between which no statistical difference was detected (following model post-hoc pairwise comparisons) were combined to quantify variation within the counts and therefore estimate likely power to detect changes in numbers. This created two groups of rivers: (a) the Teith with a mean count of 0.74 Goosanders per vantage point (95% confidence interval, 0.60 – 0.88); and (b) the ‘others’ combined with a mean count of 0.38 (0.31 – 0.48). Similarly, months were combined into two groups: (a) ‘Early winter’ (November and December) with a mean count of 1.41 Goosanders per vantage point (95% CI = 1.11 – 1.78); and (b) ‘Late winter’ (January and February combined) with a mean count of 0.20 (0.16 – 0.25).
5. Discussion
The suitability of any field survey method to monitor bird populations is determined by a number of factors including: (a) the statistical power to detect changes over time of, or differences across regions in, abundances; and (b) the resources available to collect sufficient data at appropriate timescales. Specifically relevant to the monitoring of winter populations of sawbills in Scotland are the sizes of population changes that can be detected (i.e. as in (a) above), and over what time period, in order to inform understanding of any impacts of management on their conservation status. The trial of timed point counts offers an approach to monitoring sawbills numbers in winter which has comparable power to detect changes of abundance as do some established methods (Section 5.1). Collection of these alternative metrics should be attractive to volunteer surveyors in order to maximise representative coverage (Section 5.2) and to make repeating a survey with appropriate periodicity feasible, to effectively inform of any changes in abundance within realistic timescales to adapt management policies affecting them (Section 5.3).
5.1 Suitability of the sawbill data for the core aims of survey and monitoring
The variation in counts of Goosanders from sample vantage point counts on four rivers in Scotland varied from -18% to +26% around the means using the data combined for rivers and winter periods (Section 4.3.3). Using the same assumptions used to assess the statistical power to detect changes between two survey periods in the winter abundance of Goosander in Wales (see Section 2.4), this suggests the potential to reliably detect a decline of 36% or an increase of 52% between two surveys using the same methods. This is marginally less power to detect change between a pair of surveys than for the more intensive survey approach used in Wales (expected to detect a decline of 32% or an increase of 40% across Wales). Statistical power to detect change is enhanced markedly however if surveys can be repeated with sufficient frequency for trends to be determined. For example, data from annual bird sampling surveys can deliver trends through generalised modelling approaches (linear or additive) that can have greater statistical power to detect change than by a simple comparison of data from surveys undertaken at two separate points in time or space.
Trends in the abundance of many bird populations are routinely determined by annual surveys, which in Britain are undertaken mostly, or exclusively, by volunteer surveyors. Particularly relevant to sawbill ducks in winter is the Wetland Bird Survey (WeBS; Frost et al., 2021). WeBS uses an established approach that delivers trends based on standardised monthly counts of delineated sectors of selected waterbodies. A seasonal difference in the abundance of Goosander was detected in the trial surveys reported here (greater abundance in the first half of the winter) and so an approach that could potentially deliver metrics of abundance at different times through the winter will be important. This is because a survey that provides a single metric for a whole winter has the potential to be unrepresentative. A survey that can be repeated several times through a year will have advantages in the potential to identify seasonal differences in any changes of status. For Goosanders and other piscivorous species, this could be particularly relevant for identifying changes at key times for potential conflict with fisheries interests. While WeBS delivers monitoring through its monthly sampling protocol, rivers are generally poorly represented within the survey over many parts of Scotland and hence there is a clear need for better information on the status of sawbills in Scottish rivers.
Ideally, further development of monitoring protocols for sawbills should build on existing programmes where these are appropriate. Enhancement and expansion of WeBS would be an obvious approach but it must be accepted that there will be limitations as to how far that scheme can be expanded using current pools of volunteers and the count methods that are used (i.e. full surveys by walking along allocated river sections). Point counts, as undertaken here on four rivers in Scotland in winter 2021-22, have the potential to supplement WeBS in areas where achieving coverage proves difficult in that it offers an alternative approach, which is expected to be logistically more practical for rivers and could prove attractive to new volunteers including people from different stakeholder groups. As fewer birds tended to be detected in second and subsequent five-minute sampling periods in the present study, timed point counts could be restricted to five minutes only which in turn could allow surveyors to sample more points during any survey visit. In addition to WeBS, a number of catchments have their own bespoke approaches to monitoring sawbills, most of which involve coordinated counts (Humphreys et al., 2016) and are not dissimilar to WeBS. Some approaches use specialist equipment such as canoes (Cosgrove et al., 2004) and communications with contacts during this trial work revealed that others are considering the use of drones and even using loud noises to flush and then count birds. While there is merit in continuing with local or regional approaches where these are already established, the inconsistencies in approach and variation in coverage between years makes the data from these counts difficult to combine to make population estimates at a wider than catchment level. The development of new methods should aim to be consistent, compatible with established approaches, readily applicable across sites, and be suitable for use by different interest groups.
5.2 Suitability of the trial method for use by volunteers
5.2.1 Success of engagement with volunteers and associated constraints
With funding only agreed in September, time for preparation of volunteer engagement materials was very restricted. Nevertheless, our requests to the ‘traditional’ volunteer audience of birdwatchers/existing BTO volunteers resulted in many more volunteers compared to the 10-12 we had envisaged at the outset might test the survey for us. This was perhaps not surprising, as we have a large database of supporters to call upon, and many of these people have an existing relationship with BTO and have already carried out surveys for us on a regular basis. We were also aided in engagement by our existing volunteer coordinators in each region (BTO Regional Representatives, WeBS Local Organisers and other local contacts). A few such volunteers expressed concerns about surveying sawbills where the objective was to provide data to underpin licensed control measures for these birds but we were largely able to allay these concerns. The majority of this existing audience understands and supports the BTO remit to provide objective data and advice, even around sensitive conservation management issues. These concerns of some do highlight the potential advantages of different stakeholder groups gaining a mutual understanding of each other by working together on surveys and monitoring programmes (Ainsworth et al., 2020).
In the necessarily tight timescale, we were less successful in actively engaging volunteers who self-identified with fisheries/angling interests in the trial surveys. We were able to call upon existing contacts held by BTO Scotland and UKCEH at the relevant local Fisheries Boards and River Trusts and they were helpful and supportive without exception. However, at least three of these bodies raised concerns around engaging their supporters/members/angers in systematic surveys, voicing some likelihood that those with a fishing interest would likely know the river well enough to know where to find large numbers of sawbills, and there was a risk they would actively seek these areas out to count larger numbers of birds, thereby introducing a bias into the results. While such concerns could influence survey data that were to be used to deliver population estimates, it would not necessarily be an issue in delivering metrics that could be used to provide information on trends in abundance. In any future surveys, the possibility of deliberately focussing some counts in places where local knowledge presumed larger numbers of birds to be, however, would need to be considered carefully when delineating river sections to be surveyed and the number of vantage points to be included within each section.
The timescale available to communicate with potential survey volunteers through these third party contacts were particularly challenging, and it was not always possible to establish whether key information had been passed on to their supporters/anglers or not (for example, because it did not meet the existing planned schedule of communications with their members). Although we consider a good number of potential volunteers identifying with fisheries interests did eventually receive the invitations to help with the pilot survey, some probably only received the information at quite short notice (for example, as part of a second push for engagement that we carried out in early February). There are pros and cons of using different approaches to reaching potential volunteers with fisheries interests. By going through 'umbrella' contacts, individuals and angling clubs heard about the pilot survey and were asked to take part from a ‘warm’ (trusted) contact, rather than direct from BTO (who they probably did not know). However, using these routes, it was harder for us to gauge the level of interest/response, and hard to know exactly which details were passed to individual anglers. Given that we know that at least some angling clubs were told about the survey, the relatively low translation into participation by anglers either tells us that not all the clubs considered it appropriate/interesting/within their remit to pass on survey information to potential volunteers, or that the anglers themselves opted not to take part - both give us an insight into the relative difficulties of engaging with this audience, in the first instance at least. Should such vantage point surveys become a feature or requirement of some future national licencing protocol, it may well be that a higher proportion of ‘fisheries community volunteers’ could be incorporated and retained in the ranks of survey volunteers.
At the outset of the pilot study work, we were well aware of the challenges of engaging a potential pool of volunteers with little previous exposure to BTO or to structured bird surveys. It is often difficult for those not involved previously to understand why a systematic survey method is important and why they cannot just go to places where they know there are numbers of the focal animal (in this case sawbill ducks) to count. Those not familiar with BTO may also incorrectly understand BTO to be a conservation organisation that is anti-angling/licensed control, and therefore be suspicious of engaging with a survey coordinated by BTO. Whilst we took every possible opportunity to explain the background to the survey and the need for the methods to this new audience in the written materials we provided, this could never be a substitute for a more comprehensive programme of relationship building, engagement and training, which would need to be planned and delivered with a longer lead-in period to recruit larger numbers of volunteers from any new group such as this. It would likely require more face-to-face meetings than were possible during the winter of 2021/22 and would benefit from some keen members of the fishing community to act as ambassadors / advocates / influencers / local points of contact. Contacts at the Fisheries Boards / River Trusts provided some helpful suggestions for increasing participation in future, including: placing articles in Trout & Salmon magazine; attending relevant AGMs; and attending events organised to open the salmon fishing season. All could prove valuable, given a suitable lead-in time to a future survey. Furthermore, there could be opportunities (or constraints) associated with fishing seasons for engaging with people from the fisheries interest groups that we were unable to accommodate within the pilot reported here.
We elected not to use social media to recruit volunteers for this time-limited pilot study because we were not looking to achieve full coverage and had limited time and resources for running the survey. There may be great potential to use social media for effective engagement as a way of reaching the fisheries audiences more directly in future, but any campaign would require careful planning and management to deal with the potentially controversial/divisive issues arising from the link between the survey work and licensed control of fish-eating birds.
On the Spey, full-river surveys from Loch Insh to Spey Bay are carried out four times a year. This involves teams of surveyors travelling by canoe or on foot and recording sawbills, cormorants, and grey herons. The Forth Rivers Trust ran two full walkover surveys in March 2017 and 2018 counting fish-eating birds, using recording protocols from NatureScot, along with marking on maps where each record was made; a mixture of anglers and their own conservation volunteers took part with the aim to find out if there were any ‘hot spots’ (aggregations of fish-eating birds) in the catchment. These counts clearly took a significant amount of time, effort, and organisation. There is thus also a need to explain clearly to any volunteers already involved in such bird surveys why participation on a different survey is valuable and complementary to their ongoing local survey work.
5.2.2 Feedback from different types of participant
Overall the vantage point bird survey methods were very well received by participants and none of the volunteers found the survey particularly difficult to carry out. Again, this is perhaps not surprising given that almost all participants had some previous bird survey experience (and at least half had carried out BBS or WeBS surveys). To date we have had responses from only two volunteers who did not self-identify as existing birdwatchers. The majority (85%) of respondents said they would take part in a future survey using these methods, and the remaining 15% said they “might” take part in future surveys.
Almost 90% of participants indicated they were already confident in identifying Goosanders and Red-breasted Mergansers ahead of the pilot survey work but nevertheless not all participants were confident in identifying all the riparian species they might see, and therefore the advance training provided was both important and clearly both valued and enjoyed by participants.
5.3 Feasibility of future survey and monitoring based on volunteers
There is a range of reasons why there is great value in encouraging more members of the fisheries communities to engage with future surveys of riverine birds. Given the uneven human population densities across Scotland, it is challenging to try to achieve satisfactory national coverage for most kinds of bird and wider biodiversity monitoring (at least away from the Central Belt) when we are reliant on existing skilled birdwatchers (as evidenced by existing gaps in coverage of national surveys like BBS and WeBS). Engaging other groups of potential volunteers who are already countryside users and have the potential to carry out surveys has been part of BTO Scotland’s overall surveyor engagement strategy for more than 10 years and includes previous, and ongoing, work with hillwalkers, estate managers, gamekeepers and the farming community.
As well as helping us to improve overall biodiversity monitoring coverage across Scotland, engagement with new groups of potential volunteers can be particularly beneficial in situations where data are being gathered to underpin decision-making that is controversial, as is the case around the licensed control of fish-eating birds. In such situations, polarised views from different stakeholder groups (in this case, crudely, ‘fisheries interests’ and ‘bird conservationists’) can lead to mistrust in supporting data collected by one or other of the groups (Carss et al., 2009; Marzano et al., 2013; Ainsworth et al., 2020). Involving all interested stakeholders actively in surveys should build more trust in the resulting dataset and, if planned carefully, can also help to build trust between opposing stakeholder groups by encouraging them to work together and better understand each other’s position and needs.
5.4 Comparison of survey costings
A survey of about 2,300 km of salmon rivers in Wales (out of a total of 16,456 km of non-tidal river; after Ordnance Survey Open Source Data) in winter 2020-21 undertaken exclusively by professional surveyors cost a total of about £213,000. Costs were roughly divided into £44,000 for planning, management, analyses and reporting with £169,000 directly spent on fieldwork and associated data processing. Full details of methods are described by Taylor et al. 2021, but in summary, most of the main channels were covered once in December and samples of tributaries were surveyed and repeat counts of 50% of the main channels were undertaken in January and February (see Section 2.2).
The following rough costs for similar surveys of rivers in Scotland assume comparable rates (noting that these will change over time), and that resources required for planning, management, analyses and reporting will remain similar for a comparable or greater length of surveyed rivers. Using these assumptions, acknowledging that these are not confirmed costings and they are based on costs in 2020-21, a comparable survey covering different lengths of river could cost in the order of: £137,000 for 1,000 km of river; £230,000 for 2,000 km of river; £322,000 for 3,000 km of river; £415,000 for 4,000 km of river; £507,000 for 5,000 km of river; £970,000 for 10,000 km of river; £1,433,000 for 15,000 km of river; £1,897,000 for 20,000 km of river.
With 45,442 km of non-tidal river in Scotland (after Ordnance Survey Open Source data) and assuming a survey of a representative sample of 14%of that length (as in Wales), equivalent to 6,362 km, the estimated costs for a fully professional survey could be around £634,000.
A sample survey using volunteers and a vantage point sampling approach, as trialled on four rivers in Scotland in winter 2021-22, would require sufficient funding to cover planning, engagement, training, coordination, data handling, analyses and reporting. Furthermore, such a survey would benefit from coordinated cooperation and calibration with other established monitoring schemes (Section 5.1). Costing a programme of work to further develop volunteer based surveys of piscivores (and potentially wider riparian biota) would require discussions with those operating and coordinating the established monitoring/counting schemes, which is not achievable within the timescales for reporting here. For very rough guidance however, we suggest the initial set up costs of a programme of river monitoring restricted to three or four months of the winter could be in the order of £50,000 with subsequent annual maintenance and reporting costs in the order £25,000, exclusive of any VAT that may be applicable. As with all costs suggested here, these figures are presented for rough guidance only, with more realistic costings possible only following discussions and agreement about areas to be covered, outcomes, purposes and duration of any future survey or monitoring programmes. In particular, any long-term monitoring programme would benefit from the development of online data capture capability which would incur additional set-up costs but should reduce ongoing running costs. Furthermore, we have not factored any need for professional fieldworkers to supplement that by volunteers; if surveys were required of more remote sections, in particular many headwaters of river systems, then additional costs would be required.
6. Recommendations and conclusions
Timed point counts have considerable potential to add capacity for monitoring capabilities of riparian birds, including sawbills on Scottish rivers. They could be a valuable and cost-effective supplement to established monitoring programmes (e.g. WeBS and potentially regional monitoring undertaken by local fishery interests) where more comprehensive counts are less feasible because of limitations associated with site accessibility or the availability of surveyors. Given the generally favourable feedback from participants in the pilot surveys reported here, the use of a relatively simple and standardised methodology could also help introduce ‘new’ people and groups to bird monitoring activities. It is acknowledged that more time to work with fisheries groups would be needed than was available in the present study in order to maximise their input and involvement. Introducing new people to such counting schemes could be particularly attractive if surveys were targeting single species or a limited number of them such as Goosanders and other sawbills and if such surveys were associated with a relevant training programme.
There is a general need to improve the monitoring of riparian birds in relation to general biodiversity management issues, though for sawbills there is arguably a more immediate policy need. The number of Goosanders recorded in the present pilot study was quite low; 82% of all counts recorded no Goosanders from vantage points on river sections. Motivation to continue participation in such surveys can be associated with seeing and recording the target species and so there might be an issue with motivating some volunteers for a survey solely targeting Goosanders (or sawbills). Recording of other species during the survey (even one where the principle interest is sawbills) would thus not only add to the intrinsic value of the data collected, but also add to the attractiveness of such a survey to potential participants. An associated survey and identification training programme could therefore include a limited suite of riparian species and so would be less likely to preclude, or be a disincentive to, new surveyors. The current pilot surveys also demonstrated that riparian mammals could also be recorded, indicating the potential for such surveys to include other taxa; for example, if monitoring periods included the summer months as well, the distributions of some invasive non-native plants (e.g. Japanese Knotweed Reynoutria japonica, Giant Hogweed Heracleum mantegazzianum and Himalayan Balsam Impatiens glandulifera) and their associations with possible changes in native biodiversity.
A limitation of timed point counts of river birds is that they do not deliver estimates of population size directly. While regular indices of abundance (which could be delivered by point counts) can best inform changes in status and the needs for, or impact of, any management interventions, knowledge of actual population size can be important when considering proportions of populations that can be affected by a programme of culling or disturbance for example. However, population estimates of any widespread species are subject to bias associated with the detectability (to surveyors) and the behaviour of the species involved (e.g. Brouwer et al., 2003; Hewson et al., 2018). This makes such estimates effectively indices of population abundance and hence why it is essential that repeat surveys, or surveys from other areas against which comparisons are made use directly comparable field and interpretive methods. For Goosanders, the potential sources of bias, and therefore inaccuracy, in a population estimate are poorly understood. Furthermore, ongoing BTO studies of Goosander movements and use of river systems indicate they may differ between catchments which would add further to the uncertainties around any derived population estimate. However, there would be value in further work to calibrate the indices of abundance derived from point counts with population size estimates or, more realistically, with other survey methods that are expected to deliver indices that are more representative of population size. A better understanding of how indices of species abundance derived from different survey methods relate to each other will also inform how to best to integrate counts and other indices of abundance derived from different survey methods.
References
Ainsworth, G.B., Redpath, S.M., Wilson, M., Wernham, C. and Young, J.C. 2020. Integrating scientific and local knowledge to address conservation conflicts; Towards a practical framework based on lessons learned from a Scottish case study. Environmnetal Science & Policy, 107, 46-55.
Armitage, M.J.S., Rehfisch, M.M. and Wernham, C.V. 1997. The 1997 Breeding Sawbill Survey. BTO Research Report No. 193 , BTO, Thetford.
Balmer, D.E., Gillings, S., Caffrey, B.J., Swann, R.L., Downie, I.S. and Fuller, R.J. 2013. Bird Atlas 2007–11: the Breeding and Wintering Birds of Britain and Ireland. BTO, Thetford.
Brouwer, J., Baker, N. E. & Trolliet, B. 2003. Estimating bird population sizes and trends: What are the hard data, what are the unavoidable assumptions? A plea for good documentation. Wader Study Group Bulletin, 100, 197– 201.
Call, E.M. and Hunter, M.L. 2017. Evaluating the framework of a new river bird survey method. River Research and Applications, 33(4), 495-504.
Carss, D.N. (ed.) 2003. Reducing the conflict between Cormorants and fisheries on a pan- European scale REDCAFE: Pan European Overview Final Report to European Commission, (August 2003), pp. 169.
Carss, D.N., Bevan, R.M., Bonetti, A., Cherubini, G., Davies, J., Doherty, D., El Hili, A., Feltham, M.J., Grade, N., Granadeiro, J.P. and Grémillet, D. 1997. Techniques for assessing cormorant diet and food intake: towards a consensus view. Suppl. Ric. Biol. Selvaggina, 26, 197-230.
Carss, D.N., Bell, S. and Marzano, M. 2009. Competing and coexisting with cormorants: ambiguity and change in European wetlands. In: Heckler, Serena, (ed.) Landscape, Process and Power: Re-evaluating Traditional Environmental Knowledge. New York, Oxford, Berghahn Books, 99-121. Environmental Anthropology and Ethnobiology, Vol 10.
Carss, D.N., Parz-Gollner, R. and Trauttmansdorff, J. 2012. The INTERCAFE Field Manual: research methods for cormorants, fishes, and the interactions between them. INTERCAFE COST Action 635 Final Report II. NERC/Centre for Ecology & Hydrology on behalf of COST, pp. 142.
Cosgrove, P.J., Butler, J.R.A. and Laughton, R.L. 2004. Canoe and walking surveys of wintering Goosanders, Red-breasted Mergansers, Great Cormorants and Common Goldeneyes on the River Spey, 1994-2003. Scottish Birds, 24, 1-10.
Frost, T.M., Calbrade, N.A., Birtles, G.A., Hall, C., Robinson, A.E., Wotton, S.R., Balmer, D.E. and Austin, G.E. 2021. Waterbirds in the UK 2019/20: The Wetland Bird Survey. BTO/RSPB/JNCC. Thetford.
Gibbons, D.W., Reid, J.B. and Chapman, R.A. 1993. The New Atlas of Breeding Birds in Britain and Ireland: 1988–1991. T. & A.D. Poyser, London.
Gregory R.D., Carter, S.P. and Baillie, S.R. 1997. Abundance, distribution and habitat use of breeding Goosanders Mergus merganser and Red-breasted Mergansers Mergus serrator on British rivers. Bird Study, 44, 1-12
Harris, C.M., Calladine, J., Wernham, C.W., and Park, K.J. 2008. Impacts of piscivorous birds on salmonid populations and game fisheries in Scotland: a review. Wildlife Biology, 14, 395-411.
Harris, S.J., Massimino, D., Balmer, D.E., Eaton, M.A., Noble, D.G., Pearce-Higgins, J.W., Woodcock, P. and Gillings, S. 2021. The Breeding Bird Survey 2020. BTO Research Report 736. British Trust for Ornithology, Thetford.
Hewson, C., Miller, M., Johnston, A., Conway, G.J., Saunders, R., Marchant, J.H. and Fuller, R.J. 2018. Estimating national population sizes: Methodological challenges and applications illustrated in the common nightingale, a declining songbird in the UK. Journal of Applied Ecology, 55, 2008-2018.
Humphreys, E.M., Gillings, S., Musgrove, A., Austin, G, Marchant, J. and Calladine, J. 2016. An update of the review on the impacts of piscivorous birds on salmonid populations and game fisheries in Scotland. Scottish Natural Heritage Commissioned Report No. 884.
Marquiss, M. and Carss, D.N. 1994. Avian piscivores: basis for policy. National Rivers Authority.
Marquiss, M., Carss, D.N., Armstrong, J.D. and Gardiner, R. 1998. Fish-eating Birds and Salmonids in Scotland. Scottish Office Agriculture, Environment and Fisheries Department. Edinburgh: Stationary Office.
Marzano, M., Carss, D.N., and Cheyne, I. 2013. Managing European cormorant-fisheries conflicts: problems, practicalities and policy. Fisheries Management and Ecology, 20(5), 401-413.
QGIS.org, 2022. QGIS Geographic Information System QGIS Association.
Russell, I.C., Dare, P.J., Eaton, D.R. and Armstrong, J.D. 1996. Assessment of the problem of fish-eating birds in inland fisheries in England and Wales. Lowestoft: Directorate of Fisheries Research.
Salmon Business, 2018. Scottish wild salmon count, investigation into decline begin
SAS Institute Inc, 2013. SAS® 9.4 Statements: Reference. Cary, NC: SAS Institute Inc.
Taylor, R. and Noble, D. 2017. Population estimates of non-breeding Cormorant and Goosander on the River Dee. Report to NRW.
Taylor, R.C., Austin, G., Boersch-Supan, P., Bowgen, K., Burton, N., Calladine, J., Noble, D. and Robinson, R. 2020. 2020/21 winter census of cormorant and goosander in Wales. Report to NRW.
Taylor, R.C., Boersch-Supan, P., Cooper, C., O’Connell, P., Wetherhill, A., Bowgen, K. and Calladine, J. 2021. A winter census (2020/21) of Cormorant and Goosander in Wales. Report to NRW.
Wires, L.R., Carss, D.N., Cuthbert, F.J. and Hatch, J.J. 2003. Transcontinental connections in relation to cormorant-fisheries conflicts: perceptions and realities of a "bête noire" (black beast) on both sides of the Atlantic. Vogelwelt 124, Suppl.: 389-400.
Annexes
Annex 1: Instructions provided to volunteers for the trial surveys of river birds in the winter of 2021/22
Annex 1 is a reproduction of the survey instructions provided to the volunteer surveyors. It has been provided in PDF format below. Please note that this document is not fully accessible. If you require an accessible format please use the feedback form on our website.
Annex 2: Examples of completed recording sheets and field map
Annex 2 is an example of a completed recording sheet. It has been provided in PDF format. Please note that this document is not fully accessible. If you require an accessible format please use the feedback form on our website.
Annex 3: Post-survey maps showing river sections that were and were not surveyed and locations of vantage points within each section
Annex 3 contains maps of each of the four river systems that were surveyed as part of the pilot.
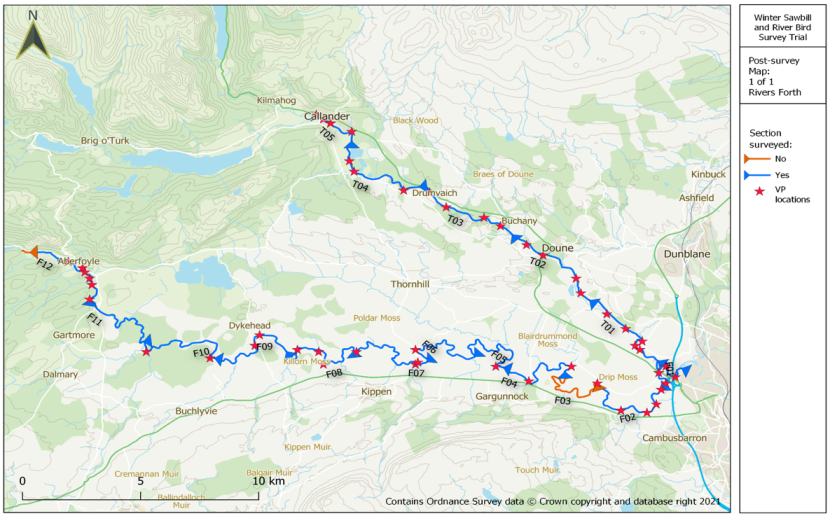
Figure 6. Map of two rivers surveyed in Forth.
Click for a full description
Sections that were surveyed are marked in blue and un-surveyed sections are shown in red.
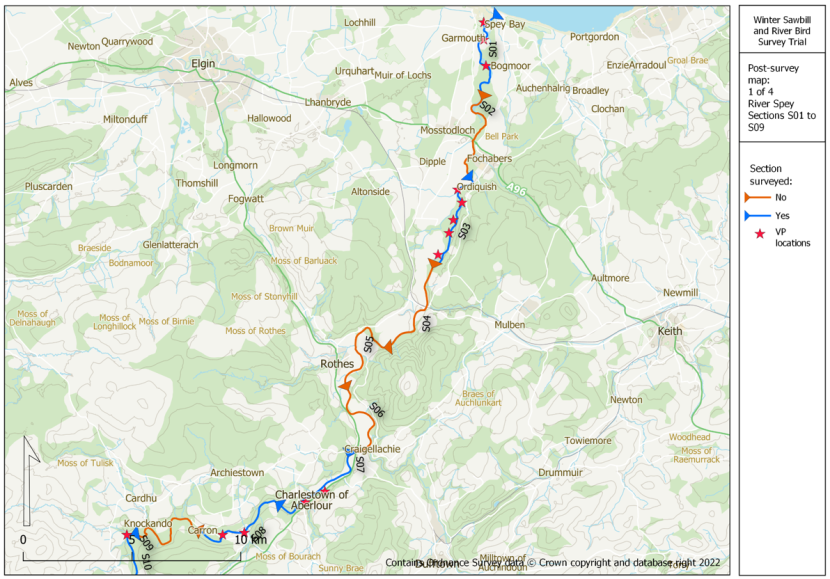
Figure 7. Map of the River Spey sections S01 to S09.
Click for a full description
Sections that were surveyed are marked in blue and un-surveyed sections are shown in red.
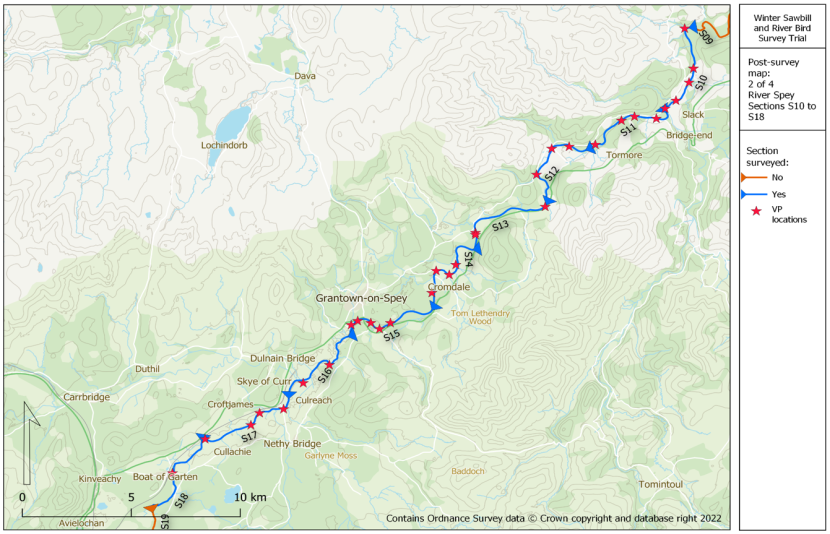
Figure 8. Map of River Spey sections S10 to S18.
Click for a full description
Sections that were surveyed are marked in blue and un-surveyed sections are shown in red.
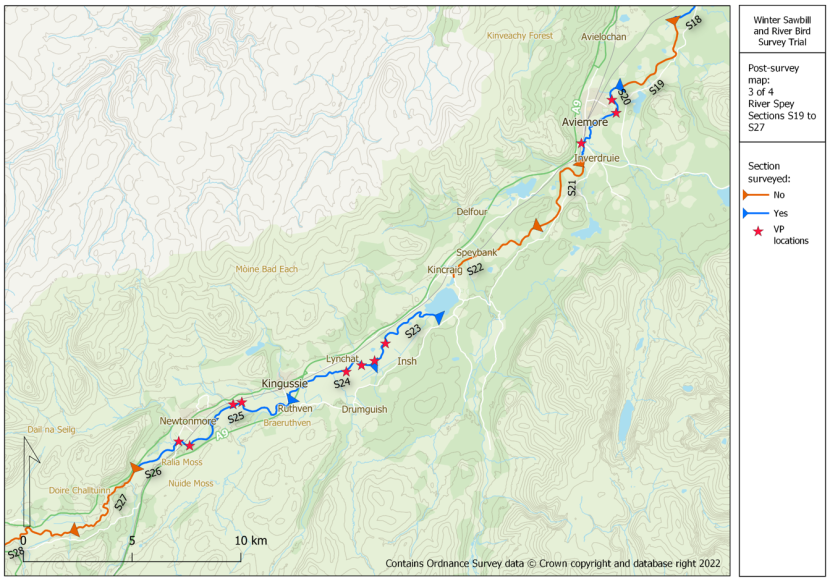
Figure 9. Map of River Spey sections S19 to S27.
Click for a full description
Sections that were surveyed are marked in blue and un-surveyed sections are shown in red.
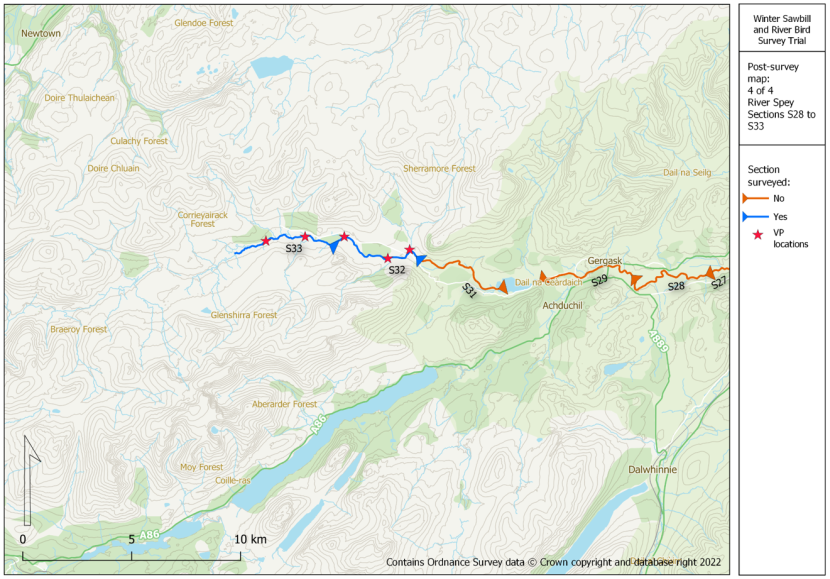
Figure 10. Map of River Spey sections S28 to S33.
Click for a full description
Sections that were surveyed are marked in blue and un-surveyed sections are shown in red.
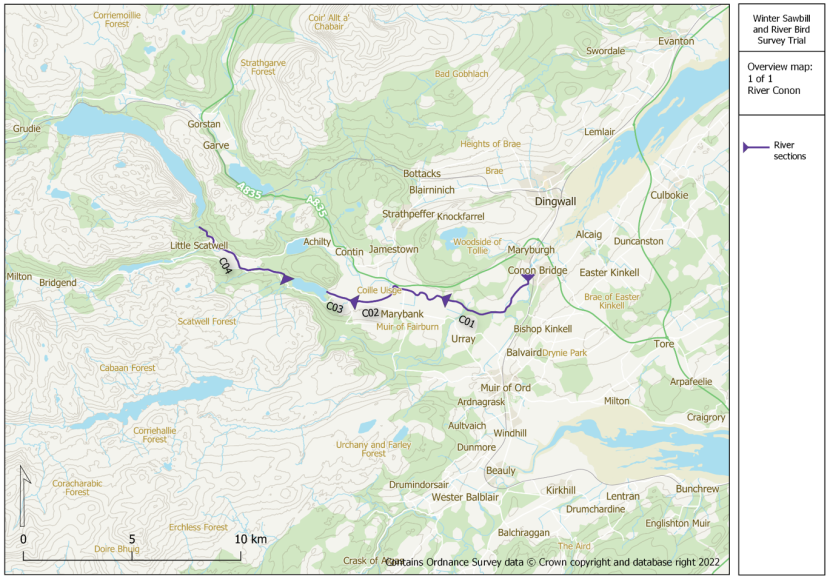
Figure 11. Map of River Bird.
Click for a full description
Sections that were surveyed are marked in blue and un-surveyed sections are shown in red.