NatureScot Research Report 1372 - 2023 South Arran dive survey: comparison with imagery data from 2014 and recommendations for monitoring method optimisation
Published: 2025
Authors: Matt Doggett, Lin Baldock and Nick Owen (Marine EcoSol)
Cite as: Doggett, M., Baldock, L., and Owen, N. 2025. 2023 South Arran dive survey: comparison with imagery data from 2014 and recommendations for monitoring method optimisation. NatureScot Research Report 1372.
Keywords
Diver; diver transect; maerl; maerl gravel; marine; monitoring; seagrass; fisheries, management; South Arran MPA; phase II; photo quadrat
Abbreviations
MPA = Marine Protected Area
NTZ = No Take Zone
MNCR = Marine Nature Conservation Review
EMFF = European Maritime and Fisheries Fund
PMF = Priority marine feature
BACI = Before-After Control-Impact
COAST = Community of Arran Seabed Trust
RV = Research vessel
BCD = Below Chart Datum
PSA = Particle Size Analysis
Background
The aim of this survey was to make detailed assessments of the condition of selected protected features in the South Arran Marine Protected Area (MPA) and to compare condition using data collected in previous dive surveys in 2014/2015 on six fixed dive transects. The main features assessed were maerl habitats and seagrass beds. Detailed diver observations were made to assess the condition of associated communities, and to assess any changes in habitat since management measures were introduced for the protection/recovery of the features in 2016.
The South Arran MPA encompasses a range of protected features: burrowed mud, kelp and seaweed communities on sublittoral sediment, maerl beds, maerl or coarse shell gravel with burrowing sea cucumbers, ocean quahog aggregations, seagrass beds, and shallow tide-swept coarse sands with burrowing bivalves. The conservation objectives of the MPA are to restore maerl beds and conserve the other protected features. Dive transects were focussed predominantly on maerl habitats and the repeat of detailed dive surveys in these areas were used to evaluate change since the 2014 survey.
Main findings
- The aim of this project was to make detailed assessments of the condition of selected protected features in the South Arran MPA. The features assessed were maerl beds, kelp and seaweed communities on sublittoral sediment (including maerl gravel) and seagrass beds. Feature condition in 2023 was assessed by comparison with data collected in previous dive surveys in 2014/2015 on six fixed dive transects.
- Two maerl beds, a seagrass bed and four maerl gravel habitats in and around the MPA were surveyed in detail by divers at the end of August 2023 (Figure 1). These sites (with the exception of one site) had previously been surveyed in 2014 using similar, but not identical methods.
- Sediments at four of the seven sites surveyed in 2023 were dominated by dead maerl gravel (50 %-60 % cover) or by largely maerl and shell-derived sand and had less than 1% live maerl. These sites represented part of the ‘kelp and seaweed communities on sublittoral sediment’ protected feature of the South Arran MPA.
- The other two maerl sites had dense growths of live maerl: with Phymatolithon calcareum dominating at a site northwest of Pladda and Lithothamnion glaciale in Lamlash Bay. Live maerl cover at these two sites was on average 18 % and 52 % respectively, and are representative of the maerl beds protected feature of the MPA.
- Comparison of the ecological community data derived from photo quadrats, where available for both survey years, suggested negligible inter-annual differences between the two data sets. Furthermore, there were no strong correlations between the community data obtained from the image analysis with the substrate data generated at the same time.
- Comparison of community data derived from video footage from 2014 and 2023 showed that there were only small differences between survey years with the same taxa contributing to sample similarity between the years. Again, there was no strong correlation with substrate composition.
- A similar comparison using Phase II survey data did show significant differences in the benthic communities between years. There were, however, few differences in the characterising taxa at each site. Possible reasons for the differences are discussed.
- Two non-native red seaweeds, the Trailliella phase of Bonnemaisona hamifera and siphoned Japan weed (Dasysiphonia japonica) contributed in abundance to mats of filamentous and foliose red algae which were recorded binding sediment and live maerl at all survey sites apart from that at Pladda. This was especially notable at Lamlash Bay North where the live maerl was matted and bound together by filamentous red algae. B. hamifera was also identified during analysis of sediment core samples at four sites (SAR01, SAR02, SAR03 and SAR06) along with the non-native polychaete Goniadella gracilis at one site (SAR02; Purdue et al., 2025).
- The final site surveyed was a sandy seabed with moderately dense patchy seagrass, representative of the seagrass bed protected feature of the MPA. With just a single transect surveyed in the Whiting Bay seagrass bed, only a qualitative assessment could be made between the two surveys. The most abundant taxa at the site were the same in both survey years, the only exception being the common starfish (Asterias rubens) which was not recorded in 2023.
Acknowledgements
We would like to thank Liz Morris-Webb for her input to setting up this contract and seeing it through to near completion.
1. Introduction
1.1 Background
The South Arran MPA encompasses a range of protected features: burrowed mud, kelp and seaweed communities on sublittoral sediment, maerl beds, maerl or coarse shell gravel with burrowing sea cucumbers, ocean quahog aggregations, seagrass beds, and shallow tide-swept coarse sands with burrowing bivalves. The conservation objectives of the MPA are to restore maerl beds and conserve the other protected features. Dive transects were undertaken in August 2023 which focussed predominantly on maerl beds and maerl gravel, repeating work originally undertaken in 2014, in order to investigate possible changes in the condition or extent of these habitats since that point in time.
The South Arran Marine Conservation Order 2015 implemented under the Inshore Fishing (Scotland) Act 1984 came into force in February 2016 to further the conservation objectives of the MPA. Approximately 1 % (276 hectares) of the MPA, north of Holy Isle, has been designated as a No Take Zone (NTZ) where all forms of fishing are prohibited. Certain forms of bottom contact fishing methods are prohibited within the whole MPA and four small areas are designated where fishing using static gear is also prohibited. The survey sites selected aimed to include examples of different fishing methods within and close to the MPA for assessment:
- No demersal trawling other than by beam trawl by vessel of < 120 tonnes, dredging prohibited
- All trawling and dredging prohibited
- Trawling, dredging and static gear prohibited
- No Take Zone
1.2 Survey aims
The overall aim of this project was to make detailed assessments of the condition of selected protected features in the South Arran Nature Conservation Marine Protected Area (MPA) designated by the Scottish government in 2014. This report, however, specifically presents the results of the Phase II survey and in situ imagery (quadrats and diver video transects) carried out in August and September 2023. The scope of this report does not include additional data which will be considered in assessing feature condition: specifically infaunal analysis from sediment cores and complementary data from previous deeper water surveys on RV Alba na Mara in 2021 and the European Maritime and Fisheries Fund (EMFF) project in 2018.
Feature condition in 2023 was compared to data collected in previous dive surveys in 2014/2015 on seven fixed dive transects. The features assessed were maerl beds, kelp and seaweed communities on sublittoral sediment (including maerl gravel) and seagrass beds. Detailed diver observations were made to evaluate associated communities, and to try to gauge any changes in habitat since fisheries management measures were introduced for the protection/recovery of the designated features in 2016.
In order to achieve these assessment aims a dive survey took place in late summer 2023 (August/September) when a team of divers revisited survey sites previously surveyed in 2014 using similar, but not identical methods (Mercer et al., 2018). The Arran MPA and the seven survey locations are shown in Figure 1.
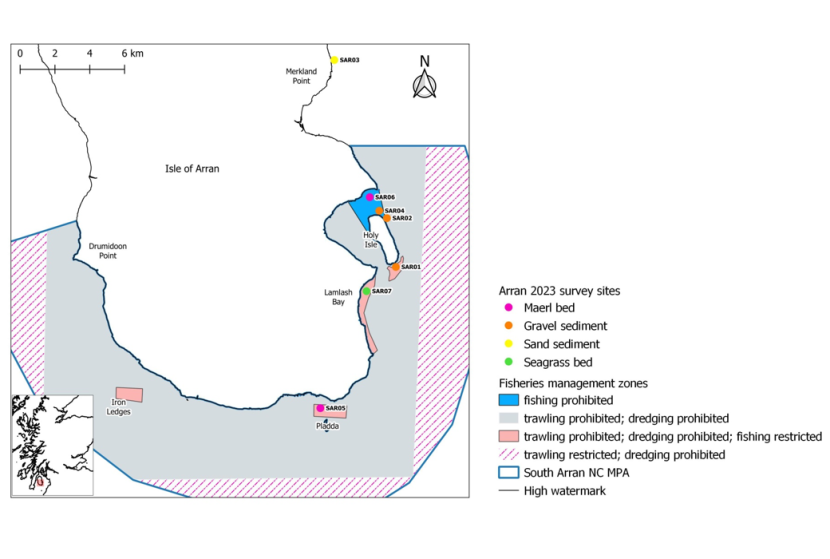
Figure 1. Map showing the extent of the South Arran Marine Protected Area (MPA) together with fisheries management zones and 2023 survey site locations.
Click for a full description
Map of South Arran MPA with seven survey sites from which MNCR Phase II data, photo quadrats and video transects were collected: marked in pink where sites are maerl beds; orange where sediments are gravelly, including maerl gravel; yellow where sediment is sandy and green where the site is a seagrass bed. No quadrat images were collected at site SAR04 due to the camera flooding.
SAR01 (HI22, Holy Isle south)
SAR02 (HIN02, Holy Isle north, in MPA/outside NTZ)
SAR03 (Merkland Point, outside MPA boundary)
SAR04 (HIN04, Holy Isle north, inside MPA/NTZ)
SAR05 (PL34, Pladda West, inside MPA/outside NTZ)
SAR06 (LBN, Lamlash Bay north, inside MPA/NTZ)
SAR07 (WBZ, Whiting Bay seagrass bed, inside MPA/outside NTZ)
The boundary of the South Arran Marine Protected Area (MPA) is shown as a blue boundary. Fishing order areas are represented by shaded polygons: solid light blue shading denotes ‘fishing prohibited’ i.e. NTZ; solid light grey denotes ‘trawling and dredging prohibited’; solid pale pink denotes ‘trawling and dredging prohibited and fishing restricted’; and cross-hatched pink denotes ‘trawling restricted and dredging prohibited’.
At the time of the designation of the MPA in 2014 the maerl beds within the area were considered to be in poor condition (Mercer et al., 2018), one objective of the designation being to recover the beds to good status. A less extensive survey of some of the sites was undertaken in 2015 when survey pins were installed at each site. The results of the 2015 survey remain unpublished but have been used to inform differences between the 2014 and 2023 surveys. Sediment samples collected during the 2015 survey were analysed in detail and reported by Allen (2017).
Six of the seven 2023 survey locations were on maerl rich sediments grading from beds of live maerl to areas with variable amounts of dead maerl gravel. The priority marine feature (PMF) review for maerl beds carried out in 2018 defined a maerl bed as having at least 20 % cover of dead or live maerl thalli forming a complex 3D structure covering a minimum area of 5 m x 5 m (Marine Scotland, 2018). Areas of seabed with broken maerl gravel may also be considered maerl beds, albeit degraded ones, where there is at least 5 % cover of live maerl material > 1 cm in size (Marine Scotland, 2018). Given this definition, only the sites at Pladda West (SAR05) and Lamlash Bay North (SAR06) can currently be considered to be maerl beds.
Marine Ecological Solutions Ltd provided scientific divers with extensive experience of surveying maerl habitats to assist in the 2023 field survey programme. This report aims, where possible, to compare the 2023 data with that collected in 2014 and make recommendations for future sampling and data analysis methods.
2. Methods
The survey, conducted from the vessel RV COAST Explorer, was carried out between 27 and 31 August 2023 at seven locations (Figure 1), six within the South Arran NC MPA and one outside the MPA off Merkland Point north of Brodick. This site was selected as a control for a Before-After Control-Impact (BACI) study around Arran. Site details are provided in Table 1.
Site Name | Site Code | Site Code 2014 | Management regime | Date | Latitude WGS84 | Longitude WGS84 | Depth m below CD |
|---|---|---|---|---|---|---|---|
| Holy Isle South | SAR01 | HI22 | No mobile gear | 27/08/2023 | 55.51069 | -5.06223 | 9.0 |
| Holy Isle North | SAR02 | HIN02 | No mobile gear | 27/08/2023 | 55.53564 | -5.07231 | 9.0 |
| Merkland Point | SAR03 | - | Outside NC MPA | 28/08/2023 | 55.6159 | 5.12654 | 10.0 |
| Holy Isle North | SAR04 | HIN04 | NTZ | 29/08/2023 | 55.53867 | -5.07758 | 7.0 |
| Pladda West | SAR05 | PL34 | No mobile or passive gear | 30/08/2023 | 55.43619 | -5.12503 | 8.5 |
| Lamlash Bay North | SAR06 | LBN | NTZ | 31/08/2023 | 55.54604 | -5.08872 | 11.6 |
| Whiting Bay seagrass | SAR07 | WBZ | No mobile or passive gear | 31/08/2023 | 55.49753 | -5.08788 | 4.2 |
In 2023 a diver laid a 25 m transect at each survey site with the start and end points marked with steel pins that have been left in situ. An effort was made at each site to find the marker pins installed in 2014, but this was only successful at one location (Holy Island South, SAR01). Divers collected a variety of samples and data along the transect at each survey location: still images of quadrats, transect video, in situ notes and sediment cores. Finally, a Marine Nature Conservation Review (MNCR) Phase II survey with associated images was undertaken with additional in situ notes made on seabed sediment type and algal cover.
2.1 Quadrat imagery 2023
Twenty 50 cm by 50 cm (0.25 m2) quadrat images were taken at pre-selected random distances along each transect within 2 m either side of the tape.
Images of the 0.25 m2 quadrats were collected at sites SAR01, SAR02 and SAR03 using a frame mounted Nikon D300 digital camera with an APS-C image sensor fitted with a Tokina 10-17 mm fisheye zoom lens set at 10 mm (35 mm sensor equivalent: 15 mm) mounted on a fixed frame. Image sizes were about seven megapixels. The camera flooded on one deployment hence there are no images available for SAR04 (Holy Island North). Images for sites SAR05, SAR06 and SAR07 were collected using a hand-held Sony ILCE-1 camera with a full frame sensor fitted with a Sony FE 28-60 mm lens with zoom settings of 28-32 mm. This setup produced images of 12-18 megapixels. Lighting was provided by high quality Keldan daylight spectrum video lights.
2.2 Quadrat imagery 2014
Divers placed 0.25 m2 quadrats at pre-selected random distances along the 25 m transect and recorded percentage cover of live and dead maerl in situ. These quadrats were also photographed. Photographs were taken using ambient light, the resulting images being of low resolution (generally less than 1 megapixels) and poorly colour balanced. Ten images were available from each site.
2.3 Video transect 2023
Video footage of each transect was collected using a hand-held Sony ILCE-1 camera with a full frame sensor and a Sony FE 28-60 mm lens. Lighting was provided by two high power Keldan LED torches. The diver swam tight zigzags along the transect covering approximately 2 m either side of the 25 m tape.
Drop-down video tows were collected at multiple locations within the NTZ in Lamlash Bay near the known maerl bed to obtain information on the bed extent. This imagery has not been further analysed for this report.
2.4 Sediment assessment 2023
Sediment type, water depth, percentage of live and dead maerl and algal cover were assessed independently by a diver at 5 m intervals along the tape.
Sediment cores to be analysed for infauna, particle size distribution and total organic content were collected at six sites. Cores were 10 cm in diameter and driven to a minimum depth of 20 cm. Cores were securely capped before being extracted from the sediment and recovered. It was not possible to collect cores at Pladda (SAR05) where maerl-rich sediment overlies hard substrate forming a relatively thin, mobile sediment veneer. In 2014, the sediment at the Pladda site was described as ‘coarse sediments, dominated by pebbles, gravel and very coarse sand’ (Mercer et al., 2018), and this may be explained by the fact that transects were placed in close proximity (start locations within ~21 m of each other) but not in the exact same location in both years. Final data from the analysis of these cores were not available at the time of writing this report (Purdue et al., 2025). but some information is referenced in this report.
2.5 MNCR phase II survey 2023
A Marine Nature Conservation Review (MNCR) Phase II survey pro forma (Hiscock, 1996) was completed for each site. Two divers surveyed a 2 m wide swath each side of the survey tape, down one side and back the other taking notes on the biota and sediment, supplementing this with extensive use of macro photography. Cameras used were a full frame Canon EOS 5D Mark IV with 50 mm macro lens and flash producing images of about 30 megapixels; and a Canon EOS 60D with an APS-C image sensor, 60 mm macro lens and flash producing images of about 20 megapixels. Images collected were later scrutinised for additional taxa not listed in the field. Small numbers of samples of the algal mat were collected from each site where it was present to determine the taxonomic composition of these algal accumulations by microscopic examination of fresh material.
Taxon abundance was assessed using the MNCR abundance scale (SACFOR) (Annex 1). Obtaining MNCR data contributes to the overall understanding of the physical and biological communities at each site and allows a more comprehensive species list to be compiled. It also includes taxa which do not fall within the more limited area covered by the photo quadrats. Live and dead maerl abundance was recorded as % cover values during the Phase II surveys. Where live maerl was ‘present’ in only extremely low quantities it was recorded at values such as 0.1 % or 0.5 % based on the surveyor’s best judgement; this was done to help quantify and illustrate the very low abundances present. Whilst these estimated values were sometimes very precise, they may not be as accurate as those generated from the quadrat data where the analyst was aided by the defined bounds of the quadrat.
Taxonomic nomenclature follows that provided by The UK Marine Environmental Data and Information Network (2024). Marine Species of the British Isles and Adjacent Seas (MSBIAS): a checklist of species derived from the UNICORN and Marine Recorder applications. Accessed: February 2024.
2.6 Image analysis
Still and video imagery was analysed for both 2014 and 2023 by one of the divers who had undertaken the MNCR survey in 2023 and hence was familiar with the biota at the sites.
Imagery was judged for quality and a taxon list compiled for each photograph/video. Sediment composition was also assessed in the same images by the same person. Video suitability for the analysis of biota and sediment composition was problematic for both surveys. In general, in 2014 the video transect was erratic, poorly orientated and often too fast to allow an accurate evaluation of the transect. In 2023 it was intended to use the video imagery to construct 3D photogrammetry of each transect hence the imagery was not ideal for detailed analysis of the biota and sediment composition, the camera being too high above the seabed which was, as a consequence, poorly illuminated.
Stills imagery was variable in quality and in particular 2014 images were poorly colour balanced and of low resolution. The use of low shutter speeds in both years in some instances produced blurry images. The impacts of these quality issues on data analysis and interpretation are addressed where relevant in conjunction with the results later in this report.
2.7 Data analysis
Data analysis was undertaken using Excel, Minitab® and PRIMERTM. Both univariate and multivariate analytical methods were used to determine if there were any ecological changes occurring in the communities being monitored. In the case of univariate statistics where data were normally distributed, T-tests or ANOVA were carried out. Where not normally distributed, non-parametric Kruskal-Wallis tests were used. Further details of the statistical methods used are provided in Annex 2. In short, multivariate data from each site were subjected to separate SIMPROF, ANOSIM, SIMPER and BEST analyses to determine whether there were any significant differences in the data between 2014 and 2023.
SIMPROF tests the null hypothesis that a set of samples, which are not a priori divided into groups, do not differ from each other in multivariate structure.
ANOSIM is an analysis of a similarity matrix approximately analogous to univariate 1- and 2-way analysis of variance (ANOVA). It cannot be used to test for differences between groups already generated by a cluster analysis or other methods.
SIMPER can be used to investigate the nature of differences between groups of samples once these differences have been shown to exist. It looks at the contribution of individual taxa to the separation between groups.
BEST is a procedure used to investigate the best match between multivariate patterns demonstrated for a community and environmental variables associated with those samples.
Taxon abundance data recorded as SACFOR values were converted for multivariate analysis as described by Strong & Johnson (2020).
3. Results
3.1 Maerl habitats
3.1.1 Physical characteristics
Sediments at four of the seven sites surveyed in 2023 were dominated by dead maerl gravel (particle size 4 mm – 16 mm) or largely maerl and shell-derived sand (< 4 mm) and had less than 1 % live maerl. Three of these sites (SAR01, SAR02, SAR04) were within the MPA while the fourth site (SAR03) was located outside the MPA. The sites represented part of the ‘kelp and seaweed communities on sublittoral sediment’ protected feature designated for the South Arran MPA and all occurred within vicinity of previous point records for this feature. Whilst sediments at these sites comprised largely dead maerl gravel, the habitats were not classified as the PMF ‘Maerl or coarse shell gravel with burrowing sea cucumbers’; sea cucumbers (Neopendactyla mixta) were only recorded at SAR05 as ‘rare’ and the epifauna recorded was matched to the kelp and seaweed communities on sublittoral sediment feature. The other two maerl sites had dense growths of live maerl: Pladda (SAR05) with Phymatolithon calcareum and Lamlash Bay North (SAR06) with Lithothamnion glaciale, as identified in situ based on colour and morphology. Specimens were collected for genetic analysis to confirm the maerl species present, but analysis was still ongoing at the time of writing of this report.
Dead maerl gravel was present in greatest quantities at SAR01, SAR02 and SAR04 providing ~50-60 % cover on average according to the quadrat data and ~80 % based on the Phase II assessment; live maerl at these sites and at SAR03 comprised <1 %. At SAR05 the mean cover of dead maerl was ~22-30 % based on the quadrat and Phase II data, respectively whilst live maerl was ~18-25 % respectively. This is in good agreement with the results from Purdue et al (2025) with sediments ranging from coarse/very coarse sand to very fine gravel as the dominant fractions.
The highest percent cover of live maerl was recorded at SAR06 in Lamlash Bay with an average of 52 % cover recorded from the quadrats and an assessment of 80 % cover from the Phase II survey. This was confirmed by measurement of live maerl fragments from core samples (Purdue et al., 2025). Dead maerl at SAR06 contributed 0-7 % from the Phase II and quadrat data, respectively. This site also had the highest mud fraction recorded at 12 % in the quadrats and the highest non-maerl algal cover of over 35 % comprised largely of a range of filamentous species covering and binding together the maerl fragments. Other sites had non-maerl algal cover (excluding kelp) ranging from 2 % to over 20 %.
Annex 3 presents the site survey details and physical characteristics for the six maerl survey locations based on the analysis of photo quadrats. The sediment composition within the quadrats at each site (based on quadrat image analysis) is summarised in Figure 9, which shows the mean percentage cover for each substratum type together with the standard deviation compared to data collected in 2014 - no quadrat data are available for site SAR04 from 2023 due to camera flooding.
In general, the quadrat substrate data were comparable to records from the same sites in 2014, which were characterised into three distinct sediment categories (Mercer et al., 2018). The same categories as described from the 2014 survey remained applicable to the 2023 data and are used in section 3.1.3 to describe the sediments and biotopes at the sites surveyed in 2023.
3.1.2 Community composition
The Phase II survey produced records of 181 taxa within the six maerl and maerl gravel sites surveyed; this compared well with the 186 taxa reported across five sites in 2014 (Mercer et al., 2018). The full set of Phase II data is shown in Annex 4.
Table 2 displays the abundance values of the characterising taxa recorded at each site which were recorded using the SACFOR scale from super-abundant (S) to frequent (F), with the exception of maerl species and taxa for site SAR05 (Pladda) where taxa recorded as occasional (O) are also presented, owing to the low number of taxa with abundances of Frequent or higher.
SAR01 - Holy Island South | - | SAR02 - Holy Island North | - | SAR04 - Holy Island North | - |
|---|---|---|---|---|---|
| Lithothamnion glaciale# | R | Lithothamnion glaciale# | R | Lithothamnion glaciale# | R |
| Ascidiella aspersa | A | Ascidiella aspersa | A | Ascidiella aspersa | A |
| Saccharina latissima$ | C | Marthasterias glacialis | C | Saccharina latissima$ | A |
| Synarachnactis lloydii | C | Saccharina latissima$ | C | Dasysiphonia japonica$ | C |
| Chaetopterus tubes | C | Bonnemaisonia hamifera$ | F | Plocamium lyngbyanum$ | C |
| Solenoidea | C | Calliblepharis jubata$ | F | Rhodomela confervoides$ | C |
| Marthasterias glacialis | C | Dasysiphonia japonica$ | F | Rhodophyllis divaricata$ | C |
| Dasysiphonia japonica$ | F | Rhodophyllis divaricata$ | F | Synarachnactis lloydii | C |
| Rhodophyllis divaricata$ | F | Synarachnactis lloydii | F | Solenoidea | C |
| Desmarestia ligulata$ | F | Chaetopterus tubes | F | Marthasterias glacialis | C |
| Spirobranchus | F | Spirorbinae | F | Pomatoschistus pictus | C |
| Spirorbinae | F | Ostracoda | F | Ostracoda | C |
| Terebellidae | F | Solenoidea | F | Bonnemaisonia hamifera$ | F |
| Liocarcinus corrugatus | F | Pomatoschistus flavescens | F | Calliblepharis jubata$ | F |
| Phoronis | F | Pomatoschistus pictus | F | Cryptopleura ramosa$ | F |
| Pomatoschistus pictus | F | No. of taxa = 101 | - | Chaetopterus tubes | F |
| No. of taxa = 105 | - | - | - | Terebellidae | F |
| - | - | - | - | Necora puber | F |
| - | - | - | - | Amphipholis squamata | F |
| - | - | - | - | No. of taxa = 92 | - |
SAR03 - Merkland Point | - | SAR05 - Pladda | - | SAR06 - Lamlash Bay North | - |
|---|---|---|---|---|---|
| Lithothamnion glaciale# | R | Phymatolithon calcareum# | C | Lithothamnion glaciale# | S |
| Ascidiella aspersa | A | Pomatoschistus pictus | C | Ascidiella aspersa | A |
| Saccharina latissima$ | A | Callionymus lyra | F | Bonnemaisonia hamifera$ | C |
| Synarachnactis lloydii | C | Synarachnactis lloydii | O | Saccharina latissima$ | C |
| Pomatoschistus pictus | C | Solenoidea | O | Chaetopterus tubes | C |
| Bonnemaisonia hamifera$ | F | No. of taxa = 47 | - | Inachus dorsettensis | C |
| Dasysiphonia japonica$ | F | - | - | Heterosiphonia plumosa$ | F |
| Rhodophyllis divaricata$ | F | - | - | Rhodophyllis divaricata$ | F |
| Rhodothamniella floridula$ | F | - | - | Terebellidae | F |
| Chaetopterus tubes | F | - | - | Galathea intermedia | F |
| Spirobranchus | F | - | - | Marthasterias glacialis | F |
| Spirorbinae | F | - | - | No. of taxa = 86 | - |
| Necora puber | F | - | - | - | - |
| Solenoidea | F | - | - | - | - |
| Celleporella hyalina | F | - | - | - | - |
| Marthasterias glacialis | F | - | - | - | - |
| No. of taxa = 83 | - | - | - | - | - |
A cluster analysis with SIMPROF was performed in PRIMERTM to determine the similarity between the communities surveyed at each site (Figure 2). The community data for sites SAR01, SAR02 and SAR03 were significantly similar, as indicated by the SIMPROF test (red branches in Figure 2), site SAR04 being the next most similar to those three sites (all Category 2 below). These four sites all had a very low percentage of live maerl (<1 %), assumed to be Lithothamnion glaciale, awaiting genetic analysis, whilst the characterising algae at each site included Dasysiphonia japonica, Rhodophyllis divaricata and the Trailliella phase of Bonnemaisonia hamifera either at Frequent or Common abundance (Table 2). B. hamifera was also recorded in core samples from sites SAR01, SAR02 and SAR03 (Purdue et al., 2025). At SAR03, outside the MPA, the red alga Rhodothamniella floridula, also known as ‘sand binder weed’, was Frequent and is likely reflective of the higher sand fraction recorded at this site, coarse and fine sand totalled ~50% in the MNCR data (Figure 9). This is consistent with PSA analysis (Purdue et al., 2025), which showed this site to have the highest proportion of sand. The tunicate Ascidiella aspersa was also Abundant at each of these four sites.
Sites SAR05 (Pladda) and SAR06 (Lamlash Bay North) both had higher abundances of live maerl compared to the other sites with Phymatolithon calcareum (C) and Lithothamnion glaciale (S), respectively (Table 2). Characterising red algae at SAR06 included Heterosiphonia plumosa (F), Rhodophyllis divaricata (F) and Bonnemaisonia hamifera (C) whilst Ascidiella aspersa was again Abundant. At SAR05, a high energy, exposed site with mobile sediment, 47 taxa were recorded, which was lower than the 83 – 105 recorded from the other maerl habitats.
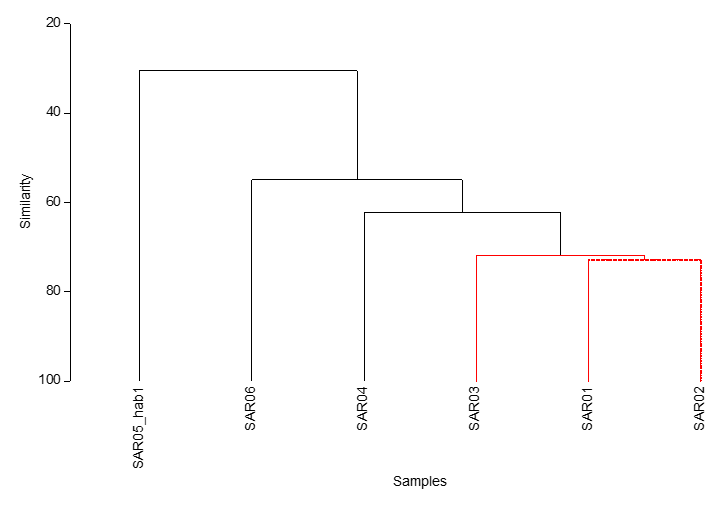
Figure 2. Cluster analysis with SIMPROF of Phase II survey data of maerl bed habitats surveyed around South Arran in 2023. Red = significantly similar.
Click for a full description
Cluster dendrogram showing the similarity relationship between each maerl bed site surveyed using MNCR Phase II methodology. SIMPROF analysis generates red lines between samples to indicate significant similarities between samples. Stations SAR01, SAR02 and SAR03 are grouped together.
SAR05_hab2 recorded during the Phase II survey was excluded from the analysis because it did not represent a maerl habitat (bedrock and boulders).
3.1.3 Biotope descriptions
The physical characteristics and community composition at each of the maerl sites was used to assign biotopes. These were split up into the same three categories as those used in 2014:
Category 1
Pladda, SAR05.
Biotope: Phymatolithon calcareum maerl beds with red seaweeds in shallow infralittoral clean gravel or coarse sand SS.SMp.Mrl.Pcal: Figure 3.
This tide swept site had sediment waves of mixed live maerl gravel (in troughs) grading to dead maerl gravel and medium mineral sand on the crests of the sediment waves. Burrowing bivalves, mostly Solenoidea, were occasional in the sediment together with occasional burrowing anemones (Synarachnactis lloydii). Red algae including Scinaia interrupta were sparse across the site. Large fronds of the kelp Saccharina latissima extended over the site, recorded at an average of 25 % cover in quadrats. Digging in the sediment revealed healthy live maerl medallions at least 10 cm below the sediment surface. The maerl rich sediment overlies hard substrate forming a relatively thin, mobile sediment veneer. Live nodules of Phymatolithon calcareum maerl were recorded at 18-25 % cover from quadrats and Phase II data, respectively, with empty shells recorded at 4-15 % from quadrats and Phase II data, respectively.
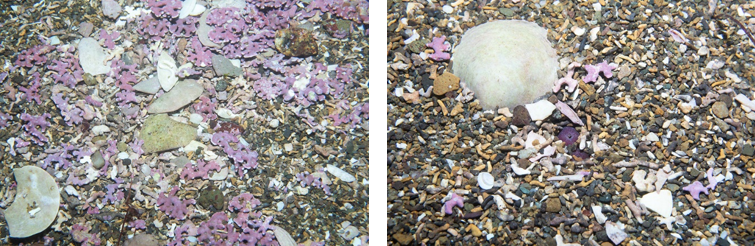
Figure 3. Left: typical live medallions of Phymatolithon calcareum. Right: maerl rich gravel and sand and broken shell. Pladda, SAR05.
Click for a full description
Left: typical live medallions of Phymatolithon calcareum. Right: maerl rich gravel and sand and broken shell. Pladda, SAR05. Images represent typical substrate found at site SAR05 off Pladda within South Arran MPA. Not pictured is an area of bedrock and boulders recorded as habitat 2 at this site during Phase II survey.
Surveyors on the Phase II survey encountered an area of bedrock and boulders along the transect which was recorded as a different biotope: “Saccharina latissima and/or Saccorhiza polyschides on exposed infralittoral rock” (IR.HIR.KSed.SlatSac). The hard substrate provided attachment points for brown algae, notably S. latissima and Desmarestia aculeata, with mixed red seaweeds beneath the canopy provided by the larger algae. This habitat will be strongly scoured by the surrounding sediment of gravel and sand and is likely to be intermittently buried beneath the mobile sediments.
Category 2
Holy Isle South, SAR01 and Holy Isle North, SAR02.
Biotope: Saccharina latissima and robust red algae on infralittoral gravel and pebbles SS.SMp.KSwSS.SlatR.Gv.
These two sites had a level seabed of slightly rippled dead maerl gravel with dead shell (mostly Dosinia sp), the whole consolidated by a complex mix of predominately red algal species notably around clumps of solitary ascidians (largely Ascidiella aspersa). The main algal components were Plocamium lyngbyanum, Rhodophyllis divaricata and the non-native Dasysiphonia japonica. The Trailliella intricata phase of Bonnemaisonia hamifera, another non-native species, was only a small component of the mix. Scattered large fronds of the sugar kelp Saccharina latissima and tubes of the polychaete worm Chaetopterus were further important components of the habitat. There were signs of bioturbation, at least some due to predation by Marthasterias glacialis on buried bivalves.
Merkland Point, SAR03 and Holy Isle North, SAR04.
Biotope: Saccharina latissima and filamentous red algae on infralittoral sand SS.SMp.KSwSS.SlatR.Sa.
The first 10 m of the transect at SAR03 comprised largely medium shell and dead maerl sand with scattered pebbles with the fauna dominated by the tunicate Ascidiella aspersa. Sediment particles were bound together by a variety of foliose and filamentous red algae, predominantly Rhodothamnionella floridula (sand binder weed). As the transect sloped into deeper water (10 m BCD) the sediment became coarser with a higher proportion of dead maerl sand and gravel. Clumps of A. aspersa still visually dominated the fauna with mixed binding red algae consolidating the sediment.
At SAR04, the level seabed was comprised of dead maerl and shell gravel, well bioturbated with 75 % cover of a mixed red algal mat dominated by Rhodophyllis divaricata, Plocamium lyngbyanum, Rhodomela confervoides and the non-native Dasysiphonia japonica. Sugar kelp, (Saccharina latissima) covered about 35 % of the seabed over and above the algal mat and sediment. Fauna tubes of the polychaete Chaetopterus were common and the burrowing anemone Synarachnactis lloydii abundant. Large starfish (Marthasterias glacialis and Luidia ciliaris) were common, being large predators on buried bivalves. Numerous clumps of the tunicate Ascidiella aspersa helped to consolidate in the algal mat.
These four sites all had high proportions of dead maerl gravel which varied from 30 – 60 % on average in the quadrats to 80 % in the Phase II data, although dead maerl gravel comprised only 15 % at SAR03 outside the MPA. Live maerl, recorded as less than 1 % at all four sites was predominantly Lithothamnion glaciale, while P. calcareum was also present at SAR03. All sites contained a stone gravel fraction between 2-25 % and a sand fraction which varied widely between sites and survey techniques at 5-34 %. Detailed PSA data from core samples collected at these sites are reported in Purdue et al. (2025). Figure 4 to Figure 7 illustrate the sediment types present at each site.
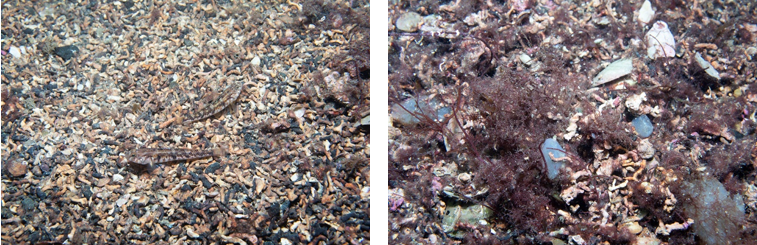
Figure 4. Left: dead maerl coarse sand. Right: dead maerl gravel and small tunicates bound together by filamentous red algae. Holy Isle South, SAR01.
Click for a full description
Left: dead maerl coarse sand. Right: dead maerl gravel and small tunicates bound together by filamentous red algae. Holy Isle South, SAR01. Images represent typical substrate found at site SAR01 off the south of Holy Isle within South Arran MPA and were taken during Phase II survey.
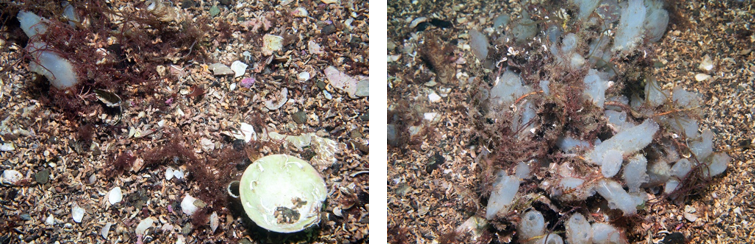
Figure 5. Left: dead maerl gravel and shell with binding filamentous red algae. Right: clump of tunicates (Ascidiella aspersa) with binding red algae and dead maerl gravel. Holy Island North, SAR02.
Click for a full description
Left: dead maerl gravel and shell with binding filamentous red algae. Right: clump of tunicates (Ascidiella aspersa) with binding red algae and dead maerl gravel. Holy Island North, SAR02. Images represent typical substrate found at site SAR02 off the north of Holy Isle within South Arran MPA and were taken during Phase II survey.
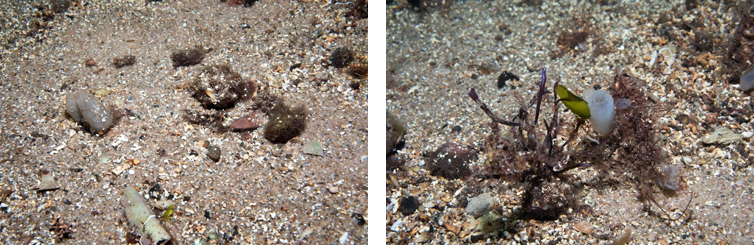
Figure 6. Left: Medium sand and scattered dead shell. Right: medium sand, dead maerl gravel and red algae. Merkland Point, SAR03.
Click for a full description
Left: Medium sand and scattered dead shell. Right: medium sand, dead maerl gravel and red algae. Merkland Point, SAR03. Images represent typical substrate found at site SAR03 off Merkland Point, which is found to the north of the South Arran MPA and were taken during Phase II survey.
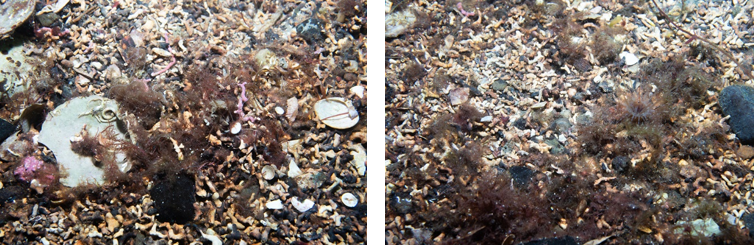
Figure 7. Left: dead maerl gravel and shell. Note small fragments of live maerl. Right: dead maerl gravel, burrowing anemone and binding red algae. Holy Isle North, SAR04.
Click for a full description
Left: dead maerl gravel and shell. Note small fragments of live maerl. Right: dead maerl gravel, burrowing anemone and binding red algae. Holy Isle North, SAR04. Images represent typical substrate found at site SAR04 off the north of Holy Isle within South Arran MPA and were taken during Phase II survey.
Category 3
Lamlash Bay North, SAR06.
Biotope: Lithothamnion glaciale maerl beds in tide-swept variable salinity infralittoral gravel SS.SMp.Mrl.Lgla: Figure 8.
The seabed at this site within the NTZ sloped gently into the channel between Arran and Holy Isle with depths ranging from 8.5 m to 12.0 m BCD. The seabed cover was ~50 % to 80 % live maerl (L. glaciale) based on the average quadrat and Phase II data, respectively, overlying muddy sediment. The maerl nodules were bound together by mixed red algae and supported a mat of fine red filamentous algae over much of their surface. Large fronds of Saccharina latissima were attached to clumps of maerl. Clumps of the tunicate Ascidiella aspersa and large starfish (Marthasterias glacialis and Luidia ciliaris) were prominent.
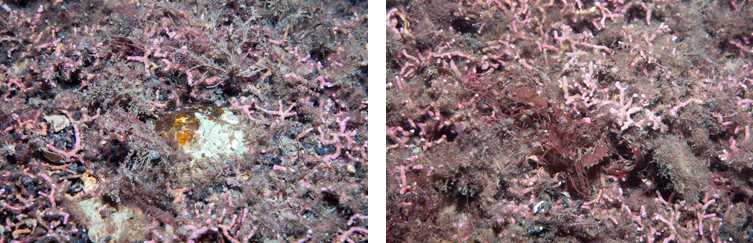
Figure 8. Left: dead shell and live maerl (Lithothamnion glaciale) overgrown by filamentous red algae. Right: Live maerl and entangling foliose algae. Lamlash Bay North, SAR06.
Click for a full description
Left: dead shell and live maerl (Lithothamnion glaciale) overgrown by filamentous red algae. Right: Live maerl and entangling foliose algae. Lamlash Bay North, SAR06. Images represent typical substrate found at site SAR06 in the Lamlash Bay No Take Zone within South Arran MPA and were taken during Phase II survey.
Dead maerl gravel was low at ~ 7 % and 0 %; quadrat and Phase II data, respectively. The site had the highest percentage of empty shells compared with the other sites recorded at 15 % and 25 % from the Phase II and quadrat data, respectively, and the site had a higher mud fraction than the other maerl sites (~ 11 %).
Note that it has been assumed that the dominant maerl species at this site in 2023 was L. glaciale as demonstrated in 2014 by Mercer et al. (2018).
3.1.4 Comparison with 2014 data
3.1.4.1 Sediment and algae including maerl
In 2014, live and dead maerl assessments were made by survey divers in situ in 20 quadrats along a 25 m transect; no other substrate assessment was made but images were taken of the quadrats. From each survey station, nine or ten quadrat images were available for post-survey assessment of the percentage cover of substrate types including live and dead maerl. The data from the image analysis are summarised in Figure 9 for comparison with data from the same sites in 2023. They display similar patterns of sediment composition between the two years e.g. at SAR05 and SAR06, where live maerl was in highest abundance. However, at SAR01 and SAR02 the proportion of dead maerl was lower in 2014, with a higher coarse sand fraction.
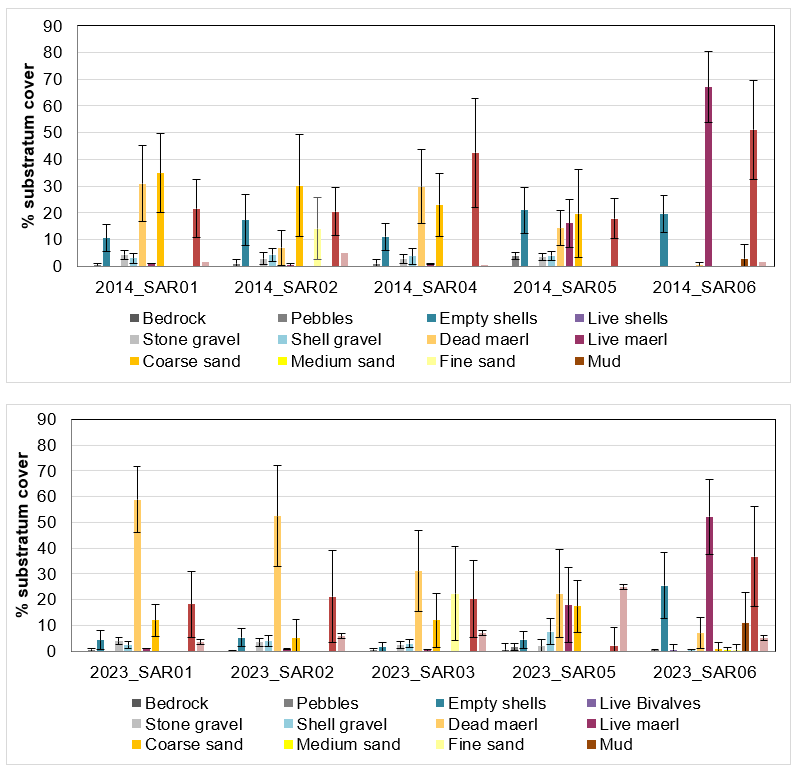
Figure 9. Substratum cover at each maerl survey site in 2014 (top) and 2023 (bottom) based on photographic quadrat assessments (n = 9-20 per site, data show mean cover per category ±stdev).
Click for a full description
Substratum cover at each maerl survey site in 2014 (top) and 2023 (bottom) based on photographic quadrat assessments (n = 9-20 per site, data show mean cover per category ±stdev). Sediments are dominated by coarse sand and dead maerl gravel (orange), live maerl (purple) and other algae (red). Note site SAR03 was a new site in 2023 and so no data available for 2014. No data were available for site SAR04 in 2023 due to the camera flooding.
The mean percentage cover per quadrat of live and dead maerl (±stdev) at each site as assessed in situ in 2014 or by image analysis of quadrat photographs post-survey in 2014 and 2023 is shown in Figure 10. Owing to the different methodologies, it is not appropriate to draw conclusions between any differences between data collected in situ with that generated by image analysis. In general, the in situ data from each site exhibit similarities with that from image analysis but differences are inevitable given the data were recorded by different people with different viewpoints and perspectives of the substrates.
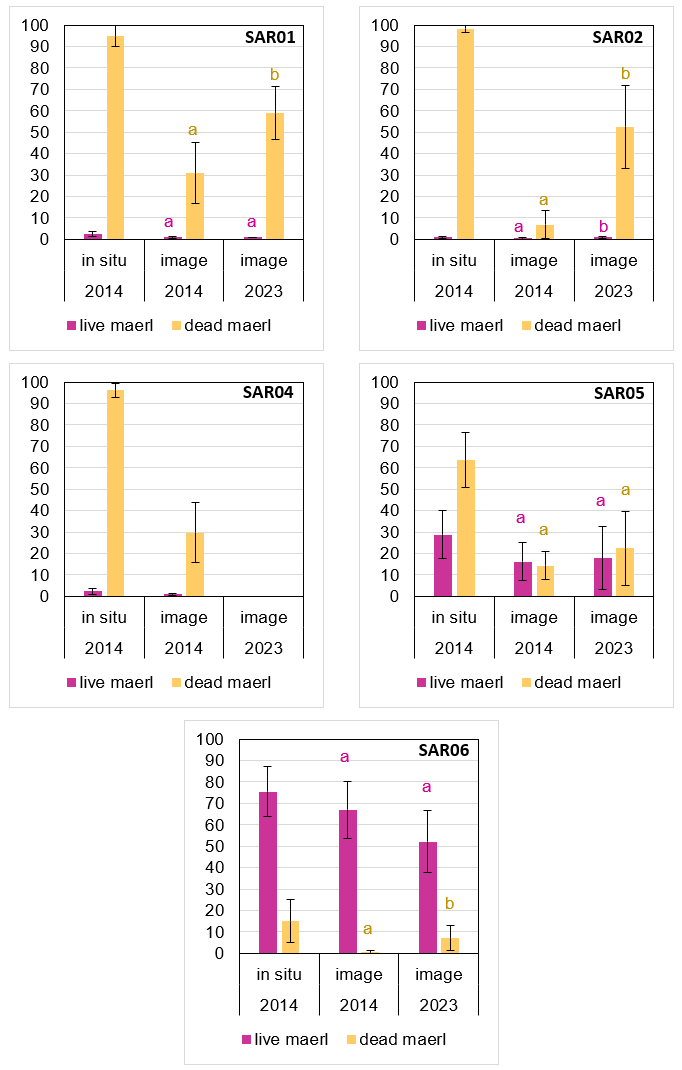
Figure 10. Mean percentage cover per quadrat of live and dead maerl (± stdev) at all sites in 2014 and 2023 as assessed in situ or by image analysis. Different letters indicate significant differences from image analysis data for live or dead maerl.
Click for a full description
Mean percentage cover per quadrat of live and dead maerl (± stdev) at all survey sites in 2014 and 2023 as assessed in situ or by image analysis. Different letters indicate significant differences in percent cover per quadrat of live and dead maerl based on image analysis data for live or dead maerl.
Sediments at sites SAR01, SAR02 and SAR04 were dominated by dead maerl (yellow) with higher estimates for 2014 in situ assessments. Live maerl (pink) was the main component at SAR06, and image analysis from site SAR05 estimated similar proportions of live and dead maerl for both years. Note site SAR03 was a new site in 2023 and so no data was available for 2014: in 2023, live maerl cover was estimated as 0.2 % and dead maerl gravel ranged from 3 to 66 % between quadrats. No data were available for site SAR04 in 2023 due to the camera flooding.
Holy Isle South, SAR01 (inside MPA)
There was no significant difference in the median percentage cover of live maerl recorded during image analysis between the two survey years (Kruskal-Wallis, H=0.00, df=1, P=1.000) but there was a significant difference in the mean percentage cover of dead maerl between the two survey years (31 % in 2014 vs 60 % in 2023), as assessed by image analysis (T-test, T=-5.26, df=16, P<0.001). There was no significant difference in the total percentage algal (non-maerl) cover at SAR01 between 2014 and 2023 (Kruskal-Wallis, H=0.02, df=1, P=0.893).
The 2023 Phase II data recorded 80 % dead maerl gravel and live maerl as ‘present’ (~0.5%). Divers assessing the percentage of live and dead maerl in situ every 5 m along a 25 m transect in 2023 recorded dead maerl as 95 % and live maerl at SAR01 as 5 % consistently throughout the transect.
Holy Isle North - SAR02 (outside MPA)
There was a significant difference in the median percentage cover of live maerl recorded during image analysis between the two survey years (0% in 2014 vs 1% in 2023) (Kruskal-Wallis, H=8.24, df=1, P=0.004) and for the mean percentage cover of dead maerl between the two survey years (7 % in 2014 vs 53 % in 2023) as assessed by image analysis (T-test, T=-9.43, df=25, P<0.001). There was no significant difference in the total percentage algal (non-maerl) cover at SAR02 between 2014 and 2023 (Kruskal-Wallis, H=1.04, df=1, P=0.307).
The 2023 Phase II data recorded 80 % dead maerl gravel and live maerl as ‘present’ (~0.1%). Divers assessing the percentage of live and dead maerl in situ every 5 m along a 25 m transect in 2023 recorded live maerl at SAR02 as 2-5 % and dead maerl as 95%. Review of in situ macrophotography suggests that in situ recording over-estimated the proportion of live maerl.
Merkland Point - SAR03 (outside MPA)
There were no data for this site from 2014 so no comparisons could be made. The location was selected as a control for a Before-After Control-Impact (BACI) study of fisheries impacts around Arran. Figure 9shows the values obtained for live maerl (0.2 %) and dead maerl gravel (3-66 %) based on quadrat image analysis. Divers assessing the percentage of live and dead maerl in situ every 5 m along a 25 m transect in 2023 recorded live maerl at SAR03 as ‘present’ (~ 0-1 %) and dead maerl as 20-70 %. The 2023 Phase II data again recorded live maerl as ‘present’ (~ 0.1 %) and recorded 15 % dead maerl gravel and 38 % coarse sand.
Holy Isle North - SAR04 (inside NTZ)
There were no data available for 2023 due to the survey camera flooding. As at the other sites, the 2014 in situ data suggested higher percentages of live and dead maerl than the image analysis data.
The 2023 Phase II data recorded 80 % dead maerl and live maerl as ‘present’ (~0.1 %). Divers assessing the percentage of live and dead maerl in situ every 5 m along a 25 m transect in 2023 recorded live maerl at SAR04 as ‘present’ (~ 0-2 %) and dead maerl as 70-90 %.
Pladda - SAR05 (inside MPA)
There was no significant difference in the mean percentage cover of either live maerl (T-test, T=-0.38, df=24, P=0.704) or dead maerl gravel (Kruskal-Wallis, H=0.89, df=1, P=0.346) between the two survey years, as assessed by image analysis. There was no significant difference in the total percentage algal (non-maerl) cover at SAR05 between 2014 and 2023 (Kruskal-Wallis, H=0.53, df=1, P=0.467).
The 2023 Phase II data recorded 30 % dead maerl gravel, 25 % live maerl and 20 % medium sand. Divers assessing the percentage cover of live and dead maerl every 5 m along a 25 m transect in 2023 recorded live maerl at SAR05 as 20-40 % and dead maerl as 60-80 %. There was a distinct sorting of the sediment size fractions making up the sediment waves at this site with live and dead maerl gravel together with dead shell in the troughs and medium sand composed of geogenic particles as well as dead maerl accumulated on the wave crests.
Lamlash Bay North - SAR06 (inside NTZ)
There was no significant difference in the mean percentage cover of live maerl recorded during image analysis between the two survey years (T-test, T=-1.67, df=20, P=0.110) but there was a significant difference in the percentage of dead maerl between the two survey years (Kruskal-Wallis, H=8.92, df=1, P=0.003), as assessed by image analysis (0.4 % vs 7 % mean cover respectively). There was a significant difference in the total percentage algal (non-maerl) cover at SAR06 between 2014 and 2023 (Kruskal-Wallis, H=19.36, df=1, P<0.001) with higher values in 2023.
The 2023 Phase II data recorded 0 % dead maerl and 80 % live maerl. Divers assessing the percentage cover of live and dead maerl every 5 m along a 25 m transect in 2023 recorded live maerl at SAR06 as 50-90 % and dead maerl as 2-7 %.
3.1.4.2 Community composition
Maerl habitat community data were recorded in several ways for the 2014 and 2023 surveys, each providing an alternative set of data pertaining to the biological communities present. These were:
Image analysis of 0.25 m2 quadrat photographs
Image analysis of video footage of 25 m x 4 m transects
In situ Phase II recording along a 4 m wide 25 m transect by experienced dive surveyors.
The following sections provide details of the statistical analyses completed on each of the different community data sets available.
Photo quadrats
At each survey station where quadrats were photographed in both 2014 and 2023, the photographs were analysed post-survey in 2023 by an experienced surveyor who had also completed the in situ Phase II surveys in 2023. In total 148 images were analysed: these covered five of the six maerl sites in both years with data being comparable between four of those sites. In 2023 all images were rated as being of ‘good’ quality for sites SAR01-03 and SAR05 whilst those from SAR06 were rated ‘poor’ to ‘moderate’ on account of slow shutter speeds blurring the images. No images were available from SAR04 in 2023. Of the images from 2014, all were rated either ‘poor’ or ‘very poor’ owing to a combination of either low resolution, image blur, inadequate lighting or oblique camera angles resulting in out of focus areas in the images. No images were available from SAR03 in 2014.
A total of 54 different taxa or taxonomic groups were identified from the images, 37 of which were to either species or genus level. The raw data have been supplied to NatureScot.
An initial MDS plot of the entire dataset for both years suggested (as per the 2023 cluster analysis of Phase II data, Figure 2) that sites SAR05 and SAR06 were dissimilar from sites SAR01-04 (Figure 11). This result would be expected given the higher SACFOR scores of live maerl at these two sites of ‘common’ and ‘superabundant’ determined during the Phase II surveys in 2023, compared to ‘rare’ at sites SAR01-04 (Figure 12). A BIO-ENV analysis indicated no strong correlations between the community data obtained from the image analysis with the substrate data generated during the same image analysis, nor with survey station depth (m BCD). The best correlation indicated between the benthic community data and substrate types was with the live maerl only, with a Spearman rank correlation coefficient of ρ = 0.500; depth did not register as a significant factor influencing the community composition. These results are consistent with the infaunal results (Purdue et al., 2025) with most overlap between the Hoy Isle sites (SAR01, SAR02, SAR04), and SAR06 being more distinct from the maerl gravel sites.
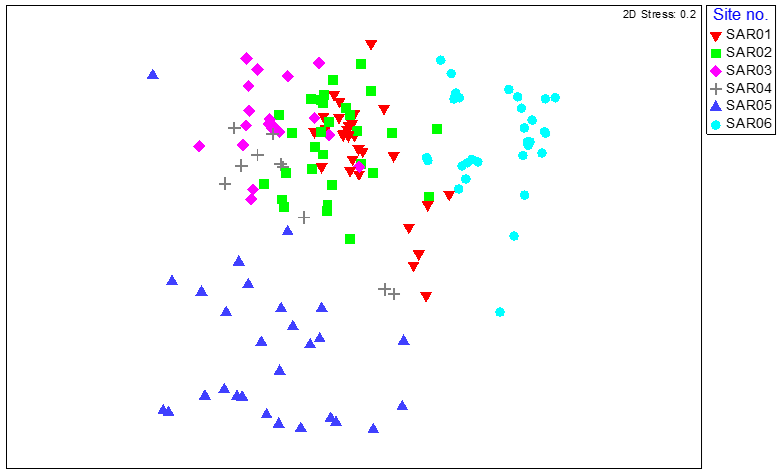
Figure 11. MDS plot of maerl bed community data from quadrat image analysis for six survey stations around South Arran in 2014 and 2023, coded by survey station.
Click for a full description
MDS plot of maerl bed community data from quadrat image analysis for six survey stations around South Arran in 2014 and 2023, coded by survey station. The spread of survey stations shows some degree of similarity between the same survey station in both years. Dead maerl gravel habitats at SAR01, SAR02, SAR03 and SAR04 cluster more closely, with the sites with live maerl SAR05 and SAR06 distinct from these and from each other.
An ANOSIM of the entire data set resulted in a very low R-value, which suggested negligible ecological interannual differences between the two data sets (R=0.062, P=0.032) (Figure 13), even though there were statistically significant differences in some cases (see details in above sections). Quadrat data for each site or distinct group of sites were assessed separately given the known differences in overall community and sediment types (see Figure 2, Figure 9 and Figure 10). On this basis, sites SAR01 and SAR02 were analysed as a single distinct data set, as were site sites SAR05 and SAR06. Sites SAR03 and SAR04 were not included in the subsequent analyses given there were no data for these locations in 2014 and 2023, respectively.
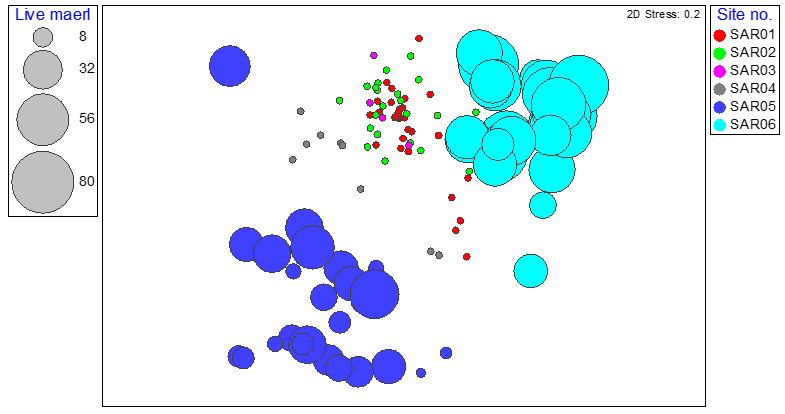
Figure 12. MDS plot of maerl bed community data from quadrat image analysis from six survey stations around South Arran in 2014 and 2023 showing relative proportions of live maerl, coded by survey station.
Click for a full description
Results are consistent with those reported by Purdue et al. (2025).
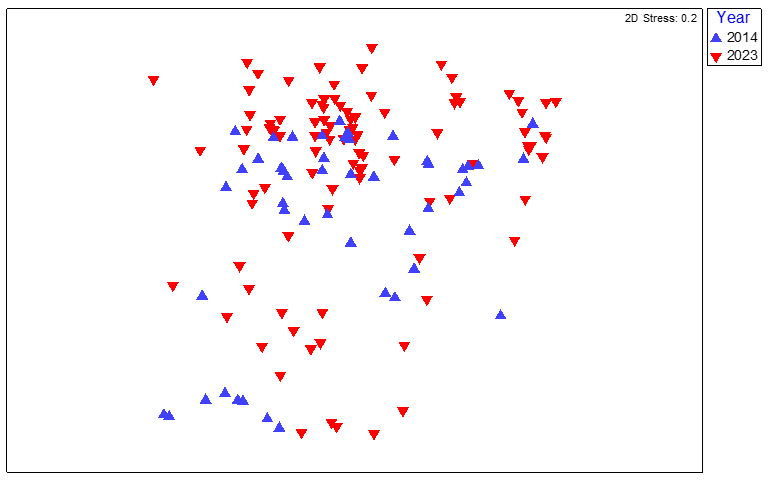
Figure 13. MDS plot of maerl bed community data from quadrat image analysis from six survey stations around South Arran in 2014 and 2023, coded by survey year.
Click for a full description
MDS plot of maerl bed community data from quadrat image analysis from six survey stations around South Arran in 2014 and 2023, coded by survey year. The spread of survey stations suggested negligible inter annual differences between the two datasets.
Holy Isle South - SAR01 and Holy Isle North - SAR02 (inside MPA)
The quadrat image data for these sites showed a strong overlap in similarity between years (Figure 14) with a low ANOSIM R-value indicating very little dissimilarity between the two data sets (ANOSIM, R=0.116, P=0.023). SIMPER analysis indicated the same four taxa contributing most to the top 80 % of sample similarity within both years: Lithothamnion glaciale, Synarachnactis lloydi, Corallinales (crust) and Ascidiella aspersa. The similarity between the years was highlighted by the fact that the same four taxa (plus others) also contributed most to the low sample dissimilarity between the year groups (Table 3).
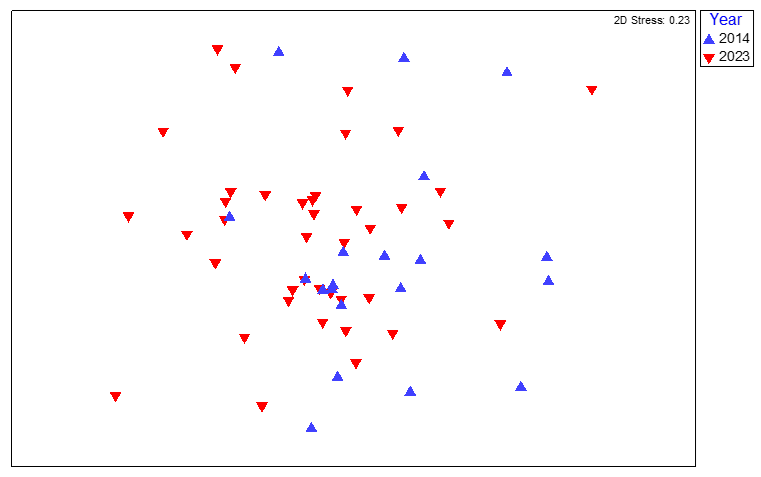
Figure 14. MDS plot of maerl bed community data from quadrat image analysis from survey stations SAR01 (Holy Isle South) and SAR02 (Holy Isle North) around South Arran in 2014 and 2023, coded by survey year.
Click for a full description
MDS plot of maerl bed community data from quadrat image analysis from survey stations SAR01 (Holy Isle South) and SAR02 (Holy Isle North) around South Arran in 2014 and 2023, coded by survey year. The spread of individual quadrat image data for SAR01 and SAR02 for 2014 and 2023 shows a strong overlap in similarity between years.
| Taxon | 2014 average SACFOR abundance | 2023 average SACFOR abundance | Contribution to dissimilarity % | Cumulative contribution to dissimilarity % |
|---|---|---|---|---|
| Ascidiella aspersa | 3.72 | 3.28 | 15.23 | 15.23 |
| Synarachnactis lloydii | 2.92 | 3.48 | 14.8 | 30.03 |
| Spirobranchus | 0.24 | 1.85 | 11.18 | 41.22 |
| Saccharina latissima | 1.61 | 0.64 | 10.66 | 51.88 |
| Phaeophyceae crust | 1.5 | 1.13 | 9.21 | 61.08 |
| Lithothamnion glaciale | 2.1 | 2.7 | 6.4 | 67.48 |
| Chaetopterus tube | 0.43 | 0.91 | 6.18 | 73.66 |
| Membranipora membranacea | 0.27 | 0.7 | 4.87 | 78.53 |
| Scinaia interrupta | 0.4 | 0.23 | 3.1 | 81.63 |
Pladda - SAR05 (inside MPA)
The quadrat image data for this site showed a small degree of dissimilarity between survey years (Figure 15) with a low ANOSIM R-value (ANOSIM, R=0.345, P=0.020). SIMPER analysis indicated that Phymatolithon calcareum was the top contributor to sample similarity within each survey year group but was also one of the top contributors to dissimilarity between years (Table 4). SIMPER searches for and ranks dissimilarity no matter how small it is between samples. P. calcareum was present in high abundance in both years, thereby contributing to similarity of samples within each year, but the difference in abundance between years was strong enough to rank it highly in those taxa contributing to interannual dissimilarity.
Of the taxa contributing most to sample dissimilarity between years, four were absent in 2014; S. latissima and M. membranipora were also not recorded in Phase II surveys but were detected in the video data so it is possible that they were missed by the quadrat placement or that the kelp fronds were moved aside before quadrat assessment. The lack of coralline crusts and G. calcicola in the 2014 data might be attributable to the poor image quality in 2014; only coralline crusts were recorded in the Phase II data from 2014 and neither taxon from the video imagery, which was not of adequate quality to detect these small taxa. Gelidiella calcicola was recorded at this site in 2014 from microscopic examination of maerl samples.
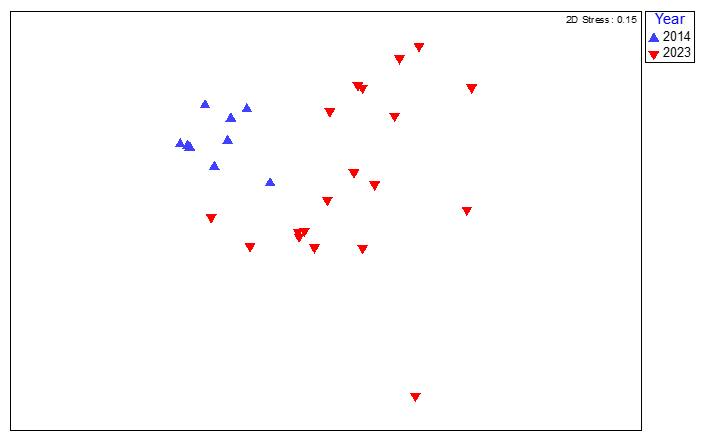
Figure 15. MDS plot of maerl bed community data from quadrat image analysis from survey station SAR05 (Pladda) South Arran in 2014 and 2023, coded by survey year.
Click for a full description
MDS plot of maerl bed community data from quadrat image analysis from survey station SAR05 (Pladda) South Arran in 2014 and 2023, coded by survey year. The spread of individual quadrat image data for SAR05 for 2014 and 2023 shows a small degree of dissimilarity between years.
| Taxon | 2014 average SACFOR abundance | 2023 average SACFOR abundance | Contribution to dissimilarity % | Cumulative contribution to dissimilarity % |
|---|---|---|---|---|
| Ulva (foliose) | 2.67 | 0.21 | 12.98 | 12.98 |
| Membranipora membranacea | 0 | 2.53 | 11.78 | 24.75 |
| Scinaia interrupta | 2.13 | 0.26 | 10.62 | 35.37 |
| Phymatolithon calcareum | 6.33 | 4.79 | 9.74 | 45.11 |
| Saccharina latissima | 0 | 2.07 | 9.73 | 54.84 |
| Synarachnactis lloydii | 0.44 | 1.42 | 8.45 | 63.3 |
| Corallinales crust | 0 | 1.63 | 8.42 | 71.71 |
| Gelidiella calcicola | 0 | 1.26 | 6.32 | 78.03 |
| Laminariaceae | 1.01 | 0 | 5.43 | 83.46 |
Lamlash Bay North - SAR06 (inside NTZ)
The quadrat image data for this site showed a small degree of similarity between years (Figure 16) with a low ANOSIM R-value indicating low dissimilarity between the two data sets (ANOSIM, R=0.187, P=0.031). SIMPER analysis indicated that Lithothamnion glaciale was the top contributor to sample similarity within each survey year group, contributing 86 % to sample similarity in 2023 and 52 % in 2014; it was also one of the top contributors to dissimilarity between survey years (Table 5). Of the taxa contributing most to sample dissimilarity, all were recorded from images in each survey year with variations in the abundances recorded being responsible for the dissimilarities rather than presence / absence. Poor image quality from 2014 may also have been a factor in assessing abundance of various taxa, particularly smaller or more cryptic species.
| Taxon | 2014 average SACFOR abundance | 2023 average SACFOR abundance | Contribution to dissimilarity % | Cumulative contribution to dissimilarity % |
|---|---|---|---|---|
| Corallinales crust | 2.1 | 0.15 | 17.33 | 17.33 |
| Lithothamnion glaciale | 6.8 | 7.8 | 15.27 | 32.6 |
| Saccharina latissima | 1.51 | 0.46 | 14.76 | 47.35 |
| Phaeophyceae crust | 3 | 1.65 | 14.58 | 61.93 |
| Ascidiella aspersa | 0.82 | 1.17 | 11.69 | 73.62 |
| Spirobranchus | 0.08 | 1.3 | 9.57 | 83.2 |
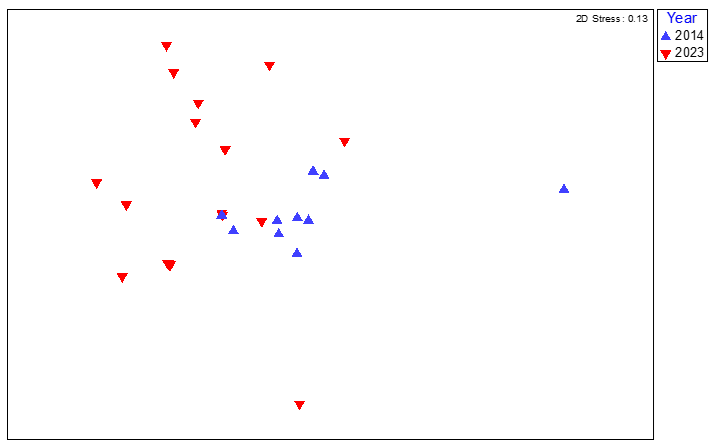
Figure 16. MDS plot of maerl bed community data from quadrat image analysis from survey station SAR06 (Lamlash Bay North) South Arran in 2014 and 2023, coded by survey year.
Click for a full description
MDS plot of maerl bed community data from quadrat image analysis from survey station SAR06 (Lamlash Bay North) South Arran in 2014 and 2023, coded by survey year. The spread of individual quadrat image data for SAR06 for 2014 and 2023 shows a small degree of dissimilarity between years.
Transect video
At each survey station video footage was also recorded along each transect. The videos were all analysed post-survey in 2023 by an experienced surveyor who had also completed the in situ Phase II surveys in 2023. Of the 11 transect videos available, nine were rated as ‘poor’ quality, one as ‘adequate’ (SAR02 in 2014) and one as ‘good’ (SAR05 in 2014) based on the underwater conditions, panning speed and often erratic deployment of the camera along the transect. Despite the general ‘poor’ quality of the videos, 66 different taxa or taxonomic groups were identified from the footage, most to the level of species or genus (raw data in Annex 4).
Multivariate analysis suggested some dissimilarities existed between the data from different years (ANOSIM, R=0.296, P=0.011) but that these were small differences, as indicated by the low R-value. A cluster analysis of the data showed no distinct separation of the samples from each survey year (Figure 17). There were insufficient replicates to determine statistically what role video quality may or may not play in influencing sample similarity.
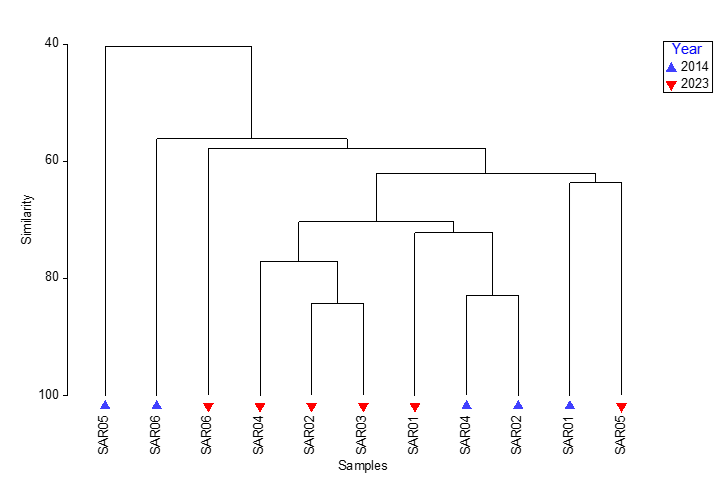
Figure 17. Cluster analysis of community data obtained from analysis of video footage from 25 m transects from maerl bed habitats around South Arran in 2014 and 2023.
Click for a full description
Cluster analysis of community data obtained from analysis of video footage from 25 m transects from maerl bed habitats around South Arran in 2014 and 2023. Cluster analysis of the data showed no distinct separation of the samples from each survey year.
| Taxon | 2014 average SACFOR abundance | 2023 average SACFOR abundance | Contribution to dissimilarity % | Cumulative contribution to dissimilarity % |
|---|---|---|---|---|
| Live maerl | 2.8 | 0 | 7.89 | 7.89 |
| Chaetopterus tube | 1.4 | 3.5 | 6.08 | 13.96 |
| Scinaia interrupta | 2.6 | 2.35 | 6 | 19.97 |
| Synarachnactis lloydii | 3.8 | 2.87 | 5.51 | 25.47 |
| Bivalvia siphons | 1 | 2.5 | 5.25 | 30.72 |
| Porania (Porania) pulvillus | 0.04 | 1.85 | 5.18 | 35.9 |
| Henricia | 0.02 | 1.67 | 4.69 | 40.59 |
| Ascidiella aspersa | 3.6 | 4.33 | 4.6 | 45.19 |
| Phaeophyceae crust | 1.8 | 2 | 4.09 | 49.29 |
| Desmarestia ligulata | 0.02 | 1.33 | 3.94 | 53.23 |
| Liocarcinus depurator | 0.02 | 1.33 | 3.6 | 56.83 |
| Necora puber | 1.02 | 1.18 | 3.59 | 60.42 |
| Ulva (foliose) | 3.02 | 3.17 | 3.36 | 63.79 |
| Membranipora membranacea | 3.22 | 4 | 3.18 | 66.97 |
| Marthasterias glacialis | 2.2 | 2.52 | 3.07 | 70.04 |
A SIMPER analysis showed similar taxa contributed to the sample similarity within each year group across all the sites, namely Saccharina latissima, Synarachnactis lloydi, Ascidiella aspersa, Ulva (foliose) and Marthasterias glacialis. Sample dissimilarity between the years was mainly attributed to differences in abundances of various taxa as opposed to presence or absence between years (Table 6). The exception to this was for live maerl which was not recorded from the videos in 2023 at sites where it occurred at very low densities (< 1 %; SAR01, SAR02 and SAR04) likely due to poor quality of the footage making it difficult to discern from other sediments.
A BIO-ENV analysis indicated no strong correlations between the community data obtained from the video analysis with the substrate data generated during the analysis, nor with survey station depth (m BCD). The best correlations indicated between the community data samples and substrate types were with the small boulder, cobble and pebble fractions in varying combinations, all with a Spearman rank correlation coefficient of ρ = 0.730. Depth did not register as a significant factor influencing the community composition, likely because the depth range across sites was small (7-11.5 m BCD). The video data suggested that pebbles were fairly evenly distributed throughout the sites, but that cobbles and small boulders were most often recorded from SAR01 and SAR05.
Phase II survey
An ANOSIM test of the community data from 2014 and 2023 showed a significant difference between the data from each survey year. A cluster analysis showed the dissimilarities in the data between each year but indicated greater similarity between samples within each year (Figure 18). The SIMPROF analysis indicated similar structure within each year group, with sites SAR01-03 or SAR01-04 being significantly more similar to one another than to SAR05 and SAR06; both of the latter having a significant live maerl fraction, and the result reflecting the characteristic physical categories described previously. The lower dissimilarity of SAR05 in 2023 to all samples can likely be attributed to the lower number of taxa recorded from that site.
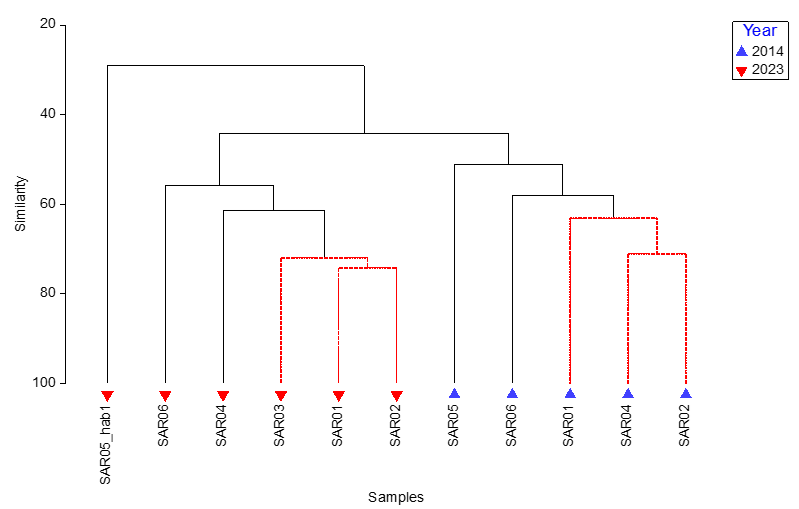
Figure 18. Cluster analysis of Phase II survey data of maerl bed habitats around South Arran in 2014 and 2023. SIMPROF analysis generates red lines between samples to indicate significant similarities between samples.
Click for a full description
Cluster analysis of Phase II survey data of maerl bed habitats around South Arran in 2014 and 2023. SIMPROF analysis generates red lines between samples to indicate significant similarities between samples. Cluster analysis showing dissimilarities in the data between each year. SIMPROF analysis generates red lines between samples to indicate significant similarities showing greater similarity between samples within each year. SAR05_hab2 (bedrock and boulders) recorded during the Phase II survey was excluded from the analysis since it did not comprise a maerl habitat.
Despite the dissimilarities indicated above, the data from 2014 and 2023 suggest few differences in the characterising taxa at each site (see Table 2 above and Table 3 in Mercer et al. (2018)). Therefore, the inter-annual dissimilarities illustrated in Figure 18 could be due to genuine fluctuations in populations of both characterising and / or less abundant taxa or the different surveyors present in each year, as opposed to broad scale changes occurring at each site; without greater temporal resolution to the data it is not reasonable to assume any trends in the data. Furthermore, each diver may have differing levels of taxonomic expertise, which can lead to them recording more or fewer of certain taxonomic groups. This latter point is borne out to some degree in the data whereby although ~180 taxa were recorded across the maerl sites in both 2014 and 2023, each survey recorded ~70 taxa that the other did not which will inevitably cause dissimilarity between samples from different years. For example, the algae Ulva rigida, Plocamium spp., Calliblepharis spp. and Rhodymenia pseudopalmata as well as the tunicate Pyura microcosmos, Phoronids (horseshoe worms), and small Rissoa sp. (snails) were all regularly recorded in 2023 but not 2014, whilst algae such as Polysiphonia stricta, echinoderms such as Asterias rubens and Aequipecten opercularis (queen scallops) were recorded in 2014 but not 2023. Juvenile Pecten maximus (king scallop) were recorded at all sites apart from SAR05 in 2023. At very small sizes (< 5 mm), these two scallops (Pectinidae) could have been confused in the field. Interestingly, analysis of infaunal samples indicated an increase in the number of taxa between 2014 and 2023 at two sites around Holy Isle (SAR01_HI22 and SAR02_HIN02) from 25 and 26 taxa to 43 and 42 taxa, respectively, whilst the number of taxa recorded was more consistent between years at the remaining sites (Purdue et al., 2025).
Further to the above possible reasons for the dissimilarities in the data, the transects were repeated in close proximity to, but not at exactly the same locations in both years (start positions were within ~21 m), and this may have introduced an element of spatial variation into the data which cannot be accounted for when only a single transect is surveyed at each site.
3.2 Seagrass habitats
3.2.1 Physical characteristics
The seabed at the final site, SAR07, at 4 m BCD was composed of medium sand with scattered dead shell and with a subsurface layer of anoxic sediment; there was plenty of evidence of bioturbation by infauna with many burrows, holes, mounds and casts.
3.2.2 Community composition and biotope
The site was a moderately dense seagrass bed (Zostera subg. Zostera marina) with few epiphytes and only minor blackening of leaves by the marine slime mould Labyrinthula zosterae (< 1 %). Little epiphytic growth was observed on the leaves, and seeds and flowers were present. The growth of seagrass was rather patchy away from the transect. Fronds of Saccharina latissima were occasional on the site together with clumps of the brown alga Desmarestia aculeata. Characterising taxa recorded during Phase II survey are listed in Table 7. The site was assigned the biotope Zostera marina/angustifolia beds on lower shore or infralittoral clean or muddy sand SS.SMp.SSgr.Zmar.
Taxon | 2014 | 2023 |
|---|---|---|
| Zostera marina$ | A | A |
| Echinocardium cordatum | C | F |
| Echiurus echiurus / Echiura | C | F |
| Ensis arcuatus / Solenoidea | C | O |
| Liocarcinus depurator | C | O |
| Macropodia | C | R |
| Pagurus bernhardus | C | R |
| Pomatoschistus | C | F |
| Rissoa lilacina | C | F |
| Rissoa parva | C | - |
| Cradoscrupocellaria ellisi | - | F |
| Ascidiella aspersa | O | F |
| Dasysiphonia japonica$ | F | R |
| Saccharina latissima$ | F | O |
| Necora puber | F | - |
| Ophiura ophiura | F | - |
| Pholis gunnellus | F | - |
| Total no. of taxa | 60 | 44 |
3.2.3 Comparison with 2014 data
With scattered quadrats in denser stands of seagrass assessed in 2014 and one transect, SAR07, assessed in 2023, within the seagrass bed in Whiting Bay, only a qualitative assessment could be made between the two surveys. The characterising taxa from 2023 (Table 7) were compared to those listed from 2014 (Mercer et al., 2018). Most of the characterising taxa from 2014 were recorded in 2023, albeit at different levels of abundance with exception of Zostera marina. Rissoa parva, Necora puber, Ophiura ophiura and Pholis gunnellus were not recorded in 2023. Cradoscrupocellaria ellisi (F) was recorded from Desmarestia aculeata in 2023 whereas in 2014 Cradoscrupocellaria reptans (R) was recorded. It is likely these are the same species as the description of C. ellisi as a new species had only been made shortly prior to the 2014 survey (Vieira & Spencer Jones, 2012).
Transect video data from 2023 was not of sufficient quality for a meaningful analysis to generate additional community data from the seagrass bed. However, the 2014 video enabled the identification of 33 taxa or taxonomic groups with those most abundant summarised in Table 8. All the most abundant taxa listed in Table 8are also recorded in Table 7 with the exception of A. rubens. The record for ‘Rhodophyta filamentous’ could equate to that of D. japonica from the Phase II surveys, even if the video quality did not enable accurate identification. The 2014 video data also recorded the sediment type as 1 % empty shell and 99 % sand, which was in strong agreement with the records from the Phase II surveys.
| Taxon / group | 2014 |
|---|---|
| Zostera marina$ | A |
| Rissoa lilacina | C |
| Saccharina latissima$ | C |
| Ascidiella aspersa | C |
| Macropodia | F |
| Pagurus bernhardus | F |
| Asterias rubens | F |
| Rhodophyta filamentous$ | F |
| Total no. of taxa | 33 |
In 2023, divers swimming a 25 m transect through the seagrass bed noted the abundance and/or presence of specific seagrass features at 5 m intervals (n = 6). Seagrass cover was recorded to vary from 5-30 % at an average density of 25.5 shoots per quadrat, a density similar to that recorded in situ in 2014. The median number of shoots recorded per quadrat in 2014 (22 shoots) and 2023 (24 shoots) were very similar. The mean blade length was 47 cm with epiphyte cover ranging from 5-30 %. Seeds were visible in some plants at the start of the transect only. Some blackening of Zostera blades (possible Labyrinthula infection) was recorded approximately halfway along the transect.
The quadrat image data from either year was not of high enough quality to provide useful or accurate community data, due to either the oblique angles of the images or the seagrass blades obscuring much of each image. Attempts were made to record seagrass shoot counts from the images obtained in 2023, in order to investigate whether this would be a useful method of retrospectively doing shoot counts for seagrass beds, but they yielded counts approximately half that of those obtained in situ in both 2014 and 2023, and therefore were not deemed comparable.
3.3 Power analysis
Using the outcomes from the analysis of photographic quadrat imagery in 2014 and 2023 the results of a retrospective power analysis are discussed in detail in Annex 5 in so far as it relates to species accumulation curves as well as univariate and multivariate statistical power. The results indicated that in many instances 10-20 still images per transect could provide a fair representation of the benthic community for maerl habitats, ideally at the upper end of this range. Power analyses were not completed for the seagrass data owing to the survey imagery being of insufficient quality to generate community data in 2023.
4. Discussion
The South Arran MPA includes large areas of coarse sediment biotopes, often with high percentages of live maerl and dead maerl gravel. These are designated protected features of the MPA: ‘maerl beds’ and ‘kelp and seaweed communities on sublittoral sediment’, respectively. The area has also had a Marine Conservation Order implemented to further protect the designated features whereby four different fisheries regimes operate in different areas (Figure 1).
The aim of the present survey was to assess the status of maerl beds and maerl gravel areas assigned to the ‘kelp and seaweed communities on sublittoral sediment’ feature in the MPA and to begin to obtain data on the impacts of the different fisheries management tools on the biota at the sites.
In order to delineate the maerl beds present in the South Arran MPA a definition as to what constitutes a maerl bed was required. The priority marine feature (PMF) review for maerl beds carried out in 2018 defined a maerl bed as having at least 20 % cover of live or dead maerl thalli forming a complex 3D structure and covering a minimum area of 5 m x 5 m (Marine Scotland, 2018). Moore (2014a) reviewing the status of maerl around Arran acknowledged that sediments rich in dead maerl gravel support diverse benthic communities. A review of English maerl beds has developed a detailed categorisation of maerl gravel rich sediments (Axelsson, 2023). These categories include assessment of the proportions of both live and dead maerl as well as maerl structure and could be useful in providing comparable descriptions between maerl habitats around Arran and elsewhere in Scotland.
4.1 Maerl bed and maerl gravel biotopes
Mercer et al. (2018) distinguished three maerl habitat types in the South Arran MPA: two maerl beds dominated by different maerl species: SAR05 (Pladda) with Phymatolithon calcareum and SAR06 (Lamlash Bay North) with Lithothamnion glaciale and maerl gravel areas on the moderately exposed coast south and east of Holy Isle and off Merkland Point, representing the designated feature ‘kelp and seaweed communities on sublittoral sediment’ of the site. This situation had not changed in 2023. The authors raised concern at the large amounts of two species of non-native seaweed recorded: namely Dasysiphonia japonica (siphoned Japan weed), which was recorded as Frequent to Superabundant at all sites in 2014, and the Trailliella phase of Bonnemaisonia hamifera (Superabundant at SAR06 but only recorded as Rare at SAR02 and SAR04 in 2014; Figure 19). In 2023, D. japonica was recorded as Frequent to Common at the maerl gravel sites (SAR01, SAR02, SAR03, SAR04), but Rare or absent from the live maerl biotopes (SAR05 and SAR06, respectively). The Trailliella phase of B. hamifera was found as Occasional or Frequent at maerl gravel sites (SAR01, SAR02, SAR03, SAR04) and Common at SAR06 where it formed a dense mat over live maerl thalli. B. hamifera was also recorded in sediment cores from sites SAR01, SAR02, SAR03 and SAR06 by Purdue et al. (2025). There was a significant difference (P<0.001) in non-maerl algal cover between 2014 and 2023 at site SAR06. The status of these two non-native algae should be monitored, especially in the live maerl beds. Moore (2014b) considered the deterioration of a maerl bed in Loch Ewe to have been caused by an accumulation of a thick mat of filamentous red algae over live maerl.
Mercer et al. (2018) comparing the communities at SAR02 (Holy Isle North inside the NTZ) and SAR04 (Holy Isle North outside the NTZ), sites which are only 600 m apart, found no “meaningful differences which could be ascribed to effects of the NTZ” and considered the communities at the two sites to be part of a continuum. No significant difference between these two sites was identified between 2014 and 2023 with the visually dominant epibenthos being very similar in the two survey years (Table 2).
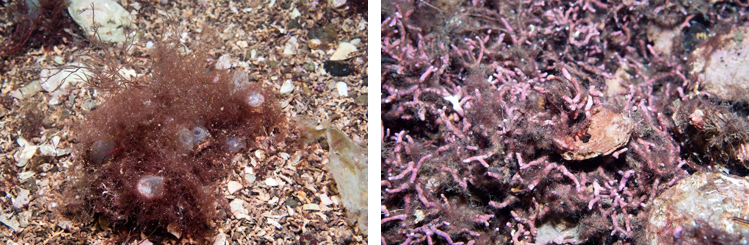
Figure 19. Left: Non-native Dasysiphonia japonica tangled around Ascidiella aspersa and Chatopterus tubes, SAR02. Right: thalli of Lithothamnion glaciale overgrown by the Trailliella phase of non-native Bonnemaisonia hamifera, SAR06.
Click for a full description
Left: Non-native Dasysiphonia japonica tangled around Ascidiella aspersa and Chatopterus tubes, SAR02. Right: thalli of Lithothamnion glaciale overgrown by the Trailliella phase of non-native Bonnemaisonia hamifera, SAR06
D. japonica was recorded at all sites in 2014 (Frequent to Superabundant); in 2023 it was recorded as Frequent to Common at maerl gravel sites (SAR01, SAR02, SAR03, SAR04) and Rare or absent from live maerl biotopes (SAR05 and SAR06, respectively). The Trailliella phase of B. hamifera was recorded as Superabundant at SAR06 and Rare at SAR02 and SAR04 in 2014; in 2023 the Trailliella phase was found as Occasional or Frequent at maerl gravel biotopes and Common at SAR06 where it formed a dense mat over live maerl thalli. B. hamifera was also recorded in sediment cores from sites SAR01, SAR02, SAR03 and SAR06 by Purdue et al. (2025). Images were taken during Phase II survey.
Phase II survey data did show significant differences between survey years. This could be due to fluctuations in populations of other less characterising taxa or different surveyors present in each year. A degree of variation in SACFOR assessments between divers is not uncommon and can depend on (i) an individual’s ability to judge density and (ii) underwater conditions at the time of survey (Moore et al., 2015). Differences in taxonomic expertise between surveyors can also be a factor, however, a comparison of the total list of taxa for both survey years showed that taxa missing from either list were generally recorded as rare or present at only one or two sites in the other year. Some other differences arose from recording at different taxonomic levels for example Scrupocellaria spp listed in 2014 were most likely recorded at family level in 2023 as Candidae. A notable absence in 2023 was the common starfish Asterias rubens, which was recorded as occasional to common at all sites except SAR05 in 2014. Other conspicuous starfish (Asteroidea) were well represented in 2023, but several predominantly as juveniles including Luidia ciliaris, Henricia sp and Porania (Porania) pulvillus. Phoronidae were not recorded in 2014 but occurred as frequent at SAR01 and rare at SAR02, SAR03 and SAR04 in 2023. This taxon, which is found closely associated with sediment, could be a useful indicator for undisturbed sediment.
Characterising taxa for the sites were very similar for both survey years (Table 2). With no replication at any of the survey locations, it should be borne in mind that any statistical differences in the data between the two surveys could just as likely reflect spatial variation in the data as they could temporal variation.
There was a difference between years in the amount of dead maerl gravel at SAR01 and SAR02 being significantly more in 2023 (P<0.001) and significantly less at SAR06 (P<0.003). This difference could be due to differences in evaluating the sediment by surveyors. At SAR01 and SAR02, the dominant sediment particle fraction was at the interface of the sand/gravel size boundary (4 mm). This inconsistency could be mitigated by thorough pre-survey briefing and the provision of particle size indicator cards to surveyors. Given the interest in maerl habitats it could be useful to record proportions of geogenic sediment particles, dead maerl derived and other biogenic particles within the categories of coarse sand (1-4 mm) and gravel (4 mm – 16 mm).
4.2 Whiting Bay seagrass beds
With only two data points from a single transect in 2023 and scattered quadrats in 2014, it is not possible to make statistically robust comparisons of the Whiting Bay seagrass bed between survey years. Estimates of shoot density of 89/m2 derived from in situ counts in 2014 (n = 46; Mercer et al., 2018) were similar to the 2023 value of in situ counts by divers on a small number of replicates (n = 6) of 100/m2. Mercer et al noted that these density estimates compared favourably with other Scottish west coast seagrass beds in Wester Ross as reported by Moore et al. (2011). Epibenthic taxon counts from these west coast seagrass beds were also comparable at 49 and 56 taxa from Wester Ross and 60 from Whiting Bay in 2014 compared with 49 from Whiting Bay in 2023. Of the 21 taxa from Whiting Bay recorded in 2014 and not reported in 2023, 17 were recorded as rare or represented by only one individual. The small gastropod Rissoa parva was common in 2014; this mollusc can be extremely abundant in some years and rare in others with timing in seasonal peaks in abundance being very variable (Moreira et al., 2010). The burrowing bivalve Ensis magnus (common) was not distinguished in 2023 although siphons of Solenoidea were reported as occasional, representing the same functional group as E. magnus. The absence in 2023 of Asterias rubens, which was common in 2014 and generally a very common species, cannot be explained. The area investigated in 2023 was smaller than that covered in the 2014 survey where dense seagrass within 50 m of the buoy marker was surveyed so this large, distinctive starfish might have been missed in 2023.
4.3 Temporal change
Statistical comparisons within each site only considered differences between the two sets of data based on image analysis. With only two points in time to compare and with the limited area covered by the images in each survey, it should be borne in mind that any statistical differences in the data between the two surveys could just as likely reflect spatial variation in the data as they could temporal variation. The data based on image analysis also had to include a category of ‘algal cover’ as the sediment beneath any algae could not be assessed - this may explain to some degree the lower percentages of live and dead maerl frequently recorded by this method in comparison to the in situ data, especially where the algal cover values were high. Furthermore, caution must be applied to any consideration of temporal change based on only two survey events with few replicates; several more years of survey data are required before any confident assertion of temporal change can be made, whether due to management measures or otherwise. Other possible drivers of between-year differences include spatial variation, image quality issues and surveyor variation. The last has been minimised by using the same analyst in the image and video analyses but the marked differences in filming techniques and image quality likely play a substantial role in defining the final data.
It has not been possible to identify any extensive time series studies of community change in maerl beds in Scotland (Doggett et al., 2024). However, during surveys of rocky reef communities in Plymouth Sound cSAC in 1998 and 1999 (using percentage cover in quadrats), Moore (2000) recorded large differences (often greater than x2, some by an order of magnitude) in the abundances of characteristic taxa and considerable differences in the total list of taxa present (>40 % change) at three different sites.; Many of these differences were statistically significant. With these differences observed over just two adjacent years, the potential for natural variability to be even greater should not be underestimated, especially on a decadal scale as in the present study. Moore (2000) observed that the changes were due in part to a combination of surveyor variability and behavioural factors of the organisms being recorded (e.g. expansion or contraction of anemones and cryptic behaviour of mobile species) but were mostly due to actual population changes. Such changes could be manifested as changes in year-on-year percentage cover by slow-growing, long-lived species or could be due to a strong element of ‘chance’, subject to numerous environmental factors that affect whether settlement and growth of new individuals (both short and long-lived) will occur in the same place in subsequent years i.e. stochastic and patchy recruitment. Despite these statistically significant population changes, communities were considered as “essentially the same” in both years; the author concluded that monitoring programmes need to consider these high levels of natural population fluctuations and set monitoring protocols to reflect those levels (Moore, 2000).
5. Recommendations
Possible criteria for establishing an effective monitoring regime for maerl habitats around Arran have been extensively discussed by Doggett et al. (2024). The main points are repeated below with many also equally applicable to surveying seagrass or other habitats.
Future surveys in maerl and/or seagrass habitats must:
- Decide what is to be monitored: impacts of different fisheries management measures or maerl or seagrass habitat recovery or change. Criteria as to what constitutes recovery of the habitat in question need to be established. It needs to be assessed whether these two objectives are compatible on a single survey with limited resources.
- Apply the priority marine feature (PMF) review definition of what constitutes a maerl bed: minimum 20 % cover of live or dead maerl forming a complex 3D structure over a minimum area of 5 m x 5 m.
- Consider broadening the definition of maerl sediment habitats as proposed by Axelsson (2023) for English maerl beds.
- For any monitoring programme it is necessary to standardise data collection and analytical methods to reduce ‘procedural noise’ in data.
- Be carried out at the same time of year.
- Consider indicator species and what sampling protocols are appropriate for them. Doggett et al. (2024) considered what indicator taxa might be suitable for maerl habitats.
- Choose fewer sites and monitor them effectively – more sampling stations per location in a limited area inside and outside the NTZ (in comparable habitats with comparable live maerl or seagrass) with replicate transects or sampling areas to provide robust statistical analysis. Regularly and frequently monitor key taxa very carefully using methods appropriate for the taxa and habitats selected at a suitable scale.
Whilst Phase II MNCR surveys can produce variable data, often without any or much sample replication, the data generated do help to put small-scale quadrat data into context, and the method often records rarer taxa that might otherwise be missed. The method can act as a form of horizon scanning and can aid hugely with data interpretation. The data can be analysed using non-parametric statistical techniques, but surveyor variation must be understood, and ideally more replicate samples obtained. With Phase II survey data often being gathered over a wider area than quadrats, it can act as a ‘buffer’ against making erroneous conclusions about species presence if some rarer taxa are not recorded in quadrat data.
Power analysis of the maerl data obtained for the South Arran MPA in 2014 and 2023 indicated that in many instances 10 to 20 still images per transect, ideally at the upper end of this range, could provide a good representation of the benthic community for maerl habitats. Further seagrass survey data would need to be recorded to enable an assessment of the statistical power of the seagrass survey methodologies.
If quadrat imagery is to be used to collect the core data for monitoring purposes the following criteria need to be carefully addressed:
- Develop and follow a standard operating procedure (SOP) for camera use in the field.
- Use good lighting (flash or high-quality LEDs) so the camera is not reliant on highly variable ambient light, which causes problems achieving good colour balance and sufficient shutter speeds.
- Stable and robust frame in which to mount camera and lights, preferably not made from white plastic, which causes unnecessary bias during exposure.
- Fixed zoom setting if a zoom lens is used. The selected lens should not produce too much distortion of the final image, e.g. avoid the use of very wide angle lenses.
- Image resolution: select option for high quality image files (> 10 mp). Avoid the use of high ISO values and/or slow shutter speeds to get round the use of inadequate lighting.
- Shutter speed fast enough to avoid image blur given the settings selected above.
- Avoid oblique views of the quadrat. Frame mounted equipment is best.
- Set white balance to auto and use high quality artificial lighting.
- Carry out checks in the field – with digital photography all the above can be checked in situ before setting out to capture quadrat images.
- Consider removing kelp from quadrats – perhaps take images before/after kelp removal. This is key if accurate assessments of live / dead maerl are to be made.
- Ensure the technique is appropriate for the species of interest being monitored by quadrat imagery i.e. the species of interest must be clearly visible and easy to capture in quadrat images taken over an appropriate spatial scale to accurately represent local populations / communities.
Video
- Consider the end use of the video to make sure the imagery collected is appropriate for its intended purpose. Settings suitable for photogrammetry might not be good for the analysis of benthic communities and seabed sediment types and vice-versa.
- Ensure slow smooth panning speed, proceeding steadily down one side of the transect and back up the other.
- Provide good lighting angled to minimise backscatter.
- Camera angle should be approximately at 45º to the horizontal facing forward.
Standardisation of in situ recording
At the start of every survey even if there has been no change in personnel bring the following to surveyors’ attention:
- Particle size definitions especially the difference between sand (< 4 mm) and gravel (4 mm to 16 mm) as defined by the MNCR protocol. Dead maerl fragments at sites in the South Arran MPA span this boundary. There are many different sediment particle size scales available but many dive surveyors are likely to be familiar with employing the MNCR protocol. Remind surveyors of the scale being used and provide a version to be taken underwater.
- Agree a sensible minimum value for how to record extremely low cover of live maerl, e.g. 0.1 %.
- The above two points also need to be drawn to the attention of the personnel analysing the images.
- Make sure camera operators clearly understand the purpose of the image collection and how to manage the camera. Ensure they are familiar with the operation of the equipment before stepping off the boat for the survey.
- Emphasise that it will be possible to have > 100 % cover at sites/in quadrats where for example kelp overlies sediments and where algae overgrow and/or embed maerl fragments.
- Surveyors should investigate the substratum in situ to discover conditions immediately below the surface e.g. anaerobic, buried live maerl fragments, layer of coarse sediment over mud, thin veneer overlaying hard substrate.
6. References
Allen, J. H. 2017. Infaunal and PSA analyses of benthic samples collected from around the Isle of Arran, Loch Fyne and Orkney in July and August 2015 Scottish Natural Heritage Commissioned Report No. 945.
Anderson, M. J., Gorley, R. N. & Clarke, K. R. 2008. PERMANOVA+ for PRIMER: Guide to software and statistical methods, Plymouth: PRIMER-E.
Anderson, M. J. & Walsh, D. C. I. 2013. PERMANOVA, ANOSIM, and the Mantel test in the face of heterogeneous dispersions: What null hypothesis are you testing? Ecological Monographs, 83, 557-574.
Axelsson, M. B. 2023. A categorisation system for maerl bed habitats in England NERR123.
Doggett, M., Morris-Webb, L. & Baldock, L. 2024. Time series analysis to determine change in maerl beds. NatureScot Research Report 1275.
Hartnoll, R. G. 1998. Volume VIII. Circalittoral faunal turf biotopes: an overview of dynamics and sensitivity characteristics for the conservation management of marine SACs
Hiscock, K. 1996. Marine Nature Conservation Review: rationale and methods
Marine Scotland, 2018. Priority Marine feature (PMF) – Fisheries Management Review, Maerl Beds
Mercer, T., Kamphausen, L., Moore, J., Bunker, F., Archer Thompson, J. & Howson, C. 2018. South Arran MPA diver survey of maerl beds, kelp and seaweed communities on sublittoral sediment, and seagrass beds 2014 Scottish Natural Heritage Research Report No. 882.
Moore, C. G. 2014a. The distribution of maerl and other coarse sediment proposed protected features within the South Arran pMPA - a data review to inform management options Scottish Natural Heritage Commissioned Report No. 749.
Moore, C. G. 2014b. Upper Loch Fyne and Loch Goil pMPA and Wester Ross pMPA - the identification of conservation management areas to support protected feature recovery Scottish Natural Heritage Commissioned Report No. 764.
Moore, C. G., Harries, D. B., Trigg, C., Porter, J. S. & Lyndon, A. R. 2011. The Distribution of Priority Marine Features and MPA search features within the Ullapool Approaches: a broadscale validation survey Scottish Natural Heritage Commissioned Report No. 422.
Moore, J. 2000. Development of a monitoring programme and methods in Plymouth Sound cSAC: application of diver techniques – 1999 Report to English Nature Nature for the UK Marine SACs Project. Cordah Ltd.
Moore, J., Bunker, F., van Rein, H. & Jones, J. 2015. Methodological trials: Recording subtidal epibiota in situ and in photographs, Portrush August 2013 and Sound of Mull August 2014
Moreira, J., Aldea, C. & Troncoso, J.S. 2010. Temporal dynamics of gastropod fauna on subtidal sandy sediments of the Ensenada de Baiona (NW Iberian Peninsula) Helgoland Marine Research, 64, 311-320.
Purdue, E., Pears, S. & Worsfold, T. 2025. 2023 South Arran dive survey: Infaunal and PSA analyses of diver-collected sediment samples from the South Arran MPA. NatureScot Research Report 1373.
Sebens, K. P. 1985. The ecology of the rocky subtidal zone. American Scientist, 73, 548-557.
Strong, J. A. & Johnson, M. 2020. Converting SACFOR data for statistical analysis: validation, demonstration and further possibilities Marine Biodiversity Records, 13, 2.
Vieira, L. M. & Spencer Jones, M. 2012. The identity of Sertularia reptans Linnaeus, 1758 (Bryozoa, Candidae). Zootaxa, 3563, 26-42.
7. Annexes
Annex 1 – Taxon abundance scale
% cover scale | Growth form: Crust/meadow | Growth form: Massive/turf | Size <1cm | Size 1-3cm | Size | Size | Density scale |
|---|---|---|---|---|---|---|---|
| >80% | S | - | S | - | - | - | >10,000/m2 |
| 40-79% | A | S | A | S | - | - | 1000-9999/m2 |
| 20-39% | C | A | C | A | S | - | 100-999/m2 |
| 10-19% | F | C | F | C | A | S | 10-99/m2 |
| 5-9% | O | F | O | F | C | A | 1-9/m2 |
| 1-5% or density | R | O | R | O | F | C | 1-9/10m2 |
| <1% or density | - | R | - | R | O | F | 1-9/100m2 |
| - | - | - | - | - | R | O | 1-9/1000m2 |
| - | - | - | - | - | - | R | <1/1000m2 |
S – super abundant, A – abundant, C – common, F – Frequent, O – occasional
R – rare, P – present (abundance not assessed).
From: SACFOR Abundance scale from JNCC Marine Habitat Classification website
Annex 2 – Details of statistical methods used
Using PRIMERTM Bray-Curtis similarity matrices was produced from taxon abundance data recorded by Phase II MNCR survey and by analysis of imagery (stills and video). SACFOR values were converted for multivariate analysis as described by Strong & Johnson (2020). A similarity matrix compares every sample to every other sample and ranks samples based on similarities. Multi-dimensional scaling (MDS) plots were then produced to illustrate the differences and / or similarities between sampling years at each site. These plots are based on the results of the Bray-Curtis similarity matrices and can provide useful, visual assistance with interpreting the results from ANOSIM (Analysis of Similarity) tests depending on the degree of clustering between samples; samples clustered closer together are more similar than those further apart.
ANOSIM provides R-values that indicate the degree of dissimilarity between sample groups compared with other sample groups in the dataset. R-values most often fall between zero and one. As values approach zero a greater degree of similarity is indicated, whereas those closer to one indicate a greater degree of dissimilarity. SIMPER (Similarity Percentages) analyses were examined to determine which taxa were contributing most to the differences between years.
Annex 3 – Survey site details and physical characteristics – 2023
| Site Name | Holy Isle South | Holy Isle North | Merkland Point | Holy Isle North | Pladda West | Pladda West | Lamlash Bay North | Whiting Bay Zostera |
|---|---|---|---|---|---|---|---|---|
| 2023 site code | SAR01 | SAR02 | SAR03 | SAR04 | SAR05 (hab_01) | SAR05 (hab_02) | SAR06 | SAR07 |
| 2014 site code | HI22 | HIN02 | n/a | HIN04 | PL34 | PL34 | LBN | WBZ |
| Survey date | 27/08/2023 | 27/08/2023 | 28/08/2023 | 29/08/2023 | 30/08/2023 | 30/08/2023 | 31/08/2023 | 31/08/2023 |
| Lat / long | 55.51069 -5.06223 | 55.53564 -5.07231 | 55.6159 -5.12654 | 55.53867 -5.07758 | 55.43619 -5.12503 | 55.43619 -5.12503 | 55.54640 -5.08872 | 55.49753 -5.08788 |
| Transect bearing | 200 | 110 | 075 | 110 | 240 | 240 | 100 | 100 |
| Personnel | - | - | - | - | - | - | - | - |
| Maerl / seagrass quadrats | RP / LB | RP / LB | RP / LB | RP / LB | RM / LB | RM / LB | RM / LB | RP / RM / LB |
| Phase II survey | LB / NJO | LB / NJO | LB / NJO | LB / NJO | LB / NJO | LB / NJO | LB / NJO | LB / NJO |
| Photography | LB / NJO | LB / NJO | LB / NJO | LB / NJO | LB / NJO | LB / NJO | LB / NJO | LB / NJO |
| Video | PW | PW | PW | PW | PW | PW | PW | PW |
| Biotope | - | - | - | - | - | - | - | - |
| Biotope code | SS.SMp.KSwSS.SlatR.Gv | SS.SMp.KSwSS.SlatR.Gv | SS.SMp.KSwSS.SlatR.Sa | SS.SMp.KSwSS.SlatR.Sa | SS.SMp.Mrl.Pcal | IR.HIR.KSed.SlatSac | SS.SMp.Mrl.Lgla | SS.SMp.SSgr.Zmar |
| Certain / uncertain | Certain | Certain | Certain | Certain | Certain | Certain | Certain | Certain |
| Substrate % | - | - | - | - | - | - | - | - |
| Bedrock | 0 | 0 | 0 | 0 | 0 | 75 | 0 | 0 |
| Small boulders | 0 | 0 | 0 | 0 | 0 | 25 | 0 | 0 |
| Cobbles | 0 | 1 | 0 | 2 | 0 | 0 | 0 | 0 |
| Pebbles | 1 | 1 | 2 | 0 | 0 | 0 | 0 | 0 |
| Empty shells | 0 | 10 | 0 | 10 | 15 | 0 | 15 | 2 |
| Live Modiolus | 0 | 0 | 0 | 0 | 0 | 0 | 0 | 0 |
| Stone gravel (4-16mm) | 4 | 7.9 | 25 | 2 | 10 | 0 | 0 | 0 |
| Shell gravel (4-16mm) | 14 | 0 | 5 | 0 | 0 | 0 | 0 | 0 |
| Dead maerl gravel (4-16mm) | 80.5 | 80 | 15 | 80 | 30 | 0 | 0 | 0 |
| Live maerl | 0.5 | 0.1 | 0 | 0 | 25 | 0 | 80 | 0 |
| Coarse sand (1-4mm) | 0 | 0 | 38 | 6 | 0 | 0 | 0 | 0 |
| Medium sand (0.25-1mm) | 0 | 0 | 0 | 0 | 20 | 0 | 5 | 98 |
| Fine sand (0.063-0.25mm) | 0 | 0 | 15 | 0 | 0 | 0 | 0 | 0 |
| Mud (<0.063mm) | 0 | 0 | 0 | 0 | 0 | 0 | 0 | 0 |
| Algae (excluding maerl & kelp) | 18 | 21 | 20 | - | 2 | 60 | 37 | 5 |
| Kelp | 4 | 6 | 7 | - | 25 | 80 | 5 | 5 |
| Maerl morphology | Dead twiglets | Dead twiglets | Dead twiglets | Dead twiglets | Flat plates | n/a | Live twiglets | n/a |
| Depth BCD (m) | 8.9 | 8.8 | 10.2 | 7.0 | 8.5 | 8.5 | 11.6 | 4.0 |
| Rock Features (1-5) | - | - | - | - | - | - | - | - |
| Surface relief (even – rugged) | n/a | n/a | n/a | n/a | n/a | 1 | n/a | n/a |
| Texture (smooth – pitted) | n/a | n/a | n/a | n/a | n/a | 1 | n/a | n/a |
| Stability (stable – mobile) | n/a | n/a | n/a | n/a | n/a | 2 | n/a | n/a |
| Scour (none – scoured) | n/a | n/a | n/a | n/a | n/a | 5 | n/a | n/a |
| Silt (none-silted) | n/a | n/a | n/a | n/a | n/a | 1 | n/a | n/a |
| Fissures >10 mm (none - many) | n/a | n/a | n/a | n/a | n/a | 1 | n/a | n/a |
| Crevices <10 mm (none - many) | n/a | n/a | n/a | n/a | n/a | 1 | n/a | n/a |
| Boulder / cobble / pebble-shape | n/a | n/a | n/a | n/a | n/a | 2 | n/a | n/a |
| (rounded-angular) | - | - | - | - | - | - | - | - |
| Sediment Features (1-5) | - | - | - | - | - | - | - | - |
| Surface relief (even – uneven) | 1 | 4 | 1 | 1 | 2 | n/a | 2 | 1 |
| Firmness (firm - soft) | 3 | 2 | 3 | 3 | 2 | n/a | 3 | 2 |
| Stability (stable - mobile) | 3 | 2 | 2 | 3 | 4 | n/a | 2 | 4 |
| Sorting (well - poor) | 3 | 1 | 2 | 2 | 3 | n/a | 2 | 1 |
| Sediment Features | - | - | - | - | - | - | - | - |
| Mounds / casts | N | N | Y | Y | N | n/a | Y | Y |
| Burrows / holes | Y | Y | Y | Y | Y | n/a | Y | Y |
| Tubes | N | Y | Y | Y | Y | n/a | Y | Y |
| Algal mat | Y | Y | Y | Y | N | n/a | Y | N |
| Waves / dunes (>10 cm high) | N | N | N | N | Y | n/a | N | N |
| Ripples (<10 cm high) | Y | N | N | N | N | n/a | N | N |
| Subsurface black layer | Y | N | Y | Y | N | n/a | N | Y |
| Subsurface coarse layer | N | N | N | N | N | n/a | N | N |
| Subsurface clay / mud | N | N | N | N | N | n/a | N | N |
| Subsurface silt / flocculent | N | N | N | N | N | n/a | N | N |
Note: it is possible for substrate cover to add up to more than 100 % where algae overlie other components of the sediment, e.g. kelp fronds or filamentous algae over growing live or dead maerl gravel or other sediment.
Personnel
NatureScot: RP – Rie Pors, RM – Roddy MacMinn, PW- Peter Webster
Marine EcoSol: LB – Lin Baldock, NJO – Nick Owen
Annex 4 – Phase II survey data – 2023
| Scientific name accepted | Size class / growth form | Notes | SAR01# | SAR02# | SAR03# | SAR04# | SAR05 Hab1# | SAR05 Hab2$ | SAR06# | SAR07£ |
|---|---|---|---|---|---|---|---|---|---|---|
| Sycon ciliatum | 1-3cm | - | R | - | - | R | - | - | - | - |
| Leucosolenia | 1-3cm | - | P | P | R | R | - | - | R | - |
| Suberites | Turf / massive | very small | R | - | R | R | - | - | R | - |
| Porifera | Turf / massive | crust | P | - | - | - | - | - | R | - |
| Amphilectus fucorum | Turf / massive | - | - | - | R | R | - | - | R | - |
| Cliona | Turf / massive | boring in shell | - | R | - | - | R | - | R | - |
| Halecium | Turf / massive | - | - | R | - | - | - | - | - | - |
| Clytia hemisphaerica | 1-3cm | - | - | P | - | P | - | - | - | - |
| Leptothecata | Turf / massive | - | - | - | - | - | - | - | - | P |
| Eudendrium | Turf / massive | - | - | P | - | P | - | - | P | - |
| Obelia geniculata | Turf / massive | on kelp | - | - | - | - | - | R | - | - |
| Kirchenpaueria | Turf / massive | - | - | - | - | - | - | - | R | - |
| Hydractinia | 1-3cm | - | - | - | - | - | - | - | - | R |
| Synarachnactis lloydii | 3-15cm | - | C | F | C | C | O | - | - | R |
| Cylista | 3-15cm | - | - | - | - | R | - | - | - | - |
| Edwardsia claparedii | 3-15cm | - | - | - | - | - | - | - | P | - |
| Sagartia undata | 3-15cm | - | - | - | - | - | - | - | - | R |
| Tubulanus | >15cm | - | R | - | - | - | - | - | R | - |
| Echiura | 3-15cm | burrows | - | - | - | - | - | - | - | F |
| Chaetopterus | 3-15cm | tubes | C | F | F | F | R | - | C | - |
| Hydroides norvegica | 3-15cm | - | R | - | P | R | P | - | R | - |
| Myxicola polychroma | 3-15cm | - | R | - | - | R | - | - | - | - |
| Spirobranchus | 1-3cm | - | F | O | F | R | R | F | O | R |
| Spirorbinae | <1cm | on kelp | F | F | F | O | - | - | R | R |
| Terebellidae | 3-15cm | - | F | O | O | F | - | - | F | - |
| Sabellidae | 3-15cm | - | - | - | R | R | - | - | R | - |
| Lanice conchilega | 3-15cm | - | - | R | - | - | - | - | - | - |
| Branchiomma bombyx | 3-15cm | - | - | R | - | R | - | - | R | - |
| Arenicolidae | 3-15cm | casts | - | - | - | - | - | - | - | R |
| Polychaeta | 3-15cm | sediment tubes | - | - | - | - | - | - | - | O |
| Sabella pavonina | 3-15cm | - | - | - | - | - | - | - | - | R |
| Pycnogonidae | 1-3cm | - | P | - | - | - | - | - | - | - |
| Phtisica marina | 1-3cm | - | P | - | - | P | - | - | - | - |
| Ostracoda | <1cm | - | - | F | P | C | - | - | P | - |
| Amphipoda | 1-3cm | tubes | - | - | - | P | - | P | P | - |
| Pseudoprotella phasma | 1-3cm | - | - | - | - | - | - | - | P | - |
| Cirripedia | 1-3cm | - | - | - | - | - | - | - | R | - |
| Anapagurus hyndmanni | 3-15cm | - | R | - | - | - | - | - | - | - |
| Cancer pagurus | 3-15cm | - | - | - | R | R | - | - | - | - |
| Eualus | 3-15cm | - | O | - | - | - | - | - | - | - |
| Galathea intermedia | 3-15cm | - | R | - | P | - | - | - | F | - |
| Hippolyte varians | 1-3cm | - | - | P | - | - | - | - | - | - |
| Inachus dorsettensis | 3-15cm | - | R | R | R | R | - | - | C | - |
| Inachus phalangium | 3-15cm | - | - | - | - | R | - | - | - | - |
| Liocarcinus corrugatus | 3-15cm | - | F | - | - | - | - | - | R | - |
| Liocarcinus depurator | 3-15cm | - | R | R | R | R | - | - | R | O |
| Liocarcinus navigator | 3-15cm | - | - | R | R | - | - | - | - | - |
| Macropodia | 3-15cm | - | R | R | R | R | - | - | O | R |
| Necora puber | 3-15cm | - | R | R | F | F | - | - | R | - |
| Pagurus bernhardus | 3-15cm | - | R | R | R | R | - | - | R | R |
| Pagurus pubescens | 3-15cm | - | R | R | R | R | - | - | R | - |
| Pagurus cuanensis | 3-15cm | - | - | - | - | - | - | - | R | - |
| Pandalus montagui | 3-15cm | - | - | - | - | - | - | - | - | - |
| Paguridae | 3-15cm | - | - | - | - | - | R | - | - | - |
| Mysidae | 1-3cm | - | - | - | - | - | - | P | - | - |
| Hyas | 3-15cm | - | - | - | - | - | - | - | R | - |
| Pisa | 3-15cm | - | - | - | - | - | - | - | R | - |
| Crangon | 3-15cm | - | - | - | - | - | - | - | - | R |
| Carcinus maenas | 3-15cm | - | - | - | - | - | - | - | - | R |
| Leptochiton cancellatus | 3-15cm | - | P | P | P | P | R | - | R | - |
| Lepidochitona cinerea | 3-15cm | - | P | - | - | - | - | - | - | - |
| Aplysia punctata | 3-15cm | - | P | R | - | P | - | - | - | - |
| Buccinum undatum | 3-15cm | - | R | - | - | - | - | - | - | - |
| Bittium reticulatum | <1cm | - | - | - | P | - | - | - | - | - |
| Gibbula magus | 1-3cm | - | R | R | R | - | R | - | - | - |
| Rissoa | <1cm | - | R | R | R | - | P | - | - | - |
| Rissoa lilacina | <1cm | - | O | O | - | O | - | P | R | F |
| Tectura virginea | 1-3cm | - | R | R | R | R | - | - | R | - |
| Testudinalia testudinalis | 1-3cm | - | P | P | P | - | - | - | - | - |
| Tricolia pullus | <1cm | - | P | - | - | - | - | - | - | - |
| Cyrillia linearis | <1cm | - | - | R | - | - | - | - | R | - |
| Elysia viridis | 1-3cm | - | - | P | - | R | - | - | - | - |
| Rissoa parva | <1cm | - | - | - | - | - | P | - | - | - |
| Steromphala cineraria | 1-3cm | - | - | - | - | - | - | R | R | - |
| Lacuna | <1cm | - | - | - | - | - | - | P | - | O |
| Tritia | 1-3cm | - | - | - | - | - | - | - | R | - |
| Trinchesia cuanensis | 1-3cm | - | - | P | - | P | - | - | - | - |
| Polycera | 3-15cm | juv | - | P | - | - | - | - | - | - |
| Polycera quadrilineata | 3-15cm | - | - | - | - | - | - | - | - | R |
| Dosinia exoleta | 3-15cm | live | - | P | - | - | - | - | - | - |
| Glycymeris glycymeris | 3-15cm | live on surface sediment | - | - | - | - | - | - | O | - |
| Pecten maximus | 3-15cm | - | R | - | R | O | - | - | R | - |
| Solenoidea | 3-15cm | siphons | C | F | F | C | O | - | O | O |
| Mimachlamys varia | 3-15cm | - | - | - | - | - | - | - | R | - |
| Anomiidae | 1-3cm | - | - | - | - | - | - | - | P | - |
| Hiatella arctica | 3-15cm | - | - | P | - | - | - | - | P | - |
| Aetea sica | <1cm | - | P | P | - | P | - | - | P | - |
| Celleporella hyalina | Crust / meadow | on kelp | R | R | F | O | - | O | R | R |
| Diplosoma listerianum | Crust / meadow | on kelp | P | - | - | - | - | - | - | - |
| Electra pilosa | Crust / meadow | on kelp | R | R | R | - | - | R | R | R |
| Membranipora membranacea | Crust / meadow | on kelp | R | R | O | O | - | C | O | R |
| Scrupocellaria scruposa | Turf / massive | - | R | R | R | P | R | O | R | - |
| Cradoscrupocellaria ellisi | Turf / massive | on Desmerestia aculeata | - | - | - | R | P | O | - | F |
| Crisiidae | Turf / massive | - | - | P | R | R | - | R | P | - |
| Tubuliporidae | Crust / meadow | on kelp | P | R | - | P | - | R | - | - |
| Disporella hispida | Crust / meadow | - | - | - | - | R | - | - | P | - |
| Alcyonidium diaphanum | >15cm | - | - | - | - | - | - | F | - | - |
| Fenestrulina malusii | Crust / meadow | on Dosinia | P | P | P | - | - | - | P | - |
| Phoronis | Turf / massive | - | F | R | R | R | - | - | - | - |
| Antedon bifida | 3-15cm | juvenile | R | - | - | - | - | - | - | - |
| Henricia | 3-15cm | small | O | O | R | - | - | - | R | - |
| Luidia ciliaris | >15cm | small 5cm | O | R | R | O | - | - | R | - |
| Marthasterias glacialis | >15cm | - | C | C | F | C | - | R | F | - |
| Porania (Porania) pulvillus | 1-3cm | small | O | R | R | - | - | - | O | - |
| Solaster endeca | >15cm | - | - | - | R | - | - | - | - | - |
| Astropecten irregularis | >15cm | - | - | R | - | - | - | - | - | R |
| Crossaster papposus | >15cm | - | - | - | - | - | - | R | - | - |
| Amphipholis squamata | 3-15cm | - | P | P | P | F | - | - | P | - |
| Ophiura albida | 3-15cm | - | - | - | R | - | - | - | - | - |
| Ophiothrix fragilis | 3-15cm | - | - | R | - | - | - | - | - | - |
| Echinus esculentus | 3-15cm | - | - | - | - | - | - | R | - | - |
| Echinocardium cordatum | 3-15cm | burrows | - | - | - | - | - | - | - | F |
| Neopentadactyla mixta | >15cm | - | - | - | - | - | R | - | - | - |
| Aplidium punctum | Turf / massive | - | R | - | - | - | - | R | - | - |
| Ascidiella aspersa | 3-15cm | - | A | A | A | A | R | R | A | F |
| Corella parallelogramma | 1-3cm | - | O | R | R | R | - | - | R | - |
| Dendrodoa grossularia | <1cm | - | P | - | - | - | - | - | - | - |
| Diplosoma listerianum | Crust / meadow | on kelp | R | P | O | R | - | R | R | R |
| Microcosmus claudicans | 1-3cm | - | R | R | R | - | - | - | P | - |
| Polycarpa pomaria | 1-3cm | - | R | - | - | - | - | - | - | - |
| Polycarpa scuba | 1-3cm | - | R | - | - | - | - | - | - | - |
| Pyura microcosmus | 1-3cm | - | R | R | R | - | - | - | R | - |
| Ciona intestinalis | 3-15cm | - | - | - | - | R | - | - | - | - |
| Lissoclinum perforatum | Crust / meadow | - | - | - | - | - | - | R | - | - |
| Clavelina lepadiformis | Turf / massive | - | - | - | - | - | - | P | - | - |
| Botryllus schlosseri | Crust / meadow | - | - | - | - | - | - | P | - | - |
| Callionymus lyra | >15cm | - | O | R | R | - | F | - | R | - |
| Myoxocephalus scorpius | >15cm | - | - | R | - | - | - | - | - | - |
| Pholis gunnellus | >15cm | - | R | R | R | R | - | - | R | - |
| Pomatoschistus flavescens | 3-15cm | among kelp | - | F | O | O | - | R | R | - |
| Pomatoschistus pictus | 3-15cm | - | F | F | C | C | C | - | R | O |
| Taurulus bubalis | >15cm | - | - | R | - | R | - | - | - | - |
| Syngnathus acus | >15cm | - | - | - | - | R | - | - | - | - |
| Spinachia spinachia | >15cm | - | - | - | - | - | - | R | - | - |
| Pleuronectidae | >15cm | juvenile | - | - | - | - | - | - | - | R |
| Pomatoschistus | 3-15cm | minutus / lozanoi | - | - | - | - | - | - | - | F |
| Gadus morhua | >15cm | juvenile | - | - | - | - | - | - | - | R |
| Bacillariophyceae | Crust / meadow | film on sand | - | - | - | - | - | - | - | O |
| Acrosorium ciliolatum | Turf / massive | - | - | P | R | - | - | - | - | - |
| Aglaothamnion tenuissimum | Turf / massive | - | R | R | - | - | - | - | - | - |
| Antithamnionella ternifolia | Turf / massive | - | - | - | - | - | R | R | - | - |
| Apoglossum ruscifolium | Turf / massive | - | R | R | - | R | - | - | - | - |
| Bonnemaisonia hamifera | Turf / massive | Trailliella binding maerl | O | F | F | F | - | R | C | P |
| Calliblepharis ciliata | Turf / massive | - | R | R | R | - | - | - | R? | - |
| Calliblepharis jubata | Turf / massive | - | R | F | R | F | R | - | O | - |
| Metacallophyllis laciniata | Turf / massive | - | R | - | - | - | - | R | - | - |
| Carradoriella elongata | Turf / massive | - | R | R | - | - | - | R | - | - |
| Ceramium | Turf / massive | - | P | - | - | - | R | - | - | - |
| Ceramium secundatum | Turf / massive | - | R | P | P | R | - | - | R | - |
| Chylocladia verticillata | Turf / massive | - | P | P | P | R | R | - | - | P |
| Chondrus crispus | Turf / massive | - | - | - | R | - | R | R | - | - |
| Corallina officinalis | Turf / massive | - | - | R | - | R | - | - | R | - |
| Corallinaceae | Crust / meadow | crust | R | R | R | R | - | F | - | - |
| Cruoria cruoriiformis | Turf / massive | - | P | P | P | - | P | - | - | - |
| Cryptopleura ramosa | Turf / massive | - | R | O | R | F | R | O | O | R |
| Dasysiphonia japonica | Turf / massive | - | F | F | F | C | R | R | - | R |
| Delesseria sanguinea | Turf / massive | - | R | R | R | R | - | R | - | - |
| Deltalsia parasitica | Turf / massive | - | P | P | - | P | R | - | R | - |
| Dilsea carnosa | Turf / massive | - | - | - | R | - | - | R | - | - |
| Asparagopsis armata | Turf / massive | Falkenbergia | - | - | - | R | R | - | R | - |
| Furcellaria lumbricalis | Turf / massive | - | - | - | R | - | - | - | - | - |
| Gelidiella calcicola | Turf / massive | - | - | - | - | R | R | - | - | - |
| Gracilaria gracilis | Turf / massive | - | - | - | R | - | R | - | - | - |
| Halurus flosculosus | Turf / massive | - | - | - | R | - | R | - | - | - |
| Heterosiphonia plumosa | Turf / massive | - | P | R | - | O | - | R | F | - |
| Hypoglossum hypoglossoides | Turf / massive | - | R | - | R | R | - | - | R | - |
| Lithothamnion glaciale | Crust / meadow | - | R | R | R | R | - | - | S | - |
| Lithothamnion glaciale dead | Crust / meadow | dead | S | S | - | S | - | - | - | - |
| Lomentaria clavellosa | Turf / massive | - | R | - | - | P | R | R | - | R |
| Lomentaria orcadensis | Turf / massive | - | R | R | R | - | - | - | - | - |
| Hapalidiaceae | Turf / massive | “Hedgehog” maerl | R | - | R | R | - | - | - | - |
| Membranoptera alata | Turf / massive | - | - | - | - | - | R | O | R | - |
| Nitophyllum punctatum | Turf / massive | - | R | R | R | - | R | - | - | - |
| Rhodophyta | Turf / massive | Non-calcareous red crust | R | R | R | R | R | - | R | - |
| Odonthalia dentata | Turf / massive | - | - | - | - | - | - | O | - | - |
| Palmaria palmata | Turf / massive | - | - | - | - | - | R | O | - | - |
| Peyssonnelia | Turf / massive | - | - | - | - | - | R | - | - | - |
| Phycodrys rubens | Turf / massive | - | R | P | - | - | - | O | P | - |
| Phyllophora crispa | Turf / massive | - | R | - | - | - | - | - | - | - |
| Phymatolithon calcareum | Crust / meadow | - | - | - | - | - | C | - | - | - |
| Plocamium cartilagineum | Turf / massive | - | P | - | - | - | - | - | - | - |
| Plocamium | Turf / massive | - | - | - | - | - | - | - | - | R |
| Plocamium lyngbyanum | Turf / massive | - | O | R | R | C | R | F | R | - |
| Polyides rotunda | Turf / massive | - | - | - | - | - | R | - | - | - |
| Pterothamnion plumula | Turf / massive | - | R | R | - | - | R | - | - | - |
| Ptilota gunneri | Turf / massive | - | - | - | - | - | - | R | - | - |
| Radicilingua thysanorhizans | Turf / massive | - | - | - | - | - | - | - | R | - |
| Rhodomela confervoides | Turf / massive | - | O | O | O | C | R | R | - | - |
| Rhodophyllis divaricata | Turf / massive | - | F | F | F | C | - | - | F | - |
| Rhodothamniella floridula | Turf / massive | - | - | - | - | - | F | - | - | - |
| Rhodymenia pseudopalmata | Turf / massive | - | R | R | R | - | - | - | - | - |
| Scinaia interrupta | Turf / massive | - | O | R | R | R | R | - | - | - |
| Spermothamnion strictum | Turf / massive | - | - | P | - | - | R | - | - | - |
| Spermothamnion repens | Turf / massive | - | - | - | - | - | - | - | O | - |
| Sphondylothamnion multifidum | Turf / massive | - | R | R | - | R | - | - | - | - |
| Vertebrata byssoides | Turf / massive | - | - | - | - | R | - | - | - | - |
| Vertebrata fucoides | Turf / massive | - | - | - | - | P | - | - | - | - |
| Vertebrata nigra | Turf / massive | - | - | - | - | R | - | - | - | - |
| Pneophyllum fragile | Turf / massive | on Zostera fronds | - | - | - | - | - | - | - | R |
| Gracilariales | Turf / massive | - | - | - | - | - | - | - | - | R |
| Cutleria multifida | Turf / massive | Aglaozonia | R | R | R | R | R | - | R | - |
| Desmarestia ligulata | Crust / meadow | - | F | O | R | - | - | - | - | - |
| Desmarestia viridis | Crust / meadow | - | R | - | - | R | - | - | - | R |
| Desmarestia aculeata | Crust / meadow | - | - | - | - | - | - | F | - | O |
| Dictyota dichotoma | Turf / massive | - | R | R | R | R | R | - | R | - |
| Saccharina latissima | >15cm | - | C | C | A | A | - | A | C | O |
| Sporochnus pedunculatus | Turf / massive | - | - | R | - | - | - | - | - | - |
| Sphacelaria | Turf / massive | - | P | P | P | - | - | - | R | - |
| Phaeophyceae | Turf / massive | Crust | - | - | - | R | - | - | - | - |
| Asperococcus bullosus | Turf / massive | - | - | - | - | R | - | - | - | - |
| Cutleria multifida | Turf / massive | - | - | P | - | R | - | - | - | - |
| Halidrys siliquosa | Turf / massive | - | - | - | - | - | - | R | - | - |
| Ulva | Turf / massive | Foliose | R | - | - | - | - | - | - | R |
| Bryopsis plumosa | Turf / massive | - | P | R | - | - | P | - | - | - |
| Ulva rigida | Turf / massive | - | - | R | R | R | R | R | R | - |
| Derbesia sp | Turf / massive | - | - | - | - | R | - | - | - | - |
| Zostera subg. Zostera marina | Turf / massive | - | - | - | - | - | - | - | - | A |
| Total recorded taxa (overall = 215) | - | - | 105 | 101 | 83 | 92 | 47 | 48 | 86 | 44 |
Annex 5 – Statistical power
Species accumulation curves (quadrat image analysis sampling efficiency)
Species accumulation curves can be used to determine if a sampling strategy is capturing the majority of species present within a study site. The accumulation curves for the quadrat image analysis in Figure A5.1 show that at the majority of sampling sites the curve gradient was beginning to decrease where n>5 and was even lower when n>10 in 2023. The gradients for the 2014 curves were more variable, often with steeper gradients and fewer taxa, potentially owing to the lower sample size and lower image quality limiting the number of taxa that could be recorded.
Overall, the accumulation curve data suggest that the analysis of 20 quadrat images will capture more taxa than 10 images and that the number of new taxa will be minimised when n>20, although it will always be expected to increase with further sampling effort.
Univariate power analysis
Moore (2000) conducted power analyses on species-specific, univariate data collected using quadrats used to record community-level data from the Plymouth Sound and Estuaries SAC. Moore (2000) demonstrated that to determine significant change in abundance of particular taxa, an unachievable number of quadrats is often required (>30 – 100+), thereby making assertions of significant change at the species level using the present methodology unreliable. The present methodology is designed to assess and understand broadscale community-level changes. Whilst some abundant taxa e.g. total maerl, are likely to be sampled very efficiently by this method, most of the taxa occurring more sporadically and at low abundances (as in the present data sets) are unlikely to generate data suitable for statistical analysis, mainly owing to the likely higher frequencies of low abundance or zero count data. To be certain of any significant changes occurring at a species level, individual taxa would need to be assessed from within the existing data with a high degree of caution; it would be more advisable in such an instance where this might be required, to develop a species-specific survey protocol to ensure adequate data were collected to test any hypothesis of cause and effect.
In the present study, retrospective power analysis was used with the image analysis data to assess the statistical power of the sampling regime to determine changes in the live maerl fraction of each quadrat. Minitab® was used to generate retrospective power curves for one-way ANOVA tests that might be used to determine change over time. For SAR05 and SAR06 which had the highest percentages of live maerl, a sample size of n=20 had 90% power to determine a change in the live maerl of ~14-15% cover respectively between two points in time, whilst n=10 would be able to confidently determine a change of ~20-22% respectively (Figure A5.2). The power analysis results based on the 2014 in situ assessments of live maerl at these sites were almost identical to those for the images analysis data, suggesting little difference in the power of either method of live maerl assessment to detect change.
At sites such as SAR01 and SAR02 with just 0-1% live maerl, a sample size of n=20 had 90% power to detect a change in cover of ~0.5% i.e. a 50% change, although with the data reliant on such small estimates by image analysts these lower estimates could be open to greater variation and would require careful assessment.
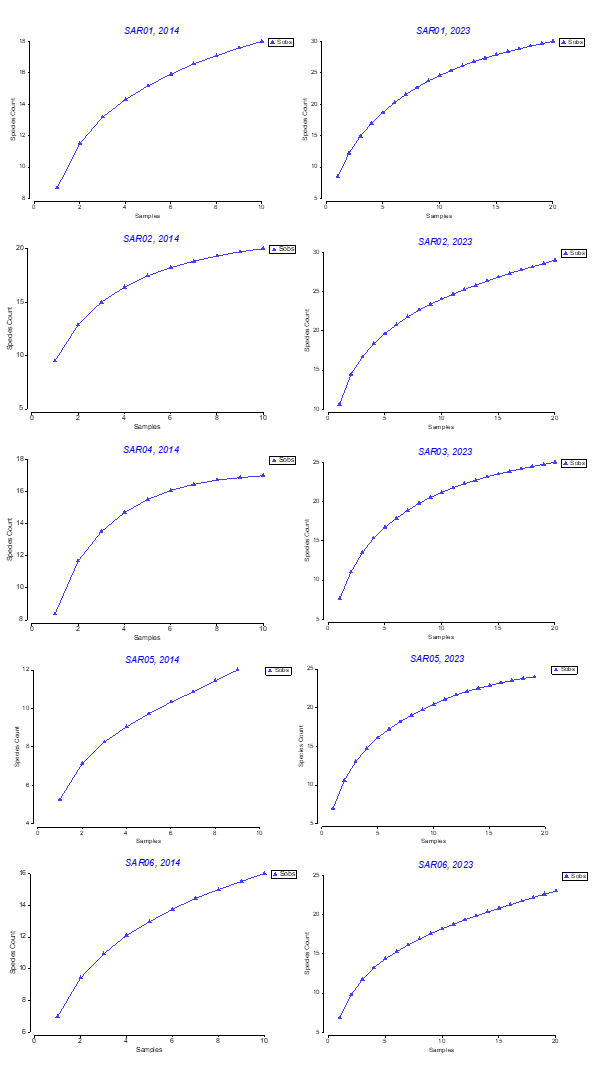
Figure A5.1. Species accumulation curves for quadrat image analysis at each site surveyed in 2014 (left) and 2023 (right).
Click for a full description
Species accumulation curves indicate that 25 samples were capturing the majority of species present within a study site in 2023 while the number of new taxa will be minimised when n > 20.
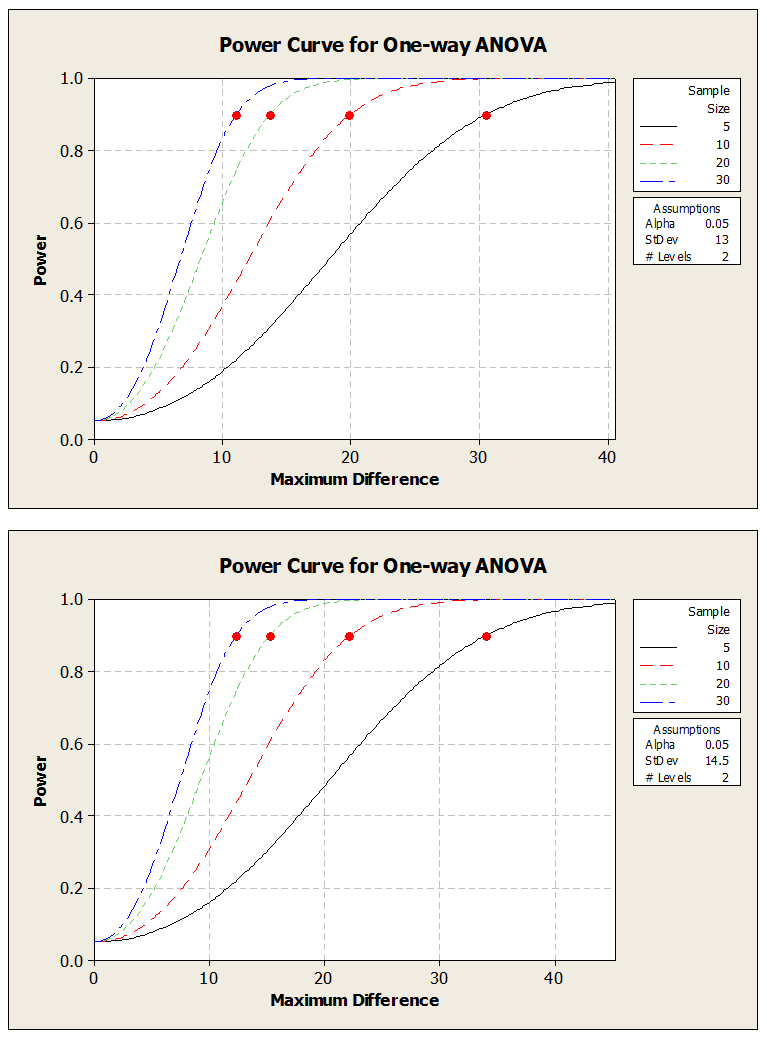
Figure A5.2. Retrospective ANOVA power analysis curves for % live maerl cover in quadrat images at sites SAR05 (top) and SAR06 (bottom).
Click for a full description
Retrospective power curves to determine what power any ANOVA statistical tests had to determine differences in the maerl percent cover for sites SAR05 and SAR06, the two sites with the highest live maerl fractions.
The data in the present study were used to generate Shannon diversity indices for individual quadrats at each survey station. Where data existed for both survey years at a survey station T-tests were used to determine whether there was a significant difference in the diversity indices obtained. There were significant differences in the mean diversity indices between 2014 and 2023 indices at SAR01, SAR02 and SAR05 (P<0.05); this result may have been influenced by the fact that the 2023 images were of ‘high’ quality and those from 2014 were ‘poor’ quality. At SAR06 there was no significant difference (T-test, T=0.60, df=22, P=0.556) and both sets of images were rated as ‘poor’ quality.
Minitab® was used to generate retrospective power curves to determine what power any ANOVA statistical tests had to determine differences in the Shannon diversity indices produced. The outputs based on data from the two sites with the highest live maerl fractions (SAR05 and SAR06) sites indicated that to determine a difference of 0.5 or less in the diversity indices with a power of at least 90%, more than 15-20 samples would be required - higher still if smaller differences needed to be determined (Figure A5.3).
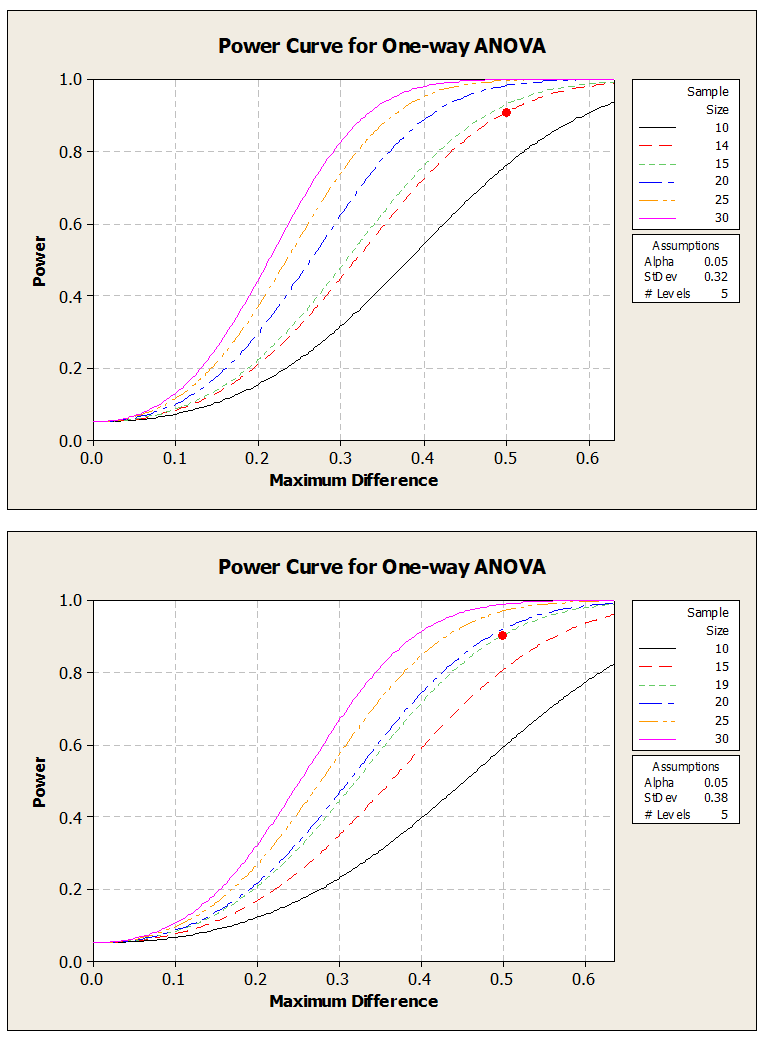
Figure A5.3. Retrospective ANOVA power analysis curves for Shannon diversity (H’Loge) scores of quadrats at sites SAR05 (top) and SAR06 (bottom).
Click for a full description
Retrospective power curves to determine what power any ANOVA statistical tests had to determine differences in the Shannon diversity indices produced were generated for sites SAR05 and SAR06, the two sites with the highest live maerl fractions. This indicated that to determine a difference of 0.5 or less in the diversity indices with a power of at least 90%, more than 15-20 samples would be required - higher still if smaller differences needed to be determined.
A further analysis for the seagrass shoot density at Whiting Bay (SAR07) based on the 2014 in situ data indicated that a sample size of n = 40 quadrats had 90 % power to confidently determine a 20 % change in shoot density between two sampling events. Over five sampling events, this level of replication would have 90 % power to determine ~25 % change in shoot density. The comparison made with the six in situ replicates in 2023 had < 30 % statistical power to confidently determine change and therefore a return to the original number of in situ replicate counts of n = 40 for seagrass shoot data is recommended.
Multivariate power analysis
The present study, where community data are derived from quadrat image analysis or in situ Phase II surveys, was designed to generate data which represent the maerl bed communities as a whole, rather than monitor changes in individual taxa. Multivariate analyses using ANOSIM are very powerful and capable of detecting statistically significant differences on spatial and temporal scales. At present however, there is no method for conducting a power analysis on multivariate tests. Anderson & Walsh (2013) demonstrated that ANOSIM is very sensitive to heterogeneity in the data and that the results basically tell us that some differences exist (be that in terms of location or time (differences in means) or dispersion (variances) or correlation (structure). This requires further investigation of the data in terms of SIMPER and/or BEST analyses, MDS ordinations or tests on community diversity parameters to understand the nature of such differences and whether they are 'real' or 'significant' ecological changes.
It is not uncommon for temperate marine communities to exhibit significant annual changes in species abundances while maintaining the core taxa comprising those communities. One such example is a series of long-term observations from the US east coast which noted that, despite year-on-year variation in abundance of component species, a change in the overall character of the study sites was not observed (Sebens, 1985, cited in Hartnoll (1998), Sebens (1985)). PERMANOVA tests are less sensitive to heterogeneity in the data but for relatively simple one-way analyses between years such as those undertaken in the present study, they will give very similar results to ANOSIM tests (Anderson et al., 2008). Therefore, in the present study the ANOSIM test has sufficient power to detect inter-annual differences in the maerl community data. Regular repetition of the survey work is required to provide a sound understanding of any inherent variation in the data, be that from natural changes or down to surveyor / methodological constraints; deviation from the known variation could then be considered of ecological significance. Based on our experience of long-term monitoring at other locations, it is likely that at least five years of regular surveys by experienced surveyors with rigorous quality assurance are required to provide some indication of this variation whilst adhering to strict monitoring protocols to avoid the issues of sampling variation.