The Proportion of Scotland's Protected Sites in Favourable Condition 2023
Published: May 2023
An Official Statistics Publication for Scotland
The diversity of Scotland’s biological and geological natural features is a particularly rich and valued natural resource. A series of nature conservation designations aim to protect the best examples nationally and internationally of the nation’s wildlife populations, habitats and earth science features, which include geological outcrops and landforms, fossil beds and caves:
- National: Site of Special Scientific Interest (SSSI);
- European: Special Area of Conservation (SAC) and Special Protection Area (SPA);
- International: Ramsar
In total these designations cover 1,881 sites protecting nature across Scotland, although some of their boundaries overlap. They host 5,591 designated natural features of which 5,365 have been assessed.
The figures presented here are correct as of 31st March 2023. Figures exclude offshore marine sites and features in Scotland beyond 12 nautical miles (NM). All candidate SACs are also excluded from these figures.
Assessment
The proportion of natural features in favourable condition on protected sites at 31st March 2023 was 76.4%. This figure comprises:
- Site Condition Monitoring (SCM) Condition Assessment – Favourable 65.2%
- SCM Condition Assessment – Unfavourable Recovering 6.4%
i.e. monitoring has detected signs of recovery but favourable condition has not been reached. - Unfavourable Recovering Due to Management Change 4.9%
i.e positive management is in place that is expected to improve the condition of the site but this has not yet been assessed on the ground.
The sum of these figures equals 76.5% rather than the headline 76.4% because of the rounding of these figures.
- Change (2022 - 23) - Decrease
- Long term trend (2005 - 23) - Increase
A difference of more than +/-1 percentage point from last year's figure suggests that the position is more likely to be changing than remaining stable.
Key points
- The proportion of features in favourable condition as measured by the indicator has decreased by 1.4 percentage point in the last year from 77.9% to 76.4%. The difference is not 1.5 percentage points due to rounding.
- This decrease is largely due to a larger than usual number of management actions expiring and the feature defaulting to unfavourable condition until it has been reassessed.
- The proportion of features in favourable condition as measured by the indicator has increased by 5.0 percentage points between 2005 and 2023 from 71.4% to 76.4%.
- The proportion of features in favourable condition as measured by the indicator has remained stable since the current protocols were put in in 2007 (0.4 percentage point increase from 76.0%)
- The proportion of features in favourable condition has decreased by 4.0 percentage points since 2016 when it peaked at 80.4%.
Evidence
The condition of the features on protected sites in Scotland is assessed by NatureScot’s Site Condition Monitoring (SCM) programme. NatureScot became the operating name of Scottish Natural Heritage with effect from August 2020. SCM is a rolling programme of monitoring which aims to asses s the condition of a sample of designated natural features each year and acts as a trigger mechanism for follow-up work when an unfavourable assessment is concluded.
Figure 1 indicates how the proportion of features in favourable condition has changed since the baseline was established in 2005. Where features have been found to be in unfavourable condition, remedial management measures are put in to place with the aim of improving them and progress is tracked according to methodologies established in 2007. The figures presented below are the latest assessment for all those features that have been assessed by 31st March of the relevant year.
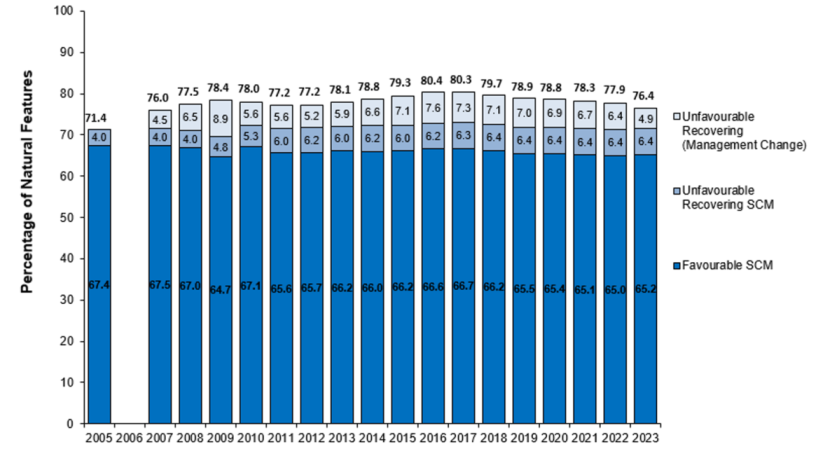
Figure 1. The Proportion of Features in Favourable Condition at 31st March 2023.
Click for a full description
Figure 1 indicates how the proportion of features in favourable condition has changed since the baseline was established in 2005. Assessments were not undertaken in 2006. For definitions of condition categories see 'Source data and updates' section. There are three favourable categories: assessed as favourable, assessed as unfavourable recovering, and unfavourable recovering due to management changes. The total proportion of features in favourable condition increases from 71.4% in 2005 to 78.4% in 2009. After this, it drops to 77.2% in 2010 and 2011 and then increases to its peak of 80.4% in 2016. Since then, the proportion of features in favourable condition has decreased to 76.4% in 2023.
Commentary
SCM is a rolling programme of monitoring and the proportion of natural features in favourable condition is dynamic. This movement reflects new condition assessments being completed as well as the implementation or cessation of remedial management activities, which can affect the categorisation of whether something is ‘unfavourable recovering due to management change’ (URDTM). The figures presented here are, therefore, a snapshot of the position at 31st March in the given year.
By 31st March 2023, of the 5,591 designated natural features on protected sites, the condition of 5,365 had been assessed and thus form the Official Statistic. As new SCM assessments are completed (either first or repeat assessments), they are used to update the proportion of features in favourable condition.
There is considerable variation in the proportion of natural features in favourable condition across the different natural feature categories, as can be seen in Table 1. A more detailed breakdown of the proportion of individual natural feature types in favourable condition within these categories is in Annex 1.
| Feature Category | Number of Features 2022 | Proportion Favourable 2022 | Number of Features 2023 | Proportion Favourable 2023 | Change in percentage points from 2022 to 2023 |
|---|---|---|---|---|---|
| Habitats | 2,444 | 77.6% | 2,443 | 75.1% | -2.5 |
| Species | 2,191 | 72.3% | 2,256 | 72.2% | -0.1 |
| Earth sciences | 666 | 96.8% | 666 | 95.6% | -1.2 |
| All Feature Types | 5,301 | 77.9% | 5,365 | 76.4% | -1.4 |
Since the last official statistic publication there have been 144 SCM feature assessments completed in 2022/23 and a number of Management Agreements/actions have come to an end (69 features) without a new assessment. In this scenario, the default is to return the condition to unfavourable until a new assessment is undertaken to determine if management action was successful. The feature condition can not be given a favourable status without a corresponding assessment which proves that this is the case. There has also been one correction. The changes in condition assessments as a result of this are summarised below.
- The improvement in the proportion of features in favourable condition is outweighed by the number of features deteriorating. The improvements come from: The condition of 12 natural features improved to favourable or recovering condition (however only 10 of those had an impact on the indicator, see below). These are made up of:
- 10 natural features, which were previously in unfavourable condition, were assessed as favourable through new SCM assessment. Natural feature types impacted: heath (4), grasslands (3), upland (1), Earth Science (1), and woodland (1).
- 2 natural features which were previously URDTM but have now been assessed as favourable through new SCM assessment. These have had no impact on the headline ‘Proportion of Features in Favourable Condition’ as both categories are considered to be in favourable condition for this purpose. However, they demonstrate that the remedial management at these sites have worked and the condition has improved. Natural feature types impacted: heath (1) and Earth Science (1).
- No natural features moved from unfavourable to URDTM. There are 262 natural features considered to be URDTM.
- A further 55 natural features were assessed for the first time and were found to be in favourable condition. Natural feature types impacted: birds (51), vascular plants (2), invertebrates (1), terrestrial mammals (1).
During the same period, the condition of 90 natural features deteriorated to unfavourable condition, made up of:
- 14 natural features which were previously in favourable condition but were assessed as unfavourable through new SCM assessment. Natural feature types impacted: woodlands (7), birds (2), earth sciences (2), grassland (2), heath (1).
- An additional feature condition (heath) has been corrected from previous reporting from favourable to unfavourable.
- 75 natural features which were previously in URDTM but are now reported as unfavourable:
- 6 were due to new assessments which have identified new additional pressures: upland (2), coastal (1), Earth Sciences (1), grasslands (1) and heath(1);
- 69 were due to expiration of management actions with a follow-up assessment yet to be conducted: heath (15), wetland (15), woodland (10), upland (8), Earth Science (6), vascular plants (5), birds(2), grasslands (4), freshwater (2) and non-vascular plants (2).
- A further 10 natural features were assessed for the first time and were found to be in unfavourable condition. These were all SPA or Ramsar bird features where the condition could be derived from corresponding feature data on an overlapping site. This new data allowed for an assessment against a baseline population to be completed.
47 features were assessed in 2022/23 and remain in an unchanged condition, made up of:
- 29 natural features continue to be assessed as favourable condition: earth science (11), upland (6), birds (4), heath (3), grasslands (2), woodlands (2), wetland (1).
- 18 natural features continue to be assessed as unfavourable condition: upland (5), woodlands (4), grasslands (3), heath (3), wetland (3).
Monitoring of bird features has been impacted by avian influenza in 2022 and 2023. A number of planned surveys have been cancelled as a result. However, the overall percentage of bird features in favourable condition has increased from 66.7% to 67.1%. This is primarily due to the completion of assessment reports from previous years’ data. It is expected that the effect of avian influenza will be detected in this statistic in future years.
The net effect is a 1.4 percentage point decrease in the proportion of natural features in favourable condition during the last year from 77.9% to 76.4%.
No On-Site Remedy
Amongst the unfavourable natural features there is a group where there are no pressures on the protected area itself, or nearby, and yet the feature remains unfavourable. There are, therefore, factors outwith local management control which are influencing condition. The majority of the 427 natural features which fall into this category are birds (399).
Sea bird populations (253) make up the largest proportion of these unfavourable bird natural features with no on-site remedy. The reasons for sea bird populations declining are thought to be due to changes in prey distribution and abundance rather than issues within the protected area itself. These changes in the distribution and abundance of prey are likely to be brought about by a combination of factors, including climate change and interactions with fisheries. The main other bird groups with no on-site remedy recorded are ducks, geese and swans (78); seaduck, divers and grebes (18); and waders (17).
There is no immediate action that can be taken to relieve these wider pressures on the protected area which are appropriate to support the natural feature concerned. Consequently, to align with United Kingdom Biodiversity Action Plan reporting, these natural features are considered favourable. In many cases the lack of detected on-site pressures indicates that within-site habitats meet the requirements of the species features they support. Working on this basis, the overall proportion of natural features in favourable condition rises from 76.4% to 84.4%.
Negative Influences
The most common negative influences (known as pressures) on natural features on protected sites that can affect condition can be seen in Figure 2. Individual natural features on a site may be adversely affected by one or more pressures.
Invasive species is the single biggest negative pressure on natural feature condition. The proportion is 21.1% of all negative pressures in 2022/23 and has remained almost constant at this level (within 1 percentage point) for a number of years. The species can be both native (e.g. bracken) and non-native (e.g. Rhododendron) species. Different natural feature types appear to be affected by different types of invasive species. For example, woodland and freshwater habitats are mainly adversely affected by non-native species such as Rhododendron or Japanese knotweed. Conversely, lowland grassland and coastal habitats are affected by the spread of invasive native species such as gorse, bracken and nettles.
Whether native or non-native, invasive species can have a detrimental effect on important habitats and the flora and fauna they support by competing for nutrients and light and ultimately changing the ecology of the habitat.
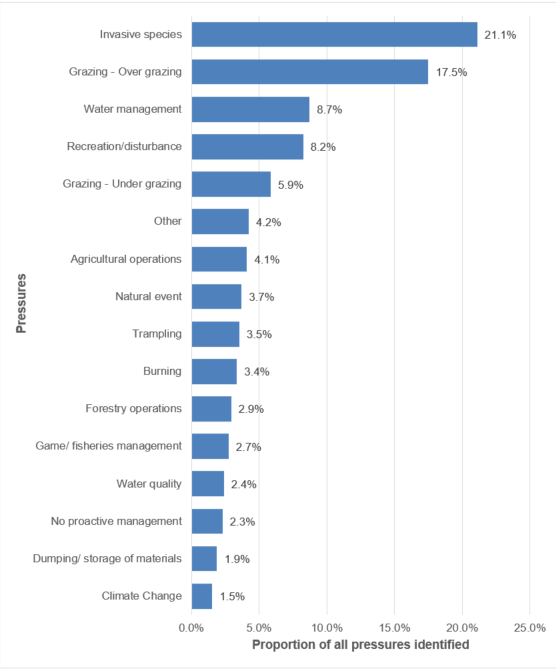
Figure 2. Summary of the main negative pressures on natural features on protected sites.
Click for a full description
Data correct as of 31st March 2023. Pressures are recorded for all natural features assessed in all conditions. Figure 2 only lists pressures where the proportion is greater than 1%. Invasive species is the most frequent pressure with this being 21.1% of all pressures identified, the second most frequent pressure is over-grazing (17.5%), and then water management (8.7%) , recreation / disturbance (8.2%), under-grazing (5.9%), other pressures (4.2%), agricultural operations (4.1%), natural event (3.7%), trampling (3.5%), burning (3.4%), forestry operations (2.9%), game / fisheries management (2.7%), water quality (2.4%), no protective management (2.3%), dumping / storing of materials (1.9%) and climate change (1.5%).
Source data and updates
To measure progress towards the Scottish Government target of maintaining the proportion of natural features in favourable condition, the following are taken into account:
- the results of SCM,
- actions that have been taken to put in place remedial management to improve the condition of the natural feature.
Where remedial management can be put in place on, or near the site, NatureScot staff and partner organisations engage with land managers and statutory bodies to identify and implement the appropriate measures to promote recovery. Such measures to date have included Forestry Grant Schemes, individual management agreements negotiated by NatureScot, and Scottish Rural Development Programme (SRDP) funding. Voluntary Control Agreements under the Deer (Scotland) Act 1996 have also been widely used to facilitate recovery of unfavourable features in upland areas.
For the purposes of the Official Statistic, ‘favourable condition’ includes natural features that are assessed through SCM as being in favourable or unfavourable recovering condition. It also includes previously unfavourable natural features where necessary management measures have been put in place since the last SCM assessment, so that in NatureScot’s expert judgment the natural feature will in due course reach favourable condition. This means that, as an interim measure, natural features where remedial management has been put in place to address all the known causes of unfavourable condition are counted as favourable. Once these management actions are concluded, the features condition will return to unfavourable, until a new assessment is undertaken to determine whether the management action was successful, or identifies further work which may be required to further improve condition. Such natural features are categorised as ‘unfavourable recovering due to management change’. Where a feature has been partially destroyed (e.g. through a housing development) the rest of the feature is assessed in its own right.
The 2005 SCM results set the baseline against which progress being made under the Protected Areas National Performance Indicator is measured.
The framework for making an SCM assessment is the Common Standards Monitoring Guidance, published by Joint Nature Conservation Committee (JNCC). This Guidance provides a common approach to the monitoring of natural features across the whole of the United Kingdom.
The SCM condition assessments are stored on a corporate database held by NatureScot and are combined with data on remedial management through the Remedies database to produce the overall Condition Target results. Access condition data for individual sites and features from the Sitelink website.
The proportion of protected sites in favourable condition will next be updated in 2024. Official Statistics are produced in accordance with the Code of Practice for Official Statistics.
| Habitats Natural Feature Type | Number of Natural Features | Proportion Favourable (%) | Change in Percentage Points from 2022 |
|---|---|---|---|
| Coastal | 335 | 86.3 | -0.3 |
| Freshwater | 223 | 74.0 | -0.9 |
| Grasslands | 222 | 70.3 | -1.8 |
| Heath | 380 | 75.0 | -3.7 |
| Marine | 103 | 96.1 | no change |
| Upland | 352 | 80.4 | -2.6 |
| Wetland | 345 | 78.6 | -4.3 |
| Woodlands | 483 | 59.4 | -3.4 |
| Habitats Total | 2,443 | 75.1 | -2.5 |
| Species Natural Feature Type | Number of Natural Features | Proportion Favourable (%) | Change in Percentage Points from 2022 |
|---|---|---|---|
| Amphibians | 12 | 83.3 | no change |
| Birds | 1,571 | 67.1 | +0.4 |
| Butterflies | 31 | 87.1 | no change |
| Dragonflies | 26 | 100.0 | no change |
| Fish | 46 | 80.4 | no change |
| Invertebrates | 182 | 85.2 | +0.1 |
| Marine Mammals | 29 | 58.6 | no change |
| Non-vascular Plants | 147 | 76.2 | -1.4 |
| Terrestrial Mammals | 52 | 88.5 | +0.3 |
| Vascular Plants | 160 | 90.6 | -3.1 |
| Species Total | 2,256 | 72.2 | -0.1 |
| Earth Science Natural Feature Type | Number of Natural Features | Proportion Favourable (%) | Change in Percentage Points from 2022 |
|---|---|---|---|
| Earth Science | 666 | 95.6 | -1.2 |
| Earth Science Total | 666 | 95.6 | -1.2 |
| Total Natural Feature Type | Number of Natural Features | Proportion Favourable (%) | Change in Percentage Points from 2022 |
|---|---|---|---|
| Total | 5,365 | 76.4 | -1.4 |