NatureScot Research Report 1382 - Understanding the need and value of land cover and habitat data
Published: 2025
Authors: Alma Economics and David Miller (James Hutton Institute)
Cite as: Alma Economics and Miller, D. 2025. Understanding the need and value of land cover and habitat data. NatureScot Research Report 1382.
Contents
- Keywords
- Background
- Main findings
- Introduction
- Understanding the uses of land cover and habitat data
- Understanding user needs
- Developing a framework for valuation
- Options for future provision
- References
- Appendix 1: Desk-based review methodology
- Appendix 2: Land cover and habitat datasets and attributes
- Appendix 3: Fieldwork methodology
-
Appendix 4: Interview terms of participation
- Project title: Understanding the need and value of land cover and habitat data
-
Privacy notice
- What is personal data?
- What personal data will you be collecting from me as part of this research?
- How will my data be stored, for which period, and who will have access to it?
- How will you use and in what form will you share my data?
- What are my rights regarding the data I provide?
- What if I have concerns about how my data is being handled?
- Participant consent form
-
Appendix 5: Survey privacy notice
-
Project title: Understanding the need and value of land cover and habitat data
- What is personal data?
- What personal data will you be collecting from me as part of this research?
- How will my data be stored, for which period, and who will have access to it?
- How will you use and in what form will you share my data?
- What are my rights regarding the data I provide?
- What if I have concerns about how my data is being handled?
-
Project title: Understanding the need and value of land cover and habitat data
- Appendix 6: Options for future provision
Keywords
land cover data; habitat data; data use; valuation; data users; recommendations
Background
Land cover and habitat data has seen a rapid expansion in its use across research areas and sectors. A growth in its use has come to underpin decision-making and analysis across the private and public sectors. Alma Economics was commissioned by NatureScot to understand the uses of land cover and habitat data in Scotland. It aimed to identify gaps, barriers, and unmet needs and generate insights that can support the development of future provision aligned with user requirements to keep pace with evolving needs.
Main findings
Understanding the uses of land cover and habitat data
The project began with a review of land cover and habitat data sources and their uses. This included identifying 24 core datasets in active use across Scotland, such as the Scotland Land Cover Map and the Habitat Map of Scotland, and identifying their key attributes, such as spatial resolution, update frequency, classification systems, and accessibility.
To better analyse the diverse ways in which this data is used, the project team developed a taxonomy of five primary use cases: Environmental Monitoring and Management, Spatial Planning and Policy, Scientific Research, Agriculture, Forestry, Urban and Infrastructure Development, and Others. Each category contains several subcategories, ranging from biodiversity conservation and climate impact assessment to urban planning and natural capital evaluation.
This taxonomy was applied to review recent academic and policy literature to identify recent uses of land cover and habitat data in areas such as scientific research, habitat monitoring, environmental modelling, and evidence-based policymaking.
Understanding user needs
Building on the desk-based insights, our qualitative fieldwork engaged stakeholders across Scotland (36 through in-depth interviews and 41 through an online survey) through surveys and interviews. These included data users and creators in government, academia, policy, local government, and the private sector. The fieldwork confirmed that land cover and habitat data is considered “essential” or “very important” for most users. The data is valuable for its use in monitoring, planning, and analysis in areas such as conservation, climate change, and spatial policy. The most valued features were comprehensive coverage of Scotland, data accuracy, and availability in appropriate formats. Conversely, real-time data was seen as less critical by most, though some monitoring applications did express a need for more frequent updates. Stakeholders highlighted the importance of high-quality data for building credible policy cases, influencing funding decisions, and designing effective, targeted interventions.
However, users also reported facing significant challenges in achieving their objectives—most notably around data accessibility, accuracy, and usability. While challenges and barriers varied by use case, difficulties experienced in finding and using data were a recurring theme. When data is outdated or inaccurate, it can undermine confidence and lead to missed opportunities—particularly in areas like climate change mitigation, ecosystem restoration, and biodiversity monitoring. Users without advanced technical skills—such as those outside academia or the public sector— often reported struggling with fragmented platforms, inconsistent metadata, and limited documentation. Many also cited the lack of clarity around update cycles and data validation, which weakened confidence in the data’s reliability.
Participants also stressed the need for better collaboration between data users and creators, with mechanisms for feedback, error reporting, and co-designing of tools and standards. User personas developed in this chapter illustrate how different types of professionals engage with the data and the specific barriers they face.
Valuing land cover and habitat data
To evaluate the impact of land cover and habitat data, the report introduces a novel valuation framework. Valuing land cover and habitat data is challenging as its benefits are mostly intangible, there is uncertainty over its uses, and a lack of standardised measures and methods to ascribe value.
The first step in the valuation of land cover and habitat data is to identify where the data is used and applied across sectors. Once the uses are mapped, the next step is to understand the kinds of benefits that flow from the use of the data. These drivers of value can be economic, environmental, or social. To operationalise these drivers through measurable quantities, we draw on two complementary measurement approaches. The first draws on use-based measures (focusing on efficiency, cost reduction, performance, and risk mitigation) and the other relies on attribute-based measures (based on the Q-FAIR framework, emphasising data quality, findability, accessibility, interoperability, and reusability). Depending on the use, availability, and context, the user can select the right set of metrics that can measure how the data generates value.
After defining appropriate metrics, we identified suitable methods that can be used to quantify the metrics. Four methods are found to be more suitable for this. These are evidence reviews to leverage existing knowledge, stated preference methods, including contingent valuation and expert elicitation, qualitative research, and counterfactual analysis, which explores what would happen in the absence of the data. The actual selection of methods is likely to involve more than one of these, as mixed methods research is more suited to valuations. To ensure the results are relevant for policy, a priority matrix can be constructed to assign weights to different use cases based on strategic goals or stakeholder preferences. The final step consolidates these weighted valuations to calculate a total value, aligning the assessment with decision-makers' priorities and enabling informed resource allocation and planning.
Options for future provision
The final section of the report draws on stakeholder recommendations to outline options to improve the provision, governance, and accessibility of land cover and habitat data in Scotland. We provide actionable recommendations for improving Scotland’s land cover and habitat data infrastructure, organised around the Q-FAIR framework.
Quality:
Improving the quality of land cover and habitat data is a key priority for users. The provision of additional documentation, including on the sources of data, its processing, and validation, is an important area of improvement. Stakeholders also emphasised the need for better spatial and temporal resolution, comprehensive national coverage, and improved classification consistency. Technological advancements, such as LiDAR, 3D mapping, and AI-driven classification, are seen as opportunities to enhance data accuracy. Additionally, systematic validation through ground-truthing and improved monitoring of habitat condition would enhance trust and usability.
Findability:
To improve findability, stakeholders strongly advocated for a centralised data platform that would serve as a one-stop resource for accessing, exploring, and understanding land cover and habitat data. While there are existing platforms that attempt to do this, they could benefit from better signposting, enhanced information, and more accessible use. It would ensure consistency, reduce duplication of effort, and improve accessibility for all users across different sectors.
Accessibility:
Ensuring open or low-cost access to land cover and habitat data is crucial, particularly for small businesses, start-ups, and independent researchers. While large institutions often have access through agreements, broader accessibility would support innovation and collaboration. Additionally, training and capacity building are essential to enable non-specialists to use the data effectively.
Interoperability and reusability:
To promote better data integration, recommendations include the standardisation of classification systems, the development of crosswalk tables, and improved linkages between datasets. A unified approach to data formatting and classification would enhance reusability and reduce fragmentation. Stakeholders also stressed the importance of collaboration among data creators to align standards and improve the consistency, accessibility, and cost-effectiveness of land cover and habitat data across sectors.
Conclusion
This report provides a comprehensive overview of the current landscape, uses, and value of land cover and habitat data in Scotland. Through an extensive desk-based review and in-depth stakeholder engagement, we identified the diverse and growing importance of this data across sectors and the critical role it plays in informing policy, conservation, and land management decisions. By developing a novel valuation framework and proposing user-driven recommendations under the Q-FAIR model, the report offers practical pathways to enhance the quality, accessibility, and relevance of this data. Implementing these options will not only strengthen data usability and integration across expanding use cases, but also ensure that Scotland’s environmental decision-making is underpinned by high-quality, reliable, and future-ready information.
Introduction
Background and policy context
Scotland’s landscapes are varied and ever-changing, encompassing woodlands, wetlands, farmland, and urban environments. Understanding changes in land cover and habitats is essential for effective environmental management, biodiversity conservation, and policy development, with high-quality land cover and habitat data making this possible. Land cover and habitat data detail the physical characteristics of the Earth's surface, including vegetation types, water bodies, urban areas, and specific wildlife habitats. It provides a crucial foundation for evidence-based decision-making in areas such as spatial planning, biodiversity and conservation, climate resilience, and sustainable land use.
NatureScot, Scotland's nature agency, provides and maintains data to protect, restore, and value nature, with a focus on reversing biodiversity loss and achieving net-zero carbon emissions by 2045. This aligns with the Scottish Government’s Scottish Biodiversity Strategy, which sets out a clear ambition for Scotland to be Nature Positive by 2030 and to have restored and regenerated biodiversity across the country by 2045.
This project was commissioned by NatureScot to support the development of future strategies for habitat and land cover data. It seeks to assess data needs, identify gaps, and understand the value this data creates across sectors. We use the insights from our report to suggest options that can shape the future of the provision of land cover and habitat data to keep pace with evolving user needs, new technologies, and emerging land-use policies. This report presents the findings of the project and contributes to NatureScot’s efforts to ensure future solutions, decisions, and practices are grounded in the best available data.
Scope of this report
This project was commissioned by NatureScot to develop a comprehensive framework to understand and assess the needs and value of land cover and habitat data in Scotland. The key aims of this project were to:
- Identify data needs and gaps in land cover and habitat data.
- Understand the value that these data create across sectors.
- Provide options for future provision of this data.
Report structure
This report provides the results of our analysis to respond to these aims. Through a desk-based review and extensive and in-depth stakeholder engagement, we outline the need for and value of land cover and habitat data in Scotland. We explore the uses and users of this data through the available evidence, identifying the use cases (A use case refers to a specific application or scenario where data is utilised to achieve a particular objective, for instance, for analysis or decision-making). It defines the purpose, users, and processing of the data. of land cover and habitat data. We use these to develop a taxonomy that can describe and categorise how the data is used and use it to structure our analysis. We highlight the challenges and barriers faced by the users and report suggestions for improvement. We also develop a novel valuation framework to assess the value of land cover and habitat data.
This report consists of four chapters:
- In Chapter 1, we present findings from a desk-based review that identified the key land cover and habitat datasets in use and their uses in the literature. We use this to develop a taxonomy of use cases, categorising how land cover and habitat data are currently used across sectors.
- Chapter 2 builds on the review by engaging directly with data users through in-depth qualitative fieldwork, identifying key insights, and developing user personas that reflect the diverse range of stakeholders who rely on this information.
- To assess the economic and social value of land cover and habitat data, Chapter 3 develops a valuation framework, with a step-by-step description of the process.
- Finally, Chapter 4 provides options for future provision of this data, outlining suggestions made by stakeholders to enhance the provision, accessibility, and usability of land cover and habitat data to better serve Scotland’s environmental and policy needs.
By bringing together these perspectives, this report aims to support NatureScot and other stakeholders in ensuring that land cover and habitat data are fit for purpose, widely accessible, and effectively contribute to Scotland’s environmental and sustainability goals.
Understanding the uses of land cover and habitat data
Desk-based review
The key challenge in understanding the need and value of land cover data lies in the lack of clarity regarding its current usage, accessibility, and real-world applications. Without a comprehensive view of how different sectors interact with this data, it becomes difficult to assess its true impact and identify gaps or inefficiencies. Furthermore, inconsistencies in how the data is accessed and applied across various use cases can lead to fragmented decision-making and missed opportunities for improvement.
Addressing this challenge requires a structured approach to mapping out existing data practices, ensuring that future improvements in data collection and dissemination are well-aligned with actual user needs. We do this through a structured desk-based review that can establish a clear and comprehensive view of the uses of land cover data. The desk-based review examines academic literature and identifies available data sources and their applications. Our review focuses on the most recent research outputs to provide a view of the latest uses of land cover and habitat data. With rapid changes in how the data is used and processed, our review focused its attention on the latest literature to capture the “state-of-the-art” in the technology and methods used for this data.
In addition, we build on the uses identified to develop a taxonomy of use cases, ensuring that the variety in the uses of land cover data can be systematically categorised. A taxonomy that can capture the existing and future uses of land cover and habitat data is a useful tool in analysing how the data generates value for its users across sectors. For the purpose of this report, the taxonomy also creates a robust framework that structures the subsequent phases of qualitative research and analysis.
Our approach to this desk-based review followed the following stages:
- Identifying the land cover and habitat data sets in use in Scotland.
- Developing a comprehensive taxonomy of use cases, validated through engagement with experts and stakeholders.
- Reviewing the most recent academic and grey literature that uses land cover and habitat data, applying our taxonomy to organise the evidence.
In the following sections, we present the process and outputs from each of these stages in detail.
Identifying land cover and habitat datasets
The first stage of the desk-based review identified the most commonly used land cover and habitat datasets in Scotland. This was done through a review of publicly available databases, guided by expert inputs. Our review identified a total of 25 datasets. We list these in the Appendix with details on the publication date, license, spatial resolution (size of ground area that each pixel represents), contextual (thematic) resolution, temporal resolution (frequency in which data is captured), and spectral resolution (level of light reflection across the electromagnetic spectrum), where available. The datasets identified include the Scotland Land Cover Map (NatureScot/Space Intelligence SLAM Map), UKCEH Land Cover Maps, the Habitat Map of Scotland, and the Ordnance Survey National Geographic database, among others. For each of these, we collect metadata on the latest versions or iterations that were accessible in the public domain.
There are key dimensions of the data directly impacting the use of these land cover and habitat datasets. We compile data on these dimensions in the table. This includes a broad range of habitat and landcover classifications such as forest, grassland, crops, bare cover, built-up cover, snow/ice, structure and composition of species, and habitat components, among others. The spatial resolution was another key dimension, which was found to be variable, and ranges from 10m to 1000m. The dimension of temporal resolution found ranged from daily, weekly, monthly, or annually. Some other datasets have had limited updates or have no updates planned, such as the Scotland Land Cover Map (NatureScot/Space Intelligence SLAM Map) and the Land Cover of Scotland 1988. The spectral resolution predominantly found ranged from visible light to near infrared. We provide detailed information for the examined datasets in Appendix 2.
A taxonomy for landcover and habitat data use cases
Our review of the datasets provided information on how this data is being used in policy and literature. We classify these uses into use cases, outlining how the data is used by various sectors. These use case categories help us organise the evidence, and this forms the core of the taxonomy developed. The five main categories of use cases are:
- Environmental monitoring and management: Land cover and habitat data are crucial in environmental monitoring and management, providing essential insights for assessing and quantifying an activity's environmental impact. This includes assessment of climate change impact, as changes in land cover data caused by deforestation, urban expansion, and desertification influence carbon sequestration and greenhouse gas emissions. It contributes to the assessment of an area's biodiversity and the effectiveness of conservation efforts. This data is used in ecosystem service assessment to identify and value the benefits people derive from ecosystems. In addition, this data is also used to analyse the transformation of the natural environment due to human activities.
- Spatial planning and policy: Land cover and habitat data are essential for spatial planning and policy development, providing critical insights for various policy decisions, such as land use planning, including an assessment of natural capital, risk assessment and disaster management, land designations, and Environmental Impact Assessments (EIA).
- Scientific research: Land cover and habitat data are used in various scientific research, especially ecologically related research (e.g., including landscape, soils, waters), remote sensing and in spatial modelling, human health and wellbeing, and natural capital assessments, which aim to better understand, measure, and value the human interdependencies on nature.
- Agriculture, forestry, and urban and infrastructure development: Land cover and habitat data are used in sectoral inventories, agricultural land management, forest management and expansion, urban planning and development, infrastructure development, and other related tasks. Using this data, policymakers can balance economic growth with environmental conservation, ensuring a sustainable future.
- Others: Besides the above, land cover and habitat data have other uses; for instance, they are also used in public engagement and knowledge exchange on topics that intersect with land cover or uses.
This taxonomy helps us identify the uses and users of land cover and habitat data for Scotland. We develop these further, informed by expert inputs and further review of the available evidence, to identify subcategories within each of the wider use cases. We list the use case categories and associated subcategories in the following table:
| Category | Subcategory |
|---|---|
| 1. Environmental Monitoring and Management | 1.1 Climate change impact assessment |
| - | 1.2 Biodiversity assessment and conservation |
| - | 1.3 Ecosystem services assessment |
| - | 1.4 Land use change analysis |
| - | 1.5 Other environmental monitoring and management |
| 2. Spatial Planning and Policy | 2.1 Land use planning |
| - | 2.2 Policy development and implementation |
| - | 2.3 Risk assessment and disaster management |
| - | 2.4 Land designation |
| - | 2.5 Governance and management (including environmental impact assessments) |
| - | 2.6 Other spatial planning and policy |
| 3. Scientific Research | 3.1 Ecologically related research |
| - | 3.2 Monitoring and measurement methods (e.g., remote sensing, spatial modelling) |
| - | 3.3 Natural capital assessments |
| - | 3.4 Other scientific research |
| 4. Agriculture, Forestry, and Urban and Infrastructure Development | 4.1 Agricultural land management |
| - | 4.2 Forest management and expansion |
| - | 4.3 Urban planning and development |
| - | 4.4 Infrastructure development |
| - | 4.5 Other AFUID (including inventories) |
| 5. Others | For instance: |
| - | Coastal-specific pressures (e.g., estuaries, sandbanks, mudflats). |
| - | Regarding transport (e.g., ferries, leisure craft, aquaculture, renewable energy). |
| - | Public engagement and knowledge exchange on topics that intersect with land cover or uses. |
While this taxonomy provides a categorisation of the uses, there is likely to be varying degrees of overlap between specific use cases. For instance, agriculture and land use can be mapped to multiple categories. It features as a prominent item in research, with significant support from the Scottish government. Similarly, while natural capital assessments have been classified under Scientific Research due to recent developments in their methodology, they can also be classed under Spatial Planning and Policy to accommodate the policy-oriented uses of the tools.
Literature on land cover and habitat
The final stage of the desk-based review examined the available evidence from both academic and grey (or policy) sources to examine how land cover and habitat data are used. We present the method used for the desk-based review, including the criteria used to create a short list of studies, in Appendix 1.
Our initial search yielded a long list of 230 papers. We applied the inclusion-exclusion pathways to screen these papers. Focusing on the most current evidence, the final short list had 27 papers (26 academic and one grey) that met the full set of inclusion criteria and were reviewed in detail. We extracted relevant information from these and identified the use case categories emerging in the papers. We found that the included papers used exactly ten of the datasets we identified in the previous stage. (Our review of evidence highlighted one additional land cover dataset that was not found in our initial review—the EUNIS land cover data Scotland used mainly for ecological and conservation purposes, containing information on species, habitat types, and protected sites across Europe). In this section, we briefly present the major findings retrieved from the literature review for each of the use case categories, outlining how land cover and habitat data are used in recent research.
Environmental monitoring and management
The use cases that exist in the literature in environmental monitoring and management are abundant, being the category with the highest number of papers covering it (12). In addition, the most covered subcategory was biodiversity conservation. One of these papers dealt with the secondary use case subcategory of ecosystem services assessment, and two papers focused on land use change analysis.
The academic research focused on assessments of animal habits (e.g., birds) (Brighton et al. 2024; Robinson et al. 2023; Fielding, Anderson, Barlow, Benn, Reid, et al. 2024; Fielding, Anderson, Barlow, Benn, Chandler, et al. 2024; Cristofaro et al. 2024; McIntosh et al. 2024; Cushman et al. 2024), ecological monitoring of ecosystems and species (Dugdale, Malcolm, and Hannah 2024; Barton et al. 2023), and carbon sink assessments for voluntary markets (Li and Martino 2024). One study focused on animal nutrient quantification (Ferraro and Hirst 2024) and another focused on climate change impacts (Dugdale, Malcolm, and Hannah 2024).
In terms of the grey literature, our review included one policy paper that focused on natural capital market assessments (Scottish Government 2024).
Spatial planning and policy
Three of the included papers were found to primarily deal with spatial planning and policy. Of these, one dealt with the subcategory of risk assessment and disaster management, another with other spatial planning and policy, and the remaining one focused on land use planning and spatial planning, with risk assessment and disaster management as secondary categories and subcategories, respectively. These papers deal with the topics of moorland burning spatial evaluation (Shewring et al. 2024), analyse rewilding (O’Connell and Prudhomme 2024), and flood management assessment (Peskett et al. 2023).
Scientific research
The number of papers focusing on scientific research was relatively high (nine), making it the second most prevalent use category. The most common subcategory was “ecological research”. Other use case subcategories, like natural capital assessments, impacts of climate change and other scientific research, were also identified. Furthermore, two papers focused on monitoring and measurement methods (e.g., remote sensing, spatial modelling); one of these two additionally looked at natural capital assessments.
The papers focused on assessments of soil and land (Mahmood et al. 2024; Wiltshire et al. 2023; Barnett et al. 2024; Khan et al. 2023), spatial resolution modelling (Riley, Mouat, and Shucksmith 2024), species distribution modelling (Cushman et al. 2024(a); Cushman et al. 2024(b); Ozsanlav-Harris et al. 2024), and climate change analysis (Spracklen and Spracklen 2023).
Agriculture, forestry, and urban and infrastructure development
Three papers included in the review were found to address the use category of agriculture, forestry, and urban and infrastructure development. These papers focused on agricultural land management, urban planning and development, and forest management and expansion. The themes included crop analysis (Upcott et al. 2023), urban climate mitigation analysis (Ananyeva and Emmanuel 2023), and woodland expansion (Newey et al. 2024).
Discussion
In this chapter, we aimed to organise and synthesise existing land cover and habitat data resources in Scotland. We developed a use case taxonomy, a valuable output that provides a structured understanding of how this data is utilised. This taxonomy serves as a foundational tool for evaluating the needs and value of land cover and habitat data, guiding subsequent project phases.
We compiled a list of 25 commonly used datasets, analysing their key dimensions to identify similarities and differences. The evidence review revealed practical applications of land cover and habitat data, primarily within academic contexts. Recognising the potential bias towards academic usage in our initial data collection, we expanded our research in the next phase. In the following chapter, we collect data from a wider range of stakeholders in the land cover and habitat data ecosystem in Scotland to build a more comprehensive picture of how the data is used.
Understanding user needs
Fieldwork insights
This chapter presents the findings of the primary fieldwork conducted for this research. The aims of this fieldwork were to develop a detailed understanding of:
- The needs and value of land cover and habitat data for its users in Scotland.
- The key barriers, challenges, and data gaps faced by users.
- Steps or actions in relation to future provision of land cover and habitat data in order to better meet user needs.
These insights drew on evidence from mixed-method research with diverse stakeholders, including data collected through an online survey and in-depth interviews. The following table provides a detailed breakdown of the number of interview and survey participants engaged per use case.
| Use case | Interview participants | Survey participants |
|---|---|---|
| Environmental monitoring and management | 15 | 15 |
| Spatial planning and policy | 6 | 5 |
| Scientific research | 6 | 11 |
| Agriculture, forestry, and urban and infrastructure development | 6 | 5 |
| Other | 3 | 5 |
| Total | 36 | 41 |
We recognise that that there may be a degree of overlap between interview and survey participants. Given the wide circulation and anonymised nature of the survey, individual respondents cannot be identified. Our complete fieldwork methodology and the accompanying fieldwork materials (interview terms of participation and survey privacy notice) can be found in the appendices D and E.
The chapter begins by presenting the overarching findings from this fieldwork, before discussing insights according to the five use case categories. This section then presents insights from data creators, followed by a discussion on future considerations for land cover and habitat data in Scotland.
User personas: To support the findings of our research, we supplement our analysis with user personas for each use case. User personas are hypothetical representations of real-world users, designed to capture the needs, challenges, and behaviours of different stakeholder groups. We developed user personas based on insights from the survey and interviews with data creators and users. Each user persona draws on a distinct use case, illustrating roles and background, as well as key datasets used, barriers faced, and recommendations for improvement. They are aimed at providing the reader with a hypothetical, but tangible, case study to better understand how the data are used.
Key findings
We built on the taxonomy developed in the previous chapter, organising the data collected by use case category. There were large areas of overlap in the views of stakeholders, with some insights spanning multiple use cases. We identified the key findings and present them in this section. We provide an overview of the current users of land cover and habitat data before introducing quantitative and qualitative insights on the value, barriers, and challenges to the use of these datasets.
Users of land cover and habitat data
We applied our taxonomy of use cases for land cover and habitat data to identify the stakeholders whom we engaged. This comprised 77 stakeholders through in-depth interviews (n=36) and an online survey (n=41). The breakdown of participants by use case category and engagement type is presented in Figure 1 below. Further information about our methodology and participant demographics can also be found in Appendix 3.
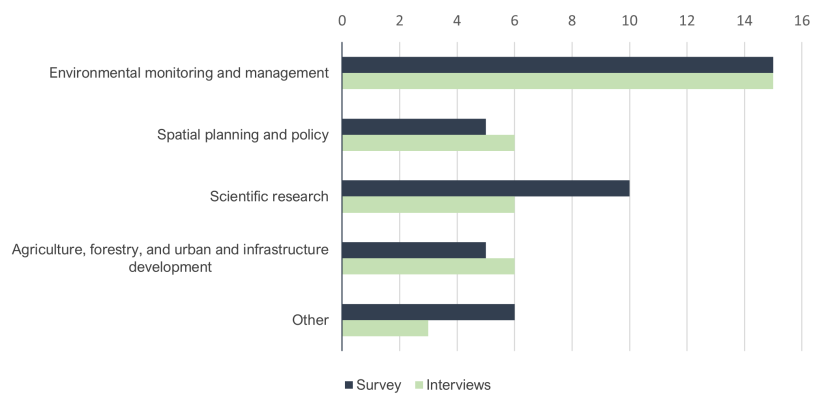
Figure 1. Respondents by use case category
Click for a full description
Bar chart comparing the number of responses from surveys and interviews across five categories: Environmental Monitoring and Management, Spatial Planning and Policy, Scientific Research, Agriculture, Forestry, and Urban and Infrastructure Development, and Other. Environmental Monitoring and Management had the most responses.
It should be noted that, in practice, participants may use land cover and habitat data for multiple use cases; in these instances, participants were assigned a primary and secondary use case, and qualitative insights for both use cases were cross-referenced to ensure alignment with the use case and avoid duplication.
Value and use of land cover and habitat data
Our stakeholder engagement assessed the overall value of these datasets across the different use case categories. As shown in Figure 2, survey respondents were asked to share how often they use land cover and habitat data in their role, ranging from ‘Never’ to ‘Always’. The largest proportion of respondents (37%) used these datasets ‘Sometimes (up to 50% of the time)’. The share of those who used them ‘Often (up to 75% of the time)’ was 22%, and ‘Always’ was 20%. This suggests that land cover and habitat data are an important part of the roles of a majority of the survey respondents.
The majority of these respondents (80%) used data catalogues or portals to find and access land cover and habitat data (Including spatialdata.gov.scot, opendata.nature.scot, environment.gov.scot, and remotesensingdata.gov.scot). Other data sources included undisclosed internal or local authority data platforms.
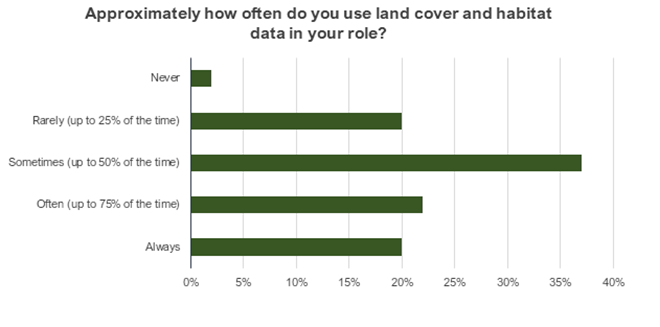
Figure 2. Respondent frequency of using land cover and habitat data
Click for a full description
Horizontal bar chart showing the frequency of land cover and habitat data use. Response options included Never (approximately 2%), Rarely (approximately 20%), Sometimes (approximately 38%), Often (approximately 22%), and Always (approximately 20%).
Survey respondents were also asked how important access to land cover and habitat is for their work (Figure 3). The majority of respondents (59%) said that these datasets are ‘Very important’, aligning with the qualitative findings from interview participants. This was followed by those who categorised these datasets as ‘Essential (I cannot do my job without land cover and habitat data)’, at 32%.
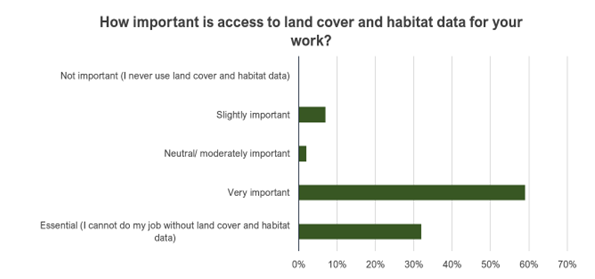
Figure 3. Importance of land cover and habitat data
Click for a full description
Horizontal bar chart showing the importance of access to land cover and habitat data. Categories range from 'Not important' to 'Essential'. The 'Very important' category has the highest response rate.
In order to better understand which technical and accessibility features were most (and least) valuable to data users, survey respondents were asked to individually score 14 features from ‘Essential’ to ‘Not important’ (Figure 4). Most features were considered either ‘Essential’ or ‘Very important’ by respondents, with ‘Comprehensive coverage of Scotland’ and ‘Data accuracy’ both considered either ‘Essential’ or ‘Very important’ by 95% of respondents. This was closely followed by ‘Data is available in an appropriate format’ (90%) and ‘Level of spatial resolution’ (88%).
The most valuable features for respondents were ‘Comprehensive coverage of Scotland’ and ‘Data accuracy’, both described as ‘Essential’ by 51% of respondents. This was followed by ‘Data is available in an appropriate format’ and ‘Open access’, both described as ‘Essential’ by 46% of respondents. Other ‘Essential’ features included ‘Comprehensive coverage of different habitat and land cover types’ (42%), ‘Availability of documentation and user guidance for data (including metadata)’ (39%), and ‘Ability to download a copy of the data’ (39%). The feature that users thought was least important was ‘Real time or near-real time data’, with 44% of respondents suggesting this was either ‘Not important’ or ‘Slightly important’.
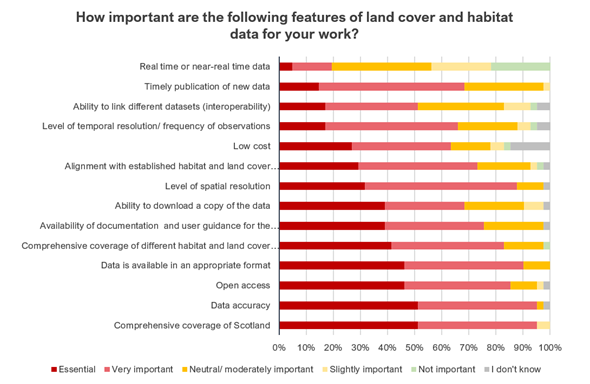
Figure 4. Importance of land cover and habitat data by feature
Click for a full description
Stacked horizontal bar chart showing the importance of different features of land cover and habitat data for users. Features include real-time data, timely publication, interoperability, temporal resolution, low cost, alignment with established data, spatial resolution, downloadability, documentation, comprehensive coverage, appropriate format, open access, data accuracy, and comprehensive coverage of Scotland. Importance levels are rated as Essential, Very important, Neutral/Moderately important, Slightly important, Not important, and I don't know. Data accuracy and comprehensive coverage of Scotland are rated as the most important features.
Qualitative insights from both the survey and interviews showed similar findings. Land cover and habitat data were regularly described as “essential” and a “non-negotiable requirement” for the work conducted by current users. In particular, these datasets were considered critical for making informed and effective decisions in multiple scenarios, including policymaking, restoration or conservation efforts, and climate change mitigation. The quality of these datasets underpins the credibility and impact of the resulting policy and interventions, which was considered particularly important when competing against other major policy priorities.
Similarly, qualitative insights regarding the value of specific technical and accessibility features also reflected the survey results. Characteristics described as particularly important included geographical scope, data accuracy, high spatial resolution, and easily downloadable datasets. Participants also discussed other valuable features not listed in the survey. For example, while real time or near-real time data was not considered very important by most survey or interview participants (although this did vary by use case), the latter suggested that reliable update schedules (even if infrequent) are important for planning research, policy, monitoring, and evaluation. Other additions included repeatability and consistency (for example, methodologies or classifications) for both comparing against earlier datasets and integrating updated data.
Further qualitative insights on the value and features of land cover and habitat data are discussed in greater detail for each use case in the following sections.
Barriers and challenges to data use
Our fieldwork explored the main barriers and challenges faced by stakeholders when finding, accessing, and using land cover and habitat data. In the survey, respondents were asked to what extent they felt that land cover and habitat data met their needs in relation to 14 features, ranging from ‘Meets all of my needs’ to ‘Does not meet my needs’ (Figure 5).
The features that respondents reported as most strongly meeting ‘all’ or ‘most’ of their needs were ‘Data is available in an appropriate format’ (63%), ‘Open access’ (56%), and ‘Comprehensive coverage of Scotland’ (49%). Contrastingly, the features that most strongly met ‘few’ or ‘none’ of respondents’ needs were ‘Real time or near-real time data’ (32%), ‘Level of temporal resolution/frequency of observations’ (24%), and ‘Timely publication of data’ (24%).
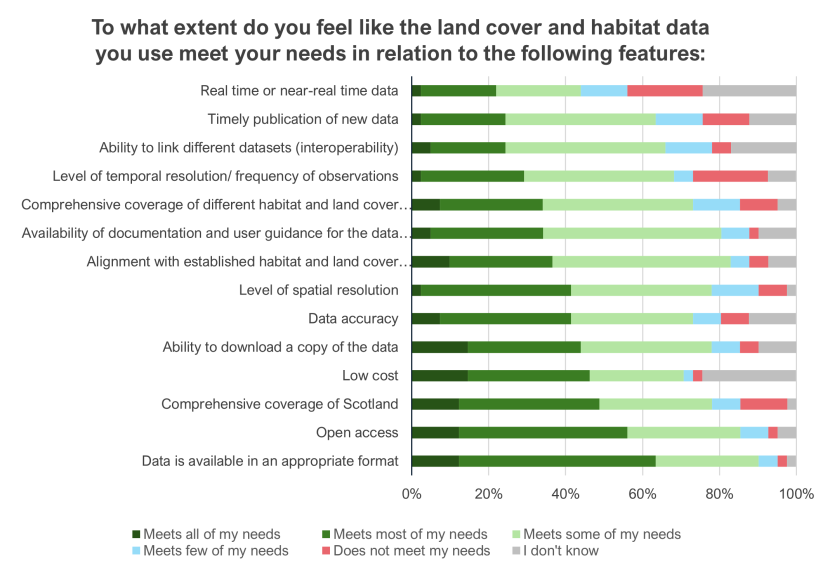
Figure 5. Satisfaction with land cover and habitat data by feature
Click for a full description
Stacked horizontal bar chart showing user satisfaction with land cover and habitat data features. Features include real-time data, timely publication, interoperability, temporal resolution, comprehensive coverage, documentation, alignment, spatial resolution, data accuracy, downloadability, low cost, comprehensive coverage of Scotland, open access, and appropriate format. Satisfaction levels range from 'Meets all of my needs' to 'Does not meet my needs' and 'I don't know'. Most users report that data accuracy and format meet their needs, while real-time data and timely publication have lower satisfaction rates.
While these insights are, on the whole, reflected in the qualitative findings, they also highlighted important nuances. For example, while ‘low cost’ was not a barrier for individual users working in public sector bodies or universities, perhaps explaining the high percentage of survey respondents responding ‘I don’t know’ for this feature (24%), this presented a greater barrier for those using land cover and habitat data for commercial or independent purposes. Similarly, the need for ‘Real time or near-real time data’ was significantly more important for participants who used land cover and habitat data for monitoring, reporting, or policymaking purposes, particularly if their observations related to time-sensitive or fast-changing phenomena (such as pollution events). Satisfaction with the coverage of Scotland was similarly nuanced and particularly affected those seeking data on rural or island areas. Other participants also expressed differing degrees of satisfaction with the level of temporal and spatial resolution for habitat data compared to land cover data, with users more frequently describing gaps in habitat data (for instance, on habitat condition or type).
Qualitative findings also identified a number of novel challenges faced by users of land cover and habitat data. For example, many participants expressed that the primary barrier they faced was not insufficient data, but the ability to find it, access it, interpret it, and use it correctly. As one participant noted, making data open access does not mean it is necessarily accessible to users, particularly for those with less technical skill sets. This challenge was shared by data creators, and both groups stressed the importance of comprehensive metadata, which includes information on data origins, dates, limitations, features mapped, assumptions, latest updates, and data validation to support the sensible use of datasets.
Other participants also raised concerns about incomplete, inconsistent, or missing data, insufficient feedback loops between data creators and users, and the lack of sector-wide strategies regarding the generation of new data, the storage of existing datasets, and interoperability between datasets across related sectors.
A comprehensive summary of our fieldwork findings relating to the uses of land cover and habitat data, as well as the value, barriers, and challenges of these datasets, can be found in the following sections. These are presented by use case category and include additional recommendations proposed by users to improve the usability of land cover and habitat data. Findings specific to data creators and future considerations can be found at the end of this chapter.
Insights by use case
In the following section, we present qualitative insights according to each individual use case. Our interviews were focused on developing a detailed understanding of how stakeholders use the data, and the importance this holds for their work. Based on these discussions, we assigned the users to up to two relevant use case categories and outlined the insights on their uses of land cover and habitat data, the value and importance of these datasets for their work, the barriers and challenges they face as users, and their recommendations for future improvements to land cover and habitat data. We supplemented each use case with two user personas, providing an archetype of the users who engage with data. These are intended to give the reader a more tangible construct of the types of users for each use case.
1. Environmental monitoring and management
This use case includes five (5) distinct subcategories:
- Climate change impact assessment
- Biodiversity assessment and conservation
- Ecosystem services assessment
- Land use change analysis
- Other environmental monitoring and management
In total, Environmental Monitoring and Management was identified as the primary use case for 15 interview participants and 15 survey respondents.
Use of land cover and habitat data
The focus of roles within this use case spanned biodiversity conservation or restoration, ecosystem health, land use, climate change, and natural capital through data analysis, policy support, and project management. Responsibilities primarily included modelling, monitoring, management, and reporting—often against national and international targets. The spatial scales at which participants used the data ranged from fine-scale analysis (i.e., plot or within field) to national-level assessments, requiring land cover and habitat data that function at multiple spatial resolutions to suit these purposes. Combined, these roles contribute to managing protected areas, restoring ecosystems, and ensuring nature’s role in climate mitigation and adaptation is effectively measured and embedded into decision-making.
Value of land cover and habitat data
Land cover and habitat data were regularly described as “essential” for their work, particularly for users who are unable to go on-site. For example, participants described these datasets as “absolutely critical” for informed and effective decision-making. Most notably, they underpin evidence used to influence ministerial decisions regarding policy and expenditure. Participants indicated that low-quality or missing land cover and habitat data will impact the strength of evidence produced, which could, in turn, undermine its credibility, lower ministerial confidence, and negatively impact the effectiveness of advice or interventions (such as conservation or restoration efforts). As one participant noted, this is particularly impactful given environmental monitoring and management initiatives are often competing for budget against other major policy priorities, such as energy fuels or carbon capture, which often present “well-organised and data-backed proposals”.
Relatedly, land cover and habitat data were also described as important for enabling the creation of robust baselines used for reporting against targets and commitments, such as Scotland’s Biodiversity Strategy 2022-2045. As described by one data user:
“If we don’t have good information, then it’s kind of a finger in the air at best”.
Participants described a variety of technical and accessibility features as being key for their work. For example, while open-access data was considered important, it did not often impact participants, as many could access data through their organisation or institution, as a majority of them had university or public sector links. Data being easily downloadable was described as a priority during the interviews. Participants listed a number of important technical features, such as:
- Complete geographical coverage across Scotland, including adequate coverage of different land cover and habitat types.
- Granularity, accuracy, and spatial resolution. User needs here vary, with users looking for data that can answer specific research questions. For example, one participant described their need for habitat data to be at a resolution of EUNIS Level 4/ Annex I habitat level, or it would be “meaningless”, while others reported no issue with the resolution.
- Up-to-date data that is reliably updated according to its uses is considered particularly important for management, monitoring, and reporting.
- Repeatability and the ability to view earlier datasets for comparison purposes (reflecting the focus on “change” over the next 20+ years).
- Consistency in habitat classifications, with EUNIS being preferred amongst participants to align data with European studies and apply international best practices in Scotland.
The absence of high-quality land cover and habitat data was considered most detrimental to making a strong political and financial case for nature. Without timely, robust, and accurate evidence, participants described missing “critical opportunities” to influence ministerial decisions and drive meaningful action.
Barriers and challenges faced by users
Consistency
Participants reported facing a variety of barriers and challenges when using land cover and habitat data. Users highlighted inconsistent, incomplete, or missing data as a significant challenge, affecting both specific land cover and habitat types as well as geographical coverage across Scotland. For example, one participant noted that although Scotland is entirely covered by the Scotland Habitat and Land Cover Map – 2022 (Space Intelligence), this is only classified to EUNIS Level 2, which limits its usefulness. Similarly, particular habitats were considered underrepresented in the data, including peatland, bog, salt marshes, and other coastal, freshwater, grassland, and upland habitats. The absence creates confusion among users in determining whether these habitats are absent, misclassified, or simply missing due to incomplete data.
Accuracy
Another barrier included the accuracy of data (for example, due to incorrectly logged data or low spatial resolution), with one participant noting that balancing accuracy (through high-resolution data) with cost-effectiveness is an ongoing challenge.
Level of detail
The level of detail was described as particularly important for small-scale monitoring and management efforts (such as conservation), which require precise mapping to ensure interventions are informed, targeted, and effective.
Interoperability
Lack of interoperability and compatibility between datasets was also described as a challenge by participants. This posed a barrier when making comparisons across time (for example, due to changes in methodology or misaligned classifications) and across other datasets (including with the UK, Europe, and other sectors, such as agriculture and renewable energy). According to some participants, aligning datasets to enable effective data linking increases the value of existing data and reduces the need for generating new datasets.
Other challenges included:
- Out-of-date data (for example, due to bottlenecks caused by data flow).
- Locating the most suitable (and accessible) datasets for their needs.
- Identifying the reliability and quality of individual datasets (for example, in the absence of comprehensive metadata).
- Bureaucracy to access datasets.
Recommendations for improvements
In response to these barriers and challenges, and reflecting the key features described, participants shared recommendations for how land cover and habitat data could be improved to better meet their needs. These included:
- Combining data generation techniques to improve accuracy, timeliness, and spatial resolution. This will consequently ensure datasets are meaningful for multiple users while also helping to reduce costs. The “best datasets” were described as a combination of automated, manual, and ground truthing methodologies (with the Raised Bog Inventory highlighted as an example of good practice. The inventory has a habitat mapping for 476 raised bog sites across Scotland, derived from aerial photo interpretation (API) and field surveys by the Scottish Wildlife Trust and NatureScot, created and updated between 2023 and 2024). While limited resources across the public sector require innovation, new technologies should be leveraged alongside other, complementary approaches.
- Developing one centralised, open-access, and nationally-endorsed platform, which consolidates all available (and approved) datasets and facilitates analysis. Participants within this use case noted that, overall, there was sufficient data available, but primarily, users struggled to identify appropriate and high-quality datasets. Important features included the ability to layer data, access to tools and models, and standardisation of formats so datasets could be packaged coherently. While similar platforms might be created for specific projects, participants called for one centralised platform to avoid unnecessary repetition. This, along with access to open data that does not rely on institutional access can help realise its benefits and encourage innovation.
- Improved collaboration and coordination between stakeholders. This was described as important at multiple levels, including: (i) between data creators/hosts and users through improved feedback mechanisms to improve validation and accuracy (for example, embedding the ability to feed in corrections or allowing ‘ground-truthed’ data to be uploaded. Ground truthing is the process of verifying and validating remotely sensed data, such as satellite images, aerial photographs, or LiDAR scans, by comparing it with real-world observations collected directly from the field), (ii) across Scottish public sector bodies (for example, through live data-sharing), and (iii) across sectors to facilitate cross-sector collaboration, set standards, and integrate datasets (for example, through sector working groups).
User personas
The following section presents the personas of two potential users of land cover and habitat data in this use case. One is a climate change officer, while the other is a project manager in the public sector, each using a variety of datasets for their roles.
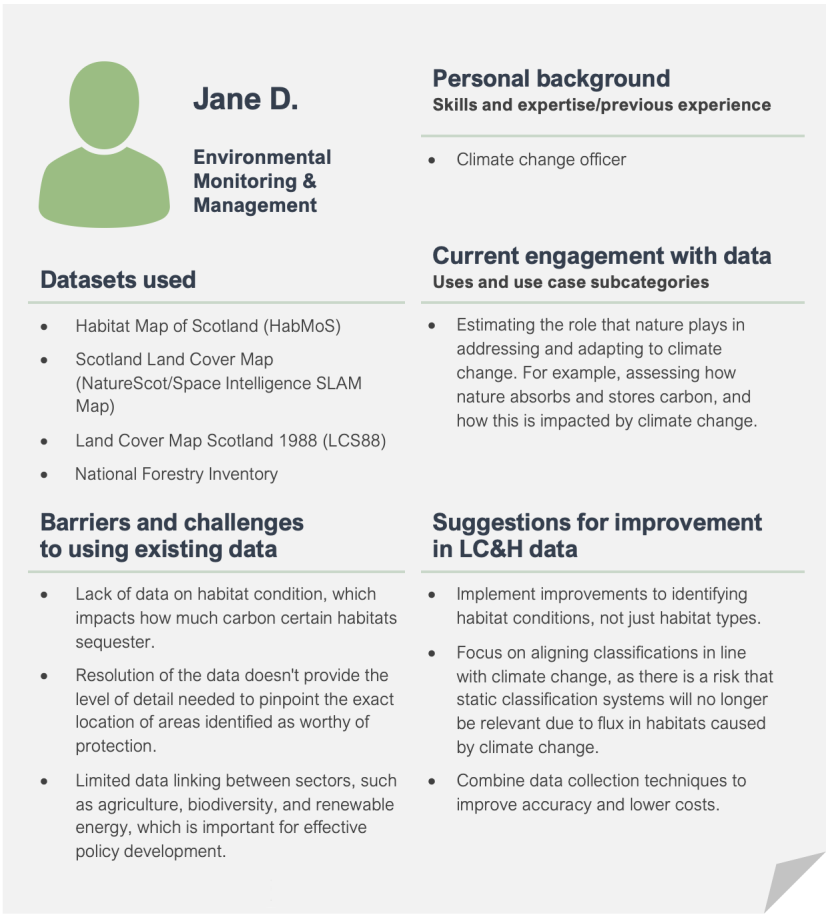
Figure 6. User persona 1: Environmental Monitoring and Management – Climate Change Officer
Click for a full description
User persona: Jane D. in Environmental Monitoring & Management. The left section lists datasets used: Habitat Map of Scotland (HabMoS), Scotland Land Cover Map (NatureScot/Space Intelligence SLAM Map), Land Cover Map Scotland 1988 (LCS88), and National Forestry Inventory. Barriers and challenges include: lack of data on habitat condition affecting carbon sequestration estimates, insufficient resolution to pinpoint protected areas, and limited data linking between sectors like agriculture, biodiversity, and renewable energy. The right section outlines Jane’s background (climate change officer), current engagement (estimating nature’s role in addressing and adapting to climate change, such as carbon absorption and storage), and suggestions for improvement: better identification of habitat conditions, aligning classifications with climate change impacts, and combining data collection techniques to improve accuracy and reduce costs. The layout includes a generic avatar illustration and uses green lines to separate sections.
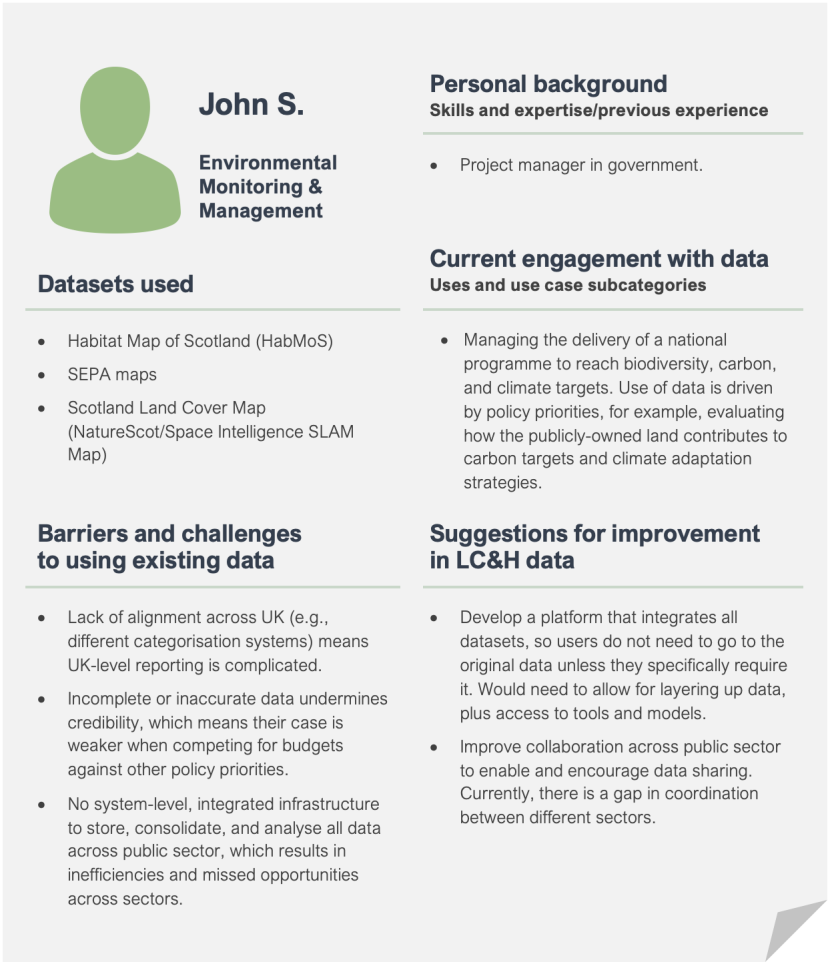
Figure 7. User persona 2: Environmental Monitoring and Management – Project Manager in Government
Click for a full description
User persona: John S. in Environmental Monitoring & Management. The left section lists datasets used: Habitat Map of Scotland (HabMoS), SEPA maps, and Scotland Land Cover Map (NatureScot/Space Intelligence SLAM Map). Barriers and challenges include: lack of alignment across the UK due to different categorisation systems complicating UK-level reporting, incomplete or inaccurate data undermining credibility and weakening cases for funding, and absence of a system-level integrated infrastructure for storing, consolidating, and analysing public sector data, leading to inefficiencies and missed opportunities. The right section details John’s background (government project manager), current engagement (managing a national programme to achieve biodiversity, carbon, and climate targets, using data to evaluate policy priorities such as land contributions to carbon targets), and suggestions for improvement: develop a platform integrating all datasets for easier access and layering, and improve public sector collaboration to encourage data sharing and coordination. The layout features a generic avatar illustration and uses green lines to separate sections.
2. Spatial planning and policy
This use case includes six (6) distinct sub-categories:
- Land use planning
- Policy development and implementation
- Risk assessment and disaster management
- Land designation
- Governance and management
- Other spatial planning and policy
In total, spatial planning and policy were identified as the primary use case for five interview participants and five survey respondents.
Use of land cover and habitat data
The scope of work within this use case covered urban development and planning, land management, policy implementation, and habitat assessment. Responsibilities of users included reviewing planning applications, assessing environmental impacts of new developments on protected areas, supporting biodiversity action plans, verifying subsidy claims related to land use, and conducting fire risk assessments. Furthermore, some of these participants also collaborated with local authorities and relevant stakeholders to provide legislative guidance, assist with community-led green initiatives, and oversee biodiversity reporting. The range of activities in which users engaged varied from detailed site-level assessments to broader nationwide habitat monitoring, using multi-scale spatial data to support decision-making. Land cover and habitat data were viewed as important in assessing habitat conditions, mapping urban green spaces and blue-green network assets, designating protected areas, and prioritising conservation actions, while ensuring policy and planning decisions are well-informed and environmentally sound.
Value of land cover and habitat data
Users emphasised the importance of data reliability for policy and spatial planning, highlighting the need to understand the source and currency of datasets to ensure decision-making is based on robust, up-to-date data. As described by one participant, this is crucial given that:
“Land cover/use/habitats maps are a non-negotiable requirement for land-based work […] their accuracy has a cascading effect on all work based on them.”
Beyond this, they identified several technical and accessibility factors as key to the usefulness of land cover and habitat data.
- Firstly, participants stressed the importance of accessible and user-friendly datasets, with a strong view that land cover and habitat data should be open access and easy to use for a range of users, including professionals with little to no specialised geospatial training (e.g., consultant ecologists).
- Secondly, comprehensive coverage of Scotland, including all major land cover and habitat types, is seen as essential.
- Accuracy and resolution were particularly important aspects for high-quality data. The impact of resolution varies depending on the objective and scale of work. While broad datasets can support strategic decision-making, more granular data is necessary for site-specific assessments, often requiring geospatial expertise. For instance, one interview participant mentioned satellite data is valuable for large-scale applications, such as council-level planning or assessing total woodland area, however, it lacks the sufficient detail for estate-level decision-making, where more precise data is needed.
- The standardisation of data formats was another recurring concern, as inconsistencies could make datasets harder to integrate into workflows.
Participants noted that outdated, low-resolution, or inaccessible datasets can result in decisions driven by financial considerations rather than evidence, prioritising cost savings over nature-related benefits. Users also mentioned that the lack of solid data for policymakers weakens the case for environmental initiatives, reducing their chances of securing funding or approval.
Barriers and challenges faced by users
Accuracy
Participants highlighted several challenges in using land cover and habitat data, primarily concerning accuracy. One key issue is the lack of detailed data, which complicates land identification and assessment, particularly when land use has changed over time and datasets have not been updated. Several participants highlighted that accuracy is crucial when distinguishing protected habitats such as woodlands and peatlands, while others also mentioned that data can be patchy and inconsistent in urban areas and often misrepresent features (e.g., categorise cemeteries as blanket bogs). As a result, site visits are often needed to verify on-the-ground conditions. Additionally, participants noted the absence of a streamlined process for reporting or correcting inaccuracies. Feedback mechanisms can often be unclear or overly complex. Addressing these issues could improve the usability and credibility of land cover and habitat data in policy and planning.
Currency
Concerns were also raised about the lack of clarity regarding how up-to-date the datasets are. For instance, some maps on platforms such as Scotland’s Environment Web lack timestamps, making it difficult to determine their relevance. This presents challenges in tracking environmental changes and assessing policy impacts. Additionally, urban development and regeneration occur rapidly, but mapping does not always capture these changes.
Other barriers flagged by respondents for this use case included:
- Inconsistent habitat data collection across Scotland, leading to a fragmented data environment.
- Technical difficulties with classification, categorisation, and matching of datasets due to the absence of agreed standards.
- Challenges in accessing detailed, nationwide habitat data due to legal restrictions or incomplete coverage.
- Limited technical expertise, particularly in GIS, among some users.
- Lack of datasets linking habitat condition with agricultural data, which hinders cross-sectoral analysis and decision-making.
Recommendations for improvements
As a result of these barriers, participants offered insights and recommendations on how to improve the quality, accessibility, and usability of land cover and habitat data, thereby enhancing its effectiveness for policy and spatial planning users. Among the recommendations are:
- Leveraging technology advancements to enhance dataset quality, consistency, and accessibility, and ensure they are regularly updated (e.g., annually). By employing advanced tools, including satellite imagery, the verification of land cover and habitat data was said to become more efficient. Additionally, participants suggested promoting greater sector-wide knowledge and increasing private sector involvement in developing new technologies and apps for more accurate and timely data analysis.
- Creating standards that provide participants with all relevant information to fully understand datasets, addressing their need for detailed metadata, methodology guidance, and clear details on data sources, collection methods, and updates. Standardised categorisation, consistent coverage across Scotland, and the inclusion of indicators of habitat quality and condition should also be considered to improve dataset quality.
- Enhance data accessibility and usability by developing a user-friendly platform that centralises all available datasets,ensuring they are easy to explore, understand, and utilise. Participants suggested that data should be open-access or low-cost, with clear metadata, attribution, and copyright information. Users also indicated this platform should allow users to interact with and visualise datasets directly, rather than solely relying on raw downloads, and include pre-configured interfaces for seamless integration with GIS tools. Additionally, datasets should be easily downloadable in common formats (e.g., .shp files).
- Establishing a clear mechanism for reporting errors and requesting dataset updates, with realistic timelines for changes. Participants suggested encouraging collaboration and contributions from external data providers to improve accuracy and address gaps in technical expertise to make datasets more accessible to a broader audience.
User personas
The following section presents the personas of two potential users of land cover and habitat data: an agricultural analyst and a policy advisor, both working in spatial planning and policy within the government.

Figure 8. User persona 3: Spatial Planning and Policy – Project Manager in Government
Click for a full description
User persona: Robert J. in Spatial Planning and Policy. The left side lists datasets used: Habitat Map of Scotland (HabMoS) and Scotland Land Cover Map (NatureScot/Space Intelligence SLAM Map). Barriers and challenges include: lack of high accuracy in datasets, insufficient information on update frequency, and difficulty assessing policy impacts when data is not regularly updated. The right-side details Robert’s background (expertise in agricultural chemistry, mapping services, and policy analysis in a public body), current engagement (assessing impacts of new developments on protected habitats for Environmental Impact Assessment), and suggestions for improvement: periodically updating datasets and creating a clear error reporting mechanism for inaccuracies. The layout uses red lines to separate sections and includes a generic avatar illustration.
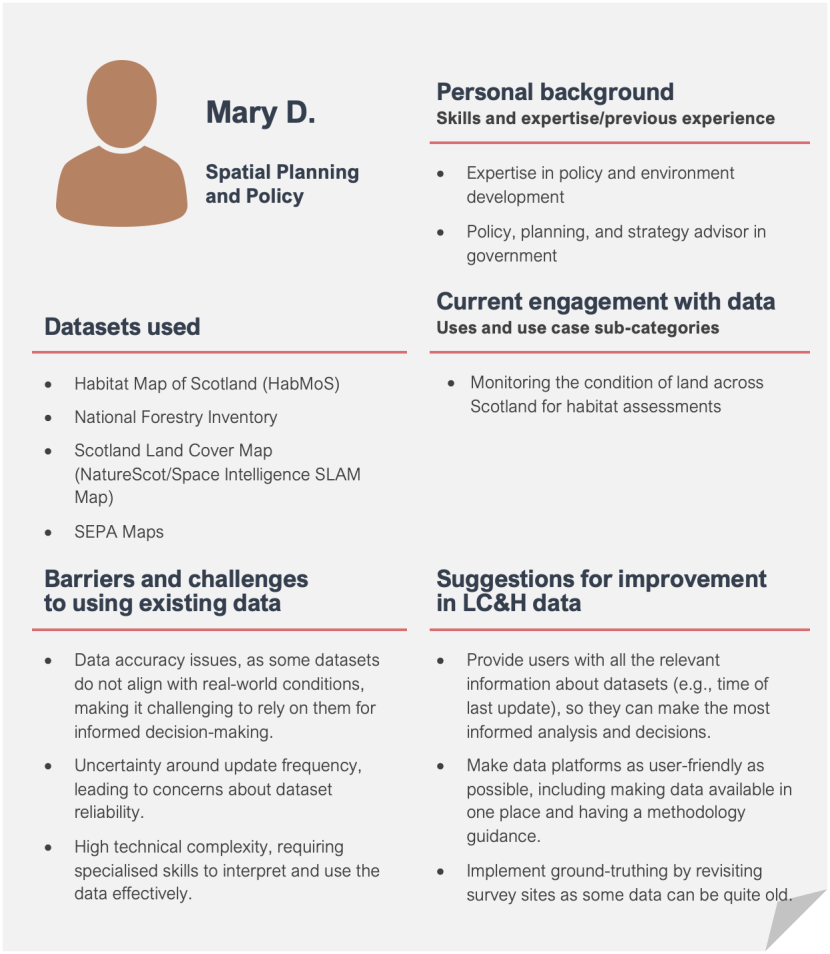
Figure 9. User persona 4: Spatial Planning and Policy – Policy and environmental development
Click for a full description
User persona: Mary D. in Spatial Planning and Policy. The left side lists datasets used: Habitat Map of Scotland (HabMoS), National Forestry Inventory, Scotland Land Cover Map (NatureScot/Space Intelligence SLAM Map), and SEPA Maps. Barriers and challenges include: data accuracy issues, uncertainty around update frequency, and high technical complexity requiring specialized skills. The right-side details Mary’s background (expertise in policy and environment development, advisor in government), current engagement (monitoring land condition across Scotland for habitat assessments), and suggestions for improvement: provide full dataset information, make platforms user-friendly, and implement ground-truthing by revisiting survey sites. The layout uses red lines to separate sections and includes a generic avatar illustration.
3. Scientific research
This use case includes four (4) distinct subcategories:
- Ecologically-related research
- Monitoring and measurement methods (e.g., remote sensing, spatial modelling)
- Natural capital assessments
- Other scientific research
In total, scientific research was identified as the primary use case for six interview participants and 11 survey respondents.
Use of land cover and habitat data
While some participants were solely involved in research projects, many roles within this use case focused on informing policy and decision-making, particularly in natural capital, ecosystem services, and climate change adaptation. Research areas include soil health, carbon sequestration, diffuse pollution, and ecological networks and involved developing spatial models, monitoring environmental changes, leveraging participatory research, and assessing land use scenarios under climate change. The purpose of these roles included providing support to local authorities, directing private investment in nature restoration, embedding natural capital in policy and decision-making, and evaluating the use of public land for climate and nature-related purposes.
Value of land cover and habitat data
High-quality, credible land cover and habitat data were described as a “non-negotiable requirement” for the work conducted by participants in this use case. Participants were particularly interested in land cover and habitat data specific to Scotland’s geography, land cover and habitat types, and land use patterns (such as crofting tenure). While robust data was quoted as a reliable alternative to expert opinion, inaccuracies have a cascading negative impact on all resulting outputs. Participants listed a variety of accessibility and technical features as crucial for their work.
Transparency and accessibility
Transparency about the origins of each individual dataset was described as essential to establish a degree of trust in the data itself. This could include publishing taxonomies, enabling access to the dataset validation statistics or raw validation points, including documentation on how datasets were created, or providing a quality assessment. Other valued accessibility features included open-access data, which is easily downloadable and provided in appropriate formats (for example, for use in pre-existing statistical workflows or aligning classifications with the type of analysis required).
Other technical considerations included:
- Data accuracy (including reliability of accuracy).
- Appropriate resolution for the research question being asked (for example, analysis of urban areas requires higher spatial resolution).
- Comprehensive geographical coverage of Scotland (particularly for research conducted at a national level and to ensure consistency in future updates).
- Regular and reliable updates to enable research to be planned around data availability.
- Interoperability between scales (for example, compatibility between data products at national-level and site-level).
The absence of high-quality land cover and habitat data was reported to negatively impact the ease-of-use of datasets, requiring users to address misalignments, artefacts, and inconsistencies. Moreover, participants also described missed opportunities concerning the practical application of land cover and habitat data, for example, to monitor the impact of research programmes or positively influence strategic land use planning and local development planning decisions by local authorities.
Barriers and challenges faced by users
Currency and accuracy
Barriers and challenges faced by participants were mostly similar to other use cases. For example, the timeliness and accuracy of data were found to impact the extent to which change achieved by research projects (such as restoration) can be evidenced, in turn making it harder for researchers and other stakeholders to demonstrate the value of these efforts (and consequently, the value of the land cover and habitat data that underpins them). While data collected on the ground was widely considered the most accurate, it was said to require more resources (time and expenses) compared to other manual or automated methods.
Navigating and selecting datasets
Participants also expressed difficulties selecting the appropriate datasets for their needs, caused by the “overwhelming flood” of available data. As described by one participant:
“Knowledge of what’s out there, what is suitable for the task in hand, and having the right access privileges can be a challenge.”
Some participants quoted notable differences in the mapping of habitats between maps (such as the Scotland Habitat and Land Cover Map – 2022 (Space Intelligence) and UKCEH Land Cover Maps). Others also mentioned uncertainty when deciding between newly released or well-established datasets (for example, using HabMoS or more recent national habitat maps). This challenge is exacerbated by a lack of robust metadata (including data origins, dates, limitations, features mapped, assumptions, and latest updates) alongside “clear, actionable information” to support users in using the data effectively and meaningfully.
Data granularity and categorisation
Inaccurate, incomplete, or limited categorisations were also raised as a challenge for participants, with granularity considered particularly important. For example, one participant described the numerous factors involved when looking at land (including land cover, soil type, and elevation) and the resolution lost when these factors are “boxed” into categories. Similarly, the lack of granularity in land use change data was particularly impactful for Scotland’s rural local authorities, where land use emissions make up a significant proportion of their inventory.
Other notable challenges included:
- Incomplete coverage of suitable accuracy, both for Scotland and for specific habitat types (such as bracken).
- Trade-offs between technical dimensions (for example, high spatial resolution, but low classification detail).
- Information on data limitations, including access to validation data.
- Access to localised (specific) datasets that have not been published.
- Interoperability and harmonisation of different datasets for combined analysis (including handling spatial and classification discrepancies).
Recommendations for improvements
Participants discussed a number of recommendations to improve the usability and value of land cover and habitat data, including:
- Adopting centralised solutions to common user challenges to standardise the quality of, and guidance about, datasets. Some participants called for a set of nationally-approved data products, integrated within one centralised platform. This includes developing comprehensive, Scotland-specific guidance to support users in deciding which dataset they should use to answer their research questions, including the most reliable datasets, alongside their strengths and limitations. Other respondents suggested combining existing and new large-scale datasets to produce a single, dynamic map of Scotland, which could be annually updated.
- Ensuring that metadata is comprehensive and robust for all datasets, including information on data origins, dates, limitations, features mapped, assumptions, and latest updates, as well as information on data validation. High quality metadata was said to be important both to enhance usability and increase trust in the data itself; for example, where datasets have “hidden” models, users do not have direct access to the assumptions and methodologies underpinning it, which can in turn make it difficult to understand the data at a granular level.
- Developing metrics and baselines to facilitate monitoring and evaluation efforts. This is important for various research scenarios that require reliable metrics to assess intervention impacts. Participants referred to government-backed biodiversity metrics to deliver against biodiversity outcome requirements or a national environmental census to evaluate the extent and condition of habitats. It was noted that the need for metrics will increase as private and public sector nature-related risks and dependency disclosure grows and becomes more central to policy and decision-making.
- Unifying nature-related strategies at a national level across all relevant sectors, rather than partitioning nature (for example, through separate agricultural, rural, and climate change strategies). Linking strategies for these sectors would ensure that stakeholders can identify interventions that benefit multiple aspects of nature, such as biodiversity, soil health, adaptation, and mitigation; to achieve this, however, stakeholders should not work in siloes and must have visibility of other dimensions of nature. This includes unifying important subcomponents, which facilitate interoperability, such as standardising classification systems.
User personas
We present personas of two potential users of land cover and habitat data who are engaged in scientific research and provide insights into their experience of using the data.
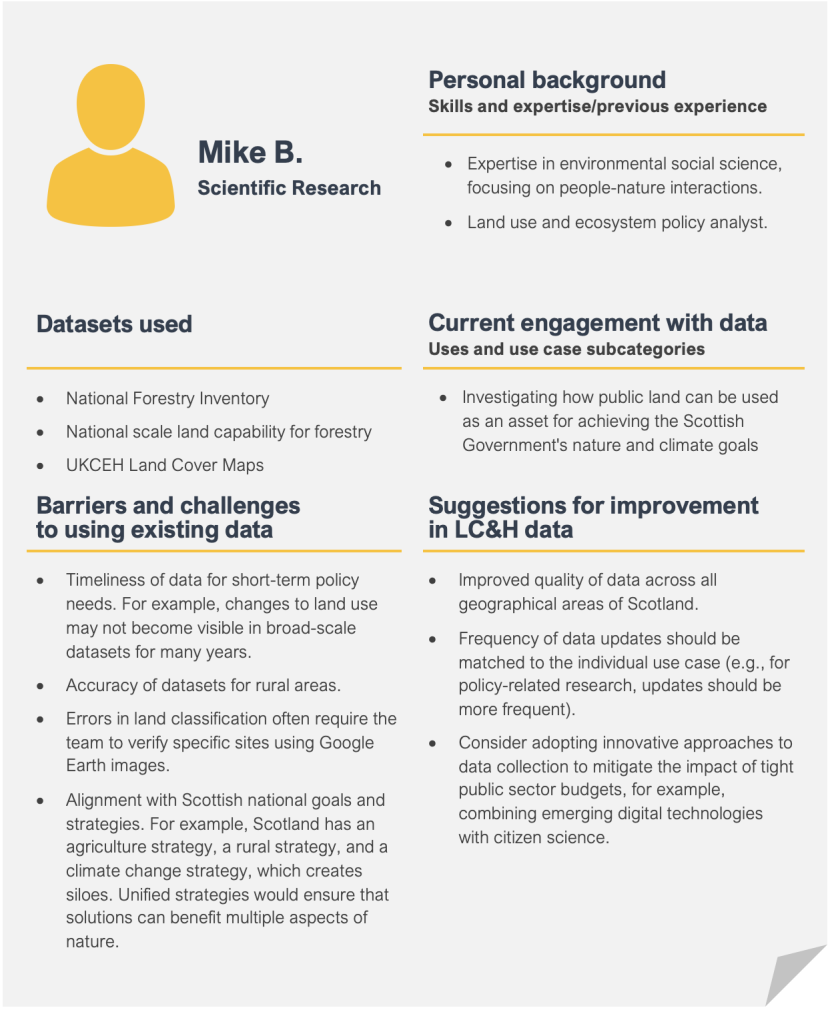
Figure 10. User persona 5: Scientific Research – Environmental social science
Click for a full description
User persona: Mike B."in Scientific Research. The left section lists datasets used: National Forestry Inventory, national scale land capability for forestry, and UKCEH Land Cover Maps. Barriers and challenges include: timeliness of data for short-term policy needs, accuracy issues in rural areas, errors in land classification requiring site verification (e.g., with Google Earth), and misalignment between separate national strategies (agriculture, rural, climate change) creating silos. The right section details Mike’s background (expertise in environmental social science, people-nature interactions, and policy analysis), current engagement (investigating public land use for Scottish Government nature and climate goals), and suggestions for improvement: better data quality across Scotland, more frequent updates tailored to use cases, and adopting innovative data collection approaches (such as combining digital technologies with citizen science). The layout features a generic avatar illustration and uses yellow lines to separate sections.
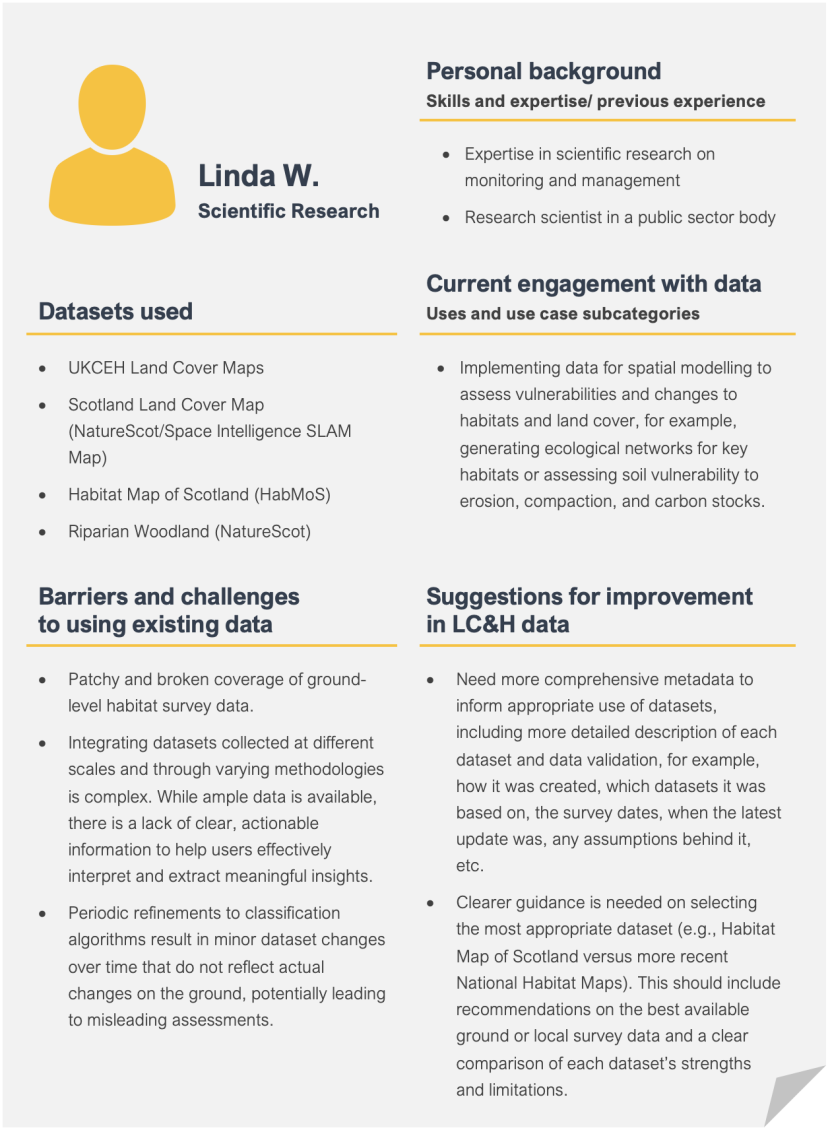
Figure 11. User persona 6: Scientific Research – Monitoring and management
Click for a full description
User persona: Linda W. in Scientific Research. The left side lists datasets used: UKCEH Land Cover Maps, Scotland Land Cover Map (NatureScot/Space Intelligence SLAM Map), Habitat Map of Scotland (HabMoS), and Riparian Woodland (NatureScot). Barriers and challenges include: patchy and broken coverage of ground-level habitat survey data, complexity in integrating datasets collected at different scales and methodologies, and periodic refinements to classification algorithms causing minor dataset changes that may not reflect real-world conditions. The right side outlines Linda’s background (expertise in scientific research on monitoring and management, research scientist in a public sector body), current engagement (using data for spatial modelling to assess vulnerabilities and changes to habitats and land cover, such as generating ecological networks or assessing soil vulnerability), and suggestions for improvement: need for more comprehensive metadata, clearer guidance on selecting the most appropriate dataset, and recommendations on the best available ground or local survey data. The layout features a generic avatar illustration and uses yellow lines to separate sections.
4. Agriculture, Forestry, and Urban and Infrastructure Development
This use case includes five (5) distinct subcategories:
- Agricultural land management
- Forest management and expansion
- Urban planning and development
- Infrastructure development
- Other agriculture, forestry, and urban and infrastructure development (including inventories).
In total, agriculture, forestry, and urban and infrastructure development were identified as the primary use case for five interview participants and five survey respondents.
Use of land cover and habitat data
Some participants focused mainly on research and data management, while others concentrated on habitat identification, land use analysis, and contributing to agricultural and environmental policy. Key responsibilities included supporting applications for monitoring of agri-environment schemes, supporting farmers with biodiversity audits, and identifying habitats on farms at the field level. This work involved assessing habitat quality, identifying opportunities for restoration, and providing farmers with baseline data to improve land management practices. Additionally, participants used land cover data to analyse the presence of specific plant species (e.g., bracken), support natural capital assessments, and evaluate ecosystem services. In policy development, land cover and habitat data played a crucial role in shaping agricultural reform by informing strategies that balance farming productivity with biodiversity conservation. This included designing policies that link agricultural support payments to environmental performance and ensuring sustainable land use practices.
Value of land cover and habitat
Participants view high-quality and accessible datasets as indispensable, forming the foundation for their work in habitat identification, land use analysis, and policy development. They emphasised that reliable data is crucial for making informed decisions about balancing biodiversity conservation with farming productivity and ensuring that strategies, like agri-environment schemes, are based on solid evidence. Relatedly, they highlighted that data quality is vital for the success of conservation and climate resilience efforts.
Among the key characteristics participants highlighted for datasets to be considered of high quality are the need to be up-to-date, accurate, consistent, and accessible. As one participant described:
“If any land cover, use, [or] habitat is not accurately mapped, it is at risk of being disregarded during planning”
Regular updates, ideally on an annual basis, are essential, especially for agricultural policy. For instance, environmental performance data can influence payments to farmers, so it is crucial to regularly update data on habitat features to track changes and provide a reliable baseline for payment schemes. Some participants noted that satellite imagery, such as Sentinel-2 or LiDAR, can complement land cover and habitat data, enhancing accuracy and supporting continuous monitoring.
Consistency across classifications and data collection methods was also identified as essential, particularly when multiple organisations are involved. The accessibility of data was another crucial aspect mentioned. Participants indicated that open-source data in standard formats, accompanied by clear metadata and documentation, ensures that it is usable by a broad range of stakeholders, including farmers.
Missed opportunities arose due to the lack of high-quality data, particularly in spatial targeting for agricultural support. For example, with better data, the conditions for supporting payments to farmers would be clearer, allowing for more targeted and effective measures to protect biodiversity. Currently, farmers have significant autonomy in adopting measures they believe will benefit the environment, but there is little spatial targeting, leaving many decisions to individual farmers about how to measure environmental benefits. A more detailed understanding of land types, coverage, and habitats could enable much more explicit targeting of areas where interventions would have the greatest impact.
Barriers and challenges faced by users
Accuracy
Users in this use case face several barriers related to land cover and habitat data. Participants noted inaccuracies across datasets, between datasets and “real life”, and between countries, resulting from discrepancies in resolutions and categorisation, particularly when different organisations are involved. Datasets always have inaccuracies, and when multiple datasets are used together, misalignments can occur due to differing spatial resolutions or means of representing land cover types (e.g., raster, vector data structures), leading to incorrect classifications. For example, one participant noted that the National Forest Inventory and UKCEH Land Cover dataset, though spatially similar, differ conceptually—CEH focuses on land cover, while the National Forest Inventory includes land use data. Using them without considering these differences can lead to discrepancies in the estimate of the area of woodland in Scotland. Additionally, datasets often do not represent real-life conditions suggesting the need for additional validation of data. Participants also noted the challenge that datasets developed for use in England do not reflect land cover types in Scotland, highlighting the need for tailored systems for the latter.
Decentralisation of data
Another challenge faced by users is the decentralisation of data and lack of effective and ongoing knowledge sharing. Datasets are scattered across various sources and hosted on different websites, which means they are often in different formats and require users to combine multiple datasets, such as overlaying various land use data. Participants highlighted the need to improve awareness of the data available to the public and advisors, including understanding its contents and knowing where to find it.
Accessibility
Participants mentioned accessibility as another significant barrier, as open-source data is not always available in standard formats or accompanied by clear metadata and documentation. This limits the ability of stakeholders, particularly those outside government or academic institutions, to effectively use the data. Furthermore, the high cost of accessing detailed datasets can be prohibitive for some organisations, particularly those that could drive innovation in the field.
Other technical challenges mentioned by participants include:
- Fragmented and patchy survey coverage, stressing the need for full coverage of Scotland.
- Low resolution, such as details within agricultural field boundaries.
- Lack of regular dataset updates, which impedes accurate tracking of habitat changes and the implementation of agricultural policies, like environmental performance-based payments.
Recommendations for improvements
In light of these barriers and challenges, participants in this use case category offered valuable insights on how they can be addressed, including:
- Use advanced tools and technologies to improve the resolution of datasets, particularly for habitat types and farm boundaries. Tools such as aerial imagery and LiDAR for precise 3D mapping should be implemented to support continuous monitoring, regular updating of data, and adding value to its uses. Increasing the frequency of habitat mapping and ensuring consistency in the process will improve data reliability, leading to better analytical output, stronger academic research funding potential, and more informed decision-making, particularly for the Habitat Map of Scotland (HabMoS).
- Expand the geographical coverage of datasets to include all of Scotland, ensuring more comprehensive and accurate analyses of land use, habitat distribution, and environmental trends across the entire country.
- Establish clear, aligned objectives among all stakeholders to ensure a coordinated strategy for land use data. A unified approach to data governance is essential to prevent fragmentation and improve consistency.
- Standardise classification systems and formats across datasets to reduce inconsistencies, making data more reliable and comparable. NatureScot, the Scottish Government, and all data creators should collaborate to adopt a joined-up approach, ensuring alignment in how land use data is collected and applied.
- Develop a centralised platform where users can access all datasets in one place, with user-friendly formats, improved downloading, and tools to retrieve spatial data efficiently. Ensuring open access and clear metadata will enhance transparency and collaboration. Government departments often require the same datasets but work in silos, leading to inefficiencies and duplicated efforts. While initiatives like CivTech have funded new tools, this has resulted in multiple platforms rather than a unified solution.
- Expand estimation capabilities by developing predictive models to forecast future land cover and habitat changes, which would support more informed decision-making. For instance, conservation efforts could be strengthened through rapid, remote methods for assessing deer grazing impacts.
User personas
The following section presents the personas of two potential users of land cover and habitat data, which provide more insights into how users in this use case category engage with the data.
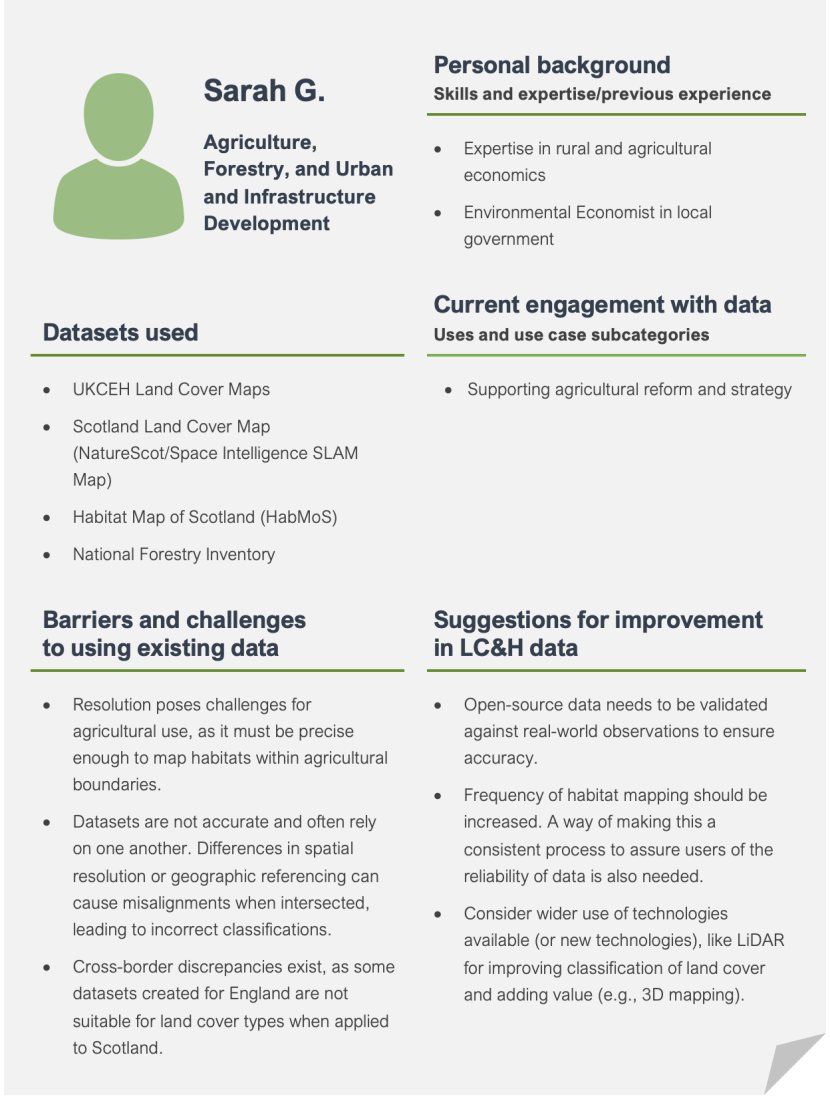
Figure 12. User persona 7: Agriculture, Forestry, and Urban and Infrastructure Development – Rural and agricultural economics
Click for a full description
User persona: Sarah G. in Agriculture, Forestry, and Urban and Infrastructure Development. The left section lists datasets used: UKCEH Land Cover Maps, Scotland Land Cover Map (NatureScot/Space Intelligence SLAM Map), Habitat Map of Scotland (HabMoS), and National Forestry Inventory. Barriers and challenges include: resolution issues for mapping habitats within agricultural boundaries, lack of accuracy and reliance on other datasets causing misalignments, and cross-border discrepancies where datasets made for England are unsuitable for Scotland. The right section details Sarah’s background (expertise in rural and agricultural economics, Environmental Economist in local government), current engagement (supporting agricultural reform and strategy), and suggestions for improvement: validate open-source data with real-world observations, increase frequency and consistency of habitat mapping, and use technologies like LiDAR for better land cover classification and 3D mapping. The layout features a generic avatar illustration and uses green lines to separate sections.
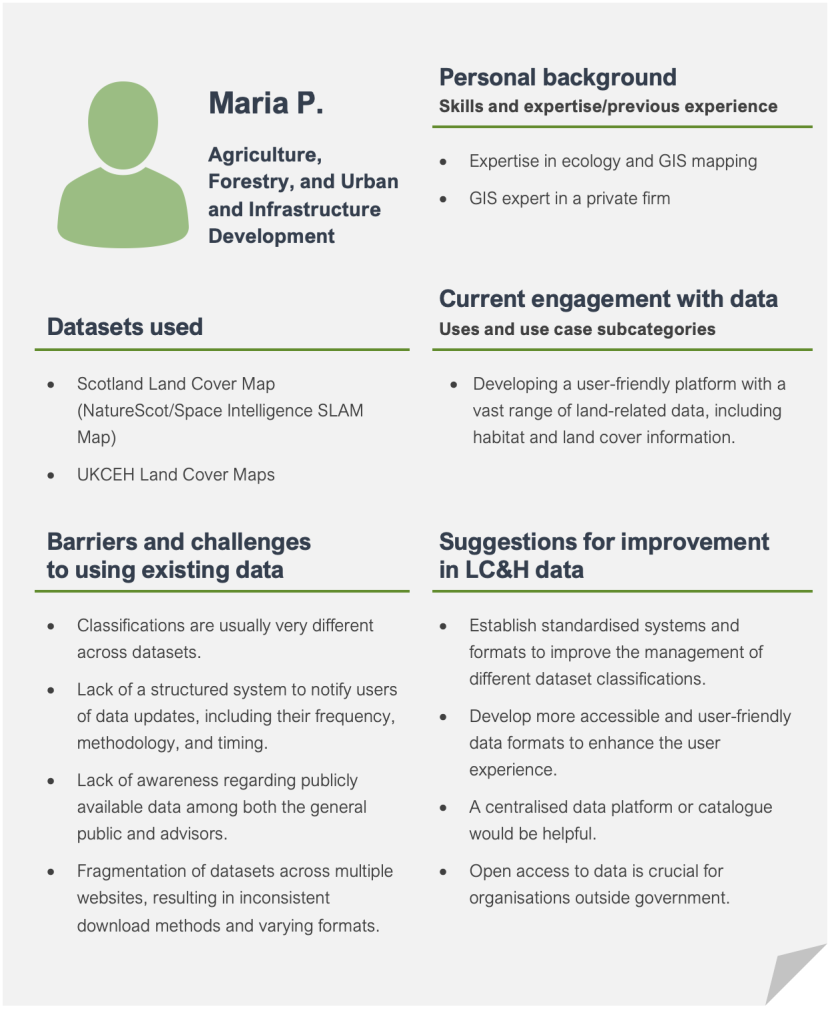
Figure 13. User persona 8: Agriculture, Forestry, and Urban and Infrastructure Development – Ecology and GIS mapping
Click for a full description
User persona: Maria P. in Agriculture, Forestry, and Urban and Infrastructure Development. The left section lists datasets used: Scotland Land Cover Map (NatureScot/Space Intelligence SLAM Map) and UKCEH Land Cover Maps. Barriers and challenges include: classifications differing across datasets, lack of a structured system to notify users of data updates, low public awareness of available data, and fragmentation of datasets across multiple websites with inconsistent formats. The right section details Maria’s background (expertise in ecology and GIS mapping, GIS expert in a private firm), current engagement (developing a user-friendly platform with a wide range of land-related data), and suggestions for improvement: establish standardised systems and formats, develop more accessible and user-friendly data formats, create a centralised data platform or catalogue, and ensure open access to data for organisations outside government. The layout includes a generic avatar illustration and uses green lines to separate sections.
5. Other use cases
In total, two (2) interview participants and five (5) survey respondents indicated that their primary use case falls outside the four previously classified categories.
Use of land cover and habitat data
Roles within this use case encompass analysing data availability and accuracy, visualising landscapes, supporting environmental restoration, tracking habitat changes, and informing land use planning. The scale of work varies, with some participants focusing on processing, comparing, formatting, and structuring datasets to make them more accessible and useful for other users, and integrating them into platforms such as those output from CivTech projects. Others concentrate on monitoring potential restoration areas and assessing the benefits of restoration efforts, such as the biological and emissions-related advantages of peatland restoration. Landscape analysts generate visualisations and public reports on ecological health and land management, while economic and land use planners use the data to monitor development sites, assess vacant or derelict land, and evaluate policy impacts. Additionally, users compare historical and current datasets to track land use changes, prioritise conservation efforts, and communicate findings effectively.
Value of land cover and habitat
Land cover and habitat data is crucial for users, enabling them to track environmental changes, support restoration efforts, and inform land use decisions. Accurate, accessible data underpins their ability to monitor landscapes, assess policy impacts, and make informed decisions across conservation, planning, and economic development. As described by one participant:
Barriers and challenges faced by users
For participants in this use case, a major challenge is the lack of up-to-date data, with many datasets being outdated and limiting the ability to track habitat changes accurately. Without regular updates, land cover and habitat data may not reflect current conditions, reducing their usefulness for decision-making, restoration efforts, and policy planning.
Accessibility and findability are also key issues. Many datasets are difficult to access, particularly at the local level, even when collected by public bodies for payment and assurance purposes. Additionally, data is scattered across multiple platforms and catalogues, often in different formats, making it difficult for users to find and integrate relevant information. A centralised, user-friendly platform would significantly improve efficiency and usability.
Accuracy and resolution are important concerns for stakeholders in this use case. Finding datasets that provide both high-quality and broad coverage is challenging, particularly in complex landscapes such as Scotland’s uplands. While older datasets, like LCS88, offer reliable classification, newer land cover maps have provided limited assessments of accuracy and at widely differing spatial resolutions. Users also face difficulties with mapping and processing data, as GIS tools can be complex and time-consuming, requiring specialist expertise that not all users have.
Other barriers include the costs of reviewing and monitoring changes to metadata as and when datasets are updated, as well as missing or incomplete datasets. For instance, important spatial information, such as public funding for peatland restoration and carbon credit registration, might be contained in complex registers rather than being available geospatially. Additional gaps include limited data on boundary features (e.g., hedges), vegetation variation (e.g., species mix of trees), and heights of features (e.g., canopy cover), which could improve habitat assessments if better integrated.
Recommendations for improvements
To improve the usability, accessibility, and reliability of land cover and habitat data, participants in this use case recommended several key actions to enhance data quality, integration, and availability:
- Enhance usability and integration: Develop interactive maps where users can click on an area to access all relevant habitat information. Improve integration of urban and building data and ensure datasets can be accessed and manipulated directly from a cloud server without the need for local downloads.
- Prioritise satellite Artificial Intelligence (AI) and machine learning: Make advanced satellite-based analysis the standard for land cover and habitat data to improve accuracy, efficiency, and monitoring capabilities.
- Increase clarity and reliability of data: Provide transparency on how data is created and the statistical methods underpinning it. Ensure consistency in classification, with clear information on classification accuracy and how land cover and habitat data are interpreted.
- Standardise formats and improve accessibility: Structure datasets to be ready for use, ensuring seamless compatibility with GIS software. Centralise data in a single platform to improve efficiency and reduce the challenge of scattered, inconsistent datasets.
- Commit to regular updates: Refresh datasets based on their nature, with land cover data updated annually and highly accurate upland maps on a 10- or 20-year cycle. Ensure long-term commitment from data creators to maintain accurate and up-to-date information.
- Expand open-access data and knowledge sharing: Prioritise making more datasets publicly available, providing clear guidance on what data exists, what habitats it contains, and how users can access and apply it effectively.
User personas
The following two personas provide examples of the types of needs, barriers, and challenges presented for users in this category.

Figure 14. User persona 9: Other – Ecology and GIS mapping
Click for a full description
User persona: John Doe in the "Other" category. The left section lists datasets used: Scotland Land Cover Map (NatureScot/Space Intelligence SLAM Map) and UKCEH Land Cover Maps. Barriers and challenges include: differing classifications across datasets, need for timely data updates and notification systems, lack of general public knowledge about available data, and datasets scattered across multiple websites with varying download methods and formats. The right section details John’s background (expertise in ecology and GIS mapping, GIS expert in a private firm), current engagement (developing a user-friendly platform with a wide range of land-related data, including habitat and land cover information), and suggestions for improvement: unify systems and formats, provide more accessible and user-friendly data formats, create a centralised data platform or catalogue, and ensure open access to data for organisations outside government. The layout features a generic avatar illustration and uses grey lines to separate sections.
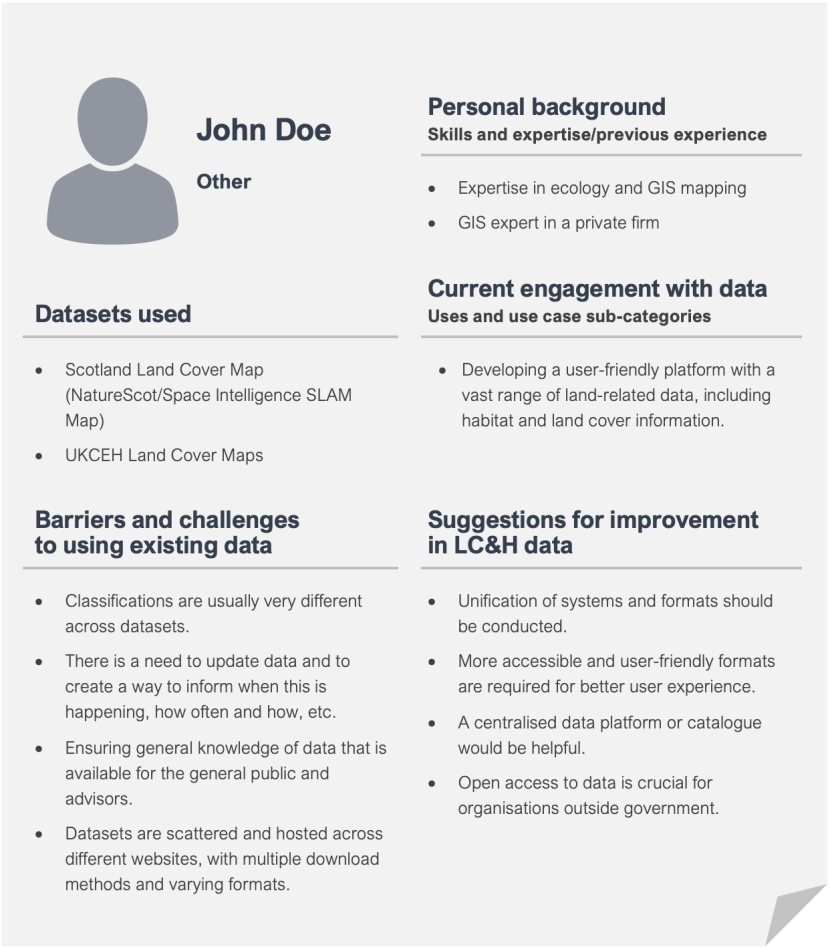
Figure 15. User persona 10: Other – Environment and land use
Click for a full description
User persona: Jane Doe in the "Other" category. The left section lists datasets used: Carbon and Peatland 2016 map, Scotland Land Cover Map (NatureScot/Space Intelligence SLAM Map), and Land Cover Scotland 1988 (LCS88). Barriers and challenges include: outdated datasets and maps, lack of geospatial data on public funding for peatland restoration and carbon credit registration (with information buried in complex records), and multiple versions and formats of datasets across different portals making data gathering and analysis time-consuming. The right section details Jane’s background (expertise in environment and land use, investigator in a research organisation), current engagement (understanding the needs and benefits of peatland restoration in Scotland, identifying potential restoration sites and priority areas for research), and suggestions for improvement: regularly updated, highly accurate land cover maps (especially for the highlands), centralisation and standardisation of information, and widespread integration of land use features alongside land cover. The layout features a generic avatar illustration and uses grey lines to separate sections.
Insights from data creators
To complement the insights presented above, our qualitative fieldwork also included the perspective of stakeholders who generate these datasets (‘data creators’). The following section outlines insights gathered on data generation, user needs, and recommendations to improve the user experience.
Overview of data generation
Participants used a combination of manual and automated approaches to generate land cover and habitat data. Specific examples included using a mixture of online and paper-based surveys, training AI models according to specific habitats to generate higher-resolution mapping, and using algorithms to process satellite imagery. The data generated by participants overwhelmingly focused on Scotland and tended to be driven by user needs or gaps identified in existing datasets rather than a unified organisational or national strategy.
Data creators described a variety of challenges involved in generating, hosting, and publishing data. Some are related to cost, for example, accommodating ad-hoc user requests (which are more resource-intensive) or balancing costs and accuracy (automated software being cheaper but less accurate than manual classification). Others related to data governance and data sharing agreements, for example, challenges making data open-source (if under license conditions from a third party), time taken to establish data sharing agreements, and barriers to establishing feedback loops with users (due to GDPR constraints). Additional challenges included:
- Adapting datasets to formats that allow live updates.
- Ensuring data is accessible and readable to all users.
- Validating data when working with non-experts on the ground.
- Integrating new data at pace before it becomes outdated.
- Publishing metadata that is both detailed but accessible to users.
Understanding user needs
Creators of land cover and habitat data identified a number of different users and use case categories for their datasets, in line with the categories described in this report thus far. These included analysts, researchers, policy advisors, and government or local authority officers, using land cover and habitat data for planning, tech development, condition monitoring, fieldwork design, claim validations, and regulation reporting. Requests ranged from site-specific to broader thematic or regional datasets, depending on the individual question being asked.
In our interviews, we collected information on the interactions between data creators and their intended users, as these can be informative for NatureScot. The data creators identified four key features that they considered most important to data users. These included:
- Open-access and free data, particularly if generated by government agencies, given that they are publicly funded.
- Datasets and classification systems suited to Scotland’s landscape, referring to EUNIS classifications and the Scotland Habitat and Land Cover Map – 2022 (Space Intelligence) as examples of best practice.
- Comprehensive metadata, including minimum mapping units and descriptions of how data can be used.
- Up-to-date and usable data, which will differ per use case.
A number of user challenges also emerged, drawn from a combination of personal experiences and direct feedback from data users. These included:
- Discrepancies between datasets and on-the-ground realities, reducing trust in data.
- The absence of data catalogues hinders accessibility.
- Inaccurate, inconsistent, or inappropriate classifications.
- Inconsistencies in datasets (for example, linked to methodologies or assumptions), which complicate broader thematic queries.
- Lack of data interoperability, which can be time-consuming to resolve.
The most significant challenge concerned the complexity of land cover and habitat data, and the challenges faced by users to appropriately interpret and use these datasets. Habitat data, in particular, can be complex (for example, National Vegetation Classification data or information derived from it, where a single polygon might represent multiple habitat types, e.g., as captured in LCS88 mosaics) and, at times, requires additional support to simplify and filter the data. Some participants reported that the lack of geospatial expertise in the environmental sector and the resulting misuse or misinterpretation of land cover and habitat data were a challenge, particularly since technology has made these datasets more accessible to non-expert users. As one participant noted:
“There is no lack of data. There is a massive lack of credible information and evidence from that data. So I think when people say we don’t have the data, often what they’re saying is that we don’t have the ability to get this data to work for us because it’s too difficult to get out”.
While some participants reported dedicating more time to support users as a result, there remains a risk that data is not used sensibly. One solution presented was improving metadata so prospective users can better understand its purpose, origins, and context, in order to make informed decisions about which dataset is most appropriate for their needs. Indicatively, metadata should include nuances between datasets (for example, whether they are algorithmic or human-driven) and information about scale appropriateness. Importantly, it was noted that metadata should be descriptive, user-friendly, and appropriate for non-expert users in order to be useful.
Recommendations
Three overarching recommendations emerged from discussions with data creators in response to the uses, needs, and challenges discussed above. These included:
- Establishing direct feedback loops with data users. Participants described difficulties collecting feedback on the uses and value of their data, as well as challenges faced by data users, caused by data governance and data sharing restrictions. Developing user networks and embedding mechanisms to capture feedback from all users (e.g., analysts, farmers) was considered crucial.
- Considering the long-term value of new datasets through big picture thinking about their future importance. This should be factored into funding and strategic decision-making and considered in light of the uncertainties created by climate change. The Well-being of Future Generations (Wales) Act 2015 was quoted as a best practice example for considering future impact.
- Ensuring data is accompanied by clear caveats, fostering an honest conversation about the inherent inaccuracies within data and supporting users to make informed decisions based on these limitations. Comprehensive metadata should be available for all land cover and habitat data, tailored to the intended users’ expertise to sensibly mitigate against inappropriate interpretations or uses of these datasets.
Future considerations
We also asked participants, both data users and creators, about their views on changes and improvements in land cover and habitat data over time, as well as expected future developments. Innovations such as AI, remote sensing, and cloud-based platforms have enhanced data collection and analysis, with future developments in machine learning, LiDAR, and satellite imaging expected to drive further progress. However, challenges like data fragmentation and accessibility remain. This section outlines participants’ perspectives on past and future changes, highlighting advancements in accuracy, accessibility, and technology.
Changes and improvements to land cover and habitat data over time
The stakeholders with whom we engaged drew on their experience to provide insights into how land cover data has changed over time. The changes have provided datasets with significant analytical value, making them essential for use across sectors. As noted by participants, spatial resolution has increased over time, with reduced overlaps and more robust data production. The availability of datasets has also expanded, with more open-access data, large-scale surveys (e.g., peat depth surveys), and improved web-based portals facilitating access. The use of satellite data and drone surveys has further enhanced coverage. Additionally, digital recording has transformed data sharing, reducing reliance on local copies and enabling cloud-based access. National coverage, particularly in Scotland, has improved significantly, and there is greater awareness of the value of making data publicly available.
Participants also mentioned advancements related to data collection, specifically the shift from manual methods to technology-driven processes. Mapping has evolved from basic cartography to the use of machine learning algorithms, hybrid technologies, and Earth Observation. One example of this improvement mentioned by participants is the development of the Scotland Habitat and Land Cover Map – 2022 (Space Intelligence) by NatureScot, which exemplifies innovation. The transition from vector-based to raster-based datasets has allowed for more frequent updates and expanded applications in some forms of spatial modelling. Remote sensing technologies, including aerial and satellite imagery, offer higher spatial and temporal resolutions, improved feature interpretation, and greater accessibility. AI and cloud computing have revolutionised data processing, making large-scale analysis more efficient while introducing new possibilities for land cover feature visualisation. While challenges remain, the ongoing integration of advanced technologies continues to improve the accuracy, efficiency, and usability of land cover and habitat data.
Future developments through technological innovation
Looking towards the future, several participants envision that the future of land cover and habitat data will be shaped by significant advancements in remote sensing, AI, and data science. Remote sensing technologies, such as satellites and drones, are set to revolutionise the evaluation of habitat condition. As satellite technology progresses, there will be increased availability of detailed data products, with more frequent updates and better resolution. Remote sensing techniques, like LiDAR and InSAR, will continue to advance, enhancing terrain mapping, surface deformation analysis, and habitat condition assessments. Participants highlighted that the combination of aerial and satellite imagery with AI will enable the development of new products, such as vegetation indices for mapping habitat condition, topsoil moisture, and peatland health at high spatial and temporal resolution, and cloud computing will enable access to greater processing power. While these advances in remote sensing, including satellite and aerial imagery, offer greater accuracy and frequency, some participants still think they will need to be paired with ground truthing to understand the quality of the data.
Another innovation highlighted by several participants is the use of artificial intelligence and machine learning to improve the analysis and interpretation of complex datasets. Machine learning will allow systems to learn from data and improve over time, making it essential for processing large amounts of land cover and habitat data. AI can streamline data analysis, uncover connections within datasets, and be used in decision-making, such as habitat connectivity analysis. As AI and machine learning capabilities evolve, they will help automate data processing, improve prediction accuracy, and make previously difficult analyses more accessible. For instance, participants highlighted that a major benefit of these technologies is that they can be implemented to integrate datasets generated using different methods (e.g., satellite imagery and survey fields) for more accurate modelling of habitat changes, climate impacts, and policy implications.
Forward-looking data and forecasting tools will become increasingly important for understanding the impacts of policy, land-use change, and climate change on habitats and biodiversity. Advances in co-benefit analysis, particularly for biodiversity and flood risk management, are also gaining traction. These developments will be crucial for land management and policy strategies, including food security, land use planning, and future regulatory frameworks that address carbon emissions and climate adaptation. While these advancements promise efficiency and accuracy, concerns remain around data fragmentation and the potential for market manipulation without a unified national data strategy. It is critical to ensure that data remains publicly accessible and that government involvement prevents private interests from dominating the sector, whilst voluntary and citizen science approaches are also built into the conversation.
New use categories
Over time, land cover and habitat data have been increasingly applied across various industries and for a wide variety of use cases. Participants mentioned the renewable energy sector, in which the push for a hydrogen-based economy has driven a need for accurate land data to assess locations for infrastructure development. Similarly, engineers in the urban planning sector also benefit from this data, as it supports property development, infrastructure, and housing planning by ensuring environmental considerations are not overlooked. In a related manner, strategic planning for projects like wind farms and transmission lines relies on detailed land use data, enabling informed decisions about location and environmental impact.
Agriculture was widely cited as a sector where land cover and habitat data are increasingly used, playing a crucial role in assessing crop types, land quality, and agricultural reform initiatives. While agricultural policy use has not been a driver of the need for habitat and land cover data in the past, it is likely to do so as policies encourage the adoption of nature-friendly farming practices. For example, more precise land cover data is necessary to monitor sustainable practices, like agroforestry, which involves integrating trees into farming systems. Relatedly, in forestry, data is essential for pre-plantation impact assessments and rewilding initiatives. Nature finance is another growing field, with landowners seeking to generate income from their land through natural capital projects. Improved data helps landowners access these opportunities, particularly by providing insights into unclaimed land for restoration or habitat maintenance. The carbon management sector also increasingly uses land data for carbon credits and sequestration, helping businesses assess their environmental impact and meet reporting requirements.
In environmental monitoring, land cover and habitat data can be used to map current plant species and model future habitat changes. In biodiversity conservation, data is crucial for assessing net biodiversity value, supporting initiatives like biodiversity credits and audits, and fulfilling growing reporting requirements for businesses and farms. Climate change restoration and mitigation also depend heavily on accurate, timely land cover maps to plan adaptation efforts, with data usage rising, particularly in projects like sustainable drainage systems. Other sectors mentioned are marine research, land management, habitat condition, ecosystem health approaches to management, and water management.
These use cases will require data in novel formats and require the development of new features. Some of this new data might require the management of “big” data from satellites and sensors, which will require addressing new challenges such as storage, computing power for analysis, and technical skills.
Developing a framework for valuation
Estimating the value of land cover and habitat data
In this chapter, we create a framework to assess the value of land cover and habitat data. Land cover and habitat data are crucial for understanding and managing ecosystems, biodiversity, and environmental change. These datasets provide insights into how land is being used, where natural habitats are located, and how they are changing over time due to human activities or climate shifts. Accurate land cover information helps in conservation planning, urban development, and resource management, ensuring that ecosystems remain healthy, balanced, and sustainable. It also supports efforts to combat deforestation, protect endangered species, and mitigate climate change by tracking carbon storage in forests and wetlands.
In spite of its importance, there are no standardised or universally accepted methods for valuing land cover and habitat data. Different stakeholders—such as governments, conservationists, and developers—use various valuation approaches depending on their objectives. Some methods focus on the direct economic benefits of land, such as agriculture or real estate value, while others consider non-market benefits, like carbon sequestration, biodiversity and nature conservation, and cultural significance.
Creating a valuation framework is an important step towards ascribing a credible value to land cover and habitat data to support informed policy decisions, assess costs and benefits, and present a business case for long-term investment.
This chapter provides a step-by-step framework for measuring the value of land cover and habitat data. We first set out the challenges of measuring the value of the land cover and habitat data. We then describe our approach to quantifying the value of land cover and habitat data, and finally, we present the framework and detail its components.
Challenges of valuing land cover and habitat data
The valuation of land cover and habitat data has unique challenges that hinder the production of a robust and accurate measurement. These have a direct impact on any decisions made on the level of investment made in the production, maintenance, and development of this data. Key amongst these are:
1. The benefits of land cover and habitat data are intangible
A key difficulty in measuring the benefit of land cover and habitat data is that most of the benefits arising from the data itself are abstract, lacking readily available numerical measurements. Many data sources of land cover and habitat are open access, whilst for others, commercial information is guarded, providing limited evidence of value to data users (i.e., revenue data). Furthermore, many of the benefits of improvements in data are “spillovers”—i.e., flowing to individuals who do not use the data directly—making monitoring these benefits challenging. Many of these spillover benefits (e.g., clean air, water filtration, biodiversity) do not have market prices attached, making valuation challenging.
2. Uncertainty over uses of data and benefits from existing data
There is uncertainty about who will benefit from the usage of the data. It depends on the nature of the usage and how different stakeholders utilise the data. Furthermore, the usage of land cover and habitat data is a part of a larger value chain. It is one of the multiple inputs in conducting research, guiding policy, etc. It is also often used with other sources, making attribution of value challenging to measure.
It is to address such uncertainty that this project identifies the uses of data at the very first step.
We use the desk-based review to identify the sectors and use cases for land cover and habitat data.
3. There is a lack of standardised measures and methods that can be used to ascribe value to data
Due to limited efforts at providing value to existing data, there are no clear metrics that are standard in measuring the value of data. This is because the value could be subjective, which makes a standard objective measure of them difficult. Similarly, there has been limited methodological work to identify ways in which the value of land cover and habitat data can be measured. This includes both quantitative and qualitative methods. This is further complicated by the fact that purely quantitative methods may not offer a good measure, given the public nature of the data itself.
All of these challenges together lead to issues in assessing the value of land cover and habitat data, which further lead to difficulties in evaluating its impact and challenges in creating a robust case for future investments.
Our approach to valuing land cover and habitat data
Since this is novel research, our approach to measuring the value of land cover and habitat data is focused on using feasible methodologies for quantifying the value. Our key inputs came from several sources, such as land cover and habitat data users and creators themselves, existing evidence from a review of data and guidance from the Geospatial Commission (2022)(Cabinet Office, Geospatial Commission, and The Rt Hon Lord True CBE 2022).
We disaggregated the problem into a series of sequential questions that need to be answered as we attempt to arrive at a value. Answering these questions provides a roadmap towards the valuation framework. In order to translate the uses of land cover and habitat data into a value, we need to answer the following questions:
- Where is this data used?
- In its uses, what are the drivers through which it produces value?
- For these drivers, what are the metrics or measures that can be used to identify value?
- How can we methodologically operationalise these measures?
- How are the valuations of different uses prioritised?
- How do we arrive at a final value?
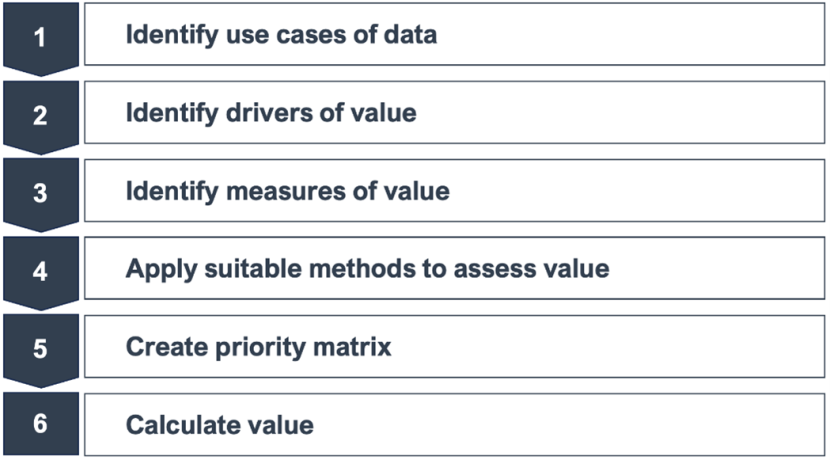
Figure 16. Step-by-step framework for data valuation
Click for a full description
A vertical step-by-step process diagram with six numbered steps for assessing data value. The steps are:
- Identify use cases of data
- Identify drivers of value
- Identify measures of value
- Apply suitable methods to assess value
- Create priority matrix
- Calculate value
Each step is displayed in a separate horizontal box with a dark arrow-shaped label containing the step number on the left.
Components of the framework
As shown in Figure 16, our valuation framework has six steps to arrive at a final value for the data. We will examine each component of the framework below.
Step 1: Identify use cases of data
The first step in assessing the value of the data is to understand where it is used. A common challenge with public data is that the owners do not always know how end-users utilise the data. Hence, the first step is to identify the use cases of the data. This can be done through a combination of stakeholder engagement, with a review of existing literature that demonstrates how and where the data is being used. This is what we do as the first step for this project, focusing on a review of evidence and datasets to identify where and how the data is used. We develop this further into a taxonomy of use cases that can provide a systematic categorisation of the uses.
Step 2: Identify drivers of value
How does the data generate value in these uses? To answer this question, we rely on existing frameworks that measure the benefits associated with geospatial data. We classify the benefits of land cover and habitat data into three categories: economic benefits, environmental benefits, and social benefits (Government Digital Service, Cabinet Office, and Geospatial Commission 2022).
Economic value refers to the benefits that land cover and habitat data have on the local or national economy, and it should capture changes in the location and volume of economic activity. Some examples of economic value would be an increase in employment and GVA, improvements in the delivery of public services, and cost savings from avoiding disruption from adverse outcomes.
The environmental value of using land cover and habitat data should cover any change to the natural environment and landscape resulting from an intervention that uses this data. Some examples of the environmental value would be the impact on air and water quality, reduced risk of flooding and improvements in the stock of natural capital. The social value of using land cover and habitat data covers the broader impacts on individuals and captures the extent to which people’s wellbeing has changed. Some examples of social value would be the impact on physical and mental wellbeing, improved longevity and quality of life, and easier access to leisure.
Step 3: Identify measures of value
Next, we want to understand the metrics or measures that can be used to quantify the values that the usage of land cover and habitat data could generate in different use cases. To do this, we use two complementary approaches. We discuss both these approaches in detail, as the user of this framework can select an appropriate set of measures depending on the context and availability of data.
Use-based measures of value
The use-based measures of value are based on suggestions from existing literature that looks at how value can be measured in environmental space data (Tassa 2020). This approach presents the following four key dimensions to measure the value of data use:
- Efficiency gains: This refers to the increases in productivity derived from using the land cover and habitat data compared to the case occurring without said data. For example, the value of the effectiveness of a particular intervention, derived from data, could be a measure here.
- Cost reduction: This is the reduction in costs compared to using alternative data measurements. This could be a simple cost of the next-best data source that a user is likely to use in the absence of the data being assessed.
- Performance improvement: This is measured as the improvement in the value of outputs resulting from using land cover and habitat data compared to the case without such data. This relates to outcomes, for instance, the change in the land value of the area of habitat gained or lost due to an intervention using the data.
- Risk mitigation: This is measured from the avoided costs of poor outcomes in the future through using land cover and habitat data, e.g., through the avoidance of environmental damage because of better monitoring.
Characteristics-based measures of value
The characteristics-based measures of value are based on the Q-FAIR framework, which was adopted to support investments in UK geospatial data (Geospatial Commission 2021). The Geospatial Commission aims to improve access to better location data by making it more Findable, Accessible, Interoperable, and Reusable (FAIR) and of the appropriate Quality that is fit for purpose. This framework lends itself to a different set of measures that can be used to identify how data is producing value. For instance, measuring through quality can include the value of data with the appropriate spatial resolution for a user. Benefits from quick identification of the right data and the value of having free and open access to it are measures of findability and accessibility. Value generated from combining datasets and using them for purposes other than originally intended covers measures for interoperability and reusability of the data.
Between the two, the use-based measurement of value is potentially easier to measure, provides a broad understanding of the overall impact of data and should be easier to communicate to relevant stakeholders. The characteristics-based measurements (Q-FAIR) dive into the finer details of the dataset and allow us to understand what specific elements of the land cover and habitat data contribute to its value.
Step 4: Identify methods to assess value
Having identified the right metrics or measures of value, the next step is to operationalise these and quantify them through a suitable method.
Our review suggests four primary methods that can be used to assess the value of land cover and habitat data.
The first method is evidence review, a critical review of existing research on the above measurements of the value of data. This method relies on past research and contributions to assess value and can be derived from suitable studies in data from other contexts. For instance, literature on health data ecosystems has used evidence reviews, such as Marjanovic et al. (2017). This is a necessary first step as it ensures that any valuation is aligned with existing research and avoids duplication of effort.
The second method is through stated preference techniques. This could be through contingent valuation and choice modelling from users of data or through elicitation of the opinions of experts. The stated preference techniques are often used to provide a measure of the monetary value of non-market resources, such as the ecosystem, and typically involve a survey directly asking how much the respondent is willing to pay for the relevant subject.
The third method is to conduct qualitative research, which involves collecting and analysing non-numerical information about the users' and other stakeholders’ perceptions of the value of data. Selecting the right set of stakeholders is key to collecting high-quality and relevant data that can support the assessment of value. For instance, Santos-Neto et al. (2015) combined qualitative and quantitative methods to assess the value attached to the user-generated tags in enhancing exploratory search. In their research, they conducted contextual interviews to understand which aspects influence the users’ perceptions of value when choosing tags during information-seeking tasks.
The fourth method is to conduct a counterfactual analysis. This is a novel approach we propose, drawing on insights from stakeholder engagement and combining with the method proposed in the literature (Tassa 2020). This approach values data using an examination of the counterfactual to the data being valued. In this approach, we ask data users the question “What would you do in the absence of suitable land cover and habitat data?”. This absence of data would typically lead the user to either use alternative data sources (that might be more expensive or less suitable) or conduct primary data collection themselves (but for a smaller sample or on a limited scale). Therefore, there should be two potential costs resulting from this absence:
- Additional costs in collecting a limited sample of data.
- Costs from having outputs that are not entirely suitable for policy creation and use.
Both estimates could be elicited from stakeholders based on their previous experience. By adding the two, we will obtain the lower bound to the value of the data.
Any measurement of value is likely to incorporate one or more of the methods we have described. In fact, employing a mixed-methods approach, particularly those that include qualitative insights, allows for calculating an estimate along with a narrative context to ensure these are suitable for use. This is particularly important for the assessment of value that is subjective in nature.
In addition, we list some additional methods that can be used to support the valuation of land cover and habitat data.
- Market-based instruments: These can be used to assign economic value to land cover and habitat data by establishing mechanisms that reflect the worth of ecosystem services, for instance, through approaches like biodiversity offsetting or payments for ecosystem services (PES).
- Bibliometric analysis: Bibliometric analysis is a quantitative method that applies mathematical and statistical tools to evaluate the academic literature by identifying patterns, trends, and impact in a specific research area (Fu et al. 2023). This could be particularly useful to value land cover and habitat datasets in research contexts.
- Hedonic pricing: Hedonic pricing is a method to estimate the price of a good based on the assumption that the price is affected by both the internal characteristics of a good as well as the external factors affecting it. This is often used to determine the value of the surrounding environment that affects housing prices (M. King, J. Mazzotta, and J. Markowitz 2000). A similar method could be used to estimate how the land cover and habitat data affect the costs of a task.
Absolute versus relative measures of value
We also note here that there are two ways to approach the measures and their measurement. The value can be assessed as absolute valuation or relative valuation.
Absolute valuation involves assigning a value to each of the dimensions used for our measurement of values, attempting to quantify the total value in monetary terms. Absolute measures try to provide a comprehensive figure representing the full contribution of habitats, which can allow for direct comparisons and integration into cost-benefit analyses. However, there are inherent difficulties in assigning monetary values to intangible benefits, making them difficult to implement in practice.
Relative valuation uses comparative values for the different dimensions and establishes benchmarks for comparisons. It focuses on comparing the value of different land cover and habitat options or assessing changes in value over time. These measures often utilise indicators like indices, flow metrics, or changes over a benchmark period of time. Relative measures are less susceptible to the ethical and methodological challenges of absolute valuation, as they emphasise comparative assessments rather than absolute monetary figures. They can be limited in scope but can provide quicker valuations that are relevant for policy decisions.
Step 5: Create priority matrix
Not all use cases have the same level of importance for policy decisions. After estimating the value of data in different use cases, it is important to weigh them when building policy priorities. These can vary and should be supported by transparent and clear reasoning. For instance, a forward-looking organisation might place greater emphasis on use cases more relevant to future use, while an organisation looking for more equitable use of data can focus on use cases that are important to underserved groups. These weights can be calculated through several qualitative methods, such as elicitation from experts using the Delphi method (The Delphi method is a commonly used survey technique to generate data from multiple expert opinions through consensus building (Chuenjitwongsa 2017)).
The assignment of weights can be done through the creation of a priority matrix, where a weight is assigned for each of the use cases and drivers of value. These weighted values can be used to prioritise the benefits and uses and arrive at a socially- and policy-relevant valuation.
For instance, a set of decision-makers might want to increase the weightage placed on uses of data in the private sector (for example, for climate change impact assessment) to be twice as much as the use of data in the public sector (for instance, for biodiversity assessment and conservation). In this case, they can reflect this prioritisation in the valuation by multiplying the valuation obtained for the first use case by a factor of two. The final addition of value across use cases will thus reflect the decision-maker’s priorities for valuation.
Step 6: Calculation of value
The final step brings together the valuation carried out as a sum of the values assigned to each use case. Depending on the methods used, this can require standardisation through statistical methods. Also, this value can be absolute or relative, depending on how the measures are operationalised, as outlined in Step 4.
Discussion
The six steps described above outline the end-to-end process of developing a framework that can provide a value for land cover and habitat data. These steps are outlined in the figure below:
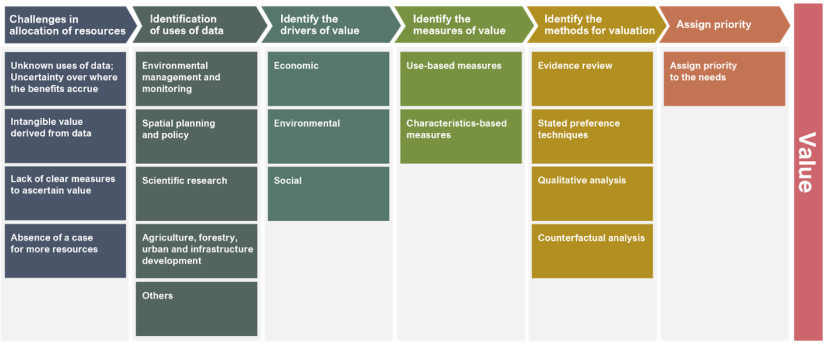
Figure 17. Steps to the development of a valuation framework
Click for a full description
A horizontal flowchart illustrating the process for valuing data in resource allocation. The chart is divided into six columns, each representing a step:
- Challenges in allocation of resources: Lists issues such as unknown uses of data, intangible value, lack of clear value measures, and absence of a case for more resources.
- Identification of uses of data: Categories include environmental management and monitoring, spatial planning and policy, scientific research, agriculture/forestry/urban/infrastructure development, and others.
- Identify the drivers of value: Lists economic, environmental, and social drivers.
- Identify the measures of value: Divided into use-based measures and characteristics-based measures.
- Identify the methods for valuation: Includes evidence review, stated preference techniques, qualitative analysis, and counterfactual analysis.
- Assign priority: Final step is to assign priority to the needs.
A vertical pink bar on the right labels the overall process as "Value." Each step is color-coded and arranged left to right, with text in colored boxes.
This framework for land cover and habitat data represents a novel attempt to quantify value. While it attempts to be comprehensive, we expect it to be considered more as a starting point for further discussion and development. Due to its innovative nature, the process of valuation could potentially involve uncertainties that vary by dataset and data use. For instance, when evaluating new methods and innovative technologies, there would need to be a focus on attributes of the data that could be created for users (e.g., higher spatial resolution, more frequent updates, or better visualisation). There is unlikely to be detailed evidence in existing research for such a scenario, and the valuation process is likely to have a heavier reliance on stakeholder feedback as well as expert opinion.
We encourage data creators and policymakers to engage with this as an evolving tool and consider any outputs within a broader understanding of economic spillovers, ecological complexities, and social values. Continuous engagement with stakeholders, interdisciplinary research, and iterative improvements can enhance the framework's reliability, applicability, and accuracy over time.
Options for future provision
In this section, we build on the data collected through stakeholder interactions to identify key options that can be used to enhance the provision of land cover and habitat data in the future.
Methodology
The policy development process followed a three-step approach, ensuring a systematic and evidence-based methodology:
1. Long list generation
We generated a long list of policy suggestions, drawing on the qualitative fieldwork. This included responses to the direct question “How could existing land cover and habitat data be improved or developed to better meet your needs?”, as well as identifying any suggestions made during other parts of the interview. We collated the individual suggestions into a long list of options for future provision.
2. Aligning options with the Q-FAIR framework
To enhance data governance, recommendations were organised using the Q-FAIR framework. The Q-FAIR framework (Geospatial Commission 2021) looks at Quality (ensuring accuracy and consistency of datasets), Findability (making data easier to find by humans and computers), Accessibility (removing barriers to data access for different user groups), Interoperability (standardising data to allow for linkage and combined use), Reusability (facilitating data usability over time for purposes different from those for which it was created). This ensures alignment with the existing work in wider policy networks on data governance and improvement. For the purpose of reporting, we combine the ‘Interoperability’ and ‘Reusability’ dimensions due to a high level of overlap and similarity in practice.
3. Rating the options
Feasibility, coverage, cost, and impact served as the evaluation criteria for stakeholder suggestions. Recognising the subjective nature of these assessments, we relied on expert judgment to assign values, ensuring a balanced and informed evaluation process. We use these scores to select priority options for NatureScot and describe these.
The complete list of options is presented in Appendix 6. In the following sections, we discuss some of the key options that emerged through the research.
Key options for future provision
Quality
- Option: Additional documentation
Our primary research suggests that the improvement of documentation of land cover and habitat data is a key priority for data users. This includes data on the source, including processes of data collection and the statistical reporting that underpins it, details on update frequencies, and information on data validation. For data that has undergone processing through an algorithm, users highlighted how the exact logic used is often not available, and this can create challenges for subsequent use and reporting. For instance, changes to classification algorithms used for satellite imagery can lead to changes in data not based on actual changes on the ground and would be difficult to identify without information about the algorithm.
- Option: Increased use of technological enhancements
Stakeholders suggested that technological enhancements can be used to improve the accuracy of land cover and habitat data while potentially reducing the costs of data collection. Stakeholders noted the plans for the use of LiDAR data and potential 3D mapping of land cover data, potentially improving the quality of classifications and adding value to products, and they anticipate the use of AI-based machine learning to increase over time. The use of new technologies to collate data also requires investment in encouraging “data maturity” within organisations who understand the challenges and nuances of data management.
- Option: Enhanced coverage, accuracy, and resolution
As noted in the previous sections, stakeholders across use cases noted the need to improve coverage, accuracy, and spatial and temporal resolution of existing data.
Improvement in accuracy and precision is a primary area for future improvement. The need for higher accuracy in land cover data is a recurring theme in our data. In agricultural areas, for instance, improved field-level precision is particularly important for land management and environmental assessments. The exact nature of accuracy varies by use case and is discussed in Chapter 2 of this report.
For coverage, users looked for more comprehensive and consistent coverage for Scotland, with a level of variability in current levels of detail captured across different regions. Expanding geographical scope can focus not only on broader mapping but also on integrating land cover data with complementary datasets, such as LiDAR, to improve usability. Additionally, ensuring comprehensive habitat coverage requires stakeholder engagement to define relevant classification categories and provide cross-referencing tools like crosswalk tables to align different datasets. Addressing gaps in classification, such as unclassified "white lands" in some current datasets, will further enhance the completeness and accessibility of land cover data.
Better resolution, both spatial and temporal, is crucial to the future provision of land cover and habitat data. The necessity for high-resolution data depends on the type of land cover and its application. In certain cases, increasing resolution may introduce inefficiencies or unnecessary data complexity without significantly improving classification reliability. Improving temporal resolution is key to ensuring that the data captures seasonal changes in land cover and habitat dynamics and can support use cases that require time-sensitive data. These use cases are growing in importance due to the effects of climate change.
- Option: Increased validation
With an increase in reliance on satellite and algorithm-driven data, users have highlighted the importance of systematic validation of data and the usability of accuracy assessments. Validation of data through “ground-truthing” or verification of the survey sites, and the provision of additional information about the processes, increases the level of trust users have in the data and its usability.
- Option: Conditions monitoring
Better monitoring of habitat condition, not just habitat type, is essential for providing a more comprehensive understanding of Scotland’s land cover and ecological health. Establishing a standardised framework for describing and collecting habitat condition data efficiently would enhance its usability, particularly in areas where existing datasets focus primarily on land cover extent rather than condition. Strengthening the integration of condition assessments with existing land cover datasets would improve the overall quality and relevance of land data for stakeholders and decision-makers.
Findability
- Option: Investment in a centralised platform
Our stakeholder engagement highlighted the importance that users put on having a centralised platform or a mechanism that facilitates the findability of data. Suggestions for such a platform included features for data layering, access to analytical tools and models, and interactive visualisation in a user-friendly manner. Such a platform should also serve as a single reference point for standards, information, and metadata, preventing unnecessary duplication of efforts and ensuring consistency and accessibility across all stakeholders. The requests for such a platform varied by use case category and are discussed in Chapter 2.
Accessibility
- Option: Open access
Access to land cover and habitat data at zero or low costs is important for users of the data outside the academic and public sectors. With increased engagement of the private sector, low-cost access is important in ensuring a wider use of the data. While data costs are managed through large-scale arrangements by universities and government bodies (e.g., Public Sector Geospatial Agreement with Ordnance Survey), these can be prohibitive for start-ups, small firms, and independent researchers. Making data available to this group can foster innovation, facilitate cross-sector collaboration, and support the development of new use cases in the future.
- Option: Training and capacity building
Current use of land cover and habitat data is focused on specialised users and has a significant cost in terms of the training required by users before they use the data. This limits its use by non-specialist audiences. A publicly available training and capacity-building programme targeted at relevant audiences can support greater use of the data in the future. Additionally, simplifying technical classifications is important—datasets should include non-technical descriptions and clear documentation to help a wider audience understand and apply the information correctly. A user-friendly approach should be prioritised, reducing barriers to dataset usage by incorporating structured guidance, metadata clarity, and interactive platforms.
Interoperability and reusability
- Option: Standardisation and linkages
To promote interoperability and reusability of land cover and habitat data, a standardised approach should be adopted, including the development of look-up or crosswalk tables to facilitate integration across different classification systems and environmental datasets. Additionally, better linking and combination of multiple datasets should be encouraged to reduce reliance on single-source datasets. Establishing a centralised and widely accepted system for standardising data formats and classification schemes is also important over the longer term.
- Option: Consistent classification
Stakeholders identified issues with the use of different classification systems as a challenge to the effective use of land cover and habitat data. To address this, and to enhance interoperability and reusability, land cover and habitat data should aim to establish clear, documented, and validated linkages between systems. The EUNIS classification system and other widely recognised frameworks can be considered as reference points. This would improve usability across different datasets, including emissions data and habitat assessments.
- Option: Creator collaboration
Our research highlighted the importance of collaboration between data creators in producing land cover and habitat data that is easier to link, produce, and maintain. The establishment of sector-working groups can facilitate cross-sector collaboration and set standards for a more joined-up approach to land cover and habitat data, potentially reducing costs and increasing usability.
Prioritising options
There are many competing demands on future resources for the provision of land cover and habitat data, and with limited resources, it can be necessary to prioritise some of these for implementation over others. To facilitate this, we rely on expert assessment ratings to identify options that can be prioritised by NatureScot (The team of authors included Dr David Miller, James Hutton Institute, who has more than 40 years of experience with land cover and habitat data.) The complete list of suggested options with the ratings can be seen in Appendix 6. The assessment criteria for these included:
- Feasibility: How easily can the suggestion be implemented?
- Coverage: Does the suggestion apply to a single use case, or does it affect multiple use cases?
- Cost implication: How costly is the implementation likely to be?
- Impact: How large is the impact of implementing this suggestion, and to the benefit of whom?
Drawing on the results from our assessment, as well as our user engagement, we group the policies to present three different approaches to the prioritisation of options.
1. Options with low cost
These are the options that are assessed to have a low cost of implementation and a high level of feasibility, but can potentially have a high or medium impact across use cases. They also have high feasibility and high coverage across use cases. These include:
- Enhancing documentation: such as metadata, data on methods for data collection and validation, as well as information on any qualifiers on the uses of the data that might be relevant.
- Investing in training and capacity building: This can allow for wider, more inclusive access to land cover and habitat to users who might not have the necessary technical skills.
- Development of a centralised platform:With a wider range of users suggesting a centralised platform that can facilitate the findability of land cover and habitat data, this is an important option to explore. While the development of a fresh platform can be expensive, we note that there are existing alternatives (such as Scotland’s Environment Web and find.data.gov.scot) that can be enhanced, repurposed, or refocused to meet user needs at a low cost. Enhanced signposting that increases the findability of data, ensuring users are able to find the right datasets for analysis, is an important option in this regard.
2. Options with a high impact
These are innovative, high-impact initiatives that are likely to have an impact in the longer term. They can also have a higher cost. These are:
- Open access: The provision of access to land cover and habitat data is the only option in this group. Ensuring availability at zero or very low cost to data users, particularly outside the public and academic sector, can facilitate wider use, innovation, and cross-sector collaboration. However, this can be expensive if measured through possible lost revenues from commercialisation of the data at market rates.
- Establishing direct feedback loops with data users: Existing land cover and habitat data can be enhanced through user networks that can contribute to error reporting, validation, and updates. Developing mechanisms that can support such activity can be a useful way to maintain the data on an ongoing basis.
- Establishing a clear mechanism for dataset updates: Clear and signposted communication of strategic plans for dataset updates can encourage collaboration and contributions from data users and other data creators and enhance the quality and use of data.
1. Options to support future use
These are suggestions that are linked to the forward-looking use cases identified in our primary data collection. Prioritising future-oriented policies would imply ensuring that land cover and habitat data are available to meet the needs for use in carbon markets as well as for climate change restoration and mitigation. The options for this are:
- Ensuring consistency and completeness at a higher frequency to allow for monitoring.
- Improving temporal resolution to capture changes in land cover and habitat dynamics.
- Detailed information and metadata related to these use cases to allow researchers to use them appropriately.
- Investing in forward-looking data and forecasting tools and linking these to data will allow for modelling the impacts of policy and climate change with greater confidence.
Our stakeholder engagement also highlighted the importance of agriculture as an area with increasing use of land cover and habitat data. Options that can support users in this sector include:
- Improvement in accuracy and precision: Improved precision at the field level, and data that can identify farm boundaries, is particularly important for land management and environmental assessments.
- Directed training and support: to provide better access to farmers who rely on the data. This also includes developing platform-based solutions that can be used by farmers without expertise or knowledge of data processing or manipulation techniques.
References
Ananyeva, O. & Emmanuel, R. 2023. Street trees and urban heat island in Glasgow: Mitigation through the “Avenues Programme”’ Urban Forestry & Urban Greening, 86 (August), 128041.
Barnett, T., Valdez-Tullet, J., Bjerketvedt, L.M., Alexander-Reid, F., Hoole, M., Jeffrey, S. and Robin, G. 2024. A multiscalar methodology for holistic analysis of prehistoric rock carvings in Scotland Heritage Science, 12 (1), pp. 1–35.
Barton, O., Healey, J.R., Cordes, L.S., Davies, A.J. and Shannon, G. 2023. Predicting the spatial expansion of an animal population with presence‐only data Ecology and Evolution, 13 (11), e10778.
Brighton, C.H., Massimino, D., Boersch-Supan, P., Barnes, A.E., Martay, B., Bowler, D.E., Hoskins, H.M.J. and Pearce-Higgins, J.W. 2024. The benefits of protected areas for bird population trends may depend on their condition Biological Conservation, 292 (April), 110553.
Cabinet Office, Geospatial Commission and The Rt Hon Lord True CBE 2022. Geospatial Commission annual plan 2022/2023 22 June.
Chuenjitwongsa, S. 2017. How to conduct a Delphi study Cardiff University.
Cristofaro, L., Batty, P., Muir, D. and Law, A. 2024. New insights on habitat use by larval northern emerald dragonflies (Somatochlora arctica) Journal of Insect Conservation, 28 (4), pp. 789–798.
Cushman, S.A., Kilshaw, K., Campbell, R.D., Kaszta, Z., Gaywood, M. and Macdonald, D.W. 2024. Comparing the performance of global, geographically weighted and ecologically weighted species distribution models for Scottish wildcats using GLM and random forest predictive modelingEcological Modelling, 492 (June), 110691.
Dugdale, S.J., Malcolm, I.A. and Hannah, D.M. 2024 Understanding the effects of spatially variable riparian tree planting strategies to target water temperature reductions in rivers Journal of Hydrology, 635 (May), 131163.
Ferraro, K.M. and Hirst, C. 2024. Missing carcasses, lost nutrients: Quantifying nutrient losses from deer culling practices in Scotland Ecological Solutions and Evidence, 5 (3), e12356.
Fielding, A.H., Anderson, D., Barlow, C., Benn, S., Chandler, C.J., Reid, R., Tingay, R., Weston, E.D. and Whitfield, D.P. 2024. The characteristics and variation of the golden eagle Aquila chrysaetos home range Diversity, 16 (9), 523.
Fielding, A.H., Anderson, D., Barlow, C., Benn, S., Reid, R., Tingay, R., Weston, E.D. and Whitfield, D.P. 2024. Golden eagle populations, movements, and landscape barriers: Insights from Scotland Diversity, 16 (4), 195.
Fu, Y., Mao, Y., Jiang, S., Luo, S., Chen, X. and Xiao, W. 2023. A bibliometric analysis of systematic reviews and meta-analyses in ophthalmology Frontiers in Medicine, 10 (March).
Geospatial Commission, 2021. “Byte-ing back better” – Introducing a Q-FAIR approach to geospatial data improvement 25 June.
Government Digital Service, Cabinet Office and Geospatial Commission, 2022. Measuring the economic social and environmental value of public sector location data. 22 August.
Khan, A., Aitkenhead, M., Stark, C.R. and Jorat, M.E. 2023. Optimal sampling using conditioned Latin hypercube for digital soil mapping: An approach using Bhattacharyya distance Geoderma, 439 (November), 116660.
Li, X. and Martino, S. 2024. Assessing the economic feasibility of voluntary carbon markets in land use management scenarios for Scottish saltmarshes Ocean and Coastal Management, 251 (May), 107099.
King, D.M., Mazzotta, M.J. and Markowitz, K.J. 2000. Hedonic pricing method Ecosystem Valuation.
Mahmood, S., Wilebore, B., Jenkins, R., Willis, K.J., Macias-Fauria, M. and Ebrahim, S.M. 2024. A high-resolution soil organic carbon map for Great Britain Sustainable Environment, 10 (1), 2415166.
Marjanovic, S., Ghiga, I., Yang, M. and Knack, A. 2017. Understanding value in health data ecosystems: A review of current evidence and ways forward RAND Corporation.
McIntosh, A.L.S., Langley, L.P., Hilton, G.M., Shaw, J.M. and Bearhop, S. 2024. Flying without fear: Shooting disturbance has little effect on site preferences in a conflict goose species Journal of Applied Ecology, 61 (7), pp. 1612–1625.
Newey, S., Hubbard, C., Gibbs, S., McLeod, J., Smith, A. and Ewald, J. 2024. The distribution of mountain hares and the possible effects of woodland expansion using the Cairngorm National Park as a case study European Journal of Wildlife Research, 70 (4), 72.
O’Connell, M.J. and Prudhomme, C.T. 2024. The need for an evidence-led approach to rewilding Journal for Nature Conservation, 79 (June), 126609.
Ozsanlav‐Harris, L., McIntosh, A.L.S., Griffin, L.R., Hilton, G.M., Cao, L., Shaw, J.M. and Bearhop, S. 2024. Contrasting effects of shooting disturbance on the movement and behavior of sympatric wildfowl species Ecological Applications, 34 (8), e3032.
Peskett, L.M., Heal, K.V., MacDonald, A.M., Black, A.R. and McDonnell, J.J. 2023. Land cover influence on catchment scale subsurface water storage investigated by multiple methods: Implications for UK natural flood management Journal of Hydrology: Regional Studies, 47, 101398.
Riley, T.G., Mouat, B. and Shucksmith, R. 2024. Real world data for real world problems: Importance of appropriate spatial resolution modelling to inform decision makers in marine management Ecological Modelling, 498 (110864), 110864.
Robinson, K.P., Macdougall, D.A.I., Bamford, C.C.G., Brown, W.J., Dolan, C.J., Hall, R., Haskins, G.N., et al. 2023. Ecological habitat partitioning and feeding specialisations of coastal minke whales (Balaenoptera acutorostrata) using a recently designated MPA in Northeast Scotland PLoS ONE, 18 (7), e0246617.
Santos-Neto, E., Figueiredo, F., Oliveira, N., Andrade, N., Almeida, J. and Ripeanu, M. 2015. Assessing the value of peer-produced information for exploratory search arXiv.
Scottish Government, 2024. Overcoming barriers to the engagement of supply-side actors in Scotland’s peatland natural capital markets - Annexes volume
Shewring, M.P., Wilkinson, N.I., Teuten, E.L., Buchanan, G.M., Thompson, P. and Douglas, D.J.T. 2024. Annual extent of prescribed burning on moorland in Great Britain and overlap with ecosystem services Remote Sensing in Ecology and Conservation, 10 (5), pp. 597–614.
Spracklen, B.D. and Spracklen, D.V. 2023. Decline of late spring and summer snow cover in the Scottish Highlands from 1984 to 2022: A Landsat time series Remote Sensing, 15 (7), 1944.
Tassa, A. 2020. The socio-economic value of satellite earth observations: Huge, yet to be measured Journal of Economic Policy Reform, 23 (1), pp. 34–48.
Upcott, E.V., Henrys, P.A., Redhead, J.W., Jarvis, S.G. and Pywell, R.F. 2023. A new approach to characterising and predicting crop rotations using national-scale annual crop maps The Science of the Total Environment, 860 (February), 160471.
Wiltshire, C., Waine, T.W., Grabowski, R.C., Meersmans, J., Thornton, B., Addy, S. and Glendell, M. 2023. Assessing N-alkane and neutral lipid biomarkers as tracers for land-use specific sediment sources Geoderma, 433, 116445.
Appendix 1: Desk-based review methodology
Methods
A systematic search was conducted that allowed us to prioritise evidence from a variety of sources across the literature. This section sets out the search strategy and inclusion/exclusion criteria used to decide if the retrieved studies fit into the evidence review.
Studies identified by the search strategy were combined into a “long list” of relevant studies. The studies included in this long list were subject to a review of titles and abstracts and screened based on the inclusion/exclusion criteria. The screening process led to a “short list” of studies that were read in detail. While reading the short list, the relevant information on the selected studies was recorded using a Research Extraction Sheet (RES). The information recorded was then used to synthesise and summarise the evidence related to the research questions.
Search strategy
We have designed the search strategy to ensure it is targeted at thoroughly answering the research questions. Table 1 below illustrates the keywords used to identify relevant sources for the desk-based review. The keywords have been chosen from initial testing, assessing different combinations of search terms across information sources to determine those that generate the most relevant pieces of literature for our research questions.
Search terms were combined into search strings using Boolean operators (AND/OR/NOT) and other database-specific search operators. Using these strings, we arrived at a long list of studies, which were subsequently screened to see if they met the inclusion criteria (set out below).
| Category | Keywords |
|---|---|
| Subject keywords | Land cover, habitat, GIS |
| Methodology | Data, map*, spatial, model*, “remote sensing”, monitor* |
| Geographic identifier | Scotland |
Different combinations of search terms and keyword fields (e.g., title, abstract, whole record) were used to identify relevant evidence. The chosen search strings and keyword fields were the ones that returned a substantial, but manageable, number of relevant results.
Inclusion and exclusion criteria for studies
A set of inclusion and exclusion criteria was used to decide if the studies, records, and evidence identified from our search were suitable for answering the core research questions of this project. The criteria that will be used to move from a long list of materials towards a short list of studies are listed in the table below.
| Theme | Inclusion Criteria | Exclusion Criteria |
|---|---|---|
| Jurisdiction of the study | Scotland | Any other countries will be excluded. |
| Methodologies | Studies with quantitative methodologies will be included. | All other studies will be excluded. |
| Datasets | Studies must include land cover and habitat datasets. | All other studies will be excluded. |
| Date of research | 2023 onwards (covering the last two years of publications) | Before 2023 |
| Language | English | Any other language. |
| Type of studies | Peer-reviewed journal articles only and government-commissioned research. | All other records will be excluded. |
For searches of academic literature, we focused on the following two established databases: Web of Science and Scopus. The search strings used for each of the databases were recorded to ensure replicability. For grey literature sources, we focused on reports and publications by the Scottish government that can be accessed through their website. This recognises that considerable literature would have been produced prior to 2023 and that some types of uses will not be included in detail (e.g., casework on every planning application, environmental impact assessments for development proposals).
Data management
To ensure the search process was comprehensive and transparent, we used a Research Activity Sheet (RAS) to record all searched terms, accessed sources, the date of the search, and the number of search results.
We recorded and maintained a list of the retrieved references in a specialist software package called Zotero. Zotero is a free, open-source reference management tool that stores citation information (e.g., author, title, and publication fields) and has the ability to organise, deduplicate, tag, and perform advanced searches.
Screening process
The screening started by reviewing the titles of initial search results and removing any duplicate studies to compile a long list of relevant research papers and reports. Our interdisciplinary team screened the abstracts to decide which studies were included in the short list. The screening process to select shortlisted papers was carried out according to the inclusion and exclusion criteria listed in Table 2. A second researcher checked a random sample of decisions to verify agreement with the screening process, with no reported disagreements.
The search retrieved a total of 229 academic papers (191 papers from Web of Science and 38 papers from Scopus) and 86 grey ones from the Scottish government website. Relevant information from these was extracted and recorded on a search list on Excel containing the following information:
- Paper reference number
- Meets long list criteria
- Publication year
- Author
- Title
- Abstract/executive summary
- Country of origin
- Language
- Source
- Meets jurisdiction of the study criteria
- Meets methodologies criteria - ‘YES/NO’
- Meets datasets criteria - ‘YES/NO’
- Meets date of research criteria - ‘YES/NO’
- Meets language criteria - ‘YES/NO’
- Meets type of studies criteria - ‘YES/NO’
- Meets short list criteria - ‘YES/NO’
- Quantitative methodology used
- Land cover and habitat dataset used
‘YES/NO’ columns were used to determine if the papers met each of the inclusion criteria. Only if a paper met all the inclusion criteria, a ‘YES’ was assigned in the column ‘Meets short list criteria’, otherwise a ‘NO’ was assigned. Two additional columns were used to indicate the type of quantitative methodology used (if any) and the name of the land cover or habitat dataset used in the study.
The screening process resulted in a final shortlist of 27 papers (26 academic and one grey) to be read in full. Our primary focus was on recent papers (published within the past two years) and directly concerned with the use of data in Scotland.
Research extraction
To capture the key findings of each study included in the short list, we used a Research Extraction Sheet (RES) that included the following details for each study:
- Paper reference number
- Publication date
- Authors
- Title
- Abstract/executive summary
- Type of publication
- Source
- Country of focus
- Dataset used
- Use Case Category
- Use Case Subcategory
- Secondary Use Case Category
- Secondary Use Case Subcategory
All use case categories and subcategories of land cover and habitat datasets were identified for each paper reviewed, according to the taxonomy developed for this project.
Appendix 2: Land cover and habitat datasets and attributes
In this section, we present a table listing the land cover and habitat datasets identified through our desk-based review. The table lists the dataset along with the following attributes:
- Publication date
- License information
- Spatial resolution
- Thematic or contextual resolution
- Temporal resolution or frequency
- Spectral resolution
We also present a list of the datasets organised by the use cases identified in our taxonomy for the reader’s reference in the second table in this appendix. We note here that one dataset can appear in multiple use case categories, e.g., Ordnance Survey National Geographic Database, UKCEH Land Cover Map, and Landsat satellite imagery.
| No | Dataset | Publication Date | License | Spatial resolution | Contextual (thematic) resolution | Temporal resolution | Spectral resolution | Use cases |
|---|---|---|---|---|---|---|---|---|
| 1 | Scotland Land Cover Map (NatureScot/Space Intelligence SLAM Map) | 2022 | Available under the Open Government Licence v3.0 Maps and data created by Space Intelligence with input and support from NatureScot, © SNH. | 20m | 2022-2 levels of classification based on the European Nature Information System (EUNIS): Level 1: Classifies land cover into 5 general categories. Level 2: Provides a more detailed classification with 28 distinct classes. | 3 versions of this map – 2019, 2020, 2022 (2022, there is a EUNIS level 1 map and a EUNIS level 2 map) | Optical data from Sentinel-2, Synthetic Aperture Radar (SAR) data from Sentinel-1 and data from ALOS-2/PALSAR. | Habitat conservation, local biodiversity assessments, monitoring habitat changes, climate adaptation, planning and land use management. |
| 2 | UK Centre for Ecology & Hydrology Land Cover Maps | 1990-2023 | Creative Commons Attribution 4.0 International License (CC BY 4.0). | 10 m Classified Pixel dataset, classified to create a single mosaic of national cover Land Parcel datasets, which are the result of intersecting the 10 m Classified Pixel dataset with the UKCEH Land Parcel Spatial Framework to generate land parcel attributes. 25 m Pixel Rasterised Land Parcel datasets: the result of rasterising the Land Parcel dataset into 25 m pixels. 1 km summary raster products, summarising dominant land cover class and percentage coverage of each land cover class | 21 land cover classes, including urban, forest, grassland, wetlands, and water bodies. | Annual | Visible light to near-infrared. | Nationwide biodiversity studies, land use and habitat monitoring, policy development (e.g., agri-environment schemes), and climate change modelling. |
| 3 | National Soil Map of Scotland | 1980 | James Hutton Institute Open Data License. | 1:25,000, 1:63,360, 1:50,000 and 1:250 000 scales vector data where coverage. Raster versions if requested. | Soil types and associated properties, including features like organic carbon content, soil texture, and topsoil pH. 1:250,000 national soil map includes descriptions of vegetation associated with mapping units. Data used to derive thematic maps, such as risk maps (erosion, compaction, leaching) and capability maps (e.g., Land Classification for Agriculture, Land Classification for forestry). | 1:250,000 1980 – once 1:25,000, 1:63,360, 1:50,000 from field surveys between 1947 and 1981. | N/A | Agricultural land management, peatland restoration, carbon sequestration studies, and habitat restoration planning. |
| 4 | CORINE Land Cover 2018 | 2018 | Open access policy. | 100 m | 44 land cover categories. | 2017-2018 - updates every 6 years. | Multi-spectral imagery—not specified. | Environmental monitoring, urbanisation analysis, cross-border habitat and ecosystem studies, and reporting. |
| 5 | Copernicus Land Monitoring Service Global Land Cover Change Maps 2019 | 2019 | Open access policy. | 100 m | 23 land cover classes. | 2015 to 2019 – annually. | Multi-spectral imagery—not specified. | Global land cover change detection, environmental impact assessments, sustainable development planning, and climate change mitigation strategies. |
| 6 | ArcGIS Living Atlas of the World Sentinel-2 10m Land Use/Land Cover Time Series | 2022 | Creative Commons by Attribution (CC BY 4.0) license. | 10 m | Nine land categories, including forests, water bodies, urban areas, and croplands. | 2017-2022 – annually. | Visible, near-infrared, and shortwave infrared ranges. | Monitoring of land use changes, urban expansion, agricultural land analysis, and risk assessment. |
| 7 | ESA WorldCover V2 2021 | 2021 | Open access policy. | 10 m | 11 land cover classes. | 10 consecutive months. | N/A | Global habitat mapping, carbon storage analysis, deforestation tracking, and reporting. |
| 8 | CCI Land Cover V2 | 1992 | Creative Commons by Attribution (CC BY 4.0) license. | 150 m, 300 m, 500 m, 1000 m. | 22 land cover classes. | 1992-2015 – annually. | Spectral bands from optical to infrared wavelengths. | Climate change impact studies, global biodiversity assessments, and earth system modelling. |
| 9 | OpenStreetMap Land Cover | 2019 | Open access policy. | Not specified | Residential, industrial, natural, or commercial areas. | Not specified | N/A | Urban planning, science applications. |
| 10 | MODIS Land Cover Map | 2001 | Open access policy. | 250 m, 500 m, and 1,000 m | 17 classes (e.g., forests, grasslands, croplands). | Daily | 36 spectral bands, including visible and infrared wavelengths. | Long-term global land cover change analysis, agricultural and forest monitoring, and climate modelling. |
| 11 | FAO Global Land Cover-SHARE | 2014 | Open access policy. | 30 arc-seconds (~1 sq.km). No resolution in m is provided. | 11 major land cover classes. | 1998-2012 - No detail of frequency of data capturing. | Visible and infrared spectrum. | Global food security planning, agriculture, and ecosystem service valuation. |
| 12 | Dynamic World | 2022 | Open access policy. | 10 m | Water, trees, flooded vegetation, crops, built area, bare ground, snow/ice, and grass. | 5 days.. | 13 spectral bands for vegetation, water detection, and atmospheric corrections. | Land cover monitoring, risk assessment, and habitat change detection. |
| 13 | Land Cover Scotland 1988 (LCS88) | 1988 | Open Government License 3.0 - open access. | 1:25.000 scale vector data (polygons, lines, points). Raster data provided on request. | 126 primary land cover types, plus 1,300 mosaics. | Once from aerial photographic interpretation (1988). | N/A | Land cover studies, ecological and environmental monitoring, land cover and use change detection, inventories (e.g. forestry), environmental impact assessments, local planning casework. |
| 14 | Ordnance Survey National Geographic Database | 2022 | Public sector geospatial agreement (PSGA). | 1 m | Address, Administrative and Statistical Units, Buildings, Geographical Names, Land, Land Use, Structures, Transport, and Water. | Daily | N/A | Infrastructure and land use planning, urban development, and emergency planning. |
| 15 | Native Woodland Survey Scotland | 2014 | Open access policy. | 25 m | Woodland types (birchwood, oakwood, pinewood). Composition (species present, percentage cover). Structural attributes (age classes, canopy cover). Ecological features (deadwood presence, ground flora). Condition assessment (grazing pressure, regeneration potential). | 2006-2013 - frequency not specified. | N/A | Woodland assessments, forestry planning, and conservation. |
| 16 | Peatland Action open data, including data on vegetation for monitoring (2014/15) and resurvey (2021) | 2014, 2015, 2021 | Open access policy. | Restoration data available at 1m resolution, peat depth surveys at 100m. | Vegetation types, restoration feasibility, and project outcomes. | Multi-year, all restoration-related datasets are updated quarterly. | N/A | Peatland restoration tracking, carbon sequestration, and climate change adaptation planning. |
| 17 | National Inventory of Woodland and Trees (Scotland) | 2001 | Open Government Licence - free access. | 1:25.000 - no pixel resolution provided | Woodland types Species composition (dominant and secondary tree species). Age structure and canopy density. Land ownership and management practices. | 1995-1999 - frequency not specified. | N/A | Forest management, carbon stock assessments, and biodiversity planning. |
| 19 | NatureScot Habitats and Species WCS (Habitat Map of Scotland HabMoS) | Various | Open Government Licence - free access. | Various | Habitat classifications according to the EUNIS classification (European Nature Information System) for habitats and biotopes. | Various – updates not specified. | Multi-spectral satellite imagery. | Habitat planning, conservation, and ecological research. |
| 20 | National Soils Inventory for Scotland | 1978-1988 | Open access policy. | 10 km2 | Soil type, texture, organic carbon content, soil pH, vegetation at sample points. | 1978-1988 | N/A | Soil assessments, land use planning, and agricultural management. |
| 21 | Landsat satellite imagery series (including Thematic Mapper) | 1972- ongoing | Open access policy. | 15 m, 30 m, and 100 m | Vegetation, water bodies, urban and built-up areas, agriculture, barren land, snow, and ice. | Weekly and fortnightly. | Visible, near-infrared, shortwave, thermal infrared, panchromatic. | Land cover change studies, environmental monitoring, and disaster management. |
| 22 | UKCEH Countryside Survey data | 1978 | Open Government Licence. | 1 km2 | Habitat types (as grasslands, wetlands, woodlands), plant composition, vegetation structure, soil properties, freshwater quality. | 1978, 1990, 1998, 2007 | N/A | Habitat assessments, biodiversity tracking, and policy support. |
| 23 | LandSFACTS | 2007 | GNU Public License - free access. | Up to 2 million polygons - no specificity given for area. | Types of crops, different land use types. | Annual | N/A | Land-use change modelling, agricultural planning and policy modelling. |
| 24 | Digital Geological Map Data of Great Britain - 625k (DiGMapGB-625) 2008 | 2008 | Open Government Licence. | 1 km2 | Bedrock, superficial deposits, dykes, and linear features (faults). | 2008.2015 | N/A | Geological hazard mapping, land use planning, and resource management. |
| 25 | Worldwide 2 | 2005 | Paid license. | 2 m | Forests, agriculture, wetlands, and urban areas. | Fortnightly | Visible range, near-infrared, and shortwave infrared. | Environmental assessments, policy development, and environmental monitoring. |
| Number | Use case | Datasets |
|---|---|---|
| 1 | Environmental Monitoring and Management | Scottish spatial data portal, Ordnance Survey National Geographic Database, Scottish Habitat and Land Cover Map 2022, EUNIS landcover data, UK Centre for Ecology & Hydrology Land Cover Map, ESA WorldCover V2 2021, MODIS Land Cover Map, Dynamic World, Native Woodland Survey Scotland, Peatland Action open data, including data on vegetation for monitoring (2014/15) and resurvey (2021), Habitat Map of Scotland, NatureScot Habitats and Species WCS, Worldwide 2 |
| 2 | Spatial Planning and Policy | Ordnance Survey National Geographic Database, UK Centre for Ecology & Hydrology Land Cover Map, Copernicus Land Monitoring Service Global Land Cover Change Maps 2019, ArcGIS Living Atlas of the World Sentinel-2 10m Land Use/Land Cover Time Series, Habitat Map of Scotland, National Soils Inventory for Scotland, Digital Geological Map Data of Great Britain - 625k (DiGMapGB-625) 2008 |
| 3 | Scientific Research | National Soil Map of Scotland, Ordnance Survey National Geographic Database, EUNIS land cover data, Land Cover of Scotland 1988, CORINE Land Cover 2012, UK Centre for Ecology & Hydrology Land Cover Map, Landsat, OpenStreetMap Land Cover, Digital Geological Map Data of Great Britain - 625k (DiGMapGB-625) 2008 |
| 4 | Agriculture, Forestry, and Urban and Infrastructure Development | UK Land Cover Map 2015-2020, Landsat, UK Centre for Ecology & Hydrology Land Cover Map and Ordnance Survey National Geographic Database, ArcGIS Living Atlas of the World Sentinel-2 10m Land Use/Land Cover Time Series, MODIS Land Cover Map, FAO Global Land Cover-SHARE, National Soils Inventory for Scotland, LandSFACTS |
| 5 | Others | None |
Appendix 3: Fieldwork methodology
The primary fieldwork for this research adopted a mixed-methods approach, comprising an online survey and in-depth interviews. The purpose of the fieldwork was to generate novel insights on the use, need, and value of land cover and habitat for public sector and private stakeholders in Scotland. All research activities were developed and delivered between December 2024 and February 2025.
Survey
We developed an online survey structured according to the key research questions for this project, ensuring that the survey questions addressed each research question clearly and in detail. The questions were also informed by insights from the desk-based review and reviewed by the project Steering Group to ensure accuracy and appropriateness.
The survey was administered online using Microsoft Forms and included a mixture of multiple-choice and free-text fields to allow respondents to elaborate on their views. The questions addressed five (5) broad topics:
- respondents’ use of land cover and habitat data
- the perceived need for these datasets
- critical gaps, challenges, and barriers faced by users
- the perceived value these datasets create across sectors in Scotland
- recommendations for the future provision of these datasets to ensure that they are fit-for-purpose and accessible. Some questions address land cover and habitat data broadly, while others focus on specific features of these datasets.
The survey was distributed to public and private sector stakeholders across Scotland who had experience using or generating land cover and habitat data. To ensure a diverse sample of respondents, the survey was disseminated through multiple channels by stakeholders at NatureScot, the James Hutton Institute, and the Scottish Government. The survey was also distributed on Alma Economics’ social media channels for wider reach.
The survey received 41 complete responses. Of these, 39 were users of land cover and habitat data, while two (2) generated these datasets. Respondents represented a variety of organisations and role types, as shown in Figures 2 and 3 below.
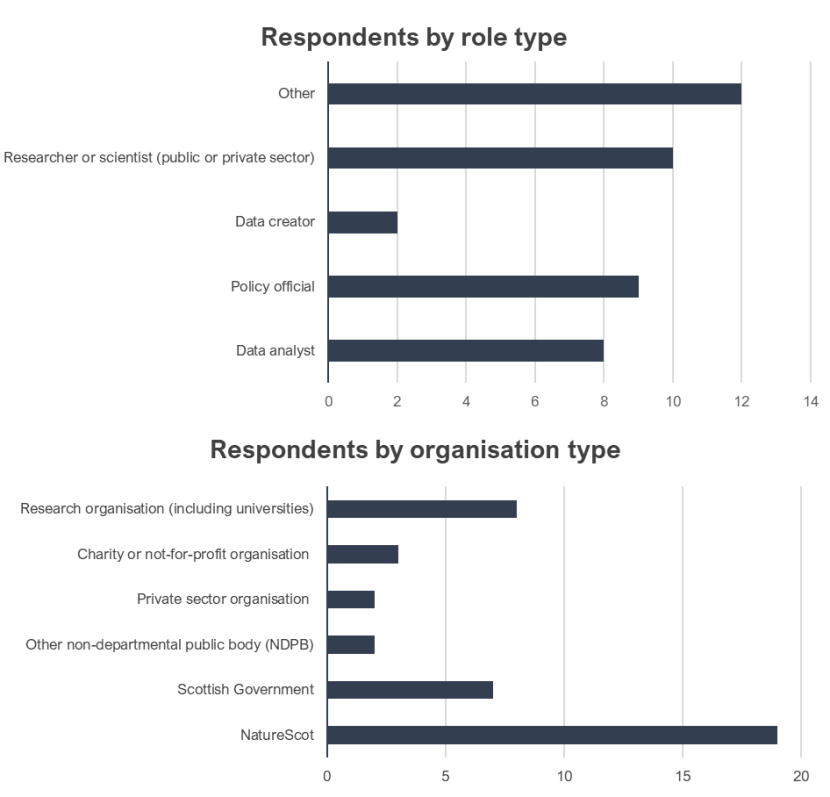
Figure 18. Number of respondents by role and organisation type
Click for a full description
Horizontal bar chart titled "Respondents by role type." The chart shows the number of respondents for each role: Other (12), Researcher or scientist (public or private sector) (10), Policy official (9), Data analyst (8), and Data creator (2).
Horizontal bar chart titled "Respondents by organisation type." The chart shows the number of respondents from each organisation type: NatureScot (highest, around 19), Research organisation (including universities) (about 8), Scottish Government (about 6), Charity or not-for-profit organisation (about 4), Other non-departmental public body (NDPB) (about 3), and Private sector organisation (about 2).
Complete survey findings are discussed in detail in ‘Understanding user needs: Fieldwork insights’ (p. 9). A copy of the Privacy Notice for this survey can also be found in Appendix 4.
Interviews
We also conducted in-depth, online interviews with 36 public sector and private stakeholders in Scotland. Of these, 26 were data users, three (3) were data creators, and seven (7) both used and created land cover and habitat data. All participants who expressed interest within the engagement timeframe were invited to participate. Interviews lasted up to 60 minutes and were held over Microsoft Teams to maximise accessibility and flexibility.
Similar to the survey, semi-structured interview discussion guides were developed according to the key research questions for this project. These were also informed by the desk-based review findings as well as expert steers from the project Steering Group. The discussion guides addressed six (6) broad themes: (i) participants’ use (or generation) of land cover and habitat data, (ii) the perceived importance and value of these datasets, (iii) critical gaps, challenges, and barriers faced by participants, (iv) the perceived need for these datasets across sectors in Scotland, (v) recommendations for the future provision of these datasets to ensure that they are fit-for-purpose and accessible, and (vi) insights on future considerations for these datasets.
Complete interview findings, including breakdowns by use case, are discussed in detail in ‘Understanding user needs: Fieldwork insights’ (p. 9). A copy of the Terms of Participation for the interviews can be found in Appendix 4.
Analysis
We analysed qualitative survey and interview data using four iterative steps of thematic analysis, i.e., familiarisation, coding, theme development, and write-up, paying particular attention to patterns and differences or similarities between or within use cases. Closed-response survey questions were analysed quantitatively.
Insights generated from the primary fieldwork are presented in the fieldwork insights section. They also informed the development of the user personas and the options for future provision.
It should be noted that the findings from our primary fieldwork represent only the views of those who voluntarily chose to participate in this research. This should be kept in mind when interpreting the fieldwork findings in the report.
Appendix 4: Interview terms of participation
Project title: Understanding the need and value of land cover and habitat data
What is the purpose of the study?
You are invited to take part in a research project aimed at understanding the need and value of land cover and habitat data. Alma Economics have been commissioned by NatureScot to undertake this research. As part of this, we are collecting the views of people who create and use this data.
The insights generated from this research will help NatureScot to identify opportunities for improvement and develop strategies for the future development and provision of land cover and habitat data. The findings will also contribute to a publicly available report accessible via NatureScot’s website.
Do I have to take part?
It is up to you and you alone whether you wish to take part. If you do decide to take part, you can still choose not to answer any questions you do not want to, and you will be free to withdraw at any time without providing a reason and without any negative consequences.
What would I be required to do?
You have been asked to participate in an online interview with Alma Economics lasting between 45 and 60 minutes. We will ask about your experience of using land cover and habitat data as well as your views on related topics.
Will my participation be anonymous and confidential?
Your participation will be fully anonymous, and your personal data will not appear in any published material. We will always ask for explicit consent from you if we wish to share any personal information, such as the name of your organisation.
If we choose to quote directly some of your words or refer to any examples you mention, we will not use your real name. Quotes and examples will be further edited where needed to omit information that could result in your identification. Please note that this does not mean that you will necessarily be quoted, which will be determined by the needs of the analysis.
Informed consent
It is important that you are able to give your informed consent before taking part in this study, and you will have the opportunity to ask any questions in relation to the research before you sign the Participant Consent form included below.
What should I do if I have concerns about this study?
Please contact Project Director Alastair Brown at [email protected] Alastair is a Director at Alma Economics and is overseeing this research.
Contact details
For any communication other than concerns, please contact Project Manager Rob Dutfield at [email protected] or Shantanu Singh at [email protected]
Privacy notice
What is personal data?
Personal data is defined under the UK General Data Protection Regulation (UK GDPR) as ‘any information relating to an identified or identifiable natural person’.
What personal data will you be collecting from me as part of this research?
As part of this research, we will be collecting personal data, including your name, email address, organisation, and job role. This information will only be used to inform the practical aspects of this research to ensure that our sample is representative. It will not be used for identification purposes or shared beyond the research team. We will always ask for explicit consent from you if we wish to share any personal information, such as the name of your organisation.
We will also collect information on your use of land cover and habitat data, as well as your views on a set of questions related to this topic. The insights you share with us will be reported anonymously and will not be attributable to your personal information.
Under GDPR, the lawful basis we rely on for processing this information is your consent. You are able to remove your consent at any time. You can do this by contacting Project Manager Shantanu Singh at [email protected]
How will my data be stored, for which period, and who will have access to it?
Your data will be stored securely electronically. After the completion of the research project, no personal data will be retained. Your anonymised data may be retained indefinitely and used for any legitimate purpose in future.
All of our computers use full disk encryption. This ensures that the whole disk will remain unreadable in case of accidental loss or theft. If we destroy the data, the full disk encryption means any retrieved deleted files are unreadable.
For more information about Alma Economics IT & Data Security Policy, please send an email to: [email protected]
How will you use and in what form will you share my data?
The data collected will be used to inform the research findings and will result in a publicly available report accessible via NatureScot’s website.
Your participation will be fully anonymous, and your personal information will not appear in any published material. If we choose to quote directly some of your words or refer to any examples you mention, we will not use your real name.
All interviews will be audio-visually recorded with your consent. Recordings will only be accessible by Alma Economics and used to assist with notetaking. They will not be used for any other purposes.
What are my rights regarding the data I provide?
You have several rights under UK GDPR, including the right to request access to and/ or to withdraw your personal data for the period we hold it (i.e., before it is destroyed). Note that if your data is anonymised, we will not be able to withdraw it, because we will not know which data is yours.
You can read all of your rights under UK GDPR here.
Our Data Protection Officer (DPO) is responsible for explicitly addressing all matters relating to GDPR. Our security policies have been revised to meet GDPR, and we have ready-to-use protocols for participants wanting to access or delete data and for data breaches. For more information, you can contact our DPO (Evan Spyropoulos) by sending an email to: [email protected].
What if I have concerns about how my data is being handled?
If you have concerns about how we have processed your personal data, you can contact Project Director Alastair Brown at [email protected].
You also have the right to raise any concerns you have with the Information Commissioner’s Office (ICO) or another data protection regulator. You can find details about how to contact ICO here.
Participant consent form
Please consider the following points before signing this form and ask the researcher(s) any outstanding questions you may have before the start of the research. Adding your name to this form confirms that you are willing to participate in this project. You are free to withdraw your participation at any time without providing a reason.
| Statement | Yes | No |
|---|---|---|
| I understand that my participation is entirely voluntary and that I can withdraw from the study at any time without giving an explanation. | - | - |
| I understand that I will be able to withdraw my data at any point before data collection for this research is complete, and I understand that if my data has been anonymised, it cannot be withdrawn. | - | - |
| I agree to being quoted anonymously in relevant research outputs. | - | - |
| I agree to have my interview recorded and transcribed for analytical purposes, and I understand that if the interview takes place through a video call, and my camera is enabled, the recording will capture both audio and video. | - | - |
| I agree to take part in the above research. | - | - |
Appendix 5: Survey privacy notice
Project title: Understanding the need and value of land cover and habitat data
What is personal data?
Personal data is defined under the UK General Data Protection Regulation (UK GDPR) as ‘any information relating to an identified or identifiable natural person’.
What personal data will you be collecting from me as part of this research?
As part of this research, we will be collecting data on your role, the type of organisation you work for, and, if you are interested in participating in a follow-up interview, your email address. We will also be collecting your opinions on a set of questions related to the need and value of land cover and habitat data. Under GDPR, the lawful basis we rely on for processing this information is your consent. Completion of the survey will be taken as consent.
How will my data be stored, for which period, and who will have access to it?
Your data will be stored securely electronically. After the completion of the research project, no personal data will be retained. Your anonymised data may be retained indefinitely and used for any legitimate purpose in future.
All of our computers use full disk encryption. This ensures that the whole disk will remain unreadable in case of accidental loss or theft. If we destroy the data, the full disk encryption means any retrieved deleted files are unreadable.
For more information about Alma Economics IT & Data Security Policy, please send an email to: [email protected]
How will you use and in what form will you share my data?
The insights you share will contribute to a report being drafted for NatureScot on an anonymised basis and so represent an opportunity to provide candid feedback on the use, need, and value of land cover and habitat data. This report will be used to shape the future of land cover and habitat data in Scotland, ensuring that it continues to meet evolving user and policy needs.
What are my rights regarding the data I provide?
You have several rights under UK GDPR, including the right to request access to and/or to withdraw your personal data for the period we hold it (i.e., before it is destroyed). Note that if your data is anonymised, we will not be able to withdraw it, because we will not know which data is yours.
You can read all of your rights under UK GDPR here.
Our Data Protection Officer (DPO) is responsible for explicitly addressing all matters relating to GDPR. Our security policies have been revised to meet GDPR, and we have ready-to-use protocols for participants wanting to access or delete data and for data breaches. For more information, you can contact our DPO (Evan Spyropoulos) by sending an email to: [email protected]
What if I have concerns about how my data is being handled?
If you have concerns about how we have processed your personal data, you can contact Project Manager Rob Dutfield at [email protected]
You also have the right to raise any concerns you have with the Information Commissioner’s Office (ICO) or another data protection regulator.
You can find details about how to contact the ICO here.
Appendix 6: Options for future provision
This section presents a list of options for future provision of land cover and habitat data, as proposed by stakeholders during our engagement exercise. We present the suggestions as described during the engagement exercise, to preserve their intended meaning. We do, however, assign the suggestions into “Themes” to facilitate further analysis. The options are organised along the dimensions of the Q-FAIR framework, and presented along with expert assessment of the feasibility, coverage, cost implication, and impact of these options.
Quality
| Suggestion | Theme | Feasibility | Coverage | Cost implication | Impact |
|---|---|---|---|---|---|
| Improvements to identifying habitat conditions, not just habitat type. | Habitat conditions | Medium | Low | Medium | High |
| Improved coverage across whole of Scotland. | Coverage | High | Medium | High | High |
| Periodic and predictable dataset updates according to the nature of the data. | Frequency | High | Medium | High | Medium |
| Improved resolution, particularly for large-scale maps to avoid errors due to extrapolation. | Spatial resolution | Medium | Medium | High | Medium |
| Systematic validation. | Validation | High | Medium | High | Medium |
| Mix data sources/techniques/methodologies to improve accuracy, lower costs (compared to traditional field surveys), and ensure it is meaningful for multiple needs and uses. | Technological enhancement | High | Medium | High | High |
| Leveraging technology. | Technological enhancement | Medium | Medium | High | High |
| Consistent and trustworthy datasets that provide reassurance to users. Provide users with all the relevant information about datasets so they can make the most informed analysis. | Documentation | High | High | Low | High |
| Datasets must come with more guidance of use on the methdology. | Documentation | High | Medium | Low | Medium |
| Having more updated information with periodic updates. | Documentation | High | Medium | Medium | Medium |
| Ground-truthing: Revisiting survey sites, as some data can be quite old (20-30 years old). However, they note this is going to be difficult and expensive to achieve. Satellite imagery can help in this sense. | Validation | High | Low | Medium | Medium |
| Clarity on data sources and data creation: Metadata is definitely useful. Knowing who collected the data and when it was gathered is important. Ground-truthed data is generally more reliable than satellite data, so knowing the methodology helps assess accuracy. | Documentation | High | High | Low | Medium |
| Additionally, it would be helpful if datasets clearly stated the required attribution or copyright information, as this can sometimes be confusing. | Documentation | High | High | Low | High |
| It’s also important to understand how the data was collected. | Documentation | High | Medium | Low | Medium |
| A clear mechanism for reporting errors. | Others | High | Low | Medium | Medium |
| Improved geographical scope. | Coverage | High | Medium | Low | High |
| Yearly refinements to classification algorithms used for satellite/aerial imagery lead to subtle changes across years that are not based on actual changes on the ground. | Documentation | ||||
| Improved temporal scope & resolution (frequency of mapping). | Frequency | Medium | Medium | High | Medium |
| Higher quality spatial resolution. | Spatial resolution | High | Medium | Medium | Medium |
| Assessing the condition of habitats and land cover. | Habitat conditions | Medium | Low | Medium | High |
| Validating data via ground-truthing. | Validation | High | Low | Medium | Medium |
| Coverage of all habitats. | Coverage | High | Medium | High | High |
| Driving data from the “objective end” and focusing on mapping areas to manage land and reduce carbon emissions effectively. | Others | Medium | Medium | Low | High |
| Improved metadata, including more detailed descriptions of dataset and data validation. | Documentation | High | High | Low | Medium |
| Many emissions models have ‘hidden’ models, meaning there is no direct access to the assumptions and methodologies behind them. | Documentation | Medium | Low | High | High |
| Clearer guidance on best available ground/local survey data and highlighting strengths/limitations of datasets. | Documentation | High | Low | Low | High |
| Clearer signposts to reliable ground surveys vs the more probabilistic data products derived from aerial/satellite imagery, etc. | Documentation | High | Low | Low | High |
| Establishing baseline for the extent and condition of habitats in Scotland. | Others | High | Low | Medium | High |
| Developing metrics used to evaluate certain decisions (different to data). Important for various policy and practice scenarios that need reliable metrics to assess both pre- and post-development impacts. | Additional metrics | ||||
| Accuracy must be improved. | Accuracy | High | Medium | Low | High |
| Resolution should be improved. | Spatial resolution | High | Medium | Medium | Medium |
| Accuracy: Some datasets made in England are not accurate for Scotland; there is a need to build systems that recognise the way that land is divided in Scotland. | Accuracy | High | Medium | Medium | High |
| Accuracy: Farm boundary identification must be enhanced. | Accuracy | Low | Medium | Medium | Low |
| Accuracy: ‘White lands’ are not mapped, which should be addressed. | Accuracy | High | Medium | Medium | High |
| Use more technology. | Technological enhancement | High | Medium | Medium | Medium |
| Introduce the use of LIDAR for 3D mapping. | Technological enhancement | High | Low | Medium | High |
| Frequency of habitat mapping should be increased. A way of making this a consistent process to assure users of the reliability of data is also needed. | Frequency | High | Medium | High | High |
| Increase the geographical scope. | Coverage | High | Medium | NA | NA |
| It would be good to be able to estimate condition of a habitat. | Habitat conditions | Medium | Low | Medium | High |
| It would be good to be able to estimate vegetation height. | Additional metrics | High | Low | Low | High |
| Satellite AI machine learning should be prioritised and “become the norm”. | Technological enhancement | High | Medium | Medium | Medium |
| Commitment from data creators to update data regularly. | Frequency of update | Medium | Medium | Medium | Medium |
| Clarity on how the data was created and on the statistical reporting underpinning it. This would provide data users with more confidence in the data and assure them it is reliable for the work they will be doing. | Documentation | High | High | Low | Medium |
| Classifications: It is important to ensure consistency of data with a classification that is designed. | Classification | High | High | Medium | High |
| There is room for resolution improvements. | Spatial resolution | High | Medium | Medium | Medium |
Findability
| Suggestion | Theme | Feasibility | Coverage | Cost implication | Impact |
|---|---|---|---|---|---|
| Consistent, centralised platform. Platform that integrates all datasets, so users do not need to go to the individual source unless they specifically require it. Would need to allow for layering up the data you are interested in, plus access to tools and models on top of that. Should not be recreating the platform for every new analysis. | Centralised platform | High | Medium | Low | Medium |
| Helpful to have somewhere to point to and standards/information in one place. | Centralised platform | High | High | Low | Medium |
| Making data platforms as user-friendly as possible: Having all the data in one place would be really useful. For example, the Scotland Environment Web allows users to explore available datasets, switch layers on and off, and see what exists for different areas. Having access to a platform where users can interact with the data, rather than just downloading raw datasets, would be incredibly helpful. While it's good to be able to import data into GIS and integrate it with other mapping tools, having a pre-configured interface where users can manipulate and visualise it directly saves a lot of time. It takes time to figure out how to symbolise data effectively, so having some of that work done in advance makes things easier. | Centralised platform | High | Medium | Medium | Medium |
| Unified centralised system that holds all data in one place. | Centralised platform | High | Medium | Medium | Medium |
| Centralised platform for datasets. | Centralised platform | High | Medium | Low | Medium |
Accessibility
| Suggestion | Theme | Feasibility | Coverage | Cost implication | Impact |
|---|---|---|---|---|---|
| All data should be open access, or at the very least, low-cost. | Open access | Medium | High | High | High |
| How to access and use data. | Open access | High | Medium | Low | High |
Interoperability and reusability
| Suggestion | Themes | Feasibility | Coverage | Cost implication | Impact |
|---|---|---|---|---|---|
| Improved joined-up working between stakeholders (for efficiency and validation). | Collaboration | Medium | Medium | Medium | Medium |
| Establish sector working groups to facilitate cross-sector collaboration and to set standards. | Collaboration | High | High | Low | Medium |
| Focus on measuring change in classifications in light of climate change. | Classification | Medium | Low | High | Low |
| Platform to enable Scottish public sector bodies to share data. Scottish Environment Web – platform for live data-sharing across agencies. For example, allowed users to pull data on protected sites and compare it with flood data. Platform beneficial from user perspective. | Platform | High | Medium | Medium | Medium |
| Flexibility to add priority categories (e.g., bracken). | Additional features | Medium | Low | Medium | High |
| More regularly shaped data. | Format | High | Medium | Low | Low |
Last updated:


