NatureScot Research Report 1362 - Developing a toolkit for monitoring the success of peatland restoration projects using remote sensing and wireless sensor networks
Published: 2025
Authors: Hunter, P.D., Silva-Perez, C., Salakpi, E.E., Marino, A., Modlich, M., Blake, M., Simpson, M. and Subke, J.A. (Scotland’s International Environment Centre, University of Stirling)
Cite as: Hunter, P.D., Silva-Perez, C., Salakpi, E.E., Marino, A., Modlich, M., Blake, M., Simpson, M. and Subke, J.A. 2025. Developing a toolkit for monitoring the success of peatland restoration projects using remote sensing and wireless sensor networks. NatureScot Research Report 1362.
Keywords
environmental monitoring; Earth observation; remote sensing; wireless sensor networks; peatland condition; hydrology; carbon dynamics
Background
Peatlands are Scotland’s largest carbon store. In recent years, significant sums of public funding have been invested in peatland restoration projects to reverse historical declines in condition, to better protect these ecosystems against future damage, and to enhance their capacity for carbon sequestration as a nature-based solution to the climate crisis. Monitoring is an integral component of peatland restoration projects, being central to furthering our understanding of how peatland ecosystems respond to different restoration measures but also to evidencing progress against management and policy objectives. However, peatlands can take several years or longer to respond to restoration measures, and monitoring changes over long time periods at a national scale is highly challenging.
The assessment of peatland condition at a national scale will require greater use of data from satellite sensors. Remote sensing is arguably the only approach that can be used repeatedly to capture data over Scotland’s entire peatland resource to assess its condition regularly at the national scale. However, there are few examples of remote sensing tools being used operationally (i.e. continuous real-time monitoring using automated approaches) for peatland condition monitoring in the UK or elsewhere.
The central aim of this project was to demonstrate the feasibility of an operational peatland monitoring service in the Forth Valley region. Satellite data products related to peatland hydrology and carbon dynamics were developed from optical and Synthetic Aperture Radar (SAR) data with the underpinning processing chains operationalised on a high-performance computing infrastructure. The satellite data products were augmented by establishing an Internet of Things (IoT)-enabled sensor network. This provided high-temporal data to complement the spatial coverage afforded by satellite observations and support the training, testing and validation of processing chains. This report provides detail on the infrastructure and monitoring service that has been established in the Forth Valley region alongside examples of the data products and their applications. Finally, the report evaluates the potential for mainstreaming remote sensing as a tool for peatland condition monitoring at scale.
Main findings
Indicators of peatland hydrological status such as the water table depth can be monitored using data from SAR satellites with high accuracy and the approach is robust across multiple peatland sites.
Interferometric SAR (InSAR) can be used to track the surface motion of bogs (so-called ‘bog breathing’), which is an indicator that integrates changes in bog hydrology, vegetation growth and peat accumulation over time.
Data from optical and thermal sensors can be used synergistically to estimate changes in gross primary production (GPP; carbon uptake) and net ecosystem exchange (NEE; carbon balance). This has been verified by comparisons to available data from selected Scottish peatlands and long-term data from Scandinavian peatlands forming part of the International Carbon Observing System (ICOS).
The greater availability of in-situ data on peatland carbon fluxes from eddy covariance flux towers and chambers would greatly benefit the training, testing and validation of these remote sensing algorithms for GPP/NEE and their transferability in space and time.
IoT-enabled sensor networks provide high frequency data that can be used synergistically with satellite remote sensing providing deeper insights into the peatland responses to restoration, information on variables that cannot be observed from space, and invaluable data for training, testing, and validating remote sensing methods.
Satellite data processing chains for the assessment of peatland condition can be operationalised on high-performance computing infrastructures and made ‘cloud-ready’ enabling peatland condition to be monitored at scale (i.e. nationwide) with enhanced reliability and interoperability.
Constraints and limitations to the mainstreaming of satellite remote sensing for peatland condition monitoring include the sparsity of data available for model training, testing and validation, particularly for greenhouse gas fluxes, which affects the accuracy and transferability of models across different peatland sites and types.
Data on peatland condition can be visualised on the web in near-real time making the information easily accessible to nature conservation agencies, investors and funders, and other stakeholders, maximizing the visibility of peatland restoration schemes and their contribution to Scotland’s net zero efforts.
Harnessing new sensing technologies, including satellite observations and wireless sensor networks, with cloud computing and data-driven modelling would enhance and scale existing peatland monitoring efforts. This project has demonstrated the technologies are now sufficiently mature to enable monitoring at scale to be undertaken operationally.
Acknowledgements
The research presented in this report was co-funded by the Peatland ACTION Data & Evidence team at NatureScot and Scotland’s International Environment Centre. Scotland’s International Environment Centre is funded by UK and Scottish Government under the Stirling and Clackmannanshire City Region Deal.
Abbreviations
Application Programming Interface (API)
Ecosystem Respiration (RECO)
Enhanced Vegetation Index (EVI)
European Centre for Medium-Range Weather Forecasts (ECMWF)
European Space Agency (ESA)
Forth Environmental Resilience Array (Forth-ERA)
Gross Primary Production (GPP)
Interferometric Synthetic Aperture Radar (InSAR)
Intermittent Small BASeline (ISBAS)
International Carbon Observing System (ICOS)
Internet of Things (IoT)
Land Surface Temperature (LST)
Line of Sight (LOS)
Mean Absolute Error (MAE)
Message Queuing Telemetry Transport (MQTT)
Multi-Spectral Images (MSI)
Near Infra-Red of vegetation (NIRv)
Net Ecosystem Exchange (NEE)
Normalised Difference Vegetation Index (NDVI)
Normalised Difference Water Index (NDWI)
Photosynthetically Active Radiation (PAR)
Secure File Transfer Protocol (SFTP)
Small BASeline (SBAS)
Surface Soil Moisture (SSM)
Synthetic Aperture Radar (SAR)
Temperature Greenness (TG)
Vertical Transmit - Horizontal Receive (VH)
Vertical Transmit - Vertical Receive (VV)
Virtual Private Network (VPN)
Water Table Depth (WTD)
Introduction
The Scottish Government has set an ambitious target of achieving net-zero greenhouse gas emissions by 2045. To meet this target, significant improvements in land management will be required, particularly in relation to peatlands because these ecosystems have an almost unrivalled capacity to sequester and store large quantities of carbon. Scotland has an extensive peatland resource which covers more than 20% of its land surface (Chapman et al., 2009; Aitkenhead and Coull, 2019) and is estimated to hold around 1889 Mt of carbon (Aitkenhead and Coull, 2019). However, many Scottish peat bogs have been degraded by poor land management (e.g. drainage, afforestation, overgrazing), reducing their capacity to sequester and store carbon and, in some cases, causing bogs to act as a net source of carbon to the atmosphere thereby contributing to climate warming. Indeed, although there are large gaps in the data, there is general consensus that around 75% of Scotland’s peatland is degraded to some extent (Evans et al., 2017).
In view of the importance of peatlands to the mitigation of climate change, the Scottish Government is investing £250 million between 2020-2030 through the Peatland ACTION programme in projects to rehabilitate degraded peatlands and restore their natural capacity to sequester and store carbon. In total, the Scottish Government is aiming to restore 250,000 ha of degraded peatland by 2030. Many peatland restoration schemes focus on rewetting (e.g. via drain blocking) to promote the growth of Sphagnum mosses as the main peat-forming plant species, but other measures such as forestry removal, stabilisation and reseeding of bare peat, and scrub control are also common. However, the success of these restoration measures can vary considerably in terms of the net effect on water storage, vegetation dynamics and carbon balance at the ecosystem-scale, and the rate at which favourable conditions return in response to restoration measures.
The implementation of effective peatland monitoring programmes is therefore critical if the success of restoration projects, in terms of the net environmental benefit and the so-called ‘carbon return on investment’, is to be robustly evaluated and used to inform future practice and evidence delivery against policy objectives. However, monitoring the success of peatland restoration projects is far from straightforward due to a number of challenges including but not limited to:
- the identification of pre-restoration baselines or appropriate control sites against which changes can be assessed (particularly in the context of a changing climate);
- the fact that positive environmental benefits might not be realised until many years after restoration work has been undertaken; and
- the sheer extent and dispersed nature of the peatland resource across Scotland.
Monitoring programmes implemented to measure the success of peatland restoration projects typically focus on quantifying changes in hydrology and vegetation as indicators of ecosystem recovery. Measurements of carbon flux (e.g. via static chambers or eddy covariance flux towers) are being made at some sites, but these are limited in number because of the complexity and expense of the instrumentation used. Because it can take decades to restore the ecological function of a degraded peatland (Alderson et al., 2019; Allan et al., 2023), monitoring programmes typically aim to characterise the trajectory of change against a baseline or control site, rather than the achievement of a specific endpoint, to demonstrate the ecosystem is ‘on the road to recovery’. But even determining the trajectory of change in peatland condition can require monitoring to be conducted over a period of several years. Furthermore, while the standard field-based methods used to measure changes in peatland hydrology, vegetation and, to an extent, carbon balance, provide detailed data for specific locations or small areas, these data might not adequately capture changes at the ecosystem-scale and cannot be easily replicated across large areas without costs becoming prohibitive.
Some of the limitations of existing peatland monitoring strategies could be addressed by the improved use of remote sensing technologies to augment and expand on conventional field-based methods. The main advantages of using satellite data to support peatland monitoring include:
- the ability to rapidly and synoptically observe large expanses of peat;
- frequent revisit periods (i.e. 3-5 days for Sentinel-2) allowing for more detailed trajectories to be established;
- the ability to standardise data acquisition and processing methods across space and time; and
- the potential to use the data to upscale field measurements to assess change in condition at the ecosystem-scale.
Despite these advantages and significant technological advancements in satellite technologies over recent years, remote sensing remains an underutilised tool for peatland condition monitoring, particularly in an operational context (i.e. continuous near real-time monitoring using highly automated pipelines). In recent years, there has also been increased use of wireless sensor networks for environmental monitoring as the technology has become more accessible, reliable, and affordable. These networks are typically comprised of multiple distributed sensors, often powered off-grid (e.g. via photovoltaics), with the capacity to transmit data automatically over cellular networks to a database hosted on a physical or cloud server often with (near) real-time web-based data visualisation and reporting.
The main advantage of using wireless sensor networks for environmental monitoring is the ability to collect data continuously at high frequency (e.g. seconds to days) without the need to physically visit the site to collect data thereby reducing disturbance, cost, and carbon emissions. Wireless sensor networks are a highly synergistic approach to remote sensing because the high frequency data they provide can be invaluable for the training, testing and validation of remote sensing algorithms. Furthermore, high frequency sensor data can support the interpretation of more infrequent satellite observations, support the filling of gaps in satellite time-series, and allow other parameters to be measured that cannot be observed using satellite sensors. Sensors for the measurement of parameters such as water table depth are relatively widely used to support peatland condition monitoring, and there are peatlands in the UK and elsewhere equipped with more sophisticated instrumentation for measurement of greenhouse gas fluxes and other parameters. However, there are relatively few examples of highly integrated sensor networks with real-time data telemetry, automated data processing and web-based visualisation being used to support peatland monitoring in the UK.
The work presented in this report was undertaken as part of the Forth Environmental Resilience Array (Forth-ERA) – a large-scale programme to establish a digital environmental observatory for the Forth Valley region. Supported by co-funding from the Peatland ACTION programme, the central aim of this research was to develop, implement and evaluate scalable remote sensing methods for peatland condition assessment and to demonstrate how these can be effectively used to augment and extend more conventional field-based monitoring approaches. The project has instrumented several peatland restoration sites in the Firth of Forth catchment with sensors and the data were used alongside existing monitoring data to calibrate and validate remote sensing data indicators of peatland condition and recovery. These indicators included peatland hydrology (water table depth), gross primary production (GPP) and net ecosystem exchange (NEE). The report details the work undertaken to establish an integrated systems-based approach for peatland monitoring in the Forth Valley region as a demonstration for what could be achieved at a national scale. Further, it evaluates the integration of remote sensing and wireless sensor networks as a tool for monitoring peatland condition at scale and considers how these approaches can be mainstreamed, upscaled and operationalised in the future.
Wireless sensor networks for peatland condition monitoring
A wireless sensor network covering five peatlands in the Firth of Forth catchment was established to evaluate the potential of these technologies for peatland condition assessment and to provide data to support the training, testing and validation of remote sensing algorithms. The sensor network was designed to provide data on key indicators of peatland condition and function related to (1) hydrology and (2) greenhouse gas fluxes. In addition, stations for the measurement of standard meteorological parameters were also included within the network to provide supplementary data to aid the interpretation of other indicators. The main indicator types and parameters measured by the sensor network are summarised in Table 1.
| Indicator type | Measured parameters | Sensors | Measurement frequency | Transmission frequency |
|---|---|---|---|---|
| Hydrology | Water table depth | OTT Hydromet Ecolog 1000 | 1 hour | 12 hours |
| Hydrology | Soil Moisture Profiles | HOBOnet multi-depth soil moisture and temperature | 15 min | 1 day |
| Hydrology | Land-air H2O flux | LiCOR eddy covariance tower | 30 min | 30 min |
| Greenhouse gas fluxes | Land-air CH4 flux | LiCOR eddy covariance tower | 30 min | 30 min |
| Greenhouse gas fluxes | Land-air CO2 flux | LiCOR eddy covariance tower | 30 min | 30 min |
| Greenhouse gas fluxes | Land-air CO2 flux
| Eosense forced diffusion chambers | 1 hour | 1 hour |
| Meteorology | Air temperature Relative humidity Rainfall Wind speed Wind direction Photosynthetically Active Radiation (PAR) | HOBO RX2100 meteorological station | 15 min | 1 day |
Demonstration sites
Five peatland sites were selected to use as case studies for the integration of sensor networks with remote sensing indicators of peatland condition. The five sites were: (1) Flanders Moss (managed by NatureScot), (2) Tigh na Blair (restoration supported by the Forth Rivers Trust), (3) Glen Finglas (managed by the Woodland Trust), (4) Hare Moss (operated by the UK Centre for Ecology & Hydrology under UK-National Capability and MERLIN projects), and (5) Leadloch (managed by the Future Forest Company). The sites were chosen in consultation with Peatland ACTION, NatureScot and other stakeholders to provide a selection of peatlands that are broadly representative of restoration sites within the Forth Valley region and Scotland more widely. The sites encompass both blanket and raised bog and are located at altitudes ranging from 20 m to 525 m distributed across a hydro-climatic gradient from Glen Finglas in the west (2300 mm annual rainfall) to Hare Moss in the east (960 mm annual rainfall). Restoration measures had been undertaken at three sites prior to the project commencing (Flanders Moss, Tigh na Blair, Glen Finglas); restoration work at Leadloch commenced during the project in early 2024, while works at Hare Moss had not commenced by the end of the project. Figure 1 shows the location of the sites within the Firth of Forth catchment.
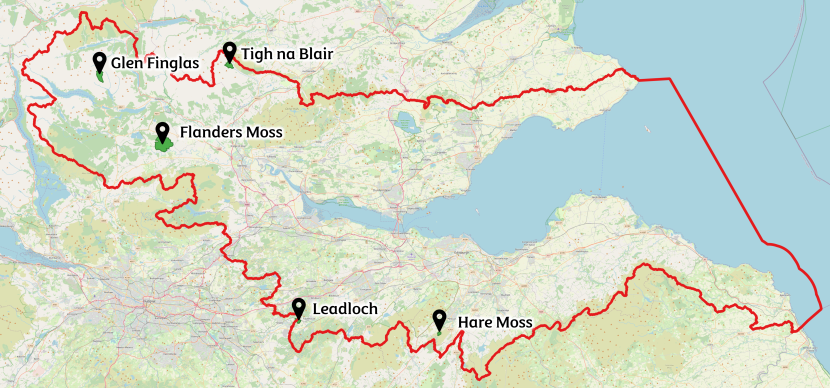
Figure 1. Map of the locations of the five peatland sites encompassed by the ground-based sensor network.
Click for a full description
Map showing the outline of the Forth catchment area in red. The outlines of the five demonstration peatland sites included in the project are also shown in green, along with black pins to highlight their locations. The five sites are Flanders Moss, Glen Finglas, Hare Moss, Leadloch and Tigh na Blair.
Three sites (Tigh na Blair, Glen Finglas and Hare Moss) were instrumented with the same standard suite of sensors including a meteorological station, water level sensors, soil moisture and temperature sensors, and lower cost forced diffusion carbon dioxide (CO2) soil chambers. Leadloch was instrumented with the same suite of sensors except the forced diffusion chambers. Flanders Moss was equipped with additional instrumentation including an eddy covariance flux tower. Flanders Moss was chosen to receive the additional instrumentation because it is one of the best remaining examples of raised bog in the UK.
The forced diffusion CO2 soil chambers have only been developed in the last few years and have therefore not been rigorously tested in the field. Hence, a decision was taken to install the forced diffusion chambers ultimately intended for Leadloch on Flanders Moss for one to two years so comparisons could be made against more standard flux measurements from the eddy covariance flux tower. Table 2 provides a summary of the five demonstration sites and the instrumentation installed.
| Site | Peatland type | Elevation (m) | Nature of restoration work | Forth-ERA Instrumentation |
|---|---|---|---|---|
| Flanders Moss | Raised bog | 20 | Ditch blocking, scrub and tree removal |
|
| Tigh na Blair | Blanket bog | 225 | Ditch blocking, hag/gully reprofiling |
|
| Glen Finglas | Blanket bog | 525 | Hag/gully reprofiling |
|
| Hare Moss | Raised bog/blanket bog | 265 | Pre-restoration: ditch blocking planned |
|
| Leadloch | Raised bog/blanket bog | 255 | Ditch blocking, trench bunding, scrub removal, stump flipping and ground smoothing |
|
Data communications, management and visualisation
The sensors installed at the five peatland sites are all powered off-grid using photovoltaic systems, except for the OTT Hydromet water level sensors which are powered by batteries due to their low power consumption (it is estimated the batteries will need replacing around every 3 years). The power supply to the eddy covariance flux tower on Flanders Moss will also be augmented by the installation of a vertical microturbine in summer 2024.
The sensors were configured to transmit data securely over cellular networks to the Forth-ERA cloud data centre hosted on Microsoft Azure. The sensor network employs a range of connectivity solutions to accommodate the diverse nature of the sensor devices installed. These are illustrated in Figure 2. For example, the OTT Hydromet water level sensors transmit data over 4G LTE using the MQTT protocol (Message Queuing Telemetry Transport, a common standard for IoT sensor networks) to the Microsoft Azure IoT Hub. Conversely, the software supporting the eddy covariance tower on Flanders Moss is connected to a router transmitting data via 4G LTE through a firewalled site-to-site Virtual Private Network (VPN).
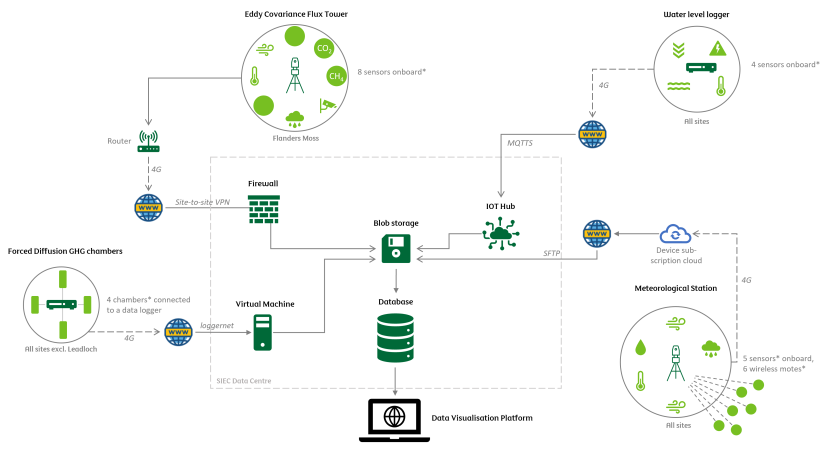
Figure 2. Schematic detailing the connections of the different peatland sensor systems to the SIEC data infrastructure.
Click for a full description
Schematic showing how the Eddy Covariance Flux Tower, Water Level Loggers, and Forced Diffusion GHG Chambers connect to the Blob Storage within the SIEC Data Centre. Connections are initially made via cellular networks/4G and the internet and then enter the data centre using a variety of protocols (e.g. a Secure File Transfer Protocol (SFTP). The database within the SIEC Data Centre is connected to the Data Visualisation Platform.
The data transmitted by the sensors is received either through the IoT Hub, via a virtual machine, or over the firewalled site-to-site VPN. The data are stored temporarily in so-called ‘Blob’ storage until an automatic function is triggered which re-formats and ingests the data into a PostgreSQL database. The database is accessible over a RESTful Application Programming Interface (API) based on Python’s FastAPI framework and the data are visualised on a dedicated web-based dashboard (the data are pulled from the API and refreshed every 15 minutes). The web-based dashboard is built using 3DEO’s ActiveMaps platform.
Sensor applications and preliminary data
The following section provides further details on the different sensor devices within the Forth-ERA network and examples of the data collected since installation. Due to the fact some sensors have been installed for less than 12 months, it is not possible to use the data to infer anything conclusive regarding the condition of the peatlands or their responses to restoration at this stage. However, the intended use of the data to support the monitoring of restoration outcomes and the development and validation of remote sensing approaches is described below.
Eddy covariance flux tower
Peatlands in good ecological condition are generally considered to be strong net sinks for carbon, but when they become degraded they often become a net source of carbon to atmosphere. Degraded bogs can release large amounts of carbon as CO2. Gaseous CO2 emissions are often highest during warm, dry periods where the drawdown of the water table promotes the mineralisation of peat. Restoration projects often focus on re-wetting peatlands to reduce or reverse CO2 fluxes to the atmosphere. However, waterlogged, anaerobic conditions in peatlands can favour the production of the powerful greenhouse gas methane (CH4). Hence, it is important to monitor the effect of restoration measures on the potential trade-off between CO2 and CH4 emissions.
To assess net ecosystem exchange (NEE) of greenhouse gases, eddy covariance methods allow greenhouse gas fluxes between land and atmosphere to be measured over large areas (tens to hundreds of metres). The LiCOR eddy covariance flux tower at Flanders Moss was installed in February 2023 (Figure 3) and is instrumented to measure the following variables:
Land-atmosphere flux of CO2 (μmol/m2/s)
Land-atmosphere flux of CH4 (μmol/m2/s)
Land-atmosphere flux of H2O (μmol/m2/s)
Land-atmosphere flux of sensible and latent heat
Rainfall (mm/h)
Average wind speed (m/s)
Max wind speed (m/s)
Wind direction (°)
Photosynthetically Active Radiation (PAR) (μE)
Air temperature (°C)
Air pressure (Pa)
Relative humidity (%)
Evapotranspiration flux (mm/h)
Phenocam digital image
The eddy covariance tower is powered by a large, multi-panel solar array and time-aggregated data are transmitted with a latency of 30 minutes via the 4G LTE mobile network.
To measure gas exchange between land (soil and vegetation) and atmosphere, the tower’s instrumentation is attached approximately 3.2 m above the surrounding vegetation. While eddy covariance flux towers are powerful instruments for assessing the net exchange of greenhouse gases and contextual environmental variables over large areas, the complexity and expense make them less suited for deployment at scale. Hence, there are relatively few eddy covariance systems installed on peatland sites in Scotland.
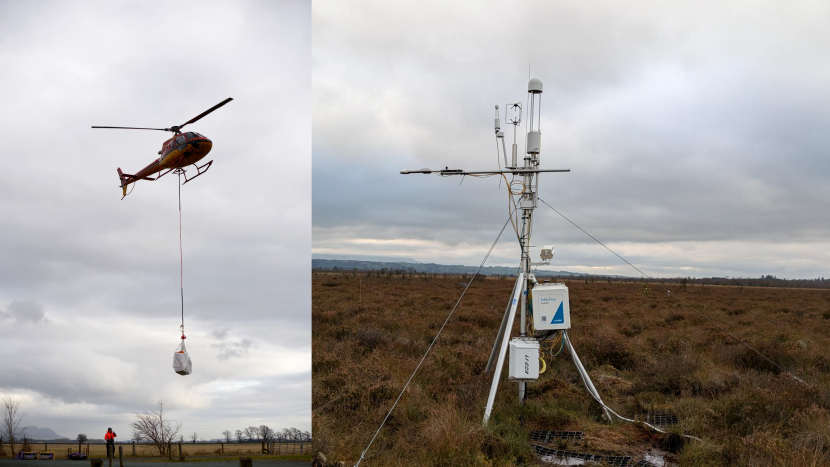
Figure 3. Two pictures of the eddy covariance flux tower and its deployment on Flanders Moss: helicopter lift (left) and the assembled tower (right).
Click for a full description
Two images, on the left a helicopter transports the eddy covariance flux tower onto Flanders Moss in February 2023. The picture on the right shows the flux tower on the monitoring site after construction.
Preliminary flux results
CO2, H2O and energy fluxes were collected from the date of installation (in April 2023), whilst communication problems with the CH4 analyser meant that these fluxes became available only from the end of May 2023 onwards.
Data collection over the first year since deployment had to overcome several technical challenges. The operation of the flux tower as a fully remotely monitored device was not initially possible owing to security concerns for data transfer between the router and the Forth-ERA data centre. Data collection and flux computations can operate without remote access but required manual data download during periodic maintenance visits (normally once per month). However, the lack of direct remote access meant that performance could not be monitored routinely, and thus some loss of data due to a lack of storage went unnoticed for a short period.
A secure link between the flux tower and the Forth-ERA data centre was established in early February 2024 using a router connected to the cloud over a site-to-site VPN. This means that the function of instruments and data transmissions can be monitored in real time and enables near real-time presentation of measurements and fluxes on the Forth-ERA data portal.
Fluxes presented here should be treated as preliminary, as the data screening routines and flux computation protocols are still being developed. However, the results in Figure 4 allow a first overview of the ability of the system to provide time-resolved fluxes and averaged net greenhouse gas budgets. Fluxes greater than 0 represent fluxes of CO2 from the bog to the atmosphere, whilst negative fluxes represent periods of CO2 assimilation from the atmosphere by bog vegetation. Diurnal CO2 exchange (Figure 5) illustrates the flux dynamics influenced by daylight hours (assimilation) and during darkness (net release), and changes throughout the season. The individual curves illustrate the increasing “sink strength” for CO2 during summer months, with longer daylight periods and hence sustained CO2 uptake periods, whilst early- and late-season fluxes are dominated by net emissions from the bog to the atmosphere. A similar presentation of CH4 fluxes (Figure 6) shows some tentative diurnal trends with progressively higher net emissions as the growing season progresses. Fluxes greater than 0 represent fluxes of CH4 from the bog to the atmosphere, whilst negative fluxes represent periods of CH4 uptake (methane oxidation) from the atmosphere. Whilst there is considerable uncertainty from data gaps, the data suggest an overall CH4 source at Flanders Moss, which is as expected. There is an emerging pattern of decreasing net CH4 fluxes around mid-day, and also a trend of progressively higher CH4 fluxes to the atmosphere over the course of the growing season.
Further steps for quality control of data, filtering and gap-filling need to be implemented for new data that will be collected quasi-continuously from the tower. This means that there will be recent “raw” flux values available alongside data that have undergone processing which are time-lagged.
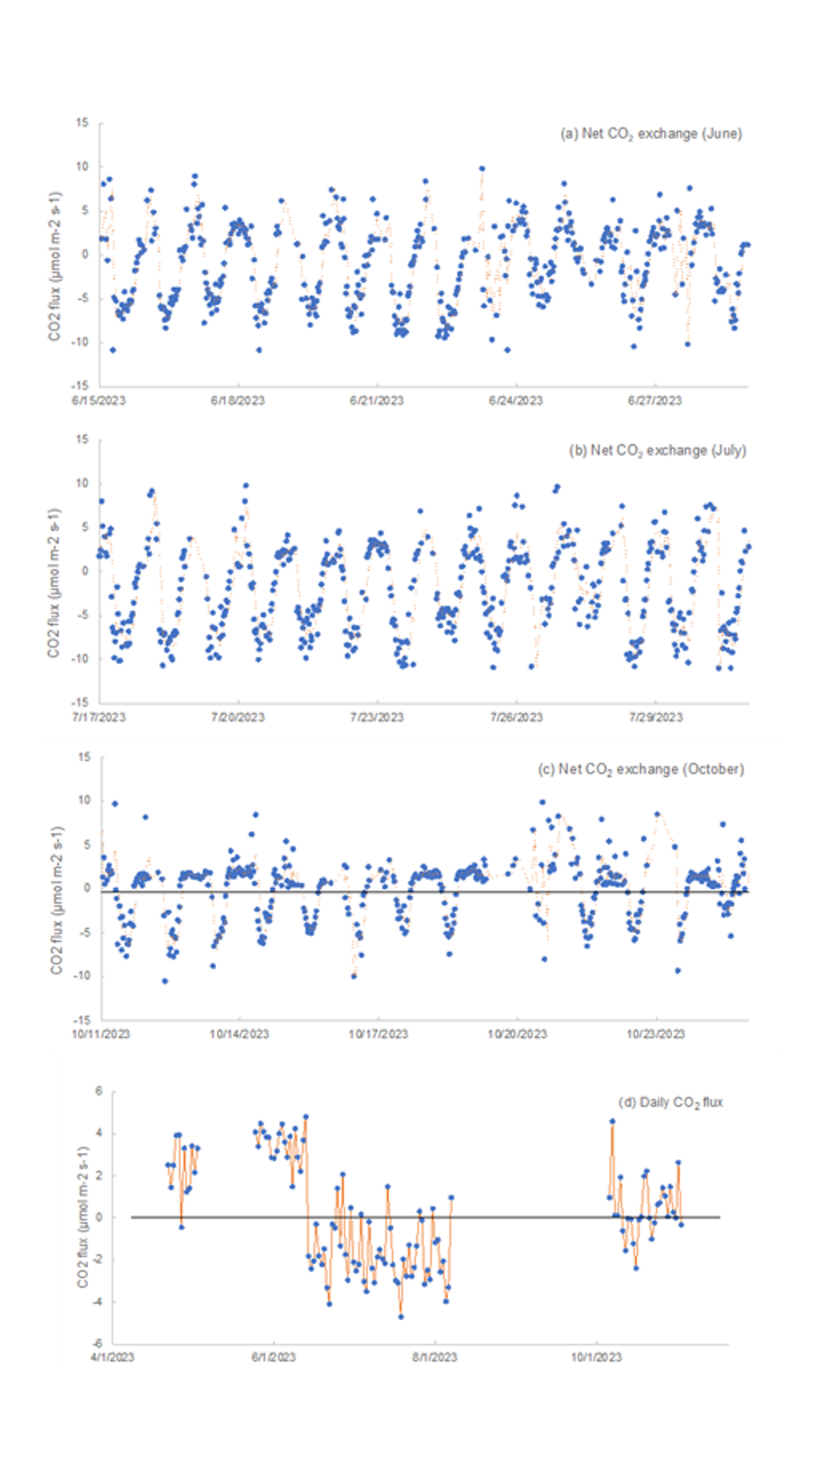
Figure 4. Examples of CO2 flux results from the Flanders Moss eddy covariance tower.
Click for a full description
Examples of CO2 flux results from the Flanders Moss eddy covariance tower. Half-hourly flux estimates for 2-week periods in (a) June, (b) July and (c) October and (d) daily flux averages for available periods up until November 2023.
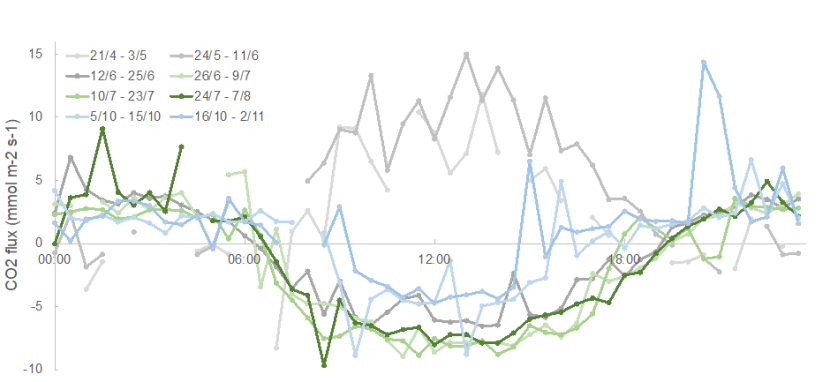
Figure 5. Diurnal carbon dioxide (CO2) flux dynamics at Flanders Moss over the growing season 2023.
Click for a full description
Diurnal carbon dioxide (CO2) flux dynamics at Flanders Moss over the growing season 2023. The plot shows average fluxes of CO2 for each half-hourly interval across 24 hours, averaged for different weeks in 2023.
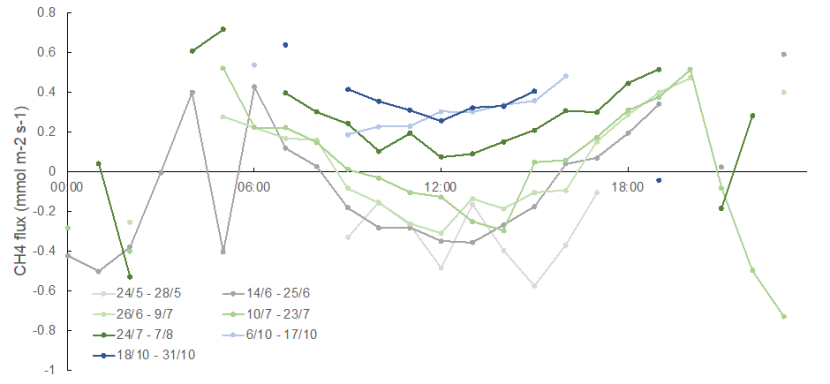
Figure 6. Diurnal methane (CH4) flux dynamics at Flanders Moss over the growing season 2023.
Click for a full description
Diurnal methane (CH4) flux dynamics at Flanders Moss over the growing season 2023. The graph shows average fluxes of CH4 for each half-hourly interval across 24 hours, averaged for different weeks in 2023.
Forced diffusion soil flux chambers
The forced diffusion chambers (manufactured by Eosense) measure soil-atmosphere fluxes of CO2 in the footprint of the chamber itself (see Figure 7). The CO2 flux measured is from the soil surface, and includes CO2 derived from microbial decomposition of peat and root/root-associated respiration from vegetation. Rather than a net CO2 exchange, it provides an integrated measure of the metabolic activity of the site, and its response to environmental drivers such as temperature and moisture (or water table). Unlike traditional closed soil chambers the forced diffusion soil flux chambers do not trap and accumulate gas inside the chamber, but rather have membranes through which gases diffuse into and out of the chamber headspace. The headspace CO2 concentration is a function of the rate of CO2 addition from the peat surface (respiration) and the diffusion outwards through the membrane. CO2 concentrations are measured continuously and fluxes are calculated based on this steady-state concentration and diffusion coefficients through the membrane. Figure 8 shows the soil respiration fluxes measured by the chambers at the Hare Moss monitoring site. As the chamber has no moving external parts, it is less vulnerable and suitable for deployment in remote areas and less favourable weather conditions (e.g. Kim et al., 2016). The chambers are considerably less expensive than an eddy covariance flux tower, potentially enabling more peatland sites to be instrumented for the in-situ measurement of CO2 soil-atmosphere fluxes. The chambers are also highly portable and can be easily moved between peatland sites.
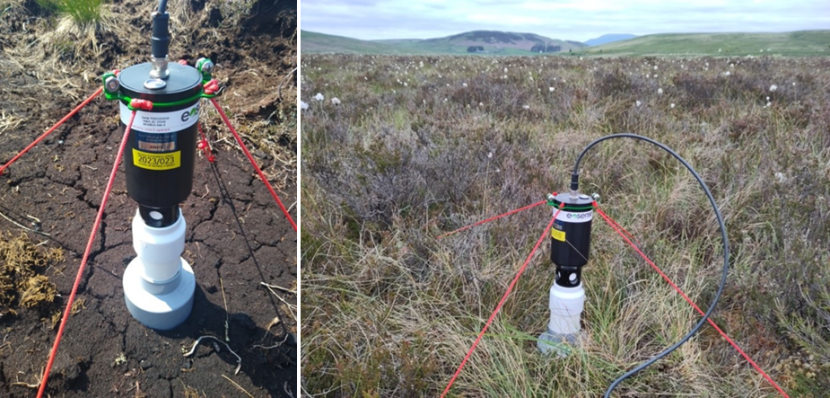
Figure 7. Forced-diffusion soil flux chambers at the Tigh na Blair restoration site.
Click for a full description
Forced-diffusion flux chambers at the Tigh na Blair restoration site. Fluxes are calculated based on the continuously measured CO2 enrichment in the chamber headspace.
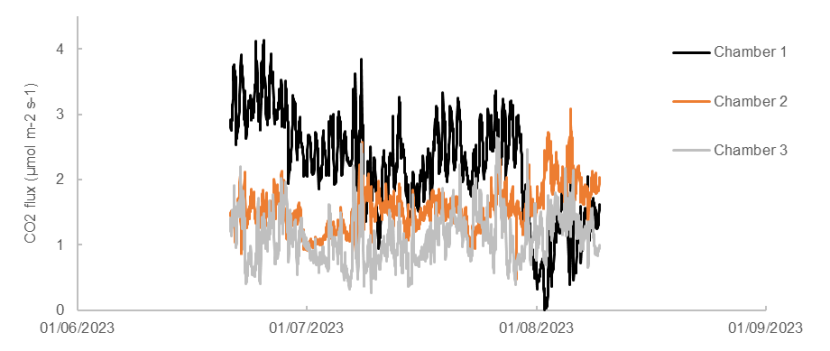
Figure 8. Soil respiration fluxes measured by forced diffusion chambers at Hare Moss.
Click for a full description
Soil respiration fluxes measured by forced diffusion chambers at Hare Moss. Results illustrate clear diurnal trends likely related to soil temperature, but also some divergence between individual chamber locations within the site.
Water level sensors
The waterlogged conditions in healthy peatlands ensure that organic matter does not fully decompose and release carbon, accumulating and forming peat as a result. Peatland hydrology is therefore the dominant control on greenhouse gas fluxes (Evans et al., 2021). Monitoring the water table depth is thus essential to ensure restoration efforts contribute to the proper functioning of restored peatlands. To this end, water level sensors (manufactured by OTT Hydromet) were installed at each of the monitored peatland restoration sites. Each of these devices takes hourly measurements of the local water table depth (in metres) and the water temperature (in degrees Celsius) which are transmitted to our data centre in bulk every 12 hours.
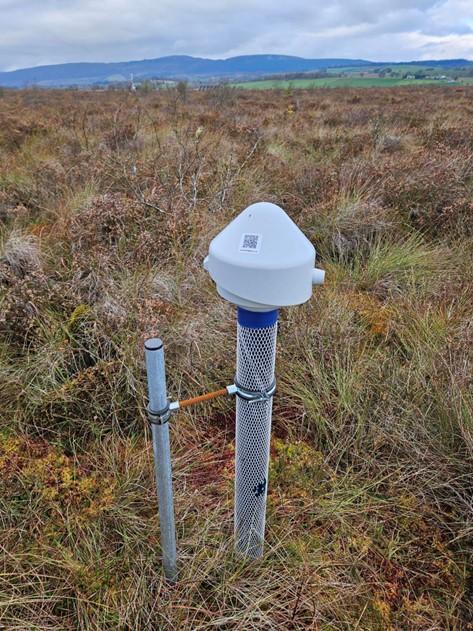
Figure 9. One of the OTT Hydromet water level loggers installed at Flanders Moss.
Meteorological stations
External water input for a peatland site is a key factor driving peatland hydrology. Therefore, meteorological data, including precipitation as well as air and soil temperature, is also being recorded using a meteorological station (manufactured by HOBO) at each site (see Figure 10 for example). Details of the measured parameters are shown in Table 3 below. The meteorological stations are powered by solar arrays on site and record data in 15-minute intervals.
| Parameter | Units | Number of sensors (replication) |
|---|---|---|
| Air temperature | °C | 4 |
| Relative humidity | % | 4 |
| Dew point | °C | 4 |
| Wind speed | m/s | 1 |
| Gust speed | m/s | 1 |
| Wind direction | ° | 1 |
| Photosynthetically Active Radiation (PAR) | μE | 1 |
| Precipitation | mm/h | 1 |
| Surface soil moisture | m3/m3 | 1 |
| Surface soil temperature | °C | 1 |
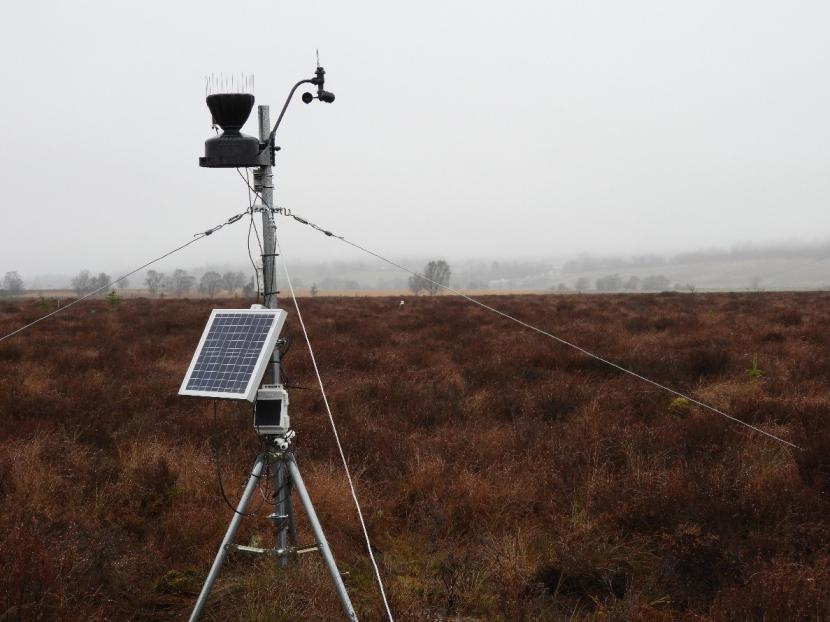
Figure 10. The HOBO RX2100 meteorological station installed at Flanders Moss.
Remote sensing for peatland condition monitoring
The following section presents research undertaken to develop remote sensing approaches for the assessment of peatland condition including indicators related to peatland hydrology and carbon balance. The first two sections demonstrate how satellite Synthetic Aperture Radar (SAR) and Interferometric SAR (InSAR) can be used to monitor changes in water table depth and surface motion (so-called ‘bog breathing’). The third section demonstrates how optical and thermal data from satellite sensors can be used to monitor peatland carbon dynamics including gross primary production (carbon uptake) and net ecosystem exchange (carbon balance). The remote sensing methods were developed using existing in-situ data from water table loggers and eddy covariance flux towers augmented by new data collected by the Forth-ERA sensor network where available. The remote sensing algorithms were developed and tested using data from selected peatland sites, but their implementation on high performance computing infrastructures means the approaches can easily be scaled to extend monitoring to the regional or national scale.
Peatland water table depth
This section presents a data-driven model designed to estimate the Water Table Depth (WTD) of peatlands in near real-time (NRT) using Synthetic Aperture Radar (SAR) imagery. The model leverages the relationships between meteorological factors, peatland vegetation, soil moisture and backscatter intensity measured by the C-band SAR on Sentinel-1 satellite to estimate WTD. Preliminary results demonstrate that the model effectively predicts water table depth by leveraging the distinctive characteristics of the vegetation and moisture captured in the proposed model inputs. The model achieves a Mean Absolute Error (MAE) of 6 cm and a coefficient of determination (R2) of 0.72. This work presents progress towards a novel alternative for remote estimation of peatland WTD.
Datasets
In-situ water level data collected by Peatland ACTION and openly available on the Peatland ACTION hydrology explorer website were used as ground-truthed data to train the model (Figure 11). Data were used from all available water table loggers that fall inside the Sentinel-1 SAR frame, located on 35 different peatland sites across Scotland with varying water table depths and vegetation characteristics. The data included peatlands outside of the Firth of Forth catchment so that a larger dataset was available for model development and testing. The Forth-ERA sensor network was still in its infancy at the time the research was undertaken so the existing Peatland ACTION data were essential to the successful training and testing of the model.
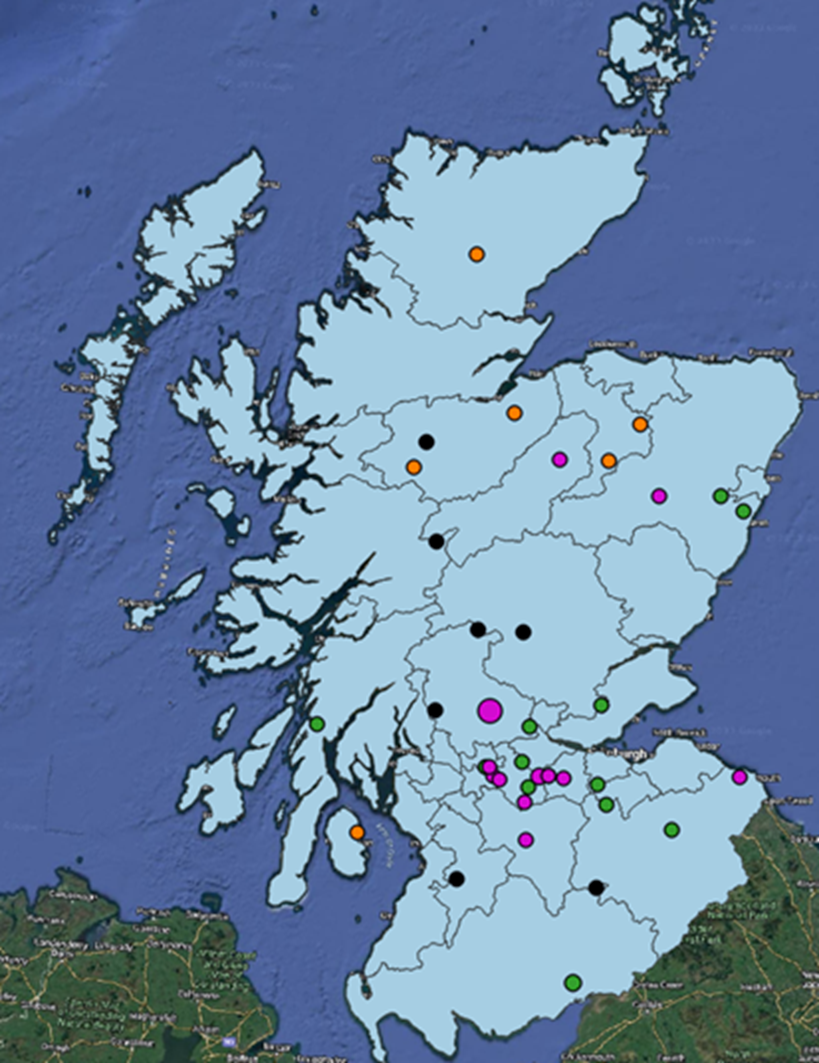
Figure 11. Overview map of the WTD sensors across Scottish bogs used for building the WTD models.
Click for a full description
Overview map of the water table depth sensors across Scottish bogs used for building the WTD models. Pink: water table sensors in raised bogs used for training. Green: water table sensors in raised bogs used for testing. Black: water table sensors in blanket bogs used for training. Orange: water table sensors in blanket bogs used for testing.
Regarding the satellite data, SAR backscatter intensity was derived from the European Space Agency’s Sentinel-1 SAR satellite. Data from 2016 to 2022 were included to calibrate and validate the models presented here.
Methodology
Existing research suggests the potential connection between C-band SAR backscatter intensity, Surface Soil Moisture (SSM) and peatland WTD. Previous research has shown that changes in shallow WTD change the SSM due to the strong hydraulic connection in the shallowest layers of peat soils (Bechtold et al., 2018). Surface soil moisture in turn influences the backscatter measured by SAR satellites, given the sensitivity of SAR signals to dielectric properties of objects on the ground.
The workflow for the data-driven model implemented in our research is presented in Figure 12. Regional SSM obtained from the ERA-5 datasets produced by the European Centre for Medium-Range Weather Forecasts (ECMWF) was used. SSM was used as an input for the data-driven model given its ability to summarise the water resources available in an area of interest. While the spatial resolution of approximately 9 km grid spacing is significantly coarser than that of Sentinel-1, it provides an indication or proxy regarding the water budget in a peatland site and surrounding areas. Since vegetation can also have an influence on SAR backscatter, information derived from multitemporal SAR imagery for the VV (Vertical Transmit – Vertical Receive) and VH (Vertical Transmit – Horizontal Receive) polarisations is also provided. The multitemporal information, along with the VV and VH backscatters and the corresponding regional SSM are fed to a gradient boosting machine learning algorithm.
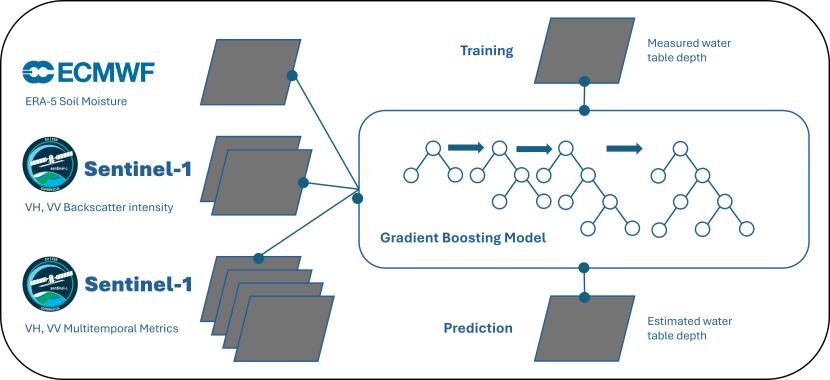
Figure 12. The workflow of the gradient boosting model developed to estimate peatland water table depth.
Click for a full description
The workflow of the gradient boosting model developed to estimate peatland water table depth. The model takes Sentinel-1 backscattering intensities and multitemporal metrics along with soil moisture forecasts from ECMWF to estimate the water table depth for peatland sites.
Model training and testing was then performed following standard procedures used in the data science community. Randomly splitting the datasets for training and validation resulted in overoptimistic results (R2 ~0.86). This is because it was possible for the model to be trained and tested with consecutive data points from the same logger (no constraints are imposed when randomly splitting the data). The model was then trained and tested based on a geographical data split i.e. using loggers of some sites for training and some sites for testing. However, there appeared to not be enough training sites in the area of interest and on occasions one site heavily outnumbered other sites (i.e. Flanders Moss has 30 loggers while other sites have one logger). Similarly, this may penalise the model since some sites have highly different peatland ecohydrological conditions compared to others and this may not have been seen by the model during training. If this method is used, an R2 ~0.45 is achieved.
Cross-validation methods typically used in time series prediction/forecasting validation were used instead. In this case, training and test sets are obtained by splitting the time series data samples at fixed time intervals. Data from before the first of June 2020 was used for training (about half of the data) and data after this date for testing. This method aims to reduce the bias of randomly splitting data and to provide the model with as much data diversity as possible. This resulted in an R2 of ~0.72. Considerations for model transferability are mentioned in the limitations section.
Figure 13 shows a comparison between the WTD measured (observed) and the WTD estimated by the model based on the test data. As may be expected, the model underperforms in locations where the water table is either very deep as in the green square or very shallow (i.e. inundated soil) as in the red square.
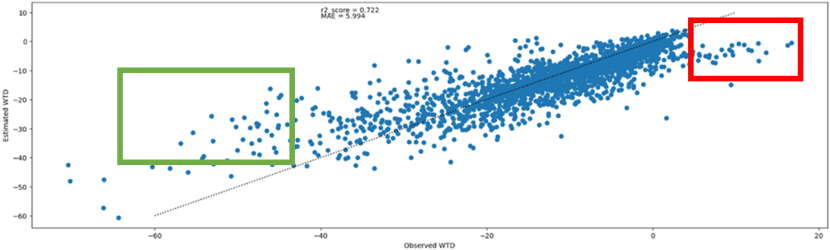
Figure 13. Scatter plot of observed (in-situ measurements) versus estimated WTD for test data.
Click for a full description
Scatter plot of observed (in-situ measurements) versus estimated WTD. The boxes around the outliers call attention to underperformance of the model in locations where the water table is either very deep (green box) or very shallow, i.e. inundated soil (red box).
Figures 14 and 15 show time series comparing in-situ measurements of WTD compared to model estimations. Note that the training procedure implemented allows us to obtain the confidence intervals associated with every model prediction.
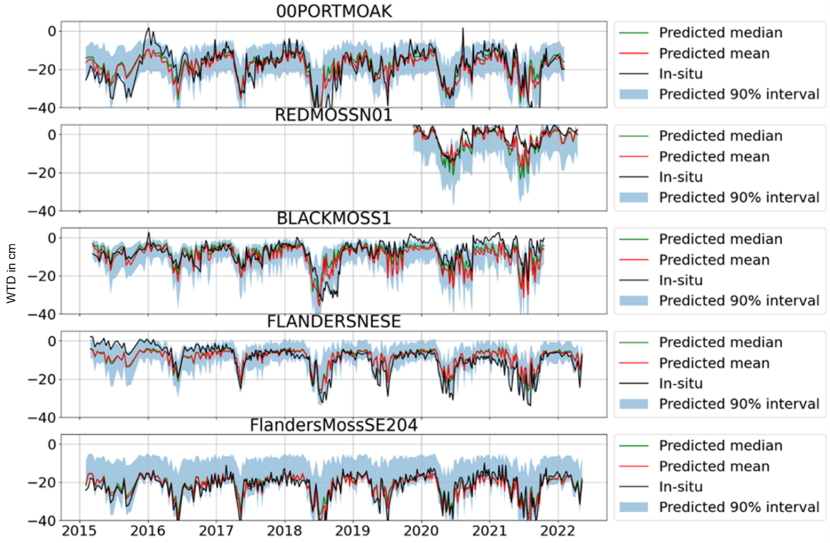
Figure 14. Example of time series of observed (in-situ measurements) versus estimated WTD.
Click for a full description
Time-series graphs for the timeframe 2015-2022 for the peatland sites Portmoak Moss, Red Moss of Netherley, Black Moss Muir of Dinnet, and Flanders Moss. The graphs compare the predicted (modelled) mean and median WTD to the in-situ measurements, also showing the predicted 90% interval.
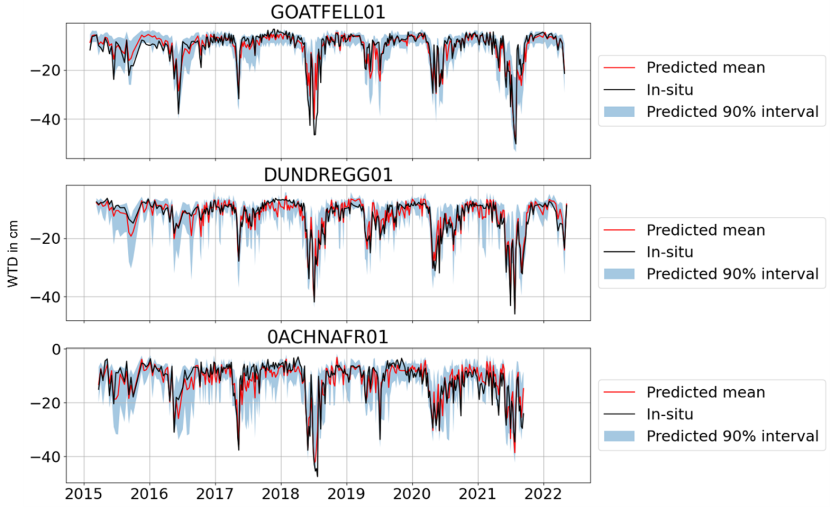
Figure 15. Example of time series of observed (in-situ measurements) versus estimated WTD.
Click for a full description
Time-series graphs for the timeframe 2015-2022 for the peatland sites Goatfell, Dundreggan, and Auchnafree. The graphs compare the respective predicted (modelled) mean WTD to in-situ measurements, also showing the predicted 90% interval.
Figure 16 shows the spatial distribution of WTD for Flanders Moss predicted by the model for four different dates. The spatiotemporal changes are clear and are consistent with the seasonality.
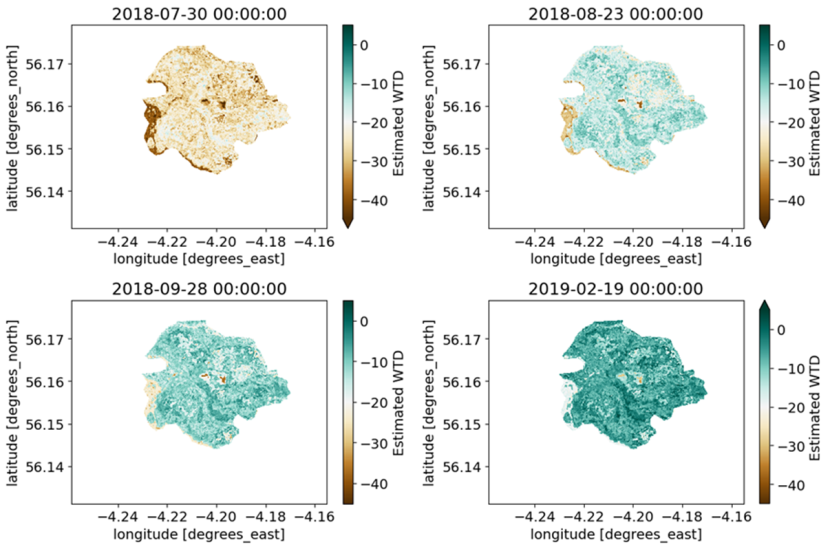
Figure 16. Example of spatiotemporal WTD estimated by the model for Flanders Moss.
Click for a full description
Example of spatiotemporal WTD estimated by the model for Flanders Moss. Clear spatiotemporal changes are visible that are consistent with the seasonality, the water table being lower during the summer months and rising towards the autumn and winter (from first to last picture, i.e. from July to February).
Limitations
While the model performs well considering the data withheld for testing (40% of the dataset), it is important to highlight some limitations that the current model would face:
- In-situ data. Most of the WTD sensors were installed after peatland restoration. The before and after trend may not have been captured and instead only WTD from after restoration is available. This may create a bias in the training dataset.
- Spatial resolution. If the size and/or impact of restoration is less than the pixel size (approximately 20 x 20 m), the impact of the restoration may not be clearly visible (also considering possible speckle effects in the radar images). In this sense, the larger the extent of restoration the more likely it is that an effect can be observed in the satellite data.
- Type of restoration. Some types of restoration may change the landscape significantly which complicates estimation of WTD. For instance, tree felling during forest-to-bog restoration causes significant change to the landscape structure meaning changes in water table against the original baseline will be hard to detect in the short term.
- Transferability of data-driven models. While the model performs well against the available in-situ data, further opportunities should be sought to validate the models against new data, particularly from peatlands that may be different in character from those represented in the datasets used in this study. This is particularly important for data-driven models and work is ongoing to use the data being collected by the Forth-ERA sensor network to extend the model validation presented here.
Peatland surface motion
Spaceborne InSAR is a tool used in remote sensing to measure Earth surface deformation. A SAR system measures changes in the distance between the SAR satellite and the ground. The distance is measured using the phase information of microwave signals emitted and received by a SAR system. This is done using a pair of images as follows. The phase of the signal received by the SAR sensor at a reference date is acquired. Then the phase of the signal received at a secondary date is obtained. The difference in the phase information between these two points in time is used to calculate the ground surface motion. Multiple image pairs can be used to observe the changes over longer periods of time.
The phase measurement can be affected by several factors. These include variations in the acquisition geometry among dates (spatial baseline), changes in the ground surface between the time elapsed between images (temporal baseline), difficulties accounting for complex topography, and atmospheric conditions being different during the reference and secondary dates. To account for these factors and to monitor changes over long periods of time, various InSAR time series analysis techniques have been proposed. For a thorough review of these techniques please refer to Xue et al. (2020). In this report, the Intermittent Small BASeline (ISBAS)-InSAR time series technique was used to estimate ground surface motion. The ISBAS-InSAR method has been shown to detect subsidence and uplifting features under vegetated areas with good accuracies (Alshammari et al., 2020). A processing chain has been implemented for raw image processing using ISCE2 (Rosen et al., 2012) and the Miami Python package (MintPy) (Yunjun, Fattahi and Amelung, 2019).
SAR signals can penetrate vegetation and some dry materials to a limited extent, but not deeply especially when using shorter wavelengths such as C-band SAR as is the case for Sentinel-1. This may limit the effectiveness of InSAR in densely vegetated areas for monitoring surface motion changes. Similarly, vegetation can cause rapid decorrelation due to movement of canopy or changes in vegetation cover. This reduces InSAR coherence over time, which is essential for interferometric measurements. InSAR time series methods focus on reducing these limitations by identifying and using pixels that remain coherent over long periods of time. As such, the use of multiple consecutive images is key for the success of this technique. It should also be noted that while shorter wavelengths may be affected more by vegetation cover, C-band SAR was chosen as Sentinel-1 data is freely available. Previous studies of C-band SAR using ISBAS-InSAR techniques within the Flow Country have also found noteworthy coverage over vegetated regions (Alshammari et al., 2020).
Ground surface motion and peatland dynamics
Surface motion in a peat bog appears to be associated with ecosystem dynamics and ecohydrological processes (Kim et al., 2017; Alshammari et al., 2020; Tampuu et al., 2020). This displacement can then be related to WTD. Subsidence/swelling is expected due to seasonal changes in soil moisture (i.e. subsidence during dry periods, swelling during wet periods), and InSAR can be used to monitor these displacements (Howie and Hebda, 2018; Bradley et al., 2022).
Similarly, Tampuu et al. (2020) investigated InSAR temporal coherence and WTD over open raised bog. They chose a SAR image as a reference date with its corresponding WTD and estimated the coherence of this image with the remaining images acquired in the same year. The difference between the reference WTD and the WTD for the rest of the year was also estimated. Based on this, the relationship between InSAR coherence and WTD was described with a second order polynomial regression. In Alshammari et al. (2020), the relationship between ground surface motion and peatland condition is evaluated. Their results indicate that peatland sites in near-natural conditions show seasonal subsidence and swelling. Sites in more degraded condition also show seasonality, however, there seems to be a time shift between the peaks of subsidence and swelling with respect to peatland in good condition. Eroded peatland sites with large bare peat areas show long-term subsidence and no seasonality is evident. This research is complemented in Bradley et al. (2022) by using a more thorough treatment of the InSAR ground surface motion time series, coming to similar conclusions as Alshammari et al. (2020).
ISBAS-InSAR for Flanders Moss
Figure 17 shows the average Line Of Sight (LOS) displacement from the start date (beginning of 2017) to the end of the monitored period (end of 2023) as estimated with ISBAS-InSAR over Flanders Moss. LOS displacement refers to the movement or deformation of the Earth’s surface along the line of sight of the radar sensor. LOS displacement consists of contributions from three directions: Vertical (changes in elevation), East-West displacement and North-South displacement. In this case, pixels with displacement of zero would mean that they oscillate yearly above and below zero not cumulating any displacement. Other areas where the cumulative displacement shows higher/lower values mean that there is a trend present and displacement is likely occurring (subsidence or elevation).
To analyse the surface motion, three locations were selected where different patterns can be observed. Point 1 is in a restored area where trees were removed in 1998 (Figure 18). Point 2 shows a location where negative displacement seems to be happening i.e. movement away from the satellite through horizontal movement or subsidence (Vasco et al., 2019). Point 3 corresponds to a healthy part of the bog where the eddy covariance flux tower (sections above) is located.
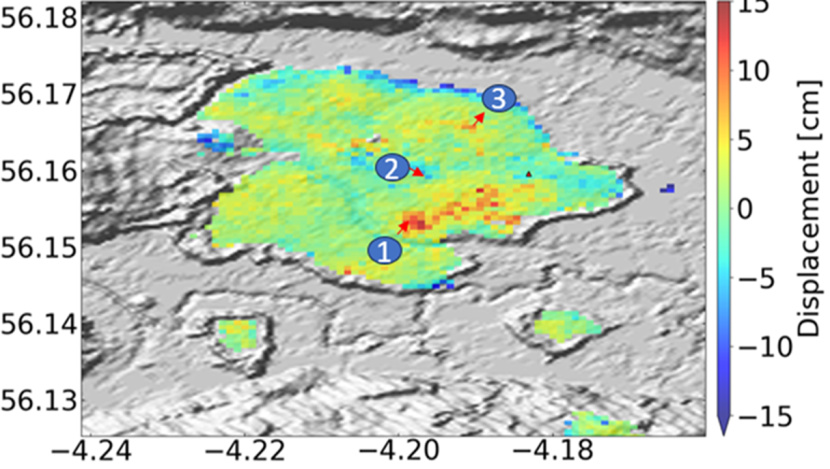
Figure 17. Average estimated line of sight displacement on Flanders Moss with respect to the starting date (2017-2023).
Click for a full description
Average estimated line of sight displacement on Flanders Moss with respect to the starting date (2017-2023). Points 1, 2, and 3 are used as examples to analyse time series displacement (below).
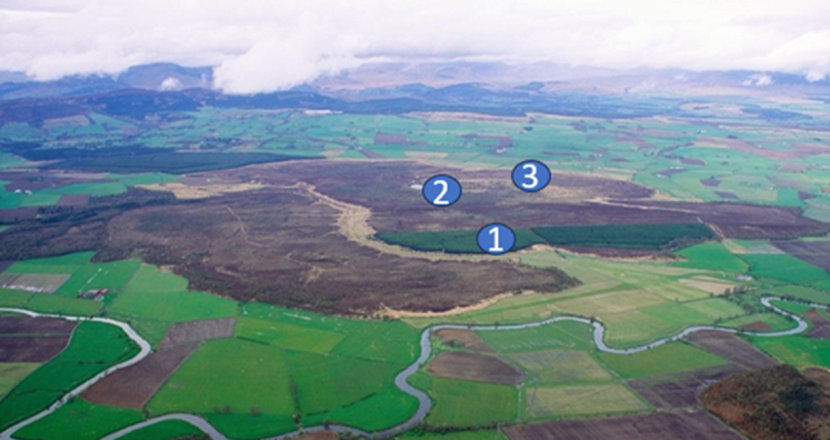
Figure 18. Archived aerial imagery of Flanders Moss ©NatureScot.
Click for a full description
The forest within the peat bog shown in this image was removed in the late 1990s. Points 1, 2, and 3 are used as examples to analyse time series displacement (below).
Figures 19, 20, and 21 show the LOS displacement relative to the beginning of the monitoring period (beginning of 2017) for the three points of interest described above. All cases show evidence of seasonal behaviour because of swelling and subsidence according to the available water resources. Point 1, the area where forest-to-bog restoration occurred, shows a positive trend in terms of the overall LOS displacement (Figure 19). The time series for Point 2 shows a minor negative trend (Figure 20), possibly due to the presence of shrubs and other invasive vegetation types growing in the area and negatively affecting the hydrology of the bog. Point 3 shows relatively lower yearly displacement (i.e. amplitude), potentially since this healthy area of the bog is constantly wet even in summer seasons (Figure 21). This can be seen in the water table depth measurements from the Peatland ACTION loggers, FLANDERSSE07 (Point 1), FLANDERSMOSSNE301 (Point 2) and FLANDERSMOSSNE03 (Point 3), where the seasonal wetness is much less varied within Point 3, showing a higher water table depth throughout the year.
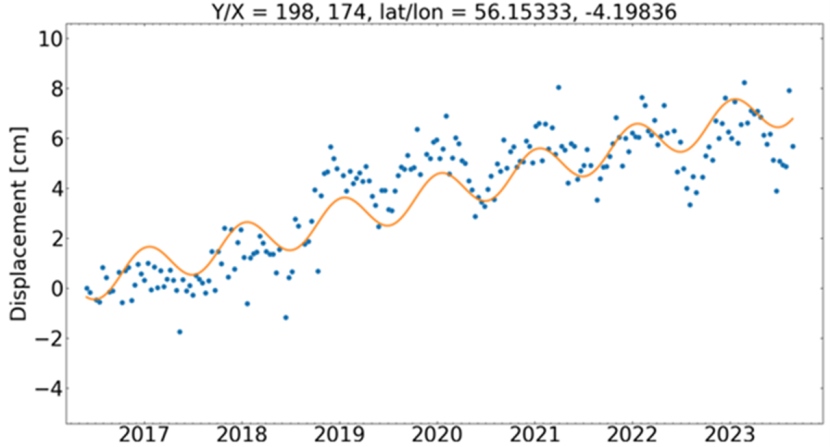
Figure 19. Line of sight time series displacement of an area of Flanders Moss where forest was removed in the late 1990s (Point 1).
Click for a full description
Line of sight time series displacement of an area of Flanders Moss where forest was removed (Point 1). The blue dots represent the InSAR predicted ground displacement in cm from the beginning of 2017 to the end of 2023. The orange line is a sinusoidal fitted to the data, making the seasonality of the model more clearly visible.
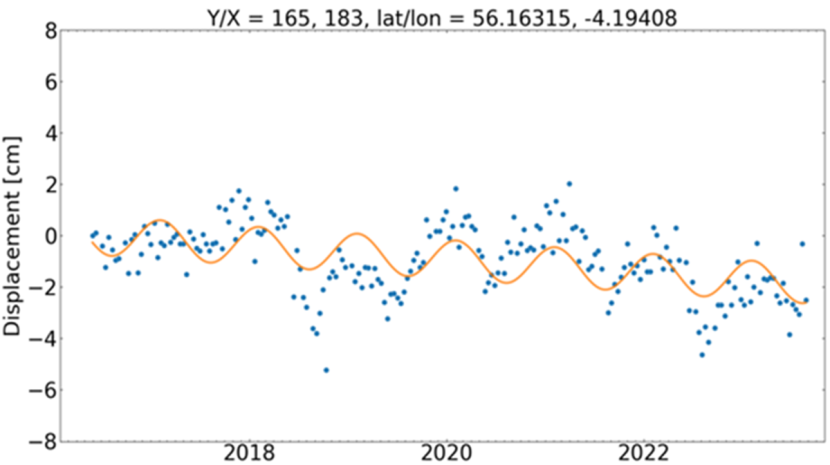
Figure 20. Line of sight time series displacement at the centre of Flanders Moss (Point 2).
Click for a full description
Line of sight time series displacement at the centre of Flanders Moss (Point 2). The blue dots represent the InSAR predicted ground displacement in cm from the beginning of 2017 to the end of 2023. The orange line is a sinusoidal fitted to the data, making the seasonality of the model more clearly visible.
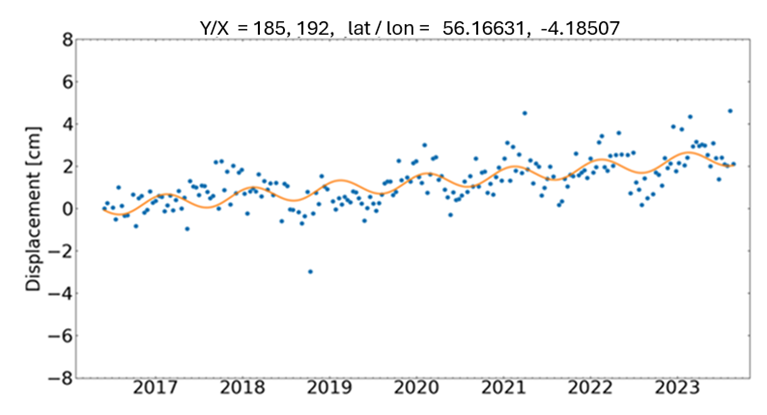
Figure 21. Line of sight time series displacement near the location of the new flux tower at Flanders Moss (Point 3).
Click for a full description
Line of sight time series displacement near the location of the new flux tower at Flanders Moss (Point 3). The blue dots represent the InSAR predicted ground displacement in cm from the beginning of 2017 to the end of 2023. The orange line is a sinusoidal fitted to the data, making the seasonality of the model more clearly visible.
Note that in the LOS displacement time series shown above, the impact of the 2018 droughts is visible with a dip in the time series. This effect seems to be more apparent for point 2 which is the most degraded area of Flanders Moss. The potential to detect drought impacts on the condition of peatlands would be highly valuable given the expected impact on ecosystem function and soil-atmosphere fluxes of CO2. There is significant potential for further research on the applicability of InSAR LOS displacement for the assessment of drought effects on peatland condition and function.
Limitations
The main limitation to the use of InSAR LOS displacement for the assessment of peatland condition is the somewhat complex interpretation of the observed changes in surface topography. These can occur due to combined effects from variation in surface soil moisture, water table, vegetation growth and decay, gas fluxes, and peat growth and mineralisation. In addition, the technique may fail to detect large surface deformation events if the rate of subsidence is greater than the maximum resolvable displacement between image pairs (this is 1.2 cm for Sentinel-1 C-band SAR; Marshall et al., 2022). This may prevent large scale deformation events such as those driven by severe drought events from being detected. Interpreting change in surface topography therefore also requires an understanding of local site conditions, but the results presented here clearly demonstrate the potential value of InSAR as a tool for tracking changes in peatland condition at the studied Scottish sites. Subsequent stages would explore how to improve on these current results.
Installation of corner reflectors
Peatland surface motion derived from InSAR requires pixels that are “coherent” or stable over time. This means that changes due to vegetation growth, for instance, can often be an obstacle for estimation of surface motion. Traditional small-baseline interferometric techniques rely on numerical methods to determine the pixels in an image that are suitable for InSAR analysis. While these techniques have proven successful in many cases, there is still some uncertainty about their use in peatlands and specifically in the context of hydrological assessments.
To avoid losing coherence or stability in a pixel, a corner reflector can be installed in-situ to improve the stability of a given pixel over time, regardless of external variations such as vegetation change. This approach has been implemented by different organisations in the UK, including the British Geological Survey and National Highways England. In order to further advance the use of InSAR for peatland assessment in the future, corner reflectors were installed at the five peatland sites in the Firth of Forth catchment to provide coherent targets for the development and validation of the InSAR surface motion approach. The trihedral reflectors are made of aluminium and measure approximately 1 m in height, 1 m in depth, and weigh 20kg. The reflectors have been installed on the peatland surface and, at the Glen Finglas restoration site, also on an outcrop of bedrock.
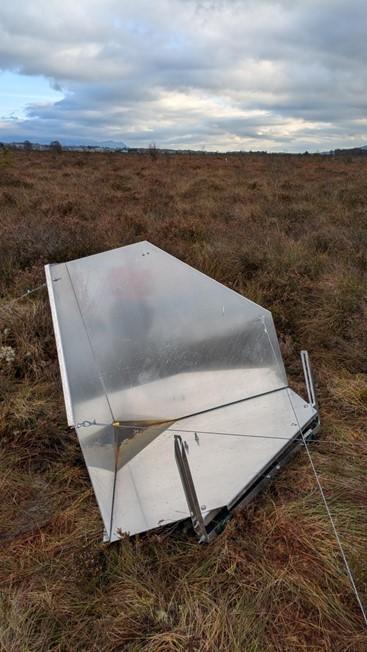
Figure 22. Trihedral corner reflector for radar remote sensing installed at Flanders Moss.
The reflectors will enable us to obtain more precise surface motion measurements by providing a target on the peatland surface with persistent scatter and stable phase characteristics. In turn, this will allow us to separate surface displacement caused by the changes to peatland hydrology from that occurring due to changes in vegetation growth. In addition, as part of new work funded by Scottish Water, a peatland motion camera will be installed (Evans et al., 2021) on a restoration site in the Loch Katrine catchment. The corner reflectors and peatland motion camera will enable us to improve and validate the accuracy of the InSAR measurements of peatland surface motion.
This will be key to understanding the validity of Small BASeline (SBAS)-InSAR and its transferability to other sites. Similarly, since the peatland motion camera and corner reflectors are installed near to water table depth sensors and meteorological stations, this will improve understanding of the connection between peatland surface motion and peatland hydrology. Corner reflectors will improve the coherence of InSAR measurements as the stable point of the reflector will not be affected by soil moisture and other factors that would affect the bog itself. While there is the possibility that the corner reflectors may compress the peatland surface over time, this work will be used as a way to explore the impacts on InSAR measurements from using corner reflectors in these locations. The impact of a corner reflector installed on the 3rd of November 2023 is visible in subsequent Sentinel-1 SAR acquisitions as shown in Figure 23 below.
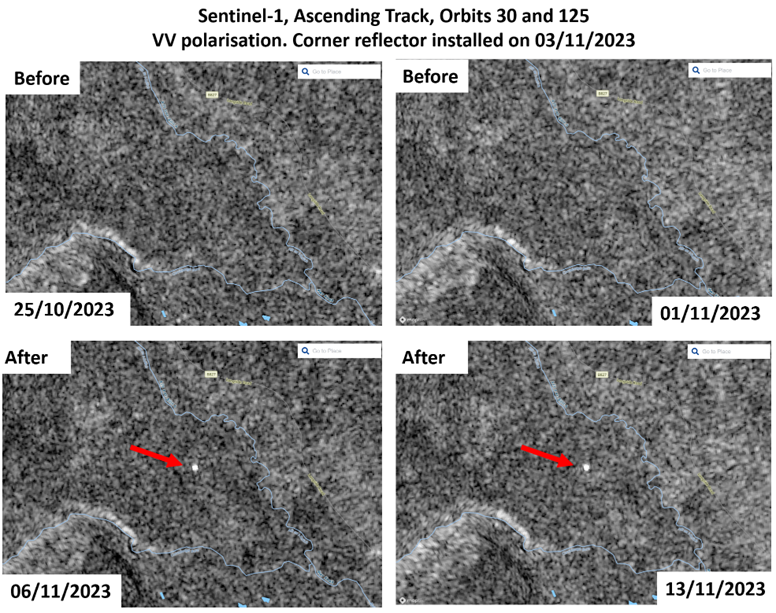
Figure 23. Sentinel-1 backscatter before and after installation of corner reflectors (highlighted by red arrows).
Peatland carbon uptake and net ecosystem exchange
This section of the report outlines the development of remote sensing approaches for the estimation of peatland carbon fluxes (gross uptake and net exchange). In contrast to the work presented in the previous section, this research combined data from optical and thermal satellite sensors to develop models that could be trained, tested, and validated using in-situ data captured from on-ground eddy covariance (EC) flux towers. The overall objective was to develop and validate models to quantify peatland CO2 fluxes in space and time.
To this end, models were developed to estimate peatland CO2 fluxes including Gross Primary Production (GPP, total uptake of CO2 by plants through photosynthesis), ECOsystem Respiration (RECO, total release of CO2 by all living organisms through respiration) and Net Ecosystem Exchange (NEE = RECO - GPP). Based on previous research in this field, several remote sensing indices related to land surface hydrology and vegetation condition were selected for use in a data-driven approach. These included the Normalised Difference Water Index (NDWI), Normalised Difference Vegetation Index (NDVI), Enhanced Vegetation Index (EVI) and Near Infra-Red of vegetation (NIRv) derived from the European Space Agency (ESA) Sentinel-2 MultiSpectral Instrument (MSI). The Land Surface Temperature (LST) product from NASA’s MODIS satellite was also acquired and used for this work.
The Forth-ERA flux tower at Flanders Moss was only installed in spring 2023, therefore analogous data from other flux towers in Scotland was sought to support the development of the remote sensing algorithms. Post-processed GPP, RECO and NEE data were thus obtained from flux towers located on blanket bog at Balmoral and raised bog at Auchencorth Moss in Scotland. These data were kindly provided by The James Hutton Institute (JHI) and the UK Centre for Ecology & Hydrology (UKCEH) respectively. In addition, to bolster the data available for model development and testing, eddy covariance flux tower data from peatlands in Siikaneva in Finland, and Abisko-Stordalen Palsa and Degero in Sweden were also obtained. These Scandinavian peatlands occur at a higher latitude and in a different climatic zone to Scottish peatlands, but for the purposes of this study the sites were considered to be sufficiently similar to provide a useful testing ground for remote sensing models for carbon flux assessment. In addition, as all three Scandinavian peatlands are part of the Integrated Carbon Observation System (ICOS), this provided assurance that the carbon flux data met the highest quality standards.
Methodology: ESA’s Sentinel-2 MSI products, from the year 2017 to 2022, were acquired over the peatland sites of interest and atmospherically corrected using Sen2Cor and quality-checked using the scene classification mask to remove pixels representing clouds and cloud shadows. The various vegetation indices (NDVI, EVI, NDWI, NIRv) used for this work were then computed using selected spectral bands from the Sentinel-2 MSI. NASA’s MODIS LST products acquired from the same time period and over the same sites were also masked with the quality assurance band to remove poorly calibrated and clouded pixels.
Pixels within a 100 m to 200 m radius of the flux tower footprint were sampled and aggregated to generate a time series of the vegetation indices and LST. The gaps resulting from the removal of poor-quality pixels were filled and smoothed using linear interpolation and Gaussian Process (Rasmussen and Williams, 2006) algorithms. The extracted time series were matched to the corresponding aggregated half-hourly flux tower data (GPP, NEE and RECO) recorded at the same time the satellite passed over the sites of interest.
The collocated and time-matched data were used to calibrate regression models to estimate either GPP, NEE or RECO. Model development was undertaken in two distinct phases. In Phase 1, an adapted Temperature Greenness model for the estimation of GPP was developed using Sentinel-2 MSI and downscaled MODIS LST data. The model developed was underpinned by data from the flux towers located on the Balmoral and Auchencorth peatlands. The Temperature Greenness (TG) model developed by Lees et al. (2021) was designed to estimate Gross Primary Production (GPP) based on coarse resolution MODIS data. In this study the TG model was adapted to Sentinel-2 MSI data and downscaled MODIS LST data to provide outputs at a spatial scale (20 m) more consistent with the scale of most peatland restoration sites. Two downscaling methods were tested to bring the coarser MODIS LST to 20 m spatial resolution. The first method was based on the Data Mining Sharpener (DMS) developed by Guzinski and Nieto (2019). The second method was based on a simple pixel resampling where the coarser LST images were reprojected into a 20 m resolution grid. There were no significant differences between the results from both approaches. The outputs from the DMS were used for work done in Phase 1. Running the DMS model was computationally intensive over larger areas, so the resampling method was used in Phase 2. The adapted TG model was calibrated within a Bayesian (probabilistic) framework which derived uncertainties for model outputs.
In Phase 2, a more data-driven approach was followed whereby models for the estimation of GPP and NEE were developed using machine leaning approaches (Random Forests and Extreme Gradient Boosting) using in-situ flux measurements from the eddy covariance systems located on the Scandinavian peatlands. The data-driven approach exploits the power of machine learning approaches and their ability at solving complex statistical problems. It was not possible to apply the same approach to the data from the Scottish peatland sites due to the smaller number of time-matched training data available.
Results of Phase 1: Phase 1 of this work focused on using satellite-derived NDVI, LST and flux tower-derived GPP over Auchencorth Moss to calibrate a TG model to estimate GPP at 20 m spatial resolution. Due to the Bayesian framework, the model outputs the distribution of GPP estimates instead of the single value. The estimated distribution enabled the computation of mean GPP estimates along with the estimates of upper and lower percentiles. Figure 24 shows a time series plot comparing the observed and estimated GPP. The shaded area shows the prediction uncertainty within the 95% interval. The time series showed high uncertainties for those periods where errors for the estimated values were high.
The correlation between the mean estimated GPP and observed GPP was 0.79 with a co-efficient of determination (R2) of 0.63. This means that over 60% of the variations in the measured GPP fluxes could be explained by the TG model.
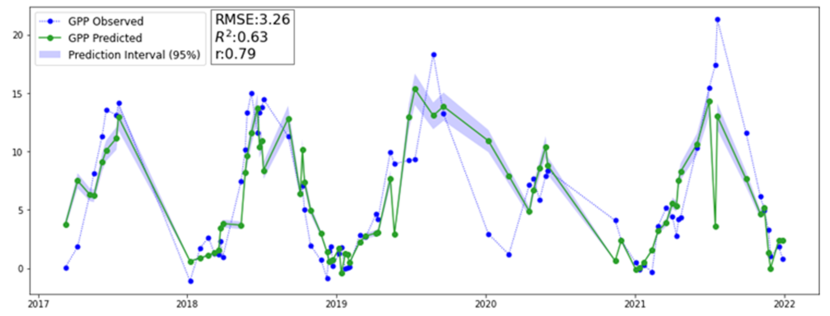
Figure 24. Time series of observed GPP compared to mean of GPP estimated from TG over peatland at Auchencorth Moss.
Click for a full description
A time series graph of observed GPP compared to mean of GPP estimated from the TG model over peatland at Auchencorth Moss. Shaded area depicts the 95% prediction interval of the estimated distribution.
Following the model evaluation, the calibrated model was used to generate GPP maps of selected peatland sites. Figure 25 shows maps of the mean GPP from the estimated distributions for the restoration site at Auchencorth Moss for March 2021 and June 2021. As expected, GPP was generally low in March compared to June. The transferability of the calibrated TG model was tested by generating GPP maps over Flanders Moss as seen in Figure 26.
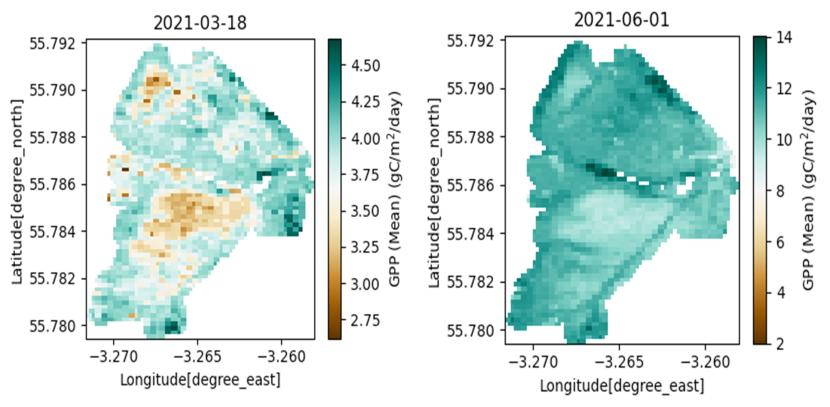
Figure 25. Mean estimated GPP map over restored peatland at Auchencorth Moss.
Click for a full description
Mean estimated GPP map over restored peatland at Auchencorth Moss. The gradients range from brown (low mean GPP) to dark blue (high mean GPP). Maps show estimates from March 2021 (left) and June 2021 (right).
It is important to note that the maps generated over Flanders Moss have not been validated due the unavailability of data at the time of model calibration and testing. This work will be undertaken once sufficient data have been collected by the new eddy covariance flux tower on Flanders Moss. However, from Figure 26, it can be seen that GPP was estimated to be higher in June than in April. This agrees with prior expectations, with GPP typically higher during summer due to increased daylength, solar radiation and temperature.
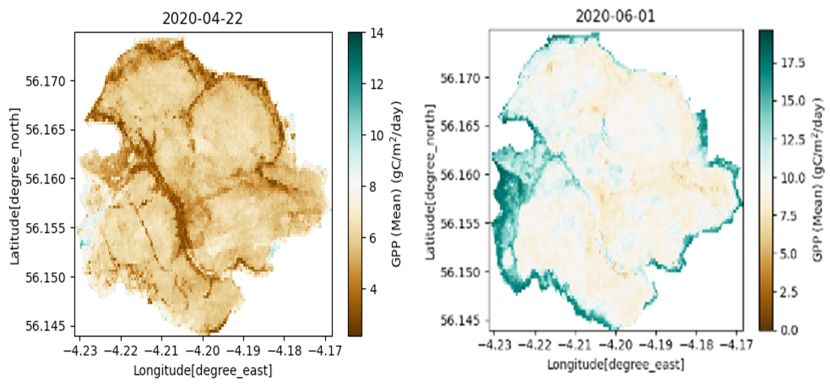
Figure 26. Mean estimated GPP map over restored peatland at Flanders Moss.
Click for a full description
Mean estimated GPP map over restored peatland at Auchencorth Moss. The gradients range from brown (low mean GPP) to dark blue (high mean GPP). Maps show estimates from April 2020 (left) and June 2020 (right).
Limitations of Phase 1: The main limitations of the adapted TG model developed in Phase 1 were related to data availability. This was due to:
- Limited access to flux tower data for Scottish peatlands that could be time-matched with Sentinel-2 observations.
- The loss of potential time-matched data due to extended periods of cloud cover over the two Scottish peatland sites with in-situ flux data.
Results of Phase 2: Phase 2 focused on using a data-driven approach with various machine learning techniques to estimate GPP and NEE. To address some of the limitations associated with data availability in Phase 1, additional data was obtained from three eddy covariance flux towers in the ICOS network. These were at two peatlands in Sweden (Abisko-Stordalen Palsa, Degero) and one in Finland (Asiikaneva), mostly because of greater data availability. These sites had extended time-series of measured land-atmosphere carbon fluxes and this also enabled us to apply gap-filling techniques to maximise the data available for model training and validation. Gaps in the satellite input data (e.g. NDVI, EVI, NDWI, LST) were filled using a Gaussian process machine learning model (Figure 27). A comparison of this gap-filled time series with the observed time series is shown in Figure 28.
The gap-filled input data was used to estimate GPP and NEE by training and testing various machine learning models using the flux tower data from the Scandinavian peatlands. The top two machine learning models for estimating GPP and NEE were random forests and extreme gradient boosting (XGBoost). These models achieved R2 values of between 0.82-0.85 with a combination of satellite-derived input variables such as EVI, NIRv, NDWI and LST. For both GPP and NEE, models using information on land surface greenness (EVI or NIRv), wetness (NDWI) and temperature (LST) as inputs showed significantly better agreement with the in-situ flux data than models built using any of these indices individually. See examples of these results in Figure 29.
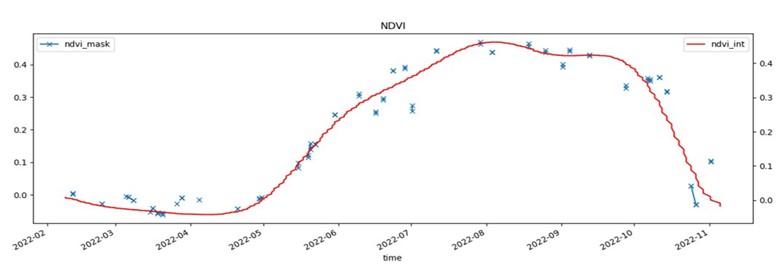
Figure 27. Example of the results of a Gaussian gap filling process of the satellite data for a Swedish peatland.
Click for a full description
Example of the results of a Gaussian gap filling process of the satellite data from the Abisko-Stordalen Palsa peatland in Sweden. The blue points show extracted NDVI data with gaps. The red line shows gap filled NDVI data.
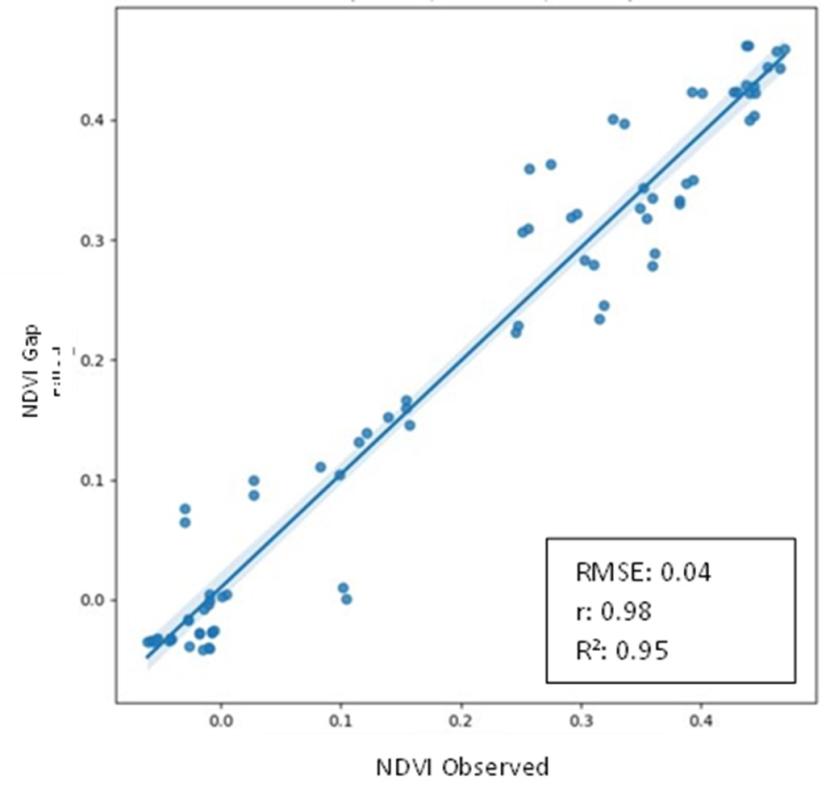
Figure 28. Comparison of the observed NDVI time series and the gap-filled time series for the Swedish peatland.
Click for a full description
A scatter plot comparing the observed NDVI time-series and the gap-filled time-series for Abisko-Stordalen Palsa peatland in Sweden (Root Mean Square Error = 0.04 NDVI units; R2 = 0.95).
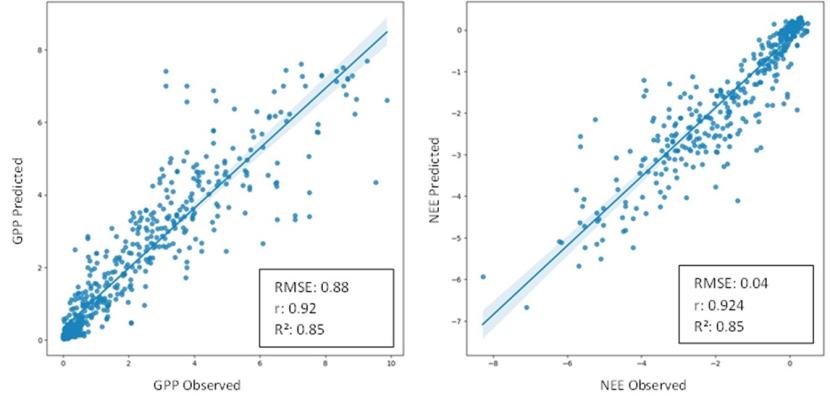
Figure 29. Scatterplots showing estimated GPP using different satellite time series.
Click for a full description
Scatterplots showing the estimated GPP (left) using satellite EVI, NDWI and LST time-series and NEE (right) using satellite NIRv, NDWI and LST time series. Both models are fitted using an XGBoost algorithm and have an R2 value of 0.85.
In Phase 2, similar input variables to those used by the TG model and other algorithms for terrestrial primary production were maintained (Badgley et al., 2019; Junttila et al., 2021). Although the performance of the machine learning models was significantly better compared to the existing TG model, they proved to be biased when tested and evaluated for transferability to the available datasets from the two Scottish peatlands. The poor performance of the models over the two Scottish peatlands was mainly due to the higher GPP/NEE values than observed in the Scandinavian peatlands. These limitations are currently being addressed by including more data from Scottish peatland sites in the algorithm training. It is important to note here that the algorithms, when properly calibrated, can be implemented at scale, so it is entirely feasible to run them operationally over large areas.
Data visualisation platform
The data visualisation platform being developed for Forth-ERA includes a dedicated dashboard to provide access to data on peatland condition within the Forth Valley region. This dashboard is being developed in collaboration with 3DEO. At the time of reporting, this dashboard is still in development, but a beta version has been released to showcase its capabilities. The dashboard will not only visualise our remote sensing data products, but it will also allow exploration, comparison, and aggregation of data from the wireless sensor network.
The dashboard for monitoring peatland restoration projects is centred around a map showing the location of individual peatland restoration sites within the Firth of Forth catchment alongside the locations of the sensors and areas for which satellite data products are available (see Figure 30). Dedicated menus allow users to switch between the available dashboards, filter the features and datasets displayed on the map, and toggle contextual layers (e.g. boundaries) off and on. The peatland restoration sites can be selected to provide access to a dedicated information panel with images and background information.
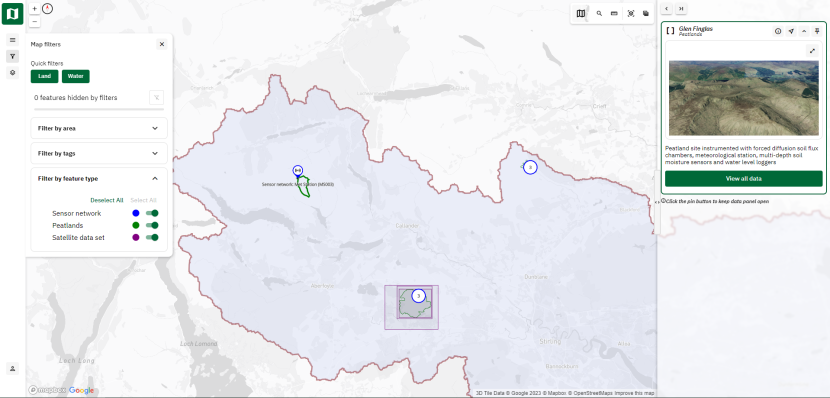
Figure 30. Screenshot of the Forth-ERA peatlands dashboard.
Click for a full description
Peatlands dashboard map showing outline of Forth catchment area, peatland monitoring sites and their information panel, locations of ground sensors and remote sensing data products.
Remote sensing data products
The remote sensing data products developed in this study (see Section 3) can be visualised on the map interface using a dedicated toolset developed specifically for the visualisation of time-series satellite datasets. The remote sensing data are produced using cloud-ready pipelines that are highly scalable allowing the approaches to be easily applied to large areas. The output data products are managed using state-of-the-art data cube technology designed to allow large satellite datasets to be made available to users over the internet while providing the ability to interrogate and analyse data products ‘on-demand’.
The remote sensing data products are visualised as raster images with colour scales overlaid on the map at the location of the respective peatland (see Figure 31 for an example). This includes visualisation of water table depth, gross primary production (lower limit, mean and upper limit) and surface motion (displacement). Individual points and areas can be drawn within the bounding box of the peatland site to extract spatially-aggregated time-series and produce interactive plots. This not only allows the comparison of data trends from different locations across the peatland site, but it also allows the user to derive an estimate for the entire extent of the peatland. This is particularly useful for understanding changes at the ecosystem-scale. To better understand changes over time across the site, the image data cube can be animated with the images viewed successively in chronological order.
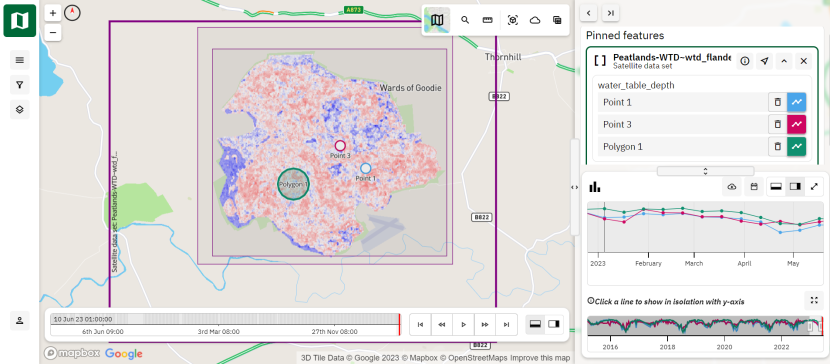
Figure 31. Screenshot of WTD data at Flanders Moss visualised on the Forth-ERA peatlands dashboard.
Click for a full description
A screenshot of the peatlands dashboard map showing the WTD at Flanders Moss as gradient overlay over a map of the peatland, with data from different points within the peatland visualised on a line graph in the right-hand side panel.
Wireless sensor network
Individual sensors within the wireless sensor network are represented on the map using unique icons. However, to reduce map clutter at low zoom levels, the dashboard uses dynamic clustering whereby sensors are clustered together and represented by an icon that shows the number of sensors within the cluster. These clusters are expanded automatically as the user increases the zoom level. The sensor and cluster icons can be selected to reveal a panel showing the variables measured by each of the different sensors at that location. This panel lets the user explore more in-depth information about each individual sensor and visualise and compare the data in one or more plots.
Data from different sensors and locations can be shown on a single plot to aid comparability, with the data being normalised automatically to avoid issues due to different measurement scales. For instance, measurements of ‘distance to water’ (i.e. water table depth) from a water level sensor can be compared to the data recorded by a rainfall gauge from a meteorological station (see Figure 32). It is also possible to visualise sensor and extracted remote sensing time-series on the same plot. The timeframe that is displayed can be adjusted using a slider overlaid on the entire recorded time series below the plot.
Currently, all sensor data streams are visualised using the same plotting functions. However, bespoke plotting and data visualisation for the eddy covariance flux tower is currently being developed which will allow measured fluxes to be visualised alongside a heatmap of the measurement footprints and time-matched phenocam images.
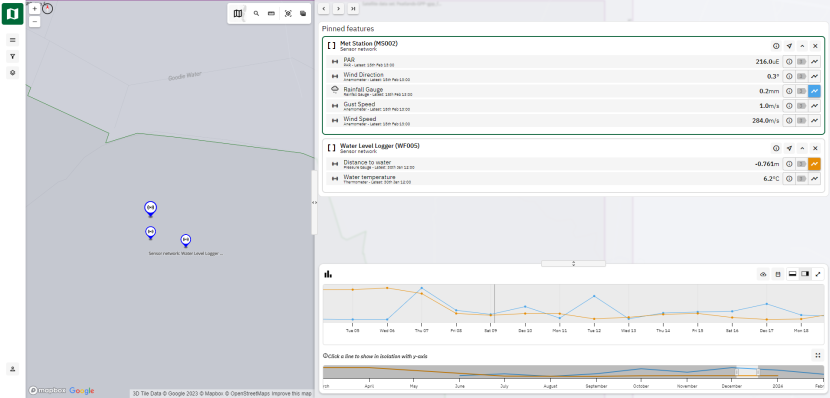
Figure 32. Screenshot of peatlands dashboard extended data panel showing selected features and data comparison.
Click for a full description
Data panel showing an overview of the different variables measured by the selected features, as well as a comparison of the data on 'distance to water' (orange) and rainfall (blue) in a line plot. A slider bar below the plot allows selection of different time periods.
Discussion
Monitoring peatland condition at scale
This study has demonstrated how remote sensing can be used to monitor the condition of peatland ecosystems, providing a set of tools that can be used to assess the outcomes of peatland restoration projects in Scotland and elsewhere. Further, we have shown how wireless sensor networks can be used to augment remote sensing approaches and improve model performance while providing data on peatland condition at complementary space and time scales.
The primary objective of most peatland restoration schemes is to reinstate the natural capacity of peat bogs to capture and store carbon as a nature-based solution to climate change. In addition, restoring peat bogs can deliver other environmental benefits including flood mitigation, improvements to water quality, and the protection and enhancement of biodiversity. Because many of these benefits, including land-atmosphere carbon fluxes, are strongly linked to the hydrology of peatlands, this is often a core focus for monitoring programmes. In the main, peatland hydrology is monitored by recording changes in water table depth using manual dipwells or data loggers. In recent years, wireless sensors have also been used to monitor water table depths, albeit in a more limited manner.
The limitations of these more conventional approaches to monitoring peatland hydrology are primarily two-fold. Firstly, the spatially complex and variable nature of peatlands and their hydrological regimes presents a challenge for acquiring representative data. Peatlands often cover large expanses, but water table depths can vary over relatively small spatial scales making it difficult to obtain representative measurements of change at landscape or ecosystem level. Secondly, while water level loggers are relatively inexpensive compared to other environmental sensors (e.g. gas flux sensors) enabling water level data to be acquired relatively cost-effectively at site-level, it is still likely to be prohibitively expensive to install replicated devices across large numbers of peatlands due to the capital and maintenance costs.
Remote sensing is arguably the only approach that can be used to monitor peatlands at scale. In this project, we developed two separate remote sensing data products to monitor change in peatland hydrology. Firstly, we developed a data-driven approach for estimating peatland water table depth using machine learning (gradient boosting). The inputs to the model were backscatter intensities and polarisation metrics from Sentinel-1 C-band SAR and modelled surface moisture data from ECMWF ERA-5. The model was trained, tested, and validated using in-situ water level data from all available Peatland ACTION water table loggers that fall inside the Sentinel-1 SAR frame, using 35 peatland sites. The model was able to estimate peatland water table depth with an R2 = 0.72; the highest errors being observed at either very low (low surface connectivity) or high (surface inundation) water table depths. Importantly, the model performed robustly when applied to the large number of peatland sites, which was no doubt aided by the large dataset available for model development.
In a second complementary approach, we used Sentinel-1 C-band InSAR to measure changes in the surface motion of selected peatlands – a seasonal pattern sometimes referred to as ‘bog breathing’. The surface motion of peatlands is also a function of the hydrological regime, although is also influenced by other factors such as vegetation growth and the accumulation or erosion of peat. In this project we demonstrated the potential for Sentinel-1 C-band InSAR to track very small changes (on the scale of centimetres) in the surface motion of peatlands. This approach is highly complementary to the estimation of water table depth and the two methods can be deployed in tandem to track seasonal and long-term changes in peatland hydrology. We were not able to undertake a direct validation of the surface motion estimates, although the newly installed corner reflectors will provide valuable reference targets on our demonstration sites. However, as InSAR is an established method, with previous studies in the Flow Country showing good results (Alshammari et al., 2020), we can assume a high confidence in the accuracy of the data. These approaches may also prove useful for determining the effect of drought on peatland ecosystems (indeed we could see the effect of prolonged drought in the surface motion time-series). The Sentinel-1 C-band InSAR could also be used to measure peatland erosion at degraded sites (although not shown here, we have applied the method to a peatland extraction site to demonstrate the ability to measure reductions in peat volume).
One of the major strengths of the use of SAR is the fact it penetrates cloud cover, which greatly increases the frequency of observation in cloud prone regions such as Scotland. This allows detailed time-series to be constructed improving our ability to detect systematic change in peatland condition. However, while we can infer information on peatland hydrology from SAR and we would expect that carbon sequestration and storage will be enhanced in wetter peatlands, it is not straightforward to estimate change in land-atmosphere carbon fluxes from SAR. Instead, as shown in this project, carbon fluxes in the form of GPP and NEE can be estimated from a combination of optical and thermal data. In this project, we demonstrated for the first time the feasibility of this using high resolution data from Sentinel-2 MSI and downscaled MODIS LST data in both a physical (TG model) and data-driven model framework. We showed that GPP could be estimated with an R2 = 0.63 for two Scottish peatlands with estimates of GPP and NEE improving to an R2 = 0.85 for three Scandinavian peatlands (considered as analogues for Scottish peatlands). While the results achieved for the Scottish peatlands were satisfactory, it was evident the larger dataset of in-situ flux measurements available for the Scandinavian peatlands significantly improved the accuracy of the models.
The estimation of carbon fluxes from remotely sensed data could be used to estimate the net carbon benefit of peatland restoration projects as a means of reporting progress against climate objectives. The methods developed here are less robust than those for the peatland hydrology products and we were not able to transfer the models developed for the Scandinavian peatlands to sites in Scotland. This partly reflects the complex factors that influence carbon fluxes in peatlands, but perhaps more significantly the benefits of having large datasets available to support model training and validation. While the number of peatland sites equipped with eddy covariance flux towers in the UK is small, the number is slowly increasing with several new installations commissioned over recent years across a range of different peatland sites (including the new tower installed on Flanders Moss as part of this project). The data from these flux towers will be invaluable in supporting remote sensing of peatland carbon dynamics. Despite the smaller measurement footprint, measurements from the lower-cost chamber systems will also be useful to support remote sensing models.
On the basis of the results achieved in this project, we believe that remote sensing can be used to measure peatland condition and monitor the success of restoration projects at scale in Scotland. The use of SAR data for monitoring surface hydrology is sufficiently mature to be used at a regional or even national scale – albeit with ongoing and rigorous validation with new in-situ data as they become available. The fact that the approach performed robustly across 35 sites provides a degree of confidence it provides valuable data on peatland condition. Even in the event the estimates of water table depth were biased in absolute terms, we believe the approach would likely still provide a useful relative indicator of change in peatland hydrology. Furthermore, the approach can be easily coupled with the InSAR approach for the assessment of surface motion as this provides complementary information and would assist with the interpretation of change.
The estimation of carbon fluxes using remote sensing indices related to land surface greenness, wetness and temperature was shown to work well for selected peatlands – particularly when larger datasets facilitated a data-driven approach. However, the approach currently is less mature than the use of SAR for peatland hydrology. We recommend that the use of remote sensing for estimating carbon fluxes is used synergistically alongside the SAR-based methods but restricted to sites where in-situ measurements of carbon fluxes are available for model training and validation or sites with similar ecohydrological and climatic conditions. In terms of how such an approach might work in practice, the SAR methods for peatland hydrology could be implemented at scale, while changes in the net carbon balance could be monitored at a number of representative ‘sentinel’ sites. This would enable the hydrological regimes of all peatland restoration sites observable from space to be monitored, while the ‘sentinel’ sites would provide supplementary evidence that raising the water table of degraded peatlands delivers net carbon benefits. As the availability of in-situ carbon flux measurements improves, the models for carbon fluxes could be easily re-trained with expected improvements in their applicability.
The development of robust remote sensing approaches for peatland condition assessment relies on the availability of large, high quality in-situ datasets for model training, testing and validation. While the Forth-ERA wireless sensor network for peatland monitoring is still in its infancy, this project has demonstrated the value of having a network of sensors constantly collecting data on peatland hydrology, carbon fluxes and other environmental parameters. It is unlikely that a sensor network like the one established as part of this project could be deployed at scale across large numbers of restoration sites, but the installation of sensors at a number of ‘sentinel’ peatlands would add greatly to the availability of data to support remote sensing approaches while also providing independent but complementary information on peatland condition and recovery from restoration. As the cost of sensor hardware, networking, and cloud hosting decreases in the future, it will become more feasible to deploy sensor networks across a range of Scottish ‘sentinel’ peatlands. Here we developed a blueprint for a highly integrated, cybersecure and scalable network of diverse sensors that could be easily transferred and scaled in the future.
Limitations
Remote sensing and sensor networks have much potential to contribute to the monitoring of peatland habitats and to track changes in site condition following restoration measures. However, there are some general limitations to their use for monitoring Scotland’s peatlands in addition to those highlighted in previous sections.
- Granularity of data. The foremost advantage of remote sensing is the ability to collect data repeatedly at scale. Conversely, field surveys provide highly detailed site-level data but are resource intensive and therefore challenging to repeat frequently over large areas. Because remote sensing cannot fully measure all dimensions of peatland condition (e.g. biodiversity), there will likely always be a need to complement remote sensing methods with targeted field-based surveys. However, remote sensing data can be used intelligently to inform when and where field surveys should be undertaken. In this context, further effort should be invested in the design of monitoring programmes to maximise the synergy of these methods for national-scale peatland monitoring.
- Data gaps and biases. Remote sensing time-series derived from optical sensors are inherently gappy because observations are lost due to cloud cover. This is a particular limitation at northerly latitudes. In severe cases, gaps in the satellite time-series can make it hard to detect abrupt changes or clearly elucidate longer-term trends. Moreover, satellite time-series can also have strong seasonal biases (e.g. disproportionally more observations during summer months) which can influence the estimation of annual values (e.g. net ecosystem exchange). Radar data are far less affected by cloud and other atmospheric effects and therefore provide a more continuous time-series (albeit currently the revisit of Sentinel-1 is reduced to every 8 days until the next generation of satellites are launched). Monitoring programmes should therefore seek to adopt multi-mission approaches combining the strengths of both optical and radar data for peatland monitoring.
- Data for model development. Remote sensing algorithms, particularly data-driven approaches similar to those used in this study, require relatively large in-situ datasets for training, testing and validation to ensure methods are robust and generalisable. Models trained with larger and more representative datasets can generally be expected to perform better. In this study, the models developed for water table estimation had a greater capacity to generalise in space and time than those developed for the quantification of carbon fluxes. This was partly due to the volume of data available for training. Long-term datasets on land-atmosphere carbon gas exchange remain rare for peatlands and this currently is a constraint on the development of remote sensing methods. However, the situation is improving with new eddy covariance towers being installed on bogs in Scotland and elsewhere in the UK. It is essential that these data are made available to support the advancement of remote sensing methods.
- Remote sensing signal interpretation. The interaction of electromagnetic radiation with the surface features of peatlands is a complex process both in the optical and microwave domains. While the remote sensing models developed in this study had a strong theoretical underpinning, there are other confounding factors that can influence the signals measured by satellite sensors over peatlands. For instance, the relationship between radar backscattering and water table depth is likely to be affected by changes in vegetation growth both seasonally and over the longer-term. Similarly, while peatland surface motion observed by InSAR reflects changes in the hydrological status of bogs, it is also likely to affected by vegetation and other environmental factors. Data should always be interpreted with an awareness of these potential confounding factors.
- New and extended satellite missions. The last decade has witnessed a significant increase in the number of Earth observation missions. New missions often bring new capabilities, but also a need to develop new data processing chains. Fortunately, the European Space Agency Sentinel missions will be replaced with near-identical satellites before the end of the current mission lifecycles which will minimise the need to radically redevelop existing data processing chains operationalised for peatland monitoring. However, the application of the models developed here to future satellite missions with new capabilities (e.g. Kuva Space Hyperfield, Landsat Next) would require work to adapt processing chains to accommodate the new data streams.
Future research directions
The research presented in this report was undertaken as part of Forth-ERA: a long-term programme to develop a state-of-the-art digital environmental observatory for the Forth Valley region. The remote sensing pipelines developed here will now be operationalised to provide continuous time-series data on peatland condition across all peatland restoration sites with the Forth Valley (and the wider Firth of Forth catchment). In the immediate term, we will be extending the existing sensor network and remote sensing pipelines to encompass a set of peatland restoration sites within the Loch Katrine sub-catchment with additional funding from Scottish Water. This will include further validation (and re-training where appropriate) of the models as new in-situ data are provided by the wireless sensor network and our collaborative partners. The data will be accessible to the public on the Forth-ERA visualisation platform via the dedicated peatlands dashboard.
Ultimately, Forth-ERA is a testbed for developing and demonstrating novel approaches to environmental monitoring that can subsequently be transferred and upscaled elsewhere. To this end, it is the ambition of the Forth-ERA programme to develop the concept presented here for peatland condition monitoring in other regions and, indeed, nationally. The cloud infrastructure developed as part of Forth-ERA means our remote sensing pipelines, sensor networking, and frontend visualisation platform are highly adaptable and scalable. We can run existing in-house data processing pipelines and implement new methods developed by other research teams. Demonstrating that remote sensing methods can be used operationally for peatland monitoring is key to mainstreaming the approach and encouraging adoption across the public and private sectors.
In the longer-term, the advent of new satellite sensors such as L-band SAR and high spatial resolution hyperspectral (e.g. Planet, Kuva Space) and thermal (e.g. SatelliteVu) will further increase the value of remote sensing as a tool for peatland condition monitoring. While the prospect of new sensing technologies (e.g. lower cost eddy covariance systems) allied with improved coverage by low power wide area communication networks, and more efficient off-grid power solutions will allow in-situ wireless sensor networks to be developed in tandem. This will afford the opportunity to develop highly integrated, holistic approaches for peatland monitoring capable of providing data at the spatial and temporal scales needed to rigorously evaluate the outcomes of peatland restoration projects and robustly evidence progress against critical policy objectives.
References
Aitkenhead, M. and Coull, M. 2019. Mapping soil profile depth, bulk density and carbon stock in Scotland using remote sensing and spatial covariates European Journal of Soil Science, 71(4), 553–567.
Alderson, D.M., Evans, M.G., Shuttleworth, E.L., Pilkington, M., Spencer, T., Walker, J. and Allott, T.EH. 2019. Trajectories of ecosystem change in restored blanket peatlands Science of the Total Environment, 665, 785-796.
Allan, J.M., Guêné‐Nanchen, M., Rochefort, L., Douglas, D.J.T. and Axmacher, J.C. 2024. Meta‐analysis reveals that enhanced practices accelerate vegetation recovery during peatland restoration Restoration Ecology, 32: e14015.
Alshammari, L., Boyd, D.S., Sowter, A., Marshall, C., Andersen, R., Gilbert, P., Marsh, S. and Large, D.J. 2020. Use of surface motion characteristics determined by InSAR to assess peatland condition Journal of Geophysical Research: Biogeosciences, 125(1).
Badgley, G., Anderegg, L.D.L., Berry, J.A. and Field, C.B. 2019. Terrestrial gross primary production: Using NIRV to scale from site to globe Global Change Biology, 25(11), 3731–3740.
Bechtold, M., Schlaffer, S., Tiemeyer, B. and De Lannoy, G. 2018 Inferring water table depth dynamics from ENVISAT-ASAR C-Band Backscatter over a range of peatlands from deeply-drained to natural conditions Remote Sensing, 10(4), 536–557.
Bradley, A.V., Andersen, R., Marshall, C., Sowter, A. and Large, D.J. 2022. Identification of typical ecohydrological behaviours using InSAR allows landscape-scale mapping of peatland condition Earth Surface Dynamics, 10(2), 261–277.
Chapman, S. J., Bell, J., Donnelly, D. and Lilly, A. 2009. Carbon stocks in Scottish peatlands Soil Use and Management, 25(2), 105–112.
Evans, C., Artz, R., Moxley, J., Smyth, M-A., Taylor, E., Archer, N., Burden, A., Williamson, J., Donnelly, D., Thomson, A., Buys, G., Malcolm, H., Wilson, D., Renou-Wilson, F. and Potts J. 2017. Implementation of an emissions inventory for UK peatlands Report to the Department for Business, Energy and Industrial Strategy, Centre for Ecology and Hydrology, Bangor.
Evans, C.D., Peacock, M., Baird, A.J., Artz, R.R.E., Burden, A., Callaghan, N., Chapman, P.J., Cooper, H.M., Coyle, M., Craig, E., Cumming, A., Dixon, S., Gauci, V., Grayson, R.P., Helfter, C., Heppell, C.M., Holden, J., Jones, D.L., Kaduk, J., Levy, P., Matthews, R., McNamara, N.P., Misselbrook, T., Oakley, S., Page, S.E., Rayment, M., Ridley, L.M., Stanley, K.M., Williamson, J.L., Worrall, F. and Morrison, R. 2021. Overriding water table control on managed peatland greenhouse gas emissions Nature, 593, 548–552.
Guzinski, R. and Nieto, H. 2019. Evaluating the feasibility of using Sentinel-2 and Sentinel-3 satellites for high-resolution evapotranspiration estimations Remote Sensing of Environment, 221, 157-172.
Howie, S.A. and Hebda, R. 2018. Bog surface oscillation (mire breathing): A useful measure in raised bog restoration Environmental Science, 32, 1518-1530.
Junttila, S., Kelly, J., Kljun, N., Aurela, M., Klemedtsson, L., Lohila, A., Nilsson, M. B., Rinne, J., Tuittila, E.S., Vestin, P., Weslien, P. and Eklundh, L. 2021. Upscaling northern peatland CO2 fluxes using satellite remote sensing data Remote Sensing, 13(4), 1–23.
Kim, J.W., Lu, Z., Gutenberg, L. and Zhu, Z. 2017 Characterizing hydrologic changes of the Great Dismal Swamp using SAR/InSAR Remote Sensing of Environment, 198, 187-202.
Kim, Y., Park, S.J., Lee, B.Y. and Risk, D. 2016. Continuous measurement of soil carbon efflux with Forced Diffusion (FD) chambers in a tundra ecosystem of Alaska Science of the Total Environment, 566–567, 175–184.
Lees, K.J., Khomik, M., Quaife, T., Clark, J.M., Hill, T., Klein, D., Ritson, J. and Artz, R.R.E. 2021. Assessing the reliability of peatland GPP measurements by remote sensing: From plot to landscape scale Science of the Total Environment, 766.
Marshall, C., Sterk, H.P., Gilbert, P.J., Andersen, R., Bradley, A.V., Sowter, A., Marsh, S. and Large, D.J. 2022. multiscale variability and the comparison of ground and satellite radar based measures of peatland surface motion for peatland monitoring Remote Sensing, 14(2).
Rasmussen, C.E. and Williams, C.K.I. 2006. Gaussian processes for machine learning. The MIT Press.
Rosen, P.A., Gurrola, E., Sacco, G.F. and Zebker, H. 2012. The InSAR scientific computing environment. EUSAR 2012; 9th European Conference on Synthetic Aperture Radar, 730–733.
Tampuu, T., Praks, J., Uiboupin, R. and Kull, A. 2020. Long term interferometric temporal coherence and DInSAR phase in Northern Peatlands Remote Sensing, 12(10).
Vasco, D.W., Farr, T.G., Jeanne, P., Doughty, C. and Nico, P. 2019. Satellite-based monitoring of groundwater depletion in California’s Central Valley Scientific Reports, 9.
Xue, F., Lv, X., Dou, F. and Yun, Y. 2020. A review of time-series Interferometric SAR techniques: A tutorial for surface deformation analysisIEEE Geoscience and Remote Sensing Magazine, 8(1), 22–42.
Yunjun, Z., Fattahi, H., and Amelung, F. 2019. Small baseline InSAR time series analysis: Unwrapping error correction and noise reduction Computers & Geosciences, 133.


