NatureScot Research Report 1376 - Status of the adder in Scotland (2022-24) - re-survey and comparison with the 1994 study
Published: 2025
Authors: Ward, R.J., Gray, F.G., Foster, J., Cooper-Bohannon, R. (Amphibian and Reptile Conservation)
Julian, A.M. (Amphibian and Reptile Groups of the UK)
Whatley, C., Raynor, R., McKinnell, J. (NatureScot)
Cite as: Ward, R.J., Gray, F.G., Foster, J., Cooper-Bohannon, R., Julian, A.M., Whatley, C., Raynor, R., and McKinnell, J. 2025. Status of the adder in Scotland (2022-24) - re-survey and comparison with the 1994 study. NatureScot Research Report 1376.
Keywords
adder; Vipera berus; conservation status; reptiles; Scotland; monitoring; Zootoca vivipara; Anguis fragilis
Background
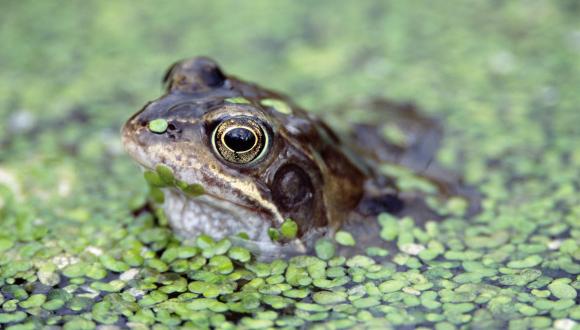
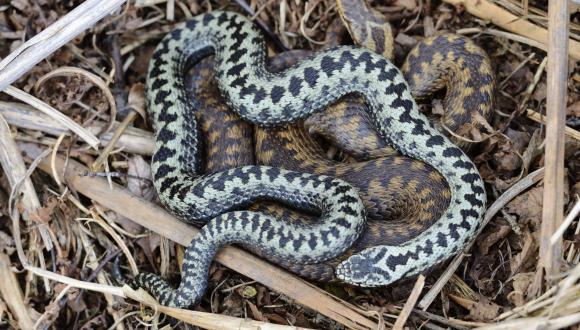
Reptiles can prove to be a challenging group to determine the status of due to their low detectability and gaps in recording efforts. Scotland is home to three terrestrial reptile species commonly accepted as native: the adder (Vipera berus), the common lizard (Zootoca vivipara) and the slow-worm (Anguis fragilis). The grass snake (Natrix helvetica) has been recorded in Scotland and it possibly occurs as a native species in Dumfries & Galloway and the Scottish Borders (see e.g. Cathrine, 2014), although further evidence is required to confirm this. The adder is Britain’s only venomous snake, and concerns have been raised over population declines (Cooke and Scorgie, 1983; Hilton-Brown and Oldham, 1991; Baker et al., 2004; Gleed-Owen and Langham, 2012; Gardner et al., 2019). Indeed, the recent Great Britain IUCN Red List assessment considered the adder to be Near Threatened in Scotland and Britain as a whole, and Vulnerable in England (Foster et al., 2021). In Scotland the adder receives protection under the Wildlife and Countryside Act 1981 (as amended) from intentionally or recklessly being killed or injured, as well as being sold.
A study commissioned by NatureScot (then Scottish Natural Heritage) was undertaken in the early 1990s to understand the status of the adder in Scotland (Reading et al., 1994). The study used both questionnaire and field survey methods to improve knowledge of the species across Scotland. It found evidence of declines and provided recommendations for further work, with adders reported across much of Scotland, but with some clear distribution gaps in the Central Valley, Outer Hebrides and Northern Isles, as well as within a large proportion of the upland region between Inverness and Glasgow. Though there have been both semi-structured and ad-hoc recording efforts in the intervening years (e.g. the National Amphibian and Reptile Recording Scheme - Wilkinson and Arnell, 2013; Make the Adder Count - Gardner et al., 2019), the results have not allowed a meaningful comparison with the 1994 study.
This study aims to repeat the work carried out previously (Reading et al., 1994) using comparable methods and provide evidence for any changes in species status since 1994. Therefore, this study comprised an online questionnaire and a re-survey of the original 1994 study sites, undertaken from 2022 to 2024.
Main findings
- The majority of questionnaire respondents indicated no perceived changes in adder populations over the preceding 10 years. However, a greater proportion of respondents considered adders to be less common in that 10-year period than more common.
- Reported changes in land use were dominated by afforestation and agricultural use, though with notable references to conservation actions such as habitat restoration and rewilding.
- Based on available evidence, the number of 10km squares occupied by adders in Scotland has declined significantly since 1994, though the range remains broadly the same as reported previously. This is characterised by distinct gaps in the Central Valley, Outer Hebrides and Northern Isles, as well as within a large proportion of the upland region between Inverness and Glasgow.
- Results from field surveys in this and the previous study 30 years prior showed the same proportion of sites to be observed as being occupied by adders. However, at sites surveyed in both studies, there was an overall reduction in observed adder occupancy between the two time periods.
- The study design did not allow any robust conclusions about changes in abundance of adders.
- We recommend that a consistent network of sites is monitored for adders and other reptiles over time to provide reliable information on occupancy and population trends.
- We recommend further survey effort to target distribution gaps and determine species presence/absence, particularly in areas that have seemingly become unoccupied between the two studies.
Acknowledgements
We would like to express our gratitude towards the various landowners, site managers and rangers from Blair Atholl Estate, Clan Donald Land Trust, Dougarie Estate, Forestry and Land Scotland, Hopes Estate, Invercauld Estates, Kelpie Woodlands, Mackay Forestry and Farming Partnership, MacLeod Estate, Mayshiel Estate, NatureScot, and Tilhill Forestry for allowing access to land and providing support to the project. We would also like to thank all questionnaire respondents for their participation and contribution to this and the previous study, to all organisations that helped promote the study, and give particular thanks to the comments, advice and support provided by Dr Chris Reading, Jane Allan, Chris McInerny, and colleagues from Amphibian and Reptile Conservation, Amphibian and Reptile Groups UK and NatureScot.
We would also like to thank all of our surveyors for their time and expertise: Paul Anderson, João Araújo, Nick Brown, Daniel Brown, Chris Cathrine, Stephen Corcoran, Brian Dalton, Anmouren Ding, Ruari Dunsmuir Hannah Gillott, Mark Greener, Gavin Irish, Dorothy Jackson, Valerio Llamine, Andrew Mossop, Adam Murphy, Daniel O’Brien, David O’Brien, Erik Paterson, Robert Raynor, Trevor Rose, Owen Scott, Michael Simmins, Julia Stoddart, Vanessa Tang, Lindsay Thatcher, Charlie Towler, Janet Ullman, and Shan Xi.
Introduction
A survey commissioned by NatureScot (then Scottish Natural Heritage) was previously undertaken in the early 1990s to assess the status and distribution of the adder (Vipera berus) (Reading et al., 1994). The study used both questionnaire and field survey methods to improve knowledge of the species across Scotland. Though there have been both semi-structured and ad-hoc recording efforts in the intervening years (e.g. the National Amphibian and Reptile Recording Scheme – NARRS; Make the Adder Count - Gardner et al., 2019), these have not been designed to allow a comparison with the 1994 study.
Concerns have been raised over declines of adder populations in Britain (Cooke and Scorgie, 1983; Hilton-Brown and Oldham, 1991; Baker et al., 2004; Gleed-Owen and Langham, 2012; Beebee and Ratcliffe, 2018; Gardner et al., 2019). Indeed, the recent Great Britain IUCN Red List assessment considered the species to be Near Threatened in Scotland, Wales, and Britain as a whole, and Vulnerable in England (Foster et al., 2021). These declines have been attributed to various factors including habitat loss, fragmentation, and modification, some of which is the result of succession, inappropriate management, or a lack of management. However, a greater understanding is needed on the severity of these and other pressures (Foster et al., 2021).
In Scotland, the adder receives protection under the Wildlife and Countryside Act 1981 (as amended) from intentional or reckless killing or injury, as well as being sold. The adder also appears on the Scottish Biodiversity List as a species that Scottish Ministers consider to be of principal importance for biodiversity conservation in Scotland.
The adder is Britain’s only venomous snake species. It can be found in a variety of habitats, including grassland, woodland, upland moors, heathland, mires and coastal areas. Though they can be sensitive to disturbance, they are also sometimes found in human-modified environments such as railway and road embankments and on golf courses. Mountainous areas and intensively managed arable land are considered to be less suitable (Reading et al., 1996; McInerny, 2014b; McInerny and Minting, 2016). The species also requires habitat features in which to overwinter. These are typically south-facing, and must be well draining and free from risk of frost and flooding. Commonly associated vegetation includes bracken, gorse, and bramble which provide cover (McInerny, 2014b).
The distribution of the adder in Scotland has previously been reported as widespread but patchy, being more common in the south, but not as widely distributed as it once was and with clear gaps. Concerns have also been raised over population declines. It is not thought to occur within Shetland, Orkney, or the Outer Hebrides (Frazer, 1983; Reading et al., 1994; 1996; McInerny, 2014b; McInerny and Minting, 2016).
The previous study solicited questionnaire responses from farmers and other landowners and managers, stratified to provide good coverage across Scotland. The responses provided indications of distribution gaps within the Central Valley, the Outer Hebrides and the Northern Isles, as well as much of the mountainous Central Highlands region between Inverness and Glasgow (Reading et al., 1994; 1996; McInerny and Minting, 2016). Furthermore, it found land use to be a predictor of distribution, and that adder abundance was likely to have declined in the 10 years preceding the study.
This study looks to repeat the work carried out previously (Reading et al., 1994), and where possible provide evidence for any changes in species status.
Methods
Questionnaire survey
A previous study produced two forms of questionnaire for distribution (Reading et al., 1994; 1996). The first was targeted towards farmers in 1992 and 1993, and the second in 1992 to a wider audience of individuals and organisations with an interest in the countryside (e.g. for work, leisure, conservation) including estate owners, environmental NGOs, biological recorders, and the Forestry Commission (Reading et al., 1994). These are from here on referred to as the ‘Farm Survey’ and ‘ITE Survey’ (Institute of Terrestrial Ecology) respectively. For this study we developed a survey questionnaire in 2022 using Microsoft Forms, which we refer to as the ‘Adder Survey’. This was hosted on the NatureScot website in January 2023, and closed on the 31st of March 2024. The form design was informed by the Farm and ITE Survey questionnaires for consistency, and to allow comparison of results. The form included the capture of location information to allow an assessment of respondent coverage, but did not capture other personal information to ensure anonymity, and to conform with data protection legislation. The survey was modified in late 2023 to reduce the amount of time the survey took to complete by condensing some location questions, allow more space for personal comments, and to ask how survey participants found out about the survey. The survey was mainly targeted at landowners and managers, including farmers and crofters, but due to poor survey participation this was expanded to include anyone who knew land in Scotland well and had done so for a long period of time. The final form design is shown in Annex 1.
The Adder Survey questionnaire was promoted through social media by NatureScot, Amphibian and Reptile Conservation (ARC) and Amphibian and Reptile Groups UK (ARG UK). Environmental NGOs and other landowners were contacted to enlist their help in promoting the survey and eliciting responses. The questionnaire was also promoted in person at the Royal Highland Show 2023 and the Women in Agriculture conference 2024, and in digital and printed media via the Scottish Farmer magazine in January 2024, through both a double page A4 spread and online on their website.
Field survey
Site selection
Sites surveyed during the 1992‒93 survey period were identified from maps (see Map 23, Reading et al., 1994), and information provided by Dr Chris Reading who carried out the previous study. Where possible, the same survey locations were targeted for the 2022‒24 survey period. This was facilitated through discussion with land managers, and by consulting the 1992‒93 field survey results. However, in some instances it was necessary to identify new sites, which were kept as close to the original site locations as possible. Where survey locations between the two survey periods were largely consistent in terms of land ownership and land cover, we treated these as ‘paired’ sites to enable comparison over time. However, any comparisons made throughout this report are done so with caution. One additional site (13b) was also included in the 2022‒24 survey. These sites are summarised in Table 1 and displayed in Figure 1.

Figure 1. Map showing the sites surveyed in 1992‒93 (Reading et al., 1994) and 2022‒24 (this study). Site locations are presented as 10km squares. Contains OS data © Crown Copyright and database right 2023. Contains data from OS Zoomstack.
Click for a full description
Map showing the survey sites visited in 1992‒93 (black circles, Reading et al., 1994) and 2022‒24 (orange squares, this study). Annotations match site IDs given in Table 1. Site locations are presented as 10km squares. Locations from the 1992‒93 survey period are recreated from Map 23 in Reading et al. (1994).
Site ID | Location | Region | 10km square | No. visits 1992‒93 | No. visits 2022‒24 |
|---|---|---|---|---|---|
1 | Borgie Forest | Sutherland (Highland) | NC65 | - | 3 |
2 | Loch Rimsdale, Strathnaver | Sutherland (Highland) | NC73 | 12 | 3 |
3 | Braemore by Dunbeath, Caithness | Caithness (Highland) | ND03 | 4 | - |
4 | Loch Lannsaidh | Sutherland (Highland) | NH79 | 2 | - |
5 | Old Suardel, north Skye | Ross & Cromarty (Highland) | NG25 | 10 | 8 |
6 | Rogie Forest / Falls of Rogie by Garve | Ross & Cromarty (Highland) | NH45 | 4 | 4 |
7 | Gleann Meadhonach, south Skye | Ross & Cromarty (Highland) | NG60 | 4 | 9 |
8 | Keiloch near Braemar / Aberarder Invercauld Estate | Aberdeenshire | NO19 | 3 | 9 |
9 | Dinnet NNR / Muir of Dinnet | Aberdeenshire | NJ40 | 5 | 10 |
10 | Falls of Bruar, near Blair Atholl | Perth & Kinross | NN86 | 8 | 6 |
11a | Flanders Moss | Stirling & Falkirk (Stirling) | NS59 | 5 | - |
11b | Flanders Moss | Stirling & Falkirk (Stirling) | NS69 | - | 14 |
12 | Glen Catacol, Isle of Arran | Ayrshire & Arran (North Ayrshire) | NR94 | 3 | 4 |
13a | Lammermuir Hills - Hope / near Gifford | East Lothian | NT56 | 7 | 3 |
13b | Lammermuirs - Killpallet Burn | East Lothian | NT66 | - | 7 |
14a | Stellach Burn near Straiton | Ayreshire & Arran (South Ayrshire) | NX39 | 7 | - |
14b | Stellach Burn Loch Braden | Ayreshire & Arran (East Ayrshire) | NX49 | - | 4 |
15 | Moffat / Earshaigs | Dumfries (Dumfries & Galloway) | NT00 | 4 | 8 |
16a | Wolfehopelee near Bonchester Bridge | Roxburgh, Ettrick & Lauderdale (Scottish Borders) | NT61 | 12 | - |
16b | Wolfehopelee | Roxburgh, Ettrick & Lauderdale (Scottish Borders) | NT60 | - | 10 |
17a | Clatteringshaws | Wigtown (Dumfries & Galloway) | NX46 | 7 | - |
17b | Clatteringshaws Loch | The Stewartry of Kirkcudbright (Dumfries & Galloway) | NX57 | - | 4 |
Surveyor recruitment and training
A total of 102 potential volunteer surveyors were recruited through an online workshop and appeals through partner networks and social media.
Survey protocols
Copies of the Scottish National Adder Survey protocol were provided to each surveyor, including instructions on survey protocols and data submission. The survey protocol comprised eight survey visits during the active period for reptiles (February‒October) across the 2022‒24 survey period. To reduce disturbance, surveyors were asked to allow at least two weeks between successive visits. During each visit, surveyors were directed to record any reptiles and amphibians encountered across all life stages and sources of evidence (e.g. sloughs). To maximise detectability of reptiles, preference was given to survey visits with temperatures between 10‒20°C, as well as targeting overcast days, and periods following heavy rain.
Each survey visit consisted of a visual search for reptiles whilst walking at a slow pace along a transect route, particularly focusing on suitable habitat features such as south-facing banks and linear features such as woodland rides. Start and end times for each survey visit were recorded, with the aim of each survey visit taking approximately three hours to complete.
Occupancy and detection
Naïve occupancy (observed species presence or absence) for each survey site was evaluated from the survey data for both the 1992‒94 and 2022‒24 time periods. In addition, we calculated occupancy and detection estimates for the 2022‒24 time period using single-season models in the unmarked package (Fiske and Chandler, 2011; Kellner et al., 2023) in R v.4.3.2 (R Core Team, 2023). For these analyses, estimates were calculated for each year a site was surveyed, rather than for the period (2022‒24) as whole. This approach assumed that occupancy remained the same within a survey season (i.e. a ‘closed’ population February‒October). Detection covariates evaluated were (i) the day of the year a survey was undertaken, where January 1st was day one, and (ii) the surveyor who undertook the survey, noting that detection of species can vary between observers. The year a survey was undertaken was also included as a site covariate to test for its influence on occupancy.
A stepwise approach was used to identify the best model for detection, followed by the best occupancy model whilst incorporating the best detection model. Model assessment was carried out using akaike’s information criterion (AIC). Model fit was assessed across 1000 bootstrap simulations (MacKenzie and Bailey, 2004). Likelihood-ratio tests were also used to compare the best models against the null model, where a value < 0.05 was considered to indicate a significantly better performing model compared to the null model.
Using the detection estimates from null models, we calculated the number of survey visits (K) required to have confidence of absence for each of the three reptile species commonly found in Scotland. These calculations were done at three probability levels; 80, 90 and 95%, using the following equation:

Equation 1. Equation for calculating the number of survey visits (K) required to have confidence of absence of a species
Click for a full description
The number of survey visits (K) to a site to have confidence of absence of a species can be calculated by considering the probability of detection (p) of a species, and the chosen confidence level (p*) of detecting the species on one or more of the K survey visits (McArdle, 1990).
where p is the probability of detection, and p* is the confidence of detecting the species on one or more of the K survey visits (McArdle, 1990).
Population size
During each survey, the number of individuals observed of each reptile species were recorded. From these values we calculated raw peak counts across each survey period in addition to mean normalised peak counts for the 2022‒24 survey period, following the approach of Gardner et al. (2019).
Distribution
Occurrence records for the adder in Scotland were collated from the results of the questionnaire and field survey elements of this report, and from additional data sources (Table 2) to achieve good coverage and reduce geographic biases. Those from external sources were filtered to verified records with a spatial accuracy of 10km or finer, and from 1994 onwards. These records were mapped against the OS GB 10km grid, in line with the previous report by Reading et al. (1994) for consistency. From this, we assessed changes in distribution by comparing against the reported distribution published in Reading et al. (1994), including survey questionnaire responses and the mapped occurrence data of Collier (1990), McGuire (1979), and the Biological Records Centre (Jan. 1993). Therefore, we evaluated the distribution of the adder across two time periods: up to and including 1993, and 1994‒2024.
| Data source | Date accessed |
|---|---|
| Amphibian and Reptile Conservation Species database | 20/09/2024 |
| iRecord | 20/09/2024 |
| Record Pool | 20/09/2024 |
| NBN Atlas* | 20/09/2024 |
* Note that the NBN Atlas dataset is comprised of data from multiple sources. The full citation can be found in Annex 3.
Results
Questionnaire survey
Survey coverage
Out of the 1,135 10x10km squares that cover Scotland and its islands, Adder Survey questionnaire returns were received for 140 squares - equivalent to a coverage of 12.3%. When combined with the distribution of Farm and ITE Survey questionnaire returns from Reading et al. (1994), the coverage totals 837 squares across the two studies (73.7%). The geographical distribution of the questionnaire returns and the number of returns from each 10x10km square are shown in Figure 2. A summary of the number of survey questionnaire responses is given in Table 3.
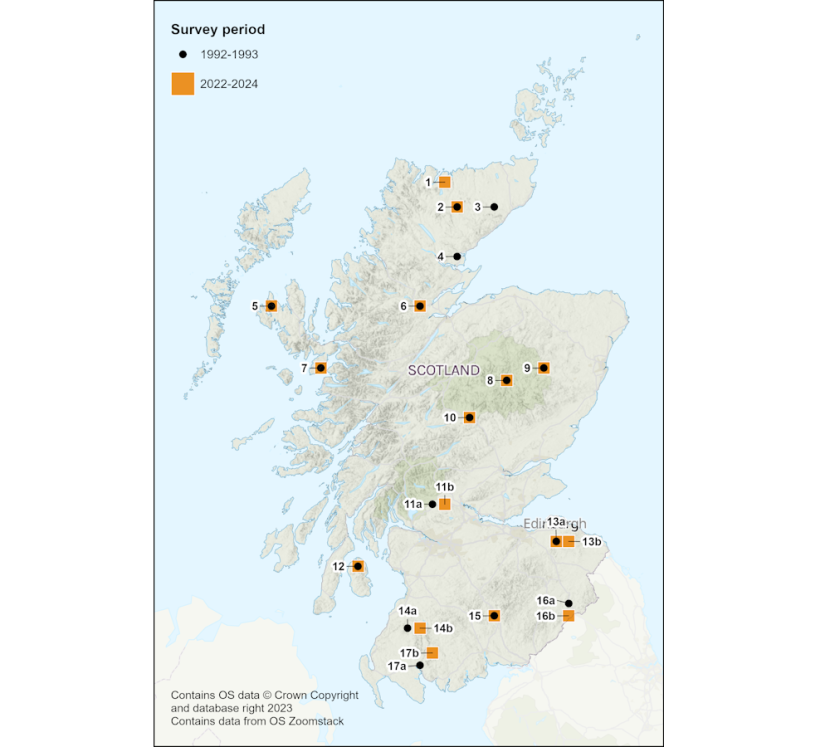
Figure 2. Geographical distribution of Adder Survey questionnaire returns, showing the number of returns from each 10km square. Contains OS data © Crown Copyright and database right 2023. Contains data from OS Zoomstack.
Click for a full description
Geographical distribution of Adder Survey questionnaire returns, showing the number of returns from each 10km square. Total number of squares with at least one return = 140. Darker colours indicate a higher number of returns.
Survey | Year(s) | No. of addresses targeted | No. returned completed | No. returned incomplete | Return rate |
|---|---|---|---|---|---|
ITE Survey | 1992 | 1439 | 723 | 137 | 50% |
Farm Survey | 1992 | 1002 | 674 | 19 | 67% |
Farm Survey | 1993 | 950 | 633 | 14 | 67% |
Adder Survey | 2022‒24 | - | 197 | 0 | - |
Though the Adder Survey questionnaire responses were well distributed across Scotland (Figure 2), there was a far lower number of completed questionnaire surveys compared to the Farm and ITE questionnaires, and differences in how they were targeted. Therefore, the Adder Survey questionnaire results are not directly comparable with those from the Farm and ITE Surveys (Table 3).
Adder habitat
The proportion of adder sightings within each habitat class is shown in Figure 3 for the Farm, ITE and Adder Survey questionnaires. The ITE Survey included an additional native woodland habitat class. The nine habitat classes listed in the Adder Survey questionnaire (Annex 1) were selected as being habitats in which adders had been seen in the majority (93.8%) of the responses. Rough grazing was the most reported habitat (16.5%), closely followed by dry moorland (16.0%). The remaining 6.2% were reported as ‘Other’ and included gardens and rocky heather areas. These results may not be a true representation of the best habitat types for adders in Scotland, but instead a reflection of a large proportion of responses being from those with a farming interest (Figure 6), and the habitats within which they live and work. All survey questionnaires across both studies collected responses for the same nine habitats (Figure 3) and 92.7% of the adder sightings were in the nine habitat categories common to all surveys.
The proportions of each habitat class were largely similar across each of the questionnaire surveys. However, the Adder Survey showed a higher proportion of adder sightings in scrub (12%) and broadleaf woodland (8.5%) and lower proportion for dry moorland (16%). These figures may reflect the interest of respondents in conservation programmes and the resulting changes in habitat management for conservation projects and rewilding (Figure 8).
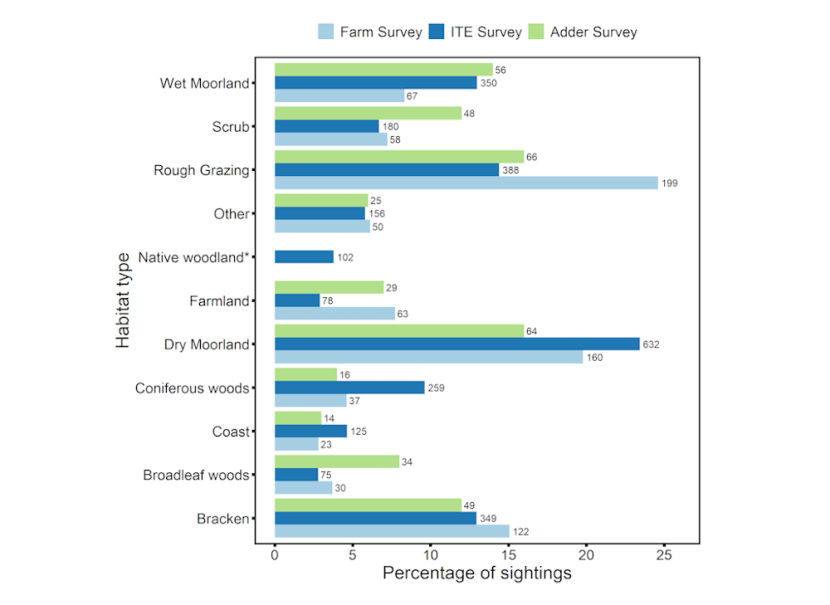
Figure 3. Comparison between surveys of the percentage of responses indicating habitat types in which adders were seen. *The ITE Survey included an additional native woodland habitat type.
Click for a full description
The percentage of questionnaire responses indicating habitat types in which adders were seen for the Farm Survey (light blue), ITE Survey (dark blue) and the Adder Survey (green). *The ITE Survey included an additional native woodland habitat type which is not represented within the Farm or Adder Surveys. The number of responses is given next to each bar.
Reptile sightings
The proportion of responses from the Farm, ITE (Reading et al. 1994), and Adder Survey questionnaires where each reptile species was reported as occurring on the respondent’s land are presented in Figure 4. Where available, these are displayed by time period. Responses indicating grass snake occurrences are also shown for the Adder Survey questionnaire.
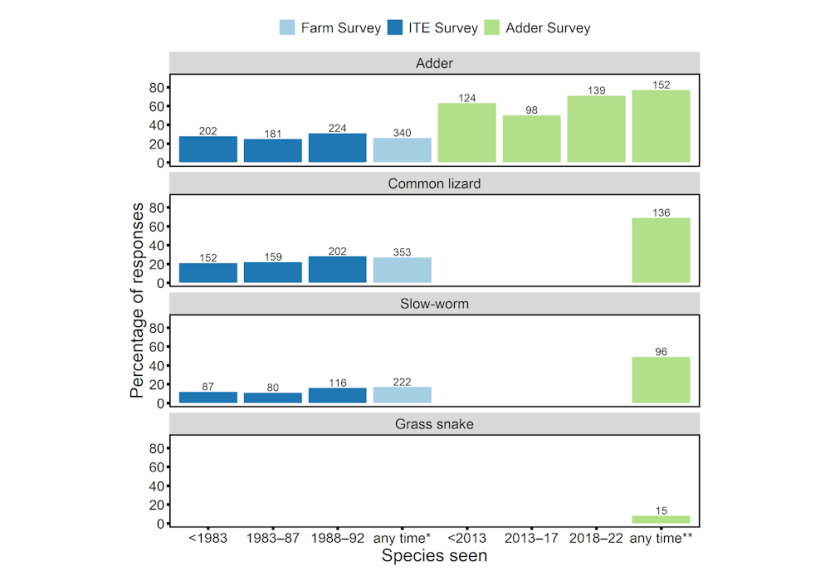
Figure 4. The percentage of responses in which adders, slow-worms, common lizards and grass snakes had been seen as a percentage of total number of replies. Results are displayed over different time periods.
Click for a full description
The percentage of questionnaire responses in which adders, slow-worms, common lizards and grass snakes (Adder Survey questionnaire only) had been seen. Results are displayed for the Farm Survey (light blue), ITE Survey (dark blue) and the Adder Survey (green) over different time periods, and includes reports from any time in the Farm Survey* and Adder Survey**. The number of responses is given above each bar.
A larger percentage of responses reported occurrence of all four reptile species in the Adder Survey questionnaire compared to both the Farm and ITE Survey questionnaires. Adders were also reported at a higher rate across all time periods in the Adder Survey questionnaire compared to all time periods in the previous study. Given the low response rate to the Adder Survey questionnaire (197 respondents, Table 3) this may reflect a bias towards respondents with an interest in reptiles or who had seen reptiles on their land – only four of 197 respondents did not know of any of the four reptiles having occurred on their land.
Change in adder status
The perceived prevalence of adders seen recently compared with the previous 10 years for each of the survey questionnaires is shown in Figure 5. Within the Adder Survey questionnaire, 38.6% of responses indicated uncertainty of any changes. This value is close to the average (29.5%) of responses saying they did not know whether adders were more or less common in the past 10 years in the Farm and ITE Survey questionnaires (Reading et al., 1994). Respondents to the Adder Survey questionnaire reported perceptions of adders being more common than in the previous 10 years in 11.2% of responses, equally common 31.0% of the time, and less common 14.7% of responses. This same pattern was observed in both the Farm and ITE Survey questionnaires. Therefore, perceived changes in adder populations are rather uncertain, with the majority of respondents across all survey questionnaires indicating no perceived change, and a higher proportion of responses indicating adders to be less common than more common.
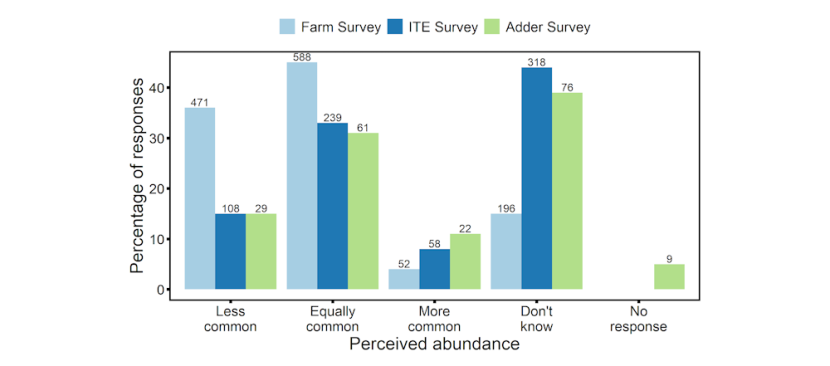
Figure 5. Perceived adder abundance compared with that of 10 years previously, shown as a percentage of the total number of replies received from respondents in each survey questionnaire.
Click for a full description
The percentage of questionnaire responses indicating differences in perceived abundance over the preceding 10 years. Results are shown for the Farm Survey (light blue), ITE Survey (dark blue) and the Adder Survey (green). The number of responses is given next to each bar.
Interests of respondents
In both the ITE and Adder Survey questionnaires many respondents indicated an interest in more than one specific interest category, and so the sum of the percentage for each interest category exceeds 100%. The largest category of respondents’ interest in the Adder Survey was farming (39%) compared to leisure activities (36%) in the ITE Survey (Figure 6). With the much higher interest in farming compared to the ITE Survey results, there was reduced interest in all other categories.
In both the ITE and Adder Survey questionnaires interests mentioned in the ‘Other’ category included nature-related interests. In the Adder Survey, of the 51 respondents who selected ‘Other’, 23 of those who gave further details mentioned nature conservation interests such as rewilding, nature conservation, ecology, and wildlife surveys.
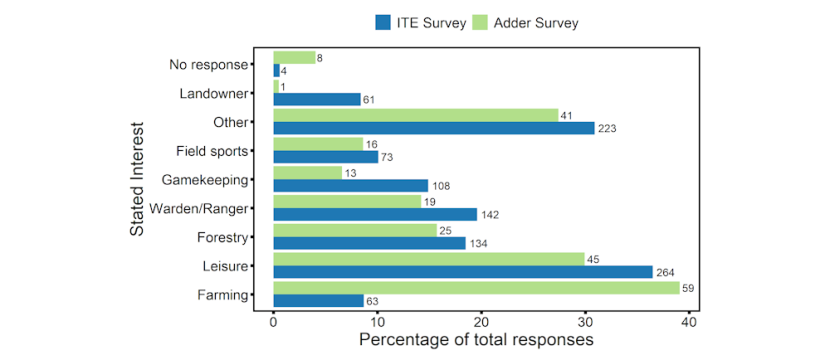
Figure 6. Respondent’s stated interest in the area for which they made a return for the ITE and Adder Survey questionnaires. The number of responses is given next to each bar.
Click for a full description
Respondent’s stated interest in the area for which they made a return for the ITE (dark blue, 723 responses) and Adder (green, 197 responses) Survey questionnaires. The sum of the percentages exceeds 100% as many of the respondents indicated interests in more than one category. The number of responses is given next to each bar.
When the ITE Survey responses were recategorised by interest (see Table 7 in Reading et al., 1994), the consensus was that with the exception of field sports, more respondents felt that adders had become ‘Less common’ than ‘More common’ (Figure 7). In all interest categories, more respondents felt that adders were ‘Equally common’ than had declined or increased.
Similar categorisation of the Adder Survey results (Figure 7) shows that in all categories except for Wardens/Rangers, there was also consensus that respondents were more likely to consider adders to be ‘Less common’ than ‘More common’. For all categories other than Forestry, the majority of respondents felt that adders were equally common than either more or less common.
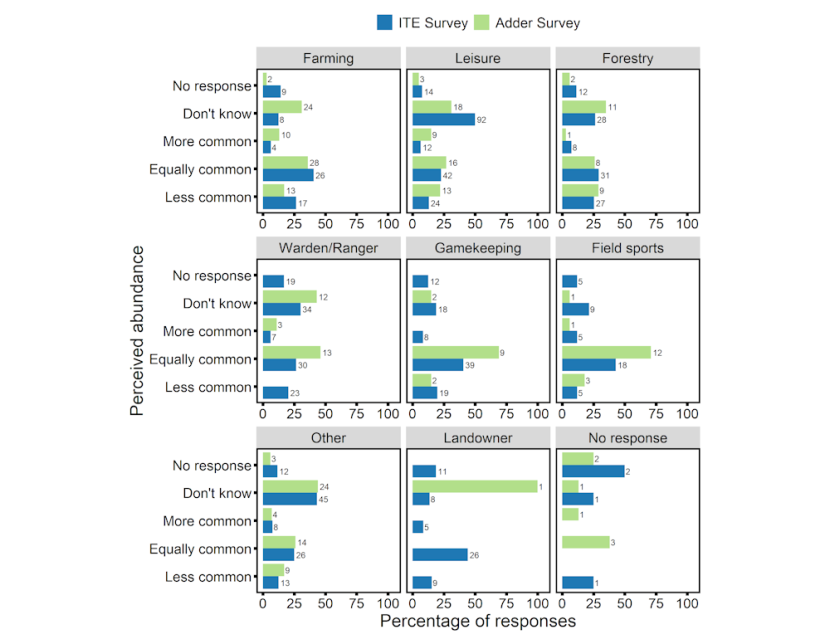
Figure 7. Percentage of ITE and Adder Survey questionnaire responses to the question whether adders have become more or less common in the last 10 years when categorised by respondents’ interests. The number of responses is given next to each bar.
Click for a full description
Percentage of questionnaire responses to the question of how adder abundance has changed over the preceding 10 years. Results are split by respondent’s interests, and are shown for the ITE Survey (dark blue) and Adder Survey (green). The number of responses is given next to each bar.
Land use changes
When asked if major land use changes had occurred on the land in the past 10 years, 96% of the 197 Adder Survey questionnaire respondents answered the question. Of these responses, 21% (40 responses) indicated a change in land use. In comparison, only 12% of the Farm Survey respondents completed this question and of these, 25% indicated major changes in land use (Reading et al.,1994). Of the 723 responses to the ITE Survey, 56% of respondents completed the question and of those, a much higher proportion (61%) indicated any major land use changes.
Within the Adder Survey questionnaire, if major land use changes had occurred, respondents were able to provide a free-text description of the changes. As there is no access to the details of text responses in either the Farm or ITE Surveys, the data from the figures in Reading et al. (1994) were used to reproduce the summaries of the Farm and ITE Surveys for comparison with the Adder Survey questionnaire responses in Figure 8. In doing so we assumed that one land use change per respondent was assessed for the Farm and ITE Surveys, compared to one or more land use change per respondent in the Adder Survey questionnaire.
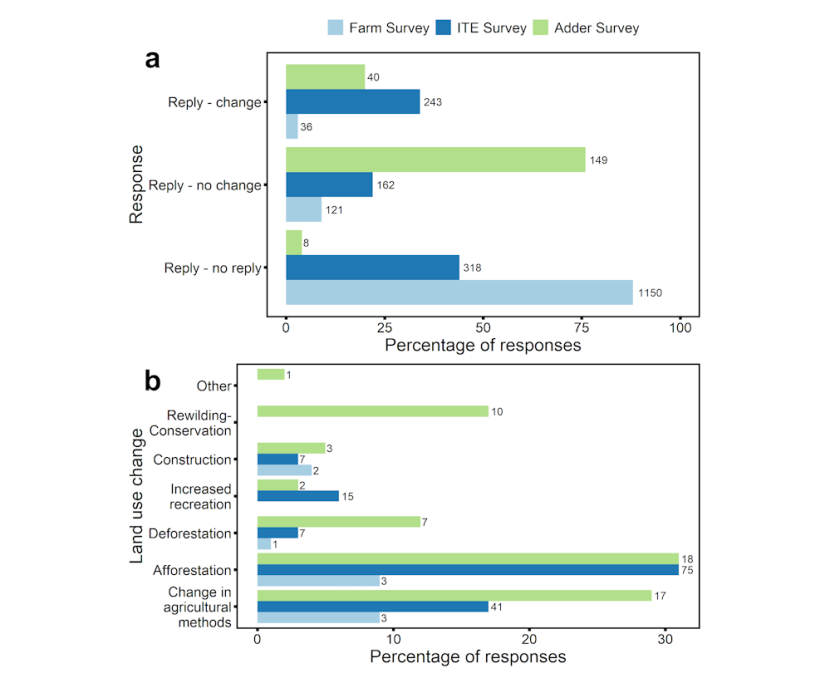
Figure 8. Comparison of the percentages of (a) response types and (b) for responses indicating changes had occurred, the types of land use change over the previous 10 years in each survey questionnaire.
Click for a full description
The percentage of questionnaire responses that (a) completed a question on land use changes in the past 10 years, whether those that responsed indicated a chance in land use or no change, and for those that did indicate change, (b) the percentage of responses for different categories of land use change. Results are shown for the Farm Survey (light blue), ITE Survey (dark blue) and the Adder Survey (green). The number of responses is given next to each bar.
For the 40 Adder Survey questionnaire responses that indicated major land use changes, free-text responses were intially categorised into the six categories used in the Farm and ITE Surveys, but there were noticeable references to conservation actions such as habitat restoration (e.g. peatlands and wetlands) and rewilding. These were therefore categorised under an additional ‘Conservation projects’ category. The method of categorising land use from free-text responses is shown in Annex 2. Of the 40 responses, 18 indicated two or more land use change categories - often where changes in agricultural practices or afforestation supported conservation projects. Forestry (afforestation and deforestation) was reported in 43% of responses, agricultural methods in 29%, and 17% of responses were categorised as rewilding / regeneration projects. The remaining responses were mainly attributed to construction of wind farms and leisure activities.
Of the 25% Farm Survey questionnaire responses that reported a change, forestry (deforestation and afforestation) and changes in agriculture (e.g. increased cereal production, ‘setaside’) accounted for 19% of those responses. The remaining 4% were categorised as construction (land draining, mining and general construction). In comparison, of the 61% who reported changes in land use in the ITE Survey questionnaire, 31% cited afforestation whereas deforestation was 3%. Changes in agricultural methods (changing grazing pressure, reduction in crofting and peat cutting) accounted for 17% of responses with the remaining responses attributed to increasing recreational pressure and construction work.
Environmental schemes
The Adder Survey questionnaire included an additional question that was not present in the Farm and ITE Surveys about whether the land had been part of an environmental scheme over the previous 10 years and if so, for details of the scheme and habitats covered. Forty-four of the respondents (22%) indicated that the land had been in environmental schemes and of these, 41 provided a degree of additional information. Schemes mentioned included Agri -Environment Climate Scheme, Forestry Grant Scheme, Peatland ACTION, Rural Stewardship Scheme, Woodland Grant Scheme and Scottish Rural Development Programme. Details of habitats covered included grasslands, woodland, heaths, wetlands and lowland bog. Animal species mentioned were birds in general, waders (eight references), choughs (six references), corncrakes and bees. Plant assemblages of species and herb rich grasslands were referenced five times.
Distribution of reptile sightings in Scotland
Maps showing 10km squares where the Adder Survey questionnaire reported presence of adder, common lizard, grass snake, and slow-worm are shown in Figures 9‒12. These maps also display ‘absence’ following the approach of Reading et al. (1994), whereby if questionnaire responses were received from within a 10km square but none reported presence of the species, it is displayed as an absence. The number of 10km squares in which each species was reported within the questionnaire surveys is given in Table 4.
| Survey(s) | - | Presence | Absence |
|---|---|---|---|
| Farm and ITE Surveys | Adders, data pooled across time periods (Reading, 1994) | 561 | 122 |
| - | Adders, before 1983 | 474 | 143 |
| - | Adders, 1983‒87 | 434 | 165 |
| - | Adders, 1988‒92 | 482 | 153 |
| ITE Survey | Common lizards, data pooled across time periods | 611 | 43 |
| - | Slow-worms, data pooled across time periods | 410 | 129 |
| Adder Survey | Adders, data pooled across time periods (this report) | 107 | 32 |
| - | Adders, before 2013 | 73 | 47 |
| - | Adders, 2013‒17 | 77 | 46 |
| - | Adders, 2018‒22 | 97 | 37 |
| - | Common lizards, data pooled across time periods | 108 | 31 |
| - | Slow-worms, data pooled across time periods | 73 | 66 |
| - | Grass snakes, data pooled across time periods | 14 | 124 |
Adders and common lizards were recorded in the majority of squares for which responses were received from the Adder Survey questionnaire (Figures 9 and 10), mirroring the widespread distribution for species found by Reading et al. (1994) and published elsewhere (e.g. McInerny and Minting, 2016), though with limited data from the island groups due to limitations in the survey questionnaire design and distribution. In contrast, similar to Reading et al. (1994), the reported occurrence of slow-worms was far lower (Figure 11). This may be a reflection of the lower detectability of the slow-worm through visual encounters (Sewell et al., 2012; 2013), but may still be a true indication of a sparsely distributed range in Scotland (McInerny and Minting, 2016). Finally, 15 responses across 14 10km squares indicated grass snakes to have occurred on their land (Figure 12), but we note concerns over the risk of misidentification (see the Discussion). Further assessment of adder distribution is given in the Distribution section and presented in Figure 19.

Figure 9. Presence/absence of adders in Scotland as indicated by respondents to the Adder Survey questionnaire. Contains OS data © Crown Copyright and database right 2023. Contains data from OS Zoomstack.
Click for a full description
Presence/absence of adders in Scotland. Presence indicates at least one respondent to the Adder Survey questionnaire had reported adders occurring on their land. Absence indicates that at least one respondent had reported that adders did not occur on their land, or they didn’t know if adders occurred on their land. Contains OS data © Crown Copyright and database right 2023. Contains data from OS Zoomstack.

Figure 10. Presence/absence of common lizards in Scotland as indicated by respondents to the Adder Survey questionnaire. Contains OS data © Crown Copyright and database right 2023. Contains data from OS Zoomstack.
Click for a full description
Presence/absence of common lizards in Scotland. Presence indicates at least one respondent to the Adder Survey questionnaire had reported common lizards occurring on their land. Absence indicates that at least one respondent had reported that common lizards did not occur on their land, or they didn’t know if common lizards occurred on their land. Contains OS data © Crown Copyright and database right 2023. Contains data from OS Zoomstack.
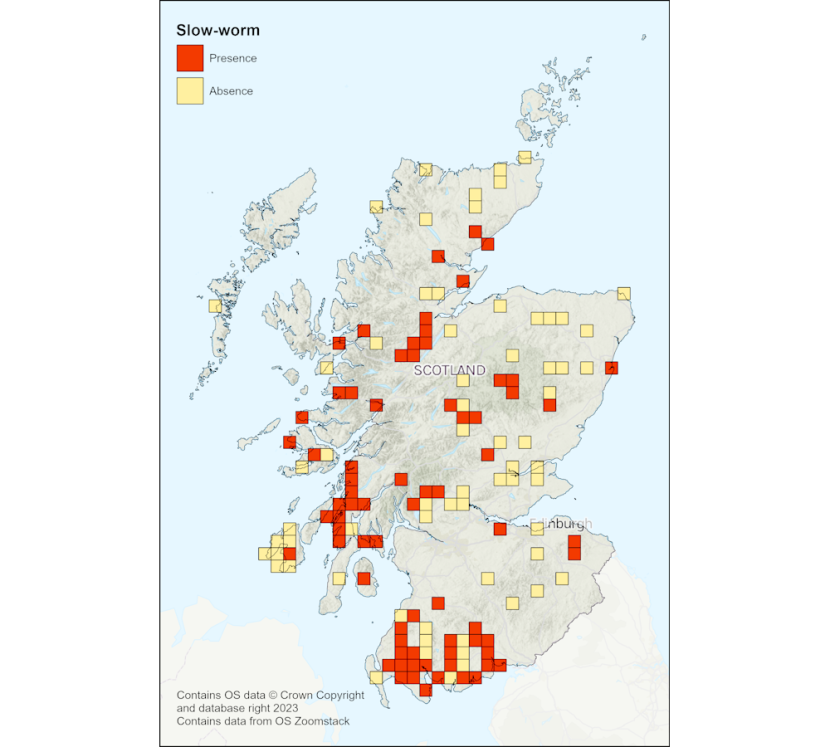
Figure 11. Presence/absence of slow-worms in Scotland as indicated by respondents to the Adder Survey questionnaire. Contains OS data © Crown Copyright and database right 2023. Contains data from OS Zoomstack.
Click for a full description
Presence/absence of slow-worms in Scotland. Presence indicates at least one respondent to the Adder Survey questionnaire had reported slow-worms occurring on their land. Absence indicates that at least one respondent had reported that slow-worms did not occur on their land, or they didn’t know if slow-worms occurred on their land. Contains OS data © Crown Copyright and database right 2023. Contains data from OS Zoomstack.
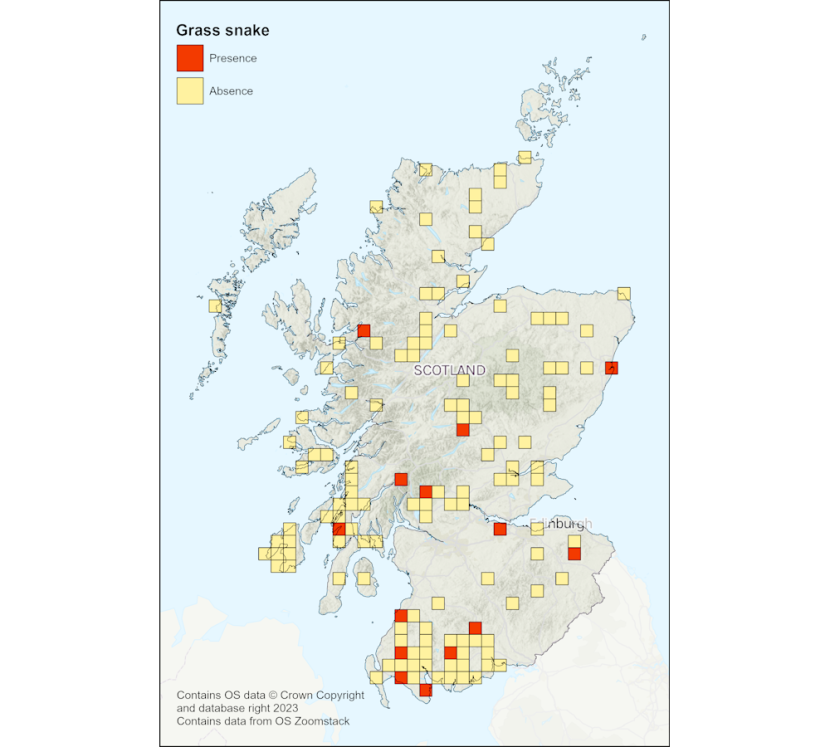
Figure 12. Presence/absence of grass snakes in Scotland as indicated by respondents to the Adder Survey questionnaire. Contains OS data © Crown Copyright and database right 2023. Contains data from OS Zoomstack.
Click for a full description
Presence/absence of grass snakes in Scotland. Presence indicates at least one respondent to the Adder Survey questionnaire had reported grass snakes occurring on their land. Absence indicates that at least one respondent had reported that grass snakes did not occur on their land, or they didn’t know if grass snakes occurred on their land. Contains OS data © Crown Copyright and database right 2023. Contains data from OS Zoomstack.
Changes in adder distribution
We mapped the responses to questions from the Adder Survey related to changes in adder distribution over three separate time periods (before 2013; 2013‒2017 and 2018‒2022). These summaries of adder presence/absence indicated by the responses are shown in Figures 13‒15. No substantial changes in distribution are observable from the responses given over these time periods, though the limited coverage of responses limits any interpretation. The distribution of adders in Scotland combining multiple data sources is also presented in Figure 19 (see the Distribution section).

Figure 13. Presence/absence of adders in Scotland prior to 2013 as indicated by respondents to the Adder Survey questionnaire. Contains OS data © Crown Copyright and database right 2023. Contains data from OS Zoomstack.
Click for a full description
Figure 13 Presence/absence of adders in Scotland prior to 2013. Presence indicates at least one respondent to the Adder Survey had reported that adders were seen ‘every year’ or ‘less often’ in a 10km square at some time prior to 2013. Absence indicates that at least one respondent was familiar with the area prior to 2013, but reported that they had ‘never’ seen adders in it. Contains OS data © Crown Copyright and database right 2023. Contains data from OS Zoomstack.
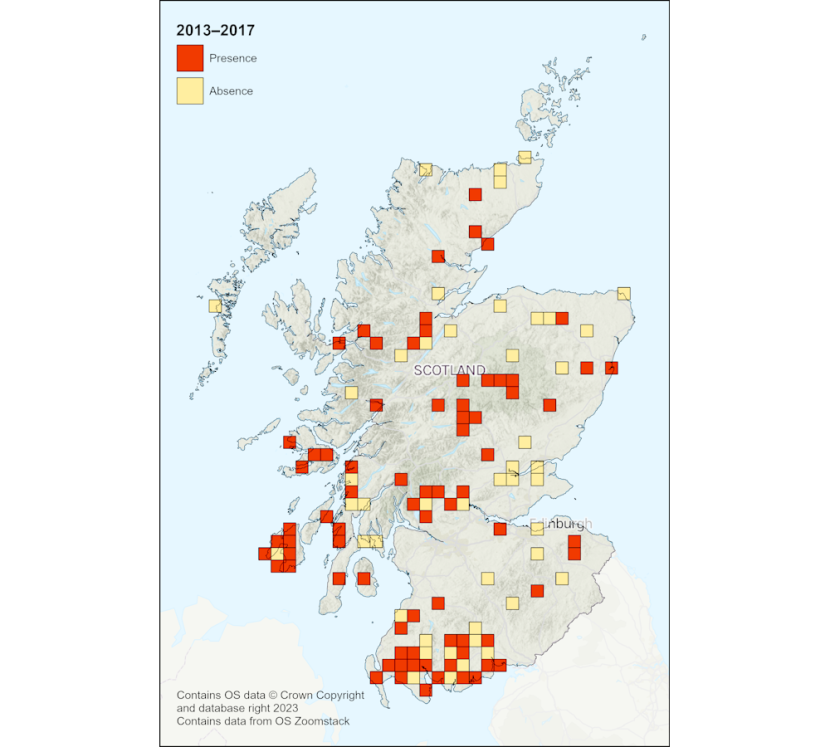
Figure 14. Presence/absence of adders in Scotland during the period 2013‒2017 as indicated by respondents to the Adder Survey questionnaire. Contains OS data © Crown Copyright and database right 2023. Contains data from OS Zoomstack.
Click for a full description
Figure 14 Presence/absence of adders in Scotland during the period 2013‒2017. Presence indicates at least one respondent to the Adder Survey had reported that adders were seen ‘every year’ or ‘less often’ in a 10km square at some time during the period 2013‒2017. Absence indicates that at least one respondent was familiar with the area during the period 2013‒2017, but reported that they had ‘never’ seen adders in it. Contains OS data © Crown Copyright and database right 2023. Contains data from OS Zoomstack.

Figure 15. Presence/absence of adders in Scotland during the period 2018‒22 as indicated by respondents to the Adder Survey questionnaire. Contains OS data © Crown Copyright and database right 2023. Contains data from OS Zoomstack.
Click for a full description
Figure 15 Presence/absence of adders in Scotland during the period 2018‒22. Presence indicates at least one respondent to the Adder Survey had reported that adders were seen ‘every year’ or ‘less often’ in a 10km square at some time during the period 2018‒22. Absence indicates that at least one respondent was familiar with the area during the period 2018‒22, but reported that they had ‘never’ seen adders in it. Contains OS data © Crown Copyright and database right 2023. Contains data from OS Zoomstack.
Field survey
A summary of the number of survey visits and the numbers of each reptile species observed are given in Table 5. A total of 10 paired sites were surveyed (i.e. sites that were surveyed in this study and by Reading et al. (1994), though exact survey locations may have differed between studies). The number of visits to sites was variable in both studies, but with a similar average number of visits (2022‒24 range: 3‒14, mean: 6.6, SD: 3.16; 1992‒93 range: 2‒12, mean: 6.0, SD: 3.0). Sites were not necessarily surveyed in every year during this and the previous study (Table 9). There were a similar number of survey visits in total between the two studies. Despite these similarities, this study resulted in more records of all three reptile species. For adders, this is predominantly due to the high number of observations at site 9 (Muir of Dinnet), at which there was also double the number of survey visits than in the study by Reading et al. (1994). The large difference between the overall number of common lizards observed is most likely down to a recording issue rather than actual observations. We suspect recorders in the Reading et al. (1994) study may not have recorded all observations of reptiles other than adders on a regular basis even when observed on survey visits. The differences in numbers between the two studies for any species other than adder should therefore be interpreted with caution.
Site ID | No. visit | Total no. | Total no. | Total no. | No. visit | Total no. | Total no. | Total no. | A | CL | SW |
|---|---|---|---|---|---|---|---|---|---|---|---|
1 | - | - | - | - | 3 | 0 | 4 | 0 | - | - | - |
2 | 12 | 0 | 3 | 0 | 3 | 0 | 2 | 0 | <> | <> | <> |
3 | 4 | 0 | 0 | 0 | - | - | - | - | - | - | - |
4 | 2 | 0 | 0 | 0 | - | - | - | - | - | - | - |
5 | 10 | 3 | 0 | 0 | 8 | 0 | 0 | 0 | < | <> | <> |
6 | 4 | 0 | 3 | 2 | 4 | 0 | 12 | 13 | < | < | < |
7 | 4 | 1 | 0 | 0 | 9 | 9 | 1 | 0 | < | > | > |
8 | 3 | 1 | 0 | 0 | 9 | 0 | 34 | 2 | < | > | > |
9 | 5 | 3 | 4 | 0 | 10 | 57 | 29 | 0 | <> | <> | <> |
10 | 8 | 1 | 0 | 0 | 6 | 2 | 8 | 0 | <> | > | <> |
11a | 5 | 3 | 0 | 0 | - | - | - | - | - | - | - |
11b | - | - | - | - | 14 | 5 | 7 | 0 | - | - | - |
12 | 3 | 0 | 2 | 1 | 4 | 1 | 1 | 1 | > | <> | <> |
13a | 7 | 0 | 0 | 0 | 3 | 3 | 0 | 0 | > | <> | <> |
13b | - | - | - | - | 7 | 11 | 0 | 1 | - | - | - |
14a | 7 | 1 | 0 | 0 | - | - | - | - | - | - | - |
14b | - | - | - | - | 4 | 0 | 2 | 0 | - | - | - |
15 | 4 | 8 | 0 | 0 | 8 | 6 | 2 | 0 | <> | > | > |
16a | 12 | 48 | 0 | 0 | - | - | - | - | - | - | - |
16b | - | - | - | - | 10 | 3 | 1 | 0 | - | - | - |
17a | 7 | 0 | 2 | 1 | - | - | - | - | - | - | - |
17b | - | - | - | - | 4 | 0 | 11 | 0 | - | - | - |
Total | 97 | 69 | 14 | 4 | 106 | 97 | 114 | 17 | - | - | - |
Occupancy and detection
In the Reading et al. (1994) study, reptiles were observed at all but three of the 16 survey sites, compared to all but one of the 16 sites in this study (Table 5). Of the sites where reptiles were detected, adders were seen at nine sites in both studies, common lizards at five and 13 sites for the Reading et al. (1994) and this study respectively, and slow-worms at three and four of the sites respectively. Where sites were surveyed across both studies (i.e. paired sites), naïve occupancy of adders remained stable at three sites, changed from present to absent at four sites, and from absent to present at two sites.
Of the nine sites where adders were recorded in the Reading et al. (1994) study, they were seen on 23 out of 52 site visits (44%), compared to 36 out of 71 site visits (50.7%) in this study. In comparison, common lizards were observed in 10 out of 30 visits (33%) and 32 out of 88 visits (36.4%) at the sites they were recorded for the two survey periods respectively, and slow-worms four out of 14 visits (29%) and seven out of 24 visits (29.2%) at the sites they were recorded respectively.
The final detection and occupancy models and their resulting estimates are displayed in Tables 6 and 7 respectively. The top scoring models for both adder and common lizard indicated the day of the year to influence species detection, whereas the null model (a model incorporating no covariates for detection or occupancy) was identified as the top model for slow-worm. None of the final models included any other detection covariates nor any occupancy covariates. Likelihood-ratio tests indicated that the top adder model did not perform significantly better than the null model (χ2 = 2.80, p = 0.094). In contrast, the top common lizard model was shown to perform significantly better than the null model (χ2 = 9.71, p = 0.008). Goodness of fit tests (MacKenzie and Bailey, 2004) did not show any substantial issues of model fit for the top models in all three species (adder: χ2 = 1394.56, p = 0.532, ĉ = 0.76; common lizard: χ2 = 2697.06, p = 0.116, ĉ = 1.68; slow-worm: χ2 = 348.21, p = 0.469, ĉ = 0.42).
| Species | Model |
|---|---|
| Adder | ρ(Day)ψ(.) |
| Common lizard | ρ(Day2)ψ(.) |
| Slow-worm | ρ(.)ψ(.) |
| - | Adder | Common lizard | Slow-worm | All reptiles |
|---|---|---|---|---|
| Naïve occupancy | - | - | - | - |
| 1992‒93 (Reading et al., 1994) | 0.529 | 0.294 | 0.176 | 0.765 |
| 2022‒24 (this study) | 0.563 | 0.813 | 0.250 | 0.938 |
| Occupancy (ψ) | - | - | - | - |
| 2022‒24 (this study) | 0.653 | 0.740 | 0.344 | - |
| Detection (ρ) | - | - |
| - |
| 2022‒24 (this study) | 0.497* | 0.584* | 0.190† | - |
Naïve estimates are based on 17 sites across 1992‒93, and 16 in 2022‒24.
* Where covariate value (day of year) is held at mean.
†The top detection model for slow-worm is also the null model.
Our calculated occupancy estimates (Table 7) indicate that the true proportion of sites occupied is likely to be higher than that observed. The detection estimates show much lower detection for slow-worm than for adder and common lizard. These observed and calculated differences in species detection (and similarly in abundance / density) are likely to have been influenced by the ecology of the species themselves (e.g. adders and common lizards being more prone to basking in areas where they are observable than slow-worms), environmental conditions and the experience of the recorder. Use of artificial cover objects would have improved the detectability of slow-worms, and potentially adders (Sewell et al., 2012; 2013), though there were logistical reasons for them not being used in this study. The timing and duration of a survey may also influence these results. Indeed, for both adder and common lizard, the day of the year on which a survey visit took place had an influence on the detectability of the species, with detectability of adders apparently decreasing over the survey season, and detection of common lizards peaking around the end of May / beginning of June (Table 6; Figure 16). Though a target duration of around three hours was suggested for survey visits in this study, the actual durations were not available for analysis. However, some survey visits were known to be up to six hours in duration. This variability in survey effort complicates any comparisons between sites and time periods.
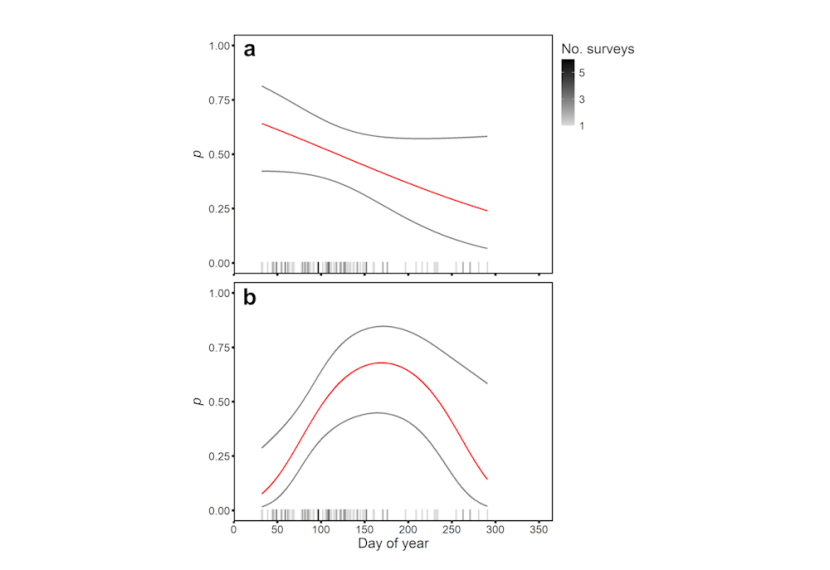
Figure 16. Predicted detectability (p) for the (a) adder and (b) common lizard by day of year for this study.
Click for a full description
Predicted detectability (p) for the (a) adder and (b) common lizard by day of year for this study. The mean (red line) and confidence intervals at 95% (grey lines) are shown. Ticks on the x-axis show the number of survey visits on a given day of the year (across all years).
Using the calculated null model detection estimates for each of the three reptile species, we found that slow-worms would require the greatest number of survey visits to have confidence of absence for the species (15 visits for 95% confidence), compared to seven visits for common lizard and only five for adder (Table 8). As described above, this would be reduced for adder and slow-worm through the use of artificial cover objects. Furthermore, based on these values, only seven sites received sufficient visits within a year in this study to have confidence of absence. Of these seven sites, adders were not detected in any of the 2022‒24 survey visits at only one (site 8 - Aberarder Invercauld Estate). Of the remaining nine sites that received less than five survey visits in all of the 2022‒24 survey years, six had no adder detections in any of the 2022‒24 survey visits. Therefore, we cannot say with high confidence that adders are absent at these sites without further survey effort.
Probability | ρ | K | K | K |
|---|---|---|---|---|
0.8 | 0.496 | 2.35 | 3.40 | 7.64 |
0.9 | 0.377 | 3.36 | 4.87 | 10.93 |
0.95 | 0.190 | 4.37 | 6.33 | 14.22 |
Population size
Evaluation of raw peak counts are displayed in Figure 17. This shows variability in peak counts between all three species, sites and time periods. In line with the results from Table 5, site 9 (Muir of Dinnet) showed the highest peak count for adders. A breakdown of peak counts by year is also given in Table 9 for adder, and Tables 10 and 11 for common lizard and slow-worm respectively. Figure 18 displays the normalised peak count for the surveys undertaken in this study, following the approach of Gardner et al. (2019). The results show variability in mean normalised peak count estimates between species and across survey years. However, we note the different number of visits used to support these estimates. For adder, the results are greatest in the final year of survey (2024), but with the largest confidence intervals due to only eight sites contributing to the estimate.
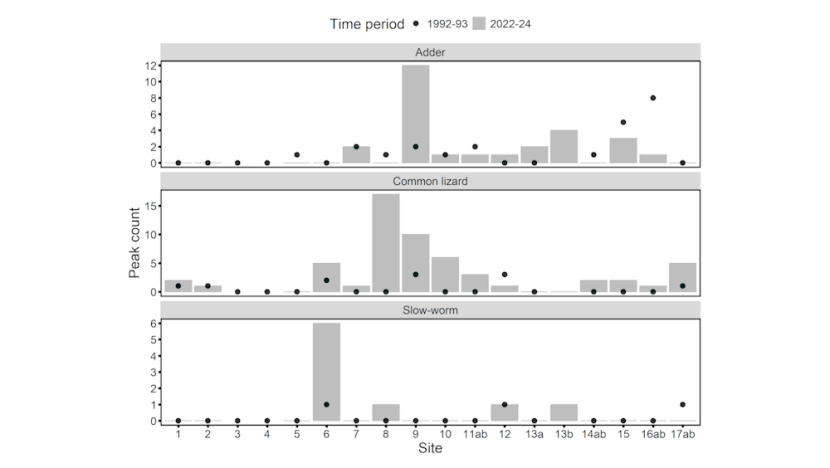
Figure 17. Peak counts of each reptile species, by site. Values are shown for surveys conducted in 1992‒93 (Reading et al., 1994) and 2022‒24 (this study). Paired sites are shown grouped and indicated by ‘ab’ on the x-axis.
Click for a full description
Peak counts of adder, common lizard and slow-worm, by site. Peak counts are shown as the highest number of individuals of a species observed during a single survey, within a given study (black points = Reading et al., 1994; grey bars = this study). Sites with slight geographic differences (‘paired’ sites) are shown grouped and indicated by ‘ab’ on the x-axis. Note that the y-axes are not consistent.
| Site ID | 1993 | 2022 | 2023 | 2024 | 2022‒24 Peak |
|---|---|---|---|---|---|
| 1* | 0 | 0 | 0 | - | 0 |
| 2 | 0 | 0 | 0 | - | 0 |
| 3 | 0 | - | - | - | - |
| 4 | 0 | - | - | - | - |
| 5 | 1 | 0 | 0 | 0 | 0 |
| 6 | 0 | 0 | 0 | - | 0 |
| 7 | 2 | 2 | 2 | - | 2 |
| 8 | 1 | 0 | 0 | 0 | 0 |
| 9 | 2 | 2 | 12 | 12 | 12 |
| 10 | 1 | - | 0 | 1 | 1 |
| 11a&b | 2 | 1 | 1 | - | 1 |
| 12 | 0 | - | 1 | - | 1 |
| 13a | 0 | 1 | 2 | - | 2 |
| 13b | - | - | 3 | 4 | 4 |
| 14a&b | 1 | - | 0 | 0 | 0 |
| 15 | 5 | 0 | 3 | - | 3 |
| 16a&b | 8 | 0 | 1 | 1 | 1 |
| 17a&b | 0 | - | 0 | 0 | 0 |
*Though site 1 (Borgie Forest) is not mapped by Reading et al. (1994), the data shows a single survey took place in 1993, resulting in an observation of one common lizard (13/09/1993).
- indicates site not surveyed in the given year.
| Site ID | 1993 | 2022 | 2023 | 2024 | 2022‒24 Peak |
|---|---|---|---|---|---|
| 1* | 1 | 2 | 2 | - | 2 |
| 2 | 1 | 1 | 1 | - | 1 |
| 3 | 0 | - | - | - | - |
| 4 | 0 | - | - | - | - |
| 5 | 0 | 0 | 0 | 0 | 0 |
| 6 | 2 | 5 | 3 | - | 5 |
| 7 | 0 | 1 | 0 | - | 1 |
| 8 | 0 | 1 | 17 | 0 | 17 |
| 9 | 3 | 4 | 5 | 10 | 10 |
| 10 | 0 | - | 6 | 0 | 6 |
| 11a&b | 0 | 2 | 3 | - | 3 |
| 12 | 3 | - | 1 | - | 1 |
| 13a | 0 | 0 | 0 | - | 0 |
| 13b | - | - | 0 | 0 | 0 |
| 14a&b | 0 | - | 2 | 0 | 2 |
| 15 | 0 | 2 | 0 | - | 2 |
| 16a&b | 0 | 0 | 0 | 1 | 1 |
| 17a&b | 1 | - | 5 | 0 | 5 |
*Though site 1 (Borgie Forest) is not mapped by Reading et al. (1994), the data shows a single survey took place in 1993, resulting in an observation of one common lizard (13/09/1993).
- indicates site not surveyed in the given year.
| Site ID | 1993 | 2022 | 2023 | 2024 | 2022‒24 Peak |
|---|---|---|---|---|---|
| 1* | 0 | 0 | 0 | - | 0 |
| 2 | 0 | 0 | 0 | - | 0 |
| 3 | 0 | - | - | - | - |
| 4 | 0 | - | - | - | - |
| 5 | 0 | 0 | 0 | 0 | 0 |
| 6 | 1 | 5 | 6 | - | 6 |
| 7 | 0 | 0 | 0 | - | 0 |
| 8 | 0 | 0 | 1 | 0 | 1 |
| 9 | 0 | 0 | 0 | 0 | 0 |
| 10 | 0 | - | 0 | 0 | 0 |
| 11a&b | 0 | 0 | 0 | - | 0 |
| 12 | 1 | - | 1 | - | 1 |
| 13a | 0 | 0 | 0 | - | 0 |
| 13b | - | - | 1 | 0 | 1 |
| 14a&b | 0 | - | 0 | 0 | 0 |
| 15 | 0 | 0 | 0 | - | 0 |
| 16a&b | 0 | 0 | 0 | 0 | 0 |
| 17a&b | 1 | - | 0 | 0 | 0 |
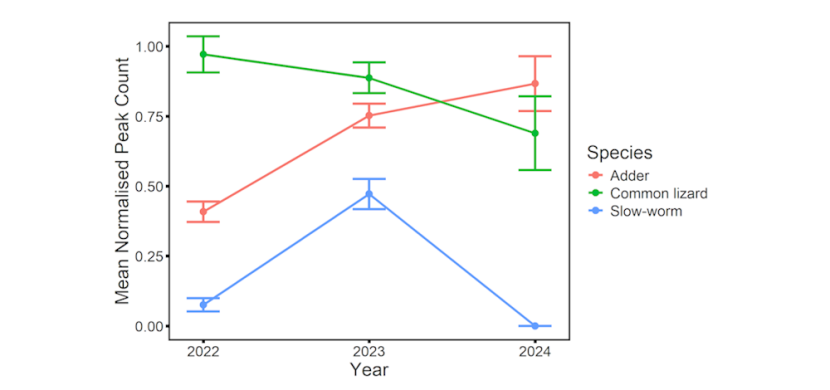
Figure 18. Mean normalised peak counts for adder (red), common lizard (green) and slow-worm (blue) from this study (2022‒24). Standard errors on the mean are displayed as error bars.
Click for a full description
Mean normalised peak counts for adder (red), common lizard (green) and slow-worm (blue) from this study (2022‒24). Values are based on 11 sites surveyed in 2022, 16 in 2023, and 8 in 2024. Standard errors on the mean are displayed as error bars.
Distribution
In addition to the maps produced showing the species distributions for each of the three reptile species based on survey questionnaire responses (see Distribution of reptile sightings in Scotland), additional data sources allowed us to map the distribution of the adder with greater reliability (Figure 19). Calculating the differences in the number of 10km squares occupied by adder pre-1994 and from 1994 onwards, we see a contraction in distribution from 567 10km squares pre-1994 to 364 squares from 1994 onwards. Despite this decline in the number of squares at which adders have been recorded, the overall range remains largely the same as described by Reading et al. (1994), with distinct gaps in the Central Valley, Outer Hebrides and Northern Isles, as well as within a large proportion of the upland region between Inverness and Glasgow. The likelihood that these gaps are a true reflection of absence is therefore increased via our study, though mountainous and remote areas in particular are often the subject of recording gaps for reptiles as well as other taxonomic groups, as well as the influence of other recording biases.

Figure 19. Presence of adders in Scotland over different time periods, as indicated by one or more adder records within a 10km square during that period. Contains OS data © Crown Copyright and database right 2023. Contains data from OS Zoomstack.
Click for a full description
Presence of adders in Scotland. Presence indicates that at least one adder record has been reported within a 10km square during the time period indicated (≤1993, 1994‒2003, 2004‒2013, 2014‒2024). Where a species is recorded in more than one time period, the most recent time period is displayed. Pre-1994 data displayed are from Reading et al. (1994), comprised of data from Map 2 - Collier (1990) and McGuire (1979), Map 3 - Scottish adder records from the Biological Records Centre (Jan. 1993), Map 6 - Farm and ITE Survey respondents indicating adder presence, Map 10 - presences reported from 1983‒87 by Farm and ITE Survey respondents, and Map 11 - presences reported from 1988‒92 by Farm and ITE Survey questionnaire respondents. Contains OS data © Crown Copyright and database right 2023. Contains data from OS Zoomstack.
Discussion
Questionnaire survey
The Adder Survey questionnaire was limited in terms of numbers of responses and geographic coverage. Nonetheless, it provided some valuable insights into the distribution and status of adders and other reptile species, as well as the respondents participating in this study. The results largely reflected those from the Farm and ITE questionnaire surveys, including overall uncertainty or a perception of no change in adder status. Similar to the previous study, a greater proportion of respondents reported adders to be less common in the preceding 10 years than more common. This is a cause for concern as adder declines could be going undetected, emphasising the need for sufficient monitoring to evidence any changes in abundance and distribution across Scotland and in what scenarios these may be occurring. For example, Gardner et al. (2019) found declines to be occurring in small adder populations, though with few study sites in Scotland.
We also saw similarities in land use changes between this and the previous study, whereby most respondents indicated no change, but for those that did, afforestation and agriculture were the two largest responses.
The maps produced solely from questionnaire responses are not a reliable representation of distribution of Scotland’s reptile species due to a number of inherent biases and caveats. This includes potential biases in the geography of respondents, the inability for us to verify the identification of the species reported, the limited coverage of the Adder Survey questionnaire responses, particularly compared to that of the Farm and ITE Surveys, and an assumption that the respondent is sufficiently familiar with their land and the species within it to provide an informed answer to the question. Similarly, a response in relation to a respondent’s land is unlikely to be representative of species occurrence within a whole 10km square. Respondents to the Adder Survey questionnaire reported reptile species to occur at a higher rate than in the previous study, which could be due to biases in the backgrounds and interests of those taking part (e.g. the target audience for the questionnaire being farmers, crofters, and land managers, and more specifically those with a greater interest in managing their land for wildlife).
Further limitations with the questionnaire included issues with understanding and interpreting the spatial and temporal relationships of responses. Some responses were in relation to estates across large or multiple areas. These may encompass multiple 10km squares, not only affecting our assessment of species distribution, but making it challenging for respondents to accurately report on large areas which may not be homogenous. Respondents were only asked if the species had occurred on their land, but not constrained to a particular time period. The resulting maps are therefore not representative of a particular time period, and any reported occurrence or otherwise absence of the species may have changed since. Still, the majority of squares where responses were provided indicated presence of adders (Figure 9). This could further support our suspicion of a response bias, in that people more familiar with native reptiles or who may have them on their land might have been more likely to complete the survey questionnaire.
The inability to verify the identification of species observations informing the answers to the questionnaires is particularly problematic. This is highlighted by the responses received for grass snakes. Twenty-two reports of grass snake were received through the Adder Survey questionnaire, widely scattered across the country except for the far north. The status and distribution of grass snakes in Scotland is uncertain, with existing records indicating the species occurs within Dumfries & Galloway and the Scottish Borders, possibly as a native species (Cathrine, 2014; McInerny and Minting, 2016; Foster et al., 2021). Although the questionnaire included pictures of each species (Annex 1), the term “grass snake” is used colloquially to refer to that species, adder or slow-worm in Scotland (Cathrine, 2014; McInerny and Minting, 2016), introducing some uncertainty for species-level identification via the questionnaire responses. Furthermore, there is a possibility of escaped or released specimens from captivity (Cathrine, 2014). We therefore caution interpretation of the questionnaire results suggesting grass snake occurrence without further evidence to verify these. If further evidence increases confidence that grass snake occurs as a native species in Scotland, our questionnaire results will be worth exploring in more depth.
Field survey
The number of sites where adders were detected has remained the same, but with no detection of adders at four paired sites where adders were recorded previously, and detection of adders at two paired sites where adders were not previously recorded. As site selection was biased towards areas suspected to have adders present, this may be surprising. However, our occupancy and detection analysis indicates that several sites surveyed between 2022‒24 did not have sufficient survey effort to have a high confidence of absence (Table 5). Furthermore, this assumes five or more visits are undertaken within a single survey season, whereas only seven of sixteen sites (7, 8, 9, 11b, 13b,15, 16) had five or more survey visits within a single year. Therefore, greater survey effort at many of the survey sites would be required to provide a true reflection of adder site-occupancy, though we acknowledge the challenges and limitations in undertaking such surveys through voluntary efforts. This bias also means that the field survey element cannot be considered representative of wider adder status in Scotland. One route to reducing the number of visits needed would be to use artificial cover objects as a means to improving detectability of adders, as well as slow-worms. This could then allow for fewer survey visits to more sites.
The 2022‒24 field survey suffered from some of the same challenges and issues as the surveys conducted in 1992‒93. Firstly, the overall sample size of sites is not sufficient to assess change in occupancy or abundance with any statistical rigour. There is also variation in the sites themselves between the two time periods, as well as potential issues with standardisation of survey visits in terms of survey duration and recording of other reptile species. Reading et al. (1994) also proposed that any follow up study would do best to maintain consistency by using the same observers. A 30-year period since the previous study and broader issues around timings and access of site visits meant that this was not feasible. We do agree though that having some measure of surveyor experience would allow for better analysis and interpretation of the field survey results. Other challenges facing this study included the remoteness of sites and site access, combined with unfavourable weather hampering survey planning or stopping visits.
In this study we assessed adder population size using the normalised peak count method (Gardner et al. 2019). However, we note that this approach is better suited to adder emergence counts where individuals may be more densely clustered and counted with higher accuracy, rather than the survey approach taken in this study.
Despite the issues highlighted above, the field study has been useful in terms of confirming adder presence at multiple sites, engaging and training volunteers in field survey methods, and providing comparisons against the previous study.
Distribution
We were able to collate multiple datasets to provide an up-to-date assessment of adder distribution in Scotland. This provides a worrying contrast to the maps produced by Reading et al. (1994), with a large reduction in the number of 10km squares reported as being occupied by adders. Despite this, the overall range remains largely the same as previously reported. Discerning the reasons for the differences in distribution is not possible using the available evidence, though we speculate that this could be down to a combination of reasons that warrant further investigation:
- Gaps and biases in available species distribution data. Reptile and amphibian occurrence records are known to be fragmented across multiple data holders (Turner et al., 2023), and it is possible that key datasets were not included in this study. An ongoing project - the Better Biodiversity Data Project - may be one route to improving this situation in Scotland.
- Limited coverage of the Adder Survey questionnaire. The adder distribution maps produced by Reading et al. (1994) were heavily influenced by the survey questionnaire responses. We had far fewer respondents, with much more limited geographic coverage. Therefore, additional effort to target questionnaire responses from discernible gaps may be beneficial, though we note the need for appropriate evidence and verification to produce a reliable output.
- Declines in adder distribution. There have been suggestions of adder declines in Scotland, and it is feasible that this has resulted in local distribution losses. Additional evidence is required to confirm this and to determine drivers, through structured repeat surveys across a network of sites.
Status
This study set out to identify changes to the status of the adder in Scotland since a previous study published in 1994. Reading et al. (1994) previously indicated declines in abundance and distribution to have possibly occurred, but further data is required to inform a full status assessment (Foster et al., 2021). These assessments would take into consideration abundance, distribution, habitat availability, pressures, and threats. The current study does not provide sufficient evidence to indicate an overall decline in abundance, though questionnaire responses provided some perceptions of the species becoming less common. In contrast, when combining multiple data sources to provide a thorough evaluation of distribution, the results suggest a reduced distribution, though with several limitations. Only through targeted field and questionnaire surveys will it be possible to ascertain if these gaps represent true absences. If adder declines are occurring, we must be able to monitor them both in terms of abundance and distribution. Monitoring abundance can identify the finer population changes, whereas solely monitoring occupancy may only be informative once a population has been extirpated or established.
Recommendations
We recommend that a network of survey sites, representative of the distribution of adders, is developed across Scotland. At these sites, volunteers should be supported to conduct multiple site visits per year across multiple years using visual survey and artificial cover objects along survey routes to look for and record adders and other reptile species. This should be combined with a targeted questionnaire survey, together filling gaps in distribution knowledge. The field survey element, when conducted over multiple years will allow for population trend estimation, and in a more representative manner than has so far been possible. Each survey should also capture information related to survey effort, surveyor expertise, and weather. We recommend that surveyors contribute via the National Reptile Survey, part of the National Amphibian and Reptile Monitoring Programme operated by ARC. That will ensure the data are collected according to an evidence-based, nationally co-ordinated programme. Habitat variables for each survey site can be extracted from Earth Observation data.
Any future questionnaire approaches should be mindful of both their wording and structure to ensure questions are properly understood, are only answered in the correct situations so the results can be relied upon. They should also allow for photo submissions which can then be verified by experts, supporting confirmation of the species reported. Finally, we recommend that the available data across Scotland is thoroughly reviewed to ensure existing sources of evidence are not being overlooked.
Conclusion
This study repeats and builds on the earlier study by Reading et al. (1994). Our study faced challenges in questionnaire response rates and in conducting field surveys visits, but on the whole provides similar results to the earlier study. Distinct gaps in adder distribution remain in several parts of the country. Evidence provided by both questionnaire responses and field survey visits continue to raise concerns over the status of the adder in Scotland, and highlight the need for additional survey to provide a clear evidence base for status assessment.
Annexes
Annexes for the adder survey 2022-24 are available to download next.
Please note that this word document is not fully accessible. If you require an accessible format please use the feedback form on our website.
References
Baker, J., Suckling, J. and Carey, R. 2004. Status of the adder Vipera berus and slow-worm Anguis fragilis in England. English Nature Research Report 546. English Nature, Peterborough.
Beebee, T.J. and Ratcliffe, S. 2018. Inferring status changes of three widespread British reptiles from NBN Atlas records. Herpetological Bulletin, 143, 18–22.
Cathrine, C. 2014. Grass Snakes (Natrix natrix) in Scotland. Glasgow Naturalist, 26 (Part 1), 36–40.
Collier, R. 1990. Adder and slow-worm survey of the Highlands. Highland Biological Recording Group (Inverness Museum). Newsletter No. 3, 7.
Cooke, A.S. and Scorgie, H.R.A. 1983. The status of the commoner amphibians and reptiles in Britain. Focus on Nature Conservation, No. 3. Peterborough: Nature Conservancy Council.
Fiske, I. and Chandler, R. 2011. unmarked: An R Package for Fitting Hierarchical Models of Wildlife Occurrence and Abundance Journal of Statistical Software, 43(10), 1–23.
Foster, J., Driver, D., Ward, R. and Wilkinson, J. 2021. IUCN Red List assessment of amphibians and reptiles at Great Britain and country scale. Report to Natural England. ARC report. ARC, Bournemouth.
Frazer, D. 1983. ed. Reptiles and amphibians in Britain. The New Naturalist, Collins, London.
Gardner, E., Julian, A., Monk, C. and Baker, J. 2019. Make the Adder Count: population trends from a citizen science survey of UK adders Herpetological Journal 29, 57–70.
Gleed-Owen, C. and Langham, S. 2012. The Adder Status Project – a conservation condition assessment of the adder (Vipera berus) in England, with recommendations for future monitoring and conservation policy. Unpublished report. CGO Ecology Ltd, Bournemouth.
Hilton-Brown, D. and Oldham, R.S. 1991. The status of the widespread amphibians and reptiles in Britain, 1990, and changes during the 1980s. Focus on Nature Conservation, No. 131. Peterborough: Nature Conservancy Council.
Julian, A.M., Langham, S.J., Cooper-Bohannon, R., Raynor, R., Whatley, C., Foster, J. and McKinnell, J. 2024. An overview of the Scottish National Adder Survey 2022-24 The Glasgow Naturalist, 28(2), 51‒56.
Kellner, K.F., Smith, A.D., Royle, J.A., Kéry, M., Belant, J.L. and Chandler, R.B. 2023. The unmarked R package: Twelve years of advances in occurrence and abundance modelling in ecology Methods in Ecology and Evolution, 14(6), 1408–1415.
MacKenzie, D.I. and Bailey, L.L. 2004. Assessing the fit of site-occupancy models Journal of Agricultural, Biological, and Environmental Statistics, 9, 300–318.
McArdle, B.H. 1990. When are rare species not there? Oikos, 57, 276–277
McInerny, C.J. 2014a. Observations on a population of adders, slow-worms and common lizards on Loch Lomondside, Scotland. The Glasgow Naturalist 26(1), 63–68.
McInerny, C.J. 2014b. Habitat preferences of European adders at Loch Lomond, Scotland. The Glasgow Naturalist 26(1), 69–74.
McInerny, C.J. and Minting, P.J. 2016. eds. The Amphibians and Reptiles of Scotland. Glasgow: Glasgow Natural History Society.
R Core Team 2023. R: A Language and Environment for Statistical Computing R Foundation for Statistical Computing, Vienna, Austria.
Reading, C.J., Buckland, S.T., McGowan, G.M., Gorzula, S., Jayasinghe, G., Staines, B.W., Elston, D.A. and Ahmadi, S. 1994. Status of the Adder Vipera berus in Scotland. Scottish Natural Heritage Research, Survey and Monitoring Report No. 38S.
Reading, C.J., Buckland, S.T., McGowan, G.M., Jayasinghe, G., Gorzula, S. and Balharry, D. 1996. The distribution and status of the adder (Vipera berus L.) in Scotland determined from questionnaire surveys Journal of Biogeography, 23, 657–667.
Sewell, D., Guillera-Arroita, G., Griffiths, R.A. and Beebee, T.J. 2012. When Is a Species Declining? Optimizing Survey Effort to Detect Population Changes in Reptiles PLoS ONE, 7(8), e43387.
Sewell, D., Griffiths, R.A., Beebee, T.J., Foster, J. and Wilkinson, J.W. 2013. Survey protocols for the British herpetofauna Version 1.0. Amphibian and Reptile Conservation, Bournemouth.
Turner, R.K., Griffiths, R.A., Wilkinson, J.W. Julian, A.M., Toms, M.P and Isaac, N.J. 2023. Diversity, fragmentation, and connectivity across the UK amphibian and reptile data management landscape
Biodiversity and Conservation, 32, 37–64.
Wilkinson, J.W and Arnell, A.P. 2013. NARRS Report 2007-2012: Establishing the Baseline (HWM Edition). ARC Research Report 13/01.