Assessing foraging movements and habitat use of herring gulls (Larus argentatus) in the Forth Islands SPA
Authors: Nina O'Hanlon (BTO Scotland), Lucy Quinn (NatureScot), Gary D. Clewley, Daniel T. Johnston (BTO Scotland), Chris B. Thaxter (British Trust for Ornithology), Rebecca Lakin, Karen A. Spencer (University of St Andrews), Niall K. Burton (British Trust for Ornithology), Elizabeth Humphreys (BTO Scotland).
Keywords
Foraging; tracking data; wind development; habitat selection; anthropogenic resources; gull.
Background
The UK Government and the Scottish Government have set targets for net zero carbon emissions by 2050 and 2045 respectively to help address climate change, with offshore wind farms (OWFs) being an important part of the strategy to achieve this. There is concern as to the impacts that these developments may have on wildlife especially seabirds given that many species are already in decline or under threat. Herring gulls Larus argentatus have been previously ranked as the most susceptible seabird species at risk of collision with a wind turbine due to their flight heights. As a result, understanding how herring gull movement patterns overlap with both existing and proposed offshore wind farm developments, year-round, is key to assessing the impact of marine renewables on UK herring gull populations, especially those qualifying features of Special Protection Area (SPAs).
Herring gulls use a variety of resources within the marine and terrestrial environments, which may overlap with other anthropogenic activities. Therefore, it is also important to understand the movement and spatial use of this species to inform decisions around licensing applications by statutory agencies: for example, to prevent serious agricultural damage or harm to livestock, and for public health and safety.
In 2019, NatureScot provided funding for the BTO to track herring gulls that are qualifying features of the Forth Islands SPA with Global Positioning System (GPS) devices to collect multi-year data on individual movements. The aim was for these data to help inform the consenting process of offshore wind farm developments within the Firth of Forth area but also more generically to help understand seabird-OWF interactions. These data would also be used to identify likely interactions with other resources linked to human activities in order to appropriately assess licence applications. This report presents the results from the analysis of GPS data obtained from the tracked herring gulls between 2019 and 2023.
Main findings
- In total we obtained year-round GPS data from 28 herring gulls breeding within the Forth Islands SPA (14 from the Isle of May, nine from Fidra and five from Craigleith) between the breeding seasons of 2019 and 2023. Whilst this number still provides useful data on individual movements, this represents a small proportion of the total herring gull population breeding within the Forth Islands SPA.
- The majority of tracked herring gulls were resident within the study area throughout the annual cycle. However, six individuals dispersed further than the other tracked birds during the non-breeding season, mostly in a southerly or south-west direction from the Firth of Forth into England and/or south-west Scotland, with some individuals reaching up to 530km from Forth Islands SPA.
- During the breeding season, on average, individuals tracked from the Isle of May had greater foraging ranges and travelled further during foraging trips than those from Craigleith and especially Fidra. Within each colony, there were also differences across years likely attributed to variation among individuals.
- The home ranges of the tracked herring gulls, across all three colonies, showed that terrestrial and coastal habitats were the habitats that were predominantly targeted for foraging. Across all colonies and individuals, away from the colony herring gulls spent an average of 94.3 ± 4.2 % of their time in terrestrial environments (including coastal habitats) during the breeding season, and 92.9 ± 7.3 % of their time during the non-breeding season. The marine environment was rarely used by individuals tracked within this study.
- Although several of the herring gulls were tracked within the footprints of proposed or consented OWFs, there was limited temporal or spatial overlap based on the number of birds tracked in this study. Across colonies and years, individuals spent < 0.01 % of their time away from the colony within OWF footprints. Up to a maximum of 7 % of the gulls’ combined individual home ranges overlapped with the OWF footprints; which involved individuals from the Isle of May during the 2021 breeding season. Fewer individuals were tracked within OWF footprints during the non-breeding than the breeding season.
- We also provide details on the onshore wind farms that the tracked herring gulls overlapped with over the study period to help inform the consenting process and Environmental Impact Assessments (EIA) of proposed developments. Several individuals overlapped with both on and offshore wind farms over the annual cycle.
- Specific locations that were targeted by tracked individuals included landfill sites and harbours, during the breeding and non-breeding season. During the non-breeding season, individuals also occasionally visited other islands within the Firth of Forth outwith their breeding colony.
- Individual herring gulls were also tracked overlapping with other SPAs, including some in England, highlighting the importance of considering SPAs from a cross-border perspective.
- Herring gulls from the Isle of May showed strong selection for landfill sites and coastal and urban habitats during the breeding and non-breeding seasons, whilst those from Fidra and Craigleith combined showed a strong selection for landfill sites and coastal habitats across both seasons, as well as harbours during the breeding season.
- Agricultural habitat was the most used habitat, consistently accounting for around 50 % of GPS fixes, however selection for this habitat was low across colonies and seasons, likely due to the gulls using it in relation to its availability.
- We provide details of specific landfills, harbours and airports that the tracked herring gulls overlapped with during the study period to help assess individual licence applications associated with these anthropogenic activities / locations.
- The habitat selection analysis provides details on the resources that herring gulls within the Forth Islands SPA are currently targeting across the annual cycle. This information is useful in understanding current potential conflicts with human activities, and to assess future issues. For example, if changes occur in the availability of specific preferred habitats, i.e. exclusion from coastal areas due to coastal development, which may lead to individual herring gulls switching to forage in other habitats such as agricultural or urban areas.
- Further exploration of the tracking data to determine whether GPS fixes that overlapped with onshore or offshore wind farms were associated with commuting or other behaviours would be a useful next step. It would also be useful to look in more detail at those individuals which overlap both with onshore and offshore wind farms, as this has implications for the EIA process, specifically in relation to apportionment of impacts back to a specific SPA.
Acknowledgements
This work was funded by NatureScot. NatureScot also provided permission to work at the Forth Islands SPA. Thanks to David Steel, Caroline Gallagher and Bex Outram from the Isle of May and Mark Newell (UK Centre for Ecology and Hydrology) and Sam Langlois (who was a PhD student of University of Highland and Island and UKCEH at that time) for their support in the field. We are also grateful to members of the Isle of May Bird Observatory Trust and Jeroen Mindermann for co-ordination of ringing and colour-mark schemes. We are extremely grateful to the skippers of the May Princess and Osprey (Anstruther) for providing access to the Isle of May and Dougie Ferguson, Skipper of the Braveheart (North Berwick) for Craigleith and Fidra. Sam Massimino (BTO) was extremely helpful in providing guidance to ensure that appropriate health and safety measures were in place for the fieldwork undertaken in 2021. During the original 2019 season assistance was gratefully received from Liz Holmes, Alan Leitch, John Hunt, Alex Dodds, Maggie Sheddan. Field support to assist with device deployment and monitoring were also gratefully received during 2022 by Lucy Quinn (NatureScot), Katherine Booth Jones (BTO), Chris Pollock (BTO) and Hannah Greetham (NatureScot) and Jess Hey (Bangor University). Thanks to the Isle of May Bird Observatory (Mark Oksien and Alan Lauder) for providing the rings deployed on the herring gulls within this study. Thanks also to Sam Langlois, as BTO member of staff, for help in creating the time-in-area maps.
Introduction
The UK Government and the Scottish Government have set targets for net zero carbon emissions by 2050 (UK Government, 2019) and 2045 respectively (Scottish Parliament, 2019) to help address climate change with offshore wind farms (OWFs) being an important part of the strategy to achieve this (BEIS, 2021). Currently, the UK is a global leader in the OWF industry, with 49 TWh of electricity generated from operational sites by the end of 2023, enough to cover 17 % of the UK’s electricity needs in 2023 (The Crown Estate, 2023). Consequently, numerous further developments are currently under construction, consented or proposed and multiple additional areas are open to development in the future as outlined in the Sectoral Marine Plan for Offshore Wind Energy (Scottish Government, 2020) (Figure 1). A further 13 projects successfully announced as Innovation and Targeted Oil and Gas (INTOG) offshore wind sites (The Crown Estate, 2024).
There is, however, concern as to the impacts that these developments may have on wildlife (Piggott et al., 2021) especially seabirds given that many species are already in decline or under threat (Dias et al., 2019). OWFs may potentially have negative impacts on bird populations, in particular, through: (1) displacement from preferred foraging sites; (2) barrier effects to migration routes or commuting flight paths to foraging areas; (3) the direct mortality associated with collision; and (4) physical habitat modifications caused by the installation of offshore wind structures, including the creation or destruction of foraging habitats (Drewitt and Langston, 2006; Fox et al., 2006). Herring gulls Larus argentatus have been previously ranked as the most susceptible seabird species at risk of collision with a wind turbine due to their flight heights, with great black-backed Larus marinus and lesser black-backed gulls Larus fuscus ranked closely behind (Furness et al., 2013). As a result, understanding how herring gull movement patterns overlap with both existing and proposed wind farm developments is key in assessing the impact of renewables on UK populations.
Herring gull populations at traditional coastal and island colonies, including those cited as qualifying features at Special Protection Area (SPAs), have declined (Burnell et al., 2023) with the species currently listed under the UK's Red list of Birds of Conservation Concern (Stanbury et al., 2024). Whilst urban populations are now established across many UK towns and cities (Balmer et al., 2013), there is uncertainty in the overall numbers and trends of herring gulls at these sites, and their distribution. This is due to detectability issues when trying to estimate accurate counts from suitable vantage points, as well as logistical and financial challenges in the use of uncrewed aerial vehicles (UAVs) and aerial surveys (Burnell, 2021).
Typically considered to be a generalist species, herring gulls can exploit a variety of resources and habitats and are able to travel considerable distances during the breeding season to obtain food (Thaxter et al., 2012). Previous research has revealed inter-colony variation in the dietary intake of breeding herring gulls, with the extent of marine or terrestrial foraging being influenced by the resources available within a populations’ foraging range (O’Hanlon et al., 2017). As individuals can exploit an array of habitats whilst foraging (e.g. marine, terrestrial and urban), there is a need to account for connectivity between breeding populations and all possible renewable developments, both on and offshore, that fall within this species’ expansive foraging range.
Herring gulls are largely resident within the UK after breeding (Coulson and Butterfield, 1985). Seasonal movements within the UK are more common than southern bound migration outside the UK, as seen in other Larus species (e.g. lesser black-backed gulls; Spina et al., 2022). This combined with their usage of terrestrial sites results in herring gull populations, unlike some other seabird species, being potentially at risk of year-round interactions with both onshore and offshore wind farms within the UK. Tracking data are therefore extremely valuable in assessing possible connectivity between development areas and designated sites throughout the annual cycle.
To inform the consenting process, the potential impacts associated with developments are assessed through an Environmental Impact Assessment (EIA) in relation to baseline populations at site, local, regional and national levels. As part of this process, developers should identify whether there might be any Likely Significant Effects (LSEs) on qualifying features of European sites (Special Protection Areas, SPAs, or Special Areas of Conservation, SACs) through a Habitats Regulations Appraisal (HRA) such that decision-makers may make an Appropriate Assessment (AA), if required. Thus, it is important to understand the extent to which birds from protected areas use proposed development areas. Potential impacts may also vary between the construction and operational phases of a development as the type of disturbance and modification to the environment differs (Bergström et al., 2014) so data collected throughout these periods are useful for informing EIAs.
Connectivity is the establishment of a plausible link between the source population and the development impact. Establishing the extent of connectivity between birds using development areas and protected areas is an important element in assessment of how protected areas may be affected (Quinn, 2019). The apportionment process relates to how the predicted impacts of an on or offshore wind farm on the qualifying feature are related back to SPA population(s) i.e. considers how the impacts can be ‘apportioned’ to multiple source colonies (Quinn, 2019; NatureScot, 2018). Generic foraging ranges for most UK seabird species during the breeding season are available (e.g. Woodward et al., 2024), which can inform the connectivity and subsequent apportionment processes, but there is often a case for site specific data due to variability between years in foraging conditions and between individuals with varying foraging strategies (Cleasby et al., 2023).
Herring gulls are less well studied in the UK by comparison to lesser black-backed gulls. However, tracking work has occurred at Morecambe Bay (Thaxter et al., 2017), and at an urban colony in St Ives (Rock et al., 2016), highlighting high variability in the foraging strategies exhibited by individuals. Additionally, herring gulls tracked from neighbouring colonies in the German North Sea demonstrated differences in their foraging strategies, with birds foraging on alternative resources depending on the colony distance from the mainland, time of day and tidal cycles (Enners et al., 2018). More recent work from analyses of herring gulls across a range of colony types in the UK has shown that terrestrial foraging ranges were greater than those of marine, and there was a clear preference for selection of the terrestrial rather than the marine environment during the breeding season (Thaxter et al., 2021; Thaxter et al., 2025).
In addition to tracking data being used to understand likely interactions with wind farms, it also can be used to inform decisions around licensing applications by statutory agencies. Under specific circumstances, herring gulls are subject to licensed control, for example, to prevent serious agricultural damage or harm to livestock, for public health and safety or for the conservation of other species. Since herring gulls have been removed from General Licences in the UK, statutory nature conservation agencies must assess individual licence applications on a case-by-case basis (NatureScot, 2020a; b). Therefore, understanding herring gull habitat use and selection in terrestrial as well as marine environments is necessary to appropriately assess licence applications at sites used by gulls given the range of potential resources linked to human activities (for example, agriculture, urban areas, landfill sites and airports within the Firth of Forth region) that individuals can target.
In 2019, NatureScot provided funding for the BTO to attach Global Positioning System (GPS) devices to herring gulls within the Forth Islands SPA, to collect multi-year data on individual movements, to help inform the consenting process specifically within the Firth of Forth area but also more generically to help understand seabird-OWF interactions. Lakin et al., (2020) produced a report based on the first breeding and post-breeding season of 2019, whilst Clewley et al., (2023) produced a report summarising the area usage of tracked herring gulls from the 2021 breeding season until the 2022 post-breeding period. This final report updates both Lakin et al., (2020) and Clewley et al., (2023) using all data collected between the 2019 breeding season and the end of the 2023 breeding season. It also provides more detail on the habitat use of the herring gulls within the study area.

Figure 1. Map of Scotland showing the locations of offshore wind development areas.
Click for a full description
Click to view a larger version of this map.
Location of future offshore wind development areas around Scotland including wind farms that are consented, under-construction and operational as of May 2024. (Image from Crown Estates Scotland).
Aims
This study aims to assess the movement patterns and habitat use of herring gulls breeding at three Site of Special Scientific Interest (SSSI) colonies located within the Forth Islands SPA. Overall, the main objectives are as follows:
- To assess year-round movement patterns and habitat use of herring gulls tagged within the Forth Islands SPA.
- To identify foraging hotspots utilised by individuals during both breeding and non-breeding seasons between years.
- To quantify the proportion of time spent in marine vs terrestrial environments during breeding and non-breeding seasons.
- To provide additional tracking data to help inform guidance on apportioning approaches and wind farm assessments for large gulls.
Specifically, the analyses included in this final report are:
- Foraging trip statistics (including foraging ranges).
- Distance from the colony outside the breeding season.
- Connectivity and spatial overlap with OWFs in the Firth of Forth (Figure 1), plus overlap with onshore wind farms, landfill sites, harbours and airports as well as to other Firth of Forth islands and Special Protection Areas (SPAs).
- Proportion of time spent in terrestrial versus marine environments during the breeding and non-breeding seasons.
- Habitat selection during the breeding and non-breeding seasons, comparing Isle of May birds with Craigleith and Fidra birds combined.
Methods
Field sites
Fieldwork was conducted at three island colonies within the Firth of Forth, Scotland (see Figure 2); Craigleith (latitude/longitude; 56.073, -2.720), Fidra (56.072, -2.785) and the Isle of May (56.182, -2.550). All islands fall within the classified Forth Islands Special Protection Area (Forth Islands SPA) and are notified Sites of Special Scientific Interest (SSSI).
The Isle of May, located c. 8 km offshore from Fife, is the largest of the three isles, stretching 1.5 km long and 0.5 km wide. It is owned and managed by NatureScot and as well as being an SPA is also a designated National Nature Reserve (NNR), and a Special Area of Conservation (SAC).
Craigleith and Fidra are considerably smaller than the Isle of May and are situated c.1 km from the Lothian coast. Fidra is a reserve, owned by the Royal Society for the Protection of Birds (RSPB), and Craigleith is owned privately by the Dalrymple family.
All three islands provide breeding grounds for nesting herring gulls during the summer months and population counts are carried out annually or biannually by wardens and volunteers. When this project started. the estimates for breeding herring gulls were (1) Isle of May: 3,398 Apparently Occupied Nests (AONs) in 2018, (2) Craigleith: 1,092 AONs in 2018 and (3) Fidra: 1,060 AONs in 2019 (JNCC, 2019).
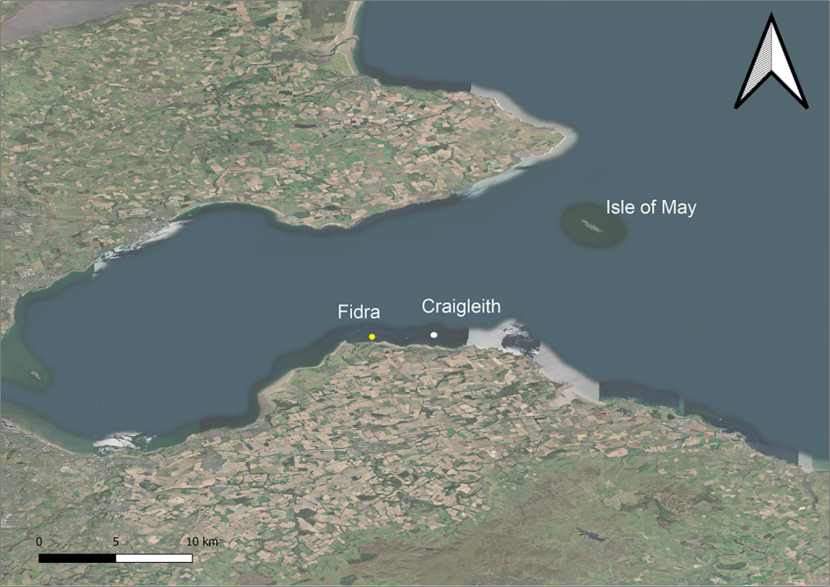
Figure 2. Map of the Firth of Forth showing the locations of the three study islands.
Click for a full description
Location of the three study islands within the Firth of Forth. The Isle of May is the largest site closest to the Fife coast whilst Fidra (yellow circle) and Craigleith (white circle) are situated close to the Lothian coast in the south. Map data © 2019 Google.
Bio-logging system - Movetech Telemetry
During this study we used two types of ‘Flyway’ devices developed by Movetech Telemetry (hereafter ‘Movetech’). During 2019, Flyway-25 (25g; 57.5 x 26.5 x 19 mm) devices were deployed. For subsequent years the lighter Flyway-18 (18g; 50 x 26.5 x 14.5 mm) devices were used which meant a greater number of captured individuals could be tagged (see below under Catching and Tagging).
These GPS devices utilise the Global System for Mobile Communications (GSM) 2G network to transmit data directly to an online telemetry data repository (Movebank) without the need for any in situ equipment. In areas without mobile coverage, the devices continue to store GPS locations on internal memory sufficient for over 60,000 records. The devices have solar panels to recharge the battery to extend life and were expected to operate for c. 2 years.
During the breeding season, Movetech devices were initially set to record one GPS fix every 60 minutes between 0800 and 2000 h and 180 minutes between 2000 and 0800 h overnight (to conserve battery power) after deployment and were updated remotely to 30 minutes (day) and 90 or 120 minutes (night) after a period of a few weeks once battery levels could be monitored. Between c. October and March, the sampling rate was reduced to 120 minutes to reduce power consumption.
Field Methods
Catching and tagging
Adult herring gulls were caught during late incubation or the very early chick-rearing phase of the breeding season (end of May to mid-June between 2019 and 2022; Table 1), when they are relatively reluctant to spend time away from the nest. Only one member of a pair was tagged, with one exception when a partner bird was tagged in a subsequent year. Cage nest traps, of small mesh wire with a funnel entrance, were placed over nests (Figure 3). Traps were monitored by observers until an individual was captured, at which point the bird was retrieved, placed in individual cotton sacks and processed. A small number of individuals were also captured using remote-release noose traps under additional specific licence. No individual nest was targeted for more than c.30 minutes and trapping effort was periodically moved to different areas of the colonies to reduce repeat disturbance in agreement with site managers. All periods of inclement weather were avoided for catching to prevent unguarded eggs from becoming chilled.
Processing took place out of sight from the colony but within 100 m or less and involved fitting a numbered metal ring, unique coded colour-ring, and recording biometrics (wing length, bill length (to feather), bill depth (at gonys), total head length, weight and moult). In addition, approximately half the individuals had a tag attached with the remaining individuals deemed as controls (see Table 1). The tags were attached using a tried and tested thoracic cross-strap harness to fit devices as a backpack (Figure 3) that has previously been used successfully for lesser black-backed gulls (Thaxter et al., 2014; Shamoun-Baranes et al., 2017, Clewley et al., 2021a). All harnesses were constructed from 6.35 mm tubular Teflon ribbon (Bally Ribbon Mills, Pennsylvania, USA) to minimise abrasion and included a braided nylon core for strength. Harnesses were modified to include a cotton weak-link element to allow safe detachment of the tag, without need to recapture the bird, after an expected period of approximately 2-3 years (Clewley et al., 2021a).
All trapping and ringing activities were carried out by licensed individuals holding valid BTO ringing permits. Tags and harnesses were fitted under endorsement from the Special Method Technical Panel (SMTP) of the BTO Ringing Committee. The time needed to safely fit the harness was c.20 minutes and overall capture, holding and handling time was aimed to be 45 minutes or less. Improvements to tag design and attachment protocol are continually being considered to aim to reduce these handling times wherever possible. One such potential improvement trialled in 2021 was the use of brass crimps on three birds to secure the harness instead of stitching and superglue (Watts et al., 2008). These provided a small decrease to fitting time and were still secure one year later. Findings were summarised and reported to the SMTP to help inform future tagging methods.
A requirement of the SMTP licence was all additional attachments (colour ring, harness and device combined) must be <3 % of an individual’s body mass at the time of capture, which is a well-established threshold in the UK to help minimise the risk of negative effects of tagging (Geen et al., 2019). Although relative mass is not the only important factor (e.g. Vandenabeele et al., 2012), this was adhered to during this study with the percentage mass of attachments to the gulls’ body mass being 2.64 ± 0.25 %.
Blood sampling under Home Office Animal Testing and Research (ASPA) licence was also conducted in 2019 on the Isle of May by Professor Karen Spencer (University of St. Andrews) as part of a separate project funded by Royal Society of Edinburgh and Leverhulme grants.
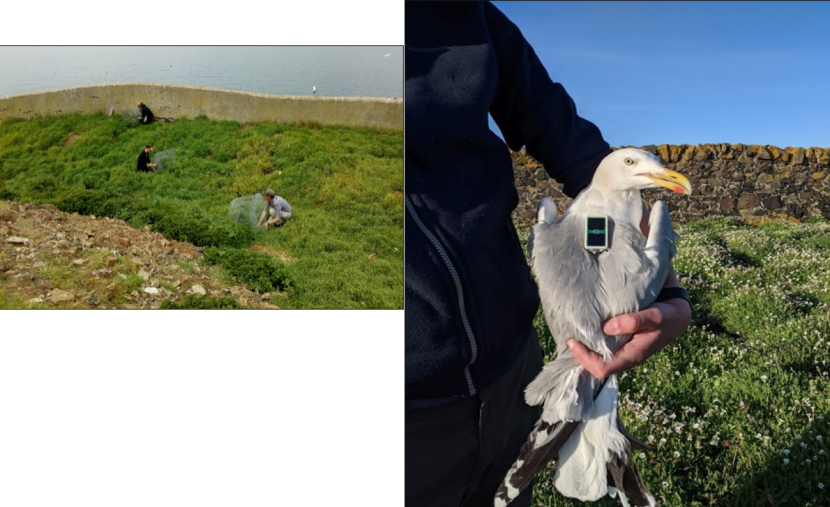
Figure 3. Field team setting nest traps in the main gull breeding area on Fidra (left) and tagged herring gull showing the position of a Movetech device just prior to release on the Isle of May (right).
Click for a full description
Two photographs. The left photograph is of several people setting up wire traps on gull nests hidden in vegetation. The right photograph shows an adult herring gull in a person’s hand with a Movetech device attached to its back.
| Year | Craigleith Tagged | Craigleith Control | Fidra Tagged | Fidra Control | Isle of May Tagged | Isle of May Control |
|---|---|---|---|---|---|---|
| 2019 | 1 | 1 | 2 | 3 | 2 | 191 |
| 2020 | 0 | 0 | 0 | 0 | 0 | 0 |
| 2021 | 0 | 0 | 0 | 0 | 14 | 10 |
| 2022 | 4 | 5 | 7 | 9 | 0 | 0 |
| TOTAL | 5 | 6 | 9 | 12 | 16 | 29 |
Monitoring for tag effects
Previous assessments of the potential negative effects of fitting devices using harnesses for lesser black-backed and herring gulls found no differences in productivity, return rates or nest attendance (Thaxter et al., 2015; Clewley et al., 2021a) or growth rates of chicks (Kavelaars et al., 2018).
Within this study, all individuals were observed immediately after release to ensure mobility was not impaired in any way. All nests of tagged and control birds were marked with uniquely numbered flags up to 1 m from the nest and revisited to check contents to establish hatching success. Chicks of ground nesting gulls tend to be highly mobile as they get older and therefore it is very difficult to assign chicks within colonies to particular nests so it was not possible to measure productivity of tagged and control nests during this study.
Adult return rates in subsequent years after tagging or marking were determined by intensive visual searches using telescopes for returning individuals, identified by colour rings. All areas where birds had been caught previously, as well as adjacent parts of the colony, were searched including at different times of day. Effort was variable between years depending on staff and access availability so data do not reflect true return rates but can be used to understand differences between the two groups (tagged and controls). There was no access to Craigleith or Fidra in 2020 or 2021 (due to COVID-19 restrictions) and only 2-3 visits in 2022 therefore, combined with very small samples at these sites, there were too few sightings to provide any meaningful data. We therefore focus on the Isle of May in 2022 where resighting effort was relatively high and where most individuals were tagged in 2021. Resighting rates in 2022 of birds tagged in 2021 were lower for tagged than control individuals (Table 2), although not significantly so (Pearson's Chi-squared test: χ2 = 2.24, P = 0.14). This was attributed to a higher than previous return rate for control birds, however return rates should be continued to be evaluated in future studies to ensure there is not a consistent difference between return rates of tagged and control individuals.
| Colony | Year marked | Group | N | 2022 Proportion re-sighted |
|---|---|---|---|---|
| Isle of May | 2021 | Tagged | 14 | 0.501 |
| Isle of May | 2021 | Control | 10 | 0.80 |
Data analysis
All data processing, foraging trip and movement metrics, and habitat selection analysis were carried out using R 4.1.2 (R Core Team, 2021) as well as custom-written functions within the R packages BTOTrackingTools and BTOWindFarms (Thaxter, 2020; 2021). Telemetry data were cleaned prior to analyses to remove any potentially erroneous data. Any incomplete or duplicate data were removed, as well as any GPS fixes obtained from three or fewer satellites. Movetech devices also recorded manufacturer specific metadata (‘flt:switch’ values) on the validity of the GPS fix obtained and only good fixes were retained for analysis. Finally, a speed filter (threshold 30m/s) was used to remove fixes considered unreliable based on calculated speed between two consecutive points.
Defining time periods across the year
Data was used from the 2019 breeding season (when the first individuals were tagged) to the end of the 2023 breeding season (Table 3). We assessed the movements of herring gulls using two different approaches to define key time periods across the year. Firstly, gulls may have different movement patterns and habitat use during the breeding season, when they are constrained to the nest, compared to the non-breeding season. Hence, we split the data into the following seasons: ‘breeding’ (01 March - 31 August) and ‘non-breeding’ (01 September – 28/29 February). This was irrespective of the actual breeding status of the tagged individuals as intensive monitoring was not feasible for all years of tracking to determine their status. We used these definitions of breeding and non-breeding (rather than those used in the previous interim report, Clewley et al. 2023: Breeding - 01 April - 31 August, Post-breeding - 01 September – 30 November, and Winter - 01 December – 31 March) as these are the seasonal timeframes recommended for herring gulls by NatureScot (2020b). Secondly, given that herring gulls are often resident to the region where they breed throughout the year, we identified when individuals were ‘colony associated’ (Thaxter et al., 2025). This was defined as the period which includes pre-breeding and post-fledging as well as ‘true breeding’ (when individuals had active nests contain eggs or chicks). For resident individuals it also included the non-breeding season, given the interest in knowing where individuals were distributed when associated within the Forth Islands SPA. This latter measure identifies when each individual was associated with the colony, derived from the tracking data as opposed to an imposed fixed date. This is particularly relevant for herring gulls where some individuals are resident, whilst others disperse away from the breeding area (Camphuysen et al., 2011; Camphuysen, 2013). The GPS data were filtered to retain all fixes within a ‘colony associated’ period defined as when an individual first returned to the colony each year to the date it left the colony, if it did. Due to the large amount of figures and tables created by using both these approaches, we present the results of foraging metrics and habitat selection from the breeding and non-breeding seasons in the main text of the report, with the colony associated summaries provided in the Annexes.
Defining trips and trip summary statistics
Any GPS fixes outside a 100 m buffer of each island boundary were classified as away from the colony. Trips were defined as continuous consecutive fixes recorded between each departure and return to the colony (as defined by the boundary) with incomplete trips defined as having data gaps greater than 8 hours.
Foraging trip metrics were calculated as follows: foraging range (i.e., the distance between the nesting site and the furthest point of a foraging trip in km), trip length (total distance covered by birds during each foraging trip as estimating by summing up all the distances between consecutive points in km), and trip duration (time taken to complete a foraging trip in hours). For each of these metrics, a mean value across all birds and the absolute maximum value were calculated. Only complete trips were used to calculate trip statistics.
Since individuals are not constrained as central place foragers outside of the breeding season, individual trip metrics cannot be calculated for the non-breeding season, although many individuals continued to visit the colony. Therefore, for the non-breeding season we calculated mean maximum and maximum distances that individuals travelled from their breeding colonies.
Assessing overlap with features of interest in the terrestrial and marine environment
Following previous studies (Thaxter et al., 2014), an individual bird would be concluded to show connectivity, or overlap, with a feature (i.e. OWF), if GPS fixes from at least one trip were located within the boundary of that feature (or development).
We therefore determined the number of individual herring gulls that overlapped with several features of interest across breeding and non-breeding seasons combined across all years: landfill sites (SEPA, 2022; Environment Agency, 2023); harbours/ports where fishery landings occur (obtained from the Marine Directorate in December 2023); airports in Scotland (HDX, 2020); onshore wind farms in Scotland (Scottish Government, 2024, which includes wind farms that are installed, consented, in planning or at the scoping/proposed stage); other islands within the Firth of Forth; and other UK SPAs (JNCC, 2022).
As we were particularly interested in the overlap of the tracked herring gulls with OWFs we determined the overlap of individuals for each year, and for the breeding and non-breeding seasons separately. We also used a time-in-area (TIA) approach to assess the utilisation distribution (i.e. where an individual is likely to be found) of tracked birds (Soanes et al., 2013; 2015). It has been shown to perform as well as other standard analytical methods, for example Kernel Density Estimation, yet is simpler to apply and can calculate temporal and spatial utilisation in one process (Warwick-Evans et al., 2015). In this method, the time spent in the cells (1 km in the present analysis) of a defined grid is calculated using linear interpolation between successive GPS locations (Sumner, 2016). Time across grid cells is then summed and cumulatively ranked to provide information on overall area use, based on different utilisation contours (e.g. 50 % for core area use and 95 % for total home area use). Based on these calculations, population level home ranges and the spatial overlaps with OWFs, using data from Emodnet (2024), as a percentage of the overall utilisation distribution area are presented. We considered all OWFs currently planned, consented or under construction in UK waters as of May 2024.
Finally, the percentage time spent by each individual within terrestrial or marine environments was determined by interpolating points to 10 second intervals and dividing the sum of all time spent either inside or outside a UK land boundary shapefile respectively by total tracking time. The shapefile assumes terrestrial location down to the mean low water springs and within estuaries where water depth is less than 2 m. Therefore, intertidal habitats are included within the terrestrial classification. Only time spent away from the colony was considered for determining the extent of time individuals spent in terrestrial and marine environments.
Determining habitat use
‘Habitat use’ refers to the identification of the different habitat types overlaid with the GPS fix data from the tracked herring gulls.
To identify habitat use by herring gulls we used the Land Cover Map 2021 (LCM2021) 25 m raster dataset, which uses composite satellite imagery to classify land parcels into 21 land cover classes (Marston et al., 2022). These classes were grouped by different categories including marine, coastal, agricultural and urban.
Given that gulls can target and forage in landfill sites, captured within the urban land cover class (Hunt, 1972; Belant et al., 1998), we also obtained data on the location of operational landfill sites in Scotland between 2015 and 2021 from SEPA (2022). We plotted the coordinates of each landfill in QGIS 3.16.3 (QGIS Development Team, 2020) and used the Google Maps Satellite Imagery base layer to manually draw polygons around each assumed landfill site boundaries. Landfill boundary data for England was obtained as a vector shapefile (Environment Agency, 2023). The two landfill shapefiles were merged and we created a 100 m buffer around each site using the buffer function in the terra R package (Hijmans, 2022). The resulting shapefile was then converted to a raster using the rasterize function in the terra R package (Hijmans, 2022) with the area within a landfill boundary classified as 1 and the areas outside the landfill polygons as 0.
To provide information on the use of ports and harbours that the gulls may have targeted, we obtained the locations of ports with fishery landings data between 2019 and 2023 from a request for data to the Marine Directorate (December 2023). To establish the use of these port/harbour areas by herring gulls, we created a 500 m buffer around each location using the buffer function in the terra R package (Hijmans, 2022). The resulting polygon layer was converted to a raster using the rasterize function in the terra R package (Hijmans, 2022) with the area within a harbour boundary classified as 1 and the areas outside the harbour as 0. Buffers of 100 – 500 m were tested, however, the 500 m buffer was selected as the most sensible to fully incorporate the harbours and associated buildings / infrastructure.
For each GPS fix we extracted the land cover class, and whether the fix overlapped with a landfill site or harbour using the extract_covariatesfunctions in amt (Signer et al., 2019). Where a fix overlapped with a landfill site or harbour, we swapped this habitat with the land cover class to create a single habitat variable. This also enabled us to consider the GPS fixes that were not overlapping with these features.
Determining habitat selection
‘Habitat selection’ refers to the statistical analysis of what habitats the tracked herring gulls are using and whether or not they have a quantifiable preference for a particular habitat type.
For the habitat selection analysis, we split the data by season (breeding and non-breeding) as well as colony. As fewer data were available for Craigleith and Fidra (Table 1), we combined the data from these two colonies given their close spatial proximity. Therefore, we tested whether there were differences in habitat selection between 1) the Isle of May and 2) Craigleith and Fidra combined. As the number of individuals tracked for some years was also low, we combined the data across all five years the birds were tracked.
We used Resource Selection Functions (RSFs) to determine habitat selection of the herring gulls at the population-level, across all individuals (Boyce et al., 2002; Johnson et al., 2006; Fieberg et al., 2021). For this analysis we used all GPS fixes except for those at the colony, which were removed. Within the daily home range (minimum convex polygon) of each individual we created 20 random fixes for each use fix using the hr_mcp and random_points functions in the amt R package (Signer et al., 2019). For each use and random fix we then extracted the land cover class, and whether the fix overlapped with a landfill site or harbour using the extract_covariates functions in amt (Signer et al., 2019). Where a fix overlapped with a landfill site or harbour we swapped this habitat with the land cover class to create a single habitat variable.
To run the RSFs, we performed logistic regressions in the glmmTMB R package (Brooks et al., 2017) with use (1) and available (0) fixes included as a binomial response variable, weighted 1 and 20 respectively. Bird ID was included as a random effect to account for variation between individuals. Ideally, it would have been preferable to include Bird ID and habitat as a random slope to account for individual differences in habitat selection. However, given our categorical habitat variable we did not have enough data for such a model to converge. To compare habitat selection between the herring gulls during 2021 we included a three-way interaction between location (Isle of May versus Craigleith and Fidra combined), season (breeding versus non-breeding) and habitat.
We evaluated all logistic regression models for goodness of fit by calculating the area under the curve (AUC) for receiver operating characteristic curves (ROC) using the pROC R package (Robin et al., 2011). Fitted models with AUC values > 0.7 are considered acceptable (Dardis, 2015).
To determine which habitats individuals had a greater preference for, and whether there were colony differences, as well as between the breeding and non-breeding season we carried out post-hoc contrasts using the emmeans R package (Lenth et al., 2020). For the three-way interactions, contrasts are visualized within interaction levels on the response scale (extent of habitat selection).
Results
Data collected
All location data collected, after cleaning, is shown by season (breeding versus non-breeding; Figure 4), by year (Figure 5) and when colony associated (Figure 6). Maps for individuals showing the data for these classifications can be found in Annex 1. The number of GPS fixes from each year and season (breeding and non-breeding) is shown in Table 3 (with this data shown for when individuals were colony associated in Table A2.1). For most devices sufficient data were collected throughout the year to be useful in the analyses although there was a large amount of individual variation as well as large gaps in data each winter as expected due to poor solar charging conditions. Overall device performance was lower than anticipated with several malfunctions and several more with sudden loss of data. Bird mortality could not be ruled out in some of these cases. Therefore, several individual-years were removed from the analyses due to small amounts of data collected (Table 3).
Broadly most gull movements from the colonies were to terrestrial (including coastal) areas with a potential southerly bias for those from Craigleith and Fidra, whilst movements north and west from the Isle of May colony were common (Figure 4). Although a relatively large number of GPS fixes were recorded as being marine, this tended to be from birds commuting to terrestrial foraging sites rather than spending much time at sea. There were some individual differences in where individuals foraged, and whether they remained resident during the non-breeding season or dispersed (Figure 7, 8, Annex 1). Over the study period, six individuals dispersed away from the Firth of Forth during the non-breeding season (Isle of May - 3 individuals, Fidra - 2 and Craigleith – 1) in a southerly direction from the colony as far south as Wiltshire, England (maximum distance from the colony of 530 km; Table 5), with several wintering in the northern half of England, and another individual heading in south-west direction in Scotland (Figure 9, Annex 1). Most individuals remained around the Firth of Forth throughout the year. Many individuals returned to their colony during at least part of the non-breeding season, potentially to roost overnight, as can be seen by the higher number of fixes within the Colony Associated period for each individual when compared to that within the defined breeding season (March – September; Table 3, Table A2.1). There were some spatial differences in where the herring gulls from the three colonies were distributed across the five years of the study, however, these differences are likely attributed to variation between individuals. Unfortunately, the sample sizes were too small across the five years to adequately test for annual variation in distributions, foraging metrics or habitat selection.
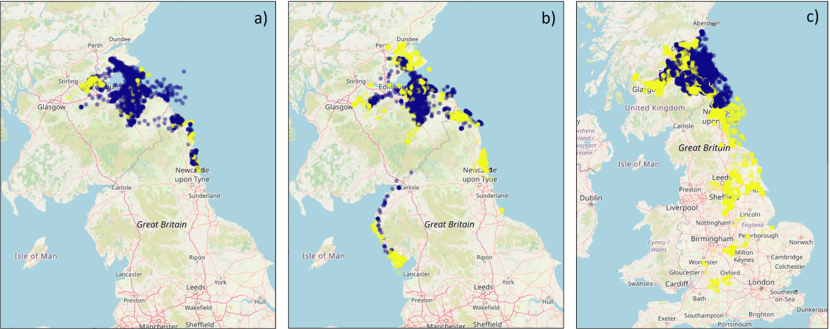
Figure 4. Three maps of the UK, one for each colony, showing all GPS fixes by season.
Click for a full description
View a larger version of this image.
GPS fixes recorded from tracked herring gulls breeding within the Forth Islands SPA, coloured by season (Breeding – purple; Non-breeding – Yellow), from the 2019 to 2023 breeding seasons. The numbers of individuals tagged from each colony were: a) Craigleith: n = 5, b) Fidra: n = 9 and c) the Isle of May: n = 14. Note that plot c is at a different spatial scale to a and b to show the data for individuals dispersing to the south of England.
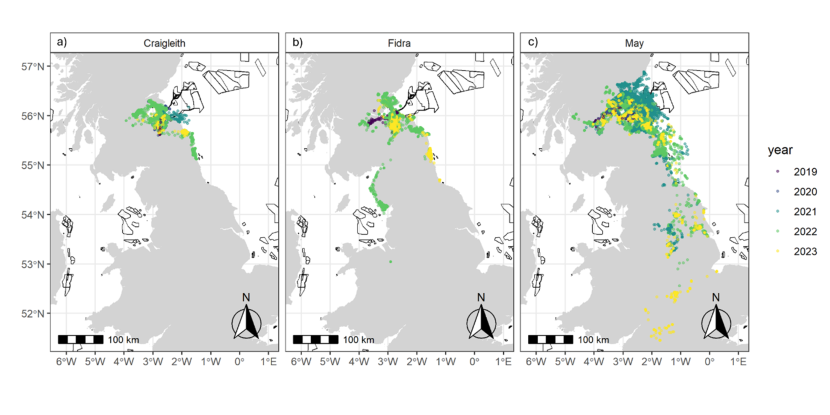
Figure 5. Three maps of the UK, one for each colony, showing all GPS fixes by year. Also shown are the outlines of offshore wind farm developments.
Click for a full description
View a larger version of this image.
GPS fixes recorded from tracked herring gulls breeding within the Forth Islands SPA, coloured by year, from the 2019 to 2023 breeding seasons. The numbers of individuals tagged from each colony were: a) Craigleith: n = 5, b) Fidra: n = 9 and c) the Isle of May: n = 14. The outlines of offshore wind farm areas that are planned, consented, under construction or operational are shown in black (EMODnet, 2024).
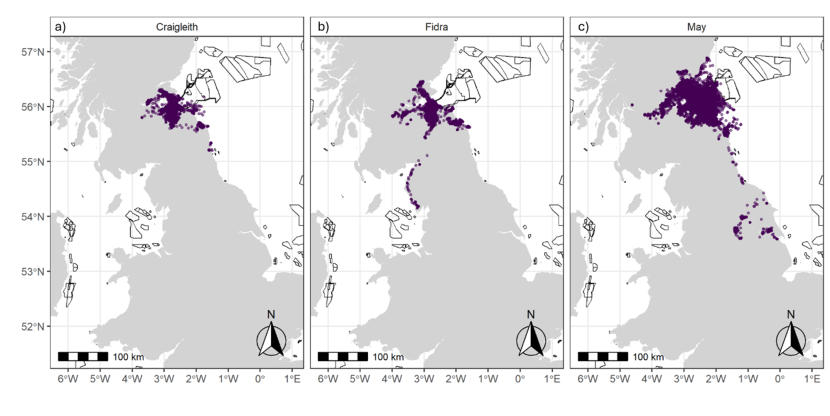
Figure 6. Three maps of the UK, one for each colony, showing all GPS fixes classified as during the Colony Associated period. Also shown are the outlines of offshore wind farm developments.
Click for a full description
View a larger version of this image.
GPS fixes recorded from tracked herring gulls breeding within the Forth Islands SPA, classified as during the Colony Associated period from the 2019 to 2023 breeding seasons. The numbers of individuals tagged from each colony were: a) Craigleith: n = 5, b) Fidra: n = 9 and c) the Isle of May: n = 14. The outlines of offshore wind farm areas that are planned, consented, under construction or operational are shown in black (EMODnet, 2024).
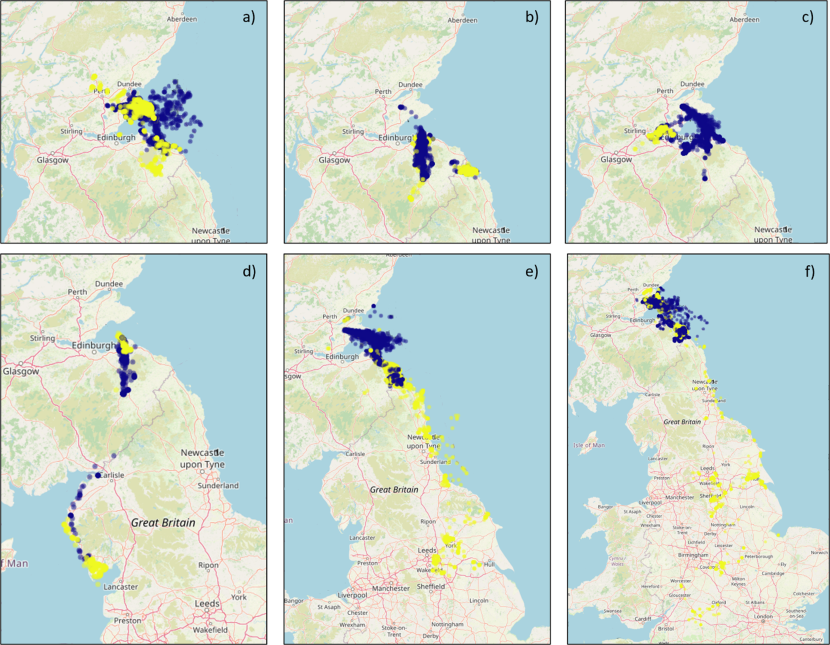
Figure 7. Six maps of the UK showing the GPS fixes of several different individual herring gulls by season.
Click for a full description
View a larger version of this image.
GPS fixes recorded from examples of individual tracked herring gulls breeding within the Forth Islands SPA, coloured by season (Breeding – purple; Non-breeding – Yellow), from the 2019 to 2023 breeding seasons: a) a largely marine individual; b) a largely inland and coastal individual; c) a mixed marine, coastal and inland individual; d) a westerly movement example; e) an easterly movement example; and f) a southerly movement example. Note that the plots are shown at different spatial scales in order to best show the data.
| Colony | Deployed | Tag ID | 2019 Breeding | 2019-2020 Non-breeding | 2020 Breeding | 2020-2021 Non-breeding | 2021 Breeding | 2021-2022 Non-breeding | 2022 Breeding | 2022-2023 Non-breeding | 2023 Breeding |
|---|---|---|---|---|---|---|---|---|---|---|---|
| Craigleith | 2019 | 1400 | 2836 | 1773 | 6320 | 1530 | 1841 | 834 | - | - | - |
| Craigleith | 2022 | 1602 | - | - | - | - | - | - | 785 | 87 | - |
| Craigleith | 2022 | 1619 | - | - | - | - | - | - | 2460 | - | - |
| Craigleith | 2022 | 1642 | - | - | - | - | - | - | 3027 | 977 | 4348 |
| Craigleith | 2022 | 1646 | - | - | - | - | - | - | 4333 | 1219 | - |
| Fidra | 2019 | 1403 | 3077 | 1348 | 59 | - | - | - | - | - | - |
| Fidra | 2019 | 1407 | 3058 | 1786 | - | - | - | - | - | - | - |
| Fidra | 2022 | 1620 | - | - | - | - | - | - | 4338 | 2279 | 6316 |
| Fidra | 2022 | 1626 | - | - | - | - | - | - | 1586 | 504 | - |
| Fidra | 2022 | 1628 | - | - | - | - | - | - | 4575 | 1589 | 565* |
| Fidra | 2022 | 1631 | - | - | - | - | - | - | 3572 | 1316 | 4923 |
| Fidra | 2022 | 1643 | - | - | - | - | - | - | 1223 | - | - |
| Fidra | 2022 | 1644 | - | - | - | - | - | - | 3263 | 705 | - |
| Fidra | 2022 | 1645 | - | - | - | - | - | - | 4370 | 2074 | 4250 |
| Isle of May | 2019 | 1399 | 2963 | 1389 | - | - | - | - | - | - | - |
| Isle of May | 2019 | 1402 | 2996 | 1881 | 4576 | 1055 | - | - | - | - | - |
| Isle of May | 2021 | 1600 | - | - | - | - | 3250 | 127 | - | - | - |
| Isle of May | 2021 | 1601 | - | - | - | - | 37* | - | - | - | - |
| Isle of May | 2021 | 1617 | - | - | - | - | 3571 | 1791 | 5532 | 2020 | 6220 |
| Isle of May | 2021 | 1618 | - | - | - | - | 4173 | 1238 | 6042 | 1322 | - |
| Isle of May | 2021 | 1621 | - | - | - | - | 4409 | 1681 | 6152 | 1436 | 164* |
| Isle of May | 2021 | 1622 | - | - | - | - | 2602 | 1244 | 4506 | 257 | - |
| Isle of May | 2021 | 1623 | - | - | - | - | 3669 | 1631 | 6025 | 2159 | 5673 |
| Isle of May | 2021 | 1624 | - | - | - | - | 3562 | 1237 | 112 | - | - |
| Isle of May | 2021 | 1625 | - | - | - | - | 2713 | - | - | - | - |
| Isle of May | 2021 | 1627 | - | - | - | - | 4149 | 1694 | 6473 | 2150 | 7029 |
| Isle of May | 2021 | 1629 | - | - | - | - | 3889 | 1620 | 2877 | 13* | 1205 |
| Isle of May | 2021 | 1630 | - | - | - | - | 3371 | 1515 | 5068 | 2289 | 2805 |
| Isle of May | 2021 | 1632 | - | - | - | - | 2776 | 1254 | 3615 | 237 | 4591 |
| Isle of May | 2021 | 1633 | - | - | - | - | - | - | - | - | - |
Foraging movements
Across all colonies and years, over 7000 discrete foraging trips were recorded during the breeding season, although due to individual sample sizes there was a bias for data collected from the Isle of May during 2021 and 2022 (Table 4). Foraging ranges during the breeding season were broadly similar across colonies although trip duration was shorter for individuals tracked from Fidra, with all individuals remaining within 100 km of their colonies. On average, individuals tracked from the Isle of May had greater foraging ranges and travelled further during trips compared to those from Craigleith and especially Fidra. However, there were differences across the colonies and years attributed to variation among individuals.
During the non-breeding season, the mean and mean maximum distances travelled by individuals from Craigleith and Fidra were similar whilst those tracked from Isle of May travelled further on average away from the breeding area (Table 5). The maximum distance travelled was greater for Fidra and the Isle of May due to specific individuals from these colonies (Fidra - 1, Isle of May - 3) dispersing further south than the small number tracked from Craigleith. A relatively small number of individuals dispersed away from the Firth of Forth region in a westerly or southerly direction. Most individuals remained resident within a similar or extended area to that used during the breeding season (Annex 1). This individual variation resulted in considerable variation among colonies and years in the mean and maximum distances individuals moved during the non-breeding season (Table 5).
Breeding season (March – August) foraging trip summaries for herring gulls fitted with GPS devices in the Forth Islands SPA between 2019-2023. Any incomplete trips where data collection was truncated were excluded.
| Colony | Year | No. of birds | No. of trips (incomplete) | Trip duration (days) mean ± SD (max) | Foraging range (km) mean max ± SD (max) | Cumulative distance per trip (km) mean ± SD (max) |
|---|---|---|---|---|---|---|
| Craigleith | 2019 | 1 | 106 (0) | 0.55 ± 0.95 (6.79) | 15.14 ± 11.11 (51.73) | 41.83 ± 40.01 (250.07) |
| Craigleith | 2020 | 1 | 131 (5) | 1.08 ± 2.65 (18.07) | 15.74 ± 11.49 (52.98) | 63.29 ± 102.62 (751.16) |
| Craigleith | 2021 | 1 | 170 (26) | 0.39 ± 0.23 (1.36) | 16.21 ± 10.91 (63.3) | 37.01 ± 29.25 (231.25) |
| Craigleith | 2022 | 4 | 439 (51) | 0.23 ± 0.39 (5.8) | 15.46 ± 14.3 (68.03) | 35.47 ± 36 (311.21) |
| Craigleith | 2022 | 1 | 208 (55) | 0.23 ± 0.18 (0.79) | 15.25 ± 15.06 (51.73) | 32.22 ± 32.12 (143.26) |
| Craigleith | All | 5 | 1054 (137) | 0.41 ± 1.11 (18.07) | 15.54 ± 13.22 (68.03) | 39.73 ± 50.67 (751.16) |
| Fidra | 2019 | 2 | 388 (2) | 0.35± 1.37 (24.54) | 7.15 ± 11.31 (64.61) | 19.56 ± 51.67 (776.51) |
| Fidra | 2020 | - | - | - | - | - |
| Fidra | 2021 | - | - | - | - | - |
| Fidra | 2022 | 6 | 861 (145) | 0.31 ± 0.37 (6.75) | 11.39 ± 13.1 (91.31) | 25.93 ± 29.66 (303.45) |
| Fidra | 2023 | 3 | 592 (133) | 0.38 ± 0.34 (4.69) | 14.2 ± 12.54 (51.14) | 31.93 ± 28.27 (182.58) |
| Fidra | All | 9 | 1841 (280) | 0.34 ± 0.75 (24.54) | 11.17 ± 12.77 (91.31) | 26.12 ± 36.29 (776.51) |
| Isle of May | 2019 | 2 | 135 (0) | 0.50 ± 1.37 (13.86) | 22.43 ± 11.32 (61.03) | 51.71 ± 52.68 (483.10) |
| Isle of May | 2020 | 1 | 40 (2) | 1.06 ± 4.09 (25.45) | 26.49 ± 18.98 (89.64) | 76.51 ± 141.46 (836.17) |
| Isle of May | 2021 | 12 | 1387 (116) | 0.43 ± 1.10 (30.89) | 24.4 ± 13.00 (96.80) | 55.7 ± 53.61 (1087.73) |
| Isle of May | 2022 | 9 | 1633 (364) | 0.46 ± 0.44 (6.84) | 22.08 ± 11.20 (53.35) | 48.12 ± 32.98 (309.22) |
| Isle of May | 2023 | 6 | 936 (204) | 0.44 ± 0.62 (12.86) | 20.76 ± 10.03 (57.89) | 44.27 ± 34.46 (451.67) |
| Isle of May | All | 14 | 4131 (686) | 0.45 ± 0.93 (30.89) | 22.72 ± 11.87 (96.8) | 50.55 ± 45.42 (1087.73) |
| Colony | Non-breeding season | No. of birds | No. of fixes | Distance from breeding colony (km) mean ± SD (max) | Mean maximum distance from breeding colony (km) |
|---|---|---|---|---|---|
| Craigleith | 2019/2020 | 1 | 1773 | 20.64 ± 4.52 (59.23) | 59.23 |
| Craigleith | 2020/2021 | 1 | 1530 | 19.84 ± 4.35 (39.37) | 39.37 |
| Craigleith | 2021/2022 | 1 | 834 | 19.39 ± 3.87 (26.93) | 26.93 |
| Craigleith | 2022/2023 | 3 | 2283 | 67.22 ± 13.46 (135.83) | 118.58 |
| Craigleith | All | 5 | 6420 | 36.80 ± 24.2 (135.83) | 104.00 |
| Fidra | 2019/2020 | 2 | 3134 | 24.51 ± 8.09 (39.79) | 29.7 |
| Fidra | 2020/2021 | - | - | - | - |
| Fidra | 2021/2022 | - | - | - | - |
| Fidra | 2022/2023 | 6 | 8467 | 44.29 ± 42.67 (350.49) | 139.26 |
| Fidra | All | 8 | 11601 | 39.00 ± 37.70 (350.49) | 112.00 |
| Isle of May | 2019/2020 | 2 | 3270 | 23.43 ± 10.14 (98.17) | 63.25 |
| Isle of May | 2020/2021 | 1 | 1055 | 22.46 ± 2.95 (30.30) | 30.30 |
| Isle of May | 2021/2022 | 11 | 15032 | 61.65 ± 77.57 (336.46) | 124.47 |
| Isle of May | 2022/2023 | 8 | 11870 | 51.53 ± 86.83 (529.26) | 159.72 |
| Isle of May | All | 13 | 31227 | 52.50 ± 77.00 (529.26) | 131.00 |
Spatial distribution and overlap with features of interest
The population-level home and core ranges of herring gulls for each colony, across years further show that the marine environment was rarely used by individuals, with instead terrestrial and coastal habitats predominantly targeted (breeding season: Figure 8; non-breeding season: Figure 9). During the breeding season, across all years, there were differences in the spatial distribution of the herring gulls tracked from Craigleith and Fidra compared to those tracked from the Isle of May. An area of mainland Lothian to the south of Craigleith and Fidra (from the coast to < 50 km inland) was used to the greatest extent by tracked individuals from these two colonies, with coastal and agricultural habitats largely being used (Figure 8 a, b). Specific hotspots were associated with an area of coastline south of Bewick-upon-Tweed, as well as with the Ladybank Landfill site in Fife. Further hotspots included Lochhead Landfill and the urban areas of Dunfermline for Craigleith and Levenseat Landfill for Fidra. In comparison, although individuals tracked from the Isle of May did visit the Lothian coastline, and that south of Bewick-upon-Tweed to some extent, the most important hotspots were associated with coastal and harbour locations and agricultural areas in Fife including Ladybank Landfill (Figure 8 c). Hotspots associated with specific habitats during the breeding season are shown in Figure 10.
During the non-breeding season, across all years, similar areas for each colony were targeted as were during the breeding season, likely driven by resident individuals that remained within the area. Hotspots of high activity of individuals that dispersed away from the breeding area included to a landfill site near Ellington and to Barrow-in-Furness, both in north-east England (Figure 9 a, b). For Fidra, there was also a hotspot along the River Tay, to the north of the Firth of Forth. For individuals tracked from the Isle of May, hotspots remained across Fife and Lothian as well as all along the coast south to the Humber Estuary. Individuals also targeted urban areas near York, Leeds and Sheffield (Figure 9 c).
Landfill sites were used by individuals from all three colonies across the breeding and non-breeding seasons in Scotland, as well as to a lesser extent in England by individuals that dispersed south during the non-breeding season (Table 6). Hotspots also corresponded with harbours that multiple tracked herring gulls targeted throughout the year: specifically, Anstruther, Pittenweem, St Monans and Crail by individuals from the Isle of May; and North Berwick by all individuals from Craigleith as well as several from Fidra and the Isle of May (Table 7). Few individuals were found to overlap with active airports in the region (Table 8).
Across the study period, individuals from the three colonies occasionally visited other islands within the Firth of Forth, especially individuals from the Isle of May (Table 9, Figure A3.1). This typically occurred during the non-breeding season so likely involved individuals roosting on these islands, especially at night. As far as we are aware all individuals continued to breed at the colony they were originally caught at. Individuals also overlapped with a range of other designated SPAs over the study period outwith the Forth Islands SPA, and the Outer Firth of Forth and St Andrews Bay Complex (Table 10).
The sizes of the population-level home and core ranges (UDs) by colony and season are shown in Table 11, as well as the spatial overlaps with the nearby OWFs. There was very little overlap with the OWFs from the limited sample of tracked individuals (< 0.01 % of time away from the colony for all colonies, individuals and years). During the breeding season, although the spatial overlap was low, most individuals from Fidra and Craigleith had fixes within at least one of the OWFs areas, particularly during 2022 (Table 3.10, Table A4.1). Individuals from the Isle of May visited the footprints of several offshore wind farm developments which at most represented about 3 % spatial overlap of the herring gulls’ combined 95 % UD areas and up to 7 % of the combined 100 % UD areas in any given year (Table 11, Table A4.1). These higher values were for individuals from the Isle of May during the 2021 breeding season where 10 of the 12 tracked gulls passed through an OWF footprint at least once. The spatial overlap in the other years was lower, however although few tracked individuals used the marine environment as a foraging habitat, several individuals did pass through an OWF area at least once.
During the non-breeding season, only one individual from Craigleith overlapped with any of the OWF areas (during the 2022/2023 non-breeding season), whilst several Fidra individuals overlapped with at least one OWF although again the extent of spatial overlap was low (Table 3.10, Table A34.2). Fewer individuals from the Isle of May overlapped with OWF areas during the non-breeding than the breeding season (Table 11, Table A4.2). Across all colonies and non-breeding season, the spatial overlap of the tracked herring gulls was less than 1 % of their combined 100 % UD areas. There was no spatial overlap between any of the OWFs with the herring gulls’ core ranges (50 % UD areas) during the breeding or non-breeding season (Table 11). At the time of the study all OWFs that the herring gulls overlapped with had a status of proposed / consented except for Neart na Gaoithe which was under construction (Table A4.1, Table A4.2).
Although not the main focus of this report, across the three colonies all but one individual (from Fidra) were found to overlap with at least one proposed and installed onshore wind farm footprint over the study period, with most overlapping with multiple footprints (Table 12).
Comparing the proportion of time the tracked herring gulls spent in terrestrial versus marine environments, across all individuals, there was a strong preference for terrestrial use (Table 13) with most individuals spending > 90 % of time spent away from the colony on land, throughout the year. Specifically, across all colonies and individuals, herring gulls spent an average of 94.3 ± 4.2 % of their time away from the colony in terrestrial environments (including coastal habitats) during the breeding season, and 92.9 ± 7.3 % of their time during the non-breeding season.
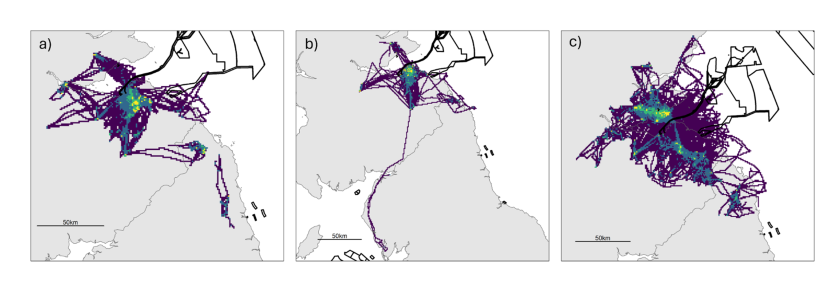
Figure 8. Three maps of the study area, one for each colony, showing the spatial distribution of the tracked herring gulls during the breeding season using utilisation distributions. Also shown are the outlines of offshore wind farm developments.
Click for a full description
View a larger version of this image.
Breeding season utilisation distributions (UDs; Purple = 100 % UD, dark blue = 95 % UD, green = 75 % UD, yellow = 50 % UD.) calculated using a Time-In-Area approach for all herring gulls fitted with GPS devices in the Forth Islands SPA in 2019-2022 for a) Craigleith, b) Fidra and c) Isle of May. The outlines of offshore wind farm areas that are planned, consented, under construction or operational are shown in black (EMODnet, 2024). Note that the plots are shown at different spatial scales to best show the data.
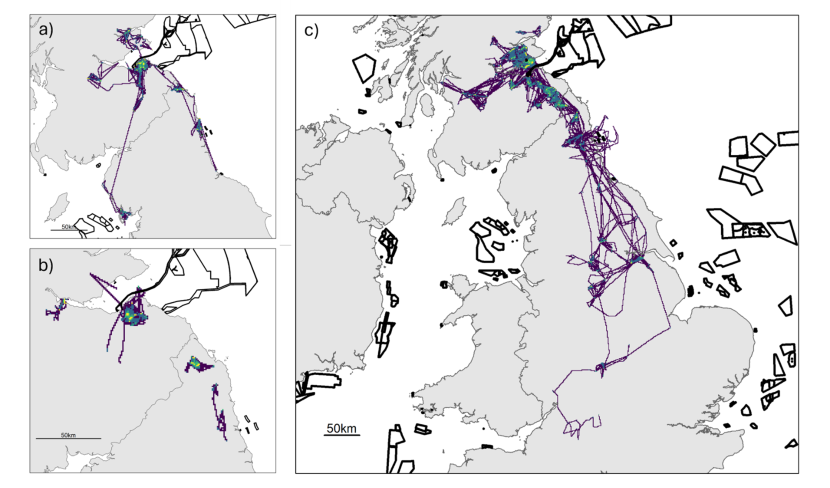
Figure 9. Three maps of the study area, one for each colony, showing the spatial distribution of the tracked herring gulls during the non-breeding season using utilisation distributions. Also shown are the outlines of offshore wind farm developments.
Click for a full description
View larger version of this image.
Non-breeding season utilisation distributions (UDs; Purple = 100 % UD, dark blue = 95% UD, green = 75 % UD, yellow = 50 % UD.) calculated using a Time-In-Area approach for all herring gulls fitted with GPS devices in the Forth Islands SPA in 2019-2022 for a) Craigleith, b) Fidra and c) Isle of May. The outlines of offshore wind farm areas that are planned, consented, under construction or operational are shown in black (EMODnet, 2024). Note that the plots are shown at different spatial scales to best show the data.
| Country | Landfill site | Longitude | Latitude | Number (%) of birds which overlapping with each landfill site Craigleith (n=5) | Number (%) of birds which overlapping with each landfill site Fidra (n=9) | Number (%) of birds which overlapping with each landfill site Isle of May (n=14) |
|---|---|---|---|---|---|---|
| Scotland | Binn Landfill, Binn Farm, Glenfarg | -3.33342 | 56.31004 | - | 2 (22.2) | 3 (21.4) |
| Scotland | Ramornie Sand Pit Landfill, Ladybank | -3.10936 | 56.27701 | 2 (40.0) | 5 (55.6) | 12 (85.7) |
| Scotland | Lochhead Landfill, Dunfermline | -3.47667 | 56.09651 | 2 (40.0) | 2 (22.2) | 2 (14.3) |
| Scotland | Valleyfield Ash Lagoons, Dunfermline | -3.60237 | 56.05296 | - | - | 1 (7.1) |
| Scotland | Avondale Landfill, Polmont | -3.67888 | 55.99024 | 1 (20.0) | - | 1 (7.1) |
| Scotland | Dunbar Landfill | -2.45123 | 55.96942 | 4 (80.0) | 4 (44.4) | 10 (71.4) |
| Scotland | Greengairs Landfill, Airdrie | -3.93872 | 55.90603 | 1 (20.0) | - | 1 (7.1) |
| Scotland | Levenseat, Lanark | -3.68781 | 55.7992 | 1 (20.0) | 4 (44.4) | 1 (7.1) |
| Scotland | Easter Langlee Landfill, Galashiels | -2.76637 | 55.62042 | 4 (80.0) | 5 (55.6) | - |
| England | Alcan Ash Lagoons 1-4, Ashington | -1.53902 | 55.20069 | - | 1 (11.1) | - |
| England | Ellington Road Landfill, Ashington | -1.58964 | 55.1971 | 2 (40.0) | 1 (11.1) | 2 (14.3) |
| England | Aycliffe Quarry Landfill Site, Darlington | -1.55813 | 54.59292 | - | - | 1 (7.1) |
| England | Seamer Carr Landfill Site, Scarborough | -0.41695 | 54.22691 | - | - | 1 (7.1) |
| England | Harewood Whin Landfill, Rufforth | -1.18468 | 53.95503 | - | - | 1 (7.1) |
| England | Escrick Brickworks, Escrick | -1.04976 | 53.85696 | - | - | 1 (7.1) |
| England | Escrick Soil Landfill Site, Escrick | -1.05751 | 53.85575 | - | - | 1 (7.1) |
| England | Peckfield Landfill Site, Leeds | -1.34276 | 53.78702 | - | - | 2 (14.3) |
| England | Welbeck Landfill Site, Wakefield | -1.45416 | 53.69401 | - | - | 1 (7.1) |
| England | Roxby Landfill, Scunthorpe | -0.62465 | 53.64331 | - | - | 1 (7.1) |
| England | Immingham Landfill, Immingham | -0.18663 | 53.6097 | - | - | 1 (7.1) |
| England | Skelbrooke Landfill Extension, Doncaster | -1.23461 | 53.5996 | - | - | 1 (7.1) |
| England | Hazel Lane Quarry, Doncaster | -1.24457 | 53.59139 | - | - | 2 (14.3) |
| England | Erin Landfill, Chesterfield | -1.3285 | 53.25212 | - | - | 1 (7.1) |
| England | Rushton Landfill, Rushton | -0.7544 | 52.44259 | - | - | 1 (7.1) |
| England | Cotesbach Landfill, Lutterworth | -1.20739 | 52.42073 | - | - | 1 (7.1) |
| England | Glebe Farm Landfill, Coventry | -1.46563 | 52.34487 | - | - | 1 (7.1) |
| Harbour | Number (%) of birds overlapping with each harbour Craigleith (n = 5) | Number (%) of birds overlapping with each harbour Fidra (n = 9) | Number (%) of birds overlapping with each harbour Isle of May (n = 14) |
|---|---|---|---|
| Anstruther | 1 (20) | - | 14 (100) |
| Arbroath | - | - | 2 (14) |
| Crail | - | - | 9 (64) |
| Elie | 2 (40) | - | 3 (21) |
| Gourdon | - | - | - |
| Johnshaven | - | - | - |
| Kirkcaldy | 1 (20) | - | - |
| Methil and Leven | - | - | 2 (14) |
| Montrose | - | - | 3 (21) |
| Newhaven | - | 1 (11) | 1 (7) |
| North Berwick | 5 (100) | 4 (44) | 6 (43) |
| Pettycur | - | - | 1 (7) |
| Pittenweem | 1 (20) | - | 13 (93) |
| St Abbs | 1 (20) | - | 7 (50) |
| St Andrews | - | - | 6 (43) |
| St Monans | 1 (20) | - | 13 (93) |
| West Wemyss | - | - | - |
| Airport | Number (%) of birds overlapping with each airport Craigleith (n = 5) | Number (%) of birds overlapping with each airport Fidra (n = 9) | Number (%) of birds overlapping with each airport Isle of May (n = 14) |
|---|---|---|---|
| Archerfield Airstrip, North Berwick | - | 1 (11) | - |
| Dundee Airport | - | 1 (11) | - |
| Leuchars Station (RAF) | - | - | 2 (14) |
| Raceway Paddock (abandoned) | 1 (20) | 2 (22) | 1 (7) |
| Firth of Forth Island | Number (%) of birds overlapping with each island Craigleith (n = 5) | Number (%) of birds overlapping with each island Fidra (n = 9) | Number (%) of birds overlapping with each island Isle of May (n = 14) |
|---|---|---|---|
| Bass Rock | 1 (20) | 1 (11) | 3 (21) |
| Craigleith | NA | 4 (44) | 9 (64) |
| Cramona | - | - | - |
| Fidra | 2 (40) | NA | 6 (43) |
| Inchcolm | 1 (20) | 2 (22) | 3 (21) |
| Inchgarvie | - | - | 1 (7) |
| Inchkeith | - | - | 3 (21) |
| Inchmickery | - | - | 1 (7) |
| Isle of May | 1 (20) | 1 (11) | NA |
| SPA | Number (%) of birds overlapping with each SPA Craigleith (n = 5) | Number (%) of birds overlapping with each SPA Fidra (n = 9) | Number (%) of birds overlapping with each SPA Isle of May (n = 14) |
|---|---|---|---|
| Cameron Reservoir | - | - | 9 (64) |
| Coquet Island | 2 (40) | 1 (11) | 2 (14) |
| Fala Flow | - | 1 (11) | - |
| Farne Islands | 2 (40) | 2 (22) | 3 (21) |
| Firth of Forth | 5 (100) | 9 (100) | 13 (93) |
| Firth of Tay & Eden Estuary | - | 2 (22) | 8 (57) |
| Greenlaw Moor | - | - | 2 (14) |
| Holburn Lake and Moss | - | 1 (11) | 1 (7) |
| Hornsea Mere | - | - | 1 (7) |
| Humber Estuary | - | - | 2 (14) |
| Inner Clyde Estuary | - | - | 1 (7) |
| Lindisfarne | 1 (20) | 3 (33) | 3 (21) |
| Loch Leven | - | - | 4 (29) |
| Lower Derwent Valley | - | - | 1 (7) |
| Montrose Basin | - | - | 1 (7) |
| Morecambe Bay and Duddon Estuary | - | 1 (11) | - |
| North York Moors | - | - | 1 (7) |
| Northumberland Marine | 2 (40) | 3 (33) | 4 (29) |
| Northumbria Coast | 2 (40) | 1 (11) | 2 (14) |
| Outer Firth of Forth and St Andrews Bay Complex | 5 (100) | 9 (100) | 14 (100) |
| Rutland Water | - | - | 1 (7) |
| Solway Firth | - | 1 (11) | - |
| St Abb's Head to Fast Castle | 1 (20) | 3 (33) | 8 (57) |
| Teesmouth and Cleveland Coast | - | - | 2 (14) |
| The Wash | - | - | 1 (7) |
| Westwater | - | 1 (11) | - |
| Breeding Colony | Year | N birds | UD area (km2) 50 | UD area (km2) 95 | UD area (km2) 100 | Total spatial overlap (% of area) with all OWFs 50 | Total spatial overlap (% of area) with all OWFs 95 | Total spatial overlap (% of area) with all OWFs 100 | N individuals overlapping with OWFs |
|---|---|---|---|---|---|---|---|---|---|
| Craigleith | 2019 | 1 | 1 | 15 | 167 | 0 | 0 | 0 | 0 |
| Craigleith | 2020 | 1 | 1 | 19 | 190 | 0 | 0 | 0 | 0 |
| Craigleith | 2021 | 1 | 1 | 36 | 546 | 0 | 0 | 0 | 0 |
| Craigleith | 2022 | 4 | 4 | 28 | 873 | 0 | 1.17 | 1.26 | 4 |
| Craigleith | 2023 | 1 | 1 | 35 | 463 | 0 | 0 | 0 | 0 |
| Fidra | 2019 | 2 | 2 | 5 | 139 | 0 | 0.27 | 0.59 | 1 |
| Fidra | 2020 | - | - | - | - | - | - | - | - |
| Fidra | 2021 | - | - | - | - | - | - | - | - |
| Fidra | 2022 | 6 | 6 | 22 | 425 | 0 | 0.61 | 0.82 | 5 |
| Fidra | 2023 | 3 | 3 | 48 | 447 | 0 | 0 | 0.8 | 2 |
| Isle of May | 2019 | 2 | 2 | 10 | 254 | 0 | 0.03 | 1.18 | 2 |
| Isle of May | 2020 | 1 | 1 | 22 | 327 | 0 | 0 | 0 | 0 |
| Isle of May | 2021 | 12 | 12 | 61 | 1774 | 0 | 3.07 | 6.85 | 10 |
| Isle of May | 2022 | 9 | 9 | 62 | 1110 | 0 | 0.44 | 2.25 | 9 |
| Isle of May | 2023 | 6 | 6 | 31 | 638 | 0 | 0.37 | 2.46 | 5 |
| Non-Breeding Colony | Year Winter | N birds | UD area (km2) 50 | UD area (km2) 95 | UD area (km2) 100 | Total spatial overlap (% of area) with all OWFs 50 | Total spatial overlap (% of area) with all OWFs 95 | Total spatial overlap (% of area) with all OWFs 100 | N individuals overlapping with OWFs |
|---|---|---|---|---|---|---|---|---|---|
| Craigleith | 2019/2020 | 1 | 8 | 79 | 252 | 0 | 0 | 0 | 0 |
| Craigleith | 2020/2021 | 1 | 23 | 178 | 390 | 0 | 0 | 0 | 0 |
| Craigleith | 2021/2022 | 1 | 8 | 73 | 139 | 0 | 0 | 0 | 0 |
| Craigleith | 2022/2023 | 3 | 12 | 105 | 405 | 0 | 0 | 0.02 | 1 |
| Fidra | 2019/2020 | 2 | 2 | 69 | 252 | 0 | 1.69 | 0.65 | 1 |
| Fidra | 2020/2021 | - | - | - | - | - | - | - | - |
| Fidra | 2021/2022 | - | - | - | - | - | - | - | - |
| Fidra | 2022/2023 | 6 | 72 | 938 | 3006 | 0 | 0.16 | 0.27 | 4 |
| Isle of May | 2019/2020 | 2 | 7 | 119 | 406 | 0 | 0.01 | 0 | 1 |
| Isle of May | 2020/2021 | 1 | 2 | 40 | 98 | 0 | 0 | 0 | 0 |
| Isle of May | 2021/2022 | 11 | 128 | 2382 | 9720 | 0 | 0.01 | 0.01 | 7 |
| Isle of May | 2022/2023 | 8 | 68 | 1481 | 6308 | 0 | 0.01 | 0.01 | 5 |
| Onshore wind farm | - | Number (%) of birds overlapping with each onshore wind farm Craigleith (n = 5) | Number (%) of birds overlapping with each onshore wind farm Fidra (n = 9) | Number (%) of birds overlapping with each onshore wind farm (n = 14) |
|---|---|---|---|---|
| Clatto Farm | Application | 2 (22) | 1 (20) | 6 (43) |
| Ditcher Law | Application | 5 (56) | 2 (40) | 2 (14) |
| Lingo Farm | Application | - | - | 9 (64) |
| Aikengall | Installed | - | 2 (40) | 6 (43) |
| Troywood | Application | - | - | 8 (57) |
| Binn Eco Park wind farm, Glenfarg | Approved | 1 (11) | - | 6 (43) |
| Proposed Wind farm at Binn Farm by Glenfarg | Application | 1 (11) | - | 6 (43) |
| Dunside Wind Farm - Scottish Borders | Application | 2 (22) | 3 (60) | 1 (7) |
| Kenly Wind Farm | Approved | 1 (11) | - | 5 (36) |
| Land at Bonerbo, Balmonth and Drumrack Farms | Application | - | - | 6 (43) |
| Dun Law | Installed | 5 (56) | - | - |
| Dun Law Extension | Installed | 5 (56) | - | - |
| Dun Law Proposed 3 Turbine Extension | Scoping | 3 (33) | 1 (20) | 1 (7) |
| Kinegar Quarry Wind Energy Scheme | Approved | - | - | 5 (36) |
| Longcroft | Scoping | 2 (22) | 2 (40) | 1 (7) |
| Crystal Rig | Installed | - | - | 4 (29) |
| Crystal Rig 1a | Installed | - | - | 4 (29) |
| Crystal Rig 2 (extension) | Installed | - | - | 4 (29) |
| Devon Wood Wind Farm | Application | 1 (11) | - | 3 (21) |
| Howpark Wind Farm | Approved | - | - | 4 (29) |
| Penmanshiel | Installed | - | - | 4 (29) |
| Blackmains (Reston) | Scoping | - | - | 3 (21) |
| Crystal Rig Phase III | Installed | - | - | 3 (21) |
| Housebyres Community Wind Co-operative | Scoping | 3 (33) | - | - |
| Longmuir Rig | Scoping | 1 (11) | 1 (20) | 1 (7) |
| Quixwood Moor, Berwickshire | Installed | - | - | 3 (21) |
| Aikengall II (Wester Dod Community Windfarm) | Installed | 1 (11) | - | 1 (7) |
| Aikengall IIa Wind Farm | Approved | - | - | 2 (14) |
| Clentrie Wind Cluster | Application | - | 1 (20) | 1 (7) |
| Crystal Rig Phase IV | Approved | - | - | 2 (14) |
| Drone Hill (Coldingham Moor) | Installed | - | - | 2 (14) |
| Fallago Rig | Installed | 1 (11) | 1 (20) | - |
| Ferneylea 2 | Scoping | - | - | 2 (14) |
| Greengairs | Approved | - | 1 (20) | 1 (7) |
| Michelin Tyre Factory (Dundee) | Installed | - | - | 2 (14) |
| Pogbie | Approved | 2 (22) | - | - |
| Pogbie extension | Application | 2 (22) | - | - |
| Rumbletonrig | Scoping | - | - | 2 (14) |
| Toddleburn | Installed | 1 (11) | 1 (20) | - |
| Tormywheel | Approved | 1 (11) | - | 1 (7) |
| Black Rig - Berwickshire | Scoping | - | - | 1 (7) |
| Blackburn 2023 | Application | - | - | 1 (7) |
| Blairadam | Application | - | - | 1 (7) |
| Bracco | Application | - | - | 1 (7) |
| Brockholes | Installed | - | - | 1 (7) |
| Chesterbank, Lamberton | Application | - | - | 1 (7) |
| Earlseat | Approved | - | 1 (20) | - |
| Forrestfield Windfarm | Application | - | - | 1 (7) |
| Highview, Drone Moss | Application | - | - | 1 (7) |
| Hoprigshiels | Approved | - | - | 1 (7) |
| Huxton Bogbank Wind Farm | Scoping | - | - | 1 (7) |
| Keith Hill (revised proposal) | Approved | 1 (11) | - | - |
| Monashee Wind Turbines | Scoping | - | - | 1 (7) |
| Old Townhead | Scoping | - | - | 1 (7) |
| St John's Hill | Installed | - | - | 1 (7) |
| Torfichen | Application | 1 (11) | - | - |
| Tormywheel extension | Application | 1 (11) | - | - |
| Weetfoot Bog | Scoping | - | - | 1 (7) |
| West Benhar Wind Farm | Approved | - | - | 1 (7) |
| Whitelee Wind Farm (Eaglesham Moor) | Installed | - | - | 1 (7) |
| Wull Muir (Hunt Law / Carcant Extension) | Application | - | 1 (20) | - |
| Colony | Year | Breeding No. of birds | Breeding % time terrestrial | Breeding % time marine |
|---|---|---|---|---|
| Craigleith | 2019 | 1 | 95.0 | 5.0 |
| Craigleith | 2020 | 1 | 96.0 | 4.0 |
| Craigleith | 2021 | 1 | 87.2 | 12.8 |
| Craigleith | 2022 | 4 | 95.5 ± 3.1 | 4.5 ± 3.1 |
| Craigleith | 2023 | 1 | 99.0 | 1.0 |
| Fidra | 2019 | 2 | 99.5 ± 0.4 | 0.5 ± 0.4 |
| Fidra | 2020 | - | - | - |
| Fidra | 2021 | - | - | - |
| Fidra | 2022 | 7 | 97.5 ± 2.1 | 2.5 ± 2.1 |
| Fidra | 2023 | 3 | 99.2 ± 0.8 | 0.8 ± 0.8 |
| Isle of May | 2019 | 2 | 93.4 ±2.3 | 6.6 ± 2.3 |
| Isle of May | 2020 | 1 | 83.8 | 16.2 |
| Isle of May | 2021 | 12 | 91.3 ± 4.0 | 8.7 ± 4.0 |
| Isle of May | 2022 | 9 | 93.7 ± 3.0 | 6.3 ± 3.0 |
| Isle of May | 2023 | 6 | 94.3 ± 3.4 | 5.7 ± 3.4 |
| Colony | Year | Non-Breeding No. of birds | Non-Breeding % time terrestrial | Non-Breeding % time marine |
|---|---|---|---|---|
| Craigleith | 2019 / 2020 | 1 | 92.4 | 7.6 |
| Craigleith | 2020 / 2021 | 1 | 90.7 | 9.3 |
| Craigleith | 2021 / 2022 | 1 | 93.7 | 6.3 |
| Craigleith | 2022 / 2023 | 3 | 91.3 ± 11.4 | 8.7 ± 11.4 |
| Fidra | 2019 / 2020 | 2 | 82.0 ± 25.5 | 18.0 ± 25.5 |
| Fidra | 2020 / 2021 | - | - | - |
| Fidra | 2021 / 2022 | - | - | - |
| Fidra | 2022 / 2023 | 6 | 96.0 ± 4.1 | 4.0 ± 4.1 |
| Isle of May | 2019 / 2020 | 2 | 97.2 ± 4.0 | 2.8 ± 4.0 |
| Isle of May | 2020 / 2021 | 1 | 99.4 | 0.6 |
| Isle of May | 2021 / 2022 | 11 | 91.1 ± 4.1 | 8.92 ± 4.11 |
| Isle of May | 2022 / 2023 | 8 | 94.6 ± 5.6 | 5.4 ± 5.6 |
Habitat use and habitat selection analysis
Comparing the proportion of GPS fixes that were associated with each habitat, after removing colony fixes, the pattern of habitat use was similar between seasons for both the Isle of May and Craigleith/Fidra birds combined (Figure 11). Agricultural habitats were the most used habitat, consistently accounting for around 50 % of overall numbers of fixes. During the breeding season this was followed by coastal habitats accounting for around 20 % of overall number of fixes. The number of fixes falling within marine and landfill habitats was relatively small. However, there was individual variation in habitat use (Figure 11, 12) which particularly indicates some specialism to landfill sites, harbours and urban habitats by individuals.
Evidence for a preference for habitats associated with human activities was apparent from the habitat selection analysis which considered the availability of these habitats in the environment. During the breeding season, although a relatively small proportion of fixes were associated with landfill sites, there was a strong selection for this habitat given its scarcity in the wider environment by herring gulls from both the Isle of May and Craigleith and Fidra combined (Figure 13). The strength of this selection was lower during the non-breeding season; however it was still one of the most preferred habitats during this period.
In addition to landfill, individuals from the Isle of May, also showed a strong selection for coastal, harbour and urban habitats during the breeding season, with a much weaker selection for agricultural habitats (Figure 13). For Craigleith and Fidra combined, coastal and then harbours were also strongly selected for after landfill, followed to a weaker extent by urban and agricultural habitats. Between colonies, individuals tracked from the Isle of May showed stronger selection for landfills and urban habitats than those from Craigleith and Fidra, as well as slightly for agricultural habitats (Figure 14). There was no difference between colonies in the selection strength for coastal or harbour habitats.
During the non-breeding season, herring gulls from the Isle of May showed a similar strong selection for landfill and coastal habitats followed by urban and then harbour habitats, with agricultural habitats selected to a lesser extent. Across both seasons there was limited use of marine habitats by gulls from the Isle of May (Figure 13). For Craigleith and Fidra combined, coastal habitat was the most selected habitat after landfill during the non-breeding season, followed by harbours to a lesser extent, as well as urban, marine and agriculture habitats (Figure 13). Herring gulls from Craigleith and Fidra combined showed stronger selection for landfills and marine habitats than those from the Isle of May (Figure 14), though use of marine habitats still remained low overall. Individuals from the Isle of May showed a stronger selection for coastal, harbour and urban habitats. There was no difference between colonies for the selection of agricultural habitats (Figure 14).
Focusing on differences between the breeding and non-breeding season, herring gulls from both the Isle of May and Craigleith and Fidra combined showed a significantly stronger selection for landfill sites during the breeding season (Figure 15). For Craigleith and Fidra combined, individuals also had a stronger selection for coastal and harbour habitats during the breeding season, and to a lesser extent agricultural habitats. Conversely, based on the data points available, selection for marine habitats was stronger during the non-breeding season, with no difference for urban habitats. For the Isle of May, individuals had a significantly stronger selection for harbours, urban and agricultural habitats during the breeding than non-breeding season. During the non-breeding season, selection was stronger for coastal, and to a lesser extent, marine habitats (Figure 15).
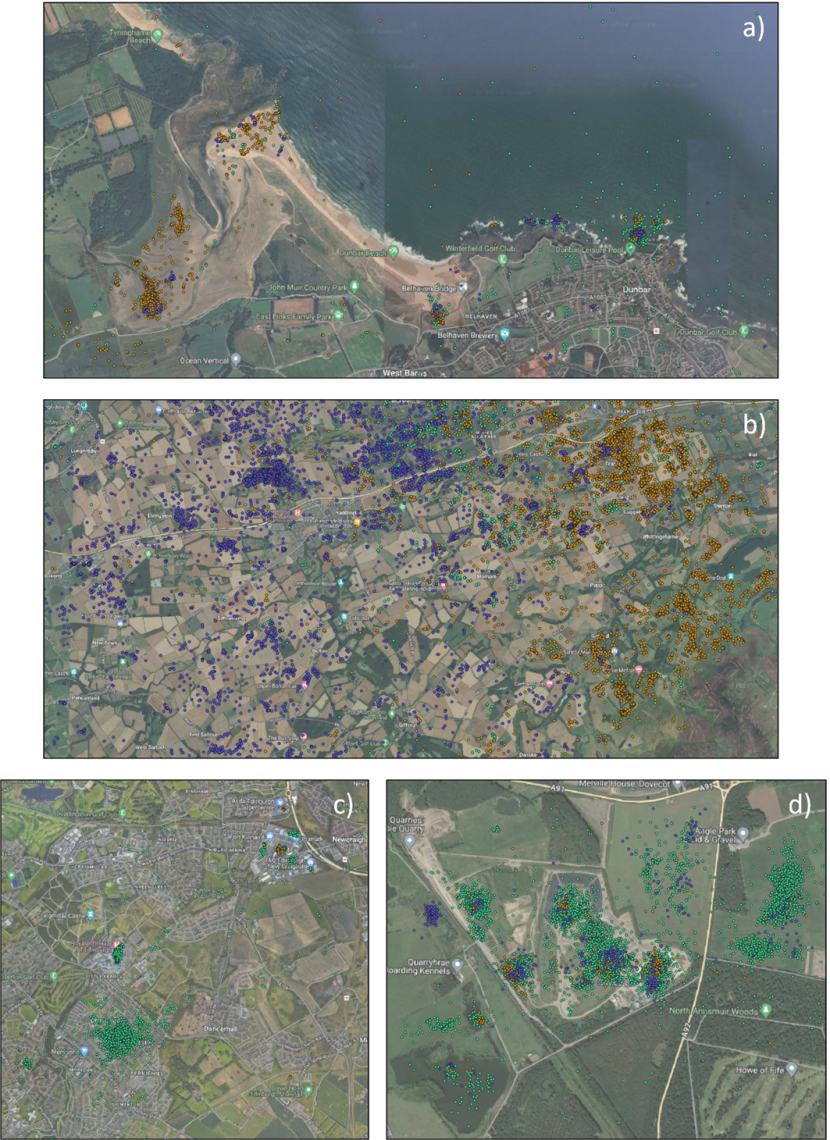
Figure 10. Four maps showing satellite imagery of different habitats as well as the GPS fixes from the tracked herring gulls.
Click for a full description
View larger version of this image.
Satellite imagery showing examples of different habitats used by the tracked herring gulls from the Forth Islands SPA across all years from 2019 to 2023 (Craigleith – orange, Fidra – purple and Isle of May – Green): a) coastal habitat and the harbour at Dunbar, b) agricultural fields around Haddington and surroundings, c) urban areas of south-west Edinburgh and d) Ladybank Landfill, Fife. Imagery © 2023 Google. Note that the plots are shown at different spatial scales to best show the data.
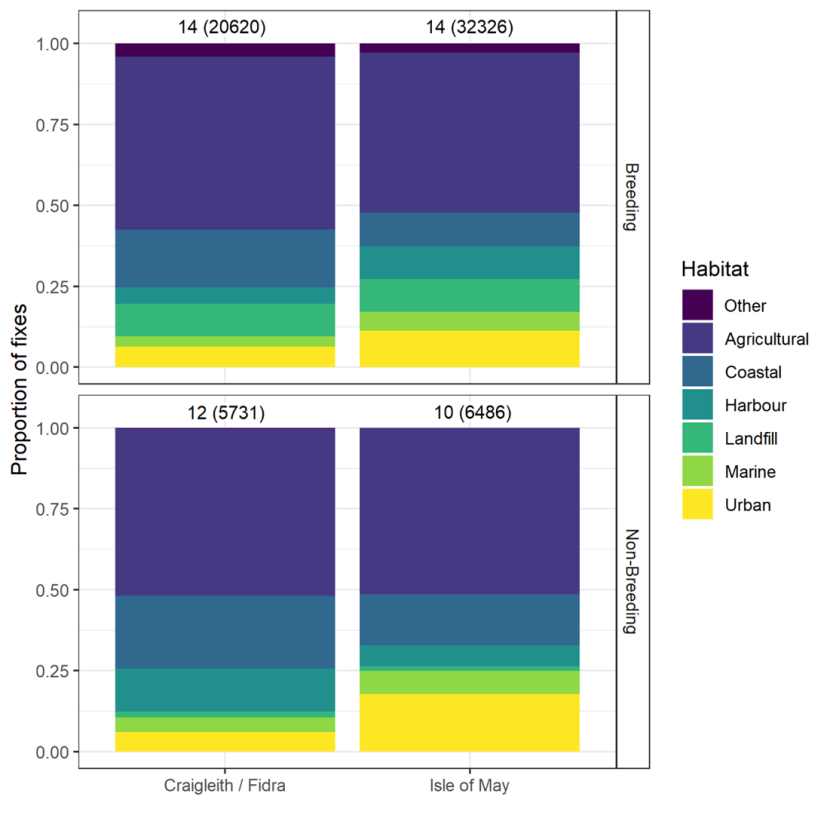
Figure 11. Two bar plots (on top of each other) showing the proportion of habitat use by tracked herring gulls from Craigleith and Fidra combined (left hand bars) and from the Isle of May (right hand bars)
Click for a full description
View a larger version of this image.
Habitat use of the tracked herring gulls breeding within the Forth Islands SPA, from the 2019 to 2023 breeding seasons for the Isle of May and Craigleith / Fidra combined, during the breeding and non-breeding season. The numbers above each bar refer to the number of individuals with adequate data, and in parenthesis the number of fixes. This is based on all GPS fixes except for those at the colony, which were removed. Data is pooled across years (2019 – 2023). Plots for individuals are shown in Figure 13. Habitat category ‘Other’ includes all habitat outwith those listed (i.e. woodland, moorland, bog etc.).
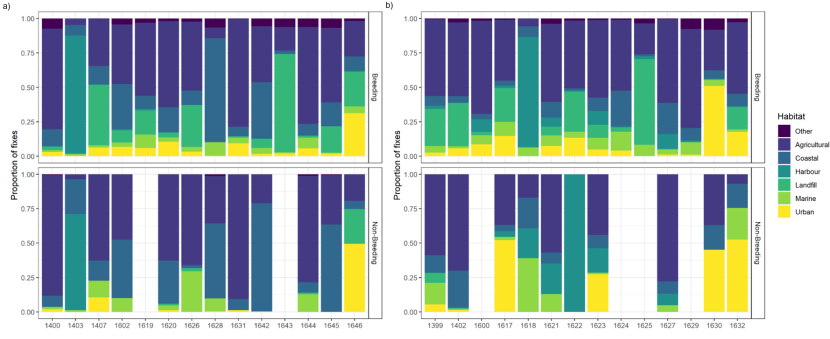
Figure 12. Four bar plots showing the proportion of habitat use by individual tracked herring gulls from Craigleith and Fidra combined (left hand bar plot) and from the Isle of May (right hand bar plot)
Click for a full description
View a larger version of this image.
Habitat use of individual tracked herring gulls breeding within the Forth Islands SPA, for a) Craigleith and Fidra combined and b) the Isle of May, during the breeding and non-breeding season. The numbers above each bar refer to the number of individuals with adequate data, and in parenthesis the number of fixes. This is based on all GPS fixes except for those at the colony, which were removed. Data is pooled across years (2019 – 2023).
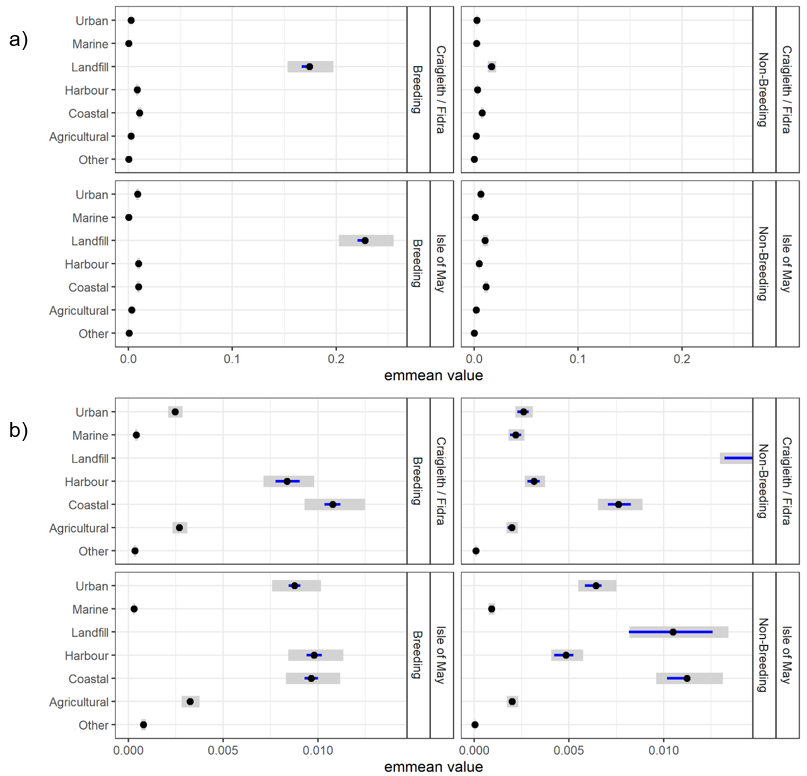
Figure 13. Habitat selection estimates of herring gulls across all years focused on habitat comparisons between colonies
Click for a full description
View a larger version of this image.
Habitat selection estimates of herring gulls across all years focused on habitat comparisons between colonies (Isle of May versus Craigleith and Fidra combined) during both the breeding and non-breeding seasons determined by post-hoc estimated marginal means from a RSF logistic regression with a three-way interaction between locations, season and habitat. Panel a) shows the habitat selection estimates of all habitats without the x-axis being truncated. Panel b) shows the x-axis truncated to better show the remaining habitat contrasts. Panels therefore have different x-axis scales. Points show the contrast estimates, grey shading the 95 % confidence intervals, and blue lines the significance; non-overlap of blue lines indicates significance.

Figure 14. Habitat selection estimates of herring gulls across all years focused on colony comparisons
Click for a full description
View a larger version of this image.
Habitat selection estimates of herring gulls across all years focused on colony comparisons (Isle of May versus Craigleith and Fidra combined) during both the breeding and non-breeding season determined by post-hoc estimated marginal means from a RSF logistic regression with a three-way interaction between location, season and habitat. Panel a) shows the habitat selection estimates of landfill without the x-axis being truncated. Panel b) shows the x-axis truncated to 0.015 to better show the remaining habitat contrasts. Panels therefore have different x-axis scales. Points show the contrast estimates, grey shading the 95 % confidence intervals, and blue lines the significance; non-overlap of blue lines indicates significance.
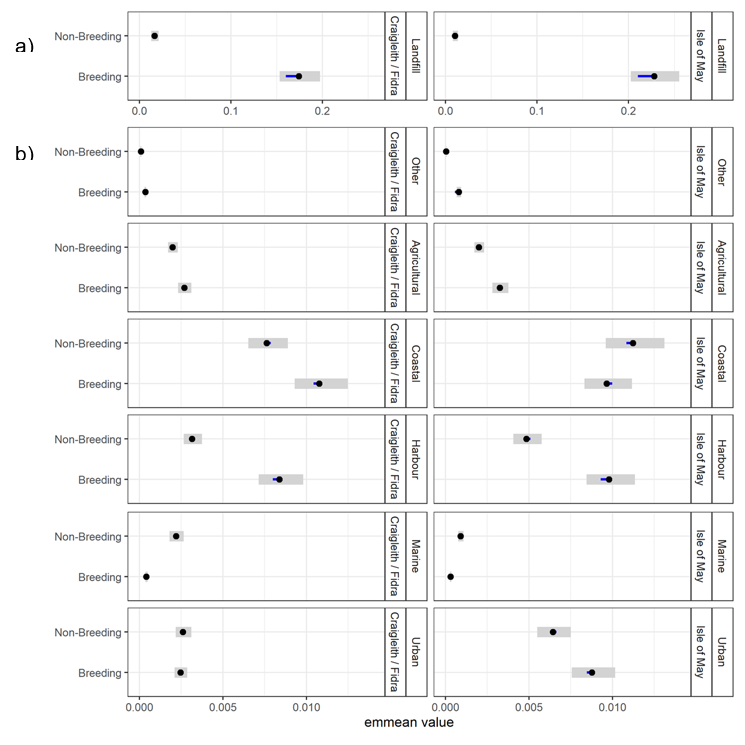
Figure 15. Habitat selection estimates of herring gull across all years focused on comparisons between the breeding and non-breeding season
Click for a full description
View a larger version of this image.
Habitat selection estimates of herring gull across all years focused on comparisons between the breeding and non-breeding season determined by post-hoc estimated marginal means from a RSF logistic regression with a three-way interaction between location, season and habitat. Panel a) shows the habitat selection estimates of landfill without the x-axis being truncated. Panel b) shows the x-axis truncated to 0.015 to better show the remaining habitat contrasts. Panels therefore have different x-axis scales. Points show the contrast estimates, grey shading the 95 % confidence intervals, and blue lines the significance; non-overlap of blue lines indicates significance.
Discussion
This report summarises the year-round movement patterns and habitat use of herring gulls tracked from three colonies within the Forth Islands SPA (Isle of May, Craigleith and Fidra) between 2019 and 2023. These data can be used to help inform decisions around licence applications and Environmental Impact Assessment (EIA) associated with developments within the region, specifically in relation to onshore and offshore wind farms. The data also provides important information on the foraging and distribution of herring gulls during the non-breeding season, which has previously been limited.
The use of harness attachments has opened up our ability to obtain vital information on fine scale movements and habitat use of individual birds across the annual cycle for species such as herring and lesser black-backed gulls (Thaxter et al., 2014; Clewley et al., 2021a). However, it should be noted that this is not possible for all seabirds at present due to current harness attachment designs / materials not being suitable for all species, even for the closely related great black-backed gull (Clewley et al., 2021b; Langlois Lopez et al., 2023a).
The sample size of herring gulls tracked within this study was improved in 2021 and 2022 due to lighter devices being available and can provide some estimate of individual variation. However, the samples sizes are still currently too low to have a high degree of confidence that population level distributions are representative (Thaxter et al., 2017) and is an important caveat to these findings. Ideally year to year differences across the study period would have been explored as individuals may have experienced different foraging conditions and habitat availability. This was not possible due to the low sample sizes in some years.
Seasonal movements
After the breeding season, herring gulls may disperse away from their breeding area, typically short distances in a southerly direction, whilst others are residents, remaining within a similar area all year-round (Coulson and Butterfield, 1985; Camphuysen et al., 2011; O’Hanlon et al., 2022). Within this study most individuals were classed as residents, remaining within a similar area around the colony during non-breeding as they did in the breeding season. Few (c20 %) individuals dispersed away from the area during at least one non-breeding season, all in a southerly direction. Given that herring gulls can therefore still remain in the area of interest for a large proportion of the year, we also summarised the GPS data for when individuals were colony associated. As some individuals roosted at the breeding colony during the non-breeding season, the colony associated period could make up the entire year. For most of the report, including the habitat selection analysis we have focused on the breeding and non-breeding season, given that is what is used by NatureScot in terms of licensing time periods and when considering development impact assessments. However, we have included information in the Annexes based on the colony associated classification in case this provides a useful perspective.
Across all years there was a relatively good sample of individual foraging trips recorded, especially for the Isle of May. The foraging ranges and trip durations of individuals tracked from Craigleith and Fidra were relatively similar however those from the Isle of May were on average larger and slightly longer across all years, potentially attributed to a greater number of individuals tracked from the Isle of May (Thaxter et al., 2017). The mean maximum foraging range tended to be lower than previous assessments based on data from multiple colonies (Thaxter et al., 2012; Woodward et al., 2024). Some longer distance movements were made during the breeding season, for example, an individual from Fidra that went to the west coast, whose nest likely failed. As might be expected the movements of individuals were larger for all colonies during the non-breeding season, but on average not greatly so given that most individuals remained resident. However, there were exceptions with two individuals from the Isle of May dispersing a considerable distance into England. This highlights the importance of considering SPAs from a cross-border perspective with several of the herring gulls spending the non-breeding season in England, and even small parts of the breeding season. This includes several of the Forth Island SPA herring gulls visiting other SPAs in Scotland and England. One individual from Fidra visited the Solway Firth SPA during the late breeding season / early non-breeding season (likely a failed breeding individual in 2022). As this study provided year-round movement data, it will facilitate better consideration of evidence needs related to protected areas designated for non-breeding birds, as most attention to date has largely been focused on breeding colonies. Wintering gulls, including herring gulls, are a protected feature of the Solway Firth SPA (NatureScot, 2023). herring gulls are also a protected feature of the Outer Firth of Forth and St Andrews Bay Complex SPA, which include migratory breeding and non-breeding individuals (NatureScot, 2020c). As would be expected all tracked individuals spent time within the Outer Firth of Forth and St Andrews Bay Complex SPA across the annual cycle.
Spatial distribution and use of features of interest in the environment
Spatial segregation of foraging habitats amongst seabird species breeding in nearby colonies is frequently observed (including in gulls, see Corman et al., 2016; Enners et al., 2018). However, this was not observed between the three herring gull colonies tracked within this study, potentially due to their close proximity to one another within the Firth of Forth.
During the breeding season, the distributions of the three colonies overlapped considerably with individuals from all colonies heading south and north to use coastal and agricultural areas in Lothian and Fife as well as trips westwards around Edinburgh. Overlap also occurred at specific features i.e. landfill sites that were used by individuals from all colonies. However, the UD hotspots do show some differences in the key areas individuals from each colony were targeting. Individuals from Craigleith and Fidra were concentrated to the south of the Firth of Forth, whilst those from the Isle of May were concentrated to the north. Differences in spatial distributions and foraging ranges among years are likely attributed to different sample sizes as well as individual variation, with a different suite of individuals typically tracked in each year. Hotspots of activity were also associated with specific harbours, specifically Anstruther, Pittenweem, St Monans and Crail along the Fife coast targeted by individuals from the Isle of May. North Berwick on the Lothian coast was visited by gulls from all three colonies, including all individuals from Craigleith. This indicates that these harbours were important sources of resources potentially associated with fishery landings and scavenging from tourists (Beasley, 2017).
The location of hotspots for each colony during the non-breeding season was similar to the breeding season, indicating that resources were available at these locations year-round. During the non-breeding season additional hotspots were located further from the Firth of Forth, particularly to the south but also to the west towards Glasgow and the Clyde as well as to the north around the River Tay and up to Montrose/Forfar. When heading south the gulls targeted coastal areas, including the Humber Estuary, as well as inland urban areas.
That individuals were largely resident to the area meant that the study colonies were frequently visited during the non-breeding season, with individuals also visiting other islands within the Firth of Forth, some of which also hold breeding gull colonies. These visits were typically made at night indicating that the islands were used to roost, which may be a relatively unrecorded behaviour.
Habitat use and selection
Habitat use by herring gulls can vary considerably between seasons, years and colonies/regions as well as due to breeding state and among individuals (Greig et al., 1985; Clewley et al., 2021c; O’Hanlon et al., 2022). Therefore, habitat selection results are rarely transferable across time and space, highlighting the importance of collecting site, and temporally, specific data to inform responses to licence requests and development impact assessments. The extensive foraging flexibility of herring gulls also means that habitat selection can change depending on the availability of different resources in both the short- and long-term, which consequently can alter when and where conflict with human interests may occur. We found individual variation in the use of different habitats across the breeding and non-breeding seasons. Although most individuals used a range of habitats, a small number of individuals had large numbers of GPS fixes associated with specific habitats indicating that some level of specialisation may have occurred with these individuals specifically targeting harbour, landfill and urban habitats.
We observed some differences in the extent of habitat selection between colonies (with Craigleith and Fidra combined) and between the seasons. However, across all colonies, landfill and coastal habitats were consistently the most important based on their relative availability. During the breeding season, across colonies, the strongest selection was for landfill sites. Most individuals visited at least one landfill site during the study period, particularly Ladybank in Fife and Dunbar in Lothian. As shown by the distributions of the gulls, coastal and harbour habitats were also strongly selected by the tracked herring gulls. Although a large proportion of GPS fixes fell within agricultural land there was only a weak selection for this habitat across locations and seasons, attributed to this being a widely available habitat within the foraging range of all colonies.
There were, however, also some differences, particularly with individuals from the Isle of May showing a stronger selection for urban habitats than those from Craigleith and Fidra combined, during both seasons. Urban areas included parts of Edinburgh (especially along the coast and to the east of the city) and coastal towns including Anstruther, Crail and North Berwick (outwith harbour areas). During the non-breeding season, across all colonies, the selection for landfill sites was not as strong as during the breeding season but this was still a preferred habitat. Coastal habitats were also important for all the tracked gulls during the non-breeding season. Harbours were selected to a lesser extent during the non-breeding season which may be related to reductions in fishery landings, as well as reduced numbers of tourists providing scavenging opportunities (Beasley, 2017).
One aspect the habitat selection analysis does not consider is the availability of food items within the considered habitats. In agricultural habitats, gulls may be targeting several features including ploughed fields and mowing of grassland where worms/invertebrates may be common, as well as supplementary feed for livestock (Schwemmer et al., 2008). The slightly stronger preference for agricultural habitats during the non-breeding season may be related to a reduction in food availability in other habitats at this time (i.e. at harbours), but also due to an increase in the supplementary feeding of livestock at this time. Although few gulls tracked within this study used the marine environment, individuals that do forage in this habitat will likely be targeting fishing vessels (Camphuysen, 1995), which our analysis did not capture. Adequate data to assess fishing effort or fishery landings within the Firth of Forth were not available so we were unable to determine whether the lack of use of the marine environment was attributed to limited opportunities to forage (Camphuysen, 1995).
A minority of individuals spent considerable time around the colony during the breeding season and may have been adopting a kleptoparasitic foraging strategy (Busniuk et al., 2020). For example, the home ranges of several great black-backed gulls tracked on the Isle of May during the breeding season indicated that they rarely left the island, due to predating on other seabirds, specifically puffins Fratercula arctica, as well as rabbits (Langlois Lopez et al., 2023b). The habitat selection of these particular herring gulls whilst at the colony were not considered as the data resolution was not fine scale enough to differentiate between nesting and foraging behaviours. However, this kleptoparasitic behaviour is important to consider given that licences might be requested where conflicts occur between herring gulls and other species of conservation concern (Langlois Lopez et al., 2023b).
Although it is difficult to make generalisations about gull foraging preferences due to these being dependent on what resources are available within the gulls foraging range, certain habitats were consistently selected by the tracked herring gulls. These were typically sites that provided predictable foraging opportunities, although it can still be challenging to determine how consistently gulls use these sites especially if conditions change, for example over varying timescales. It would be valuable to identify consistency in hotspots between years, however this was not possible here due to the different, and relatively small, sample sizes between years. It should also be noted that we used all GPS fixes away from the colony within the habitat selection models, including those when individuals were commuting to foraging areas. We did this as a precautionary approach so as not to rule out areas gulls might be using (as during commuting individuals frequently search for foraging opportunities, especially over urban areas). Classifying the gulls’ behaviours, for example to differentiate foraging, commuting, and resting/roosting, might provide additional insights into the herring gulls’ habitat use.
Applied uses of the herring gull tracking data
Marine areas were rarely used by the herring gulls tracked within this study although some individuals did utilise this habitat, likely scavenging from fishing vessels (Furness et al., 1992; Camphuysen et al., 1995). The time individuals spent in offshore marine environments compared to that inland was limited. Most individuals spent the majority of their time away from the colony (> 90 %) in terrestrial (and coastal) areas during the breeding and non-breeding season. This is useful to understand to inform apportioning in relation to the impact of on and offshore wind farms on SPA populations of herring gulls (Quinn, 2019).
Overlap with OWFs (which included proposed, consented, under-construction and operational developments) was therefore also very low, attributed to a small number of trips. However, most individuals from all three colonies did overlap with at least one of the surrounding OWFs footprints during the study period, in the breeding and non-breeding season, although the amount of time within these footprints was negligible (< 0.1 % of each individuals’ time when away from the colony). Of these OWF developments only one was under-construction at the time of the study (Neart na Gaoithe Wind Farm), which only individuals from the Isle of May overlapped with during the breeding season. None of the OWFs which the gulls overlapped with were operational during the study period, with the majority being at the proposed or consented stage. However, we only tracked a small proportion of individuals, therefore if scaled up to the whole SPA population a number of individuals are likely to use the offshore marine environment to some extent and may overlap with OWFs within their foraging range. Herring gulls are often foraging specialists both in the breeding (e.g. Clewley et al., 2021c) and non-breeding seasons (e.g. O’Hanlon et al., 2022). Therefore, a larger sample of birds tracked may reveal a small number of individuals with greater reliance on marine areas. Within this study we observed variation in the habitats individuals used, during both the breeding and non-breeding season, with some individuals targeting marine habitats to a greater extent than others. Caution is therefore required when using these data to inform advice in relation to the potential impact of OWFs on the Forth Islands SPA population as there still may be collision risk to some individuals. For individuals that dispersed west and south, the majority of the non-breeding was spent inland therefore there was very limited overlap with OWFs during this period.
Whilst OWFs were the main focus of this study, given that the tracked gulls spent the majority of their time in terrestrial habitats, we also looked at the gulls’ overlap with proposed, consented and operational onshore wind farms within the region. All individuals except one from Fidra overlapped with at least one onshore wind farm development in Scotland over the study period. Gulls overlapped with onshore wind developments within their home range in both the breeding and non-breeding seasons. This means that a proportion of tracked individuals overlapped with both onshore and offshore wind farm developments over the annual cycle. This includes five individuals from the Isle of May that overlapped with both operational onshore and offshore wind farms during the breeding season. It would be useful to investigate these connections in more detail to determine when and to what extent the gulls overlapped with both onshore and offshore wind farm developments, as well as to determine whether GPS fixes were associated with commuting or other behaviours. This was outside the scope of this project, however, the tracking data collected can still be used to inform the consenting process of onshore and offshore wind farm developments currently at the application stage, including around apportionment.
Coastal areas were one of the most selected for habitats by the herring gulls across colonies and seasons, which included a variety of habitats including intertidal areas and urban/built up coastal areas. Intertidal areas are a traditional key habitat for herring gulls, especially at low tide when individuals can exploit intertidal prey (Pierotti and Annett ,1991; Huppop and Huppop, 1999). However, within coastal areas gulls will also likely be opportunistically targeting urban areas where they can scavenge food especially at popular tourist spots during the breeding season (Beasley, 2017). Within this study, towns and villages along the Fife and Lothian coasts included harbours where fishing boats operate, which therefore likely provide scavenging opportunities; with fishery landings also being greater during the months of the breeding season (Marine Directorate, 2023). Schools and shopping centres in urban areas were also specific locations that were targeted by some individuals as has been observed elsewhere due to providing predictable food opportunities for the gulls to exploit (Spelt et al., 2019). A reduction in fishery landings or discarded waste from people living in or visiting these areas therefore has the potential to reduce the availability of food to the gulls.
Coastal development also has the potential to negatively impact gulls targeting natural coastal habitats, for example, through disturbance or reducing foraging opportunities (Dugan et al., 2008, Graells et al., 2022). Future coastal developments are predicted in the Firth of Forth associated with the proposed increase in OWFs, including floating wind farms, around Scotland (The Crown Estate, 2024). These will involve considerable development at specific harbours including infrastructure such as pipelines and wet storage. This will likely affect the availability of foraging, and roosting, opportunities for herring gulls and other coastal species (DeLuca et al., 2008), causing the displacement of gulls to other foraging habitats. Such developments may also have consequent impacts on the demographic rates of the gulls from the Forth Islands SPA depending on the energetic and nutritional quality of the alternative available foraging habitats within their foraging range (Pierotti and Annett, 1991; O’Hanlon et al., 2017; van Donk et al., 2017).
Although a relatively low proportion of fixes from the tracked herring gulls fell within the boundaries of landfill sites this resource was strongly selected for based on its spatial extent/availability. There was overlap between most individuals and at least one landfill site over the study period, during the non-breeding and especially the breeding season. However, the resolution of the data was lower during the non-breeding season with some large gaps where the devices were not charged, therefore visits to these rarer habitats may have been missed. It should also be noted that although there was strong selection for landfill sites, there was variation amongst individuals. This may suggest that the gulls were targeting landfill sites at specific times when food was available, and / or when disturbance by workers was low, alongside feeding in surrounding agriculture or alternative habitats (Greig et al., 1985). Food availability at landfills has reduced in recent years with many sites across the UK closing (Langley et al., 2021), whilst deterrents are put in place to deter gulls and over scavengers from those that are still operational (Cook et al., 2008). However, landfill sites continue to provide foraging opportunities to individuals. Requests for licensed control of herring gulls from landfill sites does occur (NatureScot, 2020a). Depending on the extent of this control, this may have an impact on the SPA population, especially if lethally controlled individuals are replaced by others from the same colony; although lethal control of adults is only considered as a last resort where there are clear public health and safety risks and will only be issued where alternatives have been tried (NatureScot, 2020a; 2024). Again, displacement of herring gulls from landfill sites may result in these individuals switching to alternate habitats with potential consequences on their demography or new conflicts arising (Belant, 1997; Belant et al., 1998; Delgado et al., 2023).
Airports are another location where requests for licensed control of herring gulls can occur due to the potential of air strikes resulting in a public health and safety risk (NatureScot, 2020a; b). Within this study few of the tracked gulls overlapped with airports (which including Dundee Airport and Leuchers Army Barrack, formerly RAF) within their home ranges during the breeding or non-breeding season. Although again, it should be noted we only tracked a small proportion of individuals. Therefore, it is useful to understand that there is some level of connectivity between airports in the region and herring gulls from the Forth Islands SPA when assessing such licence requests.
Although the selection for agricultural habitat was weak within this study, this was still an important habitat for the herring gulls from all colonies, as has been shown elsewhere (Schwemmer et al., 2008; O’Hanlon et al., 2022). Most fixes away from the colony were associated with agriculture, with the low selection of this habitat being due to its wide availability, therefore the gulls were typically using it in relation to its availability. The use of pastoral fields where livestock food is exploited will bring gulls into conflict with farmers as it takes away this food from its target plus there are also concerns about disease transmission (Butterfield et al., 1983; Navarro et al., 2019; Hill et al., 2022). This may consequently result in an increase in licence requests to control herring gulls under prevention of serious damage (NatureScot, 2020a). Given the availability of agricultural land, and that it is a relatively low risk, accessible resource for gulls to exploit compared to other habitat such as landfill and urban areas (van Donk et al., 2019), there is a concern that displacement of gulls from preferred habitats such as harbours and landfill sites due to development and disturbance/closures, may lead to more gulls foraging on agricultural land, resulting in increased conflict.
Next steps
The tracking data collected from breeding herring gulls within the Forth Islands SPA can be used to help inform future policy and casework approaches. Within this report we have documented the spatial distribution of a sample of tracked herring gulls across the breeding and non-breeding seasons. The gulls’ distributions are driven by the location, and availability, of resources that individuals utilise across the annual cycle. This includes locations that are linked to human activities including landfill sites, harbours, urban areas and agricultural land. We also document the overlap of the gulls to airports and both onshore and offshore wind farm developments (including proposed, consented and operational). These data therefore have direct use in helping to assess future requests for licensed control of herring gulls, for example, associated with airports, landfill sites and agriculture. The data also can be used to inform the consenting process of licensed developments such as renewable energy developments in both terrestrial and marine environments.
Within this report we explored in detail how the tracked herring gulls overlapped with proposed, consented, under construction and operational OWFs within their home ranges. However, given that the gulls spent most of their time away from the colony in terrestrial habitats it would also be beneficial to further investigate the spatial and temporal overlap of individuals with onshore wind farm developments within the region. Exploring this overlap in more detail, including whether individuals are commuting through or using areas where onshore wind farms are proposed may help to determine whether herring gulls will be impacted by future developments, for example, in terms of collision risk or displacement from foraging areas. The cumulative risk from both onshore and offshore wind farms should also be explored, across the annual cycle, since individuals within this study overlapped with wind farms in both terrestrial and marine environments (Thaxter et al., 2019). This is particularly relevant for apportioning the impacts of onshore and offshore wind farms to gulls breeding in SPAs (Quinn, 2019).
Another finding was that across the annual cycle the herring gulls tracked from the Forth Islands SPA also visited other SPAs, including those that are classified for wintering gulls (e.g. the Solway Firth). It would therefore be useful to explore these linkages between SPA populations in more detail, particularly those which have gulls as protected features. To date EIAs have largely focussed on breeding assemblages for seabirds and therefore this is an area that warrants further consideration in the consenting process.
The data from this project can continue to be used to inform specific questions on where herring gulls from the Forth Islands SPA are distributed across the annual cycle, and how they interact with different habitats and features within marine and terrestrial environments. There is also the potential to expand on the results we have presented within this report, including looking at habitat use during the day and night (although most data collected was during daylight hours to conserve the battery life of the deployed devices) and exploring daily temporal variation in foraging, which might relate to tidal cycles and also human schedules to explore further how individuals adapt their foraging behaviour to human activities.
References and Appendices
References
Balmer, D.E., Gillings, S., Caffrey, B.J., Swann, R.L., Downie, I.S. and Fuller, R.J., 2013. Bird Atlas 2007-11: the breeding and wintering birds of Britain and Ireland. Thetford: BTO.
Beasley, E., 2017. Foraging habits, population changes, and gull-human interactions in an urban population of Herring Gulls (Larus argentatus) and Lesser Black-backed Gulls (Larus fuscus). PhD Thesis.
BEIS, 2021. Net Zero Strategy: Build Back Greener, Gov.UK
Belant, J. L., 1997. Gulls in urban environments: Landscape-level management to reduce conflict. Landscape and Urban Planning, 38, 245–258. https://doi.org/10.1016/S0169-2046(97)00037-6
Belant, J. L., S. K. Ickes, and T. W. Seamans. 1998. Importance of Landfills to Urban-Nesting Herring and Ring-Billed Gulls. Landscape and Urban Planning 43, no. 1–3: 11–19.
Bergström, L., Kautsky, L., Malm, T., Rosenberg, R., Wahlberg, M., Capetillo, N.Å. and Wilhelmsson, D., 2014. Effects of offshore wind farms on marine wildlife—a generalized impact assessment. Environmental Research Letters, 9, 034012.
Boyce, M. S., Vernier, P. R., Nielsen, S. E., and Schmiegelow, F. K. a., 2002. Evaluating resource selection functions. Ecological Modelling, 157, 281–300.
Brooks, M. E., Kristensen, K., van Benthem, K. J., Magnusson, A., Berg, C. W., Nielsen, A., Skaug, H. J., Mächler, M., and Bolker, B. M., 2017. glmmTMB balances speed and flexibility among packages for zero-inflated generalized linear mixed modeling. R Journal, 9(2), 378–400.
Burnell, D., 2021. Urban nesting Herring Gull Larus argentatus and Lesser Black-backed Gulls Larus fuscus population estimates: devising species-specific correction models for ground-based survey data. Natural England publication ref: JNCC21_01.
Burnell, D., Perkins, A. J., Newton, S. F., Bolton, M., Tierney, T., and Dunn, T. E., 2023. Seabirds Count – A Census of Breeding Seabirds in Britain and Ireland (2015-2021). Lynx Nature Books, Barcelona.
Busniuk, K., Storey, A.E. and Wilson, D.R., 2020. Herring gulls target profitable Atlantic puffins during kleptoparasitic attack. Aniimal Behaviour, 166, 273–279.
Butterfield, B.Y.J., Coulson, J.C., Kearsey, S. V and Monaghan, P. 1983. The herring gull Larus argentatus as a carrier of salmonella. The Journal of Hygiene, 91, 429–436.
Camphuysen, K.C.J. 1995. Herring gull Larus argentatus and Lesser black-backed gull L. fuscus feeding at fishing vessels in the breeding season: competitive scavenging versus efficient flying. Ardea 83, 365–380.
Camphuysen, C.J., 2013. A historical ecology of two closely related gull species (Laridae): multiple adaptations to a man‐made environment. PhD Thesis.
Camphuysen, C.J., Calvo, B., Durinck, J., Ensor, K., Follestad, A., Furness, R.., Garthe, S., Leaper, G., Skov, H., Tasker, M.L. and Winter, C.J.N., 1995. Consumption of discards by seabirds in the North Sea. Final report EC DG XIV research contract BIOECO/93/10. NIOZ Rapport 1995 - 5, Netherlands Institute for Sea Research, Texel.
Camphuysen, C.J., Vercruijsse, H.J.P. and Spaans, A.L., 2011. Colony- and age-specific seasonal dispersal of Herring Gulls Larus argentatus breeding in The Netherlands. Journal of Ornithology, 152, 849–868.
Cleasby, I.R., Owen, E., Butler, A., Baer, J., Blackburn, J., Bogdanova, M.I., Coledale, T., Daunt, F., Dodd, S., Evans, J.C., Green, J.A., Guilford, T., Harris, M.P., Hughes, R., Newell, M.A., Newton, S.F., Robertson, G.S., Ruffino, L., Shoji, A., Soanes, L.M., Votier, S.C., Wakefield, E.D., Wanless, S., Wilson, L.J. and Bolton, M., 2023. Assessing the importance of individual- and colony-level variation when using seabird foraging ranges as impact assessment and conservation tools. Ibis.
Clewley, G.D., Clark, N.A., Thaxter, C.B., Green, R.M., Scragg, E.S and Burton, N.H.K., 2021a. Development of a weak-link wing harness for use on large gulls (Laridae): methodology, evaluation and recommendations. Seabird, 33, 18-34.
Clewley, G.D., Cook, A.S.C.P., Davies, J.G., Humphreys, E.M., O’Hanlon, N.J., Weston, E., Boulinier, T. and Ponchon, A., 2021b. Acute impacts from Teflon harnesses used to fit biologging devices to Black-legged Kittiwakes Rissa tridactyla. Ringing and Migration, 36(2), 69–77. https://doi.org/10.1080/03078698.2022.2151065
Clewley, G.D., Barber, L.J., Conway, G.J., Clark, N.A., Donato, B.J., Thaxter, C.B. and Burton, N.H.K., 2021c. Foraging habitat selection by breeding Herring Gulls (Larus argentatus) from a declining coastal colony in the United Kingdom. Estuarine, Coastal and Shelf Science, 261, p.107564.
Clewley, G.D., Johnston, D.T., O’Hanlon, N.J., Thaxter, C.B., Burton, N.H.K. and Humphreys, E.M., 2023. Assessing foraging movements and area use in Herring Gull (Larus argentatus) in the Forth Islands SPA. Second interim report. BTO Research Report produced on behalf of NatureScot by St Andrews University and BTO Scotland.
Cook, A., Rushton, S., Allan, J., and Baxter, A., 2008. An evaluation of techniques to control problem bird species on landfill sites. Environmental Management, 41(6), 834–843.
Corman, A.M., Mendel, B., Voigt, C.C., and Garthe, S., 2016. Varying foraging patterns in response to competition? A multicolony approach in a generalist seabird. Ecology and Evolution, 6(4), 974–986. https://doi.org/10.1002/ece3.1884
Coulson J.C. and Butterfield, J. 1985. Movements of British Herring Gulls. Bird Study, 32, 2, 91-103.
Dardis, C., 2015. LogisticDx: diagnostic tests for models with a binomial response. R package version 0.2.
Delgado, S., Tavecchia, G., Herrero, A., Aldalur, A., and Arizaga, J., 2023. Model projections reveal a recent decrease in a yellow-legged gull population after landfill closure. European Journal of Wildlife Research, 69(5), 1–10. https://doi.org/10.1007/s10344-023-01723-w
DeLuca, W.V., Studds, C.E., King, R.S., and Marra, P.P., 2008. Coastal urbanization and the integrity of estuarine waterbird communities: Threshold responses and the importance of scale. Biological Conservation, 141(11), 2669–2678. https://doi.org/10.1016/j.biocon.2008.07.023
Dias, M.P., Martin, R., Pearmain, E.J., Burfield, I.J., Small, C., Phillips, R.A., Yates, O., Lascelles, B., Borboroglu, P.G. and Croxall, J.P. 2019. Threats to seabirds: a global assessment. Biological Conservation, 237, 525-537.
Drewitt, A.L. and Langston, R.H. 2006. Assessing the impacts of wind farms on birds. Ibis. 148, 29–42.
Dugan, J.E., Hubbard, D.M., Rodil, I.F., Revell, D.L., and Schroeter, S.C., 2008. Ecological effects of coastal armoring on sandy beaches. Marine Ecology, 29, 160–170.
Emodnet. 2024. 2014-06-01 Emodnet_HA_WindFarms_20210217
Enners, L., Schwemmer, P., Corman, A.M., Voigt, C.C. and Garthe, S., 2018. Intercolony variations in movement patterns and foraging behaviors among herring gulls (Larus argentatus) breeding in the eastern Wadden Sea. Ecology and Evolution, 8, 7529-7542.
Environment Agency, 2023. https://data.gov.uk/dataset/ad695596-d71d-4cbb-8e32-99108371c0ee/permitted-waste-sites-authorised-landfill-site-boundaries -.
Fieberg, J., Signer, J., Smith, B., and Avgar, T., 2021. A ‘How to’ guide for interpreting parameters in habitat-selection analyses. Journal of Animal Ecology, 90(5), 1027–1043. https://doi.org/10.1111/1365-2656.13441
Fox, A.D., Desholm, M., Kahlert, J., Christensen, T.K. and Krag Petersen, I.B., 2006. Information needs to support environmental impact assessment of the effects of European marine offshore wind farms on birds. Ibis, 148, 129-144.
Furness, R., Ensor, K. and Hudson, A. 1992. The use of fishery waste by gull populations around the British Isles. Ardea, 80, 105–113.
Furness, R.W., Wade, H.M. and Masden, E.A. 2013. Assessing vulnerability of marine bird populations to offshore wind farms. Journal of environmental Management, 119, 56-66.
Geen, G.R., Robinson, R.A. and Baillie, S.R. 2019. Effects of tracking devices on individual birds – a review of the evidence. Journal of Avian Biology, 50, e01823.
Graells, G., Celis-Diez, J. L., Corcoran, D., and Gelcich, S., 2022. Bird communities in coastal areas. Effects of anthropogenic influences and distance from the coast. Frontiers in Ecology and Evolution, 10, 1–10. h.
Greig, S. A., Coulson, J. C. and Monaghan, P., 1985. Feeding strategies of male and female adult Herring Gulls (Larus argentatus). Behaviour 94: 41–59.
HDX, 2020. UK Scotland Airports. Humanitarian Data Exchange. https://data.humdata.org/dataset/hotosm_gbr_scotland_airports?
Hijmans, R. J., 2022. terra: Spatial Data Analysis. R package version 1.5-21.
Hill, N.J., Bishop, M.A., Trovão, N.S., Ineson, K.M., Schaefer, A.L., Puryear, W.B., Zhou, K., Foss, A.D., Clark, D.E., MacKenzie, K.G., Gass, J.D., Borkenhagen, L.K., Hall, J.S., and Runstadler, J.A., 2022. Ecological divergence of wild birds drives avian influenza spillover and global spread. PLoS Pathogens, 18, 1–25. https://doi.org/10.1371/journal.ppat.1010062
Hunt, G. L., 1972. Influence of food distribution and human disturbance on the reproductive success of Herring Gulls. Ecology, 53(6), 1051–1061.
Huppop, O. and Huppop, K., 1999. The food of breeding herring gulls Larus argentatus at the lower River Elbe: Does fish availability limit inland colonisation. Atlantic Seabirds, 1, 27–42.
JNCC, 2019. Seabird Monitoring Programme.
JNCC, 2022. Special Protection Areas (SPAs) with marine components (all UK waters). https://hub.jncc.gov.uk/assets/07078ed3-496d-432b-974e-1754b47536c7
Johnson, C. J., Nielsen, S. E., Merrill, E. H., McDonald, T. L., and Boyce, M. S., 2006. Resource selection functions based on use–availability data: Theoretical motivation and evaluation methods. Journal of Wildlife Management, 70(2), 347–357. https://doi.org/10.2193/0022-541x(2006)70[347:rsfbou]2.0.co;2
Kavelaars, M.M., Stienen, E., Matheve, H., Buijs, R.J., Lens, L. and Müller, W. 2018. GPS tracking during parental care does not affect early offspring development in lesser black-backed gulls. Marine Biology, 165, 1-8.
Lakin, R., Clewley, G., Johnston, D., Spencer, K., Minderman, J. and Humphreys, E.M. 2020. Assessing foraging behaviour and habitat use in Herring Gulls from three Forth Island SPA sites during breeding and post-breeding periods in 2019. First year report produced on behalf of NatureScot by St Andrews University and BTO Scotland.
Langley, L.P., Bearhop, S., Burton, N.H.K., Banks, A.N., Frayling, T., Thaxter, C.B., Clewley, G.D., Scragg, E. and Votier, S.C., 2021. GPS tracking reveals landfill closures induce higher foraging effort and habitat switching in gulls. Movement Ecology, 9, 1–13.
Langlois Lopez, S., Clewley, G.D., Johnston, D.T., Daunt, F., Wilson, J.M., O’Hanlon, N.J. and Masden, E., 2023a. Reduced breeding success in Great Black‐backed Gulls Larus marinus due to harness‐mounted GPS. Ibis, 166,: 69–81.
Langlois Lopez, S., Daunt, F., Wilson, J., O’Hanlon, N.J., Searle, K.R., Bennett, S., Newell, M.A., Harris, M.P. and Masden, E., 2023b. Quantifying the impacts of predation by Great Black-backed Gulls Larus marinus on an Atlantic Puffin Fratercula arctica population: Implications for conservation management and impact assessments. Marine Environmental Research, 188, 105994.
Lenth, V. R., Buerkner, P., Herve, M., Love, J., and Singmann, H., 2020. emmeans: Estimated Marginal Means, aka Least-Squares Means. .
Marine Directorate, 2023. Fisheries landing data as requested and obtained December 2023. Unpublished data.
Marston, C., Rowland, C.S., O’Neil, A.W., and Morton, R.D., 2022. Land Cover Map 2021 (25m rasterised land parcels, GB). https://doi.org/10.5285/a1f85307-cad7-4e32-a445-%0A84410efdfa70
NatureScot, 2018. Interim guidance on apportioning impacts from marine renewable developments to breeding seabird populations in SPAs.
NatureScot, 2020a Guidance - gull management.
NatureScot, 2020b. Birds and licensing.
NatureScot, 2020c. Outer Firth of Forth and St Andrews Bay Complex SPA.
NatureScot, 2023. Conservation and Management Advice - Solway Firth SPA. pp 1-123.
NatureScot, 2024. Guidance – gull management.
Navarro, J., Grémillet, D., Afán, I., Miranda, F., Bouten, W., Forero, M.G., and Figuerola, J., 2019. Pathogen transmission risk by opportunistic gulls moving across human landscapes. Scientific Reports, 9, 1–5. https://doi.org/10.1038/s41598-019-46326-1
O’Hanlon, N.J., McGill, R.A. and Nager, R.G., 2017. Increased use of intertidal resources benefits breeding success in a generalist gull species. Marine Ecology Progress Series, 574, 193-210.
O’Hanlon, N.J., Thaxter, C.B., Burton, N.H., Grant, D., Clark, N.A., Clewley, G.D., Conway, G.J., Barber, L.J., McGill, R.A. and Nager, R.G., 2022. Habitat selection and specialisation of Herring Gulls during the non-breeding season. Frontiers in Marine Science, 9, 224.
Pierotti, R. and Annett, C.A., 1991. Diet choice in the Herring Gull: constraints imposed by reproductive and ecological factors. Ecology 72: 319–328.
Piggott, A., Vulcano, A. and Mitchell, D., 2021. Impact of offshore wind development on seabirds in the North Sea and Baltic Sea: Identification of data sources and at-risk species. BirdLife Europe and Central Asia Report. Brussels, Belgium.
QGIS Development Team, 2020. QGIS Geographic Information System. Open Source Geospatial Foundation Project.
Quinn, L.R., 2019. Workshop Report on Gull foraging offshore and onshore: developing apportioning approaches to casework. Scottish Natural Heritage, Workshop 31st January 2019.
R Core Team, 2021. R: A language and environment for statistical computing. R Foundation for Statistical Computing, Vienna.
Robin, X., Turck, N., Hainard, A., Tiberti, N., Lisacek, F., Sanchez, J., and Müller, M., 2011. pROC: an open-source package for R and S+ to analyze and compare ROC curves. BMC Bioinformatics, 12, 77.
Rock, P., Camphuysen, C.J., Shamoun-Baranes, J., Ross-Smith, V.H. and Vaughan, I.P., 2016. Results from the first GPS tracking of roof-nesting Herring Gulls Larus argentatus in the UK. Ringing and Migration, 31, 47-62.
Schwemmer, P., Garthe, S. and Mundry, R., 2008. Area utilization of gulls in a coastal farmland landscape: Habitat mosaic supports niche segregation of opportunistic species. Landsape Ecology, 23, 355–367.
Scottish Government, 2020. Sectoral Marine Plan for Offshore Wind Energy. Edinburgh, UK. ISBN: 978-1-80004-242-1
Scottish Government, 2024. Onshore wind farm locations. Downloaded from https://www.data.gov.uk/dataset/3219c645-9664-4e86-b73b-e36190626ef8/wind-farm-proposals-scotland on 17/06/2024.
Scottish Parliament, 2019. Climate Change (Emissions Reduction Targets) (Scotland) Act 2019.
SEPA, 2022. Waste Sites and Capacity tool. Accessed 28/09/2023.
Shamoun-Baranes, J., Burant, J.E., van loon, E., Bouten, W. and Camphuysen, C.J., 2017. Short distance migrants travel as far as long distance migrants in Lesser Black-backed Gulls Larus fuscus. Journal of Avian Biology, 48, 49-57.
Signer, J., Fieberg, J. and Avgar, T., 2019. Animal movement tools (amt): R package for managing tracking data and conducting habitat selection analyses. Ecology and Evoution, 9, 880–890.
Soanes, L.M., Arnould, J.P.Y., Dodd, S.G., Sumner, M.D. and Green, J.A., 2013. How many seabirds do we need to track to define home-range area. Journal of Applied Ecology, 50, 671-679.
Soanes, L.M., Bright, J.A., Bolton, M., Millet, J., Mukhida, F. and Green, J.A., 2015. Foraging behaviour of Brown Boobies Sula leucogaster in Anguilla, Lesser Antilles: preliminary identification of at-sea distribution using a time-in-area approach. Bird Conservation International, 25, 87-96.
Spelt, A., Williamson, C., Shamoun-Baranes, J., Shepard, E., Rock, P., and Windsor, S., 2019. Habitat use of urban-nesting lesser black-backed gulls during the breeding season. Scientific Reports, 9(1), 10527.
Spina, F., Baillie, S. R., Bairlein, F., Fiedler, W., & Thorup, K. 2022. The Eurasian African Bird Migration Atlas. EURING/CMS.
Stanbury, A., Burns, F., Aebischer, N., Baker, H., Balmer, D., Brown, A., Dunn, T., Lindley, P., Murphy, M., Noble, D., Owens, R., Quinn, L. 2024. The status of the UK’s breeding seabirds: an addendum to the fifth Birds of Conservation Concern in the United Kingdom, Channel Islands and Isle of Man and second IUCN Red List assessment of extinction risk for Great Britain. British Birds, 117: 471–487.
Sumner, M.D., 2016. Trip: Tools for the Analysis of Animal Track Data. R package version 1.5.0. .
Thaxter, C.B., Lascelles, B., Sugar, K., Cook, A.S., Roos, S., Bolton, M., Langston, R.H. and Burton, N.H., 2012. Seabird foraging ranges as a preliminary tool for identifying candidate Marine Protected Areas. Biological Conservation, 156, 53-61.
Thaxter, C.B., Ross-Smith, V.H., Clark, J.A., Clark, N.A., Conway, G.J., Marsh, M., Leat, E.H.K. and Burton, N.H.K., 2014. A trial of three harness attachment methods and their suitability for long-term use on Lesser Black-backed Gulls and Great Skuas. Ringing and Migration, 29, 65-76.
Thaxter, C.B., Ross-Smith, V.H., Bouten, W., Clark, N.A., Conway, G.J., Rehfisch, M.M. and Burton, N.H.K., 2015. Seabird–wind farm interactions during the breeding season vary within and between years: A case study of Lesser Black-backed Gull Larus fuscus in the UK. Biological Conservation, 186, 347-358.
Thaxter, C.B., Clark, N.A., Ross-Smith, V.H., Conway, G.J., Bouten, W. and Burton, N.H.K., 2017. Sample size required to characterize area use. Journal of Wildlife Management, 81, 1098-1109.
Thaxter, C.B., Ross-Smith, V.H., Bouten, W., Clark, N.A., Conway, G.J., Masden, E.A., Clewley, G.D., Barber, L.J., and Burton, N.H.K., 2019. Avian vulnerability to wind farm collision through the year: Insights from lesser black-backed gulls (Larus fuscus) tracked from multiple breeding colonies. Journal of Applied Ecology, 56, 2410–2422. https://doi.org/10.1111/1365-2664.13488
Thaxter, C.B., 2020. BTOTrackingTools: An R package to load, manipulate and analyse tracking data. https://github.com/BritishTrustForOrnithology/BTOTrackingTools
Thaxter, B.C., Quinn, L.R., and Humphreys, E.M., 2021. Terrestrial and marine foraging ranges of Lesser Black-backed Gulls and Herring Gulls. NatureScot Research Report No.1287.
Thaxter, C.B., 2021. BTOWindFarms: R package to analyse animal movements in relation to windfarms.
Thaxter, C.B., Quinn, L., Atkinson, P., Booth Jones, K.A., Clakr, N.A., Clewley, G.D., Green, R.M.W., O’Hanlon, N, J., Johnston, D.T., Masden, E.A., Ross-Smith, V.H., Sage, E.L., Scragg, E., Taylor, R., Burton, N.H.K. and Humphreys, E. M. 2025 Breeding and foraging habitat are important in determining foraging ranges of sympatric generalist species. Ibis.In press.
The Crown Estate, 2023. Offshore Wind Report. https://www.thecrownestate.co.uk/our-business/marine/offshore-wind-report-2023. Accessed 21/05/2024.
The Crown Estate, 2024. INTOG: 13 projects selected to support green innovation and help decarbonise North Sea. Accessed 21/05/2024.
UK Government, 2019. The Climate Change Act 2008 (2050 Target Amendment) Order 2019.http://www.legislation.gov.uk/uksi/2019/1056/article/2/made.
van Donk, S., Camphuysen, K.C.J., Shamoun-Baranes, J., and Meer, J. Van Der., 2017. The most common diet results in low reproduction in a generalist seabird. Ecology and Evolution, 1–10. https://doi.org/10.1002/ece3.3018
van Donk, S., Shamoun-Baranes, J., Meer, J. Van Der and Camphuysen, K.C.J., 2019. Foraging for high caloric anthropogenic prey is energetically costly. Movement Ecology, 7, 17.
Vandenabeele, S.P., Shepard, E.L., Grogan, A. and Wilson, R.P., 2012. When three per cent may not be three per cent; device-equipped seabirds experience variable flight constraints. Marine Biology 159, 1–14.
Warwick-Evans, V., Atkinson, P.W., Gauvain, R.D., Robinson, L.A., Arnould, J.P.Y. and Green, J.A., 2015. Time-in-area represents foraging activity in a wide-ranging pelagic forager. Marine Ecology Progress Series, 527, 233-246.
Watts, B., Truitt, B., Smith, F., Mojica, E., Paxton, B., Wilke, A. and Duerr, A., 2008. Whimbrel tracked with satellite transmitter on migratory flight across North America. Wader Study Group Bulletin, 115, 119–121.
Woodward, I.D., Thaxter, C.B., Owen, E., Bolton, M., Ward, R.M. and Cook, A.S.C.P., 2024. The value of seabird foraging ranges as a tool to investigate potential interactions with offshore wind farms. Ocean Coastal Management, 254 107192.


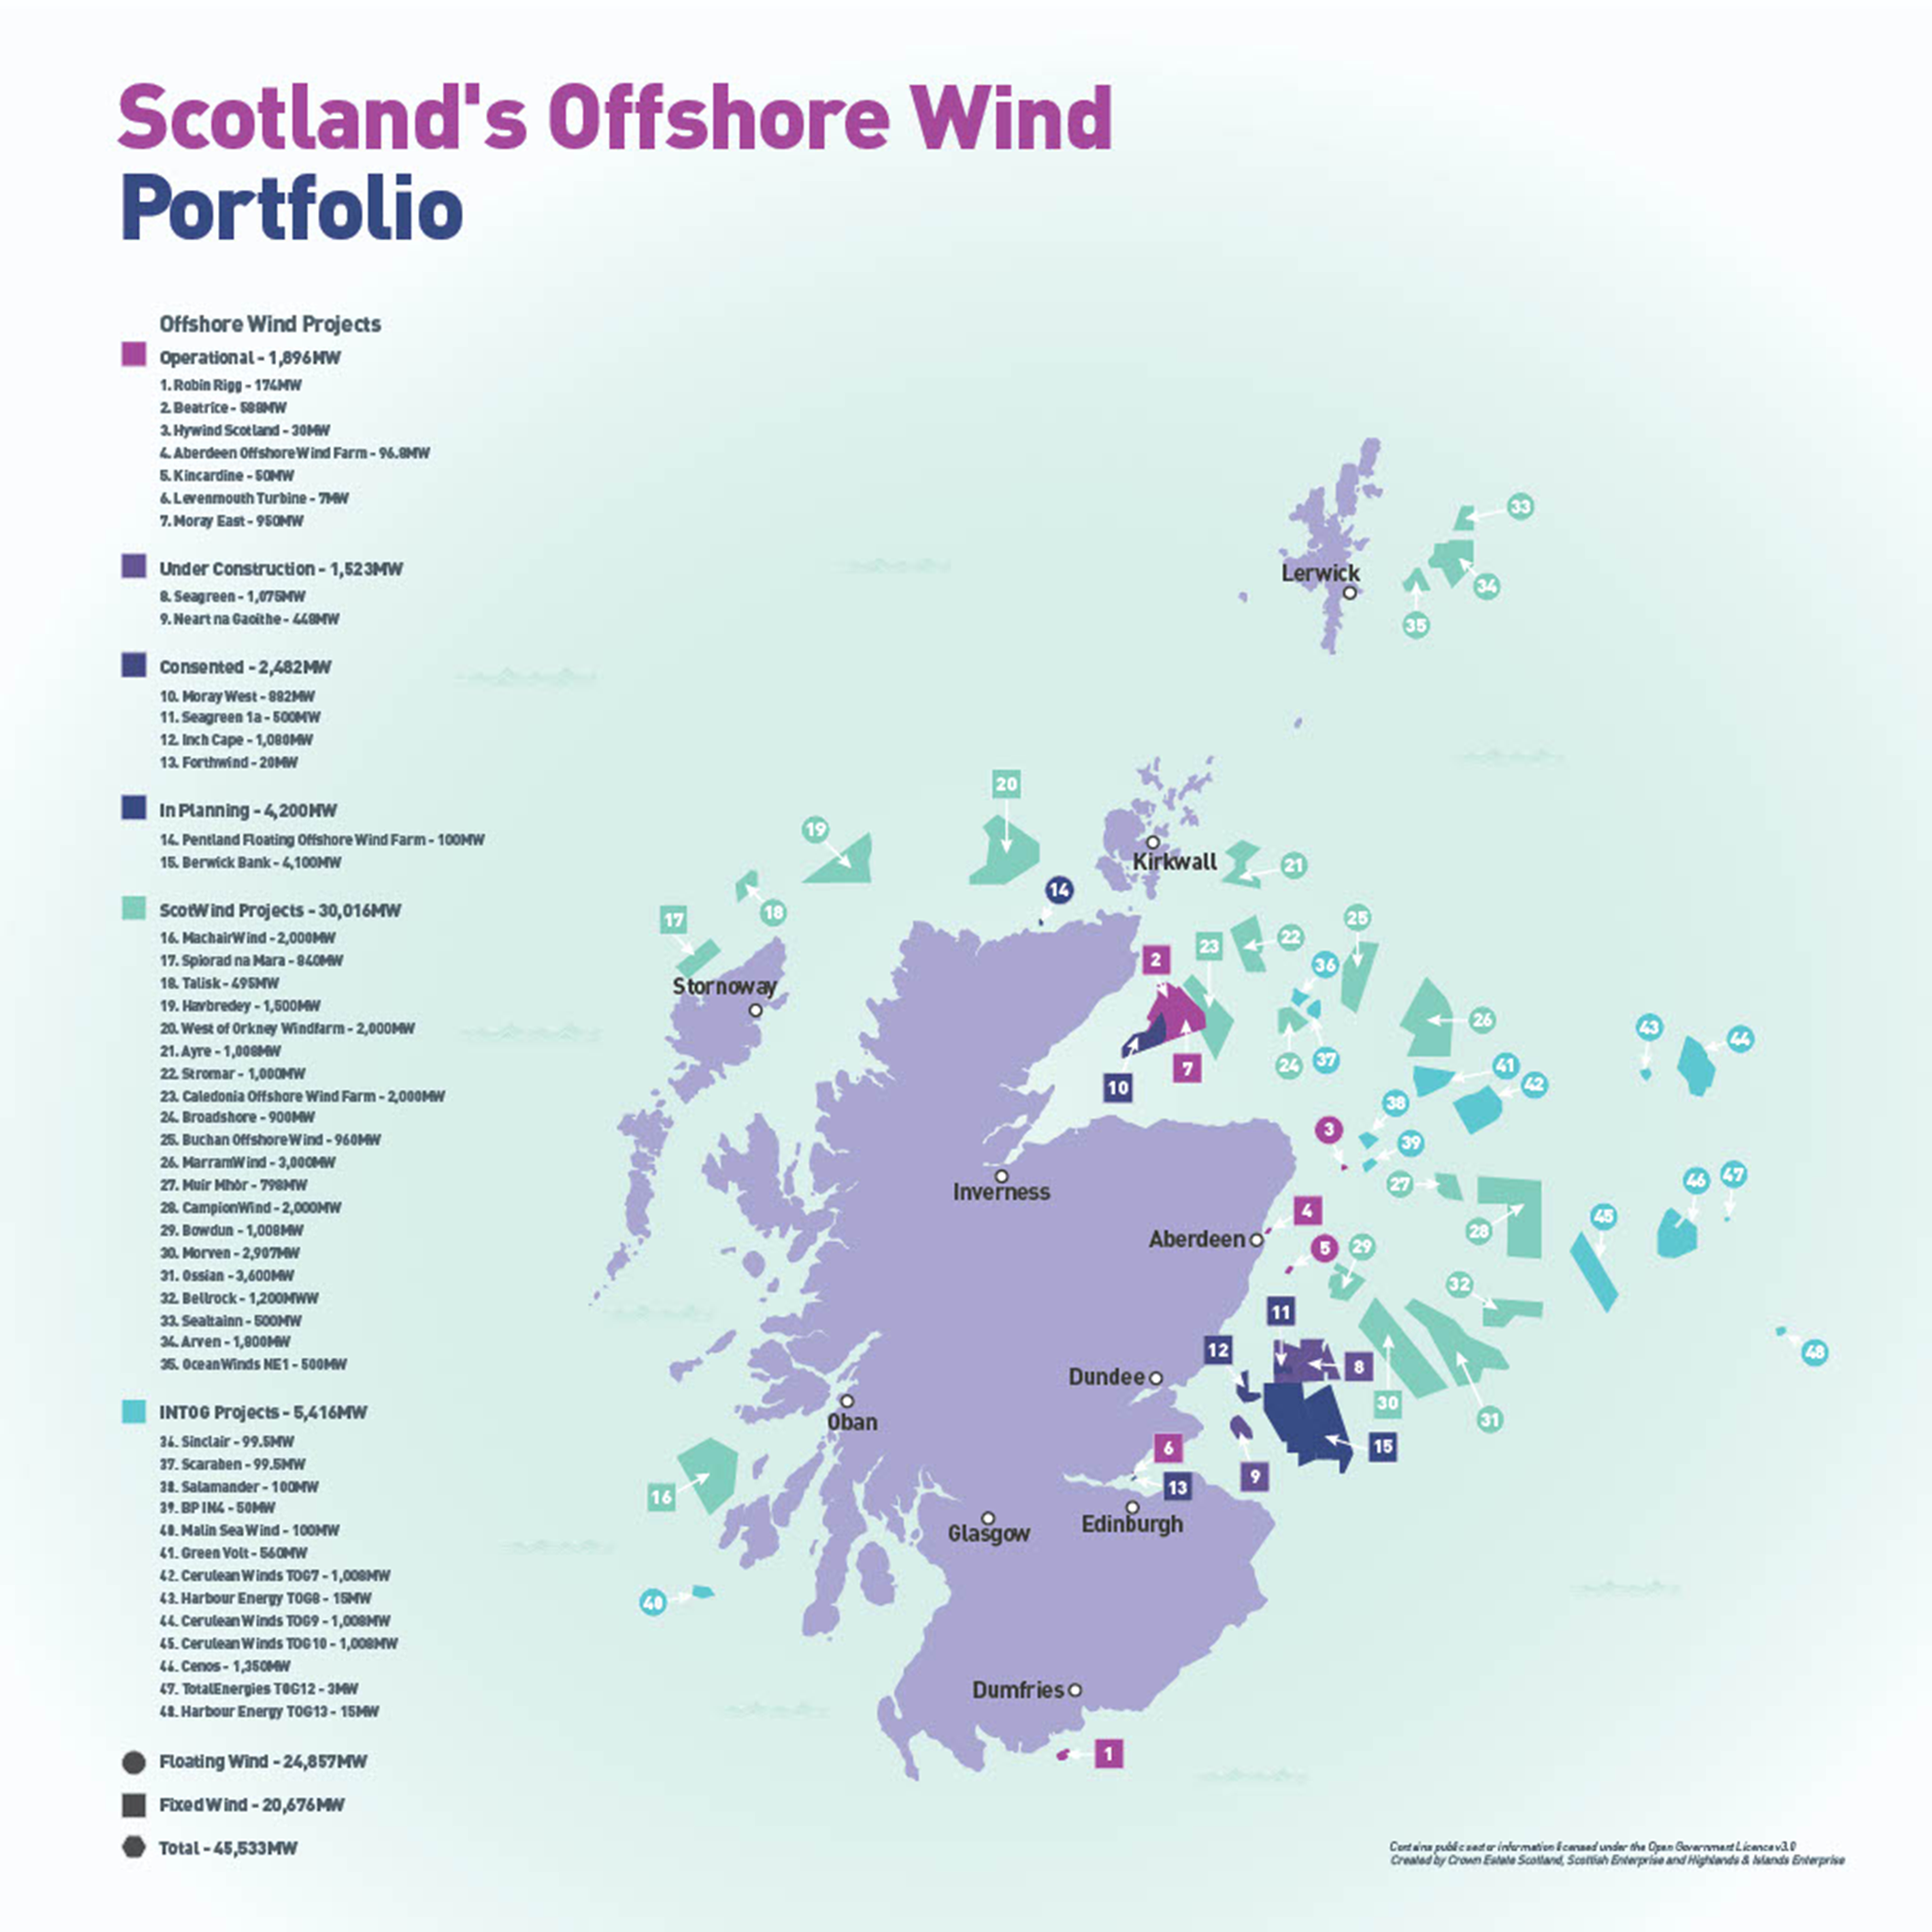
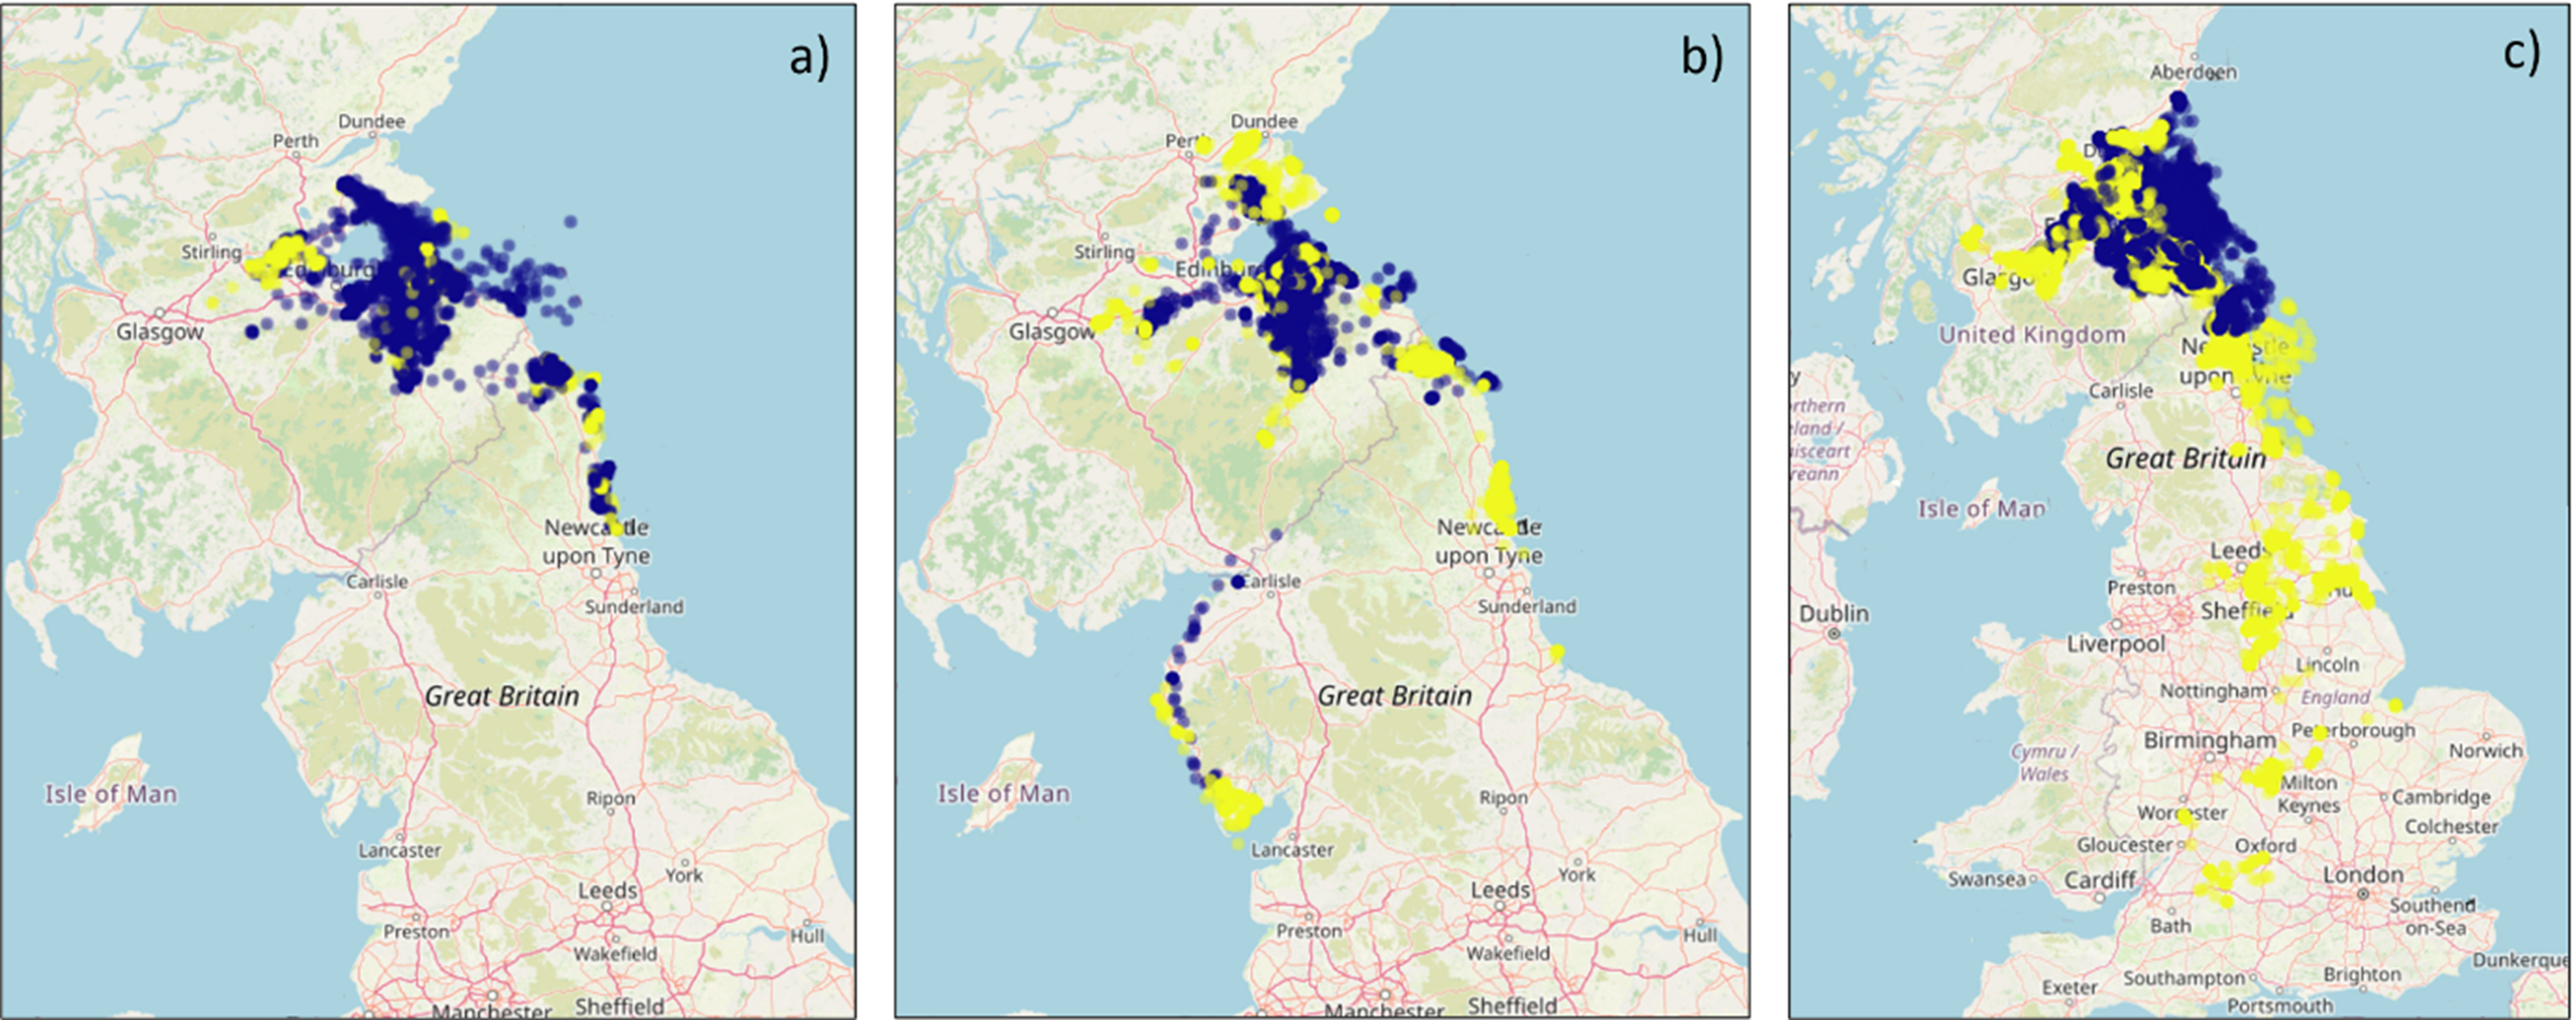
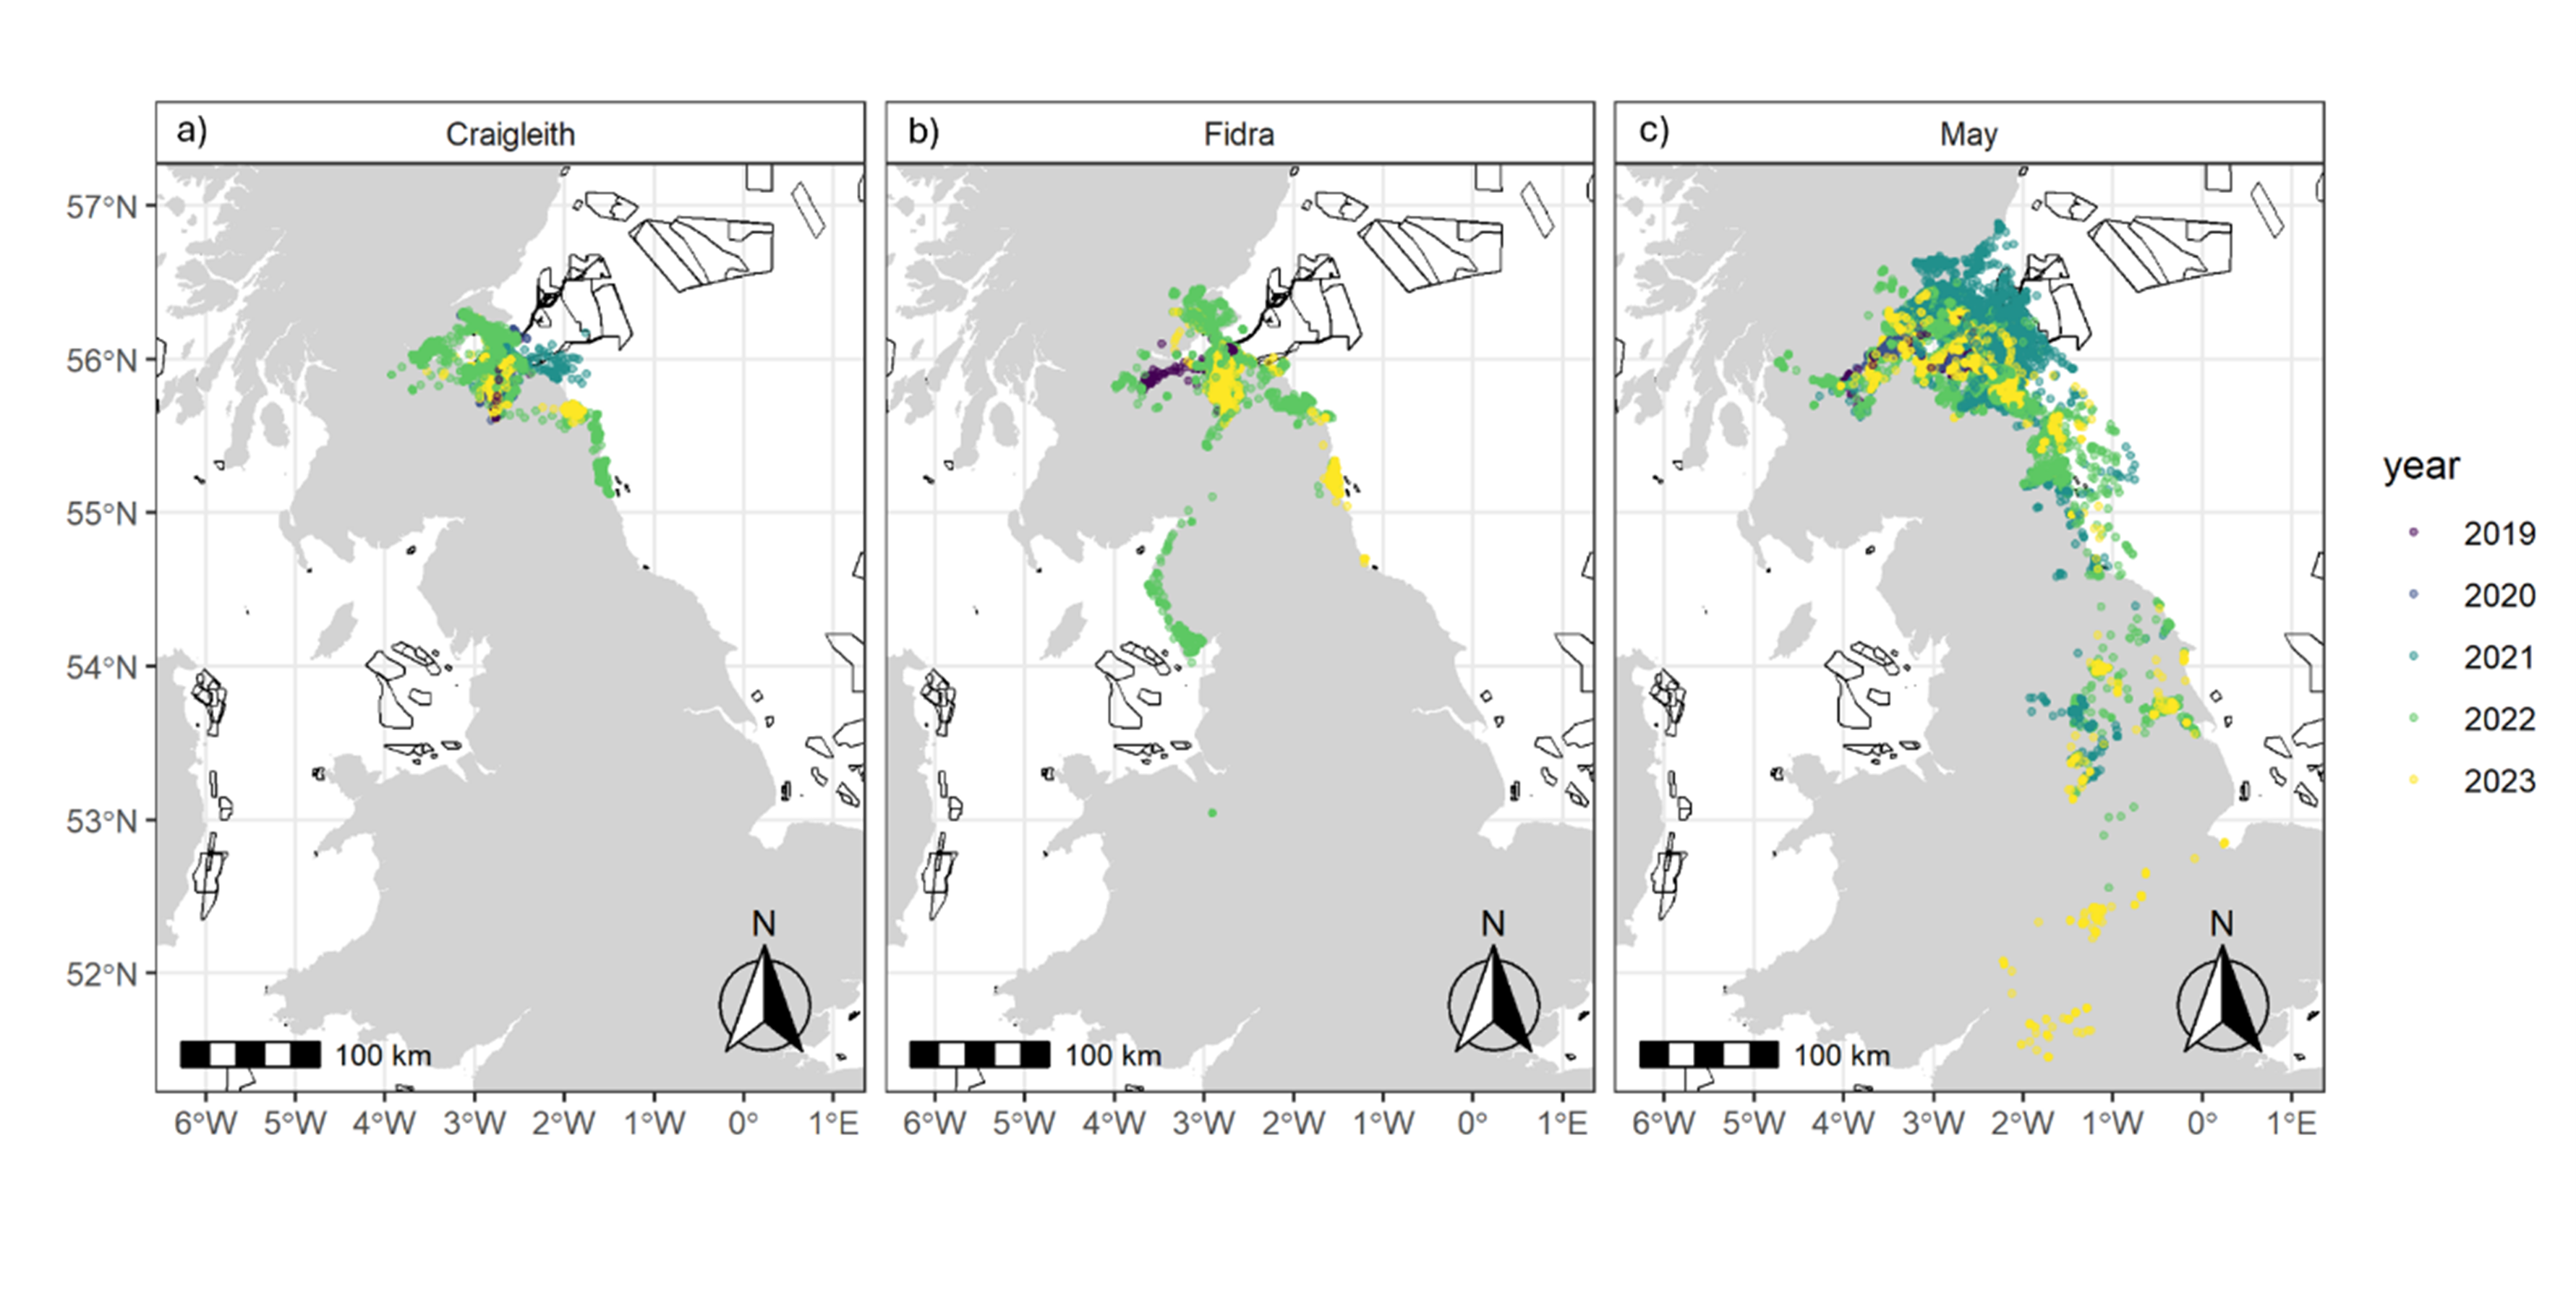
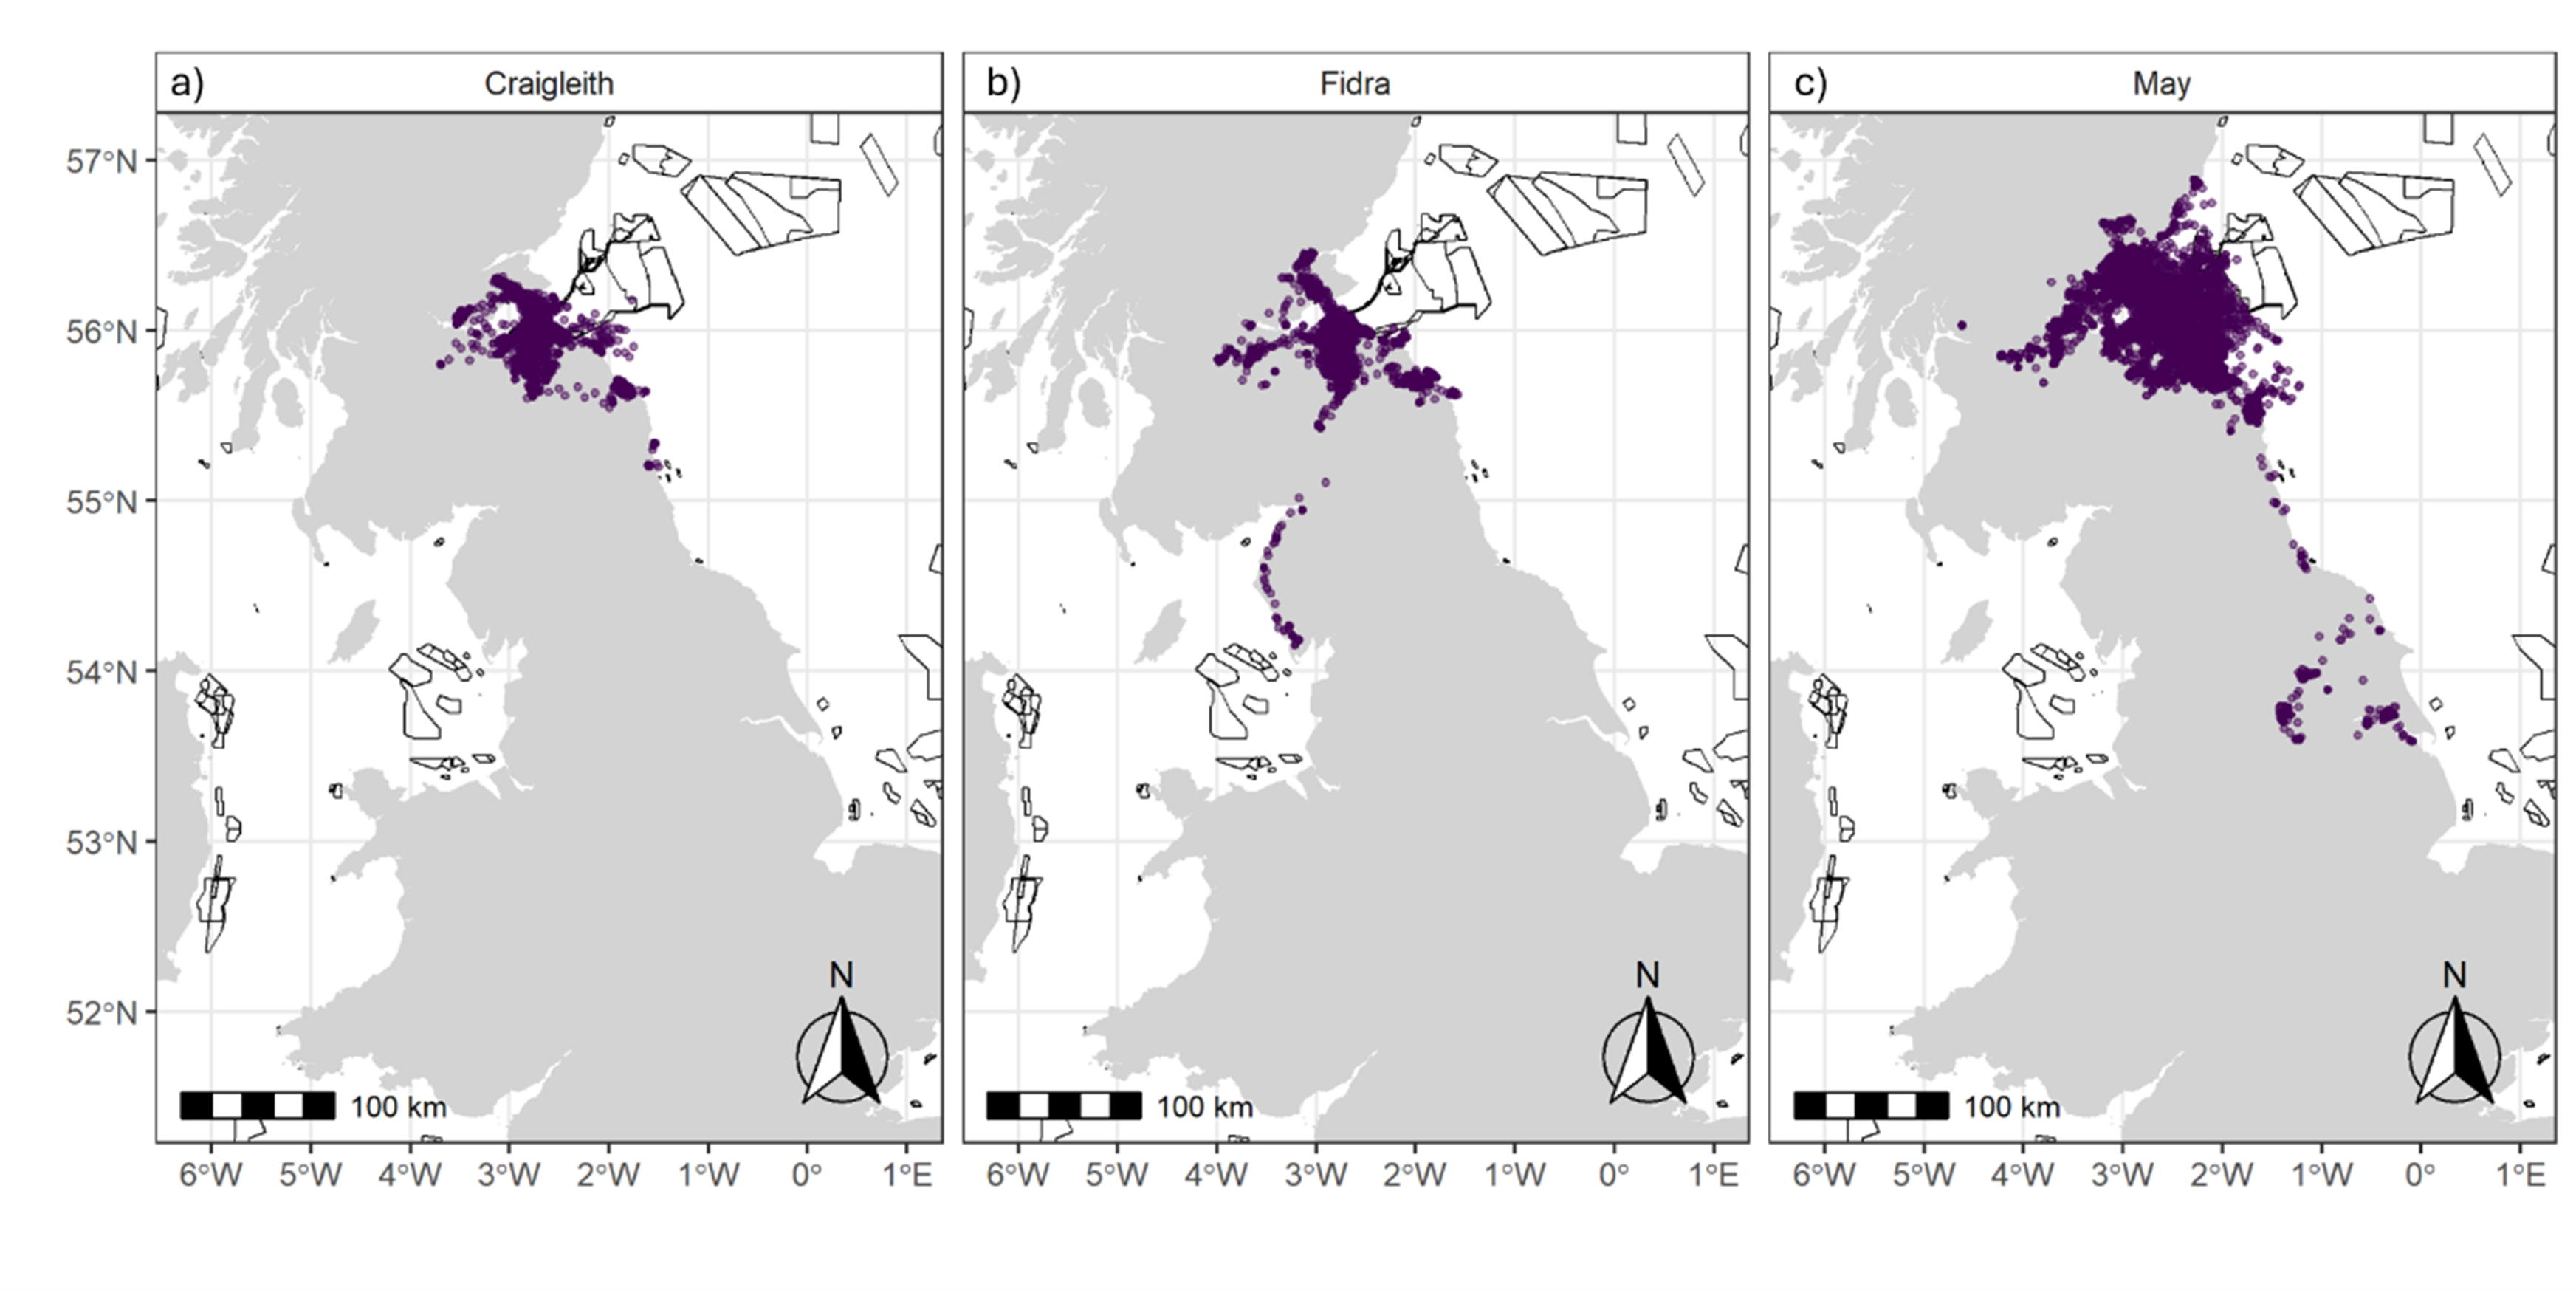
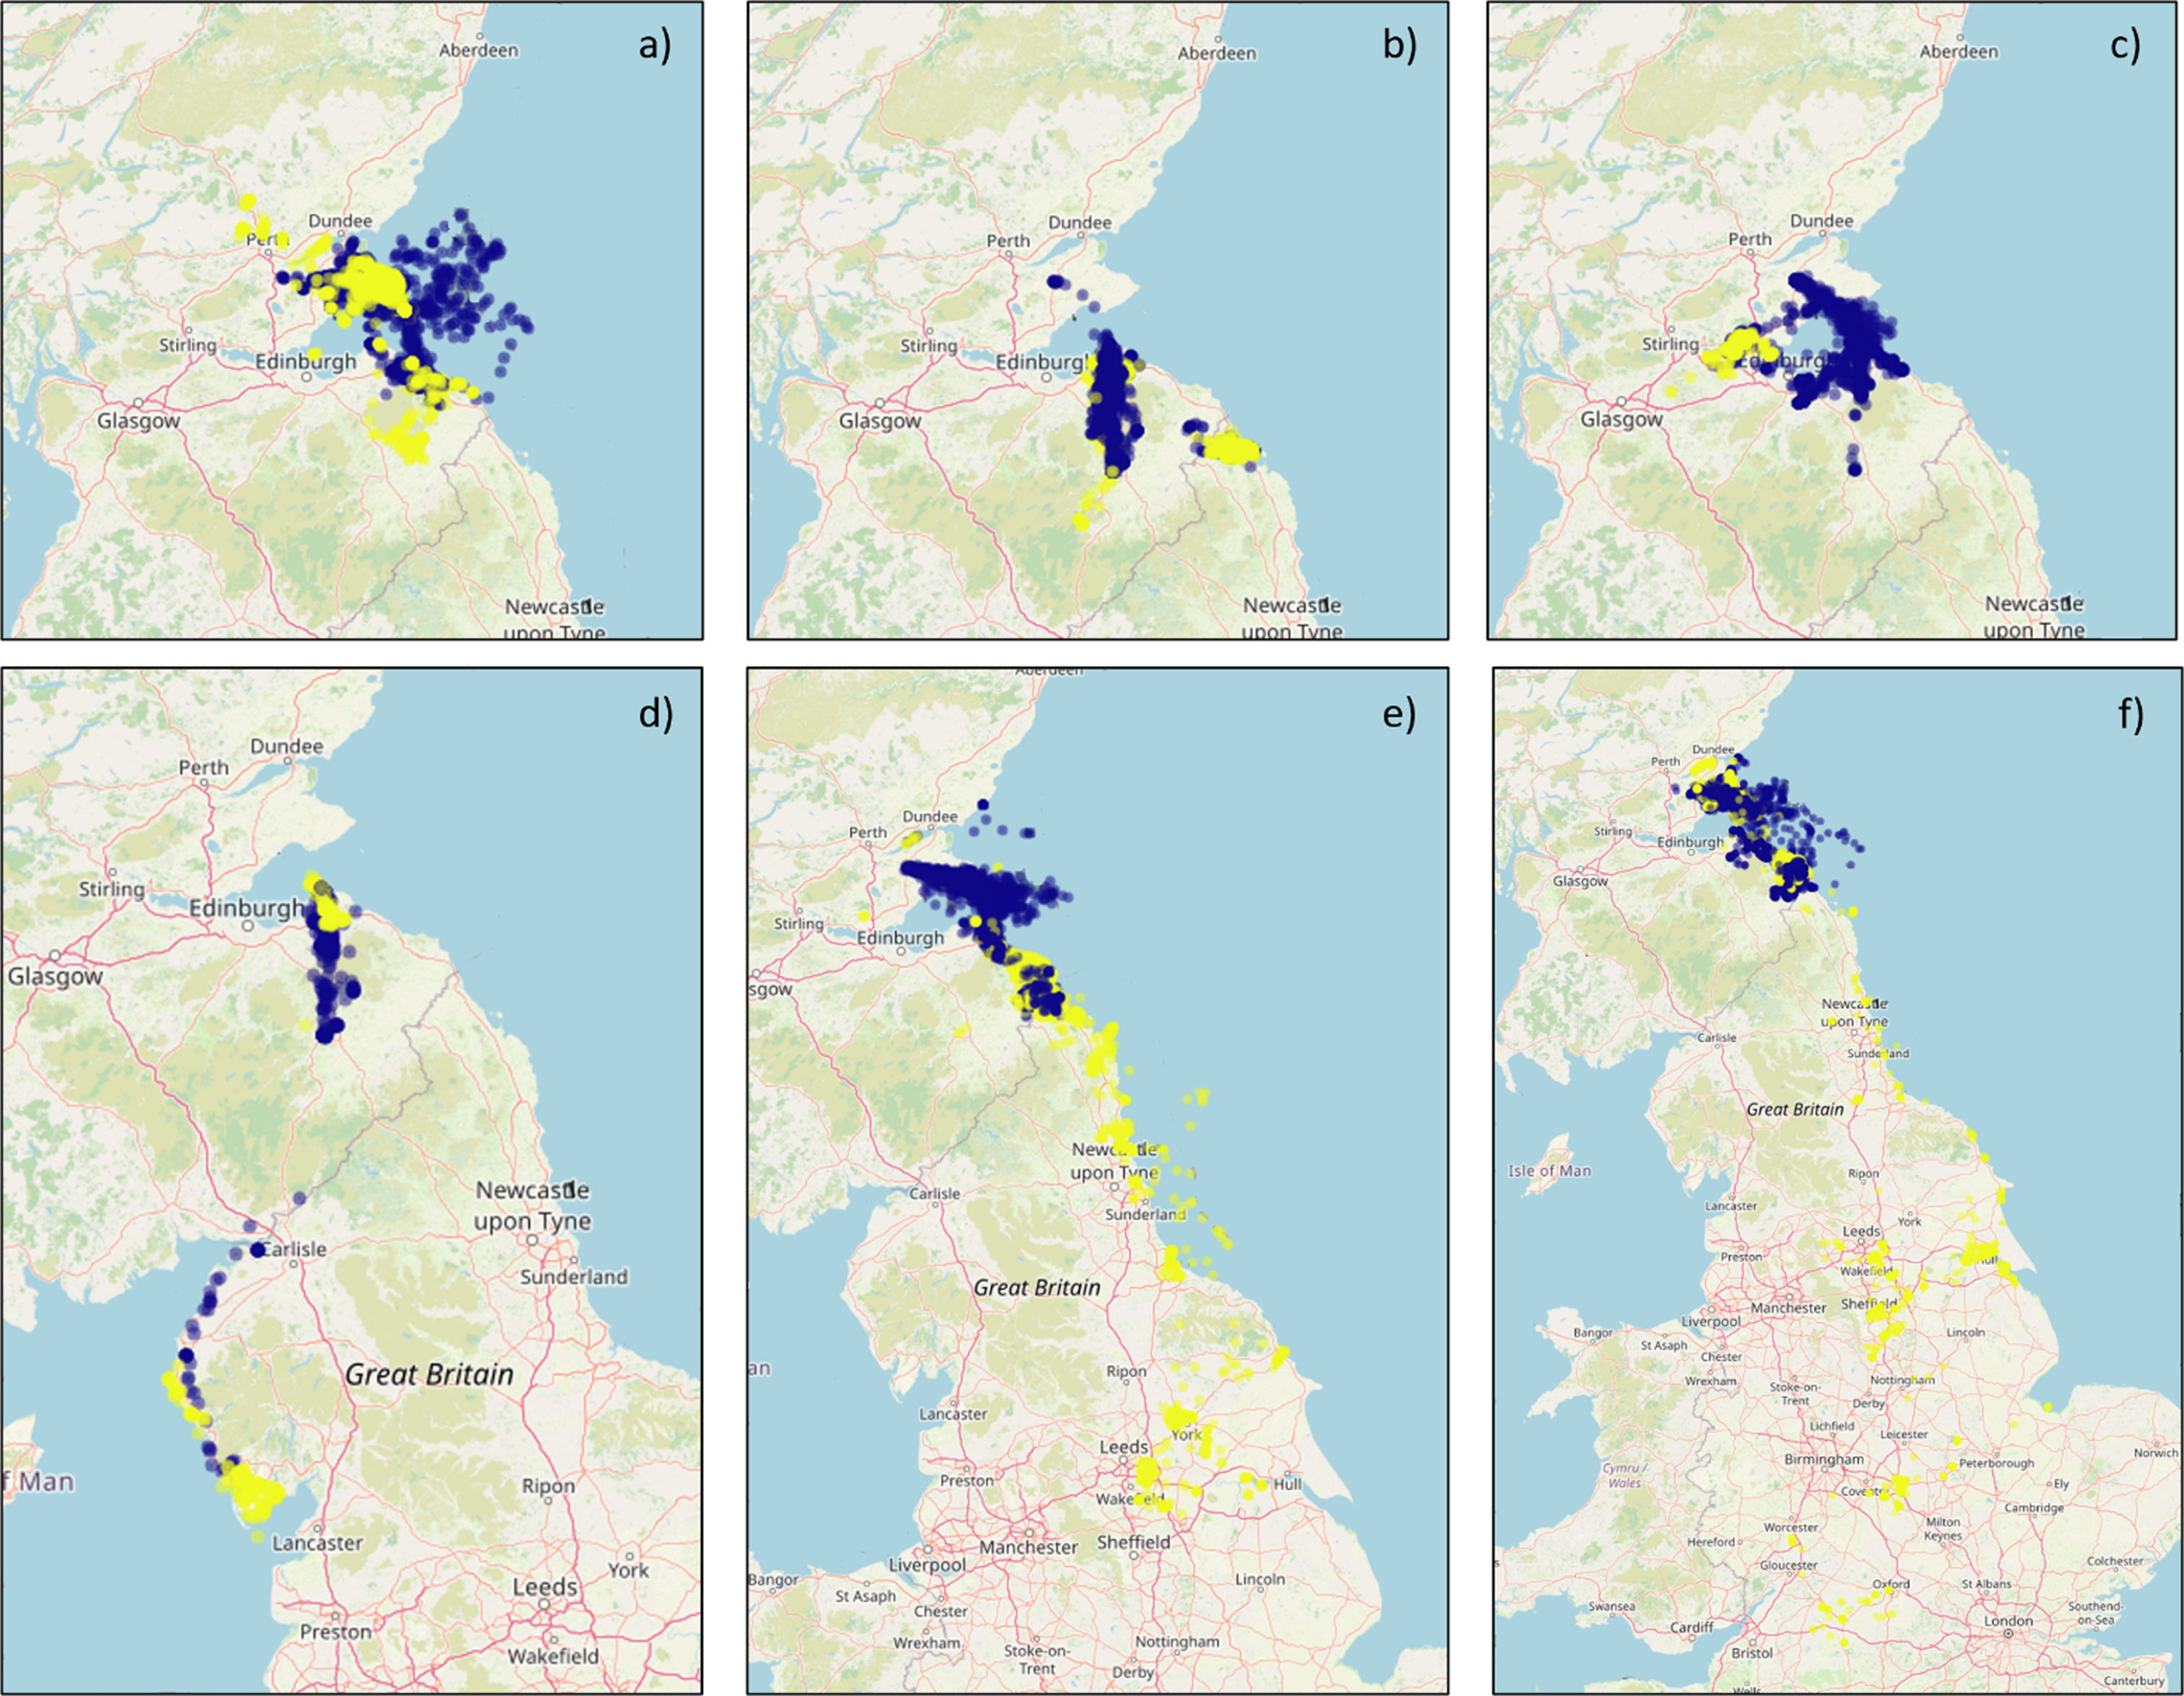
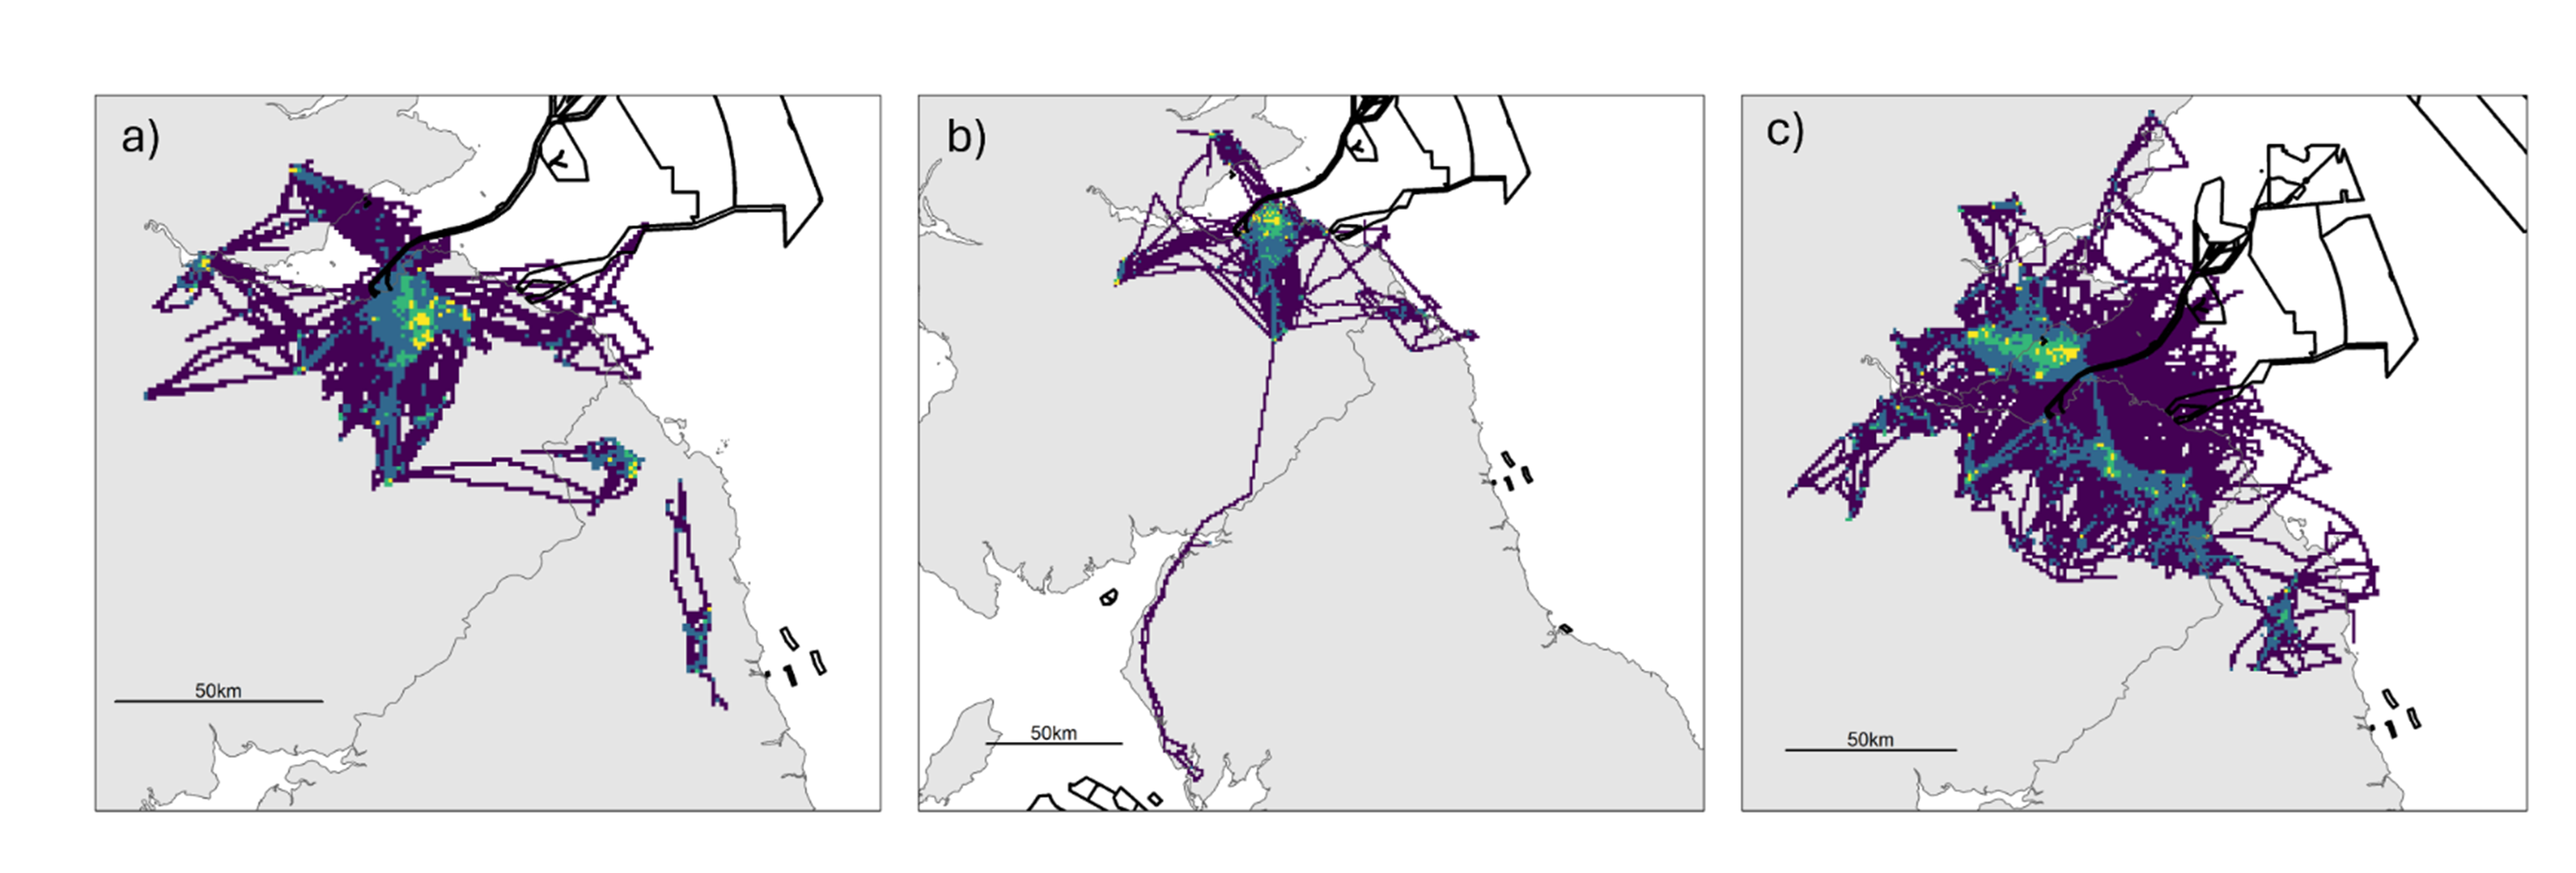
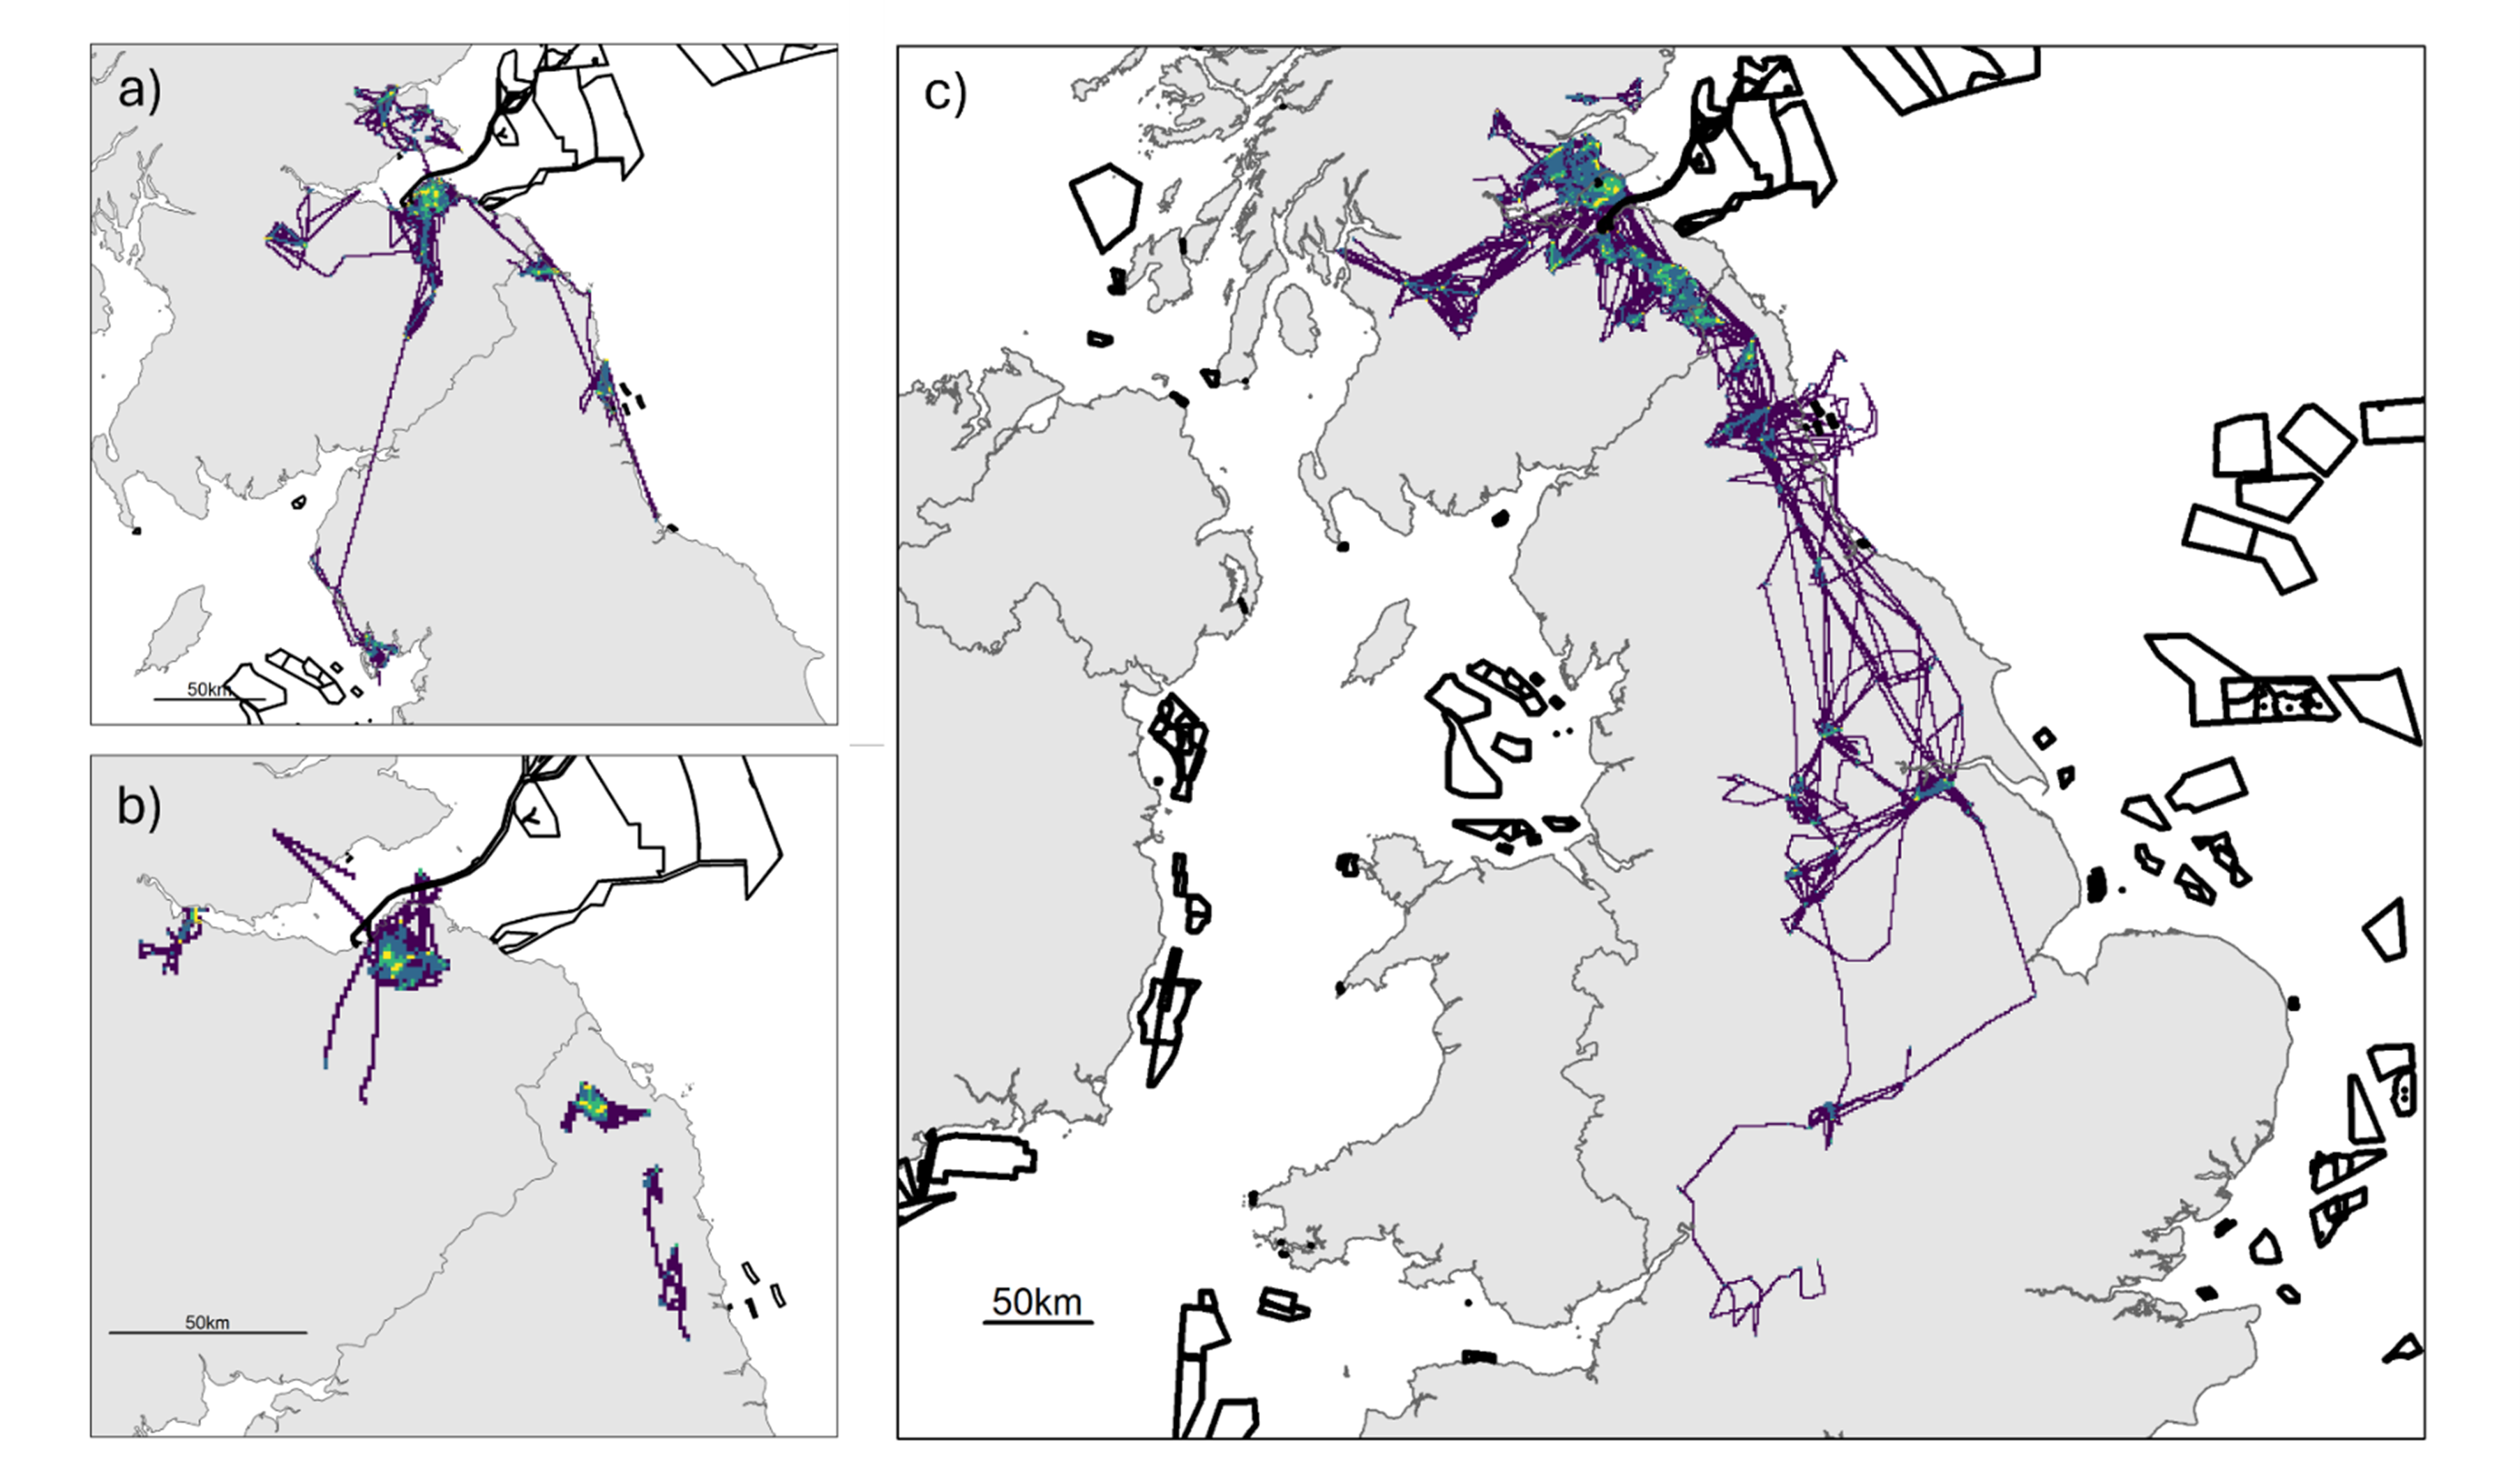
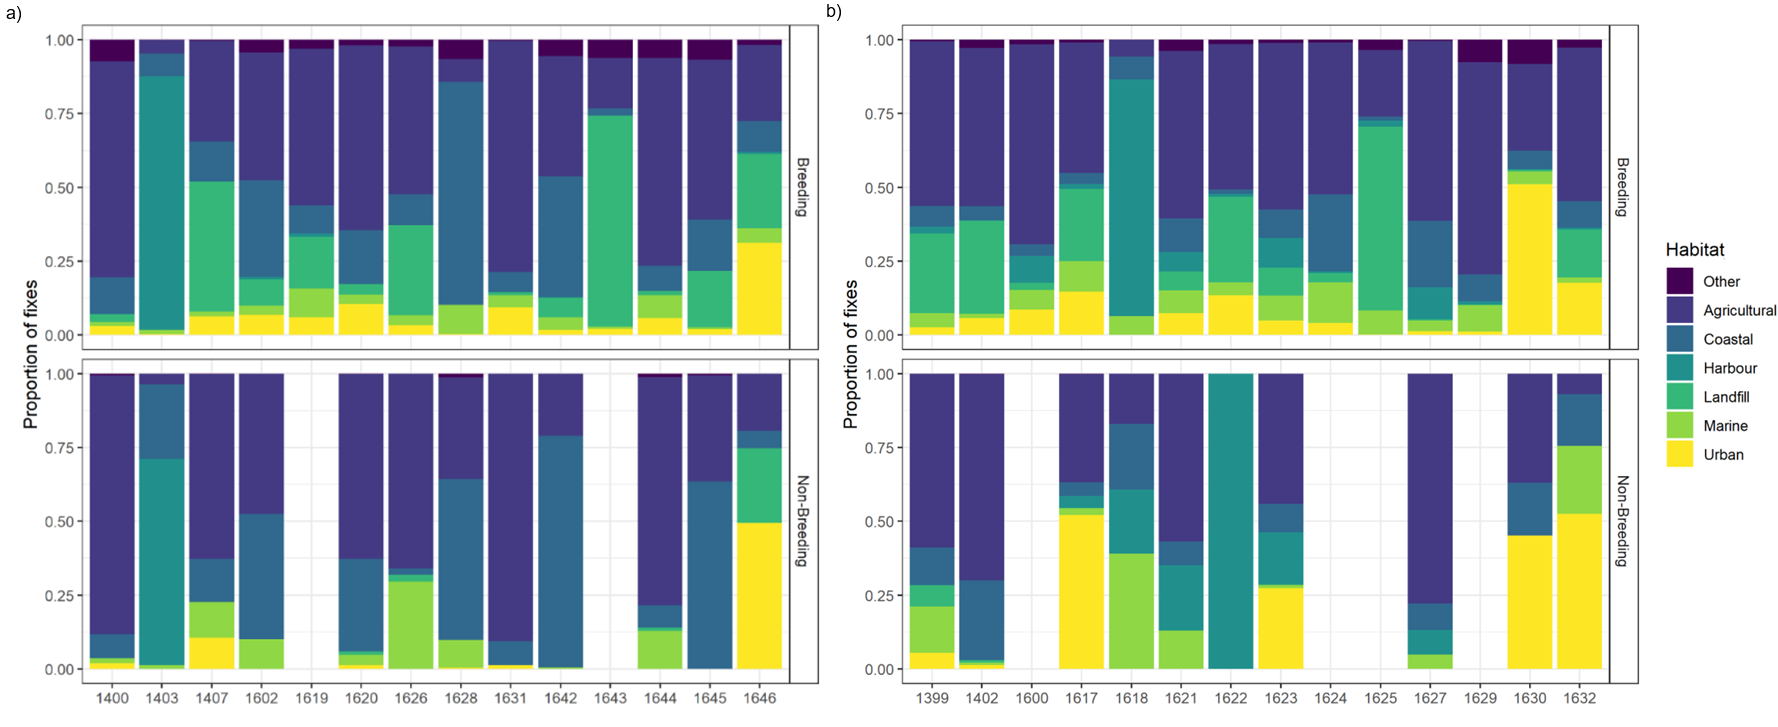
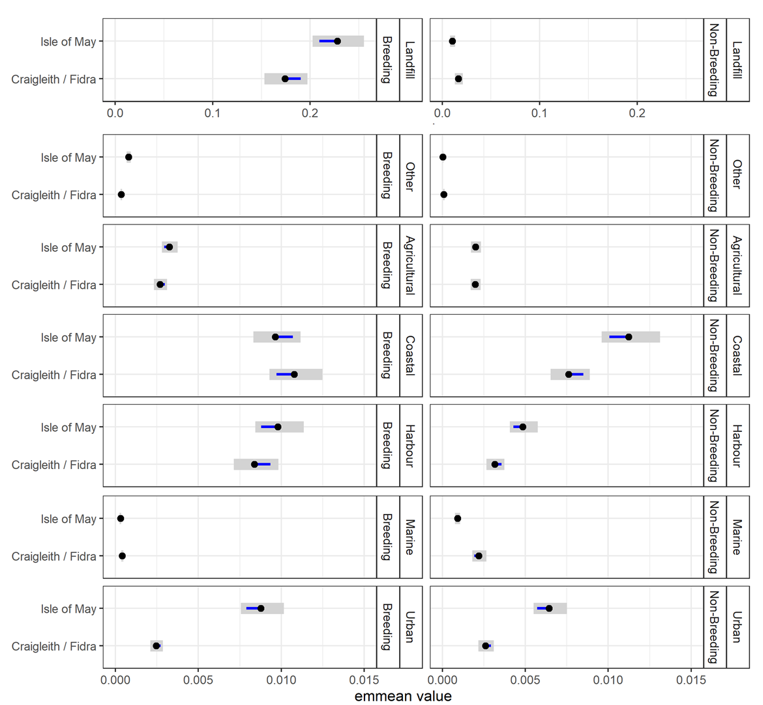