The Proportion of Scotland's Protected Sites in Favourable Condition 2026
An Official Statistics Publication for Scotland
The diversity of Scotland’s biological and geological natural features is a particularly rich and valued natural resource. A series of nature conservation designations aim to protect the best examples, nationally and internationally, of the nation’s wildlife populations, habitats and earth science features, which include geological outcrops and landforms, fossil beds and caves:
- National: Site of Special Scientific Interest (SSSI);
- European: Special Area of Conservation (SAC) and Special Protection Area (SPA);
- International: Ramsar.
In total these designations cover 1,890 sites protecting nature across Scotland, although some of their boundaries overlap. They host 5,641 designated natural features of which 5,437 have been assessed. Six are planned to be denotified and so 5,431 features form this official statistic.
The figures presented here are correct as of 31 March 2026. Figures exclude offshore marine sites and features in Scotland beyond 12 nautical miles (NM). All candidate SACs are also excluded from these figures.
Assessment
The proportion of natural features in favourable condition on protected sites at 31 March 2026 was 74.5%. This figure comprises:
- Site Condition Monitoring (SCM) Condition Assessment – Favourable 64.2%
- SCM Condition Assessment – Unfavourable Recovering 6.3%
i.e. monitoring has detected signs of recovery but favourable condition has not been reached. - Unfavourable Recovering Due to Management Change 4.0%
i.e. positive management is in place that is expected to improve the condition of the site but this has not yet been assessed on the ground.
Change (2025 – 26): Stable
Long term trend (2005 - 26): Increase
A difference of less than +/-1 percentage point from last year's figure suggests that the position is more likely to be remaining stable than changing.
Key points
- The proportion of features in favourable condition has decreased by 0.7 percentage point in the last year from 75.2% to 74.5%.
- The proportion of features in favourable condition has increased by 3.1 percentage points between 2005 and 2024 from 71.4% to 74.5%.
- The proportion of features in favourable condition has declined since the current protocols were put in place in 2007 (-1.5 percentage point difference from 76.0%)
- The proportion of features in favourable condition has decreased by 5.9 percentage points since 2016 when it peaked at 80.4%.
Evidence
The condition of the features on protected sites in Scotland is assessed by NatureScot’s Site Condition Monitoring (SCM) programme. SCM is a rolling programme of monitoring which aims to assess the condition of a sample of designated natural features each year and acts as a trigger mechanism for follow-up work when an unfavourable assessment is concluded.
Figure 1 indicates how the proportion of features in favourable condition has changed since the baseline was established in 2005. Where features have been found to be in unfavourable condition, remedial management measures are put into place, with the aim of improving them, and progress is tracked according to methodologies established in 2007. The figures presented below include the latest assessment for all those features that have been assessed by 31 March of the relevant year.
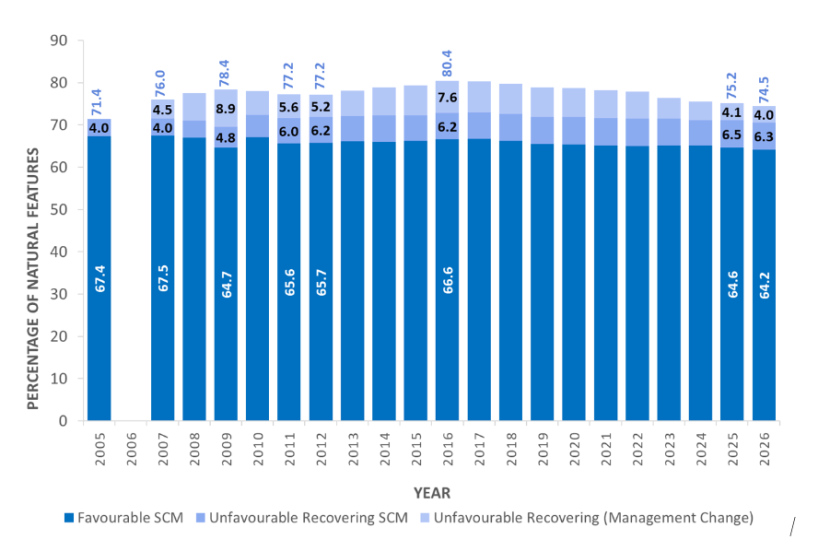
Figure 1. The Proportion of Features in Favourable Condition at 31 March 2026
Click for a full description
Figure 1 indicates how the proportion of features in favourable condition has changed since the baseline was established in 2005. Assessments were not undertaken in 2006. For definitions of condition categories see ‘Source data and updates’ section. There are three favourable categories: assessed as favourable, assessed as unfavourable recovering, and unfavourable recovering due to management changes. The total proportion of features in favourable condition increases from 71.4% in 2005 to 78.4% in 2009. After this, it drops to 77.2% in 2010 and 2011 and then increases to its peak of 80.4% in 2016. Since then, the proportion of features in favourable condition has decreased to 74.5% in 2026. Data labels only provided for peaks, troughs and reference values for clarity.
Commentary
SCM is a rolling programme of monitoring and the proportion of natural features in favourable condition is dynamic. This movement reflects new condition assessments being completed as well as the implementation or cessation of remedial management activities, which can affect the categorisation of whether something is ‘unfavourable recovering due to management change’. The figures presented here are, therefore, a snapshot of the position at 31 March in the given year.
By 31 March 2026, of the 5,641 designated natural features on protected sites, the condition of 5,431 had been assessed and thus form the Official Statistic. As new SCM assessments are completed (either first or repeat assessments), they are used to update the proportion of features in favourable condition. There have been 176 SCM feature assessments completed in 2025/26, 3.1% of all features, a decrease from 309 assessments in 2024/25.
There is considerable variation in the proportion of natural features in favourable condition across the different natural feature categories, as can be seen in Table 1. A more detailed breakdown of the proportion of individual natural feature types in favourable condition within these categories is in Annex 1.
| Feature Category | Number of Features 2025 | Proportion Favourable 2025 | Number of Features 2026 | Proportion Favourable 2026 | Change in percentage points from 2025 to 2026 |
|---|---|---|---|---|---|
| Habitats | 2,447 | 72.7% | 2,445 | 71.8% | -0.9 |
| Species | 2,320 | 72.5% | 2,320 | 71.9% | -0.6 |
| Earth Sciences | 666 | 94.4% | 666 | 93.8% | -0.6 |
| All Feature Types | 5,433 | 75.2% | 5,431 | 74.5% | -0.7 |
See Annex 1 for the list of features included in each feature category.
The changes in condition assessments as a result of the new assessments are summarised below:
- The improvement in the proportion of features in favourable condition is outweighed by the number of features deteriorating.
- The condition of 10 features had a positive impact on the statistic, which comes from:
- 9 features which previously had an Unfavourable assessment have now been assessed as favourable (birds (7), upland (1) and woodland (1)).
- One feature which was assessed for the first time and found to be favourable (birds (1)).
- During the same period, the condition of 46 natural features had a negative impact on the statistic. These are made up of:
- 41 natural features which were previously in favourable condition but were assessed as unfavourable through new SCM assessment (birds (18), upland (5), heath (4), grasslands (4), Earth sciences (4), woodlands (3), wetland (1), invertebrates (1) and freshwater (1)).
- Five natural features which were previously in Unfavourable Recovering Due to Management but are now reported as unfavourable through new SCM assessment (woodlands (2), grasslands (1), heath (1), non-vascular plants (1)).
- 120 features were assessed in 2025/26 and either did not change condition or have a neutral impact on the statistic, made up of:
- 45 natural features continue to be assessed as favourable condition (birds (34), Earth science (4), grasslands (3), uplands (2), woodlands (1) and invertebrates (1)).
- 71 natural features continue to be assessed as unfavourable condition (birds (57), woodlands (4), grasslands (3), heath (3), upland (2), coastal (1) and wetland (1)).
- Three natural features previously assessed as Unfavourable Recovering Due to Management, but which are now considered favourable through new SCM (heath (3)).
- One woodlands natural feature previously assessed as Unfavourable Recovering Due to Management that remained Unfavourable Recovering Due to Management.
The net effect is a 0.7 percentage point decrease in the proportion of natural features in favourable condition during the last year from 75.2% to 74.5%.
Negative Influences
The most common negative influences (known as pressures) on natural features on protected sites that can affect condition can be seen in Figure 2. Individual natural features on a site may be adversely affected by one or more pressures.
Invasive species is the single biggest negative pressure on natural feature condition. The proportion is 21.3% of all negative pressures in 2025/26 and has remained almost constant at this level (within 1 percentage point) for several years. The species can be both native (e.g. bracken) and non-native (e.g. Rhododendron) species. Different natural feature types appear to be affected by different types of invasive species. For example, woodland and freshwater habitats are mainly adversely affected by non-native species such as Rhododendron or Japanese knotweed. Conversely, lowland grassland and coastal habitats are affected by the spread of invasive native species such as gorse, bracken and nettles.
Whether native or non-native, invasive species can have a detrimental effect on important habitats and the flora and fauna they support by competing for nutrients and light and ultimately changing the ecology of the habitat.
Figure 2 shows that the second largest negative pressure on natural features is overgrazing, at 17.8% of negative pressures in 2025/26. Overgrazing has also remained almost constant at this level (within 1 percentage point) for several years. This can be by wild herbivores such as deer, feral goats or rabbits; or farm stock; or a combination of both wild and domestic grazers. Under grazing, which can disrupt the balance of species resulting in loss of diversity, has also been frequently identified. Delivering remedial management on protected areas where over- or under-grazing is an issue can often be complex, particularly where the issue involves the management of wild deer herds, which regularly move across ownerships depending on the season, weather conditions and forage availability.
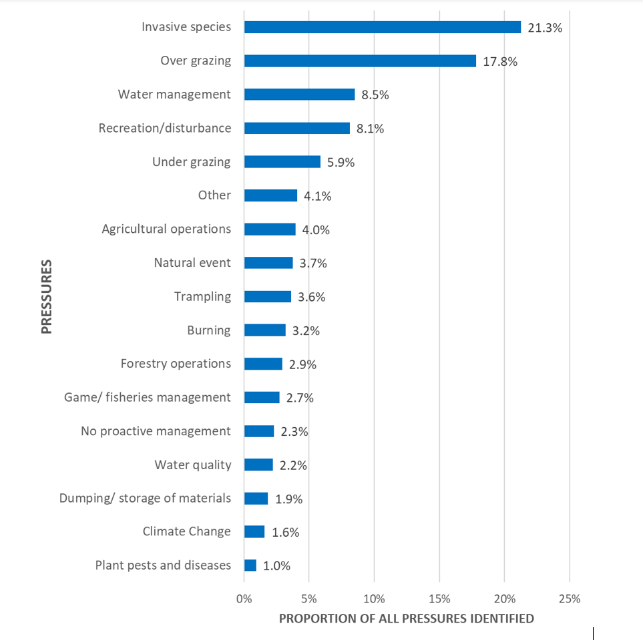
Figure 2. Summary of the main negative pressures on natural features on protected sites.
Click for a full description
Data correct as of 31st March 2026. Pressures are recorded for all natural features assessed in all conditions. Figure 2 only lists pressures where the proportion is greater than 1%. Invasive species is the most frequent pressure with this being 21.3% of all pressures identified, the second most frequent pressure is over-grazing (17.8%), and then water management (8.5%) , recreation / disturbance (8.1%), under-grazing (5.9%), other pressures (4.1%), agricultural operations (4.0%), natural event (3.7%), trampling (3.6%), burning (3.2%), forestry operations (2.9%), game / fisheries management (2.7%), no protective management (2.3%), water quality (2.2%), dumping / storing of materials (1.9%), climate change (1.6%) and plant pests and diseases (1.0%).
Source data and updates
To measure progress on the condition of protected nature sites, the following are taken into account:
- the results of SCM,
- actions that have been taken to put in place remedial management to improve the condition of the natural feature.
Where remedial management can be put in place on, or near the site, NatureScot staff and partner organisations engage with land managers and statutory bodies to identify and implement the appropriate measures to promote recovery. Such measures to date have included Forestry Grant Schemes, individual management agreements negotiated by NatureScot, and Scottish Rural Development Programme (SRDP) funding. Voluntary Control Agreements under the Deer (Scotland) Act 1996 have also been widely used to facilitate recovery of unfavourable features in upland areas.
For the purposes of the Official Statistic, ‘favourable condition’ includes natural features that are assessed through SCM as being in favourable or unfavourable recovering condition. It also includes previously unfavourable natural features where necessary management measures have been put in place since the last SCM assessment, so that in NatureScot’s expert judgment the natural feature will in due course reach favourable condition. This means that, as an interim measure, natural features where remedial management has been put in place to address all the known causes of unfavourable condition are counted as favourable. Once these management actions are concluded, the features condition will remain Unfavourable Recovering Due to Management until a new assessment is undertaken. Where a feature has been partially destroyed (e.g. through a housing development) the rest of the feature is assessed in its own right.
The 2005 SCM results set the baseline against which progress is measured.
The framework for making an SCM assessment is the Common Standards Monitoring Guidance, published by Joint Nature Conservation Committee (JNCC). This Guidance provides a common approach to the monitoring of natural features across the whole of the United Kingdom.
The SCM condition assessments are stored on a corporate database held by NatureScot and produce the overall Condition Target results. Access condition data for individual sites and features from the Sitelink website.
The proportion of protected sites in favourable condition will next be updated in 2027. Official Statistics are produced in accordance with the Code of Practice for Official Statistics.
Annex 1: The Proportion of assessed Natural Features in Favourable Condition by Broad Type at 31 March 2026
| Habitats Natural Feature Type | Number of Natural Features | Proportion Favourable (%) | Change in Percentage Points from 2025 |
|---|---|---|---|
| Coastal | 334 | 83.2 | -0.1 |
| Freshwater | 223 | 72.6 | -0.4 |
| Grasslands | 220 | 65.5 | -2.3 |
| Heath | 380 | 72.6 | -1.6 |
| Marine | 106 | 96.2 | No new assessments |
| Upland | 355 | 76.3 | -1.1 |
| Wetland | 343 | 77.0 | -0.4 |
| Woodlands | 484 | 53.3 | -0.8 |
| Habitats Total | 2,445 | 71.8 | -0.9 |
| Species Natural Feature Type | Number of Natural Features | Proportion Favourable (%) | Change in Percentage Points from 2025 |
|---|---|---|---|
| Amphibians | 12 | 83.3 | No new assessments |
| Birds | 1636 | 67.2 | -0.7 |
| Butterflies | 31 | 87.1 | No new assessments |
| Dragonflies | 26 | 100.0 | No new assessments |
| Fish | 46 | 80.4 | No new assessments |
| Invertebrates | 182 | 84.1 | -0.5 |
| Marine Mammals | 29 | 58.6 | No new assessments |
| Non-vascular Plants | 147 | 75.5 | -0.7 |
| Terrestrial Mammals | 51 | 88.2 | No new assessments |
| Vascular Plants | 160 | 89.4 | No new assessments |
| Species Total | 2320 | 71.9 | -0.6 |
| Earth Science Natural Feature Type | Number of Natural Features | Proportion Favourable (%) | Change in Percentage Points from 2025 |
|---|---|---|---|
| Earth Science | 666 | 93.8 | -0.6 |
| Total Natural Feature Type | Number of Natural Features | Proportion Favourable (%) | Change in Percentage Points from 2025 |
|---|---|---|---|
| Total | 5,431 | 74.5 | -0.7 |