NatureScot Research Report 1417 - Digital Aerial Survey of Northern Gannet (Morus bassanus) colonies off North-west Scotland in 2024.
Year of publication: 2026
Authors: Olaya Meza1, C., Quinn2, L., Laurenson2, R., Cotton 1, A., McCloud1, R., Warford1, S. and Jones1 G.C.A.
1 = APEM Ltd; 2 = NatureScot
Cite as: Olaya Meza1, C., Quinn2, L., Laurenson2, R., Cotton 1, A., McCloud1, R., Warford1, S. and Jones1 G.C.A. Digital Aerial Survey of Northern Gannet (Morus bassanus) colonies off North-west Scotland in 2024. NatureScot Research Report 1417.
1 = APEM Ltd; 2 = NatureScot
Keywords
Northern gannet; Sula Sgeir; Sule Stack; Sule Skerry; Flannan Isles; seabird colonies; population trends; HPAI.
Background
NatureScot commissioned APEM Ltd. (APEM) to conduct a 100% coverage digital aerial survey (DAS) to provide standardised colony counts of the Northern gannet (Morus bassanus) offshore breeding colonies in the north-west of Scotland, specifically Sula Sgeir, Sule Stack, Sule Skerry, Flannan Isles, and Rockall. The main aim of the surveys was to assess the status of the different colonies, and the changes the breeding populations have undergone since the previous standardised surveys conducted in 2013 and 2004 (Wanless et al., 2015a, Wanless et al., 2015b). Additional comparisons to non-standardised, longer-term data are provided where applicable. The data collected will further be incorporated into the production of a robust GB-wide breeding population estimate and provide a baseline against which future monitoring can be compared.
Main findings
- Aerial surveys of the five colonies were successfully carried out on the 18th of June (Sula Sgeir, Sule Stack, Sule Skerry, and Flannan Isles), and the 10th of July 2024 (Rockall). Gannets were counted by image analysts and registered as vector points in a geographic information system (GIS). Following counting of Apparently Occupied Sites (AOS) by the initial analysts, the data were quality assured by at least one highly experienced QA analyst, and a technical specialist.
- AOS counts for 2024 were as follows; Sula Sgeir (10,200 AOS), Sule Stack (2,947 AOS), Sule Skerry (3,465 AOS), Flannan Isles (7,646 AOS), and Rockall (0 AOS).
- When comparing the 2024 counts with the most recent (2013) standardised colony counts, numbers indicate a total decline of 9.2%, or 0.8% per annum (pa) in Sula Sgeir, and a total decline of 35.2%, or 3.2% pa in Sule Stack. However, both Flannan Isles and Sule Skerry numbers exhibited positive trends. In the case of Flannan Isles, a total increase of 44.89%, or 4.08% pa was recorded and for Sule Skerry, a total increase of 85.6%, or 7.8% pa.
- In comparison to the 2004 standardised surveys, Sula Sgeir exhibited a relatively small increase in numbers of AOS (+10.51%). Sule Stack suffered the largest percent decrease, reducing by 36.15%. Flannan Isles exhibited a strong positive trend (+177.17% since 2004), with Sule Skerry, which remains the smallest colony of the western colonies surveyed, undergoing the largest AOS increases of any of the colonies surveyed (+5683.33% since 2004).
- Both Flannan Isles and Sule Skerry colonies showed spatial colony expansion when compared to the surveys carried out in 2013.
- It is likely that the declines recorded since 2013 at Sula Sgeir and Sule Stack are, in part, linked to the highly pathogenic avian influenza (HPAI) outbreak in 2022.
Acknowledgements
We would like to thank Dave Cowley from Historic Environment Scotland, who was involved in previous standardised colony surveys, for his guidance and collaboration in the planning of this set of surveys.
Abbreviations
Apparently Occupied Site (AOS)
Per annum (pa)
Introduction
NatureScot commissioned APEM Ltd. (APEM) to conduct a 100% coverage digital aerial survey (DAS) to provide a repeated colony count of the Northern gannet (Morus bassanus, hereafter gannet) breeding colonies at the north-west of Scotland, specifically Sula Sgeir, Sule Stack, Sule Skerry, Flannan Isles, and Rockall.
The main aim of the survey was to assess the status of the different colonies, and any changes the populations have undergone since the previous standardised survey undertaken in 2013 (Wanless et al. 2015a), focussing on the numbers of gannets recorded as Apparently Occupied Site (AOS) as this is the breeding population metric recommended in the Seabird Monitoring Handbook (Walsh et al. 1995).
The methodology and data collection process for the counts presented herein followed those used in the 2013 Scottish gannet surveys (Wanless et al. 2015a) with the additional benefit of collection of vertical imagery using APEM’s bespoke high-resolution digital camera system, allowing accurate data collection and comparisons in colony extents and AOS numbers. Comparisons to the 2004 standardised survey (Wanless et al. 2015b) and other available data sources are provided where applicable for completeness. The data collected as part of this project will further be incorporated into the production of a GB and Ireland wide breeding population estimate and provide a baseline against which future monitoring can be compared to.
Colony Details
Sula Sgeir
Location: 59º06´N 06º09´W, HW620305, 64km north of Lewis in the Western Isles (Figure 1).
Originally established as a gannet colony before 1549 (Murray and Wanless, 1986). Throughout the series of standardised imagery colony assessments (1985, 1994, 2004, 2013 and 2024) the colony was initially divided into seven counting sections, and increased to eight sections in 1994, which has been maintained for the current assessment (Annex 2, Figure a).
Sule Stack
Location: 59º02´N 04º30´W, HX565177, 64km west of the Orkney Islands (Figure 1).
Originally established as a colony before 1710 (Murray and Wanless, 1986). In the first standardised colony assessment (1985) four counting sections were drawn on the colony, however, from 1994 eight sections have been used instead. Additionally, in both 2013 and 2024, the same subsections were used (Annex 2, Figure A).
Sule Skerry
Location: 59º05´N 04º24´W, HX621244, 60km west of the Orkney Islands (Figure 1).
Originally established as colony in 2003 (Wanless et al. 2015a,b). During the 2004 colony counts, this colony was assessed from pictures taken from land (Wanless et al. 2015b). In 2013 however, two counting sections and three subsections for aerial imagery were defined (Wanless et al. 2015a). For this survey, two sections were kept, but two extra subsections, Sule Skerry East North and Sule Skerry East South, were defined due to colony expansion (Annex 2, Figure a).
Flannan Isles
Location: 58º18´N 07º36´W, NA690465, 27km west of Lewis in the Western Isles (Figure 1).
Originally established as a colony in 1969 (Murray and Wanless, 1986). The colony count sections and subsections changed three times between the first standardised survey in 1985 and the last standardised survey in 2013 due to colony expansion (Wanless et al. 2015a). In this survey the previously established subsection Roareim South B was divided into Roareim South B1 and B2 due to colony expansion (Annex 2, Figure a).
Rockall
Location: 57º35´N 13º41´W, MC035165, 370km west of North Uist in the Outer Hebrides (Figure 1).
This survey represents the first attempt of including Rockall as part of the standardised Scottish colony counts. Anecdotal records of nests and gannets attempting breeding have been recorded since 1992, however productive breeding is considered unlikely due to the environmental conditions of the site (Murray et al. 2015).
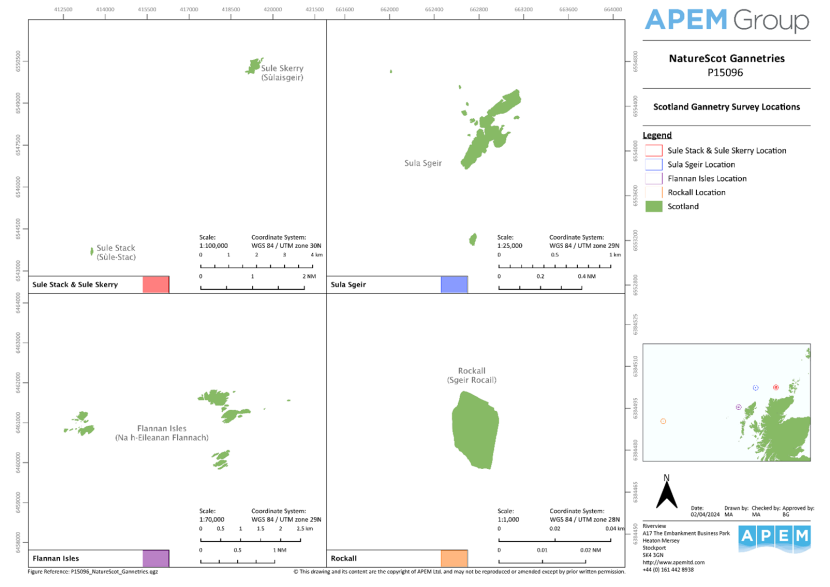
Figure 1. Location of the five surveyed locations (Sule Stack and Sule Skerry are shown in the same location due to map scale and locations distance).
Click for a full description
Maps of the locations of each of the surveyed gannet colonies including Sula Sgeir, Sule Stack, Sule Skerry, Flannan Isles and Rockall.
Avian Flu
During 2021 and 2022, an outbreak of the H5N1 High Pathogenicity Avian Influenza virus (HPAI) was responsible for a mass mortality event that affected at least 21 of the 25 UK breeding seabird species (Tremlett et al. 2024). Among the affected species, gannets were one of the most highly impacted in 2022 (Grémillet et al. 2023; Lane et al. 2024; Tremlett et al. 2024). The virus likely follows an oral–faecal spread, therefore, colonies during the breeding season presented themselves as an ideal contagion environment, although viral spread was not exclusive to colony attendance (Lane et al. 2024). With an estimated 75% of the global gannet breeding colonies affected (Lane et al. 2024), tens of thousands of gannets died in the north-east Atlantic between April–September 2022 (Grémillet et al. 2023), and a minimum of 11,175 gannets died in Scotland during 2022 (Tremlett et al. 2024).
Moreover, evidence shows that effects between colonies varied; for example, the number of AOS on Bass Rock during the outbreak was estimated at 71% less than the last full colony count in 2014 (Lane et al. 2024), the number of AON at Hermaness was estimated to have declined by 37%, while in the Noss colony a decrease of 19% AON was estimated between 2019 and 2023 (Tremlett et al. 2024). This variability has been hypothesized to potentially be related to the stage of the breeding season that the colony was at when affected by the outbreak (Lane et al. 2024).
Given that gannets are Amber-listed in the most recent Birds of Conservation Concern list for the UK (Stanbury et al. 2024) in combination with the potential impacts of avian flu and other potential pressures (e.g. offshore wind), the collection of accurate and up to date population data is of great importance for effective management and informing long-term monitoring.
Methodology
Digital Aerial Survey Methods
A program of five colony aerial surveys took place between June and July 2024.
Surveys were carried out by a twin-engine fixed-wing aircraft that orbited the target area capturing data at a safe distance using a handheld oblique camera positioned at the aircraft side window. The aircraft stand-off distance was selected by the crew on the day of survey which ranged between 1,300 and 1,500 foot (ft), this was managed through a dynamic risk assessment of target survey area topology, weather conditions, and colony activity. APEM maintained a set target resolution through this range by utilising interchangeable lenses (200 mm, 100 mm, and 85 mm) with differing focal length which were focused pre-flight and changed whilst airborne. The focal length was selected to achieve a Ground Sampling Distance (GSD) on the surface of the area of interest of between 1.5-2.0 centimetres (cm) which was sufficient to capture any distinguishing features. APEM additionally vertically mapped the colonies with its state of-the-art mapping camera system which was installed in the aircraft at the same time as the oblique camera equipment. For the oblique imagery, images were collected via a handheld Canon 5D camera with a 200mm prime lens following Wanless et al. (2015a). A metadata recorder was fitted to the camera for exchangeable image file format (Exif) encoding. For the vertical survey camera, APEM used a 110 mm lens fitted with a global navigation satellite system (GNSS) and inertial measurement unit (IMU) sensor. Further details of flight operations are detailed below.
During each survey, APEM’s on-board camera technician continually monitored the imagery as it was collected to ensure the data collected were fit for purpose. The camera technician would make the decision to cease data collection should the conditions become unsuitable for surveying or data collection.
Imagery was captured in raw format and post-processed to ensure optimal quality for the subsequent stage of image analysis, to extract information on gannets or other notable occurrences. When a survey was completed, data were checked to ensure the coverage and quality of the imagery was acceptable. Once the image analysis was completed, further quality assurance (QA) processes took place (see Section 2.3).
No health or safety issues were reported during the surveys.
Four out of the five colonies were surveyed in the ideal survey window (as defined by Walsh et al. 1995). However, Rockall had to be postponed until mid-July due to inclement weather conditions and military usage of the area. The dates, start, and end times for survey time for each colony are provided in Table 1 with the corresponding weather conditions provided in Table 2.
Date | Colony | Time On Line (UTC) | Time Off Line (UTC) | Effort Minutes |
|---|---|---|---|---|
18/06/2024 | Flannan Isles | 11:15 | 11:40 | 25 |
18/06/2024 | Sule Sgeir | 14:30 | 14:38 | 8 |
18/06/2024 | Sule Skerry | 15:09 | 15:14 | 5 |
18/06/2024 | Sule Stack | 15:17 | 15:20 | 3 |
10/07/2024 | Rockall | 10:45 | 10:50 | 5 |
Colony | Date | Visibility | Precipitation | Cloud Cover (%)1 | Air Temp (°C) | Pressure (hPa) | Wind Speed (knots) / Direction |
|---|---|---|---|---|---|---|---|
Flannan Isles | 18/06/2024 | >10 | 0 - 20 s | 100 | 5 | 1019 | 20 / N |
Sule Sgeir | 18/06/2024 | >10 | 0 | 70 | 6 | 1021 | 17 / N |
Sule Skerry | 18/06/2024 | >10 | 0 | 70 | 6 | 1021 | 17 / N |
Sule Stack | 18/06/2024 | >10 | 0 | 70 | 6 | 1021 | 17 / N |
Rockall | 10/07/2024 | >10 | 0 | 0 | 9 | 1018 | 23 / NE |
Weather conditions during all surveys were conducive to collecting and analysing imagery for the purpose of providing data on the identification, distribution, and abundance of gannets within the five colonies. Favourable conditions for surveying were defined as: a cloud base of at least 1,300 ft, visibility of greater than 10 km, and wind speed of less than 30 knots. For safety reasons, no surveying took place in icing conditions.
Measures were taken to minimise glint and glare, such as avoiding surveying when the sun angle had the greatest potential to impact image quality. Furthermore, additional vertical imagery was collected throughout the survey, providing an alternative set of images for analysis to ensure that sufficient coverage was achieved in the case that hand-held imagery was affected strongly by glint or glare, oblique angle or difficulty in capturing gannets located behind rock features/within crevices.
Gannet Identification and Counts
Section boundaries within colonies were drawn on images using appropriate image editing software. The most representative image for each section was selected for counts, ensuring alignment with historical sections. In some cases (e.g. ‘Top’ & ‘Centre’ sections in Sule Stack) vertical imagery was analysed, which was comparable to previously counted reference sections. All section boundaries were checked by multiple analysts to ensure full colony coverage and accuracy with respect to previous survey reference sections. Additional new sections were created in areas where colony expansion had occurred.
Demarcated imagery was loaded into GIS software and a dedicated team of experienced analysts recorded gannet Apparently Occupied Sites (AOS) as vector points in GIS shapefiles. Using GIS ensured exact numbers could be tracked with high precision, avoiding the need for repeat counts. Gannet AOS were determined based on the position of birds amongst the colony (either one or two birds may be present). Gannets typically nest at relative distances from one another and spacing between AOS can be readily defined in aerial imagery. In some cases, AOS were partly or completely obscured by terrain, and additional vertical imagery covering that section was checked ensuring an accurate count. Any out of view AOS in the specific image that were counted were indicated separately. Immature birds and areas containing loafing, or ‘club’ birds were omitted from AOS counts.
A colony tracker sheet was used detailing the number of sections to be counted for each colony alongside the filename of the respective image(s) containing the given colony section. Any loafing/immature or deceased gannets were also noted for each section. Image quality scores were assigned to each section counted and recorded on the tracker sheet. Quality scores for image resolution and sharpness were as follows:
1 – Very High
2 – High
3 – Average
4 – Low
5 – Very Low
Summary of Quality Assurance
Following completion of colony counts by analysts, the imagery and associated section shapefile counts detailing AOS assignment were quality assured (QA) by Technical Specialists for accuracy. Checks for potential missed AOS and correct AOS status allocation were carried out as well as annotation of section boundaries, ensuring no double counting had occurred and that birds were assigned to the correct section. Multiple images covering a given section were referred to, ensuring that obscured AOS were included and that the AOS counts were accurate. Following QA, gannet counts were totalled to form an overall count for a given colony. Quality scores were checked to ensure that they were representative and consistent.
Population comparison
Population numbers recorded in the 2024 aerial surveys were contextualised following two different approaches.
- A direct comparison against the two previous standardised surveys (2004 and 2013), to allow comparison of both changes in population trends and geographical extension of the colonies.
- A broader comparison of population numbers with published data, regardless of the collection method, in the last 20 years and longer-term trends to match those reported in Wanless at al., (2015a). Special emphasis was placed on data collected just before and after the 2022 HPAI outbreak, in an attempt to produce a fuller picture of how HPAI potentially affected the colonies.
Results
Sula Sgeir
Colony status: 10,200 AOS in 2024, 11,230 AOS in 2013, 9,230 AOS in 2004. The breeding population has declined by 9.17% since 2013 (Table 3, Table 7). This decrease is driven by the decrease in Sula Sgeir Sections 3 (-13.6%), 4a (-17.9%), 4b (-4.4%) and 7 (-21.6%). However, select sub-sections within these sections specifically proved to be a challenge imagery-wise (Annex 3 Table A), with the terrain making it difficult to achieve full coverage, even with the addition of vertical imagery. Both sections 3 and 4b contained groups of immature/non-breeding birds (Annex 3 Table A). The remaining sections exhibited increases in numbers of AOS since 2013; Section 1 + 10.5%, Section 2 + 8.2%, and Section 6 + 12.5%. Both Section 5 (0 AOS) and the helipad (1 AOS) have shown no material change from previous usage of the area, both recorded as club sites, with virtually all gannets captured in the imagery recorded as loafing, which is in line with the previous colony assessment, though these areas still represent potential space for colony expansion.
Section | AOS 2024 count | Number of out of view AOS included | 2013 | Change % | Per annum |
|---|---|---|---|---|---|
1A | 82 | 0 | 75 | +9.3 | +0.8 |
1B | 218 | 0 | 222 | -1.8 | -0.2 |
1C | 230 | 1 | 228 | +0.9 | +0.1 |
1D | 196 | 0 | 132 | +48.5 | +4.4 |
Total Sula Sgeir 1 | 726 | - | 657 | +10.5 | +1.0 |
2A | 235 | 6 | 239 | -1.7 | -0.2 |
2B | 141 | 6 | 113 | +24.8 | +2.3 |
2C | 5 | 0 | 0 | NA | NA |
Total Sula Sgeir 2 | 381 | - | 352 | +8.2 | +0.7 |
3A | 353 | 0 | 402 | -12.2 | -1.1 |
3B | 736 | 0 | 909 | -19.0 | -1.7 |
3C | 1,463 | 0 | 1,640 | -10.8 | -1.0 |
Total Sula Sgeir 3 | 2,552 | - | 2,952* | -13.6 | -1.2 |
4a/A | 70 | 0 | 126 | -44.4 | -4.0 |
4a/B | 150 | 2 | 182 | -17.6 | -1.6 |
4a/C | 726 | 0 | 982 | -26.1 | -2.4 |
4a/D | 995 | 58 | 1,073 | -7.3 | -0.7 |
Total Sula Sgeir 4a | 1,941 | - | 2,363 | -17.9 | -1.6 |
4b/A | 431 | 8 | 481 | -10.4 | -0.9 |
4b/B | 635 | 9 | 679 | -6.5 | -0.6 |
4b/C | 316 | 0 | 292 | +8.2 | +0.7 |
4b/D | 91 | 0 | 89 | +2.2 | +0.2 |
Total Sula Sgeir 4b | 1,473 | - | 1,541 | -4.4 | -0.4 |
5 | 0 | 0 | 0 | NA | NA |
6A | 61 | 21 | 29 | +110.3 | +10.0 |
6B | 291 | 8 | 215 | +35.3 | +3.2 |
6C | 544 | 15 | 555 | -2.0 | -0.2 |
6D | 720 | 19 | 638 | +12.9 | +1.2 |
Total Sula Sgeir 6 | 1,616 | - | 1,437 | +12.5 | +1.1 |
7A | 702 | 109 | 1,027 | -31.6 | -2.9 |
7B | 625 | 0 | 751 | -16.8 | -1.5 |
7C | 183 | 6 | 147 | +24.5 | +2.2 |
Total Sula Sgeir_7 | 1,510 | - | 1,925 | -21.6 | -2.0 |
Helipad | 1 | 0 | 0 | NA | NA |
Total to the closest 10 | 10,200 | - | 11,230 | -9.2 | -0.8 |
Total real numbers | 10,200 | - | 11,227 | -9.1 | -0.8 |
Sule Stack
Colony status: 2,950 AOS in 2024, 4,550 AOS in 2013, 4,620 AOS in 2004. AOS numbers have decreased by over 30% in comparison to both 2013 and 2004 (Table 4, Table 7), meaning that Sule Stack had the biggest recorded decrease in AOS of all the colonies surveyed. AOS numbers decreased in all sections since 2013, ranging from 19.1%, in the South East section, to 100% in the South Rock section, with zero AOS recorded compared to 96 recorded in 2013. The North Rock section remained unoccupied by breeding birds, as was the case in 2013. From the imagery it appears that the section is subject to wash from incoming waves which would prevent birds from nesting. Additionally, it must be noted that various sections such as South Rock had immature/non-breeding birds recorded, as did sections North East and North West A, where large numbers of immature gannets were recorded among AOS (Annex 3 Table B). Other sections such as the Top and Centre, had smaller numbers of immature/potentially non-breeding gannets, with only Sule Stack East and North Rock Sections having no immature/loafing birds.
Section | AOS 2024 count | Number of out of view AOS included | 2013 | Change % | Per annum |
|---|---|---|---|---|---|
South Rock | 0 | 0 | 96 | -100.0 | -9.1 |
Top | 869 | 0 | 1,626 | -46.6 | -4.2 |
Centre | 405 | 0 | 577 | -29.8 | -2.7 |
East | 256 | 8 | 332 | -22.9 | -2.1 |
South East | 483 | 8 | 597 | -19.1 | -1.7 |
North East | 449 | 1 | 623 | -27.9 | -2.5 |
North West A | 325 | 0 | 431 | -24.6 | -2.2 |
North West B | 160 | 0 | 268 | -40.3 | -3.7 |
North Rock | 0 | 0 | 0 | NA | NA |
Total rounded closest 10 | 2,950 | - | 4,550 | -35.2 | -3.2 |
Total real numbers | 2,947 | - | 4,550 | -35.2 | -3.2 |
Sule Skerry
Colony status: 3,470 AOS in 2024, 1,870 AOS in 2013, 55-60 in 2004. The numbers of AOS have experienced the largest % increases of any of the colonies surveyed; 85.56% since 2013 and 5783.33% since 2004 (Table 5, Table 7).
The growth of the breeding colony has occurred in both the East and West sections. All the colony sections and subsections showed increases in numbers, ranging from 63% (5.7% pa) in the West A section, to 96.5% (8.8% pa) in the West B section. Even though the West section included the higher subsection increase in total birds (Annex 3 Table C), the East section showed geographical expansion, with two new subsections being colonised, one with 111 AOS (East South), and a second (East North) that appears to be a loafing area/club site on the periphery of the main East section. Originally, in 2004 the colony only had gannets on the west side, however section edge expansion was observed in 2013 (Wanless et al. 2015a). Interestingly, despite the almost doubling in size of the colony, both sections remain separated by a grass patch.
Section | AOS 2024 count | Number of out of view AOS included | 2013 | Change % | Per annum |
|---|---|---|---|---|---|
East | 997 | 0 | 542 | +83.9* | +7.6 |
East North | 0 | 0 | - | NA | NA |
East South | 111 | 0 | - | NA | NA |
East total | 1,108 | - | 542 | +104.4** | +9.5 |
West A | 1,247 | 0 | 765 | +63.0 | +5.7 |
West B | 1,110 | 1 | 565 | +96.5 | +8.8 |
West total | 2,357 | - | 1,330 | +77.21 | +7 |
Total rounded closest 10 | 3,470 | - | 1,870 | +85.6 | +7.8 |
Total real numbers | 3,465 | - | 1,872 | +85.1 | +7.7 |
*Difference between original Sule Skerry East, and current East 1 section
**Difference between original Sule Skerry East, and current complete east section
Flannan Isles
Colony status: 7,650 AOS in 2024, 5,280 AOS in 2013, 2,760 AOS in 2004. Numbers of AOS have increased by 44.89% since 2013 and 177.17% since 2004 (Table 6, Table 7).
AOS numbers in the Flannan Isles colony showed large increases in all sections and subsections except for Main Stack A (-11.76%), ranging from 17.39% (Arch Stack) to 1630.30% (subsection Roareim A). Peak increases in AOS per total section were recorded in West Stack (189.91%), and Roareim (80.65%), this latter almost doubling in number since 2013, with subsection Roareim South A having developed a new sub-colony, and sub-section Roareim South B expanding sufficiently to be divided into Roareim South B1 and B2. The increase in Roareim AOS numbers matches the historical increase described in 2013, when compared to 2004. Also in line with the previous survey, the Roareim East section contained a large number of gannets, most of which were immature, non-breeding birds. The adults present here appeared to be loafing on a grassy area and not sitting on definite occupied sites or nests. Some adult birds appeared to be pair bonding, and some appeared to be pulling at the grass, potentially gathering nest material. This area appears to still be a clubbing or loafing area as previous surveys of the island concluded (Wanless et al. 2015a) (Annex 3 Table D). The remaining sections except for Main Stack A exhibited more moderate AOS increases.
Section | AOS 2024 count | Number of out of view AOS included | 2013 | Change % | Per annum |
|---|---|---|---|---|---|
Roareim A | 571 | 0 | 33 | +1,630.30 | +148.21 |
Roareim B1 | 325 | 0 | 241 | +34.85* | +3.17 |
Roareim B2 | 118 | 0 | - | NA | NA |
Roareim B Total | 443 | - | 241 | +83.82** | +7.62 |
Roareim C | 2,654 | 3 | 2,016 | +31.65 | +2.88 |
Roareim D | 1,029 | 3 | 310 | +231.94 | +21.09 |
Roareim East | 0 | 0 | 0 | NA | NA |
Total Roareim | 4,697 | - | 2,600 | +80.65 | +7.33 |
West Stack | 316 | 1 | 109 | +189.91 | +17.26 |
Arch Stack | 189 | 7 | 161 | +17.39 | +1.58 |
Sgeir an Eoin | 1,169 | 4 | 981 | +19.16 | +1.74 |
Main Stack A | 1,238 | 0 | 1,403 | -11.76 | -1.07 |
Main Stack B | 37 | 0 | 26 | +42.31 | +3.85 |
Total rounded closest 10 | 7,650 | - | 5,280 | +44.89 | +4.08 |
Total real numbers | 7,646 | - | 5,280 | +44.81 | +4.07 |
| *Difference between original Roareim B, and current B1 | |||||
| **Difference between original Roareim B, and total current Roareim B with expansion | |||||
Rockall
Even though there are previous records of gannets breeding in Rockall (Wanless et al. 2015a), only one gannet, deceased, was observed among the birds recorded in our images. The gannet seemed to have recently perished (within the 2024 breeding season), and was amongst ropes, indicating that entanglement from gear that had been left from an independent expedition to the island, was the cause of death for this individual.
Deceased gannet observations
Whilst not a primary aim of the surveys, deceased gannets were recorded, and can be found in the Appendix 3 Table A to Table D. In total, six deceased gannets were recorded from the images. In Flannan Isles (Roareim A), Sule Stack (North West B), and Rockall, single deceased gannets were recorded. In Sula Sgeir, three deceased gannets were recorded; one in Section 3A, and two in section 6D.
Discussion
Changes in numbers
Out of the five colonies surveyed, both Flannan Isles and Sule Skerry exhibit a clear increase in breeding population and geographical extension when the three standardised surveys are taken into consideration (2004, 2013, and 2024). Sula Sgeir had relatively stable numbers when compared to numbers for the last 20 years, with a small increase in 2013, but has had a decrease of -9.1% in 2024. Sule Stack shows a clear decrease in numbers of AOS, with a decrease of -35.16% and -36.15% when comparing the 2024 population to the 2013 and 2004 AOS numbers respectively (Table 7; Figure 2).
Colony | 2004 | 2013 | 2024 | Change % (2004-2024) | Per annum (2004-2024) | Change % (2013-2024) | Per annum (2013-2024) |
|---|---|---|---|---|---|---|---|
Sula Sgeir | 9,230 | 11,230 | 10,200 | +10.51 | +0.53 | -9.17 | -0.83 |
Sule Stack | 4,620 | 4,550 | 2,950 | -36.15 | -1.81 | -35.16 | -3.20 |
Sule Skerry | 60 | 1,870 | 3,470 | +5,683.33 | +284.17 | +85.56 | +7.78 |
Flannan Isles | 2,760 | 5,280 | 7,650 | +177.17 | +8.86 | +44.89 | +4.08 |
Rockall | - | - | 0 | - | - | - | - |
*Numbers for colony totals have been rounded to the nearest 10 to maintain consistency with Wanless et al. 2015a
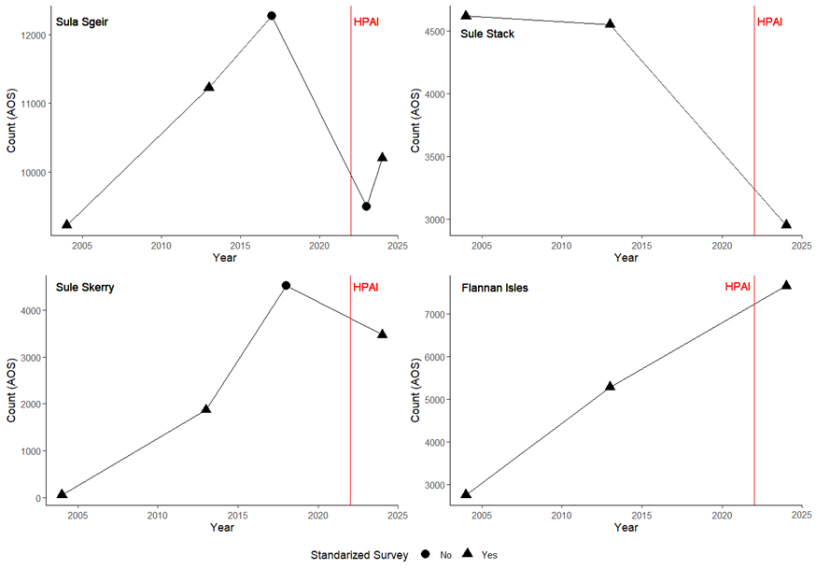
Figure 2. Counts of gannets on Sula Sgeir, Sule Stack, Sule Skerry and Sule Stack from 2004-2024.
Click for a full description
Four line graphs, one per colony, showing gannet counts over the period (2004 – 2024) with year along the x axis and counted AOS on the y axis. Counts are shown for Sula Sgeir, Sule Skerry, Sule Stack, and Flannan Isles. On each plot circles represent non-standardised counts, and triangles represent standardised counts. A red vertical line represents the 2022 HPAI outbreak.
Both the Flannan Isles and Sule Skerry colonies have undergone a positive population trend since their establishment in approx. 1984 and 2004, respectively (Harris et al. 2020). Therefore, the increase in numbers of AOS from 2013 to 2024 is to be expected, with gannets having plenty of space to occupy and expand on. In the case of Flannan Isles specifically, AOS increases have been particularly consistent for the last 20 years, with approximately 2,450 (2,370 – 2,520) new AOS every 10 years (Table 7), and with the expansion of the section Roareim B, now surveyed as Roareim B1 and B2. In the case of Sule Skerry, the growth seems to follow a similar pattern with approximately 1,700 (1,600 – 1,810) new AOS every 10 years, since 2004 (Table 7). In this case, two new subsections of the colony were assessed (Sule Skerry East North and Sule Skerry East South, as expansions of Sule Skerry East).
When considering a broader picture, and despite these apparently consistent increases in population, the numbers reported above do not provide sufficient detail on the effect of the HPAI outbreak in 2022. While there are no specific assessments on the HPAI outbreak consequences on the Flannan Isles colony, two reports for Sule Skerry give some insight into the consequences of the outbreak. First, a major mortality event of gannets was recorded in autumn 2022, probably related to the outbreak of HPAI in the summer of 2022, where a mortality of at least 6% was estimated (Harris and Wanless 2023; Lane, et al. 2023). Second, a drone colony count in 2018 reported Sule Skerry to host 4,515 AOS (Harris et al. 2019; Burnell et al. 2023), which could indicate that in the last six years there was a decrease of approx. 30% of the population (30.1%) (Figure 2). Considering how other British and Irish colonies were affected by the virus, it is likely that, that despite a consistent growth trend across standardised surveys, the outbreak of HPAI in 2022 reduced both the breeding population and the breeding success at Sule Skerry during 2022, potentially slowing or even halting the growth trend. However, the effect was not strong enough to dampen the long-term positive breeding population trend (Figure 2).
It is feasible that the colony at the Flannan Isles could have been similarly affected, with an undetected reduction in 2022 masked by an overall positive trend (Figure 2).
Outside of the standardised surveys, the Sula Sgeir colony was estimated to host 12,271 AOS in 2017 (Burnell et al. 2023; Tremlett et al. 2024), and in a colony assessment in 2023, it was estimated, although with limited confidence, that the colony hosted 9,495 AOS (Tremlett et al. 2024). Considering the effect of HPAI in other British and Irish colonies (Lane et al. 2024), it is possible that despite the colony having grown by 33%, between 2004 and 2017 (9,225 AOS (Wanless et al., 2015b) to 12,271 AOS (Burnell et al., 2023)), the outbreak of HPAI decreased the breeding population by 22.6%, to levels similar to 2004 (9,495 AOS in 2023 (Tremlett et al., 2024)). No assessment of HPAI presence and the potential effects on Sula Sgeir specifically was carried out in 2022, therefore, the changes in population cannot be definitively assigned to the virus. Sula Sgeir is the only colony where fledgling gannets are still harvested (up to a maximum of 2000) for human consumption, with an unknown interplay between the effects of harvesting and HPAI on breeding population numbers. In 2020 no harvesting took place because of covid restrictions and between 2022 and 2024 the only permitted harvesters decided that no harvesting should take place at Sula Sgeir due to potential risks from HPAI.
Sule Stack is the only case in the surveyed colonies where a negative trend in AOS has been recorded when comparing the results from this survey with each of the standardised surveys in 2004 and 2013, in addition to a negative trend overall since earlier records (Figure 2). Prior to 2024, the population estimations underwent relatively slight changes, with less than a 2% of change between 2004 and 2013. However, between 2013 and 2024, the decrease was approximately 35% (Table 7; Figure 2). No assessment has been carried out regarding the HPAI effects on the colony, and as this is the first report on the state of the population since 2013, there is not sufficiently fine-scale temporal information to fully contextualise this decrease in terms of potential HPAI effects, compared to other potential factors. However, with other Scottish gannetries showing decreases between 3% and 37% associated with HPAI (Tremlett et al. 2024), such a large decline at Sule Stack could be at least partially relate to the virus outbreak in the previous years. Reasons behind the decline at this colony will need considered further.
Finally, no live gannets were recorded during the Rockall survey, though the colony was surveyed later in the season (10th July compared to 18th June) due to inclement weather and military presence in the area. Observations made before 2015 indicate that potential breeding attempts were becoming more common in the site, with gannets having the greatest number of nests (28 AOS) recorded in 2014 (Murray et al. 2015; Burnell et al. 2023). In 2023 photos were obtained by NatureScot from a vessel passing by Rockall that indicated that breeding attempts were made (L. Quinn, pers comm.). The harsh environmental conditions of the islet likely hinders successful breeding (Murray et al. 2015; Wanless et al. 2015a), although this would require a survey in the fledgling period to investigate this. The record of a deceased gannet, apparently entrapped in ropes left behind from a previous short-term human occupant in 2023 suggests that removal of anthropogenic materials would be of benefit, not only to avoid more entanglement events, but also to ensure the area is cleared to allow nest building attempts.
The 2024 survey provides up to date, standardised counts of AOS gannets in offshore colonies in the north-west of Scotland. Trends in AOS numbers differed between colonies with some (Sule Skerry and Flannan Isles) increasing in numbers of AOS and spatial extent and others (Sula Sgeir, Sule Stack) declining to varying degrees, with Sule Stack undergoing the most severe declines. Impacts of HPAI are likely, but more regular standardised data collection is required to understand these impacts more fully.
Observer differences
Differences between initial AOS counts made by image analysts and those following thorough QA were minimal (<1%) and consisted largely of out of view birds that were easily overlooked in both in Sula Sgeir and Flannan Isles.
Methodological conclusions
The aerial surveys of the colonies were successful, despite remote locations and associated challenging weather conditions. Aerial surveying meant that all colonies except Rockall could be completed in the same day and that minimal passes over each colony were required for image capture. The inclusion of vertical imagery proved very useful in providing greater coverage of the colonies, including birds obscured by topography and greatly improved the ability of image analysts to standardise the delineation of colony counting section boundaries.
In previous standardised surveys, flushing of birds caused by lower-altitude passes was used to discern immature/non-breeding birds from those nesting. The high-quality imagery collected at an altitude above this flushing threshold during the 2024 survey reported on here provided sufficient evidence to identify areas of non-breeding birds without flushing. Non-breeding areas were typified by immature birds scattered throughout, a lack of equal spacing between adult birds (which typically indicates spaces between occupied sites/nests), differences in habitat to obvious breeding areas and lack of evidence of birds adopting the hunkered posture typical of nesting behaviour.
In terms of consistency in methodology with the 2013 surveys, the delineation of the subsections on the imagery was challenging and includes a degree of subjectivity. Future surveys using a combination of overlapping plane-mounted vertical and oblique imagery to produce an orthomosaic (e.g. Normandeau Associates, Inc. and APEM, Ltd., 2016) would reduce the potential for any inaccuracies in counts, make it easier to delineate subsections and provide options for 3-D modelling of the islands and their habitats.
References
Burnell, D., Perkins, A.J., Newton, S.F., Bolton., M. Tierney, T.D. and Dunn, T.E. 2023. Seabirds Count: a census of breeding seabirds in Britain and Ireland (2015-2021). Barcelona: Lynx Nature Books.
Grémillet, D., Ponchon, A., Provost, P., Gamble, A., Abed-Zahar, M., Bernard, A., Courbin, N., Delavaud, G., Deniau, A., Fort, J. and Hamer, K.C. 2023. Strong breeding colony fidelity in northern gannets following high pathogenicity avian influenza virus (HPAI) outbreak. Biological Conservation, 286, 110269.
Google Maps (2024) Flannan Isles, 1: 3796. [Accessed 14 November 2024].
Google Maps (2024) Sula Sgeir, 1: 3400. [Accessed 14 November 2024].
Google Maps (2024) Sule Skerry, 1: 2634. [Accessed 14 November 2024].
Google Maps (2024) Sule Stark, 1: 2842. [Accessed 14 November 2024].
Harris, M.P. and Wanless, S. 2023. A major mortality of gannets due to a probable outbreak of high pathogenicity avian influenza on Sule skerry in 2022. Scottish Birds, 43, 228–231.
Harris, M.P., Blackburn, J., Budworth, D. and Blackburn, A.C. 2020. Sule Skerry–an overspill gannetry from Sule Stack. Seabird, 32, 96-105.
Lane, J.V., Jeglinski, J.W., Avery‐Gomm, S., Ballstaedt, E., Banyard, A.C., Barychka, T., Brown, I.H., Brugger, B., Burt, T.V., Careen, N. and Castenschiold, J.H. 2023. High pathogenicity avian influenza (H5N1) in Northern Gannets (Morus bassanus): Global spread, clinical signs and demographic consequences. Ibis, 166(2), 633-650.
Murray, S. and Wanless, S. 1986. The status of the gannet in Scotland in 1984-85. Scottish Birds, 14, 74-85.
Murray, S. and Wanless, S. 1997. The status of the Gannet in Scotland in 1994-95. Scottish Birds, 19, 10-27.
Murray, S., Harris, M.P. and Wanless, S. 2015. The status of the gannet in Scotland in 2013–14. Scottish Birds, 35, 3-18.
Normandeau Associates, Inc. and APEM, Ltd. 2016) Aerial survey of seabirds and marine mammals at Ka’ula Island, Hawai’i, March 2016. Report prepared for the U.S. Navy, Commander, U.S. Pacific Fleet. December 2016. 44 pp.
Stanbury, A.J., Burns, F., Aebischer, N.J., Baker, H., Balmer, D.E., Brown, A., Dunn, T., Lindley, P., Murphy, M., Noble, D.G. and Owens, R. 2024. The status of the UK’s breeding seabirds: an addendum to the fifth Birds of Conservation Concern in the United Kingdom, Channel Islands and Isle of Man and second IUCN Red List assessment of extinction risk for Great Britain. British Birds, 117, 471-487.
Tremlett, C.J., Morley, N., and Wilson, L.J. 2024. UK seabird colony counts in 2023 following the 2021- 22 outbreak of Highly Pathogenic Avian Influenza. RSPB Research Report 76.
Wanless, S., Murray, S. and Harris, M.P. 2015. Aerial survey of northern gannet (Morus bassanus) colonies off NW Scotland 2013. Scottish Natural Heritage Commissioned Report No. 696.
Wanless, S., Murray, S., Harris, M.P. and Evans, S. 2015. The Scottish gannet survey 2004. Scottish Natural Heritage Commissioned Report No. 628.
Walsh, P.M., Halley, D.J., Harris, M.P., del Nevo, A., Sim, I.M.W. & Tasker, M.L. 1995. Seabird monitoring handbook for Britain and Ireland. JNCC / RSPB / ITE / Seabird Group, Peterborough. ISBN 1 873701 73 X.
Annexes
Annex 1: Flight lines figures per colony
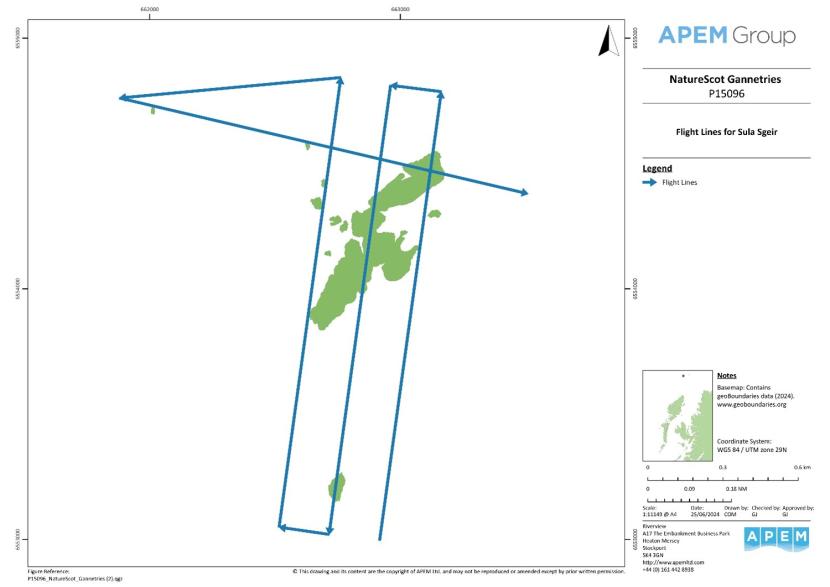
Figure a. Flight lines with directional arrows for the Sula Sgeir colony
Click for a full description
Map of the Sula Sgeir colony in the north-west of the Scottish coastline with survey flight lines showing the direction the plane was flying. The colony was flown over three times vertically, and one time in the northern half, horizontally.
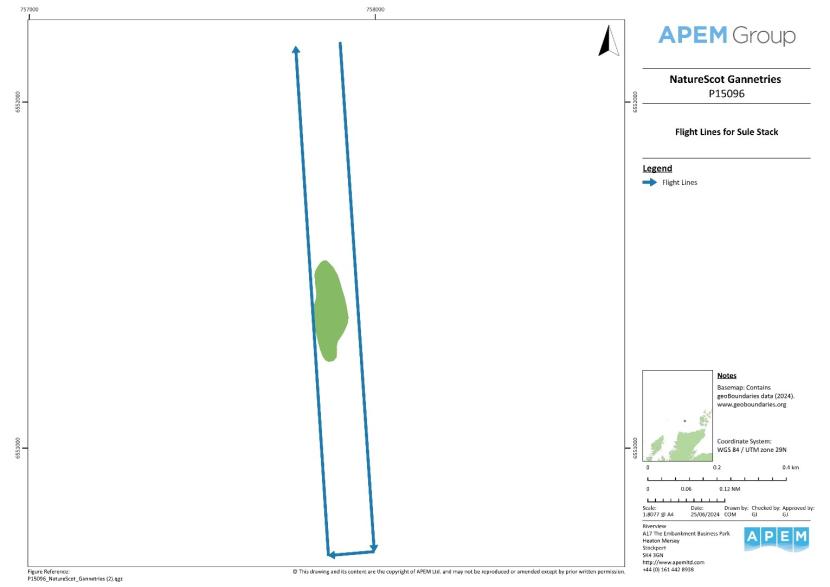
Figure b. Flight lines with directional arrows for the Sule Stack colony
Click for a full description
Map of the Sule Stack colony in the north-west of the Scottish coastline with survey flight lines showing the direction the plane was flying. The colony was flown over two times vertically.
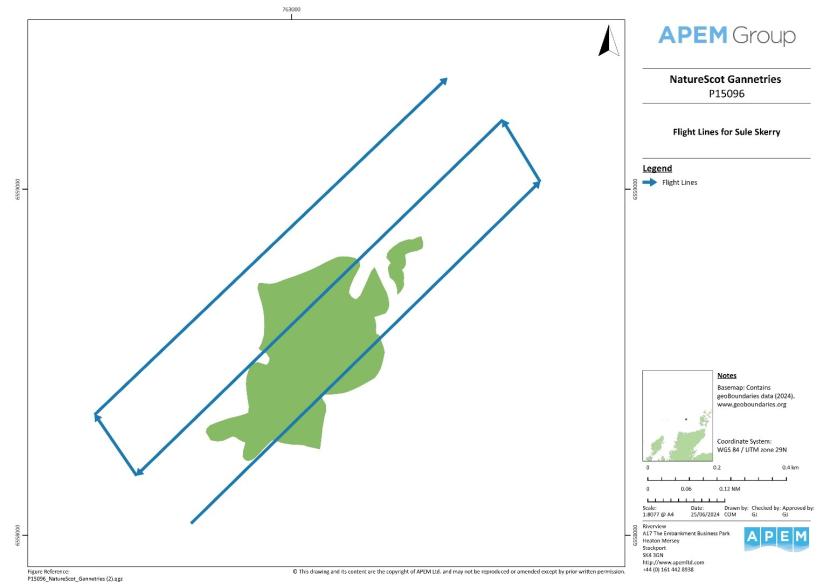
Figure c. Flight lines with directional arrows for the Sule Skerry colony
Click for a full description
Map of the Sule Skerry colony in the north-west of the Scottish coastline with survey flight lines showing the direction the plane was flying. The colony was flown over diagonally three times.
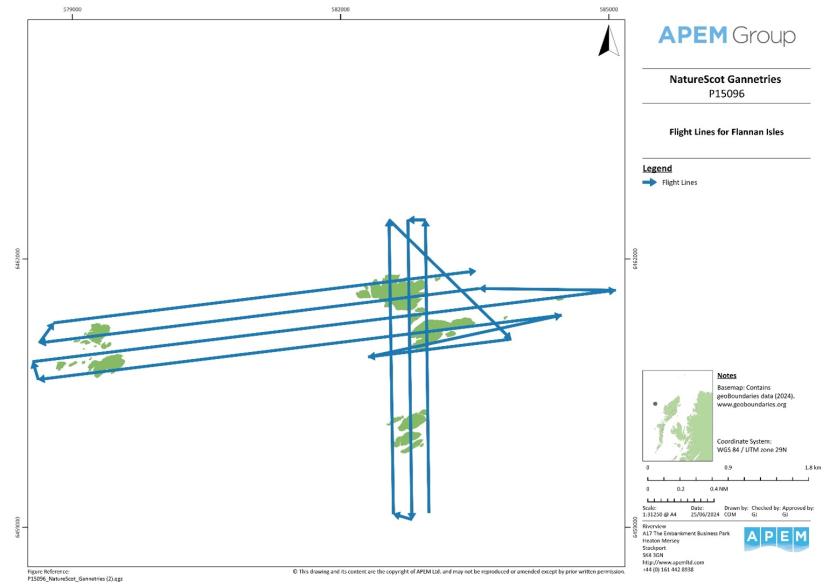
Figure d. Flight lines with directional arrows for the Flannan Isles colony
Click for a full description
Map of the Flannan Isles colony in the north-west of the Scottish coastline with survey flight lines showing the direction the plane was flying. The western isle of the colony was flown over horizontally four times, the south isle, was flown over vertically three times, and the central isle was flown over five times horizontally, and three vertically.
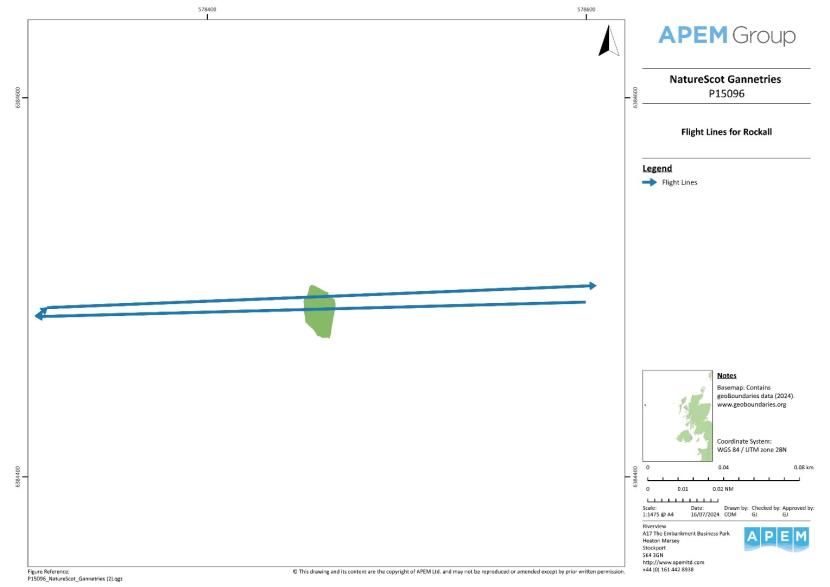
Figure e. Flight lines with directional arrows for Rockall
Click for a full description
Map of the Rockall colony in the north-west of the Scottish coastline with survey flight lines showing the direction the plane was flying. Rockall was flown over horizontally two times.
Annex 2: Colonies indicative sub-sections boundaries
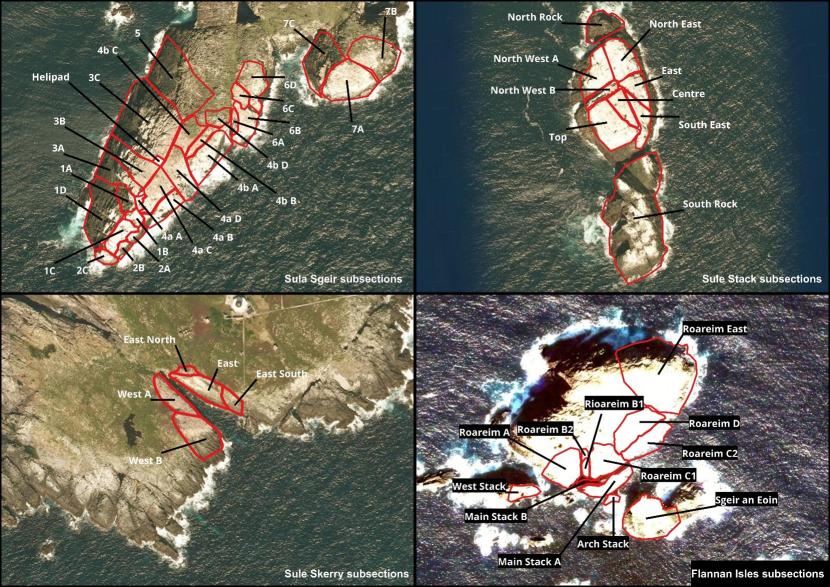
Figure a. Indicative subsection boundaries used on the four colonies with gannets recorded. Background imaging obtained from Google Satellite Maps (Google Maps, 2024).
Click for a full description
Satellite/Aereal image of the Sula Sgeir, Sule Stack, Sule Skerry and Flannan Isles colonies. Each colony has the indicative subsections boundaries in red. Sula Sgeir has 27 subsections, Sule Stack nine subsections, Sule Skerry five subsections, and Flannan Isles has 12 subsections.
Annex 3: Sections and sub-sections count details and summary
Section | AOS 2024 count | Number of out of view AOS included | Image Type & Quality | Comments and Limitations |
|---|---|---|---|---|
1A | 82 | 0 | Oblique, 2 | - |
1B | 218 | 0 | Oblique, 2 | - |
1C | 230 | 1 | Oblique, 2 | - |
1D | 196 | 0 | Oblique, 2 | - |
Total Sula Sgeir 1 | 726 | - | - | - |
2A | 235 | 6 | Oblique, 2 | - |
2B | 141 | 6 | Oblique, 2 | - |
2C | 5 | 0 | Oblique, 3 | - |
Total Sula Sgeir 2 | 381 | - | - | - |
3A | 353 | 0 | Oblique, 4 | Single deceased gannet low down. Difficult to achieve full coverage of the section improved with phase one coverage. |
3B | 736 | 0 | Oblique, 4 | Difficult to achieve full coverage of the section improved with vertical imagery. Top section difficult to count. Presumed gathering of club/loafing birds on the lower ledges. |
3C | 1,463 | 0 | Oblique, 4 | Difficult to achieve full coverage of the section, improved with vertical imagery. Top section difficult to count. Presumed gathering of club/loafing birds on the lower ledges. |
Total Sula Sgeir 3 | 2,552 | - | - | - |
4a/A | 70 | 0 | Oblique, 1 | - |
4a/B | 150 | 2 | Oblique, 1 | - |
4a/C | 726 | 0 | Oblique, 1 | - |
4a/D | 995 | 58 | Oblique, 1 | Out of view gannets at top. |
Total Sula Sgeir 4a | 1,941 | - | - | - |
4b/A | 431 | 8 | Oblique, 1 | - |
4b/B | 635 | 9 | Oblique, 1 | - |
4b/C | 316 | 0 | Vertical, 2 | Some club birds/immatures towards top of section. |
4b/D | 91 | 0 | Vertical, 2 | Some club birds/non-breeders. |
Total Sula Sgeir 4b | 1,473 | - | - | - |
5 | 0 | 0 | Oblique, 2 | All gannets appear to be club/loafing birds. |
6A | 61 | 21 | Oblique, 2 | Seemed to be some overlap between the top of Sections A and B (gully) in the boundaries provided to APEM. Some AOS appear in both but these have been accounted for. |
6B | 291 | 8 | Oblique, 2 | - |
6C | 544 | 15 | Oblique, 3 | Gannet AOS at top difficult to count. |
6D | 720 | 19 | Oblique, 3 | Two deceased gannets. Gannet AOS at top difficult to count. |
Total Sula Sgeir 6 | 1,616 | - | - | - |
7A | 702 | 109 | Oblique, 2 | Part of section obscured over the top of the rock formation (the slope above Sec C), made counting very difficult. A change in drawn section boundary recommended to better represent the topography. |
7B | 625 | 0 | Oblique, 3 | - |
7C | 183 | 6 | Oblique, 2 | - |
Total Sula Sgeir_7 | 1,510 | - | - | - |
Helipad | 1 | 0 | Oblique, 4 | Presume mostly loafing or club birds. |
Total to the closest 10 | 10,200 | - | - | - |
Total real numbers | 10,200 | - | - | - |
Section | AOS 2024 count | Number of out of view AOS included | Image Type & Quality | Comments and Limitations |
|---|---|---|---|---|
South Rock | 0 | 0 | Oblique, 1 | No evidence of breeding, loafing/club/non-breeders only. |
Top | 869 | 0 | Vertical, 1 | Mostly AOS, but immatures and non-breeding adults throughout section. |
Centre | 405 | 0 | Vertical, 1 | Mostly AOS, a few immatures and potentially non-breeding adults. |
East | 256 | 8 | Oblique, 1 | - |
South East | 483 | 8 | Oblique, 1 | Small number of club birds/immatures towards lower part of section. |
North East | 449 | 1 | Oblique, 1 | Large number of club birds/immatures, some in and amongst AOS. |
North West A | 325 | 0 | Oblique, 1 | Large number of club birds/immatures, some in and amongst AOS. |
North West B | 160 | 0 | Oblique, 1 | Single deceased gannet, lower down on ledge. |
North Rock | 0 | 0 | Oblique, 2 | - |
Total rounded closest 10 | 2,950 | - | - | - |
Total real numbers | 2,947 | - | - | - |
Section | AOS 2024 count | Number of out of view AOS included | Image Type & Quality | Comments and Limitations |
|---|---|---|---|---|
East | 997 | 0 | Oblique, 2 | - |
East North | 0 | 0 | Oblique, 2 | New section due to colony expansion, large number of immatures, appears to be a club/loafing area on periphery of main colony. |
East South | 111 | 0 | Oblique, 2 | New section due to colony expansion. Club/loafing on fringes. |
East total | 1,108 | - | - | - |
West A | 1,247 | 0 | Oblique, 3 | Club/Loafing/immatures on fringes. Handheld images quite angled, made counting AOS tricky. |
West B | 1,110 | 1 | Oblique, 3 | Club/Loafing/immatures on fringes. Handheld images quite angled, made counting AOS tricky. |
West total | 2,357 | - | - | - |
Total rounded closest 10 | 3,470 | - | - | - |
Total real numbers | 3,465 | - | - | - |
Section | AOS 2024 count | Number of out of view AOS included | Image Type & Quality | Comments and Limitations |
|---|---|---|---|---|
Roareim A | 571 | 0 | Oblique, 2 | Single deceased gannet top right of section, new sub colony bottom left of section. |
Roareim B1 | 325 | 0 | Oblique, 2 | Section B split into B1 and B2 due to colony expansion uphill. |
Roareim B2 | 118 | 0 | Oblique, 2 | New section due to colony expansion. |
Roareim B Total | 443 | - | - | - |
Roareim C* | 2,654 | 3 | Oblique, 2 | - |
Roareim D | 1,029 | 3 | Oblique, 2 | - |
Roareim East | 0 | 0 | Oblique, 2 | Large number of club birds/immatures. |
Total Roareim | 4,697 | - | - | - |
West Stack | 316 | 1 | Oblique, 3 | - |
Arch Stack | 189 | 7 | Oblique, 2 | - |
Sgeir an Eoin | 1,169 | 4 | Oblique, 3 | - |
Main Stack A | 1,238 | 0 | Oblique, 2 | - |
Main Stack B | 37 | 0 | Oblique, 2 | - |
Total rounded closest 10 | 7,650 | - | - | - |
Total real numbers | 7,646 | - | - | - |
*Roareim C was split into two sections for counting because a single image didn't cover whole section.


