NatureScot Research Report 1389 - NatureScot opinion survey 2024
Published: 2025
Authors: McGregor, D. and Strachan, V. (Progressive Partnership)
Cite as: McGregor, D. and Strachan, V. 2025. NatureScot opinion survey 2024. NatureScot Research Report 1389.
Keywords
environmental attitudes; biodiversity loss; climate change; corporate identity; public awareness; National Parks
Background
Introduction
The NatureScot Opinion Survey (NOS) is an annual survey designed to measure the public’s awareness of NatureScot, their understanding of the organisation’s work, and their attitudes to a range of topics that fall within the organisation’s remit.
The topics covered in the 2024 survey include:
- NatureScot, its brand and its activities
- Connection with nature
- Environmental issues
- Nature terminology
- National Parks
The NOS is the successor to the Scottish Nature Omnibus (SNO), a survey commissioned by Scottish Natural Heritage between 2009 and 2019. This report presents results from the 2024 NOS.
The survey questions used for the NOS vary a little each year, reflecting the organisation’s priorities and to enable current issues to be explored. Where appropriate, comparisons have been made with findings from the NOS 2023 and 2022 surveys as well as SNO 2019. A copy of the 2024 questionnaire is included in the methodology annexe.
Method
The survey was administered online by a portfolio of panels during November 2024. It collected views from a representative sample of adults aged 18 and over in Scotland, with quotas set to ensure the sample was representative of the Scottish adult population, in terms of gender, age and socio-economic group. The survey was also designed to ensure that views were collected from respondents across the length and breadth of the country in line with the Scottish regional profile (see classification tables). The profile of the sample, along with more detail on the survey approach, is provided in the methodology annexe.
Main findings
Nature connection?
- Approximately half of people heard of NatureScot, with two in five also knowing what the organisation does. Just under a quarter of participants recognised the logo, a broadly similar level to 2023.
- Most people who have heard of NatureScot have a fairly accurate idea of what NatureScot does, with respondents typically mentioning activities such as looking after Scotland’s nature, plants and environment and providing advice to government.
- A majority of people (86%) support the idea of a new National Park in Scotland and most (83%) would also support establishing a new National Park in the southwest of Scotland.
- People feel more strongly about the seriousness of climate change as compared to biodiversity loss and are more proactive and informed about the steps taken to tackle it.
- Most people had undertaken nature-friendly activities and behaviours in their local area, with respondents most typically mentioning walking in areas of local greenspace, providing food or water for wild animals and picking up litter.
- Two fifths of people reported having volunteered for the environment in the last 12 months.
- Roughly three quarters of people felt they could do more to help nature and the environment. Being able to see the positive effects of their actions, engaging with other people, and access to better information about what actions they can take, would encourage them to do more to help nature.
Abbreviations
NatureScot Opinion Survey (NOS)
Nature Connectedness Index (NCI)
Scottish Nature Omnibus (SNO)
Scottish Natural Heritage (SNH)
Findings
NatureScot
Public awareness of NatureScot
Around half of people in Scotland have heard of NatureScot, but logo recognition is somewhat lower.
The 2024 survey was conducted four years after Scottish Natural Heritage (SNH) adopted the name NatureScot. Findings suggest that around half of the population have heard of NatureScot, with 12% stating that they had heard of the organisation and knew what it does, while a further 38% had heard of the organisation but were not sure of what it does. This is in line with the levels of awareness found in the NOS in 2022 (12% and 35% respectively) and 2023 (11% and 36% respectively). Just less than half of respondents in 2024 (47%) had never heard of NatureScot.
Until August 2020 the organisation was called Scottish Natural Heritage. A similar awareness question was asked in the 2019 Scottish Nature Omnibus (SNO) in relation to awareness of SNH. As shown in Table 1, awareness levels of SNH were significantly higher, with a total of 79% having heard of the organisation.
| Which of these statements best describes your level of awareness of the organisation NatureScot? | 2015 (SNH) | 2017 (SNH) | 2019 (SNH) | 2022 (NatureScot) | 2023 (NatureScot) | 2024 (NatureScot) |
|---|---|---|---|---|---|---|
| I have heard of NatureScot, and I know what they do | 23% | 27% | 29% | 12% | 11% | 12% |
| I have heard of NatureScot, but I’m not sure what they do | 46% | 51% | 49% | 35% | 36% | 38% |
| I have never heard of NatureScot | 28% | 18% | 18% | 49% | 51% | 47% |
| Don’t know | 3% | 4% | 3% | 4% | 1% | 3% |
| Base | 1,151 | 1,063 | 1,101 | 1,010 | 1,092 | 1,017 |
| NET name recognition | 69% | 78% | 79% | 47% | 47% | 50% |
Awareness of NatureScot varied amongst different demographic groups:
- Age – younger people were more likely to be aware of NatureScot (65% of under 35s, compared with 47% of 35-55 year olds and 43% of those 65+)
- Households with children – those with children were more likely than those without to have heard of NatureScot (60% versus 46%)
- People without a disability/health condition – those who did not have a disability/health condition were more likely than those who did to have heard of NatureScot (54% versus 41%)
- Working status – people in work (57%) were more likely to have heard of NatureScot, compared with retired people (38%) and those not in work (43%).
In addition to the NatureScot name, respondents were shown the NatureScot logo and asked if they recognised it. Overall, 23% of respondents said that they did. This level of recognition is broadly consistent with the 2023 findings (20%) but is higher than in 2022 (15%).
Public understanding of NatureScot’s role
Most people who have heard of NatureScot have a reasonable idea of what the organisation does. The main activities associated with the organisation are protecting nature, plants and the environment; and providing advice to government.
We asked participants who said they had heard of NatureScot to type in what they thought the organisation does. This was an open-ended question which allowed respondents to express their perceptions of NatureScot’s role in their own words. These responses were subsequently coded and grouped into similar themes.
The majority of respondents, including those who stated in the previous question that they did not know what NatureScot did, were able to provide a fairly accurate description of NatureScot’s role, with responses typically mentioning activities such as looking after Scotland’s nature and landscapes, protecting wildlife and preserving the environment (see Figure 1).
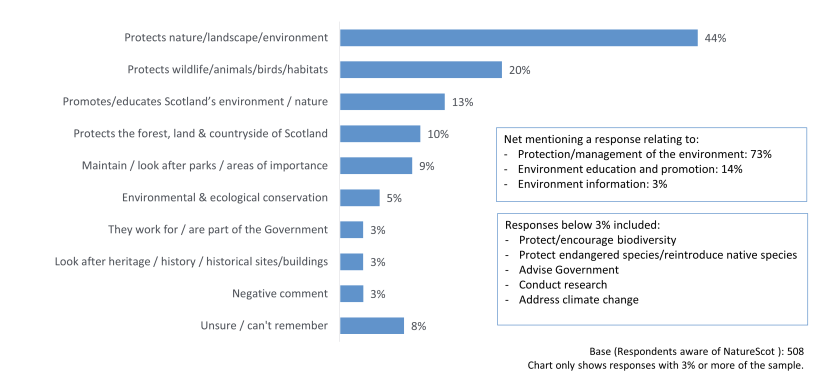
Figure 1. Activities undertaken by NatureScot
Click for a full description
The bar chart shows the types of work respondents consider NatureScot undertakes. The survey question was unprompted. Responses on the bar chart are ranked, from the most frequently to the less frequently mentioned activities. Only activities mentioned by more than 3% of those responding are included on the chart. Examples of the activities mentioned by fewer than 3% of respondents are listed on a box on the chart.
Some examples of individual comments are provided below:
- ‘It looks after and promotes Scotland’s nature’
- ‘Establishes new ways to preserve nature and helps sustain projects already up and running’
- ‘Protects the land from abuse and looks after the natural environment’
- ‘Administration of natural spaces throughout Scotland’
- ‘Improve our natural environment in Scotland and inspire everyone to care more about it’
- ‘They provide advice on natural wildlife sites and areas that are considered heritage sites’
- ‘Ensures wildlife and plants in zones which already are protected are not damaged by human disruption or by environmental factors such as extreme weather’
- ‘The upkeep of the parklands and wildlife’
- ‘It looks after the National Parks in Scotland’
It is worth noting that just 3% of respondents mentioned activities relating to heritage, the built environment, historical sites and so on. For comparison, mentions of these activities had been 15% in 2023 (similar to the levels reported when the organisation was called SNH). These findings may suggest that the organisation’s new name is impacting on the public’s understanding of its role.
Awareness of the NatureScot ‘Make Space for Nature’ campaign
Respondents were asked if they had heard of the ‘Make Space for Nature’ campaign and shown the campaign logo as a visual prompt. This question was asked prior to questions relating to awareness of NatureScot, when respondents did not know the survey had been commissioned by the organisation. Almost three in ten respondents (29%) said they had heard of the campaign, with 8% saying they knew what it is about and 21% saying that although they were aware, they did not know what it is about. Those most likely to be aware of the campaign were people aged 18-34 (44%) and those living in households containing children (41%).
| Have you heard of the ‘Make Space for Nature’ campaign? | % |
|---|---|
| I have never heard of the Make Space Nature campaign | 64% |
| I have heard of the Make Space Nature campaign, but I’m not sure what it’s about | 21% |
| I have heard of the Make Space Nature campaign, and I know what it’s about | 8% |
| Don’t know | 7% |
| Base | 1,017 |
National Parks
Most people surveyed supported both the idea of creating a new National Park and establishing one in the southwest of Scotland.
Support for a new National Park
The Scottish Government has indicated that it wishes to designate at least one new National Park in Scotland by 2026. Respondents were asked to what extent they supported the idea of a new National Park or Parks being established in Scotland (Figure 2).
The majority (86%) said they supported the idea, with 54% strongly supporting. Those more likely to support a new National Park being established in Scotland were:
- people aged 18-34 - 90%, compared to 82% of those aged over 55;
- working people - 89%, compared to 82% of retired people and 82% of non-working people;
- those with children in the household - 90%, compared to 84% of those with no children in the household;
- minority ethnic respondents - 96%, compared to 85% non-ethnic minority respondents; and
- those who have previously visited a Scottish National Park - 91%, compared with 81% of those who haven’t.
In July 2024, the Scottish Government confirmed Galloway in the southwest of Scotland as the proposed location for Scotland’s next National Park. Respondents were asked if they had heard about the proposal to create a new National Park in southwest Scotland. Around two fifths (39%) said they had heard about the proposals, while three fifths (61%) said they hadn’t. Respondents from South Scotland were more likely than most others to have heard of the proposals (50%), as were those who have previously visited a Scottish National Park compared with those who haven’t (46% versus 32%).
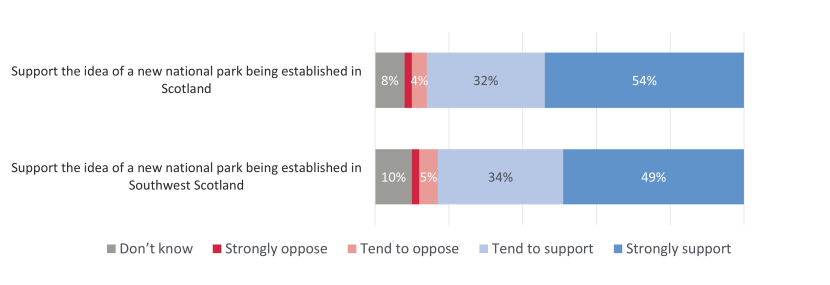
Figure 2. Support for a new National Park
Click for a full description
A pair of stacked bar charts show the level of support for a new National Park. The first shows the level of support for a new National Park being established in Scotland, the second shows support for a new national being established in southwest Scotland. The responses are presented on a four-point scale from strongly support through to agree strongly oppose. Don’t know is also an option. To the right of the chart is a table which shows the net agree scores for each statement.
All respondents were asked to what extent they supported the idea of a new National Park being established in the southwest of Scotland. The majority (83%) said they supported the idea, with around half (49%) strongly supporting. Those more likely to support the idea of a new National Park were people aged 18-34 (87%, compared to 80% of those aged over 55), working people (86%, compared to 78% retired people), and those who have previously visited a Scottish National Park (88%, compared with 79% of those who haven’t).
Respondents were asked to give their reasons for supporting or opposing establishing a new National Park (Figure 3). As might be expected given the above, the majority of reasons were positive. These included themes such as supporting the natural environment and wildlife, the ongoing benefits that the park could bring to generations in the future, and the need for more greenspace. Negative reasons included the impacts on farmers and problems relating to over-tourism. Some examples of the comments made are given below.
- ‘Need to preserve green spaces for future generations to enjoy’
- ‘Because it would be closer to where we live so my family and I can enjoy nature, fresh air, wildlife and long walks’
- ‘It’s important for people, especially youngsters, to get away from TV and computers and get back to the simple pleasures of life’
- ‘The project will help to preserve biodiversity for Scotland and overall UK’
- ‘More green space will be good for the environment and more sustainable. It would also be good for people and their mental health’
- ‘We need to protect wildlife and nature. I feel like Scotland is known for its beautiful landscapes and greenery. We should have more designated places people can visit and admire it’
- ‘Trees and plants help with climate change and more green spaces for people that don’t have a garden or access to open spaces’
- ‘It makes living in the National Park very expensive for local people. The additional visitors will pollute the area’
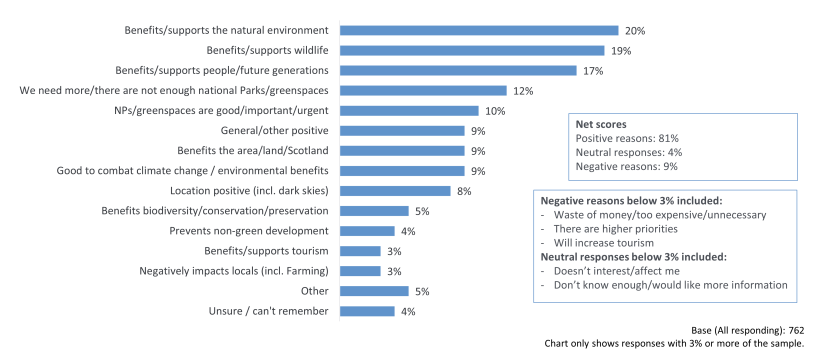
Figure 3. Reasons for views in support/opposition to National Park
Click for a full description
The bar chart shows the reasons respondents support or oppose the establishment of a new National Park. The survey question was unprompted. Responses on the bar chart are ranked, from the most frequently to the less frequently mentioned activities. Examples of reasons mentioned by only a handful of respondents are listed on a box on the right-hand side of the chart. The net scores for positive, neutral and negative comments are given in a box on the right-hand side of the chart.
Visits to Scotland’s National Parks
Respondents were asked if they had visited either of Scotland’s existing National Parks, for the purposes of leisure, tourism or outdoor recreation in the last 12 months (Figure 4). Overall, half of all respondents had visited at least one National Park in the previous year, with just over a tenth having visited both. Respondents were more likely to have visited Loch Lomond and the Trossachs National Park (28%) than Cairngorms National Park (11%). Visits to the Parks were highest among those living in Glasgow (64%) and the West of Scotland (60%), likely due to population density and proximity of Loch Lomond and the Trossachs.
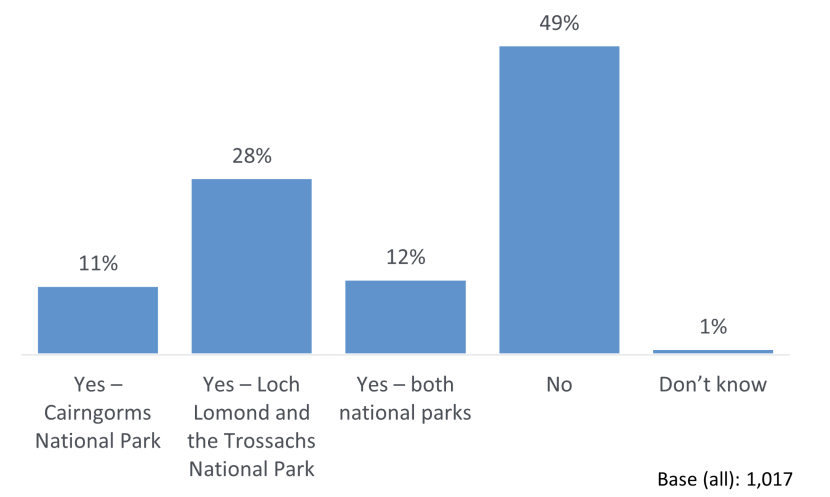
Figure 4. Visited national parks in the last 12 months
Click for a full description
The bar chart shows proportions of respondents that have visited each of the National Parks in the last 12 months. Overall, 50% of participants had visited one or both parks, with 11% having visited the Cairngorms National Park, 28% having visited Loch Lomond & the Trossachs, and 12% having visited both.
Those most likely to have visited the Galloway area were people aged 18-34, compared with those aged 55+; working people, compared with retired people; households containing a child, compared with those without a child; and minority ethnic respondents, compared with non-ethnic minority respondents.
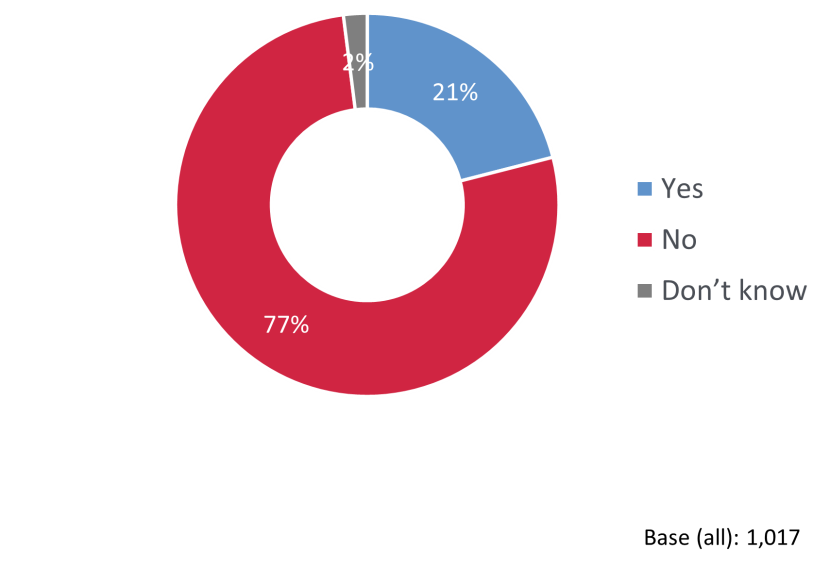
Figure 5. Visited south west of Scotland area in the last 12 months
Click for a full description
The graph shows the proportion of participants that have visited the south west of Scotland for leisure or tourism in the last 12 months. 21% of participants had visited the area, while 77% had not. 2% said they did not know.
Nature terminology
People are familiar with many nature and environmental terms, but some language is less well-known.
Respondents were shown a list of terms that relate to nature and the environment and asked to say if they had heard of them and knew what they meant. As shown in Figure 6, almost everyone had heard of climate change and most said they know what it means. Those with lower Nature Connectedness Index (NCI) scores were less likely than those in the higher bands to say they understand what it means (74% of those in the 0-30 band and 81% in the 31-50 band understanding, versus 88% of those in the 51-80 band and 90% in the 81+ band).
Almost everyone was also aware of the terms ‘greenspace’, ‘net zero’ and ‘biodiversity’, with well over half of the respondents saying they know what these terms mean.
Far fewer were familiar with the terms ‘green health’ and ‘natural capital’, with only around a tenth saying they understand what natural capital means.
People aged 18-34 were more likely than other age groups to understand the terms biodiversity, nature-based solutions, natural capital and green health. Those with NCI scores above 50 were also more likely than those with scores of 0-50 to have heard of these terms and to say that they understand them.
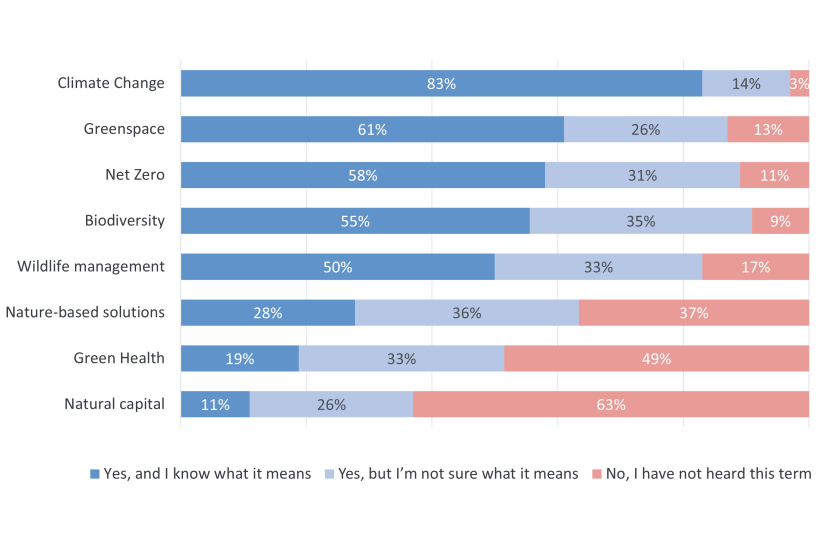
Figure 6. Awareness of nature terminology
Click for a full description
A set of five stacked bar charts that show the extent to which respondents have heard of a series of nature terms. Responses available are: ‘yes and I understand what it means’, yes but I’m not sure what it means’ and ‘no I have not heard this term’.
Protected areas (also known as designated sites) help to ensure that special habitats, species and geological sites are safeguarded. Respondents were shown a list of the different kinds of protected areas in Scotland and asked whether they had heard of them and whether they understood what the designation meant. As shown in Figure 7, the majority of respondents had heard of all the protected areas listed, with the exception of National Scenic Areas (NSA).
Respondents were most familiar with the terms National Nature Reserve (NNR) (69% aware, with 45% knowing what it is) and Marine Protected Area (MPA) (71% aware, with 42% knowing what it is). Those more likely to say they know what these terms mean were: people aged 55+ compared with younger people, those with NCI scores above 50 compared to those with scores of 0-50, and men compared to women.
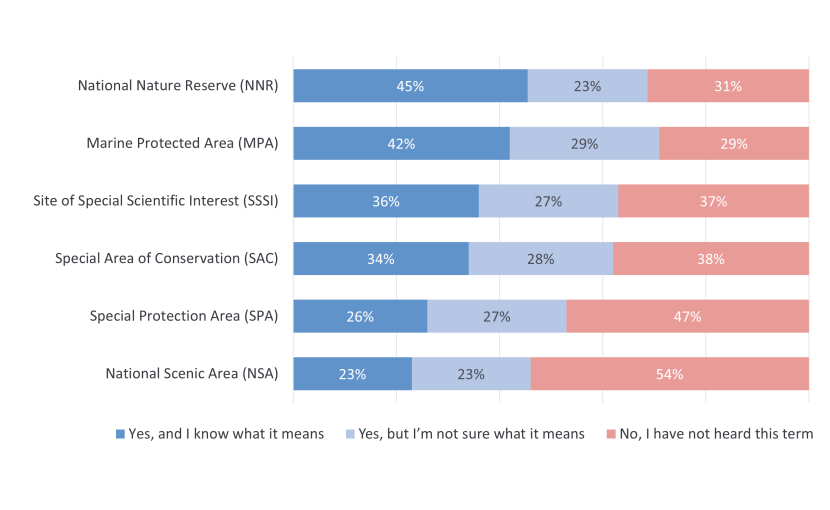
Figure 7. Awareness of Protected area designations in Scotland
Click for a full description
A set of five stacked bar charts that show the extent to which respondents have heard of a Scottish protected areas designations. Responses available are: ‘yes and I understand what it means’, yes but I’m not sure what it means’ and ‘no I have not heard this term’.
Environmental issues
People feel more strongly about the seriousness of climate change as compared to biodiversity loss.
Biodiversity loss
Respondents were shown a series of statements relating to biodiversity loss and asked to what extent they agreed or disagreed with each.
As shown in Figure 8, the majority (71%) of respondents agreed to some extent that biodiversity loss is an immediate and urgent problem, while around a fifth were less sure, saying that they did not agree or disagree with the statement. Levels of agreement increase as levels of nature connectivity increase: rising from 42% for those with a Nature Connectedness (NCI) score of 0-30, to 69% for a score of 31-50, 81% for a score of 51-80 and 87% for a score of 81-100. These results indicate a strong relationship between Nature Connectedness and the importance placed on biodiversity loss.
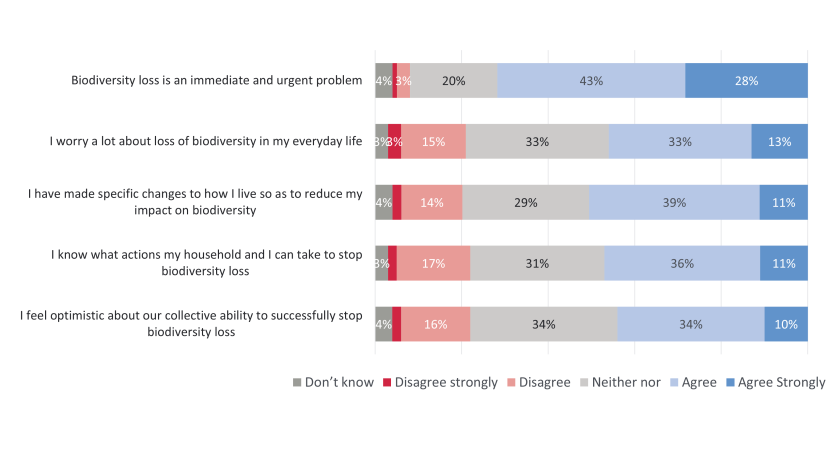
Figure 8. Views on biodiversity
Click for a full description
A set of five stacked bar charts that show the extent to which people agree or disagree with statements relating to biodiversity, or the variety of natural habitats and species in Scotland. The responses are presented on a five-point scale from disagree strongly through to agree strongly. There is also a don’t know option. To the right of the stacked bar chart is a table which shows net agreement for each statement for the last three years – 2022, 2023 and 2024 where these are available. Green circles on the chart indicate where the level of agreement is significantly higher than in 2023 (95% confidence level).
The proportion agreeing that biodiversity loss is an immediate and urgent problem is higher in 2024 than in the 2023 survey (62%),
Around half of respondents agreed they had made changes to their lives to reduce their impact on biodiversity (50%), they worry about loss of diversity in everyday life (46%), and they know what actions their household can take to stop biodiversity loss (47%). Slightly fewer agreed that they feel optimistic about our collective ability to stop biodiversity loss (44%). Levels of agreement for these statements were higher amongst those aged 18-34 than 55+, and for households with children than those without. There were also marked differences in opinions in line with respondents’ NCI score, as shown in 3, with likelihood to agree with statements generally increasing as the NCI score increased.
| Statement | 2022 | 2023 | 2024 |
|---|---|---|---|
| Biodiversity is an immediate and urgent problem | 76% | 62% | 71% |
| I worry a lot about loss of biodiversity in my everyday life | 42% | 36% | 46% |
| I have made specific changes to how I live so as to reduce my impact on biodiversity | - | 42% | 50% |
| I know what actions my household and I can take to stop biodiversity loss | 34% | 39% | 47% |
| I feel optimistic about our collective ability to successfully stop biodiversity loss | - | 40% | 44% |
| Total agreement with statements and by Nature Connectedness Index score (banded) | Total | NCI score | NCI score | NCI score | NCI score |
|---|---|---|---|---|---|
| Biodiversity loss is an immediate and urgent problem | 71% | 42% | 69% | 81% | 87% |
| I have made specific changes to how I live so as to reduce my impact on biodiversity | 50% | 20% | 48% | 62% | 67% |
| I feel optimistic about our collective ability to successfully stop biodiversity loss | 44% | 22% | 47% | 54% | 48% |
| I know what actions my household and I can take to stop biodiversity loss | 47% | 23% | 44% | 57% | 62% |
| I worry a lot about loss of biodiversity in my everyday life | 46% | 16% | 43% | 55% | 69% |
| Base | 1017 | 172 | 395 | 267 | 183 |
Climate change
Respondents were shown a series of statements relating to climate change and asked to what extent they agreed or disagreed with each.
As shown in Figure 9, the majority agreed that climate change is an immediate and urgent problem (75%), that they know the actions their household can take to tackle climate change (65%), and that they have made specific changes to how they live to reduce their contribution to climate change (63%).
Levels of agreement with these statements was typically higher amongst those aged 18-34 than 55+, for households with children than those without, those in work than those retired, and minority ethnic people than non-minority ethnicities. Repeating trends previously noted, those with lower NCI scores were less likely than others to agree with these statements, with just 37% of those in the 0-30 band saying they had made changes to the way they live, compared with 62% of those in band 31-50 and 73%/79% of those in the upper bands (see Table 4).
Around half (52%) of respondents agreed that they worry about climate change in their everyday life, while 44% agreed that they felt optimistic about our collective ability to tackle the problem. Younger people, households with children, and people from ethnic communities were more likely to agree with both of these statements.
Notably, respondents were more likely to both be worried about climate change in their everyday life and feel optimistic about tackling the issue in 2024 than in 2023.
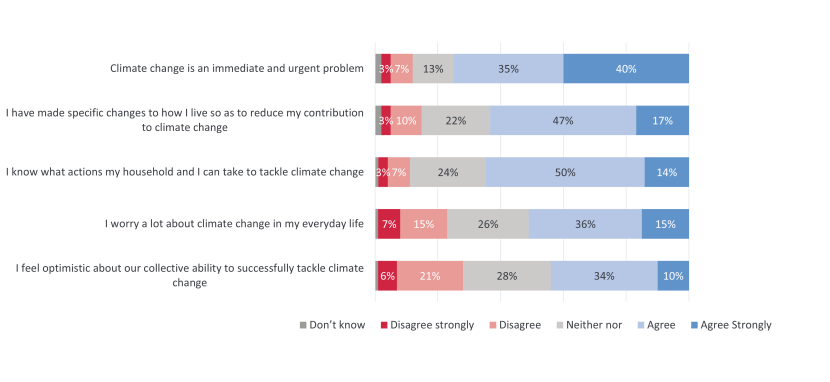
Figure 9. Views on climate change
Click for a full description
A set of five stacked bar charts that show the extent to which people agree or disagree with statements relating to climate change. The responses are presented on a five-point scale from disagree strongly through to agree strongly. There is also a don’t know option. To the right of the stacked bar chart is a table which shows net agreement for each statement for the last three years – 2022, 2023 and 2024. Green circles on the chart indicate where the level of agreement is significantly higher than in 2023 (95% confidence level).
| Statement | 2022 | 2023 | 2024 |
|---|---|---|---|
| Climate change is an immediate and urgent problem | 83% | 75% | 75% |
| I worry a lot about climate change in my everyday life | 53% | 47% | 52% |
| I have made specific changes to how I live so as to reduce my contribution to climate change | - | 61% | 63% |
| I know what actions my household and I can take to tackle climate change | 67% | 63% | 65% |
| I feel optimistic about our collective ability to successfully tackle climate change | 39% | 38% | 44% |
| Total agreement with the following statements, and by the Nature Connectedness Index (banded) | Total | NCI score | NCI score | NCI score | NCI score |
|---|---|---|---|---|---|
| Climate change is an immediate and urgent problem | 75% | 56% | 77% | 76% | 85% |
| I know what actions my household and I can take to tackle climate change | 65% | 41% | 63% | 75% | 76% |
| I have made specific changes to how I live so as to reduce my contribution to climate change | 63% | 37% | 62% | 73% | 79% |
| I worry a lot about climate change in my everyday life | 52% | 25% | 51% | 58% | 68% |
| I feel optimistic about our collective ability to successfully tackle climate change | 44% | 25% | 49% | 49% | 44% |
| Base | 1017 | 172 | 395 | 267 | 183 |
Levels of agreement were higher for each of the aforementioned statements in relation to climate change than for biodiversity loss, with the only exception being the statement ‘I feel optimistic about our ability to impact …’ – the same proportion of people, around two-fifths, agreed with this statement for both biodiversity loss and climate change.
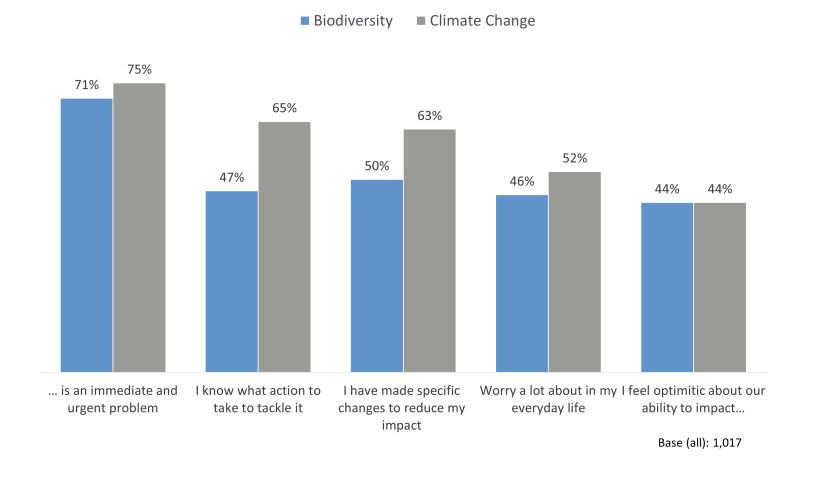
Figure 10. Comparison of views on biodiversity loss and climate change: % agreeing with related statements
Click for a full description
A clustered column chart that show the extent to which people agree or disagree with similar questions relating to climate change and biodiversity loss (for example). The columns shows the total percentage of respondents who either agree or strongly agree with each of the five listed statements.
Nature-friendly behaviour
Individual actions
Most people had undertaken nature-friendly activities in their local area and/or in their garden or other private outdoor space (if they have access to one).
All respondents were shown a list of nature-friendly activities and asked if they had undertaken any of them at home or in their local area during the previous 12 months. The most common activities that respondents had undertaken were walking in local greenspaces, providing food or water for wild animals and picking up litter. Less than a tenth of respondents said they had done none of the activities listed.
Those with children in the household (96%) were more likely than those without children (90%) to participate in at least one activity, while people with health conditions were less likely than others to participate (87%), particularly among those who took a walk (66% versus 79% without a health condition).
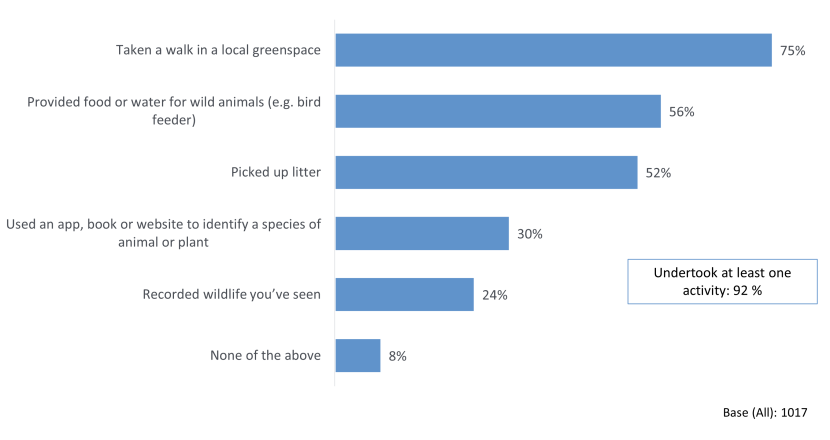
Figure 11. Nature-friendly behaviors at home or within local area
Click for a full description
The bar chart shows the types of activities respondents have undertaken at home or in their local area in the last 12 months. The survey question was prompted. Responses on the bar chart are ranked, from the most frequently to the least frequently mentioned activities. This question was asked to all respondents.
Respondents with access to a private outdoor space (their own garden, a private communal garden, a balcony or patio, or an allotment) were shown a list of some of nature-friendly behaviours and asked which, if any, they had done in the last 12 months (see Figure 12). The behaviours most commonly undertaken were avoiding the use of insecticides or weedkiller, maintaining plants with fruits/berries and planting/maintaining pollinator-friendly plants. Just under a fifth of respondents with access to private outdoor space said they had adopted none of the behaviours listed.
People aged 55+ years were more likely than those aged 18-34 years to participate in the most common activities.
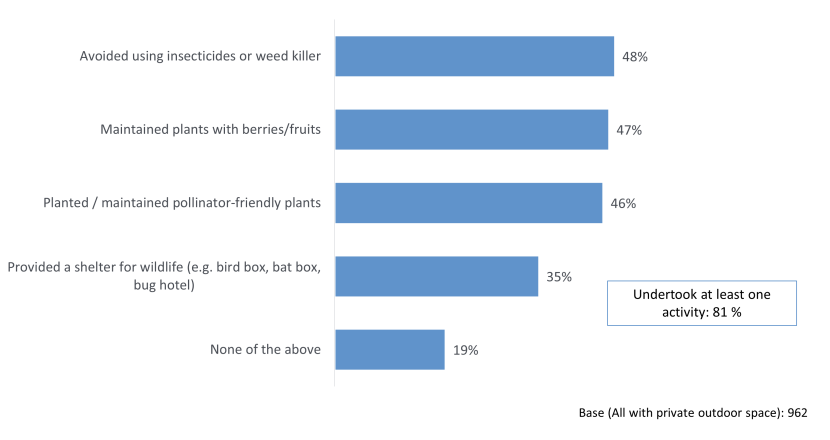
Figure 12. Nature-friendly behaviors within garden (or private outdoor area) during last 12 months
Click for a full description
The bar chart shows the types of activities respondents have undertaken in within their garden (or private outdoor area) during last 12 months. The survey question was prompted. Responses on the bar chart are ranked, from the most frequently to the least frequently mentioned activities. This question was asked to all respondents with a private outdoor space.
Respondents with a private garden or an allotment were asked if they had taken specific nature-friendly actions in these spaces over the last year (see Figure 13). Overall, just over four-fifths of these respondents had undertaken at least one of the nature-friendly activities. The most common behaviours, each taken by over two-fifths of these respondents, were to have left twigs, leaves and other debris on the ground for wildlife, and to have allowed vegetation to die back naturally. A number of differences between sub-groups were noted:
- Allow vegetation to die back naturally - People aged 55+ more likely than those aged 18-34 to follow this behaviour (51% versus 32%)
- Grown fruit/veg to consume at home - Households with children more likely than those without (43% versus 32%)
- Use peat-free compost - People aged 55+ more likely than those aged 18-34 to take this action (36% versus 17%)
- Created/maintained a pond - People aged 18-34 more likely than those aged 35+ to have taken this action (11% versus 5%); households with children more likely than those without (11% versus 5%),
- Taken any of the actions - Households with children more likely than those without (90% versus 80%)
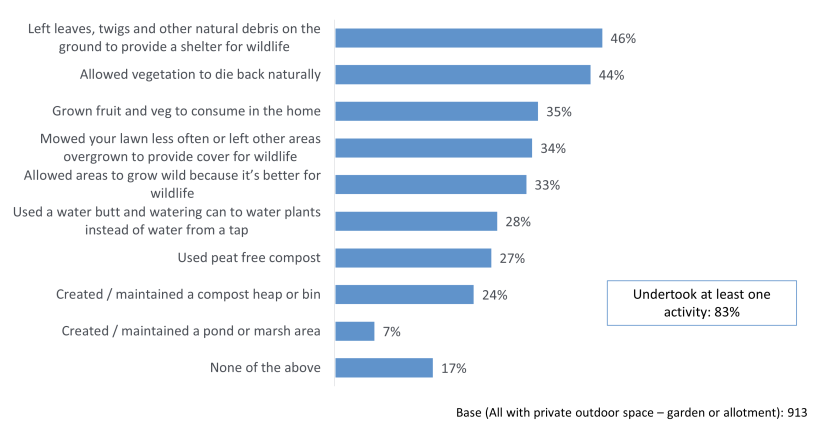
Figure 13. Nature-friendly behaviors within garden or allotment during last 12 months
Click for a full description
The bar chart shows the types of activities respondents have undertaken in within their garden or allotment during last 12 months. The survey question was prompted. Responses on the bar chart are ranked, from the most frequently to the least frequently mentioned activities. This question was asked to all respondents with access to a garden or an allotment.
Volunteering and support for nature-based organisations
Around two-fifths of people (42%) have volunteered to help the environment in the last year, while just over half have supported environmental organisations.
All respondents were asked if they had volunteered to help the environment in the last 12 months. Around a third responded that they did so informally, for example, by picking up litter, recycling and waste sorting, while 11% volunteered more formally as part of an organised group.
There were some variances in likelihood to undertake a volunteering action across sub-groups within the sample.
- Age - 18-34 year olds (63%) more likely to have volunteered, compared to 35-54 years olds (43%) and 55+ years olds (30%)
- Working status - people in work (50%) more likely, compared to retired people (29%) and people who are not working (34%)
- Children in household - households containing children (60%), compared to those without children (35%).
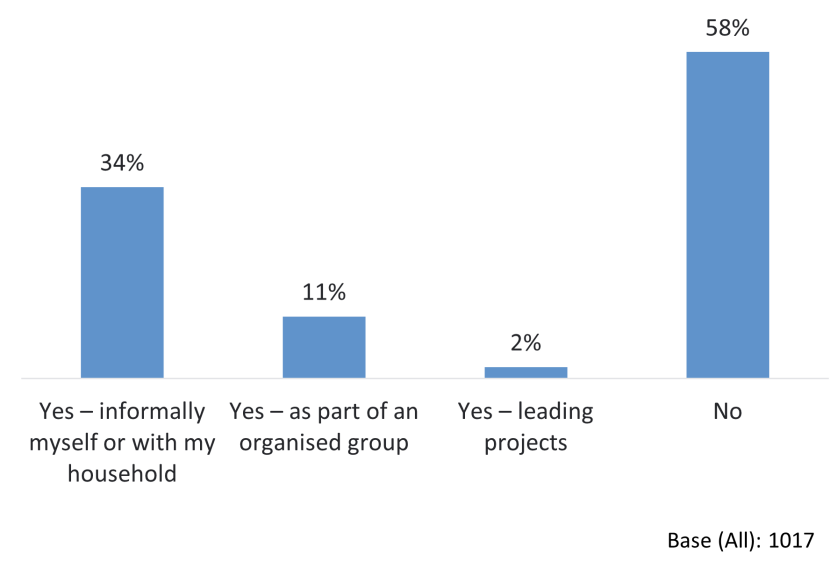
Figure 14. Volunteered to help the environment during last 12 months
Click for a full description
The bar chart showing whether respondents have volunteered to help the environment and, if so, if this was informal or as part of an organized group.
All respondents were also asked about the types of support, if any, they had given to organisations that help to look after nature and the environment in the UK. Just over half reported that they had supported environmental organisations. The most common methods of support were donating money, following on social media and purchasing goods and merchandise, while some people (around one in ten) reported having stronger links with the organisations, by getting involved in volunteering, subscribing to a mailing list, or paying for membership.
Again, there were found to be some variances in engagement across the sample profile. Those most likely to support a nature/environmental organisation were:
- Younger age groups - 18-34 year olds (76%), compared to 35-54 years olds (54%) and 55+ years olds (40%);
- People in work – 62%, compared to retired people (35%) and people who are not working (49%);
- Households containing children – 70%, compared to those without children (47%); and
- People without a disability/health condition – 56%, compared with people who have a disability/health condition (48%).
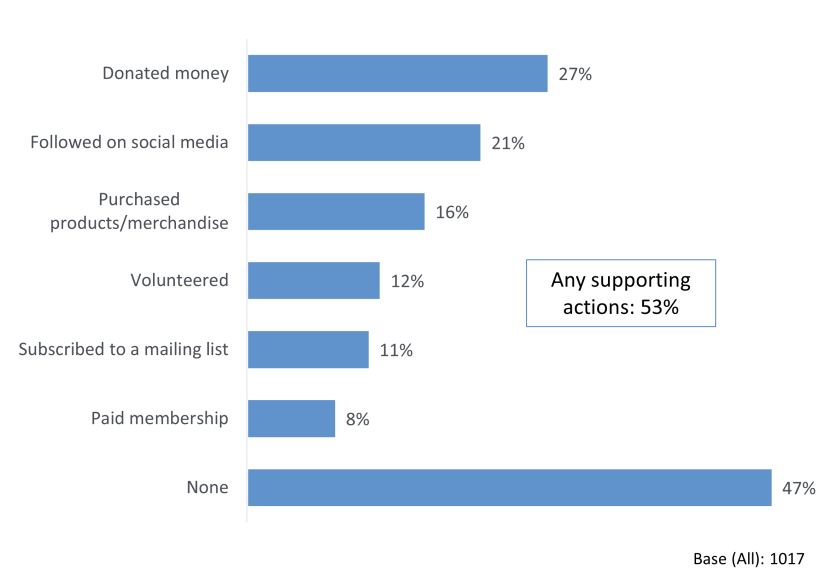
Figure 15. Support given to environmental organisations during last 12 months
Click for a full description
The bar chart shows the types of support that respondents have given to organisations that help wildlife or the natural environment during last 12 months. These organisations include Scottish Wildlife Trust, RSPB, Marine Conservation Society, The Woodland Trust, and so on. Responses on the bar chart are ranked, from the most frequently to the less frequently mentioned activities.
Notably, as shown in Table 5, people in the upper Nature Connectedness Index bands were more likely to undertake all the nature-friendly behaviours (except for subscribing to a mailing list), while those in the lowest band were the least likely to engage.
| Question | Total | NCI score | NCI score | NCI score | NCI score | Base |
|---|---|---|---|---|---|---|
| Q1: Any nature-friendly activity in local area (At home, or in your local area, have you done any of the following during the last 12 months?) | 92% | 76% | 92% | 98% | 98% | 1017 |
| Q2: Any nature-friendly activity in private outdoor space (In your garden (or any private outdoor area you have access to), have you done any of the following during the last 12 months?) | 81% | 63% | 79% | 87% | 91% | 962 |
| Q3: Any nature-friendly activity in garden/allotment (In your garden (or any private outdoor area you have access to), have you done any of the following during the last 12 months?) | 83% | 69% | 81% | 87% | 96% | 913 |
| Q4: Any volunteering action: (In the last 12 months, have you volunteered to help the environment?) | 42% | 25% | 40% | 49% | 52% | 1017 |
| Q5: Organisation support (In the last 12 months, in what ways have you supported any organisation(s) that help look after wildlife or the natural environment in the UK?) | 53% | 34% | 53% | 59% | 64% | 1017 |
Becoming more involved in nature-friendly activities
Most people agreed that they could be doing more do help nature. When asked, 73% of respondents agreed with this sentiment, with 20% agreeing strongly. Likewise, relatively few people felt that they were unable to do more to help nature, with only a quarter of respondents agreeing with this statement.
Those more likely to feel that they could do more or disagree that they were unable to do more were typically more likely to be:
- people in work - 79% agree they could do more, 43% disagree that they are unable to do more, compared to retired people (60% and 33% respectively);
- households with children - 84% agree they could do more, 44% disagree that they are unable to do more, compared with those without children (69% and 36% respectively); and
- people without a health condition/disability - 77% agree they could do more, 44% disagree that they are unable to do more, compared to those with health conditions/disabilities (64% and 26% respectively).
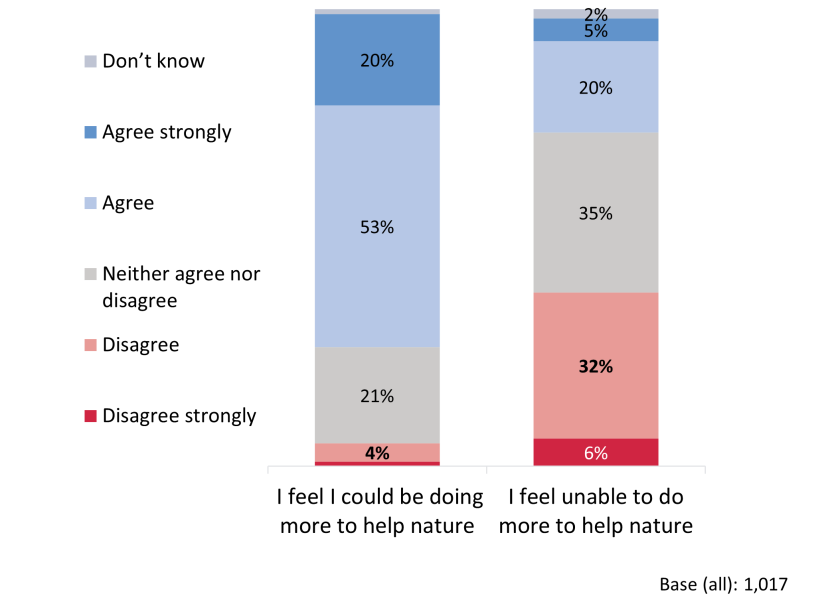
Figure 16. Opinions on supporting nature
Click for a full description
A set of two stacked bar charts show how strongly respondents feel they are supporting nature. Respondents have said how strongly they agree with the statements: “I feel I could do more to help nature” and I feel unable to do more to help nature”. The responses are presented on a five-point scale from very strongly disagree through to strongly agree.
Figure 17 shows the factors that people felt would encourage them to take more action to help nature and the environment. Top of the list, selected by almost two-fifths of people, was having more time and flexibility in my life. This was more likely to be mentioned by people aged under 55 (47%), those in work (51%), and those with children in their household (48%).
Around three in ten people felt that measures like seeing the positive effects of their actions, engaging with other people, and better information about what actions they can take, would encourage them to take more action.
Just over one tenth of respondents said that nothing would encourage them to take more action to help nature and the environment. These respondents were more likely to be people aged over 55 (21% versus 3% of those aged 18-34), retired (24% versus 7% of working people), and households without children (15% versus 5% those with children).
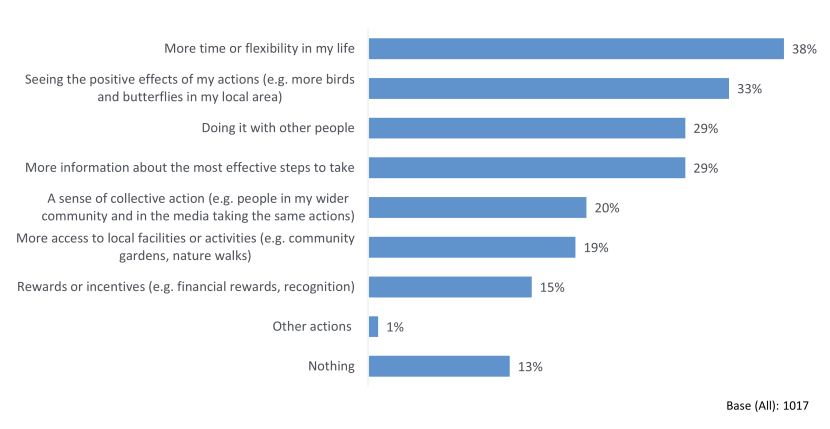
Figure 17. Factors that could encourage more action to help nature and the environment
Click for a full description
The bar chart what would encourage respondents to take more action to help nature and the environment. Respondents were offered a list of options and asked to select up to three from the list. They could write in their own option if they preferred, however, only one percent of respondents did so. Responses on the bar chart are ranked, from the most frequently to the less frequently mentioned activities.
Annexe 1: Methodology
The NatureScot Opinion Survey (NOS) is an annual quantitative population survey designed to measure public awareness of the organisation, understanding of their work, and attitudes towards a range of topics that fall within the organisation’s remit. NOS 2024 was conducted as an online self-completion survey.
Sampling
The target group for the research was a representative quota sample of adults aged 18+ living in Scotland from a portfolio of panel providers in Scotland (Cint, Dynata and Norstat). Quotas were managed for age, gender and social group, with broad location, ethnicity and rurality expected to fall out naturally.
| Sample characteristics | 2024 Number | 2024 % |
|---|---|---|
| Man | 483 | 47% |
| Woman | 532 | 52% |
| Non-binary | 2 | 0% |
| 18-24 | 82 | 8% |
| 25-44 | 328 | 32% |
| 45-64 | 364 | 36% |
| 65+ | 243 | 24% |
| Prefer not to say age | - | - |
| ABC1 | 507 | 50% |
| C2DE | 506 | 50% |
| Prefer not to say social group | 4 | 0% |
| Total | 1017 | - |
Data collection
Because the NOS is repeated annually, care was taken to minimise resampling from the previous wave. This was to help ensure that respondents’ recognition of NatureScot, as well as their awareness of, and response to, the issues covered in the questionnaire, was not biased by having previously taken part in the survey. The data collection approach was therefore to work with a portfolio of panel providers (Cint, Dynata and Norstat), each responsible for a share of the target sample. This enabled them to commit to providing fresh sample for the first two years of the survey in 2023 and 2024.
When Progressive works with panels, the following protocols are used to validate the data:
- All respondents can only submit one response due to a system of unique IDs used by panel providers.
- Panellist IDs are also checked for duplication as part of Progressive’s fieldwork checks.
- Where more than one panel provider is used, we use cookies to ensure the same individual cannot complete the same survey via two different sample providers.
The fieldwork took place between 19 November and 2 December 2024.
Data processing and analysis
The survey generated 1017 responses.
No weighting was applied to the survey sample; the review of the achieved sample indicated it closely matched the target population, with respect to age and gender based on the 2022 Census and social group (the 2011 Census).
As noted above, quotas were used to guide sample selection for this study. This means that we cannot provide statistically precise margins of error or significance testing as the sampling type is non-probability. The margins of error outlined below should therefore be treated as indicative, based on an equivalent probability sample. The overall sample size of 1,017 provides a dataset with an approximate margin of error of between ±0.61% and ±3.07%, calculated at the 95% confidence level (market research industry standard).
The data processing department undertakes a number of quality checks on the data to ensure its validity and integrity. These checks include:
- Every project has a live pilot stage, covering the first few days of fieldwork. The raw data and topline numbers are checked after the pilot to ensure questionnaire routing is working correctly and there are no unexpected responses or patterns in the data.
- The raw data is monitored throughout fieldwork to check for flatlining responses, quality of open-ended responses and speed of completion. Rules are agreed with the data processing team at the start to determine when to exclude data based on these checks.
- A computer edit is carried out prior to analysis, involving both range (checking for outliers) and inter-variable checks. Any further inconsistencies identified at this stage are investigated by reference back to the raw data where possible.
- Where an ‘other – specify’ codes is used, open-ended responses are checked against the parent question for possible up-coding.
- Responses to open-ended questions are spell and sense checked. Where required these responses are grouped using a coding frame, which is used in analysis. The code frame is developed by the executive or operations team based on the analysis of minimum 50 responses.
- Open-ended coding is validated using a dependent approach, whereby a second person has access to the original coding and checks a minimum of 5% of cases coded. Once responses are fully coded and validated, the completed code frame is given a final check by the Executive responsible for the project, and any queries or amends are passed back to the Data Project manager.
All research projects undertaken by Progressive comply fully with the requirements of ISO 20252, the GDPR and the MRS Code of Conduct.
Last updated:


