NatureScot Research Report 1361 - SPANS Scotland’s People and Nature Survey 2023/24 - outdoor recreation report
Published: 2025
Authors: Duncan Stewart and Jim Eccleston (56 Degree Insight)
Cite as: Stewart, D. and Eccleston, J. 2025. SPANS Scotland’s People and Nature Survey 2023/24 - outdoor recreation report. NatureScot Research Report 1361.
What is SPANS?
Scotland’s People and Nature Survey (SPANS) is a large-scale population survey that provides detailed data on how adults in Scotland use, value and enjoy the outdoors and connect with nature. SPANS data allow NatureScot to monitor key trends over the long-term and produce statistically robust insights.
The core research objectives for SPANS are to deliver strong quantitative evidence in relation to the following key areas:
- Visits to the outdoors for leisure and recreation;
- Recreational use of, and attitudes towards, urban greenspace;
- Connection to nature;
- Benefits of engagement with the natural environment;
- Environmental attitudes and behaviours.
Outdoor recreation report
report provides findings from SPANS 2023/24 which covers a 12-month period from March 2023 to February 2024. The 2023/24 survey followed on from previous waves of SPANS which ran on a triennial basis between 2012 and 2019.
SPANS 2023/24 was delivered with support from our contributing partners: Scottish Forestry, Sustrans, Cairngorm National Park Authority, and Loch Lomond & the Trossachs National Park Authority.
This report focuses on findings relating to outdoor recreation behaviour from SPANS 2023/24. A headline report and a suite of other reports focused on specific areas of interest have also been produced using data from SPANS 2023/24:
- Headline report
- Outdoor recreation
- Health and wellbeing
- Connection to nature
- Equality and diversity
- Technical report
- Data downloads
Survey method
SPANS 2023-2024 used an online survey approach to provide robust coverage of the Scottish adult population aged 16 and over. To compile the data, twelve monthly survey waves were undertaken between April 2023 and March 2024, consisting of at least 1,000 survey completions per month.
Fieldwork was undertaken using the Prodege online consumer panel. Panel members go through a robust quality control process before they can join the panel and are then invited to take part in surveys in return for reward points.
Each month a sub-set of the Scottish panel was invited to take part in SPANS, targeted based on their demographics and place of residence. Sampling quotas were used to produce a representative distribution across gender, age, social grade and place of residence.
Questionnaire design involved a modular approach to ensure coverage of a wide range of topics of interest over the 12 survey waves. As such, while certain questions were included in every monthly wave, others were asked every other month, quarterly, or less often.
Further details on the survey methods used are provided in the SPANS technical report.
Comparability with previous surveys
The online survey approach taken in the 2023/24 survey differs from that used in previous waves of SPANS, where a face-to-face interviewing method was employed. This change of method was made for several reasons, including future-proofing the survey against declining response rates and rising costs of in-person surveying.
There can be small differences in the way people answer survey questions online as opposed to in-person. Variations in results between SPANS 2023/24 and previous waves (even when the wording of questions is kept consistent) may partly be influenced by methodological changes as well as changes in attitudes or behaviour at a population level. As a result, caution should be exercised when making comparisons with past SPANS results, and figures from the present survey should not be considered part of a continuous time series. SPANS 2023/24 forms a new baseline for comparisons with subsequent survey waves.
Further details on the potential impacts of these changes are provided in the SPANS technical report.
Participation in outdoor recreation
Most people in Scotland visit the outdoors at least once a week
Participation levels vary significantly with affluence and health
Participants were asked to estimate how often, on average, they visited the outdoors for leisure or recreation in the last twelve months. Overall, 61% of adults in Scotland visited at least once a week for leisure or recreation. However, a substantial minority (21%) took fewer than one visit per month, including some who take no visits at all (5%).
The population groups most likely to take outdoor visits on a frequent basis included those residents in the least deprived areas, those who are most financially comfortable, those with very good health and, unsurprisingly, dog owners (see Figure 1, below).
People with poor health were less likely to visit the outdoors, with 15% of those rating their health as ‘bad’ or ‘very bad’ indicating that they never visited the outdoors. Residents of the most deprived SIMD areas were also less likely to visit than other groups.
Frequency of visit taking among other demographic variables not shown in Figure 1 (including age and ethnicity) were compared, but minor or no statistically significant differences were found.
Figure 1. Frequency of outdoor recreation visits in the last 12 months
Click for a full description
REC 1 - How often on average have you taken visits to the outdoors for leisure and recreation in Scotland in the last 12 months?
Base: All respondents (n=12,053). Demographic weight applied.
Stacked bar chart illustrating percentages of population with different levels of frequency of participation in outdoor recreation by key demographic groups.
Bars are oriented horizontally with demographic groups on the y axis, and each contains 4 coloured sections to illustrate the percentages visiting frequently (dark blue), occasionally (light blue), seldom (light grey) or never (dark grey).
The data are summarised in the following table:
| Row % | Frequent (at least once a week) | At least once a week | Occasional (once or twice a month) | Seldom (less than once a month) | Never |
|---|---|---|---|---|---|
| Total adult population | 61% | 43% | 18% | 16% | 5% |
| Aged 16-34 | 64% | 48% | 20% | 14% | 3% |
| Aged 35-54 | 60% | 43% | 20% | 17% | 4% |
| Aged 55+ | 59% | 40% | 15% | 18% | 7% |
| 10% least deprived SIMD | 71% | 51% | 16% | 12% | 2% |
| 10% most deprived SIMD | 50% | 39% | 20% | 22% | 8% |
| Very comfortable financially | 72% | 45% | 16% | 9% | 3% |
| Relatively comfortable financially | 65% | 47% | 17% | 15% | 3% |
| No money for luxuries | 60% | 44% | 20% | 16% | 4% |
| Can only just/ cannot afford costs | 51% | 37% | 17% | 22% | 9% |
| Very good health | 72% | 46% | 14% | 11% | 2% |
| Good or fair health | 61% | 44% | 19% | 16% | 4% |
| Bad or very bad health | 39% | 28% | 17% | 29% | 15% |
| White | 61% | 43% | 18% | 16% | 5% |
| Minority ethnic group | 54% | 41% | 24% | 19% | 4% |
| Own or look after a dog | 71% | 43% | 14% | 11% | 3% |
| Do not own or look after a dog | 54% | 44% | 20% | 19% | 6% |
The number of visits taken in an average month increases with age and is highest in the least deprived areas
Participants were asked to estimate the number of visits they had taken to the outdoors for leisure and recreation during the previous month. The average number of visits for the overall population was 11.2 per month.
As with visit frequency, older people, people living in the least deprived SIMD areas, people with good health, people with white ethnicity, and dog owners reported greater numbers of visits per month than the overall average, as Figure 2 shows.
Figure 2. Average number of visits taken per person
Click for a full description
REC4 - How many visits to the outdoors for leisure and recreation in Scotland did you make during [PRECEEDING MONTH]?
Base: All respondents (n=12,053). Demographic weight applied. Grossed estimates use population data.
Bar chart illustrating average number of visits taken per month for total population and by key demographic groups.
Bars are oriented horizontally with demographic groups on the y axis.
The data are summarised in the following table:
| Demographic group | Average visits per month |
|---|---|
| Total adult population | 11.2 |
| Aged 16-34 | 9.5 |
| Aged 35-54 | 11.1 |
| Aged 55+ | 12.5 |
| 10% least deprived SIMD | 13 |
| 10% most deprived SIMD | 7.5 |
| Very comfortable financially | 11.3 |
| Relatively comfortable financially | 12.4 |
| No money for luxuries, can cover essentials | 11.2 |
| Can only just/ cannot afford costs | 9.2 |
| Very good health | 14.3 |
| Good or fair health | 10.9 |
| Bad or very bad health | 7 |
| White | 11.5 |
| Minority ethnic group | 6.3 |
| Own or look after a dog | 16.2 |
| Do not own or look after a dog | 8 |
Outdoor recreation is a year-round pursuit
As shown in Figure 3, monthly frequency of outdoor visits shows some degree of seasonal variation, with the percentage of people taking 16 visits or more highest in August and lowest in March and April. However, seasonal variation is generally limited.
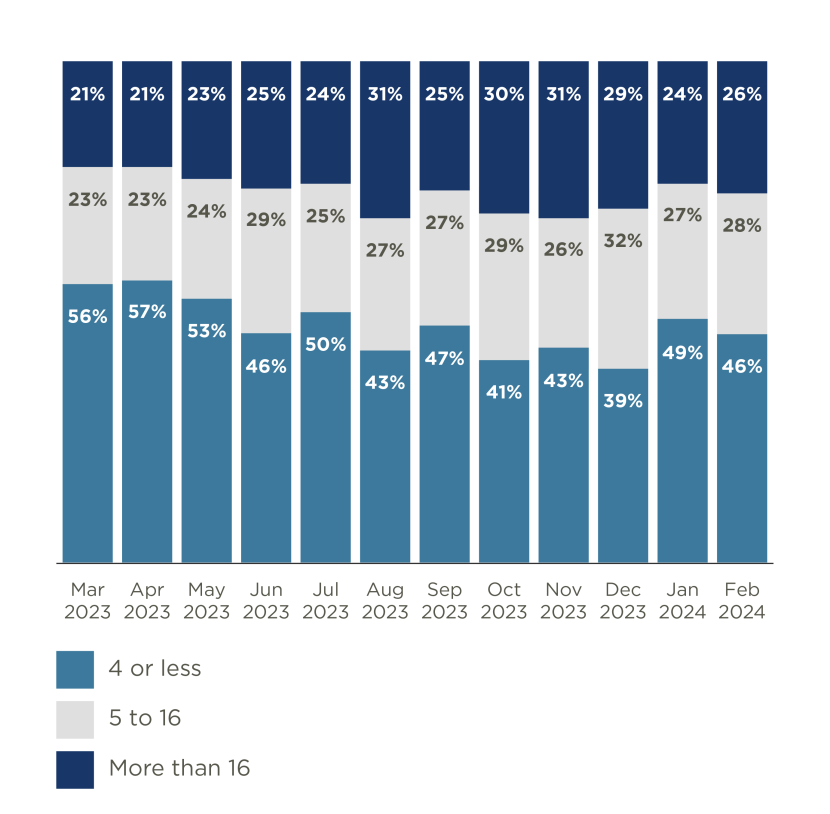
Figure 3. Number of visits taken per person by month
Click for a full description
REC4 - How many visits to the outdoors for leisure and recreation in Scotland did you make during [PRECEEDING MONTH]?
Base: All respondents (n=12,053). Demographic weight applied. Grossed estimates use population data.
Stacked bar chart illustrating percentages of taking visits at different levels of frequency by month.
Bars are oriented vertically with months on the x axis, and each contains 3 coloured sections to illustrate the percentages visiting on more than 16 occasions (dark blue), on 5 to 16 occasions (light blue) or on 1 to 4 occasions (light grey).
The data are summarised in the following table:
| Row % | 1 to 4 visits | 5 to 16 visits | More than 16 visits |
|---|---|---|---|
| Mar-23 | 38% | 29% | 25% |
| Apr-23 | 41% | 25% | 24% |
| May-23 | 36% | 27% | 31% |
| Jun-23 | 38% | 27% | 25% |
| Jul-23 | 36% | 29% | 30% |
| Aug-23 | 36% | 26% | 31% |
| Sep-23 | 33% | 32% | 29% |
| Oct-23 | 40% | 27% | 24% |
| Nov-23 | 39% | 28% | 26% |
| Dec-23 | 40% | 23% | 21% |
| Jan-24 | 45% | 23% | 21% |
| Feb-24 | 41% | 24% | 23% |
Applying these monthly estimates of average numbers of visits taken per person to the latest Scottish adult population projection of 4.6 million adults (aged 16+, using NRS mid-year estimates), we can estimate that around 611 million visits were taken over the 12 month period, with over 40 million visits taken in every month of the year.
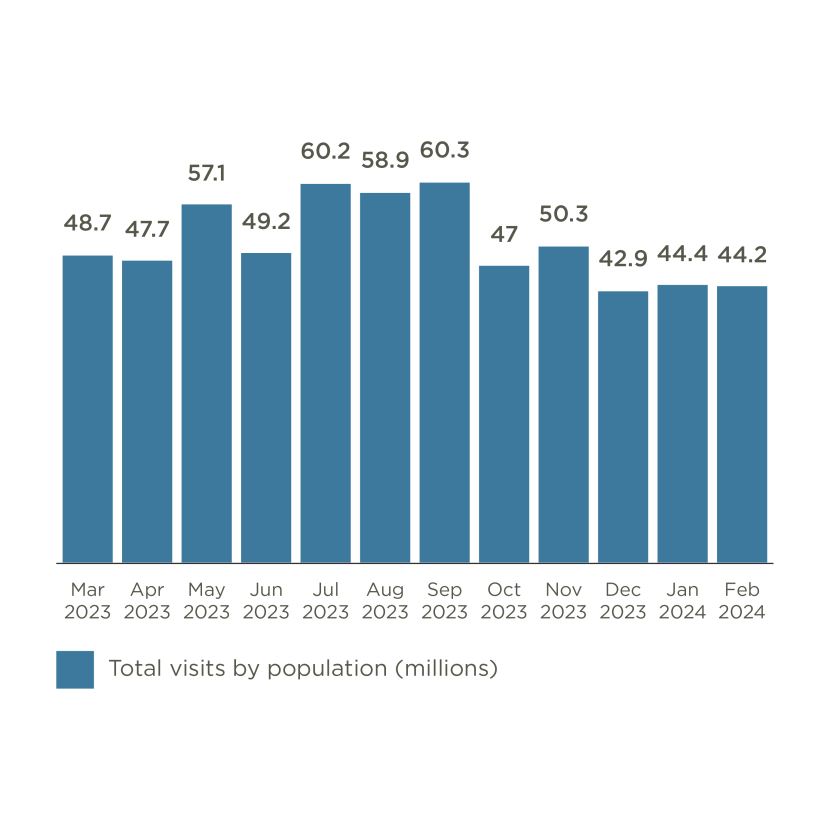
Figure 4. Estimated volume of visits to the outdoors per month amongst total population
Click for a full description
REC4 - How many visits to the outdoors for leisure and recreation in Scotland did you make during [PRECEEDING MONTH]?
Base: All respondents (n=12,053). Demographic weight applied. Grossed estimates use population data.
Bar chart illustrating estimated total volume of visits taken overall by total population during each month.
Bars are oriented vertically with months on the x axis.
The data are summarised in the following table:
| Month | Total visits by population (millions) |
|---|---|
Mar-23 | 48.7 |
Apr-23 | 47.7 |
May-23 | 57.1 |
Jun-23 | 49.2 |
Jul-23 | 60.2 |
Aug-23 | 58.9 |
Sep-23 | 60.3 |
Oct-23 | 47 |
Nov-23 | 50.3 |
Dec-23 | 42.9 |
Jan-24 | 44.4 |
Feb-24 | 44.2 |
Activities and destinations
Participants were asked a series of questions about their most recent visit to the outdoors, irrespective of whether that was a routine weeknight dog walk or a special family outing at the weekend. This information allows us to build a picture of what people in Scotland do when they visit the outdoors and where they go.
People in Scotland participate in a wide range of outdoor activities
Walking is the most popular outdoor activity
As shown in in Figure 5, the overwhelming majority of visits involved walking (93%). Around a quarter of visits included sightseeing or wildlife watching (27% and 23% respectively).
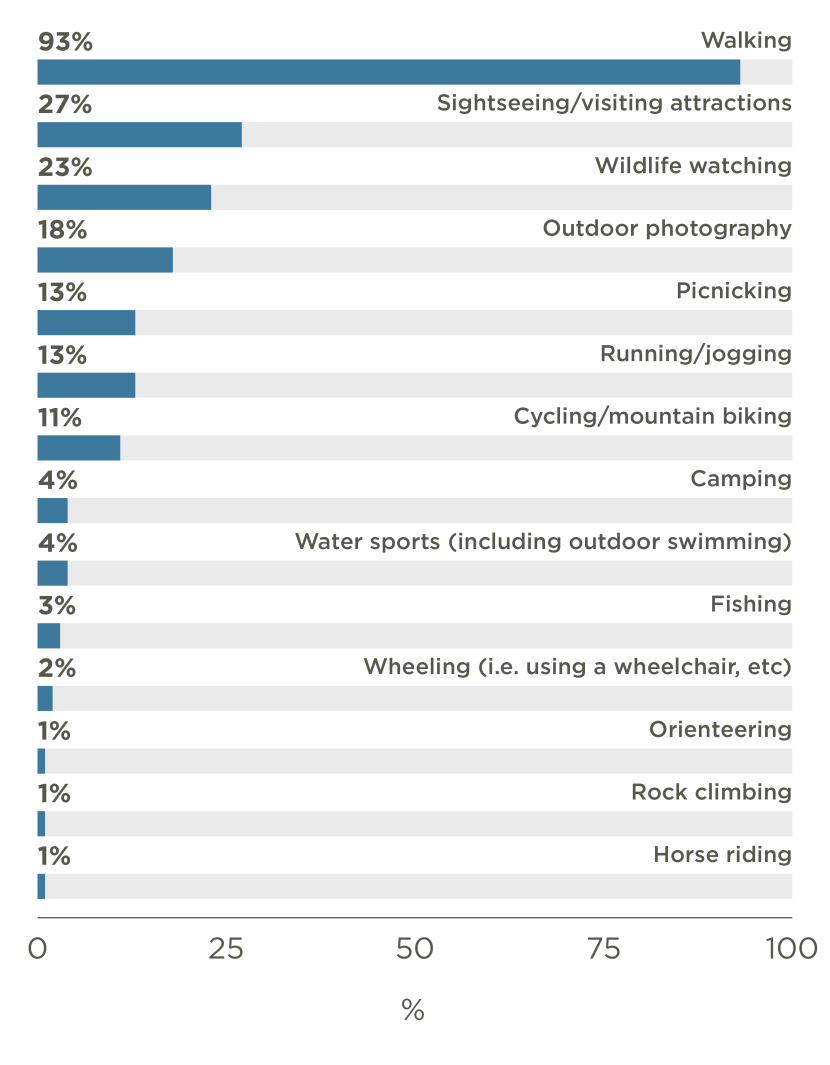
Figure 5. Activities undertaken on most recent outdoor visit
Click for a full description
REC 5 - Thinking about the most recent visit to the outdoors for leisure and recreation that you took during [PRECEEDING MONTH], which of the following did your visit include?
Note: Percentages add to more than 100% as visits could include more than one activity.
Base: Respondents taking visits in previous month (n=10,420). Excludes activities undertaken in less than 1% of visits. Visit weight applied.
Bar chart illustrating percentages of visits involving participation in a range of outdoor activities, ranked from highest percentage (walking at 93%) to lowest (horse riding at 1%).
Bars are oriented horizontally with activities on the y axis.
The data are summarised in the following table:
| Activities | Percentage of visits |
|---|---|
| Walking | 93% |
| Sightseeing/ visiting attractions | 27% |
| Wildlife watching | 23% |
| Outdoor photography | 18% |
| Running/ jogging | 13% |
| Picnicking | 13% |
| Cycling/ mountain biking | 11% |
| Water sports (including outdoor swimming) | 4% |
| Camping | 4% |
| Fishing | 3% |
| Wheeling | 2% |
| Horse riding | 1% |
| Rock climbing | 1% |
| Orienteering | 1% |
The types of activities undertaken during visits varied between demographic groups and by visit profile. For example, some statistically significant variations included the following:
- Sightseeing/ visiting attractions (27% of visits overall) - included in 37% of visits taken with children compared to 16% of visits take alone.
- Wildlife watching (23% of visits overall) - included in 33% of visits taken to places in the countryside or by the coast compared with just 20% of visits taken in urban greenspaces.
- Outdoor photography (18% of visits overall) - included in 21% of visits taken by people aged 16 to 34 compared with 16% of visits taken by people aged 55 or over.
- Running/ jogging (13% of visits overall) - varied by age from 27% of visits taken by people aged 16 to 35 to just 5% of those taken by people aged 55 or over.
Most walking trips are between two and five miles long
Table 1 illustrates the distances walked on those visits which included any walking.
Most people walked five miles or less, with distance between two and five miles being most common (58%). Only 16% of walking visits covered a distance of more than five miles. People with poor health, those visiting an urban greenspace, and people walking with a dog were all more likely than average to walk less than two miles (42%, 34% and 28% respectively).
| Distance | Visits including walking (93% of all visits) |
|---|---|
| Less than 2 miles (less than c.3km) | 24% |
| 2-5 miles (c.3-9km) | 58% |
| 6-10 miles (c.10 - 16 km) | 13% |
| More than 10 miles (16km+) | 3% |
REC5A: How far did you walk during this visit?
Base: All respondents who took part in walking during most recent visit (n=9,208). Visit weight applied.
Three quarters of visits involving bikes cover more than five miles
Table 2 illustrates the distances cycled on those visits which included any cycling.
Visits involving cycling typically covered longer distances than walking visits, with more than three quarters of visits being more than five miles in length. Over a fifth of cycle trips were more than 20 miles.
| Distance | Visits including cycling (11% of all visits) |
|---|---|
| Less than 5 miles (c. 9 km) | 23% |
| 6-10 miles (c.10 - 16 km) | 31% |
| 11-20 miles (c.17- 32 km) | 25% |
| More than 20 miles (c.32km) | 21% |
REC5C: How far did you cycle?
Base: All respondents who took part in cycling during most recent visit (n=1,045). Visit weight applied.
E-bikes were used in 14% of visits including any cycling. Notably, e-bike usage was around 6 times higher among cycling visits undertaken by people who were very comfortable financially compared with visits by those struggling with finances (36% and 6% respectively). People using an e-bike were also more likely than average to have cycled 20 miles or more (28%).
58% of cycling trips included road cycling, including urban and rural roads, and 55% included off-road cycling, including mountain biking and cycling on paths and trails. Note these percentage sum to more than 100% as trips could involve the use of multiple path surfaces.
Outdoor swimming is the most popular outdoor water sport
A small percentage of people reported participating in water sports on their most recent visit. Outdoor swimming was by far the most popular water sport, accounting for two-thirds of these visits. Two-thirds of people taking part in outdoor swimming were women (67%).
| Activity | Visits including water sports (4% of all visits) |
|---|---|
| Outdoor swimming | 64% |
| Paddle boarding | 25% |
| Kayaking | 16% |
| Sailing | 12% |
| Canoeing | 10% |
| Surfing | 8% |
| Rowing | 8% |
| Diving | 7% |
| Water skiing | 6% |
| Rafting | 5% |
| Kite surfing | 4% |
| Windsurfing | 3% |
REC5E. Which of the following best describes the water sports you took part in on this visit?
Base: All respondents who took part in water sports during most recent visit (n=418). Visit weight applied.
Around half of camping trips take place in formal managed campsites
Those who said they had gone camping as part of their most recent outdoor recreation visit were asked what kind of campsite they used. As shown in Table 4, although more than half used a formal managed campsite (52%), almost as many did not (45%).
Women were more likely than men to have used a formal, managed campsite (58% and 40% respectively).
| Location | Visits including camping (4% of all visits) |
|---|---|
| In a formal managed campsite | 52% |
| Not in a formal managed campsite | 45% |
| Not specified | 3% |
REC5F. Where did you camp during this visit?
Base: All respondents who took part in camping during most recent visit (n=390). Visit weight applied.
The percentages stating that they had not used a formal managed campsite were highest on visits which included time spent at an inland loch/ reservoir (60%), sea/ sea loch (62%) or river (56%). It was also higher in visits which involved fishing (53%).
There was no significant difference in results when comparing those taken within and outside of National Parks.
People in Scotland spend nearly seven hours a week visiting the outdoors
On average, people in Scotland spend 6 hours and 50 minutes visiting the outdoors per week, based on an average reported visit duration of 2 hours and 39 minutes and an average of 2.6 visits taken per week. This includes travel time to and from the destination.
Visit durations varied, with around half of all visits lasting less than 2 hours (49%), 20% between 2 and 3 hours, and 29% more than 3 hours.
As shown in Figure 6, while the duration of visits involving walking were typically shortest (18% lasted less than an hour), those involving other activities were likely to last longer. For example, over half of visits including a picnic or fishing took place over more than 3 hours.
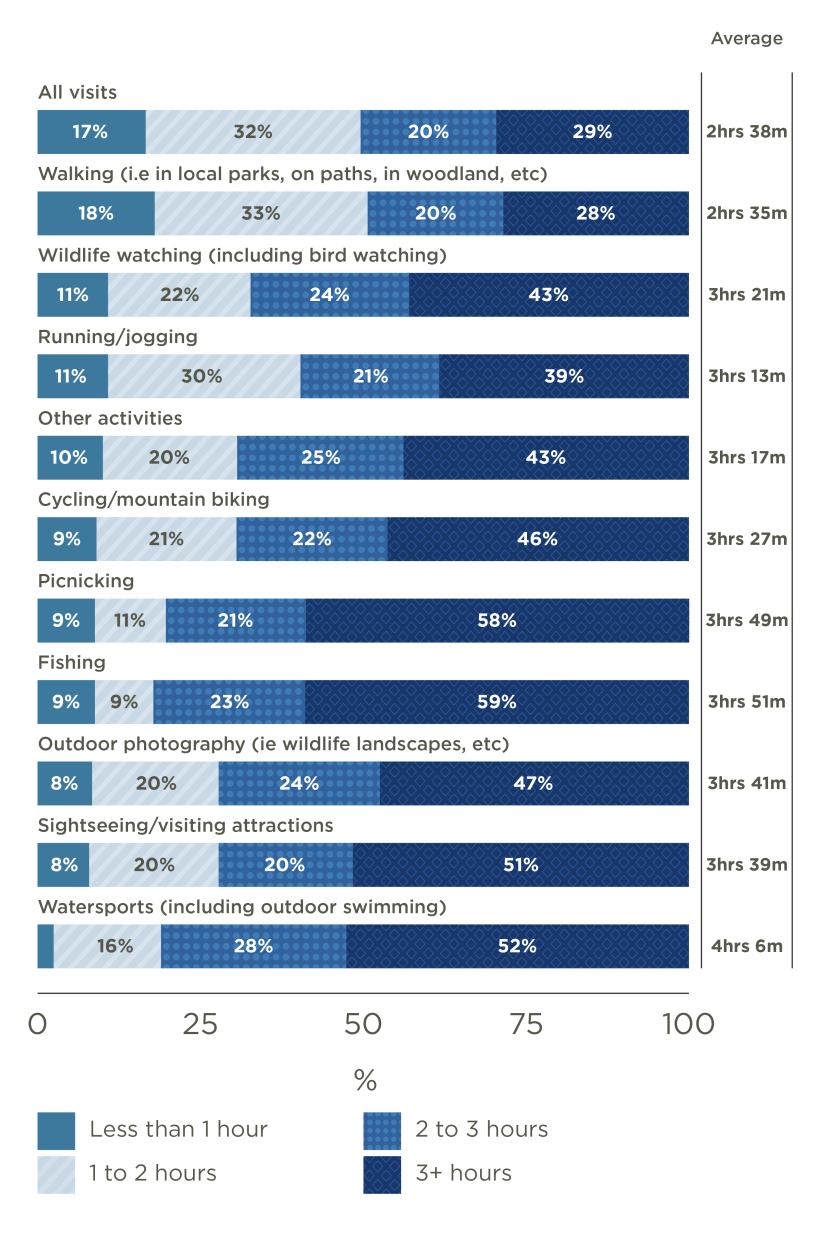
Figure 6. Duration of visits by activity undertaken
Click for a full description
REC13 - In total, how long was the visit, in terms of time - that is the total time spent, including travel time to and from the destination?
Base: Respondents surveyed in June, September or December 2023 or March 2024 who took visits in previous month (n=3,467). Visit weight applied.
Stacked bar chart showing duration of visits taken for all visits and by activities undertaken.
Bars are oriented horizontally and split into four coloured bands – dark blue for less than 1 hour, light blue for 1 to 2 hours, lighter blue for 2 to 3 hours and light grey for 3+ hours.
The average duration is also provided in a table to the right of the chart.
The data are summarised in the following table:
| Row % | Less than 1 hour | 1 to 2 hours | 2 to 3 hours | 3+ hours | Average |
|---|---|---|---|---|---|
| All visits | 17% | 32% | 20% | 29% | 2hrs 38m |
| Walking (i.e. in local parks, on paths, in woodland, hillwalking, etc) | 18% | 33% | 20% | 28% | 2hrs 35m |
| Wildlife watching (including birdwatching) | 11% | 22% | 24% | 43% | 3hrs 21m |
| Running / jogging | 11% | 30% | 21% | 39% | 3hrs 13m |
| Other activities | 10% | 20% | 25% | 43% | 3hrs 17m |
| Cycling/mountain biking | 9% | 21% | 22% | 46% | 3hrs 27m |
| Picnicking | 9% | 11% | 21% | 58% | 3hrs 49m |
| Fishing | 9% | 9% | 23% | 59% | 3hrs 51m |
| Outdoor photography (i.e. wildlife, landscapes, etc.) | 8% | 20% | 24% | 47% | 3hrs 41m |
| Sightseeing / visiting attractions | 8% | 20% | 20% | 51% | 3hrs 39m |
| Water sports (including outdoor swimming) | 3% | 16% | 28% | 52% | 4 hrs 6m |
More than half of outdoor visits take place in the countryside
Outdoor recreation visits were taken in a wide variety of types of places. As shown in Figure 7, around half of visits (53%) were categorised by participants as being countryside, while around a quarter of visits were taken in a town or city (27%) and the remaining 20% were to the seaside or coast.
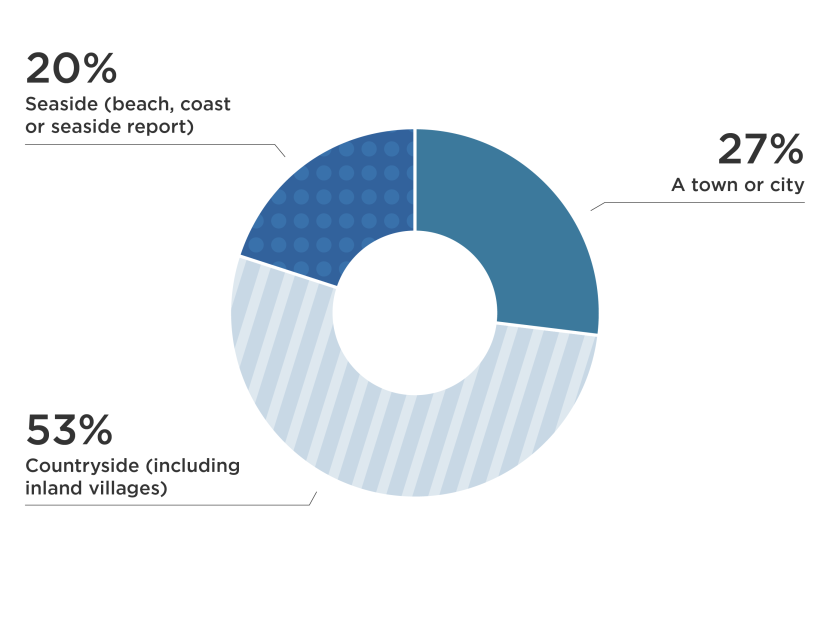
Figure 7. Main location of outdoor visits
Click for a full description
REC8 - Still thinking about your last visit to the outdoors for leisure and recreation during [PRECEEDING MONTH], which of these places best describes where you went?
Base: Respondents surveyed in April, June, August, October, December 2023 or February 2024 who took visits in previous month (n=5,325). Visit weight applied.
A pie chart illustrating the location of visits with 3 sectors.
The data are summarised in the following table:
| Location | Percentage of visits |
|---|---|
| A town or city | 27% |
| The countryside (including inland villages) | 53% |
| The seaside (e.g. a beach, coast, seaside resort) | 20% |
The types of place visited varied by demographic with town and city locations more likely to be included in visits taken by residents of the 10% most derived areas (43%) and people aged 16 to 34 (32%) while places in the countryside were more likely to be visited by dog owners (56%) and people with white ethnicity (53%).
Urban parks and greenspaces are especially important to those living in the most deprived areas
Participants were asked to provide additional detail regarding the specific types of places visited, taking into account the fact that a single visit may take in more than one type of place (i.e. a beach and a woodland). Overall, the largest percentages of visits taken included a park or other greenspace in an urban area (41%) or woodland/ forest (39%).
Visits taken in a town or city predominantly included a park or urban greenspace (75%), highlighting the importance of these spaces for outdoor recreation in urban areas. More than a fifth of urban visits included woodland and 15% involved a river.
| Location | All visits | Town or city visits | Countryside visits | Seaside visits |
|---|---|---|---|---|
| A park or other open greenspace in an urban area | 41% | 75% | 30% | 22% |
| Woodland/forest | 39% | 21% | 58% | 15% |
| Beach | 21% | 7% | 7% | 77% |
| River | 17% | 15% | 20% | 11% |
| Village | 15% | 8% | 19% | 13% |
| Wildlife area/nature reserve | 11% | 6% | 14% | 11% |
| Farmland | 11% | 3% | 18% | 5% |
| Sea/Sea loch | 11% | 4% | 4% | 36% |
| Mountain/hill | 11% | 3% | 16% | 5% |
| Inland loch/reservoir | 9% | 4% | 14% | 4% |
| Canal | 6% | 10% | 6% | 2% |
| Moorland | 3% | 1% | 5% | 1% |
| Cliff | 2% | 1% | 1% | 7% |
REC 9. On this visit to the outdoors for leisure and recreation, which of the following types of location or destination did you go to?
Note: Percentages add to more than 100% as visits could include more than one location.
Base: Respondents surveyed in April, June, August, October, December 2023 or February 2024 who took visits in previous month (Overall n=5,335, Town and city visits n=1,572, Countryside visits n=2,605, Seaside visits n=1,148). Visit weight applied.
Active travel for outdoor recreation
Most outdoor activities are undertaken close to home and on foot
Participants were asked how far they travelled, and the mode of transport they used, to and from the main destination of their visit to the outdoors. Over a third of outdoor recreation visits involved a round journey (to and from the place visited) of less than 2 miles (35%), while a further quarter (24%) involved a round journey of 2 to 5 miles.
As illustrated in Figure 8, visits taken to places in towns and cities were most likely to be close to home (75% involved a journey of less than 5 miles). The longest distances were travelled to visit the seaside (39% over 10 miles).
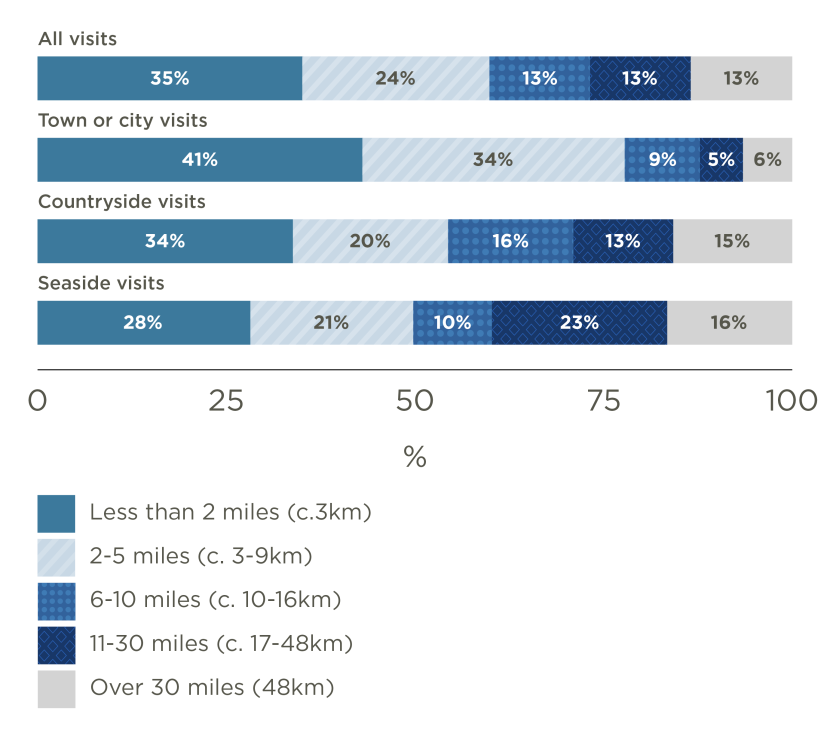
Figure 8. Distance travelled to and from the visit destination
Click for a full description
REC12 - In total, how far did you travel using this means of transport, to get to and from the main destination of this visit?
Base: Respondents surveyed in June, September or December 2023 or March 2024 who took visits in previous month (n=3,467). Visit weight applied.
Stacked bar chart showing distance travelled to get to visit destinations, for all visits and by type of location.
Bars are oriented horizontally and split into five coloured bands from less than 2 miles to over 30 miles.
The data are summarised in the following table:
| Row % | Seaside visits | Countryside visits | Town or city visits | All visits |
|---|---|---|---|---|
| Less than 2 miles (c.3 km) | 28% | 34% | 41% | 35% |
| 2-5 miles (c.3 - 9 km) | 21% | 20% | 34% | 24% |
| 6-10 miles (c.10 - 16 km) | 10% | 16% | 9% | 13% |
| 11-30 miles (c.17-48 km) | 23% | 13% | 5% | 13% |
| Over 30 miles (48km) | 16% | 15% | 6% | 13% |
Most people (72%) travelled less than 10 miles when visiting the outdoors, including travel to and from their visit destination. The most frequent visit distances were those under 2 miles (35%).
Overall, the average distance travelled to get to and from the destination was 11.6 miles. However, it should be noted that this figure will be inflated by the small number of trips extending over very long distances. The average distance increased to 14.5 miles for visits taken with children, while visits taken alone or with a dog tended to be closest to home (averaging 6.9 miles and 8.7 miles respectively).
The transport modes people used when visiting the outdoors (Figure 9) reflected the distances travelled to their destination, with just over half taken on foot from home (54%) while most of the remainder were taken by car (36%).
Reflecting the shorter distances normally travelled, the proportion of visits taken on foot was higher in visits taken to greenspaces in towns and cities (73%). Seaside visits were the most likely to be taken by car or another transport mode.
Visits taken by older people and those accompanied by children were more likely than average to be taken by car (41% and 47% respectively).
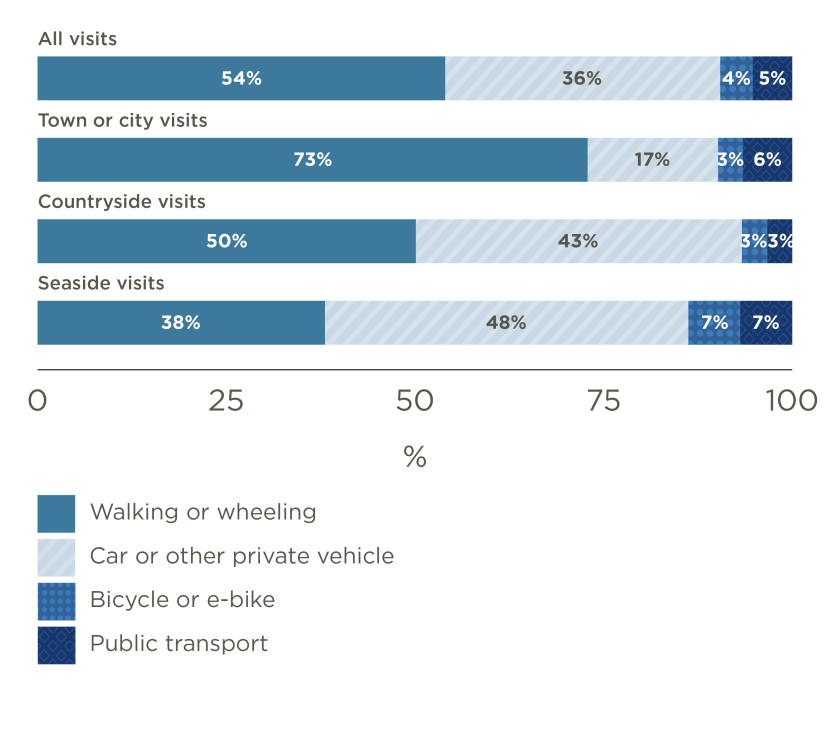
Figure 9. Transport used to reach visit destination
Click for a full description
REC11 - Thinking of your most recent visit to the outdoors, what was the main means of transport used? That is, the one used to get to the main destination of the visit?
Base: Respondents surveyed in June, September or December 2023 or March 2024 who took visits in previous month (n=3,467). Visit weight applied.
Stacked bar chart showing main transport mode used to get to visit destinations, for all visits and by type of location.
Bars are oriented horizontally and split into coloured bands representing the 4 most common transport types used.
The data are summarised in the following table:
| Row % | Seaside visits | Countryside visits | Town or city visits | All visits |
|---|---|---|---|---|
| Walking or wheeling | 38% | 50% | 73% | 54% |
| Car or other private vehicle | 48% | 43% | 17% | 36% |
| Bicycle or e-bike | 7% | 3% | 3% | 4% |
| Public transport | 7% | 3% | 6% | 5% |
Path networks are vital resources for local outdoor recreation
A path or a network of paths was used in 84% of outdoor recreation visits. However, levels of path usage varied by type of place visited, being highest in visits taken to wildlife areas/ nature reserves and woodland (91% and 90% of visits respectively) and lowest in visits taken to a beach (74% of visits).
Those who indicated they used paths were asked to provide some further details about the nature of the path, as shown in Table 6. The range of responses illustrates that most visits involved a mix of both surfaced and unsurfaced paths, and in most cases participants had seen directional signposts or waymarking.
| Nature of path(s) | Visits including use of path or network of paths |
|---|---|
| Was uneven or unsurfaced (e.g. dirt, grass or gravel) | 76% |
| Had a hard, smooth surface (e.g. tarmac) | 69% |
| Had directional signposts or waymarking for users | 67% |
| Part of National Cycle Network | 25% |
| Part of Scotland’s Great Trails or other long distance route | 18% |
T4. Which of the following, if any, applied to the paths you used on this visit?
Note: Percentages add to more than 100% as visits could include more than one type of path.
Base: Respondents surveyed in May, August or November 2023 or February 2024 whose visit involved the use of any path(s) (n=2,819). Visit weight applied.
The National Cycle Network provides much more than a route from A to B
Participants were asked about their awareness and use of the National Cycle Network (NCN). Just under half of respondents (46%) had heard of the NCN. Nearly a fifth of visits to the outdoors involved use of a path that was part of the NCN.
Levels of NCN awareness were highest amongst people aged 55 and over (56%), residents of the 10% least deprived areas (56% vs 41% in most deprived), people with very good health (51% vs 41% with bad or very bad health) and people with white ethnicity (47% vs 36% ethnic minorities).
Figure 10 summarises use of the National Cycle Network amongst those were aware of it, illustrating the range of purposes the NCN has and its importance for outdoor recreation for many people. The leading benefit of the NCN was for health (31%), while over a quarter of people used the NCN to access local greenspace or thought of it as a greenspace in itself.
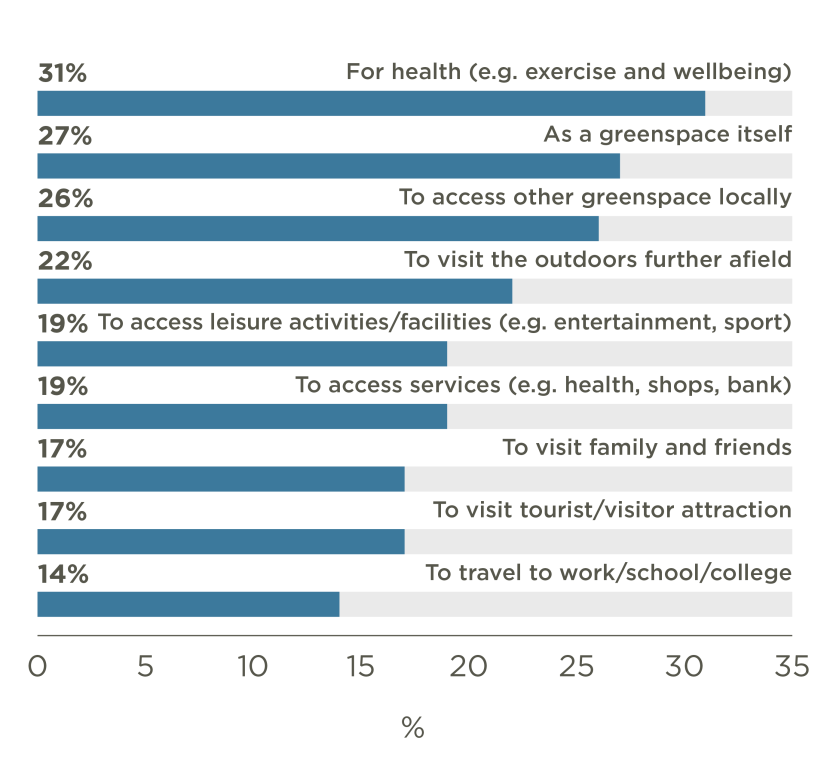
Figure 10. Use of National Cycle Network - percentage using for each purpose at least monthly
Click for a full description
T2 - How often do you use the National Cycle Network (NCN) for the following?
Base: Respondents surveyed in June, September and December 2023 and March 2024 who were aware of National Cycle Network (n=1,871). Demographic weight applied.
Bar chart illustrating percentages of the population that are aware of National Cycle Network using it for a range of different purposes.
Bars are oriented horizontally with purpose on the y axis. These are ranked from the highest percentage (for health at 21%) to the lowest percentage (to travel to work/school/college at 14%)
The data are summarised in the following table:
| Reason for using National Cycle Network | All respondents |
|---|---|
| For health (e.g. exercise and wellbeing) | 31% |
| As a green space itself | 27% |
| To access other green space locally | 26% |
| To visit the outdoors further afield | 22% |
| To access services (e.g. health, shops, bank) | 19% |
| To access leisure activities/facilities (e.g. entertainment, sport) | 19% |
| To visit family and friends | 17% |
| To visit tourist/visitor attractions | 17% |
| To travel to work / school / college | 14% |
Greenspace
People living closest to high quality greenspaces are most likely to use them frequently
As described above (see Table 5), parks and other greenspaces in urban areas were the most commonly visited locations for outdoor recreation, included in around two in five visits overall.
Given their importance, a further series of questions was included in SPANS to explore how people in Scotland use and value greenspace.
As shown in Figure 11, 96% of people stated that they had either visited or passed through their local greenspace areas (e.g. on their way to work or shops) at least once during the last 12 months, with 70% normally doing so at least once a week.
Similar to outdoor recreation more generally, frequency of greenspace use was highest amongst those living in the 10% least deprived areas (82% at least weekly compared with 59% amongst resident of 10% most deprived areas), those who were very comfortable financially (77% at least weekly), those with very good health (81%) and dog owners (81%). Differences in greenspace use across other demographic groupings, including age and ethnicity, were found to be less significant.
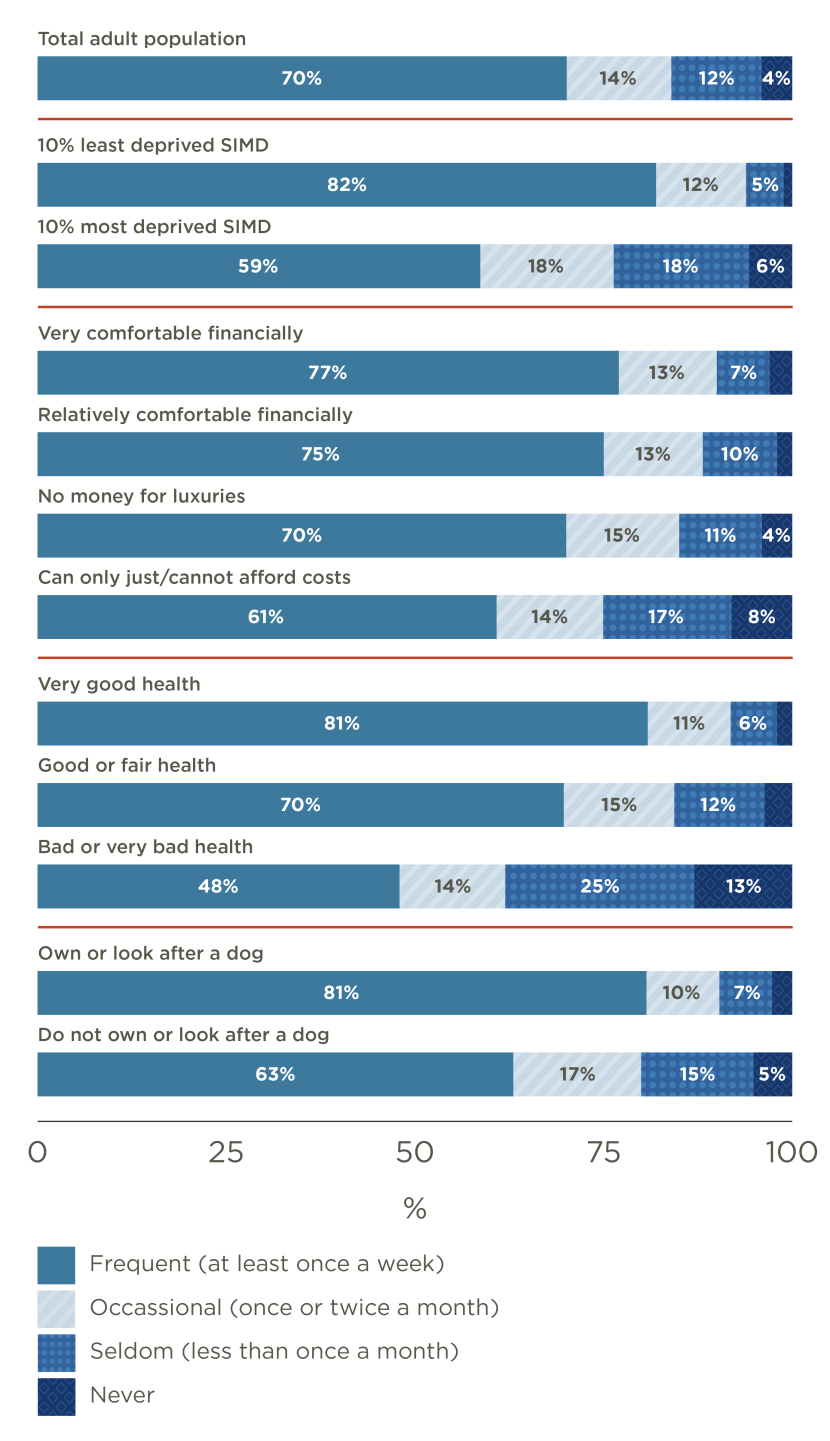
Figure 11. Frequency visited or passed through local greenspaces
Click for a full description
GREEN1 - In the last 12 months, how often on average have you visited or passed through your local greenspace areas?
Base: Respondents surveyed in May, August, November 2023 or February 2024 (n=4,020). Demographic weight applied.
Stacked bar chart showing percentages visiting local greenspaces at different levels of frequency for total population and by key demographic groups.
Bars are oriented horizontally with demographic labels on y axis. Each bar contains 4 coloured sections to illustrate the percentages visiting frequently (dark blue), occasionally (light blue), seldom (light grey) or never (dark grey).
The data are summarised in the following table:
| Row % | Frequent (at least once a week) | Occasional (once or twice a month) | Seldom (less than once a month) | Never |
|---|---|---|---|---|
| Total adult population | 70% | 14% | 12% | 4% |
| Aged 16-34 | 73% | 15% | 9% | 3% |
| Aged 35-54 | 70% | 14% | 12% | 4% |
| Aged 55+ | 67% | 13% | 14% | 5% |
| 10% least deprived SIMD | 82% | 12% | 5% | 1% |
| 10% most deprived SIMD | 59% | 18% | 18% | 6% |
| Very comfortable financially | 77% | 13% | 7% | 3% |
| Relatively comfortable financially | 75% | 13% | 10% | 2% |
| No money for luxuries | 70% | 15% | 11% | 4% |
| Can only just/ cannot afford costs | 61% | 14% | 17% | 8% |
| Very good health | 81% | 11% | 6% | 2% |
| Good or fair health | 70% | 15% | 12% | 4% |
| Bad or very bad health | 48% | 14% | 25% | 13% |
| White | 70% | 14% | 12% | 4% |
| Minority ethnic group | 73% | 12% | 11% | 4% |
| Own or look after a dog | 81% | 10% | 7% | 3% |
| Do not own or look after a dog | 63% | 17% | 15% | 5% |
How frequently people visited greenspace also varied in relation to the perceived accessibility and quality of local greenspaces with those within a short walk and those who were most satisfied with their local greenspaces visiting most often (Figure 12).
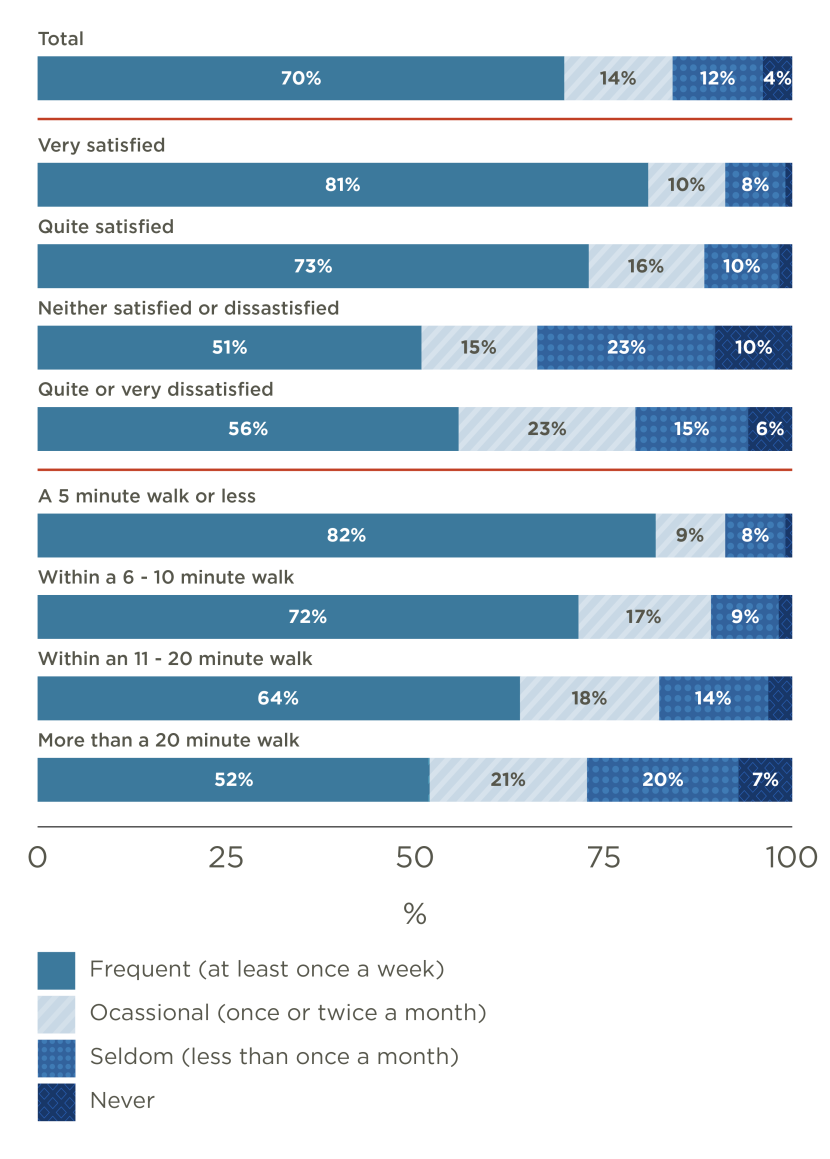
Figure 12. Frequency visited or passed through local greenspaces by proximity and satisfaction with quality with nearest local greenspace
Click for a full description
GREEN 1 - In the last 12 months, how often on average have you visited or passed through your local greenspace areas?
Base: Respondents surveyed in May, August, November 2023 or February 2024 (n=4,020). Demographic weight applied
Stacked bar chart showing percentages visiting local greenspaces at different levels of frequency for population groups with different levels of satisfaction and different proximities to local greenspaces.
Bars are oriented horizontally with labels on y axis. Each bar contains 4 coloured sections to illustrate the percentages visiting frequently (dark blue), occasionally (light blue), seldom (light grey) or never (dark grey)
The data are summarised in the following table:
| Row % | Frequent (at least once a week) | Occasional (once or twice a month) | Seldom (less than once a month) | Never |
|---|---|---|---|---|
| Total | 70% | 14% | 12% | 4% |
| Very satisfied | 81% | 10% | 8% | 1% |
| Quite satisfied | 73% | 16% | 10% | 2% |
| Neither satisfied nor dissatisfied | 51% | 15% | 23% | 10% |
| Quite or Very dissatisfied | 56% | 23% | 15% | 6% |
| A 5 minute walk or less | 82% | 9% | 8% | 1% |
| Within a 6 - 10 minute walk | 72% | 17% | 9% | 2% |
| Within an 11- 20 minute walk | 64% | 18% | 14% | 4% |
| More than a 20 minute walk | 52% | 21% | 20% | 7% |
People living in the most deprived areas and with poorest health experience lower quality local greenspace
Most people reported that they were either very or quite satisfied with the quality of their local greenspaces (30% and 50% respectively).
The relationship between the perceived quality of greenspace and levels of use is further illustrated in Figure 13, where higher levels of satisfaction is observed among several of the groups more likely to visit on a frequent basis – most notably those who were most comfortable financially and those who reported having very good health.
Satisfaction with local greenspaces was also compared on the basis of other demographics not shown but limited or no statistically significant differences were found.
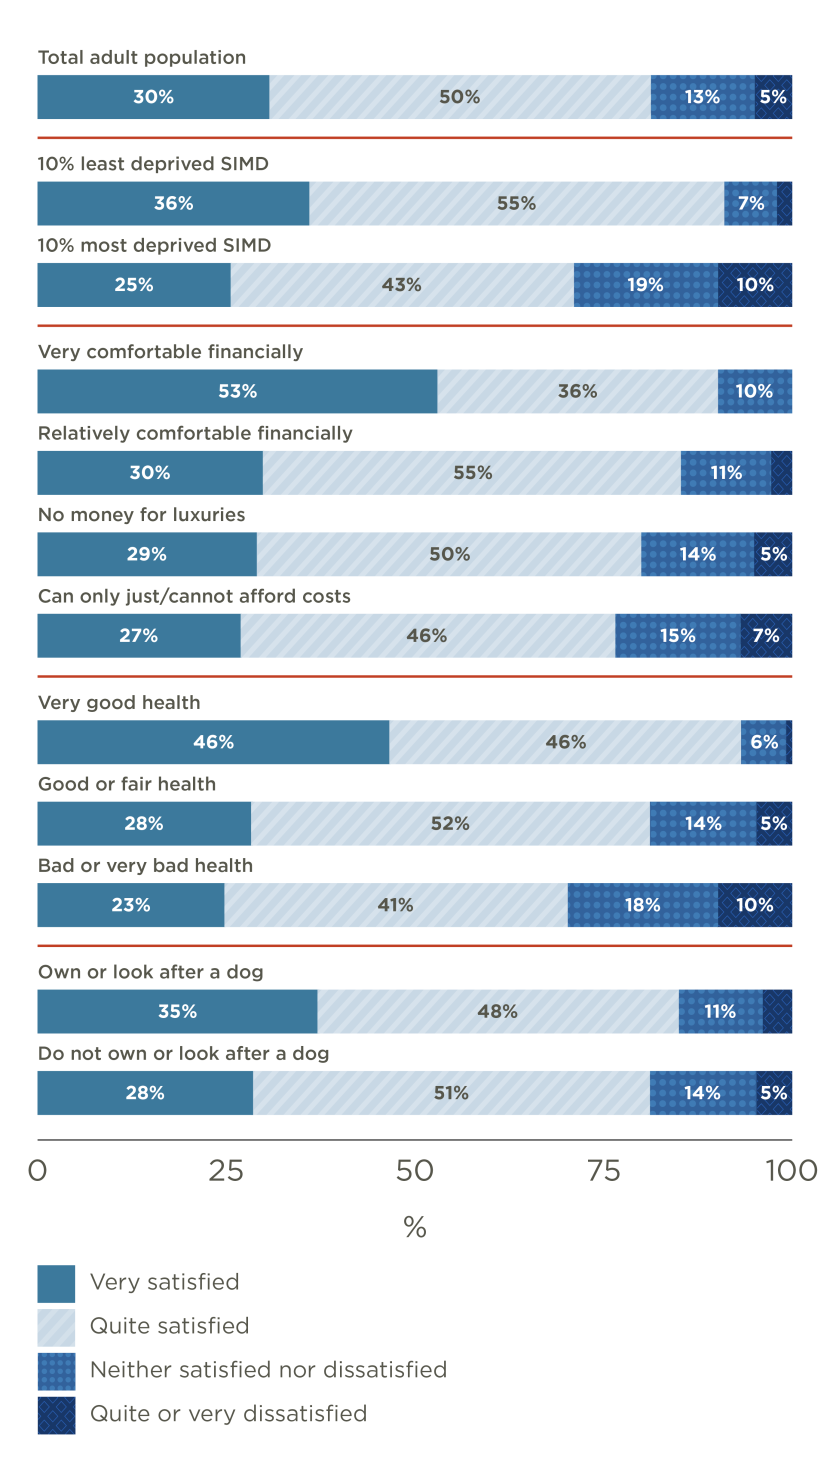
Figure 13. Overall satisfaction with quality of local greenspaces by key demographic groups
Click for a full description
GREEN5 - Overall, how satisfied are you with the quality of your local greenspace(s)?
Base: Respondents surveyed in May, August, November 2023 or February 2024 (n=4,020). Demographic weight applied.
Stacked bar chart showing levels of satisfaction with local greenspaces for total population and different demographic groups.
Bars are oriented horizontally with labels on y axis. Each bar contains 4 coloured sections to illustrate the percentages very satisfied (dark blue), quite satisfied (light blue), neither satisfied nor dissatisfied (lighter blue) and quite or very dissatisfied (grey).
The data are summarised in the following table:
| Row % | Very satisfied | Quite satisfied | Neither satisfied nor dissatisfied | Quite or Very dissatisfied |
|---|---|---|---|---|
| Total adult population | 30% | 50% | 13% | 5% |
| Aged 16-34 | 27% | 51% | 15% | 4% |
| Aged 35-54 | 28% | 51% | 13% | 6% |
| Aged 55+ | 35% | 48% | 11% | 4% |
| 10% least deprived SIMD | 36% | 55% | 7% | 2% |
| 10% most deprived SIMD | 25% | 43% | 19% | 10% |
| Very comfortable financially | 53% | 36% | 10% | 0% |
| Relatively comfortable financially | 30% | 55% | 11% | 3% |
| No money for luxuries | 29% | 50% | 14% | 5% |
| Can only just/ cannot afford costs | 27% | 46% | 15% | 7% |
| Very good health | 46% | 46% | 6% | 1% |
| Good or fair health | 28% | 52% | 14% | 5% |
| Bad or very bad health | 23% | 41% | 18% | 10% |
| White | 30% | 50% | 13% | 5% |
| Minority ethnic group | 32% | 54% | 9% | 5% |
| Own or look after a dog | 35% | 48% | 11% | 4% |
| Do not own or look after a dog | 28% | 51% | 14% | 5% |
Local greenspace is a vital resource for people’s physical and mental wellbeing
Figure 14 illustrates responses to a series of statements relating to the qualities and benefits of local greenspaces.
Generally, people in Scotland held positive opinions about their local greenspace across most of the aspects covered in this question. In particular, people generally felt their local greenspaces were easy to get to and to get around. The benefits of greenspace to health and wellbeing were also widely recognised.
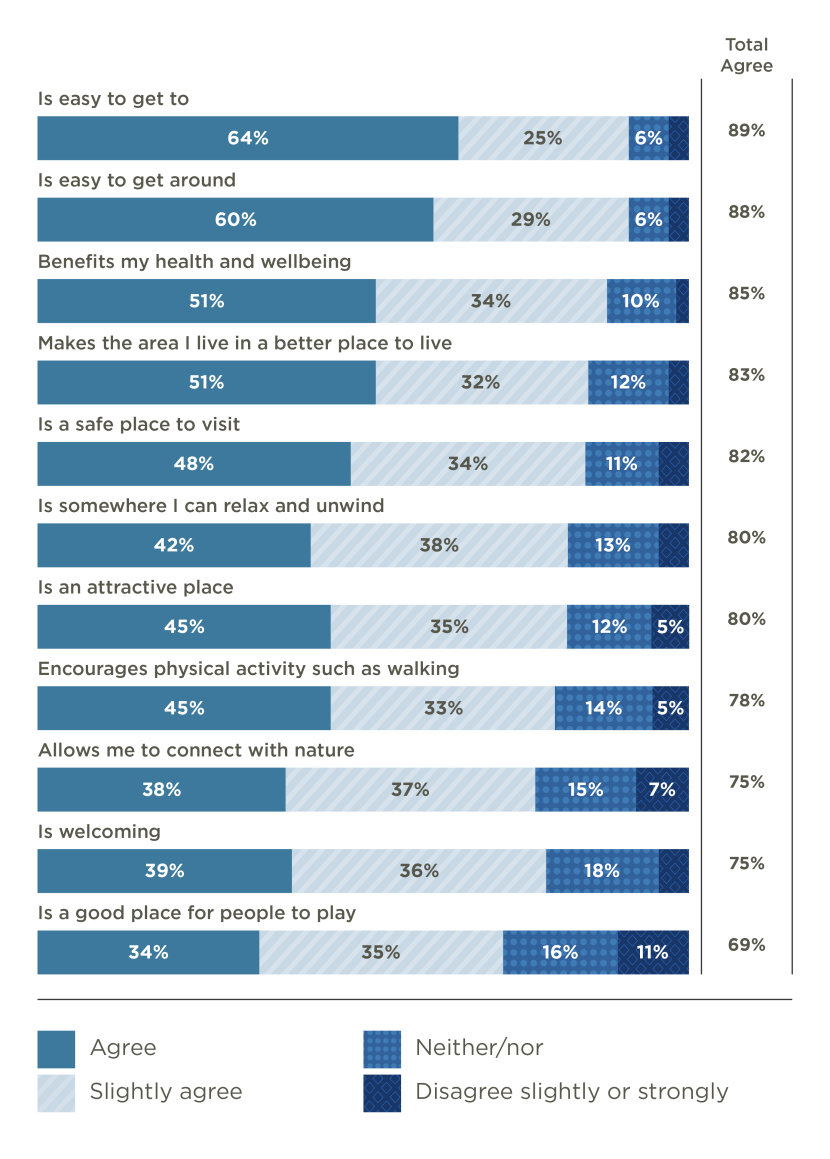
Figure 14. Attitudes towards local greenspace(s)
Click for a full description
GREEN3 - How much do you agree or disagree with the following statements relating to your local greenspace(s)?
Base: Respondents surveyed in May, August, November 2023 or February 2024 (n=4,020). Demographic weight applied.
Stacked bar chart showing levels of agreement with a series of statements related to local greenspaces.
Bars are oriented horizontally with the statements on the y axis, ranked from the highest percentage agreeing to lowest.
Each bar contains 4 coloured sections to illustrate the percentages that agree Strongly (dark blue), agree Slightly (light blue), neither agree nor disagree (lighter blue) quite or disagree (grey).
A table on the right also summarises the total percentages that agree strongly or slightly with each statement.
The data are summarised in the following table:
| Row % | Agree strongly | Agree slightly | Neither Nor | Disagree slightly or strongly |
|---|---|---|---|---|
| Is a good place for young people to play | 34% | 35% | 16% | 11% |
| Is welcoming | 39% | 36% | 18% | 4% |
| Allows me to connect with nature | 38% | 37% | 15% | 7% |
| Encourages physical activity - such as walking, cycling, sports and play | 45% | 33% | 14% | 5% |
| Is an attractive place | 45% | 35% | 12% | 5% |
| Is somewhere I can relax and unwind | 42% | 38% | 13% | 4% |
| Is a safe place to visit | 48% | 34% | 11% | 4% |
| Makes the area I live in a better place to live | 51% | 32% | 12% | 3% |
| Benefits my health and wellbeing | 51% | 34% | 10% | 2% |
| Is easy to get around | 60% | 29% | 6% | 3% |
| Is easy to get to | 64% | 25% | 6% | 3% |
Most people in Scotland walk to their local greenspace
Overall, 84% of people said they normally walk or wheel to their local greenspace, with 25% normally travelling by car or van, 8% cycling, and 5% using public transport (note that these percentages add to more than 100% as some used more than one mode).
Walking was most likely where people lived close to greenspace. Figure 15 shows that overall, just over two fifths of the population in Scotland reported having a greenspace within a 5-minute walk of their home (44%).
However, it is notable that residents of the least deprived areas were significantly more likely than those resident in the most deprived areas to live within a short walk of a greenspace.
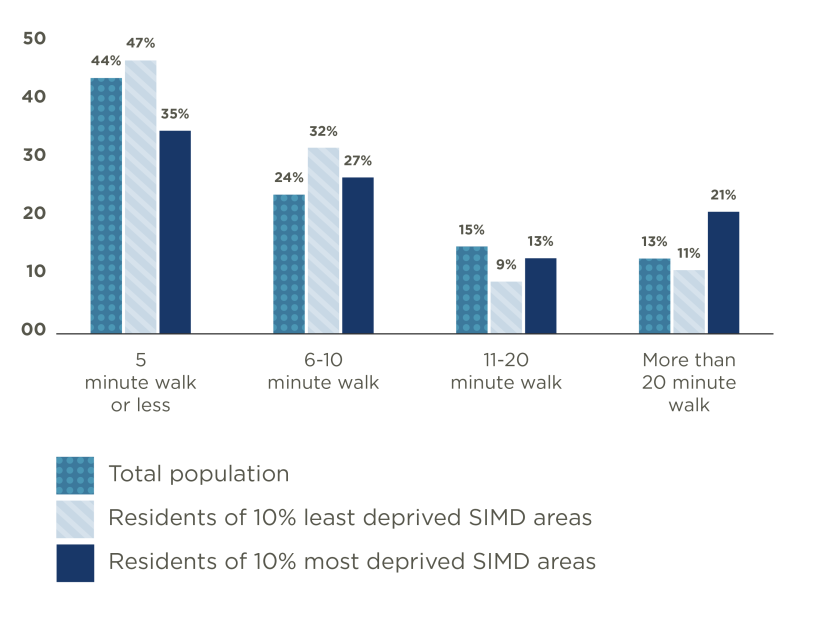
Figure 15. Proximity of local greenspaces- total population and by SIMD
Click for a full description
GREEN2 - How far away from your home is your nearest greenspace area?
Base: Respondents surveyed in May, August, November 2023 or February 2024 (n=4,020). Demographic weight applied.
Vertical bar chart showing proximity of local greenspaces for total population, those in 10% least deprived SIMD areas and those in 10% most deprived SIMD areas.
Bars are oriented vertically with labels relating to duration bands (from <5 minutes to more than 20 minutes) on x axis.
The data are summarised in the following table:
| Estimated walk duration to nearest greenspace | Total population | Residents of 10% least deprived SIMD areas | Residents of 10% most deprived SIMD areas |
|---|---|---|---|
| 5 minute walk or less | 44% | 47% | 35% |
| 6-10 minute walk | 24% | 32% | 27% |
| 11-20 minute walk | 15% | 9% | 13% |
| More than 20 minute walk | 13% | 11% | 21% |
Some people are put off using local greenspace due to a lack of toilets or by antisocial behaviour
Participants were shown a list of possible reasons for not visiting local greenspaces more often. People identified a range of barriers that affected them, including a lack of toilet facilities (18%), a lack of seating (11%), and a lack of lighting (10%). Issues around safety were also significant, with 13% selecting anti-social behaviour as a concern.
However, the leading reasons for not visiting greenspaces related to lack of time, with 25% of people saying they were too busy at home or too busy at work (41% of people selected both of these reasons).
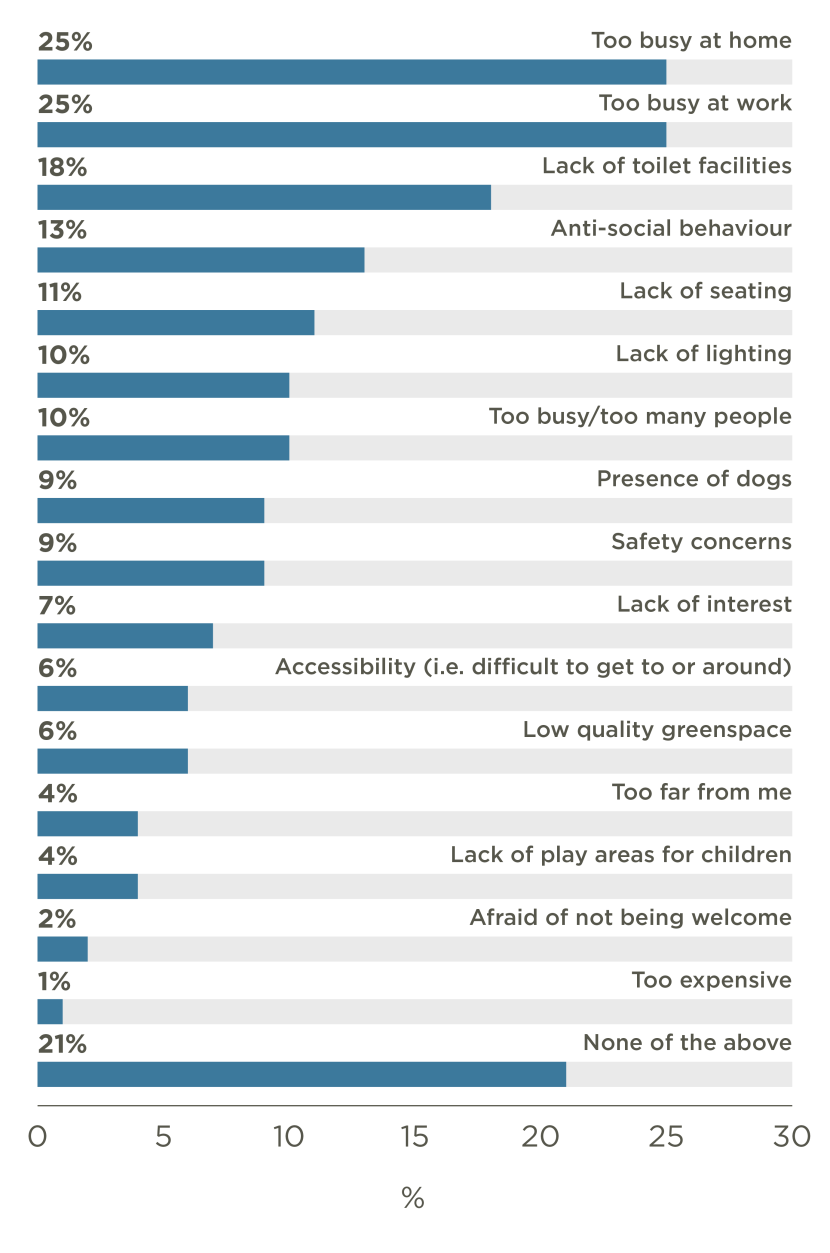
Figure 16. Reasons for not visiting local greenspaces more often during the last 12 months
Click for a full description
GREEN7 - Which of the following, if any, are your main reasons for not visiting your local greenspace(s) more often during the last 12 months?
Base: Respondents surveyed in May and November 2023 (n=2,015). Demographic weight applied.
Horizontal bar chart showing reasons for not visiting local greenspaces more often.
Bars are oriented horizontally, ranked from the reasons selected most often to the reasons selected least often.
The data are summarised in the following table:
| Potential reasons for not visiting | Percentage of population |
|---|---|
| Too busy at home | 25% |
| Too busy at work | 25% |
| Lack of toilet facilities | 18% |
| Anti-social behaviour | 13% |
| Lack of seating | 11% |
| Lack of lighting | 10% |
| Too busy / too many people | 10% |
| Presence of dogs | 9% |
| Safety concerns | 9% |
| Lack of interest | 7% |
| Accessibility (i.e. difficult to get to or around) | 6% |
| Low quality greenspace | 6% |
| Too far from me | 4% |
| Lack of play areas for children | 4% |
| Afraid of not being welcome | 2% |
| Too expensive | 1% |
| None of the above | 21% |
Scotland’s National Parks
Scotland’s National Parks provide a key destination for people to enjoy the outdoors
Participants who had visited the outdoors for recreation during the previous month were asked if (to their knowledge) their most recent visit had included time within either of Scotland's National Parks.
An estimated 13% of visits included time spent in the Loch Lomond and Trossachs National Park, while 6% included time in the Cairngorms National Park.
Table 7 compares the visitor profile of people visiting the National Parks with visits generally. People visiting National Parks tended to be younger and more financially comfortable. They also tend to be in very good health. Visits to National Parks were more likely to be made with family and friends.
| Activity | Visits to National Parks | Loch Lomond & Trossachs | Cairngorms | All outdoor recreation visits |
|---|---|---|---|---|
| Walking | 90% | 91% | 87% | 93% |
| Sightseeing / visiting attractions | 49% | 48% | 53% | 27% |
| Wildlife watching (including birdwatching) | 32% | 31% | 38% | 23% |
| Outdoor photography | 30% | 28% | 37% | 18% |
| Running / jogging | 30% | 30% | 31% | 13% |
| Picnicking | 28% | 27% | 32% | 13% |
| Cycling/mountain biking | 22% | 20% | 27% | 11% |
| Water sports (including outdoor swimming) | 11% | 11% | 14% | 4% |
| Fishing | 10% | 10% | 10% | 3% |
| Camping in a formal campsite | 7% | 7% | 8% | 2% |
| Wheeling | 4% | 5% | 7% | 2% |
| Rock climbing | 4% | 4% | 6% | 1% |
| Camping not in a formal campsite | 4% | 4% | 6% | 2% |
| Horse riding | 4% | 4% | 4% | 1% |
| Orienteering | 3% | 3% | 5% | <1% |
| Ski-ing | 2% | 2% | 3% | <1% |
Base: Respondents taking visits to National Parks (n=2,301 overall, n=1,744 for LLTNP, n=718 for CNP).Visit weight applied.
Scotland’s woodland
Woodland is the second most common destination for outdoor recreation
Woodland was the second most visited location type for outdoor recreation visits. Nearly two in five visits took place in woodland areas (see Table 5).
Overall, 87% of participants said they had visited a forest or woodland in the previous year. As shown in Figure 17, the demographic groups most likely to have visited woodland over this period included those who were most comfortable financially, those who rated their health as very good and dog owners.
Frequency of use of woodland was also compared on the basis of other demographic not shown but limited or no statistically significant differences were found.
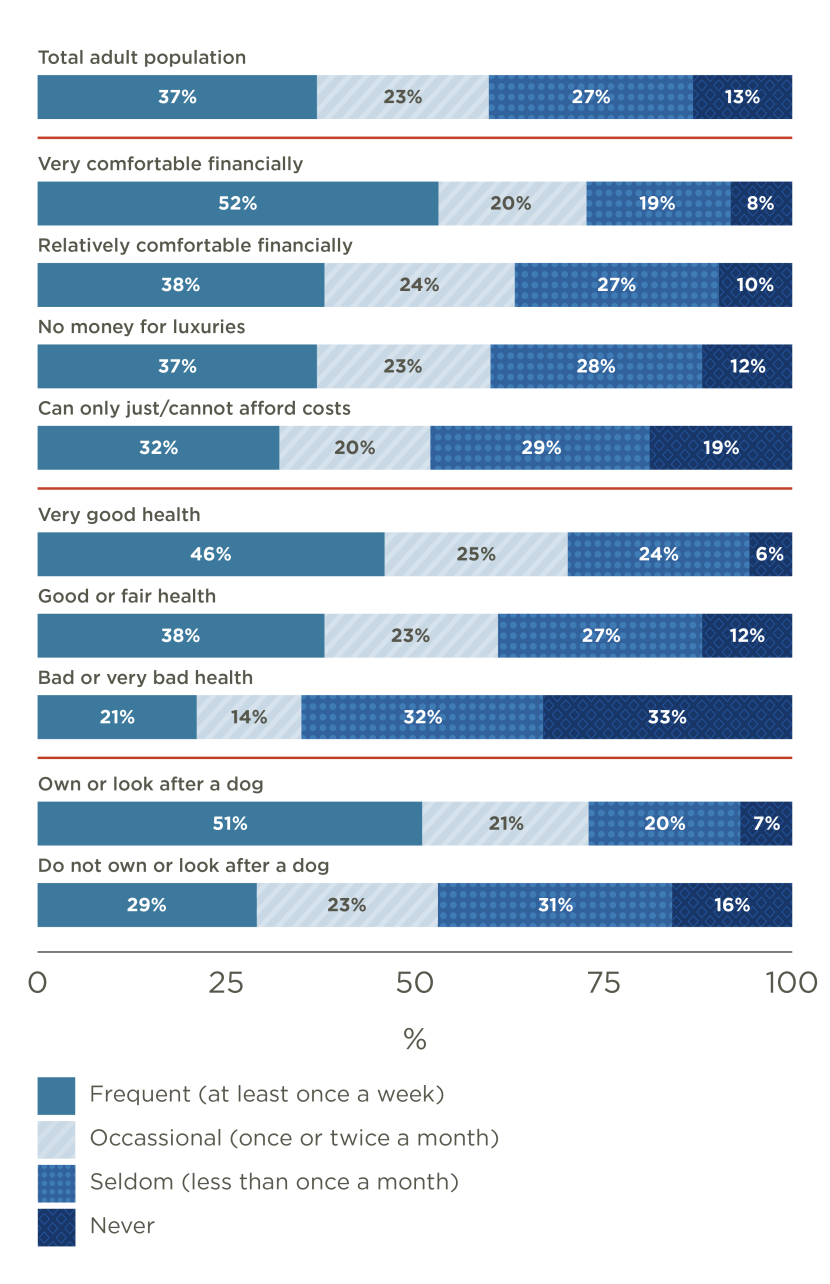
Figure 17. Frequency visited forests or woodland for recreation
Click for a full description
FOR1 - In the last 12 months, how often on average have you visited forests or woodlands for walks, picnics or other recreation?
Base: Respondents surveyed in April, May, June, October, November and December 2023 (n=6,038). Demographic weight applied
Stacked bar chart showing percentages visiting forests or woodland for recreation at different levels of frequency.
Results are shown for the total population and key demographic groups.
Bars are oriented horizontally with labels on y axis. Each bar contains 4 coloured sections to illustrate the percentages visiting frequently (dark blue), occasionally (light blue), seldom (light grey) or never (dark grey).
The data are summarised in the following table:
| Row % | Frequent (at least once a week) | Occasional (once or twice a month) | Seldom (less than once a month) | Never |
|---|---|---|---|---|
| Total adult population | 37% | 23% | 27% | 13% |
| Aged 16-34 | 41% | 25% | 25% | 8% |
| Aged 35-54 | 38% | 24% | 27% | 11% |
| Aged 55+ | 33% | 20% | 29% | 18% |
| 10% least deprived SIMD | 39% | 27% | 26% | 8% |
| 10% most deprived SIMD | 32% | 20% | 29% | 20% |
| Very comfortable financially | 52% | 20% | 19% | 8% |
| Relatively comfortable financially | 38% | 24% | 27% | 10% |
| No money for luxuries | 37% | 23% | 28% | 12% |
| Can only just/ cannot afford costs | 32% | 20% | 29% | 19% |
| Very good health | 46% | 25% | 24% | 6% |
| Good or fair health | 38% | 23% | 27% | 12% |
| Bad or very bad health | 21% | 14% | 32% | 33% |
| White | 38% | 23% | 27% | 13% |
| Minority ethnic group | 35% | 24% | 30% | 11% |
| Own or look after a dog | 51% | 21% | 20% | 7% |
| Do not own or look after a dog | 29% | 23% | 31% | 16% |
When asked to rate the provision of woods for recreation in their local area, as well as in Scotland as whole, most people gave positive responses.
Although 40% of people rated Scotland’s woodland as ‘very good’, ratings for local areas were more varied, with the largest percentages choosing ‘good’ or ‘fair’ (35% and 25% respectively).
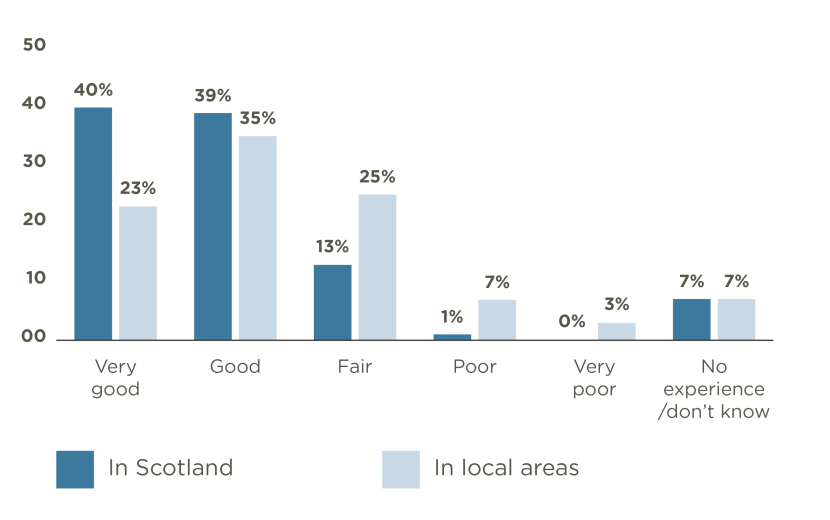
Figure 18. Rating of the provision of woods for recreation
Click for a full description
FOR4 - How would you rate the provision of woods to visit for recreation in your local area?
FOR5 - How would you rate the provision of woods to visit for recreation in Scotland as a whole?
Base: Respondents surveyed in April, May, June, October, November and December 2023 (n=6,038). Demographic weight applied
Vertical bar chart showing levels of satisfaction with provision of woods for recreation.
Bars are oriented vertically with levels of satisfaction (from very good to very poor) shown on the x axis.
There are two series . one showing satisfaction with woodland ‘in Scotland’ in dark blue and one showing satisfaction with woodland ‘in local area’ in light blue.
The data are summarised in the following table:
| Level of satisfaction with woods for recreation | In Scotland | In local area |
|---|---|---|
| Very good | 40% | 23% |
| Good | 39% | 35% |
| Fair | 13% | 25% |
| Poor | 1% | 7% |
| Very poor | 0% | 3% |
| No experience/ Don't know | 7% | 7% |
The proportion of people providing a rating of either very good or good in relation to the provision of woods for recreation in Scotland was highest amongst those resident in the 10% least deprived areas (80% vs 74% living in most deprived areas), amongst dog owners (83%) and those stating that their health was very good (86%).
Ratings for provision locally varied most by place of residence with 70% resident in areas defined as rural providing a rating of good or very good compared with 54% resident in large urban areas.
A range of factors prevented respondents from visiting forests or woodland more often (Figure 19). As with greenspace, around a quarter (27%) indicated that they were too busy or lacked time. Other common factors related to a lack of facilities (most notably toilets) and difficulties with access due to perceived distances involved and/or a lack of access to a car.
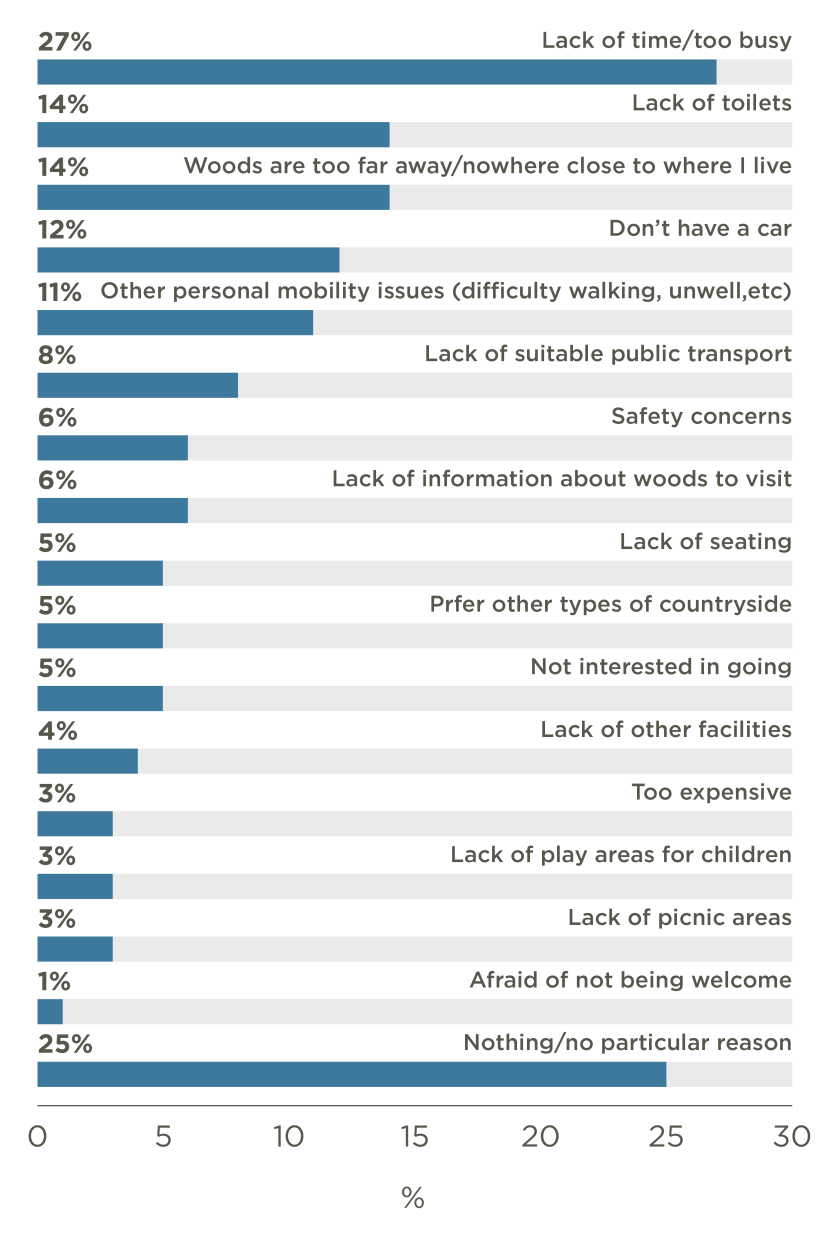
Figure 19. Reasons for not visiting local forests or woodland more often
Click for a full description
FOR2 - Which of the following, if any, are your main reasons for not visiting your local forests or woodland more often during the last 12 months?
Base: Respondents surveyed in April, May, June, October, November and December 2023 (n=6,038). Demographic weight applied
Horizontal bar chart showing reasons for not visiting local forests and woodland more often.
Bars are oriented horizontally and ranked from the reasons selected most often to the reasons selected least often.
The data are summarised in the following table:
| Potential reasons for not visiting | Percentage of population |
|---|---|
| Lack of time/too busy | 27% |
| Lack of toilets | 14% |
| Woods are too far away/ nowhere close to where I live | 14% |
| Don't have a car | 12% |
| Other personal mobility reasons (difficulty in walking, unwell, etc.) | 11% |
| Lack of suitable public transport | 8% |
| Safety concerns | 6% |
| Lack of information about woods to visit | 6% |
| Lack of seating | 5% |
| Prefer other types of countryside | 5% |
| Not interested in going | 5% |
| Lack of other facilities | 4% |
| Too expensive | 3% |
| Lack of play areas for children | 3% |
| Lack of picnic areas | 3% |
| Afraid of not being welcome | 1% |
| Nothing/ No particular reason | 25% |