NatureScot Research Report 1361 - SPANS Scotland’s People and Nature Survey 2023/24 - equality report
Published: 2025
Authors: Duncan Stewart and Jim Eccleston (56 Degree Insight)
Cite as: Stewart, D. and Eccleston, J. 2025. SPANS Scotland’s People and Nature Survey 2023/24 - equality report. NatureScot Research Report 1361.
What is SPANS?
Scotland’s People and Nature Survey (SPANS) is a large-scale population survey that provides detailed data on how adults in Scotland use, value and enjoy the outdoors and connect with nature. SPANS data allow NatureScot to monitor key trends over the long-term and produce statistically robust insights.
The core research objectives for SPANS are to deliver robust quantitative evidence in relation to the following key areas:
- Visits to the outdoors for leisure and recreation;
- Recreational use of and attitudes towards urban greenspace;
- Connection to nature;
- Benefits of engagement with the natural environment;
- Environmental attitudes and behaviours.
SPANS 2023-24 covered a 12-month period from March 2023 to February 2024. The 2023-24 survey followed on from previous waves of SPANS which ran on a triennial basis between 2012 and 2019.
Equality report
This report provides results relating to levels of equality in participation and the opportunities to engage with nature. Results are provided for key population groups where sample sizes are sufficient to support robust analysis, with variations between these groups highlighted to illustrate the areas where inequalities exist.
A headline report and a suite of other reports with a focus on specific areas of interest have also been produced using the data from SPANS 2023-24:
- Headline report
- Outdoor recreation
- Health and wellbeing
- Connection to nature
- Equality and diversity
- Technical report
- Data downloads
Survey method
SPANS 2023-2024 used an online survey approach to provide robust coverage of the Scottish adult population aged 16 and over. Twelve monthly survey waves were undertaken with at least 1,000 survey completions per month to compile data for the period from March 2023 to February 2024.
Fieldwork was undertaken using the Prodege consumer panel. Panel members go through a robust quality control process before they can join the panel and are then invited to take part in surveys in return for reward points.
Each month a sub-set of the Scottish panel was invited to take part in SPANS, targeted on the basis of their demographics and place of residence.
Each month’s fieldwork used sampling quotas to ensure a representative distribution on the basis of gender, age, social grade and place of residence.
A modular approach was used in the questionnaire design to ensure coverage of a wide range of topics of interest over the 12 survey waves. As such, while certain questions were included in every monthly wave, others were asked every other month, quarterly, or less often.
Further details on the survey methods used are provided in the SPANS technical report.
Comparability with previous surveys
The online survey approach taken in the 2023/24 survey differs from that used in previous waves of SPANS when a face-to-face interviewing method was employed. This change in method was made for several reasons including future proofing the survey against declining response rates and rising costs of in-person surveying.
There can be small differences in the way people answer survey questions online as opposed to in-person. Variations in results between SPANS 2023/24 and previous waves (even when the wording of questions is kept consistent) may partly be the result of methodological changes as well as changes in attitudes or behaviour at a population level. As a result, caution should be exercised when making comparisons with past SPANS results, and figures from this this should not be considered part of a continuous time series. SPANS 2023/24 forms a new baseline for comparisons with subsequent survey waves.
Further details on the potential impacts of these changes are provided in the SPANS technical report.
How does access to nature vary among adults in Scotland?
People with poorer health, residents of the most deprived areas, and those who are struggling financially are much less likely to participate in outdoor recreation or other forms of engagement with nature
While 61% of the overall adult population in Scotland normally visit the outdoors for recreation at least once a week, participation levels vary significantly across different population groups.
As shown in Figure 1, the population groups most likely to participate at this higher level of frequency include those reporting good or very good health, residents of the least deprived areas (as measured using the Scottish Index of Multiple Deprivation), those who consider themselves to be comfortable financially, and those reporting the highest levels of mental health (as measured using SWEMWBS).
In contrast, participation levels were lowest amongst those reporting the poorest health, those with lowest levels of mental health, residents of the most deprived areas, people with a limiting long-term illness or disability, and those who are struggling with finances.
Indeed, as shown in Figure 2, a significant minority of each of these same groups normally never visit the outdoors for recreation (around 8% to 9% of each of these population groups).
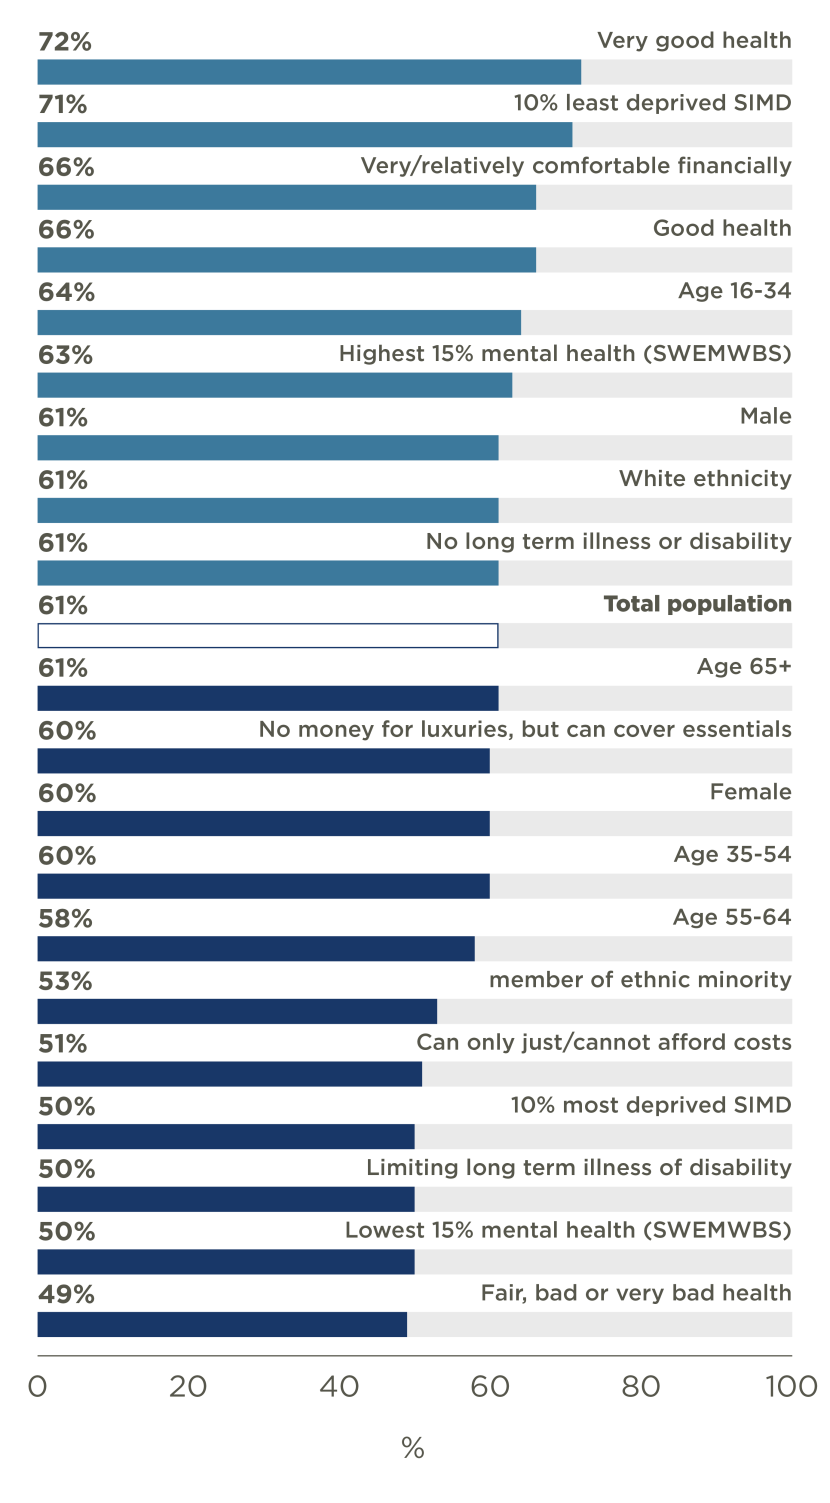
Figure 1. Percentage that visit the outdoors for recreation at least once a week by key demographics
Click for a full description
REC1: How often on average have you taken visits to the outdoors for leisure and recreation in Scotland in the last 12 months?
Base: All respondents. Demographic weight applied. Base sizes for all sub-groups are at least 600.
Bar chart illustrating percentages of total population and percentages of a number of key demographic groups visiting the outdoors for recreation at least once a week.
Bars are oriented horizontally with demographic groups on the y axis.
The groups are ranked from highest percentage participating to lowest.
The bar representing the total population is coloured white, bars for groups with participation levels higher than the total population are blue and bars for those groups with participation levels lower than the total population are grey.
The data are summarised in the following table:
| Demographic group | Percentage visiting at least once a week |
|---|---|
| Very good health | 72% |
| 10% least deprived SIMD | 71% |
| Very/ relatively comfortable financially | 66% |
| Good health | 66% |
| Age 16-34 | 64% |
| Highest 15% mental health (SWEMWBS) | 63% |
| Male | 61% |
| White ethnicity | 61% |
| No long term illness or disability | 61% |
| TOTAL POPULATION | 61% |
| Age 65+ | 61% |
| No money for luxuries, but can cover essentials | 60% |
| Female | 60% |
| Age 35-54 | 60% |
| Age 55-64 | 58% |
| Member of ethnic minority | 53% |
| Can only just/ cannot afford costs | 51% |
| 10% most deprived SIMD | 50% |
| Limiting long term illness of disability | 50% |
| Lowest 15% mental health (SWEMWBS) | 50% |
| Fair, Bad or Very bad health | 49% |
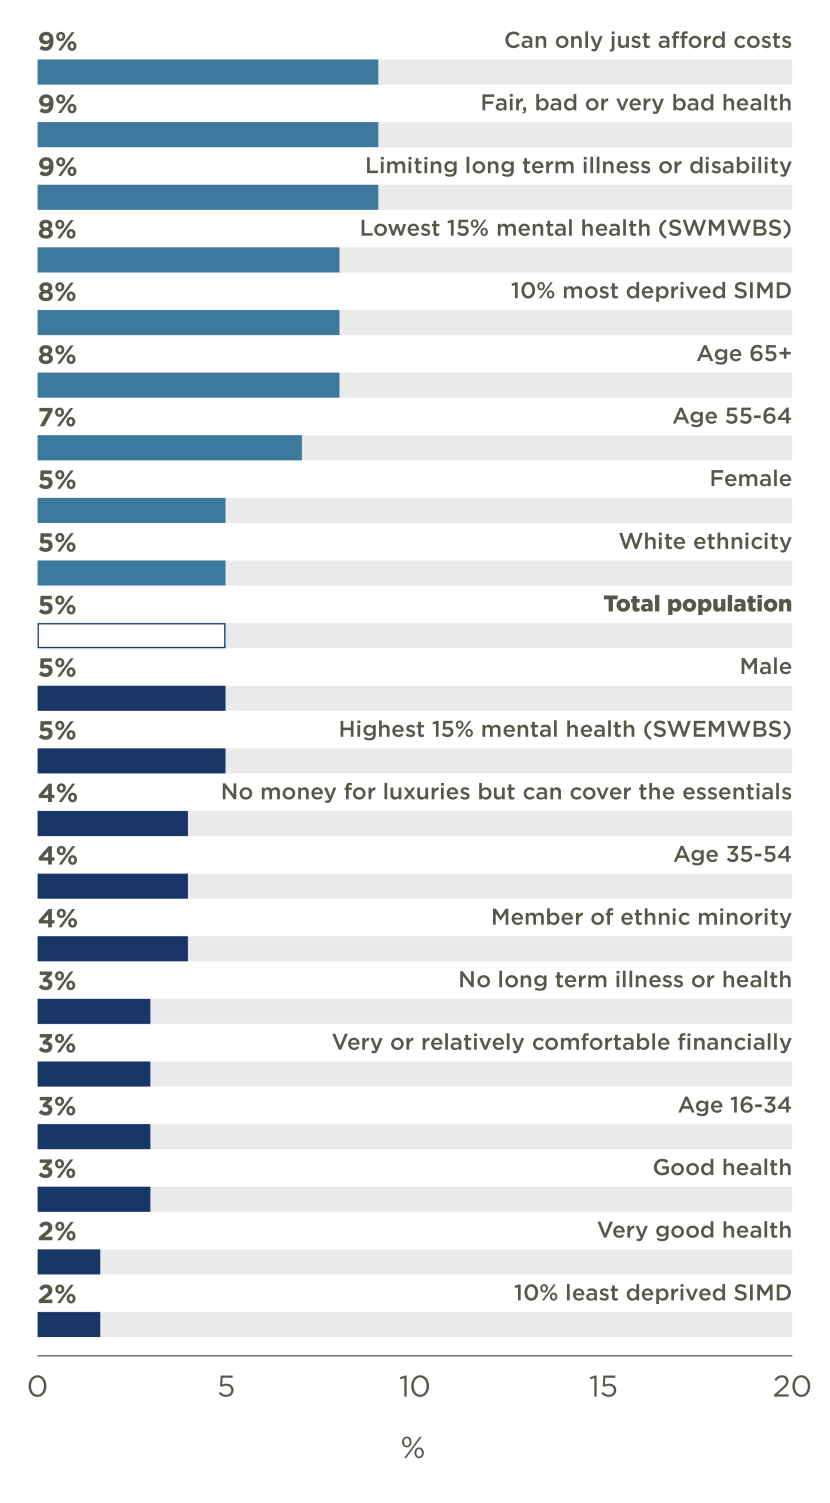
Figure 2. Percentage that never visit the outdoors for recreation by key demographics
Click for a full description
REC1: How often on average have you taken visits to the outdoors for leisure and recreation in Scotland in the last 12 months?
Base: All respondents. Demographic weight applied. Base sizes for all sub-groups are at least 600.
Bar chart illustrating percentages of total population and percentages of a number of key demographic groups that never visit the outdoors for recreation.
Bars are oriented horizontally with demographic groups on the y axis.
The groups are ranked from highest percentage never participating to lowest.
The bar representing the total population is coloured white, bars for groups with participation levels higher than the total population are blue and bars for those groups with participation levels lower than the total population are grey.
The data are summarised in the following table:
| Demographic group | Percentage never visiting |
|---|---|
| Can only just/ cannot afford costs | 9% |
| Fair, Bad or Very bad health | 9% |
| Limiting long term illness or disability | 9% |
| Lowest 15% mental health (SWEMWBS) | 8% |
| 10% most deprived SIMD | 8% |
| Age 65+ | 8% |
| Age 55-64 | 7% |
| Female | 5% |
| White ethnicity | 5% |
| TOTAL POPULATION | 5% |
| Male | 5% |
| Highest 15% mental health (SWEMWBS) | 5% |
| No money for luxuries but can cover the essentials | 4% |
| Age 35-54 | 4% |
| Member of ethnic minority | 4% |
| No long term illness or health | 3% |
| Very or relatively comfortable financially | 3% |
| Age 16-34 | 3% |
| Good health | 3% |
| Very good health | 2% |
| 10% least deprived SIMD | 2% |
To what extent do people in Scotland benefit from visiting the outdoors?
People are motivated to visit the outdoors for many reasons. Men and women show some variations in terms of what motivates outdoor recreation
The factors which motivate participation in outdoor recreation vary between different population groups.
Overall, exercise for physical health benefits was the leading motivation for outdoor visits, with men and women equally likely to mention it. However, as Figure 3 shows, other elected reasons varied between genders. For instance, women were more likely to mention the mental health benefits, enjoying fresh air and pleasant weather, enjoying scenery and wildlife, spending time with others, and entertaining children. On the other hand, men were more likely to mention challenging themselves or taking part in a hobby.
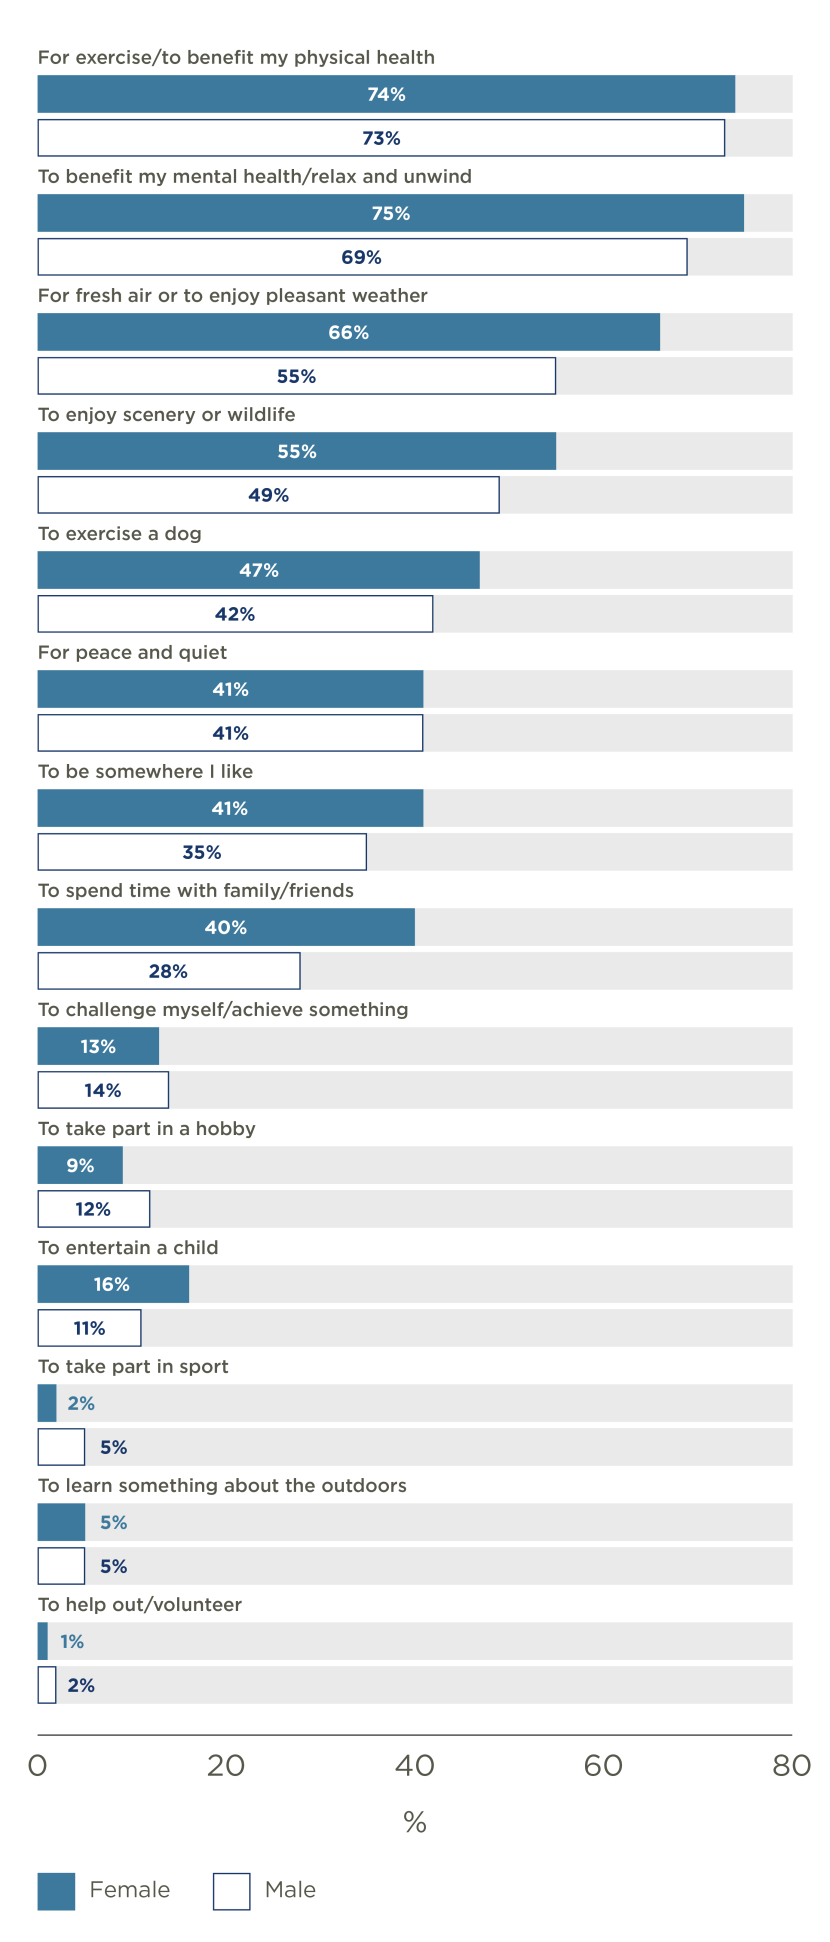
Figure 3. Motivations for most recent outdoor recreation visit by sex
Click for a full description
BEN1. Which of the following reasons, if any, best describe why you made your last visit to the outdoors during PRECEEDING MONTH?
Base: Respondents taking visits in May 2023 or November 2024 (n=1,711). Visit weight applied.
Bar chart illustrating motivations for outdoor visits showing responses from women in dark blue and responses from men in light blue.
Bars are oriented horizontally with motivations on the y axis. These are ranked from that selected by the highest percentage to that selected by the lowest percentage.
The data are summarised in the following table:
| Motivations | Male | Female |
|---|---|---|
| For exercise/ to benefit my physical health | 73% | 74% |
| To benefit my mental health/ relax and unwind | 69% | 75% |
| For fresh air or to enjoy pleasant weather | 55% | 66% |
| To enjoy scenery or wildlife | 49% | 55% |
| To exercise a dog | 42% | 47% |
| For peace and quiet | 41% | 41% |
| To be somewhere I like | 35% | 41% |
| To spend time with family/friends | 28% | 40% |
| To challenge myself/achieve something | 14% | 13% |
| To take part in a hobby | 12% | 9% |
| To entertain a child | 11% | 16% |
| To take part in a sport | 5% | 2% |
| To learn something about the outdoors | 5% | 5% |
| To help out/volunteer | 2% | 1% |
Motivations for outdoor recreation also varied to some extent by age with those aged 16-34 more likely to want to spend time with family or friends (50%) while those aged 55+ were more likely to seek exercise for physical health benefits (77%).
Participation in outdoor recreation can provide significant health and wellbeing advantages but those groups reporting the poorest health are often the least likely to gain these benefits
Recognising the benefits of outdoor recreation is a key aspect of motivating further such behaviour. Survey respondents were asked to indicate the extent to which they felt that they had obtained any of a list of potential benefits from their most recent visit to the outdoors. These benefits can be classified as being primarily mental health benefits, physical benefits, nature connection benefits, or social benefits. Although it is important to acknowledge the overlapping nature of the benefits of outdoor recreation.
Overall, 72% of people strongly agreed that they felt that their recent outdoor recreation visits had provided mental health or wellbeing benefits, 65% recognised any physical benefits, 41% reported nature connection benefits and 31% acknowledged social benefits.
However, as summarised in Table 1 and illustrated in more detail in Figures 4 to 7, levels of recognition of each of these potential benefits varied between population groups including the following:
- Women were more likely than men to report nature connection or social benefits
- Younger people were most likely to report mental health benefits.
- People with very good health were most likely overall to report benefits from visiting the outdoors
- People with good mental health were more likely to report benefits than those with poor mental health
| - | Mental health benefits | Physical health benefits | Nature connection benefits | Social benefits |
|---|---|---|---|---|
| Total population | 72% | 65% | 41% | 31% |
| Male | 70% | 66% | 37% | 28% |
| Female | 73% | 65% | 45% | 35% |
| Age 16-34 | 77% | 67% | 45% | 35% |
| Age 35-54 | 73% | 65% | 41% | 31% |
| Age 55+ | 66% | 64% | 38% | 29% |
| Very good health | 85% | 81% | 52% | 42% |
| Good health | 72% | 66% | 40% | 29% |
| Fair, bad or very bad health | 65% | 57% | 36% | 29% |
| No long-term illness or disability | 71% | 68% | 41% | 31% |
| Limiting long-term illness or disability | 72% | 59% | 42% | 31% |
| Highest 15% mental health (SWEMWBS) | 82% | 77% | 58% | 50% |
| Lowest 15% mental health (SWEMWBS) | 67% | 54% | 37% | 26% |
| White ethnicity | 71% | 66% | 40% | 31% |
| Member of ethnic minority | 80% | 63% | 53% | 34% |
| 10% least deprived SIMD | 77% | 72% | 44% | 44% |
| 10% most deprived SIMD | 67% | 63% | 36% | 26% |
| Very or relatively comfortable financially | 71% | 68% | 41% | 33% |
| No money for luxuries but can cover the essentials | 71% | 65% | 39% | 31% |
| Can only just/ cannot afford costs | 74% | 62% | 44% | 29% |
BEN2. And still thinking about your last visit in PRECEEDING MONTH, how much do you agree or disagree with each of the following statements
Base: Respondents taking visits in May 2023 or November 2024 (n=1,711). Demographic weight applied.
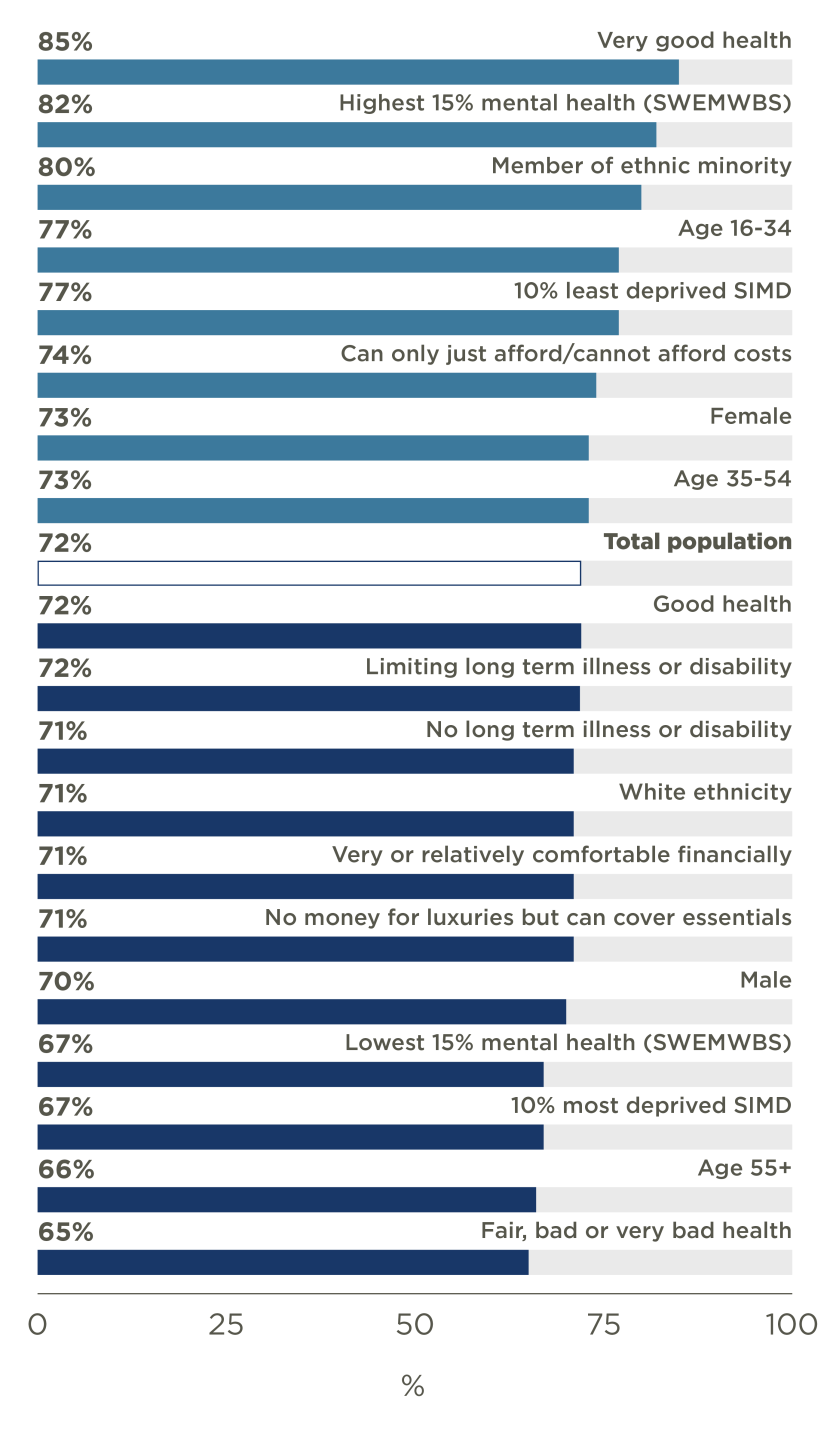
Figure 4. Percentage recognising mental health benefits from most recent outdoor recreation visit by key population groups
Click for a full description
BEN2. And still thinking about your last visit in PRECEEDING MONTH, how much do you agree or disagree with each of the following statements
Base: Respondents taking visits in May 2023 or November 2024 (n=1,711). Demographic weight applied.
Bar chart illustrating percentages of total population and percentages of a number of key demographic groups stating that they gained mental health benefits from their last outdoor recreation visit.
Bars are oriented horizontally with demographic groups on the y axis.
The groups are ranked from highest percentage to lowest.
The bar representing the total population is coloured white, bars for groups with levels higher than the total population are blue and bars for those groups with levels lower than the total population are grey.
The data are summarised in the following table:
| Demographic group | Percentage reporting mental health benefits |
|---|---|
| Very good health | 85% |
| Highest 15% mental health (SWEMWBS) | 82% |
| Member of ethnic minority | 80% |
| Age 16-34 | 77% |
| 10% least deprived SIMD | 77% |
| Can only just/ cannot afford costs | 74% |
| Female | 73% |
| Age 35-54 | 73% |
| TOTAL POPULATION | 72% |
| Good health | 72% |
| Limiting long term illness or disability | 72% |
| No long term illness or disability | 71% |
| White ethnicity | 71% |
| Very or relatively comfortable financially | 71% |
| No money for luxuries but can cover the essentials | 71% |
| Male | 70% |
| Lowest 15% mental health (SWEMWBS) | 67% |
| 10% most deprived SIMD | 67% |
| Age 55+ | 66% |
| Fair, Bad or Very bad health | 65% |
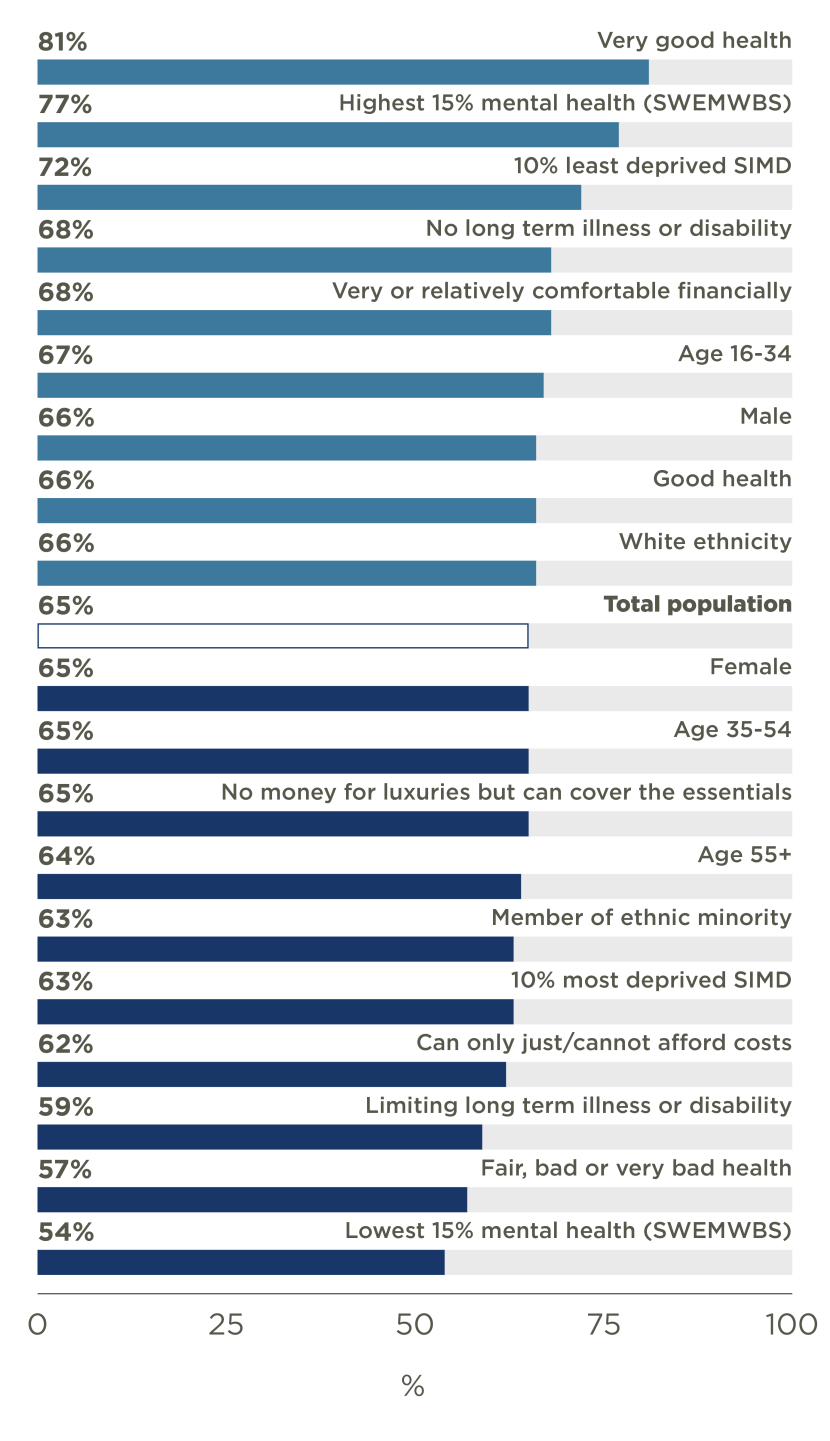
Figure 5. Percentage recognising physical health benefits from most recent outdoor recreation visit by key population groups
Click for a full description
BEN2. And still thinking about your last visit in PRECEEDING MONTH, how much do you agree or disagree with each of the following statements)
Base: Respondents taking visits in May 2023 or November 2024 (n=1,711). Demographic weight applied.
Bar chart illustrating percentages of total population and percentages of a number of key demographic groups stating that they gained physical health benefits from their last outdoor recreation visit.
Bars are oriented horizontally with demographic groups on the y axis.
The groups are ranked from highest percentage to lowest.
The bar representing the total population is coloured white, bars for groups with levels higher than the total population are blue and bars for those groups with levels lower than the total population are grey.
The data are summarised in the following table:
| Demographic group | Percentage reporting physical health benefits |
|---|---|
| Very good health | 81% |
| Highest 15% mental health (SWEMWBS) | 77% |
| 10% least deprived SIMD | 72% |
| No long term illness or disability | 68% |
| Very or relatively comfortable financially | 68% |
| Age 16-34 | 67% |
| Male | 66% |
| Good health | 66% |
| White ethnicity | 66% |
| TOTAL POPULATION | 65% |
| Female | 65% |
| Age 35-54 | 65% |
| No money for luxuries but can cover the essentials | 65% |
| Age 55+ | 64% |
| Member of ethnic minority | 63% |
| 10% most deprived SIMD | 63% |
| Can only just/ cannot afford costs | 62% |
| Limiting long term illness or disability | 59% |
| Fair, Bad or Very bad health | 57% |
| Lowest 15% mental health (SWEMWBS) | 54% |
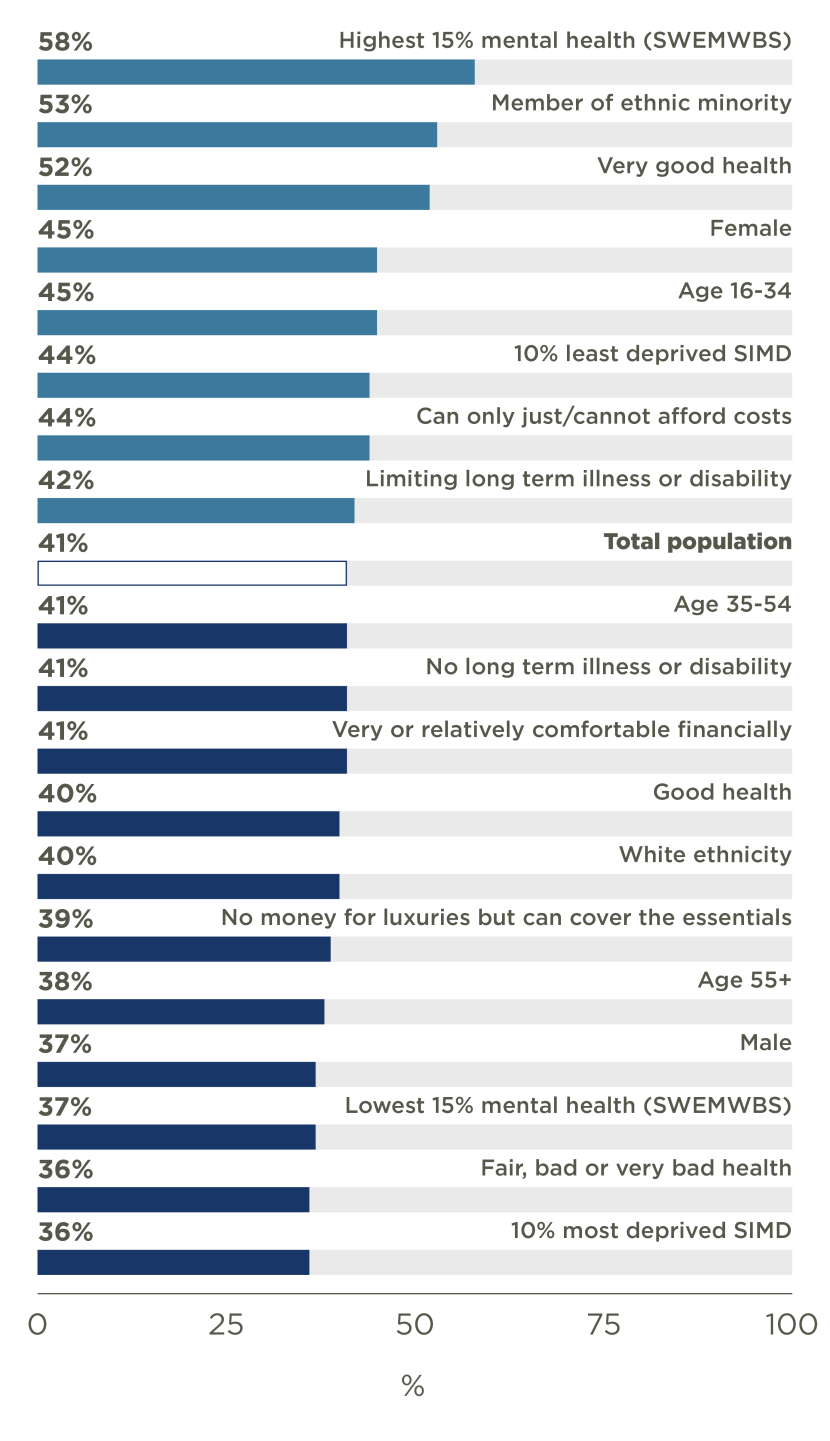
Figure 6. Percentage recognised nature connection benefits from most recent outdoor recreation visit by key population groups
Click for a full description
BEN2. And still thinking about your last visit in PRECEEDING MONTH, how much do you agree or disagree with each of the following statements
Base: Respondents taking visits in May 2023 or November 2024 (n=1,711). Demographic weight applied.
Bar chart illustrating percentages of total population and percentages of a number of key demographic groups stating that they gained nature connection benefits from their last outdoor recreation visit.
Bars are oriented horizontally with demographic groups on the y axis.
The groups are ranked from highest percentage to lowest.
The bar representing the total population is coloured white, bars for groups with levels higher than the total population are blue and bars for those groups with levels lower than the total population are grey.
The data are summarised in the following table:
| Demographic group | Percentage reporting nature connection benefits |
|---|---|
| Highest 15% mental health (SWEMWBS) | 58% |
| Member of ethnic minority | 53% |
| Very good health | 52% |
| Female | 45% |
| Age 16-34 | 45% |
| 10% least deprived SIMD | 44% |
| Can only just/ cannot afford costs | 44% |
| Limiting long term illness or disability | 42% |
| TOTAL POPULATION | 41% |
| Age 35-54 | 41% |
| No long term illness or disability | 41% |
| Very or relatively comfortable financially | 41% |
| Good health | 40% |
| White ethnicity | 40% |
| No money for luxuries but can cover the essentials | 39% |
| Age 55+ | 38% |
| Male | 37% |
| Lowest 15% mental health (SWEMWBS) | 37% |
| Fair, Bad or Very bad health | 36% |
| 10% most deprived SIMD | 36% |
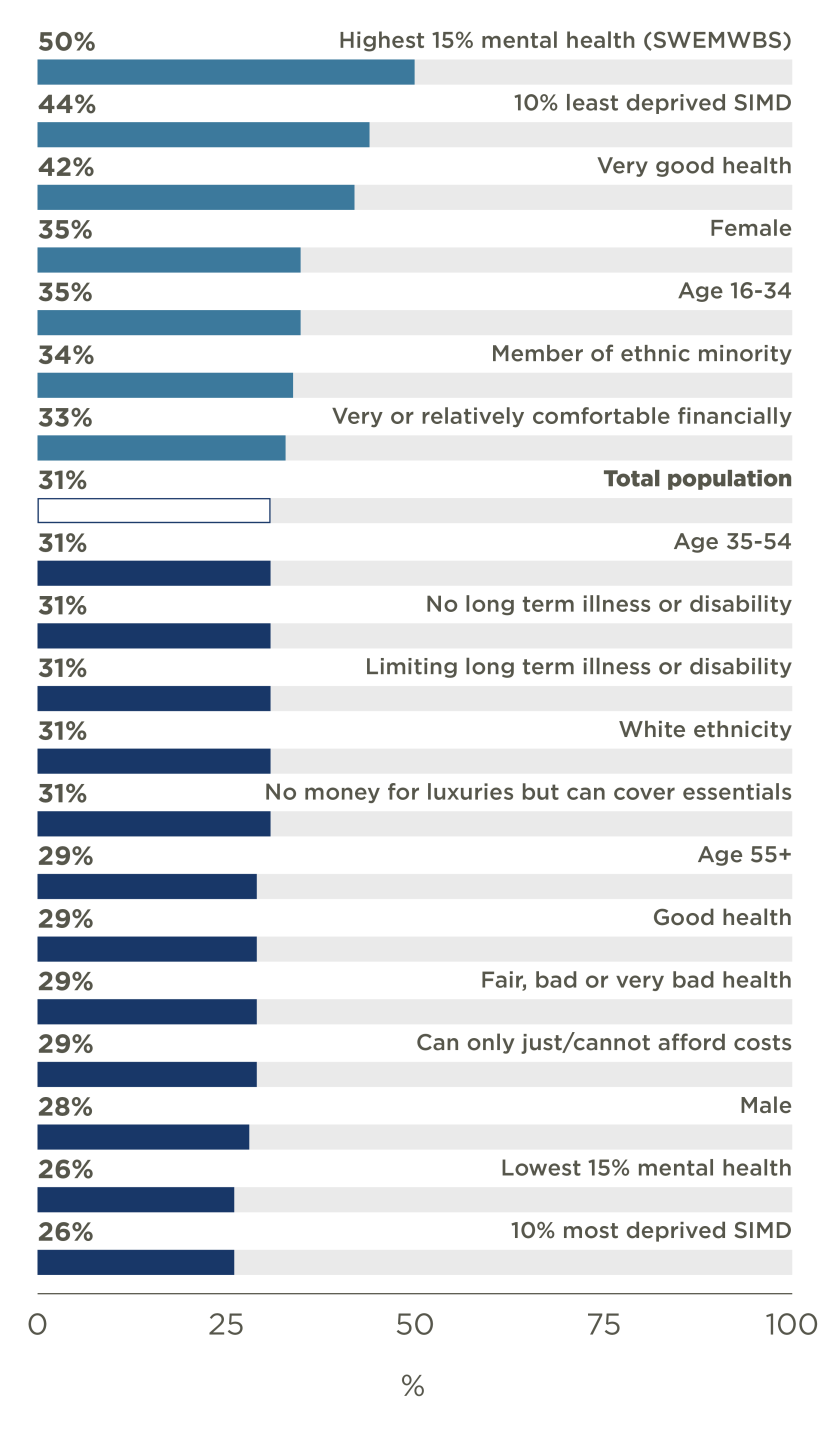
Figure 7. Percentage recognised social benefits from most recent outdoor recreation visit by key population groups
Click for a full description
BEN2. And still thinking about your last visit in PRECEEDING MONTH, how much do you agree or disagree with each of the following statements
Base: Respondents taking visits in May 2023 or November 2024 (n=1,711). Demographic weight applied.
Bar chart illustrating percentages of total population and percentages of a number of key demographic groups stating that they gained social benefits from their last outdoor recreation visit.
Bars are oriented horizontally with demographic groups on the y axis.
The groups are ranked from highest percentage to lowest.
The bar representing the total population is coloured white, bars for groups with levels higher than the total population are blue and bars for those groups with levels lower than the total population are grey.
The data are summarised in the following table:
| Demographic group | Percentage reporting social benefits |
|---|---|
| Highest 15% mental health (SWEMWBS) | 50% |
| 10% least deprived SIMD | 44% |
| Very good health | 42% |
| Female | 35% |
| Age 16-34 | 35% |
| Member of ethnic minority | 34% |
| Very or relatively comfortable financially | 33% |
| TOTAL POPULATION | 31% |
| Age 35-54 | 31% |
| No long term illness or disability | 31% |
| Limiting long term illness or disability | 31% |
| White ethnicity | 31% |
| No money for luxuries but can cover the essentials | 31% |
| Age 55+ | 29% |
| Good health | 29% |
| Fair, Bad or Very bad health | 29% |
| Can only just/ cannot afford costs | 29% |
| Male | 28% |
| Lowest 15% mental health (SWEMWBS) | 26% |
| 10% most deprived SIMD | 26% |
What limits people’s access to outdoor recreation?
For many people a lack of time restricts their opportunities for outdoor recreation
Poor health and mobility issues are significant barriers to some people
To understand the barriers to taking part in outdoor recreation, respondents were asked an open-ended question about their reasons for not visiting the outdoors more often during the last 12 months. An analysis of the responses to this question found that while a wide range of answers were provided, the following themes were mentioned most often:
- Work commitments (18% of responses) – nearly 1 in 5 people said that their work schedules, long hours or other work-related commitments prevented them from spending more time outdoors. These reasons were more likely to be given by people aged under 55 and those who’s self-reported health was very good or had no long-term illnesses or health conditions.
- Bad weather (18%) - also mentioned frequently as a barrier to taking more outdoor visits. This reason was mentioned broadly consistently across all the different demographic groups.
- Time constraints (16%) - a lack of free time due to personal responsibilities including family and other commitments was the third most frequently referenced barrier. This reason was more likely to be provided by those who stated that they were very or relatively comfortable financially.
- Health or mobility issues (5%) - personal health problems, including disabilities, chronic illnesses and recovery from surgery were mentioned as barriers, most often amongst people aged 55+, those who reported having fair, bad or very bad health, those with a limiting disability or health condition and those with the lowest levels of mental health.
- Financial constraints (3%) - the cost of transportation and other expenses related to outdoor trips was also a concern for some. As might be expected this response was most often given by those who also stated that they were struggling financially only just or unable to afford day to day costs.
- Lack of motivation (1%) - some respondents admitted to laziness or a lack of motivation as reasons for not going outdoors more frequently.
- Transport issues (1%) - difficulties with transportation, including the lack of a car or reliable public transport, were also mentioned as hindrances by a small percentage.
Following this open-ended question respondents were shown a list of potential reasons (see Figure 8) and asked to select which of these, if any, were factors limiting their participation in outdoor recreation.
Reflecting the most common responses to the open-ended question, the most frequently selected issues related to poor weather and a lack of time, followed by other concerns including cost, health related concerns and a preference not to go out alone.
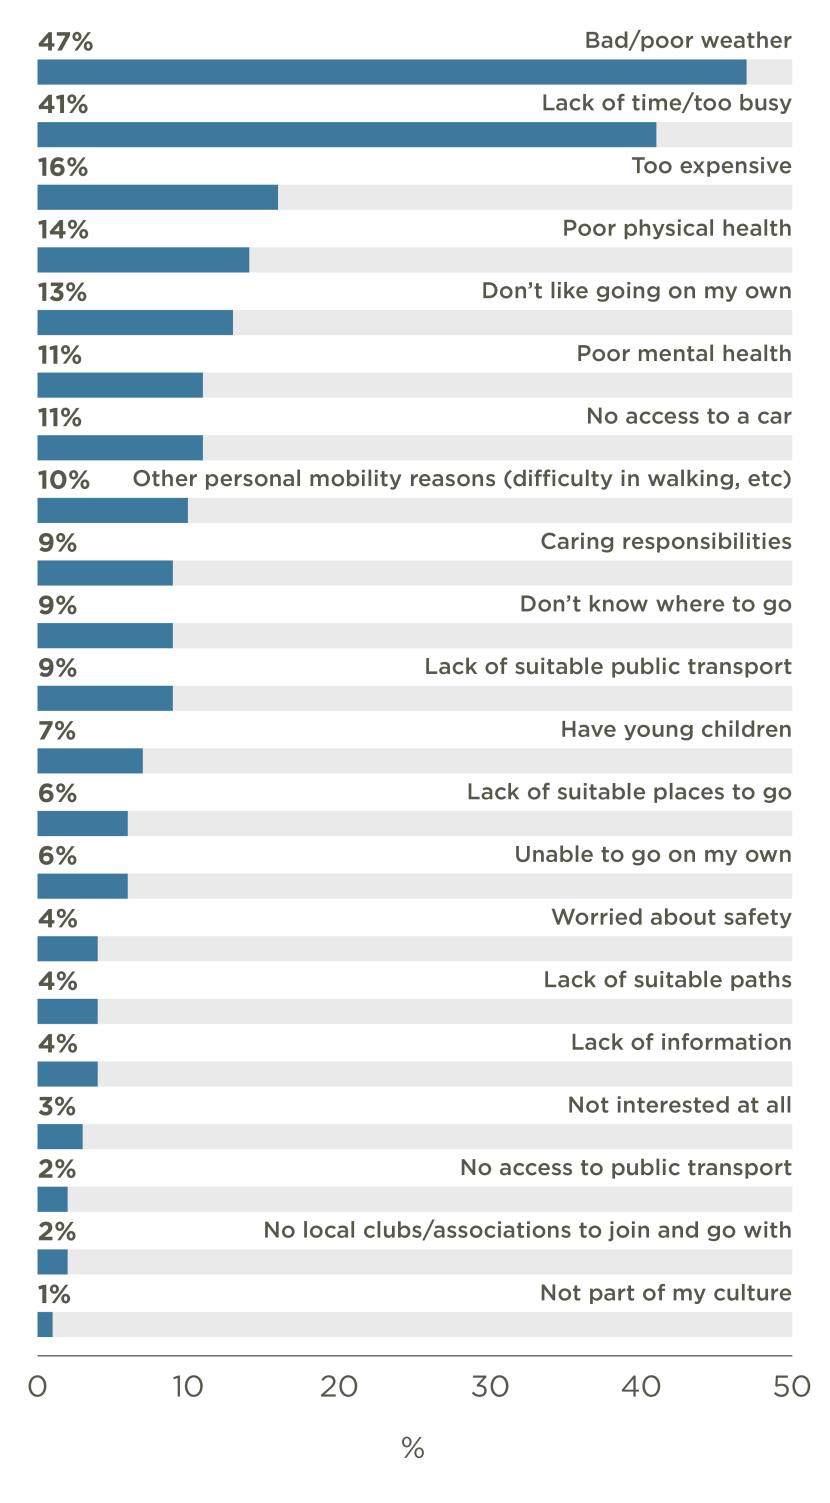
Figure 8. Reasons for not taking more visits to the outdoors during the last 12 months
Click for a full description
REC3. For which of the reasons listed below, if any, did you not make more visits to the outdoors for the purposes of leisure and recreation in the last 12 months?
Base: Respondents surveyed in July 2023 and January 2024 (n=2,008). Demographic weight applied.
Bar chart illustrating reasons provided for not visiting the outdoors more often
Bars are oriented horizontally with reasons on the y axis. These are ranked from that selected by the highest percentage to that selected by the lowest percentage.
The data are summarised in the following table:
| Reasons for not visiting | Percentage of population |
|---|---|
| Bad/poor weather | 47% |
| Lack of time/too busy | 41% |
| Too expensive | 16% |
| Poor physical health | 14% |
| Don't like going on my own | 13% |
| Poor mental health | 11% |
| No access to a car | 11% |
| Other personal mobility reasons (difficulty in walking, etc.) | 10% |
| Caring responsibilities | 9% |
| Don't know where to go | 9% |
| Lack of suitable public transport | 9% |
| Have young children | 7% |
| Lack of suitable places to go | 6% |
| Unable to go on my own | 6% |
| Worried about safety | 4% |
| Lack of suitable paths | 4% |
| Lack of information | 4% |
| Not interested at all | 3% |
| No access to public transport | 2% |
| No local clubs/associations to join and go with | 2% |
| Not part of my culture | 1% |
Comparing the reasons given for not visiting the outdoors with the frequency people reported visiting highlights the differences among some population groups (Table 2).
In general, people who visit the outdoors most often were more likely to be restrained by poor weather or having young children while occasional participants were more likely to mention a lack of time, expense, not liking going on their own, a lack of car access, or not knowing where to go.
However, those who typically never visit the outdoors for recreation were most likely to reference longer term issues including poor physical health, personal mobility issues, being unable to go alone, and a lack of interest.
| - | Total population | Visit at least once a week | Visit less often | Never visit |
|---|---|---|---|---|
| Bad/poor weather | 47% | 50% | 47% | 20% |
| Lack of time/too busy | 41% | 41% | 46% | 17% |
| Too expensive | 16% | 13% | 21% | 20% |
| Poor physical health | 14% | 11% | 17% | 27% |
| Don't like going on my own | 13% | 10% | 19% | 14% |
| Poor mental health | 11% | 11% | 12% | 13% |
| No access to a car | 11% | 9% | 14% | 11% |
| Other personal mobility reasons (difficulty in walking, etc.) | 10% | 6% | 13% | 19% |
| Caring responsibilities | 9% | 9% | 10% | 8% |
| Lack of suitable public transport | 9% | 8% | 11% | 8% |
| Don't know where to go | 9% | 7% | 11% | 12% |
| Have young children | 7% | 9% | 6% | 2% |
| Lack of suitable places to go | 6% | 5% | 7% | 9% |
| Unable to go on my own | 6% | 4% | 8% | 19% |
| Lack of suitable paths | 4% | 4% | 4% | 8% |
| Worried about safety | 4% | 4% | 5% | 8% |
| Lack of information | 4% | 3% | 4% | 6% |
| No access to public transport | 2% | 2% | 3% | 1% |
| No local clubs/associations to join and go with | 2% | 2% | 3% | 2% |
| Not part of my culture | 1% | 1% | 1% | 3% |
REC3. For which of the reasons listed below, if any, did you not make more visits to the outdoors for the purposes of leisure and recreation in the last 12 months?
Base: Respondents surveyed in July 2023 and January 2024 (n=2,008). Demographic weight applied.
Overall, 41% of respondents selected one or more of the barriers relating to lack of time or being too busy, 31% selected issues relating to a lack of information, places to go or confidence issues (e.g. not wanting to go out alone), and 25% mentioned any issues relating to health or mobility.
As shown in Table 3 the kinds of barriers cited varied between population groups including:
- A lack of time or too busy – most often selected as an issue by those aged under 55, people with good or very good health, people with no long-term illness or disability and people who considered themselves to be comfortable financially.
- A lack of information, places or confidence - most often selected as a concern by women, people aged 16 to 34, people with poorer health, people with a limiting long-term illness or disability, people with poorest mental health and residents of the 10% most deprived areas.
- Health or mobility – most often selected as a barrier by people with poorer health, people with a limiting long-term illness or disability, people with poorest mental health and residents of the 10% most deprived areas.
| - | Lack of time or too busy | Lack of information, places or confidence | Health or mobility |
|---|---|---|---|
| Total population | 41% | 31% | 25% |
| Male | 39% | 27% | 24% |
| Female | 42% | 34% | 27% |
| Age 16-34 | 51% | 38% | 24% |
| Age 35-54 | 45% | 28% | 23% |
| Age 55+ | 30% | 27% | 28% |
| Very good health | 48% | 24% | 4% |
| Good health | 47% | 27% | 13% |
| Fair, bad or very bad health | 31% | 38% | 50% |
| No long-term illness or disability | 48% | 27% | 7% |
| Limiting long-term illness or disability | 29% | 39% | 60% |
| Highest 15% mental health (SWEMWBS) | 38% | 21% | 15% |
| Lowest 15% mental health (SWEMWBS) | 36% | 43% | 44% |
| White ethnicity | 41% | 30% | 26% |
| Member of ethnic minority | 49% | 38% | 14% |
| 10% least deprived SIMD | 51% | 21% | 13% |
| 10% most deprived SIMD | 32% | 39% | 37% |
| Very or relatively comfortable financially | 46% | 24% | 16% |
| No money for luxuries but can cover the essentials | 44% | 32% | 24% |
| Can only just/ cannot afford costs | 28% | 39% | 45% |
REC3. For which of the reasons listed below, if any, did you not make more visits to the outdoors for the purposes of leisure and recreation in the last 12 months?
Base: Respondents surveyed in July 2023 and January 2024 (n=2,008). Demographic weight applied
How do the places people visit for outdoor recreation vary across the population?
Urban greenspaces such as parks and canal towpaths are significant locations for outdoor recreation amongst residents of the least deprived areas and people reporting poorer health
The kinds of places people visited for the purposes of outdoor recreation varied between population groups with implications for equality.
Figure 9 shows a basic description of the destination (either town or city, countryside, or seaside) of people’s most recent outdoor visit.
Notably visits within a town or city were more likely to have been taken by people aged 16-34, people claiming to have poorer health, members of ethnic minorities, and residents of the 10% most deprived areas.
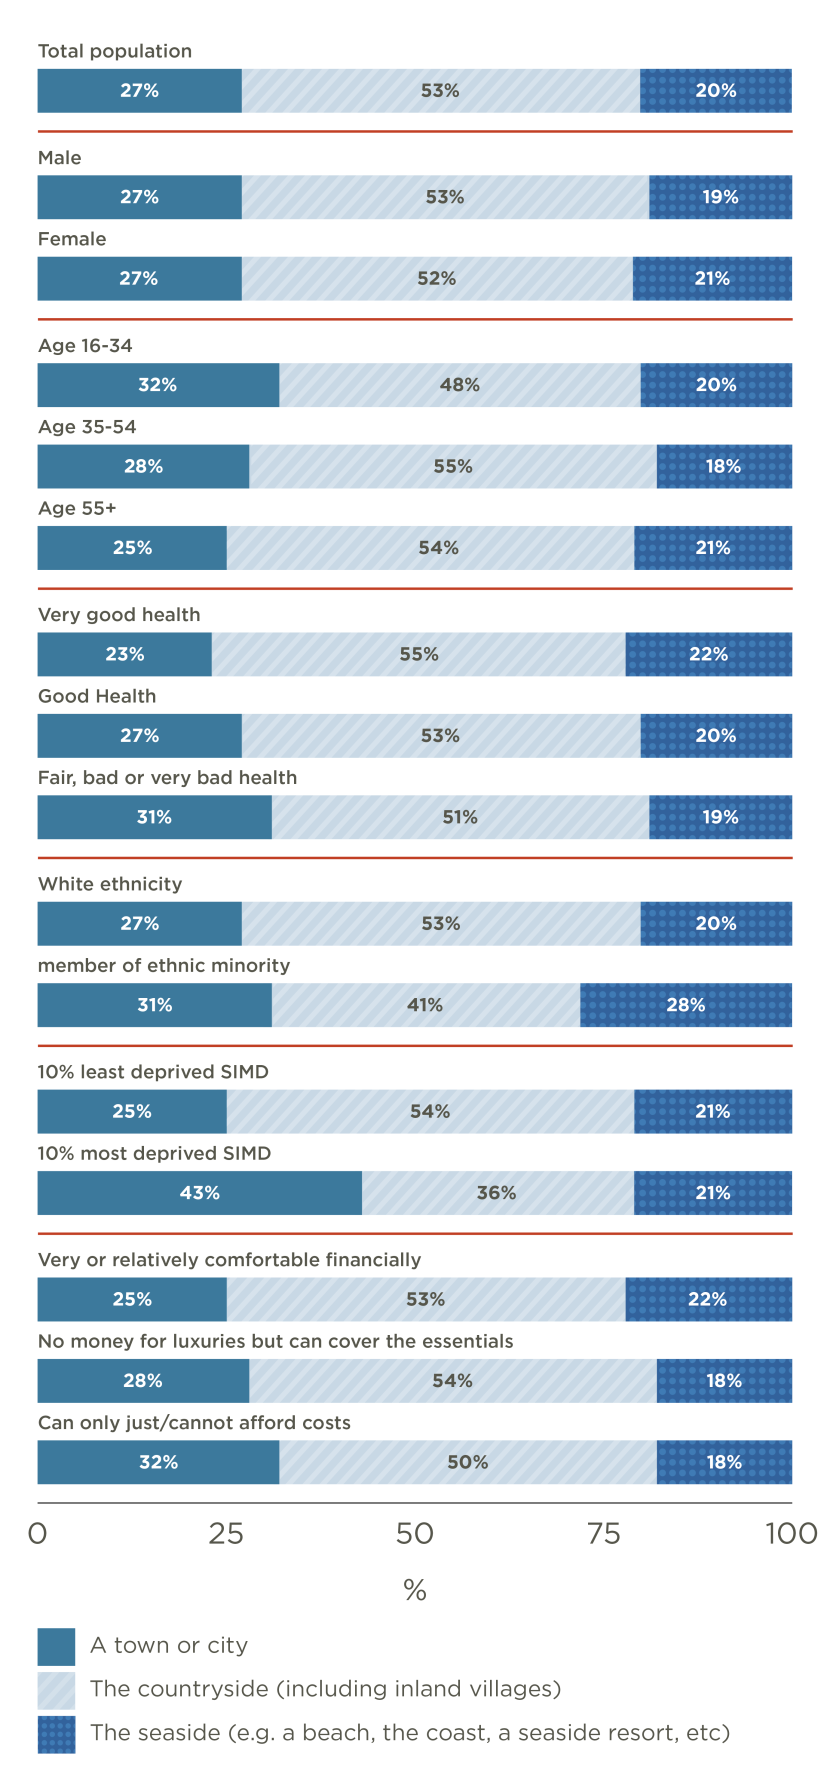
Figure 9. Best description of place visited on most recent outdoor recreation visit
Click for a full description
REC8: Still thinking about your last visit to the outdoors for leisure and recreation during PRECEEDING MONTH, which of these places best describes where you went?
Base: All respondents taking visits in April, August, October and December 2023 and February 2024. Base sizes for all sub-groups are at least 300. Visit weight applied.
Stacked bar chart showing types of location visited by total population and key demographic groups.
Bars are oriented horizontally and split into three coloured bands – grey for town or city, light blue for countryside and dark blue for seaside/coast.
The data are summarised in the following table:
| Row % | A town or city | The countryside (including inland villages) | The seaside (e.g. a beach, the coast, a seaside resort, etc) |
|---|---|---|---|
| TOTAL POPULATION | 27% | 53% | 20% |
| Male | 27% | 53% | 19% |
| Female | 27% | 52% | 21% |
| Age 16-34 | 32% | 48% | 20% |
| Age 35-54 | 28% | 55% | 18% |
| Age 55+ | 25% | 54% | 21% |
| Very good health | 23% | 55% | 22% |
| Good health | 27% | 53% | 20% |
| Fair, Bad or Very bad health | 31% | 51% | 19% |
| White ethnicity | 27% | 53% | 20% |
| Member of ethnic minority | 31% | 41% | 28% |
| 10% least deprived SIMD | 25% | 54% | 21% |
| 10% most deprived SIMD | 43% | 36% | 21% |
| Very or relatively comfortable financially | 25% | 53% | 22% |
| No money for luxuries but can cover the essentials | 28% | 54% | 18% |
| Can only just/ cannot afford costs | 32% | 50% | 18% |
Table 4 provides more detailed information on the types of places visited, highlighting the differences between visits taken by people reporting good health and those reporting poorer health.
This comparison illustrates the greater reliance on urban greenspaces such as parks and villages for the visits taken by those reporting poorer health while those self-reporting good or very good health were more likely to visit a wider range of types of locations such as mountains and hills, woodland and beaches.
| - | Very good or good health | Fair, bad or very bad health |
|---|---|---|
| A park or other open greenspace in an urban area | 40% | 43% |
| Woodland/forest | 40% | 37% |
| Beach | 22% | 20% |
| River | 16% | 18% |
| Village | 13% | 19% |
| Wildlife area/nature reserve | 11% | 12% |
| Farmland | 11% | 13% |
| Sea/Sea loch | 11% | 10% |
| Mountain/hill | 13% | 5% |
| Inland loch/reservoir | 10% | 7% |
| Canal | 6% | 6% |
| Moorland | 3% | 3% |
| Cliff | 2% | 3% |
REC9. On this visit to the outdoors for leisure and recreation, which of the following types of location or destination did you go to?
Base: All respondents taking visits in April, August, October and December 2023 and February 2024. Base sizes for all sub-groups are at least 1,700. Visit weight applied.
A similar comparison of the places visited on the most recent visit amongst those living in the most and least deprived parts of Scotland (Table 5) illustrates how those in the most deprived SIMD areas were more likely to visit urban parks and greenspaces and canals while a high percentage of visits taken by those from least derived areas included woodland or mountain and hills.
These results reinforce the importance of accessible urban greenspaces amongst those groups which tend to take visits less frequently, often due to challenges such as personal health, safety concerns or lower than average car ownership levels.
| - | 10% most deprived SIMD | 10% least deprived SIMD |
|---|---|---|
| A park or other open greenspace in an urban area | 48% | 40% |
| Woodland/forest | 22% | 38% |
| Beach | 22% | 19% |
| River | 14% | 18% |
| Village | 13% | 13% |
| Wildlife area/nature reserve | 16% | 10% |
| Farmland | 5% | 6% |
| Sea/Sea loch | 13% | 11% |
| Mountain/hill | 10% | 17% |
| Inland loch/reservoir | 7% | 10% |
| Canal | 13% | 7% |
| Moorland | 2% | 5% |
| Cliff | 3% | 0% |
REC9. On this visit to the outdoors for leisure and recreation, which of the following types of location or destination did you go to?
Base: All respondents taking visits in April, August, October and December 2023 and February 2024. Base sizes for all sub-groups are at least 300. Visit weight applied.
Visitors to urban greenspaces are typically younger and twice as likely to live in deprived areas as those visiting the countryside or coast
A comparison of the profile of those taking visits to urban greenspaces with those taking visits to the countryside or coast on their most recent outdoor visit further illustrates the differences described in the previous section.
Most notably, those visiting urban greenspaces were proportionately more likely to be aged 16-34 but less likely to be aged 55 or over. They were also twice as likely to live in the 10% most deprived areas (12% of visitors vs 6%).
| - | Visited green space in town or city | Visited countryside or coast |
|---|---|---|
| Male | 47% | 46% |
| Female | 53% | 54% |
| Age 16-34 | 28% | 22% |
| Age 35-54 | 32% | 31% |
| Age 55+ | 41% | 47% |
| Very good health | 20% | 25% |
| Good health | 48% | 48% |
| Fair, Bad or Very bad health | 32% | 28% |
| White ethnicity | 96% | 97% |
| Member of ethnic minority | 4% | 3% |
| 10% least deprived SIMD | 8% | 9% |
| 10% most deprived SIMD | 12% | 6% |
| Very or relatively comfortable financially | 44% | 49% |
| No money for luxuries but can cover the essentials | 38% | 36% |
| Can only just/ cannot afford costs | 17% | 14% |
How do attitudes towards local greenspaces vary across the population?
Opinions of local greenspaces are more negative in the most deprived areas with particular concerns regarding facilities, safety and their attractiveness as places for children to play
A series of questions asked SPANS participants specifically about greenspace in their local area. These questions covered a number of topics, including levels of usage and levels of satisfaction. As illustrated previously, local greenspaces such as parks are an essential resource for outdoor recreation, especially for some of the groups that typically take part in outdoor recreation less frequently.
Figure 10 orders population groups on the basis of the percentage visiting or passing through local greenspaces at least once a week.
While 70% of the total population report visiting or passing through their local greenspace at least weekly, a significantly greater proportion (82%) of people living in the least deprived areas do so than in the most deprived areas (59%).
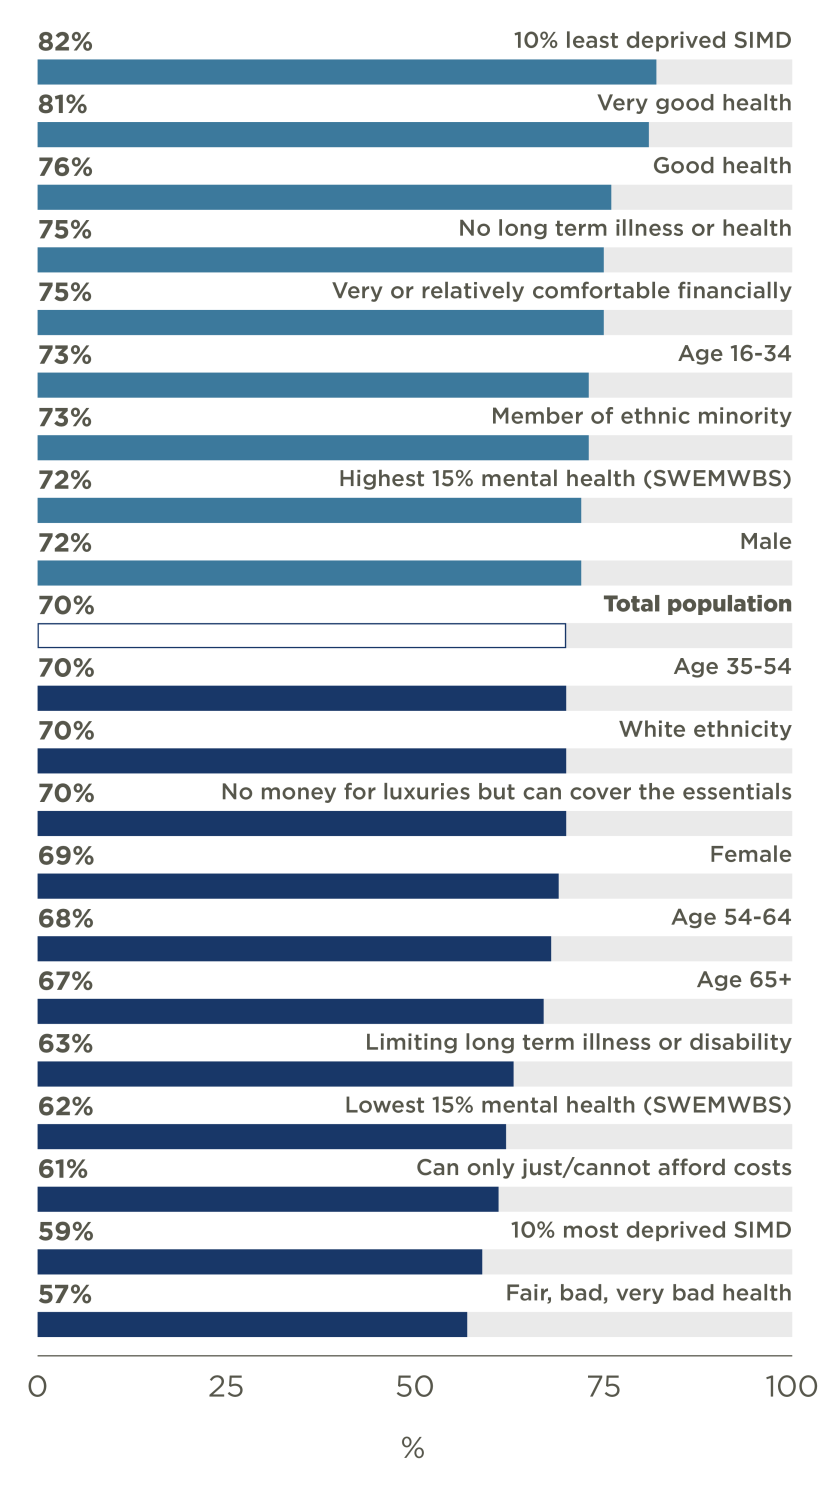
Figure 10. Percentage that visit or pass through local greenspaces at least once a week by key demographics
Click for a full description
GREEN1: In the last 12 months, how often on average have you visited or passed through your local greenspace areas?
Base: Respondents surveyed in May, August or November 2023 or February 2024. Demographic weight applied. Base sizes for all sub-groups are at least 200.
Bar chart illustrating percentages of total population and percentages of a number of key demographic groups visiting or passing through local greenspaces at least once a week.
Bars are oriented horizontally with demographic groups on the y axis.
The groups are ranked from highest percentage to lowest.
The bar representing the total population is coloured white, bars for groups with participation levels higher than the total population are blue and bars for those groups with participation levels lower than the total population are grey.
The data are summarised in the following table:
| Demographic group | Percentage visiting or passing through at least once a week |
|---|---|
| 10% least deprived SIMD | 82% |
| Very good health | 81% |
| Good health | 76% |
| No long term illness or health | 75% |
| Very or relatively comfortable financially | 75% |
| Age 16-34 | 73% |
| Member of ethnic minority | 73% |
| Highest 15% mental health (SWEMWBS) | 72% |
| Male | 71% |
| TOTAL POPULATION | 70% |
| Age 35-54 | 70% |
| White ethnicity | 70% |
| No money for luxuries but can cover the essentials | 70% |
| Female | 69% |
| Age 55-64 | 68% |
| Aged 65+ | 67% |
| Limiting long term illness or disability | 63% |
| Lowest 15% mental health (SWEMWBS) | 62% |
| Can only just/ cannot afford costs | 61% |
| 10% most deprived SIMD | 59% |
| Fair, Bad or Very bad health | 57% |
When asked about reasons for not using local greenspaces more often (Figure 11), many of the factors cited overlap with limitations on outdoor recreation more generally (e.g. being too busy). Several more place specific barriers were also selected including a lack of toilet facilities, anti-social behaviour, a lack of seating and a lack of lighting.
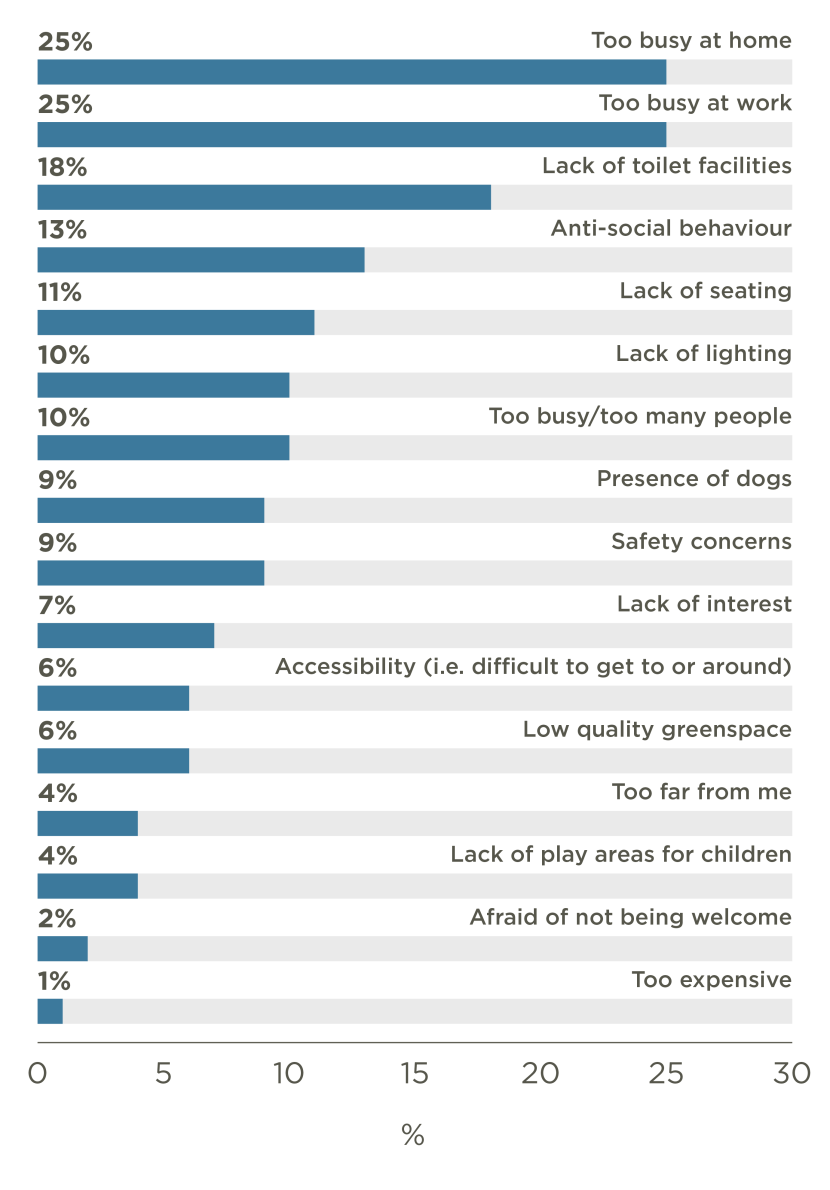
Figure 11. Reasons for not visiting or passing through local greenspace(s) more during the last 12 months
Click for a full description
GREEN7. Which of the following, if any, are your main reasons for not visiting your local greenspace(s) more often during the last 12 months?
Base: Respondents surveyed in July 2023 and January 2024 (n=2,008). Demographic weight applied.
Bar chart illustrating reasons provided for not visiting or passing through local greenspaces more often.
Bars are oriented horizontally with reasons on the y axis. These are ranked from that selected by the highest percentage to that selected by the lowest percentage.
The data are summarised in the following table:
| Reasons for not visiting | Percentage of population |
|---|---|
| Too busy at home | 25% |
| Too busy at work | 25% |
| Lack of toilet facilities | 18% |
| Anti-social behaviour | 13% |
| Lack of seating | 11% |
| Lack of lighting | 10% |
| Too busy / too many people | 10% |
| Presence of dogs | 9% |
| Safety concerns | 9% |
| Lack of interest | 7% |
| Accessibility (i.e. difficult to get to or around) | 6% |
| Low quality greenspace | 6% |
| Too far from me | 4% |
| Lack of play areas for children | 4% |
| Afraid of not being welcome | 2% |
| Too expensive | 1% |
Some notable differences were observed between groups in terms of the concerns they cited:
- Lack of toilet facilities (18% overall) – more frequently selected by women (20%), people aged 55+ (20%) and people reporting fair or bad health (22%).
- Anti-social behaviour (13% overall) – more frequently selected by people aged 16-34 (16%), people reporting fair or bad health (16%) and residents of the 10% most deprived areas (23%).
- Lack of seating (11% overall) – more frequently selected by people with fair or bad health (16%), people with a limiting long-term illness or disability (16%) and residents of the 10% most deprived areas (18%).
- Lack of lighting (10% overall) – more frequently selected by women (11%) and residents of the 10% most deprived areas (14%).
To further understand attitudes towards local greenspaces respondents were asked to rate their level of agreement with the statements shown in Table 7. The proportion of people agreeing strongly with each of these statements is shown for the total population and for those living in the most and least deprived areas in Scotland.
While a majority of people strongly agreed that their local greenspaces were easy to get to and get around, fewer people agreed that they felt safe to visit, or that they were attractive or welcoming places.
Notably, agreement with each of these positive statements about greenspace quality was lower amongst those living in the most deprived areas, especially in relation to local greenspaces making the area they live in a better place to live, feeling safe to visit or being a good place for young people to play.
| - | Total population | 10% most deprived SIMD | 10% least deprived SIMD |
|---|---|---|---|
| Is easy to get to | 64% | 61% | 70% |
| Is easy to get around | 60% | 57% | 69% |
| Benefits my health and wellbeing | 51% | 44% | 58% |
| Makes the area I live in a better place to live | 51% | 44% | 63% |
| Is a safe place to visit | 48% | 37% | 68% |
| Encourages physical activity | 45% | 39% | 56% |
| Is an attractive place | 45% | 44% | 50% |
| Is somewhere I can relax and unwind | 42% | 42% | 47% |
| Is welcoming | 39% | 39% | 45% |
| Allows me to connect with nature | 38% | 39% | 41% |
| Is a good place for young people to play | 34% | 35% | 45% |
GREEN3. How much do you agree or disagree with the following statements relating to your local greenspace(s)?
Base: Respondents surveyed in July 2023 and January 2024 (n=2,008). Demographic weight applied.
There are clear inequalities in access to greenspace
Given the importance of easy access, respondents were asked how long it would take then to reach their nearest greenspace. Overall, 44% stated that their nearest greenspace was within a 5 minute walk while 24% stated that it would take them between 6 and 10 minutes to walk there and 28% stated it would take them longer than this.
As shown in Figure 12, the percentage of people stating that they were within a 5-minute walk varied across population groups. Those reporting ‘very good health’, those aged 35 to 54, those living in the least deprived areas and those who owned their own home were most likely to state that they lived within a 5-minute walk of their nearest greenspace.
However, in contrast, people aged 16-34, social renters, members of ethnic minorities and residents of the most deprived areas were less likely to live so close to greenspace.
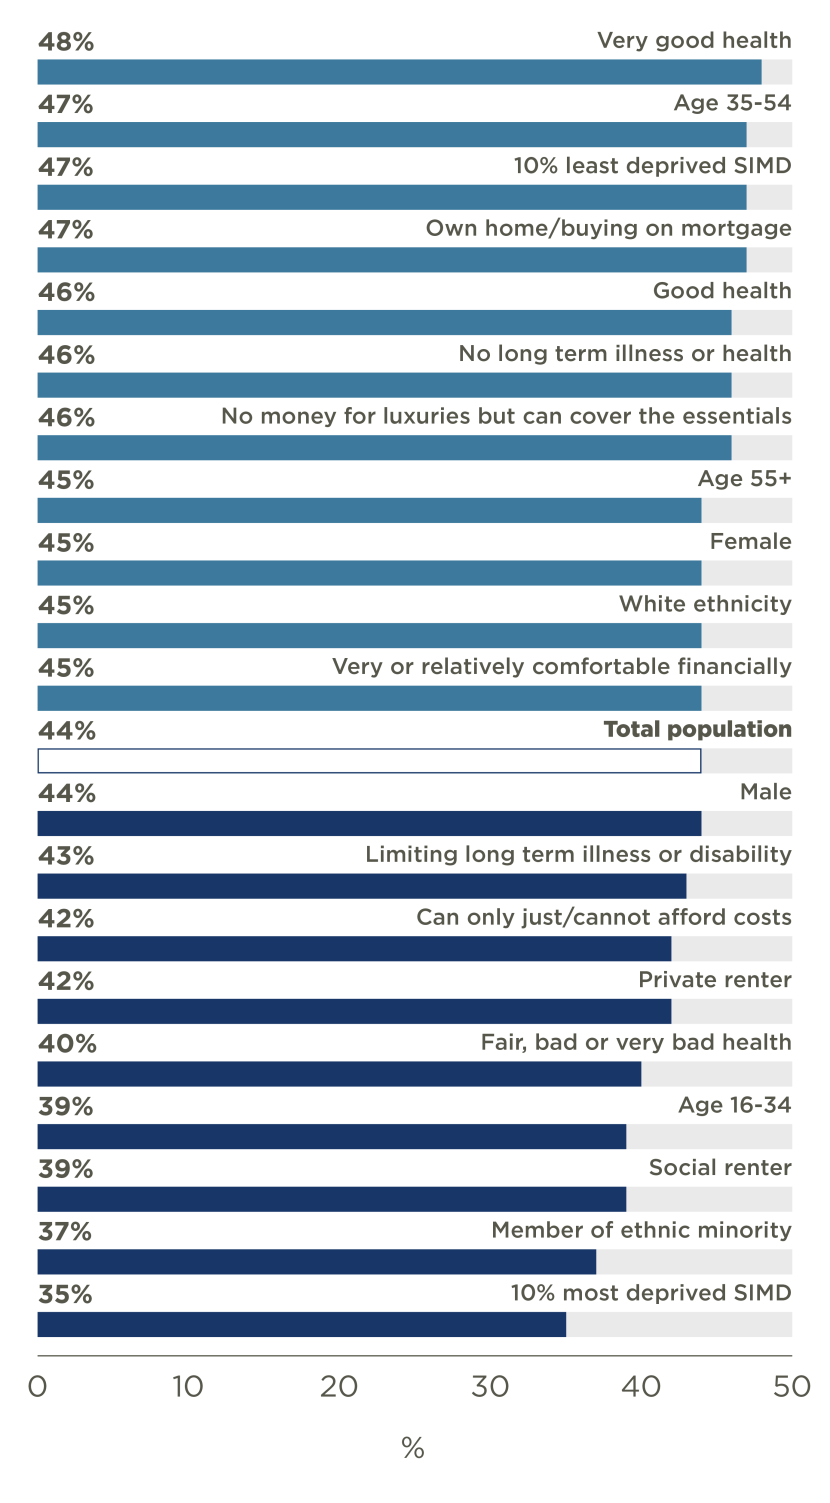
Figure 12. Percentage of population within 5 minute walk of local greenspace(s) at least once a week by key demographics
Click for a full description
GREEN2: How far away from your home is your nearest greenspace area?
Base: All respondents in May and November 2023. Demographic weight applied. Base sizes for all sub-groups are at least 100.
Bar chart illustrating percentages of total population and percentages of a number of key demographic groups reporting that they live within a 5 minute walk of a local greenspace/
Bars are oriented horizontally with demographic groups on the y axis.
The groups are ranked from highest percentage to lowest.
The bar representing the total population is coloured white, bars for groups with levels higher than the total population are blue and bars for those groups with levels lower than the total population are grey.
The data are summarised in the following table:
| Demographic group | Percentage within 5 minute walk of local greenspace |
|---|---|
| Very good health | 48% |
| Age 35-54 | 47% |
| 10% least deprived SIMD | 47% |
| Own home/ buying on mortgage | 47% |
| Good health | 46% |
| No long term illness or health | 46% |
| No money for luxuries but can cover the essentials | 46% |
| Age 55+ | 45% |
| Female | 45% |
| White ethnicity | 45% |
| Very or relatively comfortable financially | 45% |
| TOTAL POPULATION | 44% |
| Male | 44% |
| Limiting long term illness or disability | 43% |
| Can only just/ cannot afford costs | 42% |
| Private renter | 42% |
| Fair, Bad or Very bad health | 40% |
| Age 16-34 | 39% |
| Social renter | 39% |
| Member of ethnic minority | 37% |
| 10% most deprived SIMD | 35% |
While levels of satisfaction with local greenspaces are varied, many people report improvements
Reflecting some of the variations in how different population groups feel about their local greenspaces, when respondents were asked to rate their overall satisfaction (Figure 13), those groups self-reporting very good health and residents of the least deprived areas were most likely to be ‘very satisfied’ while the groups more likely to provide a dissatisfied rating included those reporting fair or bad health, those with the poorest mental health levels, those living in the most deprived areas and those struggling financially.
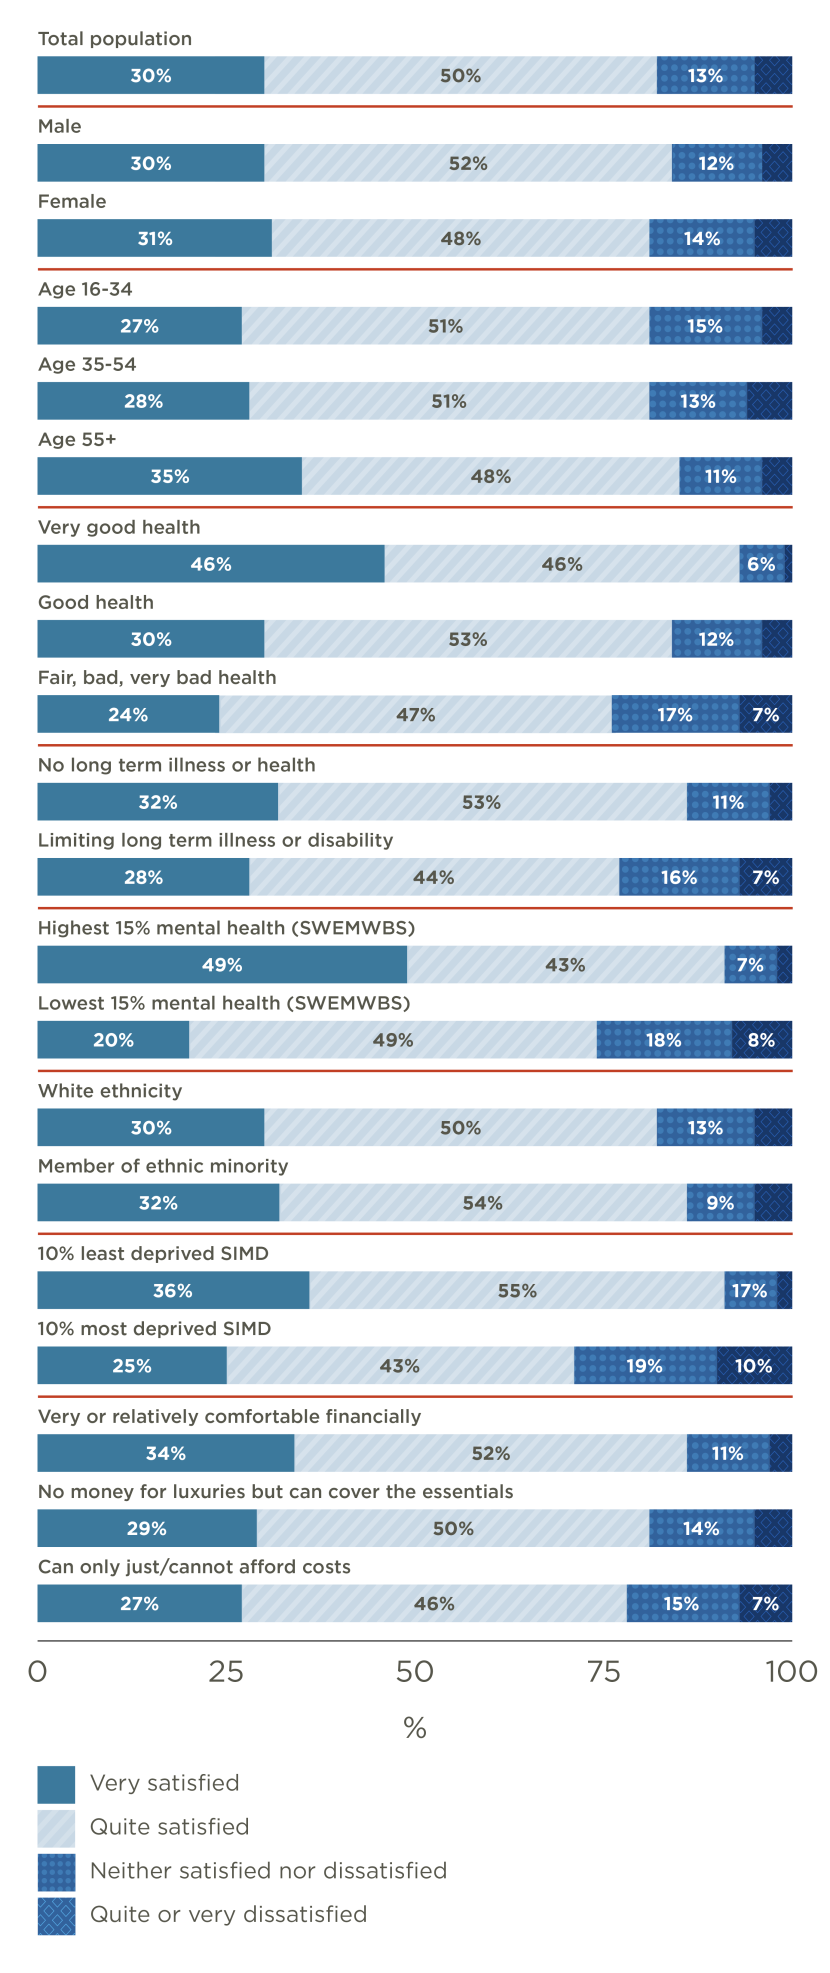
Figure 13. Overall satisfaction with local greenspaces by key population groups
Click for a full description
GREEN5: Overall, how satisfied are you with the quality of your local greenspace(s)?
Base: All respondents taking visits in June, September and December 2023. Base sizes for all sub-groups are at least 200. Visit weight applied.
Stacked bar chart showing levels of satisfaction with local greenspaces for total population and different demographic groups.
Bars are oriented horizontally with labels on y axis. Each bar contains 4 coloured sections to illustrate the percentages very satisfied (grey), quite satisfied (light blue), neither satisfied nor dissatisfied (light blue) and quite or very dissatisfied (dark blue).
The data are summarised in the following table:
| Row % | Very satisfied | Quite satisfied | Neither satisfied nor dissatisfied | Quite or very dissatisfied |
|---|---|---|---|---|
| Total population | 30% | 50% | 13% | 5% |
| Male | 30% | 52% | 12% | 4% |
| Female | 31% | 48% | 14% | 5% |
| Age 16-34 | 27% | 51% | 15% | 4% |
| Age 35-54 | 28% | 51% | 13% | 6% |
| Age 55+ | 35% | 48% | 11% | 4% |
| Very good health | 46% | 46% | 6% | 1% |
| Good health | 30% | 53% | 12% | 4% |
| Fair, Bad or Very bad health | 24% | 47% | 17% | 7% |
| No long term illness or health | 32% | 53% | 11% | 3% |
| Limiting long term illness or disability | 28% | 44% | 16% | 7% |
| Highest 15% mental health (SWEMWBS) | 49% | 43% | 7% | 2% |
| Lowest 15% mental health (SWEMWBS) | 20% | 49% | 18% | 8% |
| White ethnicity | 30% | 50% | 13% | 5% |
| Member of ethnic minority | 32% | 54% | 9% | 5% |
| 10% least deprived SIMD | 36% | 55% | 7% | 2% |
| 10% most deprived SIMD | 25% | 43% | 19% | 10% |
| Very or relatively comfortable financially | 34% | 52% | 11% | 3% |
| No money for luxuries but can cover the essentials | 29% | 50% | 14% | 5% |
| Can only just/ cannot afford costs | 27% | 46% | 15% | 7% |
More positively, when asked how the appeal of greenspaces in their local area had changed during the last 5 years, over a third stated that their local greenspaces had become more appealing (35%) while 11% stated that they had become less appealing – a net difference of +24% (i.e. the percentage stating greenspaces were more appealing minus the percentage stating that they were less appealing). The majority of respondents (54%)stated that their local greenspaces had not changed over this period.
Figure 14 illustrates the net change in appeal of local greenspaces across different population groups with the most positive results amongst members of ethnic minorities and those reporting to be in very good health.
Notably the net change was positive across all population groups (i.e. on balance more people reporting their local greenspaces becoming more appealing than less appealing) but the levels of improvement were smallest amongst those who self-reported poorer health and those who stated that they were struggling with their costs of living.
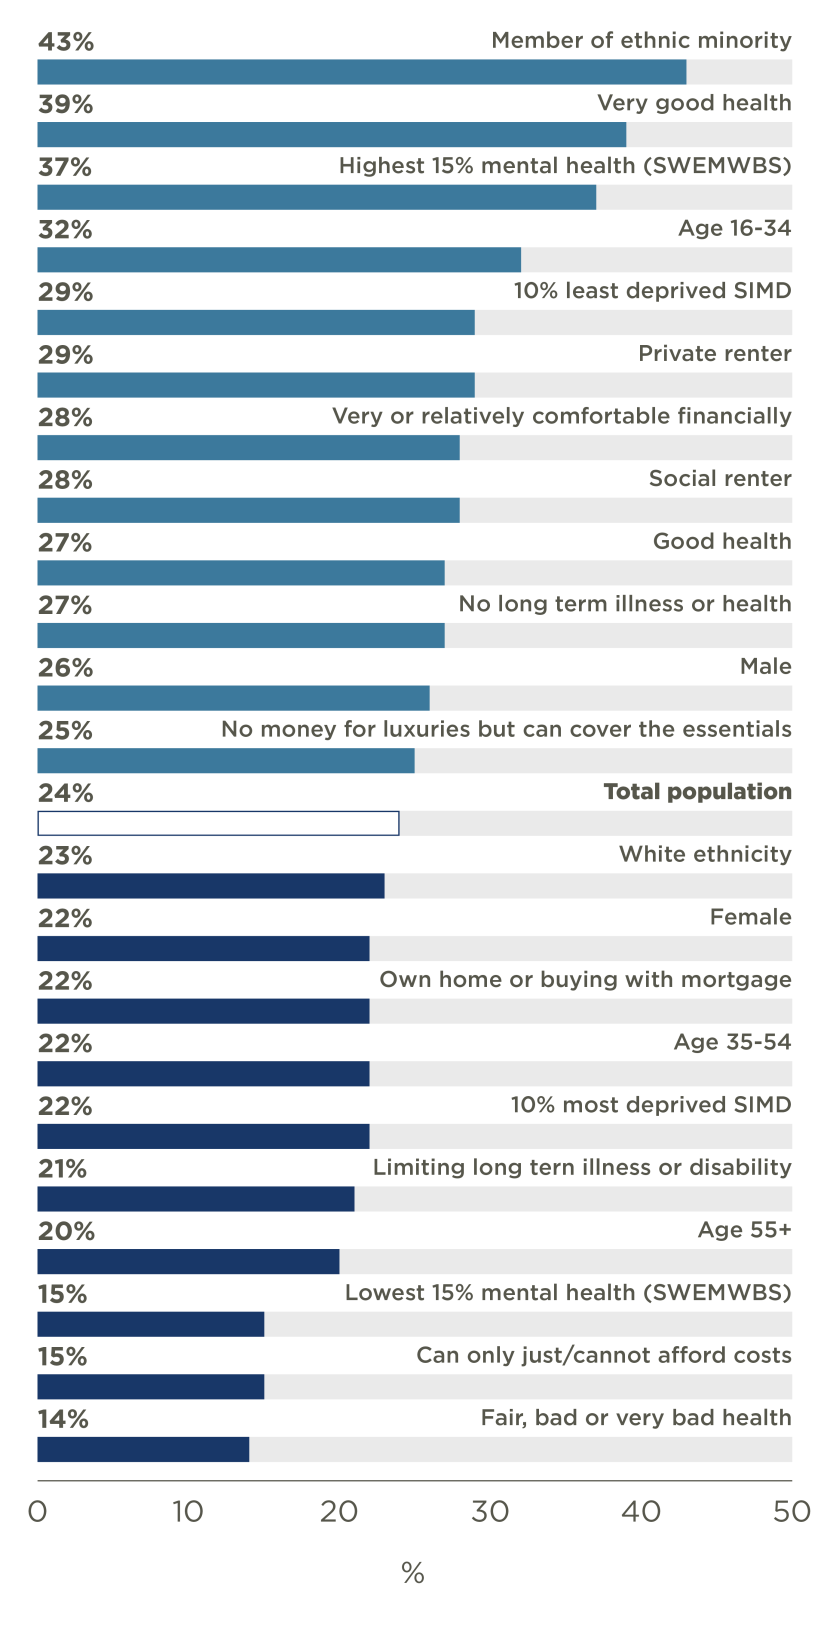
Figure 14. Net change in appeal of local greenspaces during past 5 years by key population groups (% More appealing - % Less appealing)
Click for a full description
GREEN6: During the past 5 years have your local greenspace(s) become any more or less appealing to visit?
Base: All respondents taking visits in June, September and December 2023. Base sizes for all sub-groups are at least 200. Demographic weight applied.
Bar chart illustrating the net change in appeal of local greenspaces for total population and for a number of key demographic groups.
Bars are oriented horizontally with demographic groups on the y axis.
The groups are ranked from highest percentage to lowest.
The bar representing the total population is coloured white, bars for groups with levels higher than the total population are blue and bars for those groups with levels lower than the total population are grey.
The data are summarised in the following table:
| Demographic group | Net change in appeal (% More appealing - % Less appealing) |
|---|---|
| Member of ethnic minority | 43% |
| Very good health | 39% |
| Highest 15% mental health (SWEMWBS) | 37% |
| Age 16-34 | 32% |
| 10% least deprived SIMD | 29% |
| Private renter | 29% |
| Very or relatively comfortable financially | 28% |
| Social renter | 28% |
| Good health | 27% |
| No long term illness or health | 27% |
| Male | 26% |
| No money for luxuries but can cover the essentials | 25% |
| TOTAL POPULATION | 24% |
| White ethnicity | 23% |
| Female | 22% |
| Own home or buying with mortgage | 22% |
| Age 35-54 | 22% |
| 10% most deprived SIMD | 22% |
| Limiting long term illness or disability | 21% |
| Age 55+ | 20% |
| Lowest 15% mental health (SWEMWBS) | 15% |
| Can only just/ cannot afford costs | 15% |
| Fair, Bad or Very bad health | 14% |
Rates of engagement with nature at home reflect inequalities observed for outdoor recreation and usage of greenspaces
Participants were asked about activities in the home that may bring them closer to nature, including gardening or spending time in a garden and observing wildlife. Variations in participation levels in these activities among different population groups were similar to variations observed for outdoor recreation behaviour.
Overall, 69% had enjoyed nature by spending time in a garden or by gardening and 53% had enjoyed nature or wildlife from indoors (e.g. through a window). As shown in Figures 15 and 16, both gardening and observing wildlife were more likely to be undertaken by those who considered themselves to be financially comfortable, residents of the least deprived areas and people reporting good health.
In contrast, people struggling with their finances, those reporting poor health and residents of the most deprived areas were less likely to undertake these activities.
It is also notable that those people who visited the outdoors for recreation most often were significantly more likely than those who visited less frequently to also enjoy these activities.
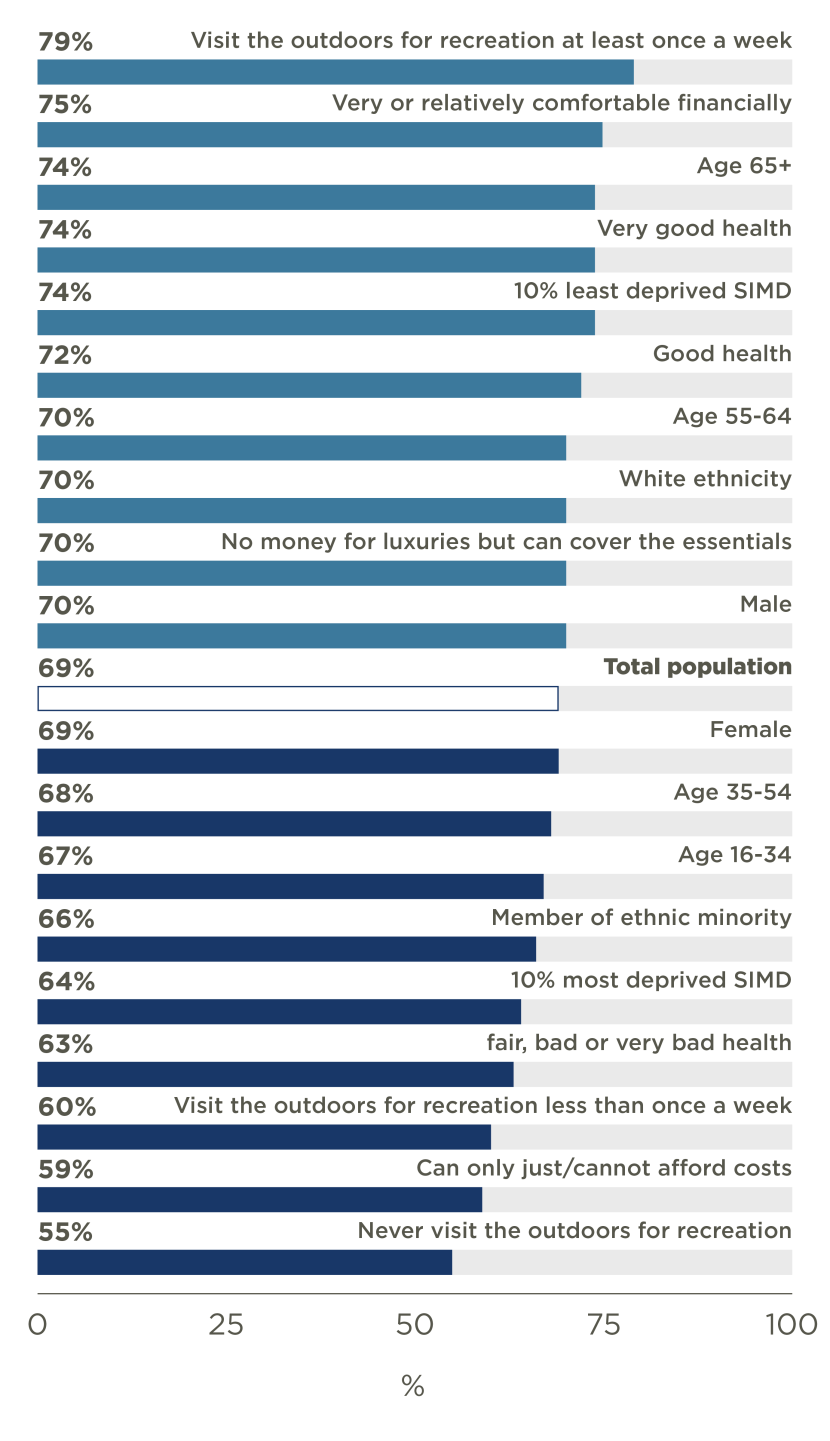
Figure 15. Percentage that enjoy nature by spending time in garden or gardening
Click for a full description
REC19. During PRECEEDING MONTH which of the following activities did you take part in either at home or out of your home? All respondents who selected ‘Enjoying nature or wildlife in a garden or other outdoor space attached to my home’, ‘Sitting or relaxing in a garden or other outdoor space attached my home’ or ‘Gardening, sowing seeds, growing flowers or vegetables or planting trees’.
Base: All respondents surveyed in April, June, September, October or December 2023 or February 2024. Demographic weight applied. Base sizes for all sub-groups are at least 350.
Bar chart illustrating percentages of total population and percentages of a number of key demographic groups that enjoy nature by spending time in their garden or by gardening.
Bars are oriented horizontally with demographic groups on the y axis.
The groups are ranked from highest percentage to lowest.
The bar representing the total population is coloured white, bars for groups with levels higher than the total population are blue and bars for those groups with levels lower than the total population are grey.
The data are summarised in the following table:
| Demographic group | Percentage that enjoy nature by spending time in garden or gardening |
|---|---|
| Visit the outdoors for recreation at least once a week | 79% |
| Very or relatively comfortable financially | 75% |
| Age 65+ | 74% |
| Very good health | 74% |
| 10% least deprived SIMD | 74% |
| Good health | 72% |
| Age 55-64 | 70% |
| White ethnicity | 70% |
| No money for luxuries but can cover the essentials | 70% |
| Male | 70% |
| TOTAL POPULATION | 69% |
| Female | 69% |
| Age 35-54 | 68% |
| Age 16-34 | 67% |
| Member of ethnic minority | 66% |
| 10% most deprived SIMD | 64% |
| Fair, Bad or Very bad health | 63% |
| Visit the outdoors for recreation less than once a week | 60% |
| Can only just/ cannot afford costs | 59% |
| Never visit the outdoors for recreation | 55% |
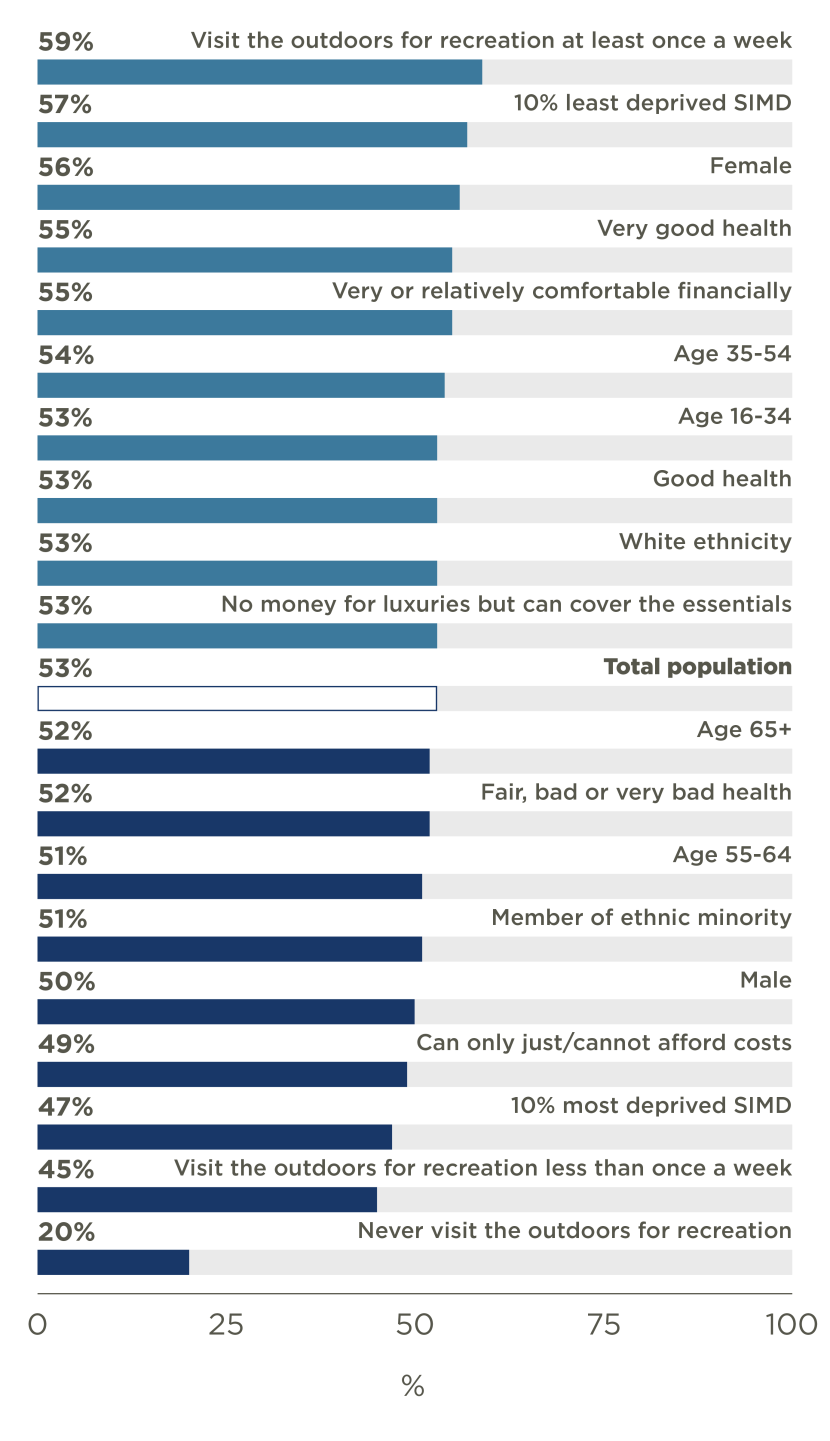
Figure 16. Percentage that enjoy nature or wildlife from indoors (e.g. through a window)
Click for a full description
REC19. During PRECEEDING MONTH which of the following activities did you take part in either at home or out of your home? All respondents who selected 'Enjoying nature or wildlife from indoors (e.g. through a window)’.
Base: All respondents surveyed in April, June, September, October or December 2023 or February 2024. Demographic weight applied. Base sizes for all sub-groups are at least 350.
Bar chart illustrating percentages of total population and percentages of a number of key demographic groups that enjoy nature or wildlife from indoors.
Bars are oriented horizontally with demographic groups on the y axis.
The groups are ranked from highest percentage to lowest.
The bar representing the total population is coloured white, bars for groups with levels higher than the total population are blue and bars for those groups with levels lower than the total population are grey.
The data are summarised in the following table:
| Demographic group | Percentage that enjoy nature or wildlife from indoors (e.g. through a window) |
|---|---|
| Visit the outdoors for recreation at least once a week | 59% |
| 10% least deprived SIMD | 57% |
| Female | 56% |
| Very good health | 55% |
| Very or relatively comfortable financially | 55% |
| Age 35-54 | 54% |
| Age 16-34 | 53% |
| Good health | 53% |
| White ethnicity | 53% |
| No money for luxuries but can cover the essentials | 53% |
| Total population | 53% |
| Age 65+ | 52% |
| Fair, Bad or Very bad health | 52% |
| Age 55-64 | 51% |
| Member of ethnic minority | 51% |
| Male | 50% |
| Can only just/ cannot afford costs | 49% |
| 10% most deprived SIMD | 47% |
| Visit the outdoors for recreation less than once a week | 45% |
| Never visit the outdoors for recreation | 20% |