NatureScot Research Report 1361 - SPANS Scotland’s People and Nature Survey 2023/24 - headline report
Published: 2024
Authors: Duncan Stewart and Jim Eccleston (56 Degree Insight)
Cite as: Stewart, D. and Eccleston, J. 2024. SPANS Scotland’s People and Nature Survey 2023/24 - headline report. NatureScot Research Report 1361.
What is SPANS?
Scotland’s People and Nature Survey (SPANS) is a large-scale population survey that provides detailed data on how adults in Scotland use, value, and enjoy the outdoors and connect with nature. SPANS data allow NatureScot to monitor key trends over the long-term and produce statistically robust insights.
The core research objectives for SPANS are to deliver strong quantitative evidence in relation to the following key areas:
- Visits to the outdoors for leisure and recreation;
- Recreational use of and attitudes towards urban greenspace;
- Connection to nature;
- Benefits of engagement with the natural environment;
- Environmental attitudes and behaviours.
Headline report
This report provides key findings from SPANS 2023/24 which covers a 12-month period from March 2023 to February 2024. The 2023/24 survey followed on from previous waves of SPANS which ran on a triennial basis between 2012 and 2019.
SPANS 2023/24 was delivered with support from our contributing partners: Scottish Forestry, Sustrans, Cairngorm National Park Authority, and Loch Lomond & the Trossachs National Park Authority.
This report covers headline findings from SPANS 2023/24. A suite of other reports with a focus on specific areas of interest have also been produced using data from SPANS 2023/24:
- Headline report
- Outdoor recreation
- Health and wellbeing
- Connection to nature
- Equality and diversity
- Technical report
- Data downloads
Survey method
SPANS 2023-2024 used an online survey approach to provide robust coverage of the Scottish adult population aged 16 and over. To compile the data, twelve monthly survey waves were undertaken between April 2023 and March 2024, consisting of at least 1,000 survey completions per month.
Fieldwork was undertaken using the Prodege online consumer panel. Panel members go through a robust quality control process before they can join the panel and are then invited to take part in surveys in return for reward points.
Each month a sub-set of the Scottish panel was invited to take part in SPANS, targeted based on their demographics and place of residence. Sampling quotas were used to produce a representative distribution across gender, age, social grade and place of residence.
Questionnaire design involved a modular approach to ensure coverage of a wide range of topics of interest over the 12 survey waves. As such, while certain questions were included in every monthly wave, others were asked every other month, quarterly, or less often.
Further details on the survey methods used are provided in the SPANS technical report.
Comparability with previous surveys
The online survey approach taken in the 2023/24 differs from that used in previous waves of SPANS, where a face-to-face interviewing method was employed. This change of method was made for several reasons, including future-proofing the survey against declining response rates and rising costs of in-person surveying.
There can be small differences in the way people answer survey questions online as opposed to in-person. Variations in results between SPANS 2023/24 and previous waves (even when the wording of questions is kept consistent) may partly be influenced by methodological changes as well as changes in attitudes or behaviour at a population level. As a result, caution should be exercised when making comparisons with past SPANS results, and figures from the present survey should not be considered part of a continuous time series. SPANS 2023/24 forms a new baseline for comparisons with subsequent survey waves.
Further details on the potential impacts of these changes are provided in the SPANS technical report.
How often does the Scottish population spend time enjoying the outdoors?
Most people visit the outdoors at least once week
61% of people in Scotland normally visit the outdoors for leisure or recreation at least once a week, including 17% who typically visit every day.
Figure 1 shows the distribution of visit frequency among the adult population. The results show a minority of people visiting much less frequently than once a week, including 8% having made only one or two visits in the previous 12 months. 5% of people make no visits to the outdoors.
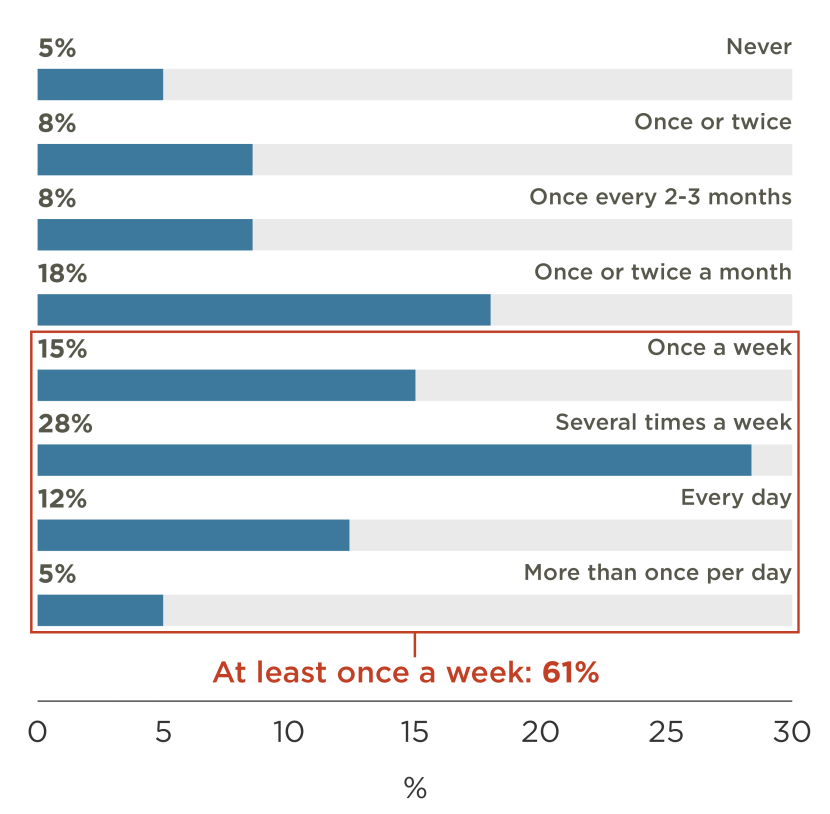
Figure 1. Frequency of outdoor recreation visits in the outdoors in the last 12 months
Click for a full description
REC 1 - How often on average have you taken visits to the outdoors for leisure and recreation in Scotland in the last 12 months?
Base: All respondents (n=12,053). Demographic weight applied. Figures rounded to nearest whole number.
Bar chart illustrating frequency of outdoor recreation visits in the last 12 months. The bars are oriented horizontally with answer categories on the y axis ranging from Never to More than once per day. The total taking visits at least once a week is also provided in a heading to the right of the chart with overall 61% took visits at this level of frequency. The data are summarised in the following table:
| Frequency of outdoor visits | Percentage |
|---|---|
Never Once or twice Once every 2-3 months Once or twice a month Once a week Several times a week Every day More than once per day | 5% 8% 8% 18% 15% 28% 12% 5% |
Visit frequency varies by affluence, deprivation, health and ethnicity
The proportion of people visiting the outdoors frequently (at least once a week) varies between population groups. The most significant variations relate to levels of affluence and deprivation, as well as by health, and ethnicity. People living in the most deprived areas, as defined by Scottish Index of Multiple Deprivation (SIMD) deciles, were twenty-one percentage points less likely to visit the outdoors frequently than people living in the least deprived areas. Dog ownership also has a large influence over visit frequency: people who own or look after one or more dogs are seventeen percentage points more likely to visit the outdoors frequently than people who do not own or look after any dogs. Figure 2 shows the percentage of people within different population groups who visit the outdoors at least once a week.
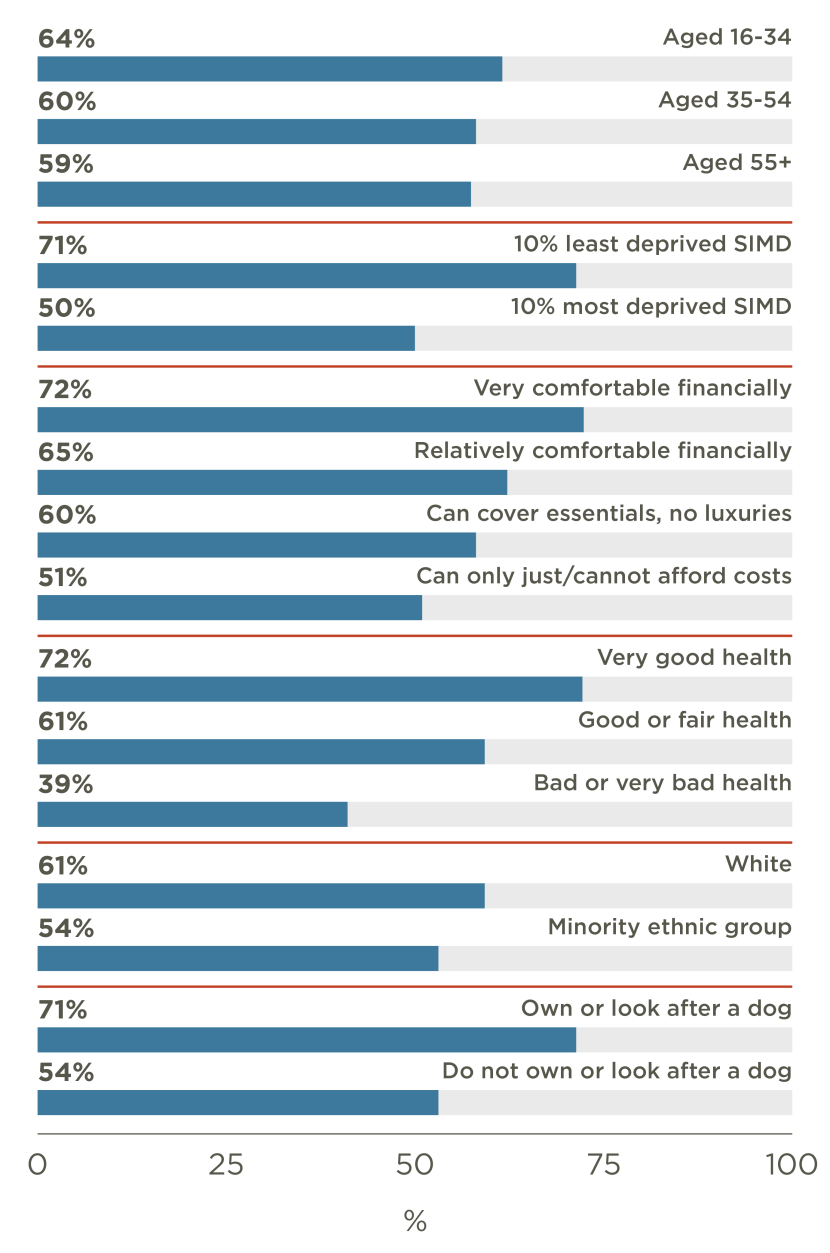
Figure 2. Proportion of population visiting outdoors at least once a week in last 12 months by key demographic groups
Click for a full description
REC 1 - How often on average have you taken visits to the outdoors for leisure and recreation in Scotland in the last 12 months?
Base: All respondents (n=12,053). Demographic weight applied. Figures rounded to nearest whole number.
Bar chart illustrating percentages of the population in different demographic groups that visited the outdoors at least once a week during the last 12 months.
The bars are oriented horizontally with demographic groups on the y axis based on age, the Scottish Index of Multiple Deprivation (SIMD), financial comfort, health status, ethnicity and dog ownership.
The data are summarised in the following table:
| Population group | Proportion visiting outdoors at least once a week in last 12 months |
|---|---|
| Aged 16-34 | 64% |
| Aged 35-54 | 60% |
| Aged 55+ | 59% |
| 10% least deprived SIMD | 71% |
| 10% most deprived SIMD | 50% |
| Very comfortable financially | 72% |
| Relatively comfortable financially | 65% |
| No money for luxuries, can cover essentials | 60% |
| Can only just/ cannot afford costs | 51% |
| Very good health | 72% |
| Good or fair health | 61% |
| Bad or very bad health | 39% |
| White | 61% |
| Minority ethnic group | 54% |
| Own or look after a dog | 71% |
| Do not own or look after a dog | 54% |
Frequency of visits to the outdoors is closely related to nature connectedness
SPANS 2023/24 introduces the Nature Connectedness Index (NCI), a consistent set of questions that combine to produce a single score indicating how closely a person feels to nature (see Richardson et al. 2019). The NCI questions and associated method are covered in the SPANS technical report.
Over the 12-month survey period, the average recorded NCI score was 59. When comparing levels of nature connectedness with visit frequency, we see that levels of connection are higher, on average, among people who visited the outdoors more often, as Figure 3 shows.
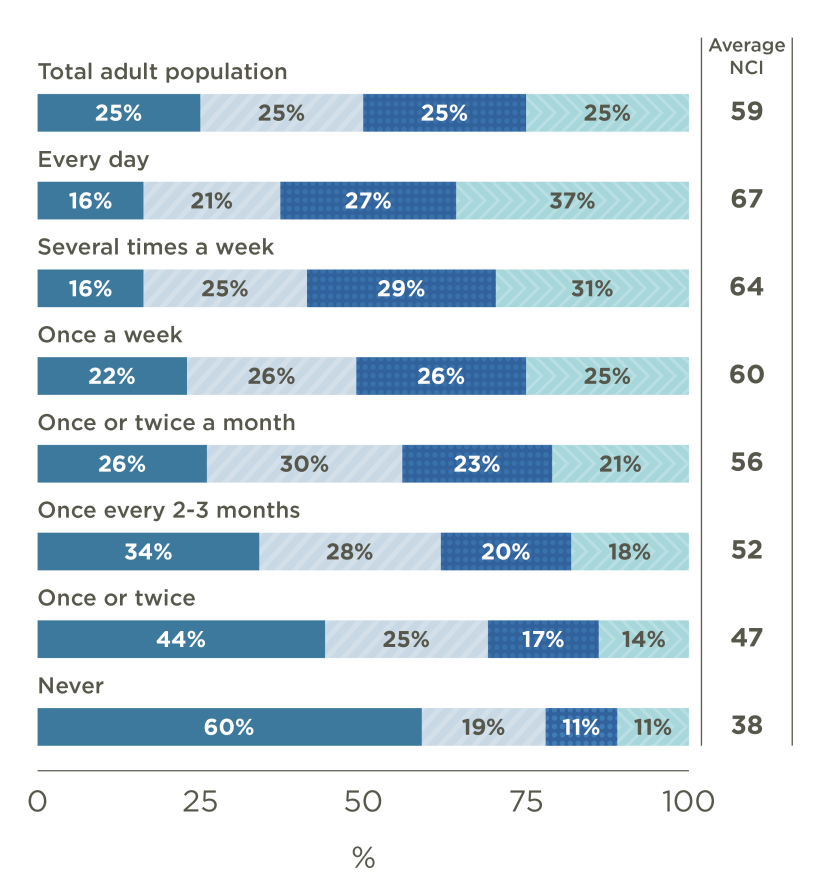
Figure 3. Nature Connection Index by frequency of visits to the outdoors
Click for a full description
Base: All respondents (n=12,053). Demographic weight applied. Figures rounded to nearest whole number.
100% stacked bar chart showing the Nature Connection Index quartile distribution amongst the total adult population and amongst sub-groups of the population segmented on the basis of their frequency of outdoor recreation visits in the last 12 months.
Bars are oriented horizontally, with the total adult population at the top and each level of frequency listed on the y axis ordered from Every Day to Never. The bars are segmented into different colours according to the percentage in each quartile, ranging from the Lowest quartile (0-34 NCI) in light grey to Second quartile (35-48 NCI) in dark grey to Third quartile (61-78 NCI) in light blue to the Highest quartile (84 – 100 NCI) in dark blue.
The average NCI for the total adult population and for each of the groups are also shown on the right of the chart.
The data are summarised in the following table:
| Frequency of outdoor visits | Lowest quartile | Second quartile | Third quartile | Highest quartile | Average NCI |
|---|---|---|---|---|---|
| Total adult population | 25% | 25% | 25% | 25% | 59 |
| Every day | 16% | 21% | 27% | 37% | 67 |
| Several times a week | 16% | 25% | 29% | 31% | 64 |
| Once a week | 22% | 26% | 26% | 25% | 60 |
| Once or twice a month | 26% | 30% | 23% | 21% | 56 |
| Once every 2-3 months | 34% | 28% | 20% | 18% | 52 |
| Once or twice | 44% | 25% | 17% | 14% | 47 |
| Never | 60% | 19% | 11% | 11% | 38 |
Scotland’s adult population took over 611 million visits to the outdoors for leisure during the 12-month survey period
By asking participants about how frequently they visited the outdoors in the previous month, it is possible to estimate the total number of visits taken by the adult population over the full 12-month fieldwork period. On average, 134 visits (of any duration) were taken per adult over this period. By applying this year-long average to the latest Scottish adult population projection of 4.6 million adults aged over sixteen (using NRS mid-year estimates) we can estimate that around 611 million visits were taken.
Figure 4 shows the average number of visits taken per person each month, along with the total number of visits taken by the whole population. The highest visit frequency was recorded during the summer months, peaking in September at 13.2 visits per person (60 million total). As might be expected, the lowest visit frequencies were taken in December, January, and February.
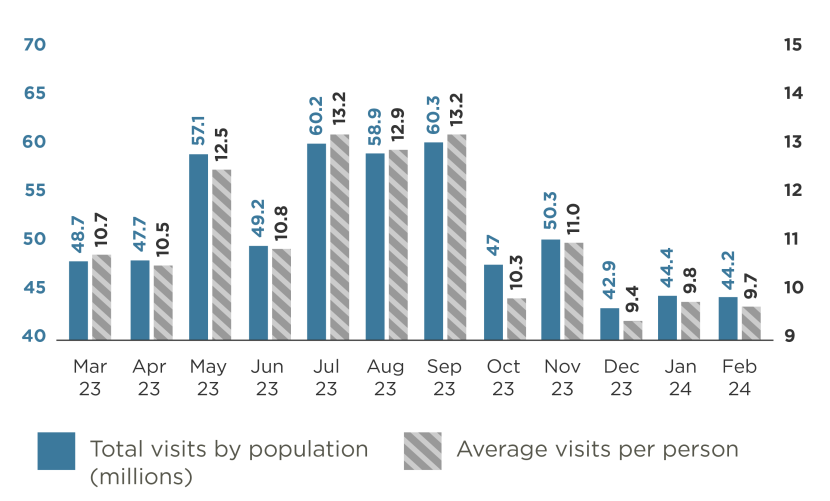
Figure 4. Average monthly volume of visits to the outdoors per adult and estimated total volume of visits to the outdoors amongst total population
Click for a full description
REC4 - How many visits to the outdoors for leisure and recreation in Scotland did you make during [PRECEEDING MONTH]?
Base: All respondents (n=12,053). Demographic weight applied. Grossed estimates use population data. Figures rounded to nearest decimal place.
Bar chart with two scales. The first uses grey horizontal bars to illustrate the total number of outdoor visits in millions taken by the total population each month from March 2023 to February 2023. The second uses blue horizontal bars to illustrate the average number of visits taken per person during the same months.
The data are summarised in the following table:
Month | Total visits by population (millions) | Average visits per person |
|---|---|---|
Mar-23 | 48.7 | 10.7 |
Apr-23 | 47.7 | 10.5 |
May-23 | 57.1 | 12.5 |
Jun-23 | 49.2 | 10.8 |
Jul-23 | 60.2 | 13.2 |
Aug-23 | 58.9 | 12.9 |
Sep-23 | 60.3 | 13.2 |
Oct-23 | 47.0 | 10.3 |
Nov-23 | 50.3 | 11.0 |
Dec-23 | 42.9 | 9.4 |
Jan-24 | 44.4 | 9.8 |
Feb-24 | 44.2 | 9.7 |
Time spent visiting the outdoors varies, from quick trips to longer active days out
Participants were asked how long they spent on their most recent visit to the outdoors, including travel time. Visit durations varied considerably. While one in six visits lasted less than an hour (17%), around a tenth of visits lasted for more than five hours (11%).
The average visit lasted for 2 hours and 39 minutes, although this varied by type of place visited and activity undertaken. Around half of people’s most recent visit lasted for less than two hours. On average, visits taken to urban greenspaces and those taken with a dog were shortest (averaging around 2 hours 15 mins) while those taken to hills and mountains, and those involving rock climbing or water sports, lasted longest (averaging around 4 hours). More detail on specific activities is provided in the SPANS outdoor recreation report.
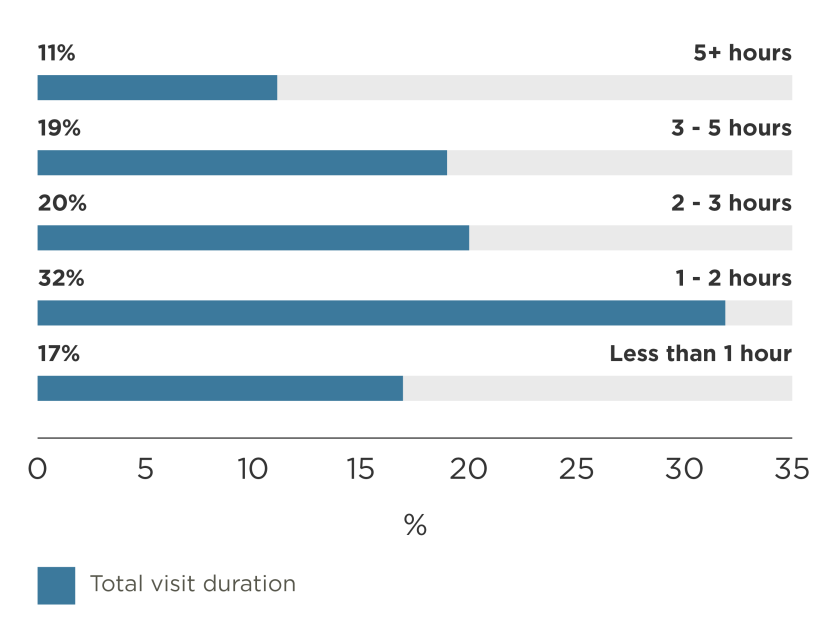
Figure 5. Duration of outdoor visits
Click for a full description
REC13 - How long was the [most recent] visit, in terms of time - that is the total time spent, including travel time to and from the destination?
Base: Respondents surveyed in June, September December 2023 or March 2024 who took visits in previous month (n=3,481). Visit weight applied. Figures rounded to nearest whole number.
Bar chart illustrating percentages of visits in different duration bands.
The bars are oriented horizontally with the 5 duration bands on the y axis ranging from 5+ hours to less than 1 hour.
The data are summarised in the following table:
| Duration | Percentage of visits |
|---|---|
| Less than 1 hour | 17% |
| 1 to 2 hours | 32% |
| 2 to 3 hours | 20% |
| 3 to 5 hours | 19% |
| 5+ hours | 11% |
Where do people spend their time during visits to the outdoors?
Urban parks and greenspaces are significant locations for outdoor recreation
Just over half of visits to the outdoors for recreation (53%) took places in areas described by participants as being in the countryside (including inland villages). Around a quarter of visits took place within a town or city (27%), and the remaining proportion (20%) were to the coast (including seaside resorts, beaches, cliffs, etc).
Places in towns and cities were more likely to be included in visits taken by people aged 16 to 34 (32%), members of ethnic minorities (33%) and residents of the 10% most deprived areas (43%).
Places in the countryside were more likely to be included in visits taken by people with white ethnicity (53% compared to 39% taken by members of ethnic minorities) and dog owners (56%) while seaside destinations were more likely to be visited by people with children aged between 5 and 18 (28%).
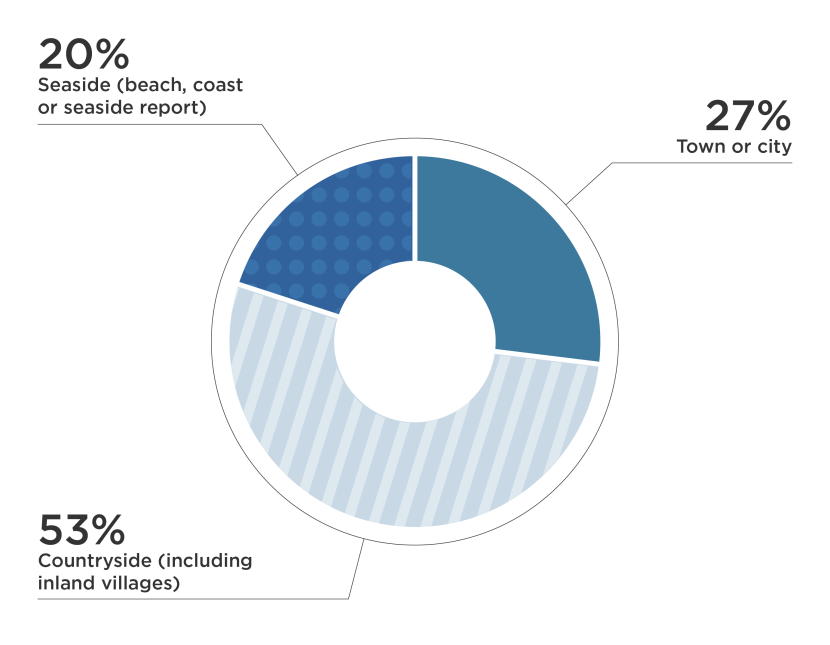
Figure 6. Location of outdoor visits
Click for a full description
REC8 - Still thinking about your last visit to the outdoors for leisure and recreation during [PRECEEDING MONTH], which of these places best describes where you went?
Base: Respondents surveyed in April, June, August, October, December 2023 or February 2024 who took visits in previous month (n=5,325). Visit weight applied. Figures rounded to nearest whole number.
Pie chart illustrating percentages of visits taken to different types of location.
The segments of the pie chart cover three groups – the seaside, town or city and the countryside with percentages summing to 100%.
The data are summarised in the following table:
| Location | Percentage of visits |
|---|---|
| A town or city | 27% |
| The countryside (including inland villages) | 53% |
| The seaside (e.g. a beach, coast, seaside resort) | 20% |
Looking in more detail at the specific types of locations visited, the largest proportions of visits overall included time in a park or other greenspace in an urban area (41% of visits). Woodland/ forest were also frequently visited (39%). Notably, as Table 1 shows, while most visits taken in town and city locations were to a park or other similar urban greenspaces, woodland and river locations were also frequently visited.
| Type of location visited | Overall | A town or city | The countryside (including inland villages) | The seaside (e.g. a beach, the coast, a seaside resort, etc) |
|---|---|---|---|---|
| A park or other open greenspace in an urban area | 41% | 75% | 30% | 22% |
| Woodland/forest | 39% | 21% | 58% | 15% |
| Beach | 21% | 7% | 7% | 77% |
| River | 17% | 15% | 20% | 11% |
| Village | 15% | 8% | 19% | 13% |
| Wildlife area/nature reserve | 11% | 6% | 14% | 11% |
| Farmland | 11% | 3% | 18% | 5% |
| Sea/Sea loch | 11% | 4% | 4% | 36% |
| Mountain/hill | 11% | 3% | 16% | 5% |
| Inland loch/reservoir | 9% | 4% | 14% | 4% |
| Canal | 6% | 10% | 6% | 2% |
| Moorland | 3% | 1% | 5% | 1% |
| Cliff | 2% | 1% | 1% | 7% |
| Other | 3% | 5% | 3% | 1% |
REC 9 - On this [most recent] visit to the outdoors for leisure and recreation, which of the following types of location or destination did you go to?
Base: Respondents surveyed in April, June, August, October, December 2023 or February 2024 who took visits in previous month (Overall n=5,335, Town and city visits n=1,572, Countryside visits n=2,605, Seaside visits n=1,148). Visit weight applied. Figures rounded to nearest whole number.
Most people visit or pass through their local greenspace at least once a week
SPANS data underlines the importance of local greenspaces: 96% of people stated that they had either visited or passed through (e.g. on their way to work or shops) their local greenspace areas at least once during the last 12 months, with 70% normally doing so at least once a week.
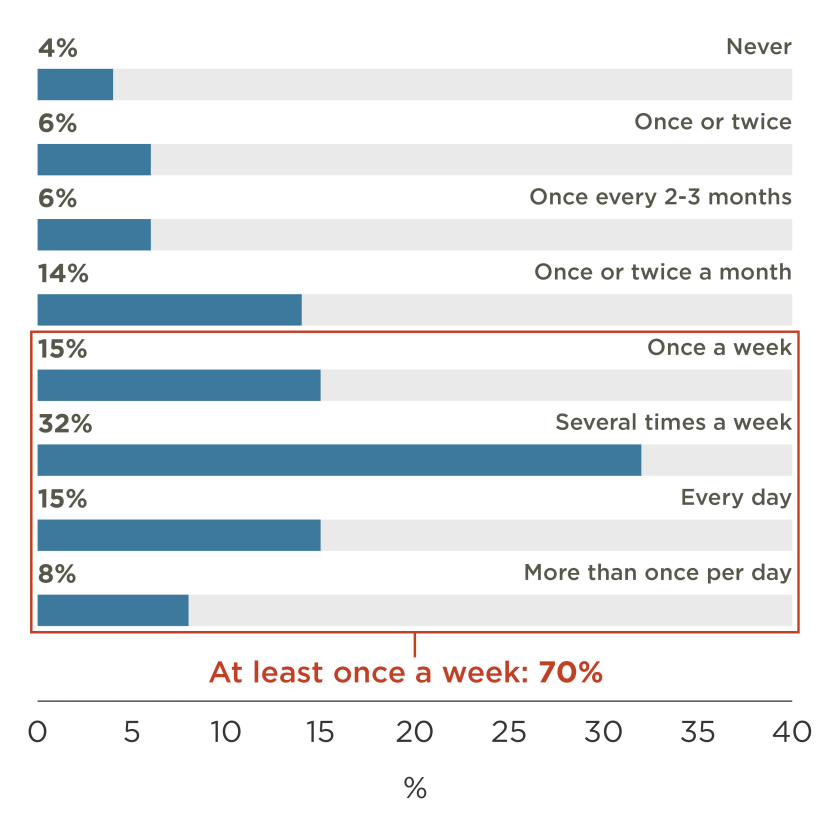
Figure 7. Frequency of visiting or passing through local greenspace in the last 12 months
Click for a full description
GREEN 1 - In the last 12 months, how often on average have you visited or passed through your local greenspace areas?
Base: Respondents surveyed in May, August, November 2023 or February 2024 (n=4,020). Demographic weight applied.
Bar chart illustrating frequency of use of local greenspaces in the last 12 months. The bars are oriented horizontally with answer categories on the y axis ranging from Never to More than once per day. The total using local greenspaces at least once a week are also provided in a heading to the right of the chart - overall 70% took visits at this level of frequency. The data are summarised in the following table:
| Frequency of local greenspace usage | Percentage |
|---|---|
Never Once or twice Once every 2-3 months Once or twice a month Once a week Several times a week Every day More than once per day | 4% 6% 6% 14% 15% 32% 15% 8% |
Frequency of visits to greenspaces is highest amongst those who have easiest access and are most satisfied with their local provision
How frequently people use their local greenspaces varies in relation to the perceived accessibility and quality of those spaces. People living within a short walk and those who were most satisfied with their local greenspaces used their greenspaces most often, as Figure 8 shows. More than double the proportion of people living within five minutes’ walk of their local greenspace used it at least once a week, compared with people living more than half an hour away.
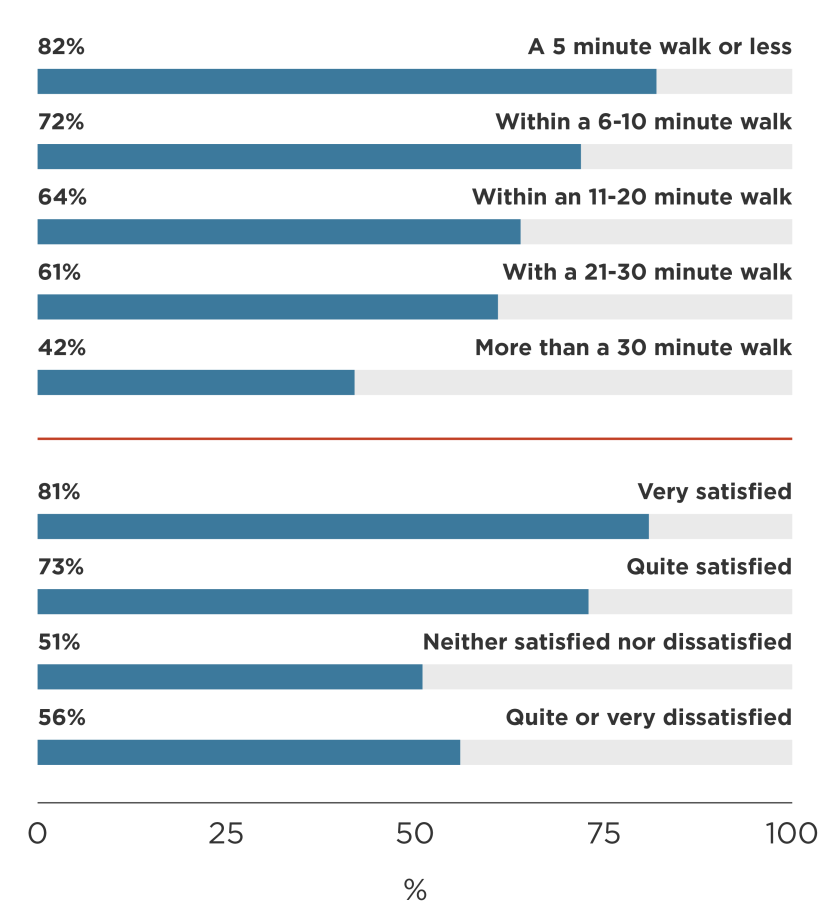
Figure 8. Proportion of population visiting or passing through local greenspaces at least once a week in last 12 months by walking duration and satisfaction with quality with nearest local greenspace
Click for a full description
GREEN 1 - In the last 12 months, how often on average have you visited or passed through your local greenspace areas?
Base: Respondents surveyed in May, August, November 2023 or February 2024 (n=4,020). Demographic weight applied. Figures rounded to nearest whole number.
Bar chart illustrating percentages of the population using local greenspaces at least weekly with the results shown for those living in within different walking durations and amongst those with different levels of satisfaction with their local greenspace.
The bars are oriented horizontally with waking duration shown in 5 bands and satisfaction levels in 4 groups, ranging from very satisfied to quite or very dissatisfied on the y axis.
The data are summarised in the following table:
| Population group | Proportion using local greeenspace at least once a week in last 12 months |
|---|---|
Live within a 5 minute walk or less to greenspace Live within a 6-10 minute walk to greenspace Live within a 11-20 minute walk to greenspace Live within a 21-30 minute walk to greenspace Live more than a 30 minute walk to greenspace | 82% 72% 64% 61% 42% |
Very satisfied with local greenspace Quite satisfied with local greenspace Neither satisfied nor dissatisfied with local greenspace Quite or very dissatisfied with local greenspace | 81% 73% 51% 56% |
Frequent use of local greenspace (at least once a week) was also highest amongst younger people, people with good health, more affluent people, and dog owners, as Figure 9 shows.
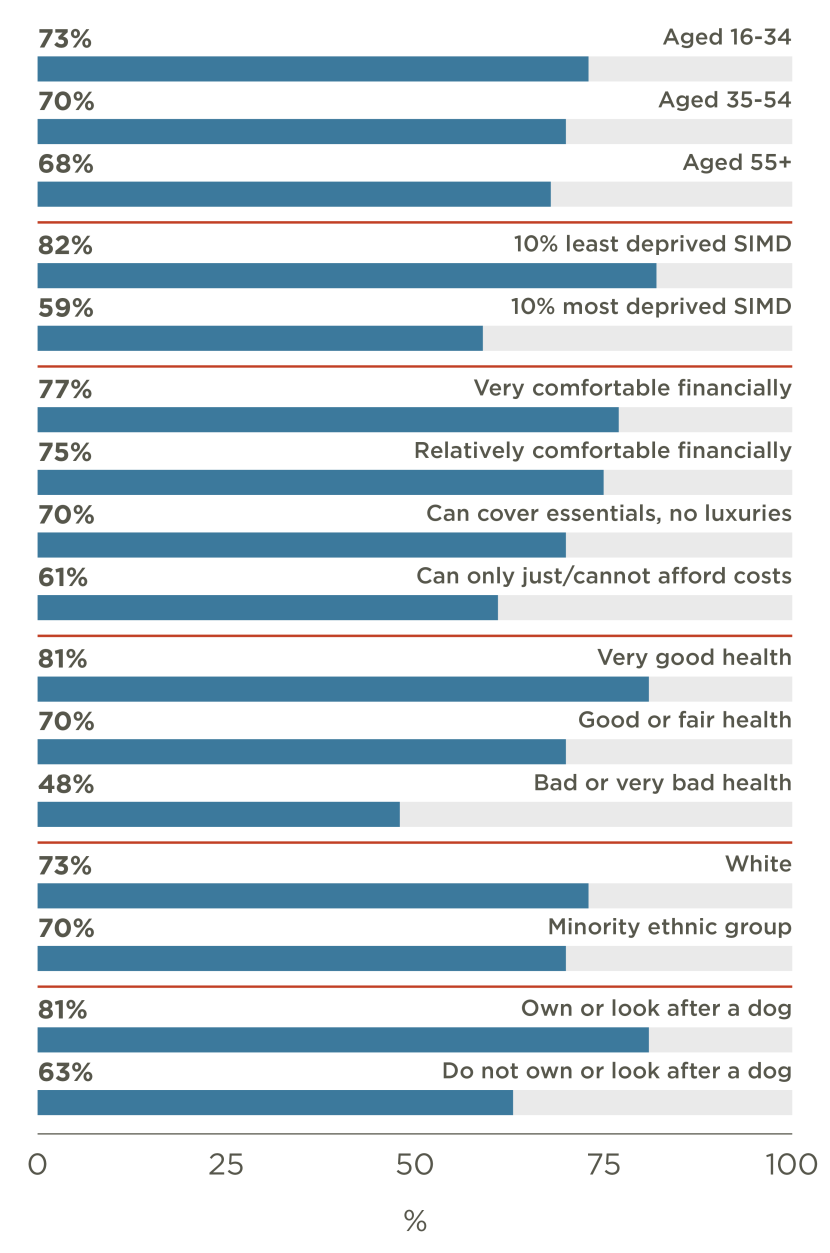
Figure 9. Proportion of population visiting or passing through local greenspaces at least once a week in last 12 months by key demographic groups
Click for a full description
GREEN 1 - In the last 12 months, how often on average have you visited or passed through your local greenspace areas?
Base: Respondents surveyed in May, August, November 2023 or February 2024 (n=4,020). Demographic weight applied. Figures rounded to nearest whole number.
Bar chart illustrating percentages of the population in different demographic groups stating they used their local greenspace at least once a week during the last 12 months.
The bars are oriented horizontally with demographic groups on the y axis based on age, the Scottish Index of Multiple Deprivation (SIMD), financial comfort, health status, ethnicity and dog ownership.
The data are summarised in the following table:
| Population group | Proportion using local greeenspace at least once a week in last 12 months |
|---|---|
| Aged 16-34 | 73% |
| Aged 35-54 | 70% |
| Aged 55+ | 68% |
| 10% least deprived SIMD | 82% |
| 10% most deprived SIMD | 59% |
| Very comfortable financially | 77% |
| Relatively comfortable financially | 75% |
| No money for luxuries, can cover essentials | 70% |
| Can only just/ cannot afford costs | 61% |
| Very good health | 81% |
| Good or fair health | 70% |
| Bad or very bad health | 48% |
| White | 73% |
| Minority ethnic group | 70% |
| Own or look after a dog | 81% |
| Do not own or look after a dog | 63% |
What can SPANS tell us about changing levels of participation in outdoor visits?
Levels of participation appear to have returned to pre-pandemic levels
The change in SPANS survey method from face-to-face interviews between 2006 and 2020 to the current online approach means that caution must be taken when comparing results. As such, 2023/24 should be considered a new baseline for SPANS. These changes are discussed in greater detail in the SPANS technical report.
The section below provides an analysis of key data from SPANS and its antecedents since 2006 to help us understand the trends in participation levels over recent decades.
Figure 10 shows the percentage of the population claiming to visit the outdoors at all in each survey, along with the net figure for those visiting at least once a week. Results are shown for the Scottish Recreation Survey and SPANS face-to-face surveys undertaken between 2006 and 2020, for the three online surveys undertaken by NatureScot during the Covid-19 pandemic (including ‘lockdown’ periods), and for 2023/24 SPANS which also used an online approach.
This analysis suggests that pre-pandemic levels of participation increased steadily from 2012 to 2020. During the pandemic period visits to the outdoors on a frequent basis increased substantially but later dipped slightly as Covid-19 related restrictions eased in 2021.
The latest SPANS results indicate that while the percentage of people visiting the outdoors at least weekly has returned broadly to reported pre-pandemic levels, a larger proportion of the population are now taking part in some form of outdoor recreation during the year.
Subsequent SPANS waves, and triangulation with other surveys, will continue to build our understanding of post-pandemic outdoor recreation behaviour, as well as the impact of methodological changes on monitoring these activities.
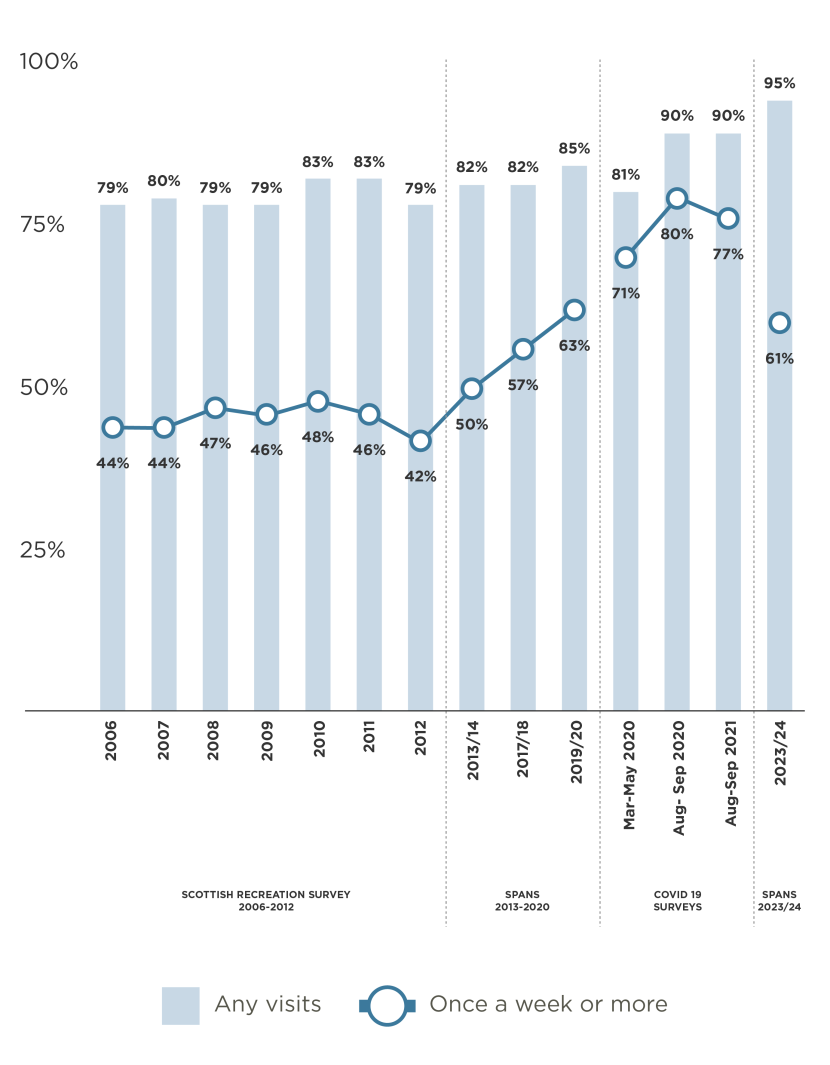
Figure 10. Participation in outdoor visits as recorded by NatureScot population surveys 2006 to 2024
Click for a full description
A chart showing levels of participation in outdoor visits between 2006 and 2023/24 with gaps where no data was collected.
Horizontal grey bars illustrate the proportions recorded during each year to have taken any visits.
A blue line chart shows the proportions on the same years recorded as taking visits at least once a week.
A note below the chart indicates that data from 2006 to 2020 was collected using a face to face method, via the Scottish Recreation Survey in 2006 to 2012 and SPANS in 2013 to 2020.
A further note indicates that data from 2020 onward was collected using an online method, via Covid-19 surveys in 2020 and 2021 and SPANS in 2023/24.
The data are summarised in the following table:
| Time period | Any visits | Once a week or more |
|---|---|---|
| 2006 | 79% | 44% |
| 2007 | 80% | 44% |
| 2008 | 79% | 47% |
| 2009 | 79% | 46% |
| 2010 | 83% | 48% |
| 2011 | 83% | 46% |
| 2012 | 79% | 42% |
| 2013/14 | 82% | 50% |
| 2017/18 | 82% | 57% |
| 2019/20 | 85% | 63% |
| Mar - May 2020 | 81% | 71% |
| Aug-Sep 2020 | 90% | 80% |
| Aug-Sep 2021 | 90% | 77% |
| 2023/24 | 95% | 61% |
Another key measure of participation levels produced by SPANS is the estimated total volume of visits. This figure is calculated from data collected on numbers of visits taken by respondents in each survey month and information on the size of the Scottish adult population.
Due to the impact of the Covid-19 pandemic on face-to-face survey fieldwork a full year estimate for this measure was not collected for the 2019/20 survey as fieldwork was halted after 11 months. However, as shown below, the estimate for this 11-month period was slightly higher than for the same 11 months in the preceding survey year (2017/18) and for the equivalent period in 2023/24, as recorded in the latest survey using the online approach.
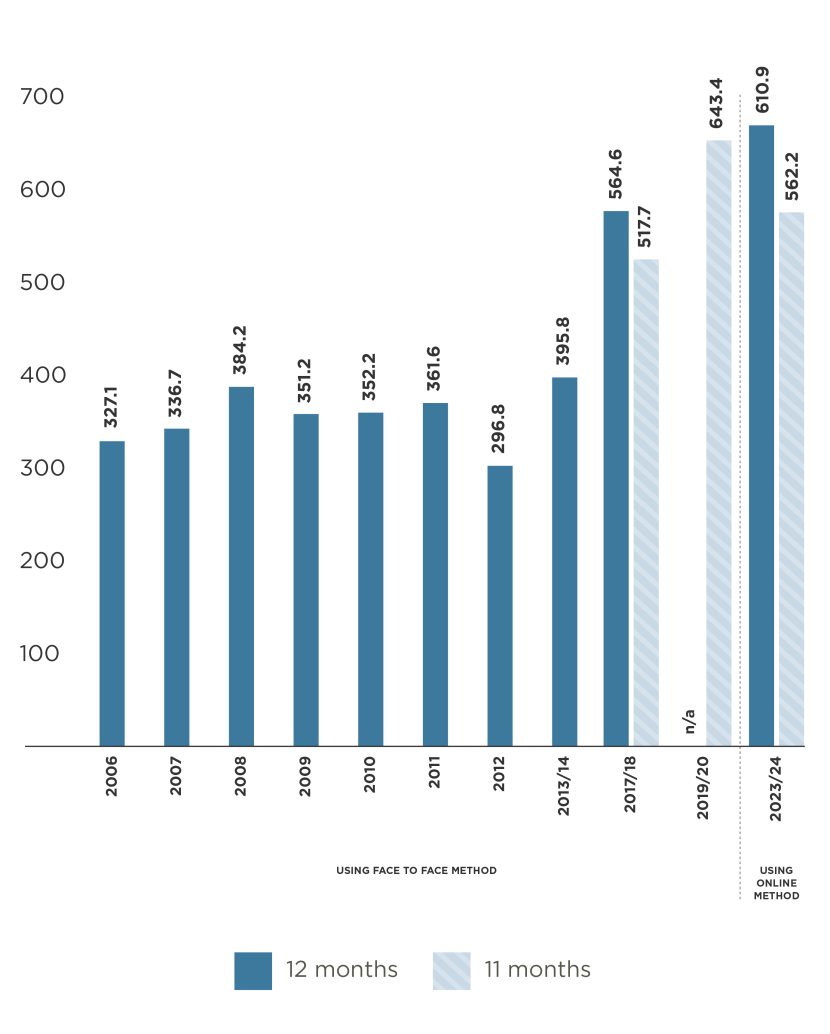
Figure 11. Estimated volume of outdoor visits (millions) as recorded in SPANS
Click for a full description
A horizontal bar chart showing the estimated annual volume of outdoor visits taken between 2006 and 2023/24.
A horizontal black bar shows the 12 months estimates where available (all years except 2019/20).
A horizontal grey bar shows the estimate for 11 months calculated for 2018/18, 2019/20 and 2023/24.
The y axis shows the estimated numbers of visits in millions.
A note below the chart indicates that data from 2006 to 2020 was collected using a face to face method while the 2023/24 data was collected using an online method.
The data are summarised in the following table:
| Time period | 12 months (millions) | 11 months (millions) |
|---|---|---|
| 2006 | 327.1 | n/a |
| 2007 | 336.7 | n/a |
| 2008 | 384.2 | n/a |
| 2009 | 351.2 | n/a |
| 2010 | 352.2 | n/a |
| 2011 | 361.6 | n/a |
| 2012 | 296.8 | n/a |
| 2013/14 | 395.8 | n/a |
| 2017/18 | 564.6 | 517.7 |
| 2019/20 | n/a | 643.4 |
| 2023/24 | 610.9 | 562.2 |