NatureScot Research Report 1341 - Pilot Study on the Use of Unmanned Aerial Systems for Surveys of Inshore Wintering Waterfowl
Published: 2026
Authors: Houghton, W., Styles, J., Peters-Grundy, R., Mazurek, S., Macleod, K., Semple, M., Cameron, M. (HiDef Aerial Surveying Ltd)
Cite as: Houghton, W., Styles, J., Peters-Grundy, R., Mazurek, S., Macleod, K., Semple, M., Cameron, M. (HiDef Aerial Surveying Ltd) Pilot Study on the Use of Unmanned Aerial Systems for Surveys of Inshore Wintering Waterfowl. NatureScot Research Report 1341.
Contents
- Keywords
- Overview
- Main Findings
- Acknowledgements
- Abbreviations
- Introduction
- Phase 1: Desktop Study
- Current Survey Methods
- Target Species
- Unmanned Aerial Systems
- Literature Review
- Optioneering Study
- Phase 1: Conclusions and Recommendations
- Phase 2: Technical Development and Trials
- Bench System Testing and Verification
- Anti-Vibration Mounting
- System Installation
- Technical Trials – Provider 1
- Technical Trials – Provider 2
- Technical Data Analysis
- Temporary Danger Area (TDA) Application
- Phase 2 Conclusions and Recommendations
Keywords
UAS; SPA, Aerial Survey; Waterfowl; Orkney, UAV,
Overview
Unmanned aerial systems (UASs) have been proposed as an alternative solution for monitoring inshore wintering waterfowl (divers, grebes and seaduck) within marine and coastal Special Protection Areas (SPAs), as well as surveys of marine birds in offshore areas for other industry use such as environmental impact assessments for development consent. Historically a range of survey methods have been used, including shore-based counts, boat-based surveys and visual aerial surveys (e.g. Lawson et al., 2015, Jackson, 2018 and Upton et al., 2018). More recently digital aerial surveys (DASs) have also been used, but no single method addresses all the different visual, behavioural and spatial requirements of the target species (Graham and Thompson, 2023, Scott et al., 2023, Peters-Grundy et al., 2025).
Recent progression of technology and operational legislation in the UAS sector has been identified as offering opportunities to develop viable solutions to address shortcomings of traditional survey methods. In October 2021 NatureScot commissioned a pilot study on the use of UASs for surveys of inshore wintering waterfowl (IWW). Two proposed Special Protection Areas (pSPAs), Scapa Flow and North Orkney, which hold internationally important populations of IWW and European shags (Gulosus aristotelis), were identified as potential test sites (Both sites were classified in February 2022 and hence are now SPAs). This study informs the feasibility of the use of UASs for monitoring of IWW in marine SPAs and more generally for survey of marine birds and mammals.
The study was split into constituent parts: Phase 1, a desktop study looking at the viability and feasibility of the use of UASs; Phase 2, technical trials and prototype development of a UAS capable of surveying, and; Phase 3, a comparison survey to coincide with commissioned digital aerial and vantage point surveys of the Orkney sites in winter 2022/23 (Peters-Grundy et al., 2025). Phase 1 of this project was concluded in February 2022 and Phase 2 was progressed until its conclusion in June 2023. However, it was not feasible to progress to Phase 3 by winter 2022/23 and therefore future progression of this phase has been postponed for further assessment. This report details the outputs of both Phases 1 and 2 with recommendations on the potential progression of Phase 3 at alternative locations at a future date.
During Phase 1, a comprehensive literature review was undertaken to assess the current utilisation of UASs in ornithological monitoring and wider applications across other sectors. This informed the development of use cases relating to the Scapa Flow and North Orkney SPAs and extending to other marine environments such as marine renewable energy development sites. Five UAS technologies were proposed to be assessed against performance metrics through an optioneering study. The outputs from the feasibility study serve to evaluate the feasibility of UASs as a viable solution for surveying wintering waterfowl within marine SPAs.
These findings provided the baseline requirements for Phase 2, which outlines the approach to platform development and testing as a proof-of-concept. The second phase also progressed the legislative processes and applications required for the use of larger-scale UAS operations at extended range in the form of a temporary danger area (TDA), a novel and relatively new commercial approach to operations outside of the military sector.
Main Findings
- Disturbance impacts from UASs on marine birds, including IWW, are uncertain and further trials, beyond those that have been identified from a review of current literature, are required to assess behavioural responses.
- Based on review of literature to date, a proposed code of practice is summarised for the use of unmanned aerial vehicles (UAVs) in ornithological surveys.
- Endurance capabilities, generally limited to less than 1 hour flight time, and low payload weights for small relatively inexpensive UAVs are perhaps the largest blocking factors in the use of small UAVs for survey of areas larger than ~5 km2.
- Legislation is continually developing, making beyond visual line of sight (BVLOS) operation more realistic. However, increased complexity and cost of BVLOS operation still means that, for small survey areas, visual line of sight (VLOS) or extended visual line of sight (EVLOS) is a better solution.
- Three use cases were assessed in this report:
- Large-scale site characterisation surveys
- Nearshore full coverage surveys
- Targeted development surveys
- Large-scale BVLOS UAVs were identified as a possible improved method of survey compared to traditional DASs.
- A camera system, including data management and power systems, has been successfully developed and tested for use in a large-scale UAV. Testing was carried out in environments similar to Scapa Flow SPA. Analysis of the test data and trial flights showed that the system performed as expected and would be suitable to be utilised as part of a UAS to conduct a Phase 3 field trial survey at a location such as Scapa Flow SPA.
- A series of flights were designed to gather data to allow testing and analysis of resolution, blur and UAV performance on the imagery in relation to the requirements of a large-scale site characterisation survey.
- The ground sample distance (GSD) of the system was validated using measured objects on the ground for straight and level flight. However, variations in GSD may have been contributed to by UAV roll, pitch and yaw (RPY) variation in challenging environmental conditions.
- Vibrational impacts on the imagery were seen in flights using both hard and anti-vibrational (AV) mounting options in adverse conditions, with AV mount usage showing comparatively less direct impact in the footage.
- Visual observations of the imagery indicate that there is also a contribution to blur due to RPY changes caused by adverse environmental conditions and platform stability.
- A gimbal mounted solution would likely be a better suited option for handling RPY effects during flight. However, this would need testing, tuning and verification to ensure the system’s capability to successfully conduct a site characterisation style survey.
- Weather conditions such as wind and precipitation caused significant impact to the Phase 2 trial flights. This is likely to be similarly challenging at sites such as Scapa Flow during wintering months and could reduce the number of operational days available for surveys using UASs.
Acknowledgements
The authors would like to extend their regards to the large-scale UAV providers utilised in this project and their employees who have collaborated with HiDef in the integration and development of UASs for use throughout the project.
The continued support and guidance from members of the project steering group is greatly appreciated, allowing the freedom and trust in the authors to develop a system to sufficiently meet the requirements of the project. Emma Philip and Ben James (Client project managers) and Kate Thompson of NatureScot have been particularly involved throughout both phases of the project.
We would also like to thank our colleagues in Germany at BioConsult SH, in particular Marc Schnurawa, for his shared knowledge and experience with the Wingtra and other UASs during Phase 1 of this project.
Abbreviations
3D: Three Dimensional
AC: Alternating Current
AGL: Above Ground Level
AI: Artificial Intelligence
ALS: Airborne Laser Scanners
ASL: Above Sea Level
AV: Anti-Vibration
BVLOS: Beyond Visual Line of Sight
CAA: Civil Aviation Authority
DAS: Digital Aerial Survey
DC: Direct Current
DMARES: Drone and Model Aircraft Registration and Education System
ESAS: European Seabirds at Sea
EVLOS: Extended Visual Line of Sight
FoV: Field of View
FPS: Frames Per Second
GPS: Global Positioning System
GSD: Ground Sample Distance
GVC: General VLOS Certificate
HiDef: HiDef Aerial Surveying Limited
IWW: Inshore Wintering Waterfowl
LiDAR: Light Detection and Ranging
LiPo: Lithium Polymer
MLWS: Mean Low Water Spring
MTOM: Maximum Take-Off Mass
PC: Personal Computer
PDRA: Pre-Defined Risk Assessments
PSG: Project Steering Group
pSPA: Proposed Special Protection Area
RPM: Revolutions Per Minute
RPY: Roll, Pitch and Yaw
SPA: Special Protection Area
SSD: Solid State Drive
TDA: Temporary Danger Area
TMZ: Transponder Mandatory Zone
UAS: Unmanned Aerial System
UAV: Unmanned Aerial Vehicle
USB: Universal Serial Bus
VLOS: Visual Line of Sight
VP: Vantage Point
VTOL: Vertical Take-Off and Landing
Introduction
The work described in this report was commissioned from HiDef Aerial Surveying Limited (HiDef) by NatureScot to investigate the potential use of unmanned aerial systems (UASs) for surveying inshore wintering waterfowl (IWW) in Special Protection Areas (SPAs). It formed part of a wider project that included conventional digital aerial and vantage point surveys at two SPAs in Orkney, as reported in Peters-Grundy et al. (2025).
Phase 1 focused on the feasibility of the use of UASs as a viable and/or cost-effective solution to survey wintering waterfowl within large marine SPAs. This phase consisted of a comprehensive literature review of the relevant studies published till February 2022, identifying the challenges and limitations that have been experienced in the scientific community and industry. The operational guidance and governing laws were explored with respect to available technologies on the market and within the UAS industry for aerial monitoring. Three proposed “use cases” for UAS surveys were investigated, using a trade-off study between several technology options. The outputs informed a proposed Phase 2 proof-of-concept trial of a UAS.
The Phase 2 trial was completed using larger-scale unmanned aerial vehicles (UAVs) with beyond visual line of sight (BVLOS) capability. The experience the authors have previously gained from conducting aerial imaging surveys and understanding of the challenges involved, contributed and added background to the technical investigations and development of a suitable system. The technical conclusions of the trials are presented with a proposal towards a potential comparable survey to a manned digital aerial survey (DAS). The operational requirements and applications for a suitable temporary danger area (TDA) in the Scapa Flow SPA were also initiated to explore the complexities involved in the TDA application processes.
Background to Project
UASs have been proposed as an alternative solution for monitoring IWW (divers, grebes and seaduck) within marine and coastal SPAs, as well as surveys to underpin environmental impact assessments for development consent. Currently, no single survey method addresses all the different visual, behavioural and spatial requirements of these species (Graham and Thompson, 2023, Scott et al., 2023, Peters-Grundy et al., 2025).
Waters surrounding Orkney are recognised for their international ornithological importance by the designation of marine SPAs at Scapa Flow and North Orkney. These sheltered seas provide wintering habitat for non-breeding waterfowl (divers, grebes and seaduck) and European shag (Gulosus aristotelis) as well as foraging habitat for red-throated divers (Gavia stellata) in the breeding season. Full lists of all the target, including SPA qualifying, and non-target species likely to be present within the Scapa Flow and North Orkney SPAs can be found in Tables 1 and 2 respectively.
| Scapa Flow SPA qualifying features | North Orkney SPA qualifying features | Other duck sp. | Other diver sp. | Other grebe sp. | Other |
|---|---|---|---|---|---|
Great northern diver Black-throated diver Slavonian grebe Red-breasted merganser Long-tailed duck Common eider European shag | Great northern diver Slavonian grebe Velvet scoter | Goldeneye Common scoter Goosander Greater scaup Tufted duck Common shelduck Eurasian wigeon Gadwall Common teal Mallard Northern pintail Northern shoveler Pochard | Red-throated diver White-billed diver | Red-necked grebe Little grebe Great crested grebe | Great cormorant |
| Swans and geese | Wader sp. | Auk sp. | Gull sp. | Petrel sp. | Raptors, herons and misc. | Cetaceans | Other mammals |
|---|---|---|---|---|---|---|---|
Mute swan Whooper swan Greylag goose Barnacle goose Pink-footed goose | Oystercatcher Ringed plover Golden plover Grey plover Lapwing Dunlin Purple sandpiper Knot Sanderling Snipe Bar-tailed godwit Curlew Redshank Turnstone | Guillemot Razorbill Black guillemot Puffin Little auk | Herring gull Great black-backed gull Kittiwake Black-headed gull Common gull | Fulmar | Buzzard Hen harrier White-tailed eagle Sparrowhawk Merlin Peregrine Kestrel Short-eared owl Grey heron Coot Moorhen | Harbour porpoise White-beaked dolphin Minke whale Pilot whale Killer whale | Grey seal Harbour seal Otter |
These waters are also of great interest for current and future developments with the proposed Scapa Deep Water Quay identified as a national development in the draft fourth National Planning Framework (NPF4).
The Orkney Harbour Authority and Orkney Islands Council have proposals in place for the development of Scapa Deep Water Quay in 20 metres depth of water and comprising more than 20 hectares of quayside and hinterland area. This proposed development would have the ability to accommodate large vessels and structures alongside providing a base for offshore wind construction and assembly for ScotWind sites located to the north. A future fuels hub is also proposed to provide low and zero carbon fuelling options to the shipping sector.
The proposed Orkney Logistic Hub, located at Hatston, Kirkwall, aims to play an important role as the optimal location for operations and maintenance activities associated with offshore wind, as well as other industry activities. The transformation of Hatston into Orkney’s Logistics Hub is already underway with a 300 m quay extension (with water depth of 10 metres), an additional 7 hectares of operational land adjacent to the quayside and substantial hinterland available for a range of activities across multiple sectors: renewable energy, oil and gas, aquaculture, logistics, cruise and boat repair.
The potential impacts of developments on European sites, including SPAs, needs to be considered through a Habitats Regulation Appraisal (HRA). Robust data are required to support assessment of the potential impacts of development on the qualifying features of the sites and to further inform the development of appropriate mitigation measures as necessary.
Assessing the population sizes and distributions of species at marine SPAs has been a complex undertaking. Previous surveys in waters including the Scapa Flow and North Orkney SPAs have comprised a composite of shore-based vantage point (VP) counts, boat-based surveys and visual aerial surveys; Lawson et al. (2015), Jackson (2018) and Upton et al. (2018) with single DASs recently undertaken in winter 2021/2022 and 2022/2023 (Peters-Grundy et al., 2025). Scapa Flow and North Orkney SPAs were identified as representative potential test sites for trialling pilot studies on the use of novel methods for surveying IWW.
DASs can provide high quality data but can suffer limitations associated with inadequate sampling of nearshore waters and dense flocking species as well as those that typically occur in small numbers (Graham and Thompson, 2023, Scott et al., 2023, Peters-Grundy et al., 2025). The cost of a single DAS may also present an issue for the frequency of surveying capabilities; this limits the ability to detect shorter term population trends between surveys that may be years apart.
UASs are proposed as a solution for smaller-scale surveys nearshore that could be cost effective and provide more robust data than traditional survey methods typically using VP observations. For larger-scale surveys, the capabilities are yet unknown, largely due to regulations and limited UAS technical advancement. However, relatively recent progression of technology and operational legislation in the UAS sector could deliver technically viable solutions to a wider array of uses in locations such as the Scapa Flow and North Orkney SPAs. This potentially provides a cost-effective approach to monitoring all IWW in marine SPAs in addition to wider applications for the offshore wind sector.
Steering Group Members / Project Partners
The project steering group (PSG) comprised representatives from NatureScot (Emma Philip / Ben James – Client project manager, Kate Thompson, Glen Tyler and Daniel Brazier), Marine Scotland Science (Finlay Bennet) and Orkney Islands Council (James Green and David Sawkins).
HiDef partnered with BioConsult SH, its sibling company in Germany. BioConsult frequently fly aerial surveys with a UAS, typically VLOS flights, and have a wealth of knowledge and experience.
HiDef worked with two large-scale UAV operators, transferring knowledge and also improving communication channels with the Civil Aviation Authority (CAA) in the development of operational procedures.
Objectives
The objectives of this study were:
- To carry out a review of all recent studies involving ornithological / environmental surveys completed using UASs or similar systems.
- To review available technology from short range / line of sight systems to over the horizon remotely operated systems.
- To determine the different use cases present for UAS surveys and the respective requirements for each use case particularly around size of study area, required coverage and target species.
- To identify a set of weighted metrics which each option could be scored against, including as a minimum: cost, duration of survey, ability to detect target species, ability to identify target species, weather limitations, safety, platform stability / data quality, and precision of estimates.
- To conduct a full review of each technology option against each use case with scoring options against the agreed criteria to create a matrix for which feasibility of each option for each use case can be assessed.
- To design, build and verify a camera system for use in conjunction with a UAV.
- To design and conduct preliminary technical UAS trials.
- To analyse the preliminary trial data to inform recommendations for future UAS field trials alongside comparable survey methods.
- To initiate and progress the necessary airspace applications for initial system trials and potential Phase 3 surveys.
Phase 1: Desktop Study
Previous Methodologies Used for Inshore Surveys
Initial draft Scottish SPA site selections (1998 – 2009)
A mixture of visual aerial surveys, shore-based counts and boat-based surveys underpinned the initial draft SPA site selections for IWW across Scottish inshore waters, including around Orkney (Lawson et al., 2015). During multiple winter surveys spanning December to March, a Partenavia (P.68) or Islander plane flew 2 km spaced transects oriented perpendicular to the coast at 75 m (250 ft) above sea level (ASL) and at a speed of 185 km/h (100 knots) across the surrounding inshore areas of Orkney up to the mean low water springs (MLWS). The visual aerial surveys used distance sampling methods (Buckland et al., 2001), with two ornithologists recording birds on both sides of the aircraft and the distance of each bird according to four distance bands split between 44 m and >1000 m.
Additional shore-based and boat-based counts were undertaken for Scapa Flow. The area was split into 43 sectors to be counted from land. Each land-based sector had multiple vantage points (VPs) (132 in total), where birds were recorded in 1 km Ordnance Survey square grids. Central Scapa Flow was counted by boat, along four 2 km spaced transects and at a speed of 12 km/h, with uniform detection assumed on either side to 1 km, providing full coverage of the central Scapa Flow. For North Orkney, 13 land-based counts were conducted in sectors south of Gairsay, and six in sectors north of Gairsay.
The final abundance estimates of some species were based solely on the land and boat-based counts as these provided the highest estimates and best spatial coverage of the survey areas.
Scapa Flow proposed SPA (pSPA) 2017/18
Target species across the Scapa Flow pSPA were surveyed using a combination of shore-based and boat-based surveys (Jackson, 2018). Four rounds of surveys were undertaken between November 2017 and March 2018. The pSPA shoreline was divided into 58 sectors, covering approximately 0 to 2 km offshore; each sector containing several VPs at least 5 m in elevation. A surveyor walked the coastline in a single direction, taking between 12-18 days per round, with an additional day of fieldwork required for black-throated diver surveying. At each VP, the surveyor would scan the horizon from left to right to avoid double counting, recording all waterfowl seen including those roosting onshore or on small islets. Flying birds were only recorded if they landed within the sector. The surveyor could take as long as necessary to record all birds in the sector (approx. 15-20 minutes at each VP) and it was presumed they had complete visibility of the full sector up to 2 km offshore with the use of a spotting scope.
Due to limited visibility beyond 2 km, central Scapa Flow was surveyed by boat. An area of approx. 90 km2 was surveyed using a transect design consisting of 12, 1 km spaced parallel transect lines. Transect ends were positioned 1.75 km from adjacent coastlines, to accommodate visibility of shore-based observers, preventing overlap of registrations. Boat-based observers employed European Seabirds at Sea (ESAS) methods. Birds were recorded on either side of the vessel in a strip of 500 m on each side. This provided complete coverage of central Scapa Flow. Each survey was undertaken in a single day (approx. 5.5 survey hr, 8 at-sea hr), with an average speed of 8 knots.
North Orkney pSPA 2017/18
Recent counts of target species within the North Orkney pSPA utilised only shore-based counts (Upton et al., 2018). Five count rounds were undertaken between November 2017 and March 2018. The pSPA was divided into 24 count sectors, each with multiple VPs. Similar methods were followed as used with Scapa Flow; recording all waterfowl within visible distance (~2 km) and moving in a single direction along the coastline to avoid double counting. However, certain sections were acknowledged to be too far from VP for full visibility. The entire pSPA could be covered in 5 days under ideal conditions and with three surveyors available.
Current Survey Methods
Shore-based surveys
Shore-based counts are currently the best method for providing full coverage of coastal sectors. Surveyors can be flexible with the time spent at each VP, allowing diving or hidden birds to become exposed. Equally, there is a level of judgement applied by real-time human observers that enables accurate counts: they can assess the movements of birds to reduce double-counting and tell whether flying birds are using the sector. However, there are obvious disadvantages. Counts are limited by accessibility on foot and/or visibility; as a result, coastlines of offshore islands within the marine SPAs were not surveyed. Shore-based counts are labour intensive and span days due to the scale of SPAs. This leads to increased movement of birds between sectors and during counts which can lead to double-counting, and also limits the frequency with which surveys can be conducted.
Boat-based surveys
Boat-based counts are often the only viable method for some areas due to logistical constraints, such as steep cliffs. They extend the spatial reaches of surveyors, thus providing the benefits of real-time human observation. However, boat surveys can flush sensitive species such as seaducks and diver sp. and are thus likely to underestimate their numbers (Schwemmer et al., 2011).
Aerial surveys
Aerial surveys have been a novel solution to some of the challenges associated with other methods. They have proven to be cost-effective for covering extensive areas; provide better coverage in areas of very shallow water; can access offshore regions beyond what is possible by sight from shore; and can reduce the disturbance of wildlife if flown at sufficient altitude. Digital aerial surveys (DASs) are flown at substantially greater altitudes compared with visual aerial, which may reduce disturbance effects. The advent of DASs has also enabled an auditable process by recording and storing data, whilst additionally increasing safety by reducing the number of surveyors in the field. Aerial surveys can provide good information on spatial distributions and robust population estimates of evenly distributed species.
However, the reduced coverage of widely spaced transect designs required for cost-effective aerial flights can lead to over or under-estimation of dense flocking species, such as scoters, eiders and long-tailed ducks. Previous aerial surveys have had limitations with respect to coverage of nearshore areas (Scott et al., 2023), due to topography of the coastline or sharp turns in transects. Small or cryptic species (such as Slavonian grebes or black-throated divers) and similar looking species (diver sp., female ducks) can be harder to detect and distinguish at altitude where identification features may not be visible due to image resolution. Snapshot surveys, such as DASs, are also more susceptible to underestimating the abundance of diving species or those roosting on land such as European shags. The cost of aerial surveys compared to vantage point observer methods may also limit the frequency with which surveys can be undertaken to help inform monitoring of marine SPAs, meaning they may fail to capture variability within or between years. This reduces the ability to monitor population trends over time. Boat surveys are also subject to similar constraints due to leasing costs of suitable vessels.
Target Species
Waterfowl species (divers, seaducks and grebes) and shags form the target species of winter surveys within the Scapa Flow and North Orkney SPAs. The eight target species were: great northern diver (Gavia immer), black-throated diver (G. arctica), Slavonian grebe (Podiceps auritus), red-breasted merganser (Mergus serrator), velvet scoter (Melanitta fusca), long-tailed duck (Clangula hyemalis), common eider (Somateria mollissima) and European shag. See Annex 1 for more detail on each of the target species in the Orkney SPAs and Peters-Grundy et al. (2025) for details of varying spatial coverage of previous surveys of these species in nearshore Orkney waters.
Unmanned aerial systems (UASs) may provide a novel way to monitor these species, provided solutions to the surveying challenges highlighted above can be overcome. However, research into current empirical evidence is required to understand the potential of unmanned aerial vehicles (UAVs) for these purposes and how target species (and non-target species) may react to such objects.
Unmanned Aerial Systems
For reference, UASs can be split into three broad components that require consideration when selecting a system for a given application (Giordan et al., 2020 and Tsouros et al., 2019). These are:
- the UAV itself, which consists of the airframe, propulsion / power system, control / avionics and payload;
- the remote-control unit that is operated by a human pilot on the ground; and
- the communications system that is used to link the above components together into a functional system.
Collectively these components create a functional system known as a UAS and are all important aspects of the system to consider when ensuring a UAS is fit for purpose. The latter part of the Phase 1 study explores the benefits and challenges faced with UASs targeted towards commercial applications and in particular ornithological surveys. Limitations of the UAV components of these systems are largely influenced by two factors at the time of this review (February 2022); legislative laws or guidance and payload capacity that restricts the endurance and sensor capabilities (Nowak et al., 2018).
UAV Legislation and Operation
Different countries are governed by their own regulatory bodies. The operation of UAVs within the UK is regulated by the CAA. Operational limitations and requirements are outlined in Civil Aviation publication (CAP) 722 (CAA, 2020). The guidance on UAV operation is relatively new and is developing as the commercial UAV industry expands. New regulations implemented in 2020 aim to offer increased guidance for ‘hobbyist’ style activities as well as making the process of commercial applications easier. The main aim of the CAP722 regulations is to improve the safety of uninvolved personnel, reducing risk where possible to the public. The limitations and challenges associated with each operating category listed in CAP722 were explored in relation to this project.
UAV Categories of Operation
The operational regulations for UAVs are rapidly developing as the use and number of UAVs in operation commercially, and as hobbyist activities, continues to rise. At the time of this report, the types of UAVs in operation are largely categorised by the size or weight of the unit and their operational area with respect to members of the public. The regulations that dictate the operational categories of all UAVs in UK law are documented in CAA reference CAP722 (CAA, 2020).
The types of UAV operation are sub-categorised into three main sectors based on the regulations set out by the CAA. These are:
- Open,
- Specific, and
- Certified.
As the operation moves from ‘open’ to ‘certified’, the associated risk increases from low to high. With increased risk, operation becomes inherently more complex. Regulations for UAVs within the certified category are still under development and as such, the current model essentially considers the UAV as a manned aircraft operation. The associated requirements for operator and aircraft licensing for example are highly regulated and render the relevance for this type of operation as beyond the scope of this study. Because of this and for the purpose of this report, the certified category is not considered further.
The operational categories within sectors are set out by the CAA (2020) and are formed from the basis of operational principles as outlined below. These act as a form of metric or standards that are universal across all categories and allow operations to be related to a category. The operational envelopes for the open and specific categories are explored with their limitations presented.
Visual line of sight (VLOS): Operation is limited to within VLOS meaning that the pilot must be able to see the UAV at all times without aid of image enhancement equipment (i.e. binoculars, telescopes, camera and lenses). This is to avoid collisions with obstacles during operation. Typically, the CAA recognise that most UAVs can be operated to a horizontal range of 500 m from the pilot depending on the size of the UAV and environmental conditions allowing maintained visibility. Larger UAVs may be operated at a great range within VLOS. Provided the UAV is always within direct VLOS there is no maximum horizontal limit from the pilot, however, the UAV should always be kept under suitable control by the pilot when operating.
Operational height for VLOS: Maximum ‘operating height’ is limited to 400 ft (~ 120 m) above ground level (AGL) and is interpreted as distance from the closest point on the Earth’s surface. This is for the safety of manned aircraft that fly above 500 ft (150 m) for much of their operation.
Extended visual line of sight (EVLOS): This is an extension of VLOS that utilises a secondary visual observer to maintain VLOS with the UAV in the cases where the pilot cannot. Direct contact between the observer and pilot must be maintained as well as ensuring suitable radio control ranges for the UAV are utilised. In order to operate at EVLOS, approval must be granted from the CAA which consequently categorises the operation in the specific category.
Beyond visual line of sight (BVLOS): BVLOS refers to the operation of a UAV beyond the VLOS operations where the pilot or additional visual spotter can no longer respond to other users of the airspace by direct observations alone. To operate BVLOS, approval from the CAA is required based on the employment of one or more of the following requirements:
- Technical capabilities that are at least equivalent to those of manned aircraft pilots to detect and avoid (DAA) potential collisions.
- A temporary danger area (TDA) be enforced that only permits the operation of the specified UAV or aircraft within the boundaries. This avoids the risk of collision with other airspace traffic but does restrict airspace to other legitimate users while the TDA is active.
- Evidence via an operational safety case (OSC) that assesses the risks of the UAV flight and provides acceptable evidence that the operation poses no threat to persons or objects on the ground.
The CAA assesses the case for BVLOS operation by way of considerations toward risk mitigation from the above methods.
BVLOS also covers operation that extends above the 400 ft (~120 m) ceiling height for VLOS/EVLOS operations.
Maximum take-off mass (MTOM): The MTOM is the manufacturer specified unit for the system. This is used to categorise UAVs to limit the capabilities of a UAV within a category and therefore the risk to persons or property associated with a failure or collision of the UAV.
Avoidance of other aircraft, uninvolved persons or structures: The pilot should always assume first actions for responding to any potential hazards that arise from other aircraft, uninvolved persons or structures. Where operations would not adhere to separation limits for the category of operation, the pilot should acquire further approvals for operation. The CAA also limits the operation of certain sizes of UAVs and their speed in relation to the distance from congested areas.
Open Category
The open category covers most of the UAVs that are available to purchase by the general public. They are typically ready to fly units that most commonly utilise an imaging sensor as the payload, for aerial photography, although are not limited to this.
The main limitations of operation within the open category are:
- MTOM < 25 kg
- VLOS operation must be maintained at all times
- The maximum operational height of the UAV must be less than 400 ft (~ 120 m)
- No operation within restricted airspace without permissions
The open category is broken down further into subcategory operations dependent on the UAVs distance from uninvolved persons and MTOM. These subcategories are explained below and supplemented by Table 3.
A1 refers to operation ‘over’ people and generally limits the UAV MTOM to <250 g for flight over people (but not crowds) and <900g for operations that involve no intentional flight over people but may consequently carry this risk due to the location of operation. There are additional competency requirements of online training and registration required for operation of UAVs with MTOM >250g in this category. These requirements reduce the risk posed to the public but inherently reduce the capabilities of the UAV and therefore this subcategory is deemed not feasible for the scope of this project. As the SPAs are largely remote and unpopulated areas, flying ‘over’ people can be avoided relatively easily and MTOM will inevitably exceed 900 g due to sensor requirements alone.
A2 refers to flying ‘close’ to people within a minimum horizontal separation of 5-30 m dependent on the speed of the UAV. The MTOM must be <4 kg and the UAV must adhere to specific safety standards as well as the pilot having completed online training, tests and the A2 certificate of competency (A2 CofC) theory test.
A3 subcategory is limited by MTOM <25 kg and only requires that the UAV maintain 50 m separation from any members of the public and 150 m horizontal separation from any residential or congested areas. For this category the pilot must have completed the UAV and Drone & Model Aircraft Registration and Education System (DMARES) online training and tests.
| Subcategory | Operating area | UAS class | Maximum take-off mass | Competency requirements |
|---|---|---|---|---|
| All | - Max height 120 m/400 ft - No dropping of articles - No carriage of dangerous goods | - | < 25 kg | - Read the user manual |
| A1 | - Flying over uninvolved people, but not over crowds - No intentional flight over uninvolved persons (Class C1 UAS) | C0 (toy/not toy) C1 Private build Legacy build A1 Transitional | < 250 g - Private, Legacy, C0 < 500 g - A1 Transitional < 900g - C1 | - Read the user manual - Complete online DMARES learning and register for flyer ID (Class C1) - A2 CofC (A1 Transitional) |
| A2 | - No closer than 30 m horizontally from uninvolved persons (5 m in ‘low speed’ mode) - No closer than 50 m horizontally from uninvolved persons (A2 Transitional only) | C2 A2 Transitional | < 4 kg - C2 < 2 kg - A2 Transitional | - Read the user manual - Complete online DMARES learning and register for flyer ID - Self-practical training - Obtain A2 CofC |
| A3 | - No uninvolved people present within the area of flight. Maintain 50 m separation from any uninvolved people - No flight within 150 m horizontally of residential, commercial, industrial or recreational areas | C3 C4 Private build Legacy build | < 25 kg | - Read the user manual - Complete online DMARES learning and register for flyer ID |
It is noted that while there are no strict limits to operation within VLOS, the maximum practical range that would be expected to allow confident control of the UAV would be approximately 1.2 km for a ~1 m wingspan / diameter UAV.
Based on the requirements of operation within the open category, most or all the in-scope operation related to this project that would be classed in the open category would fall within the A3 subcategory due to the locations of survey areas and MTOM of the UAVs that meet the technical requirements. For wider and future applications within ecological monitoring, it is worth noting the additional complexities involved when operating near the general public or built-up areas when considering use of UAVs. This may make operation around nearshore development areas more difficult to carry out.
Specific category
The specific category covers operations that pose a greater risk than those covered by the open category, including EVLOS/BVLOS and/or those that include elements not within the limits of open operation for MTOM and proximity to public or built-up areas. Due to the increased risk involved with operation in the specific category, the operator must acquire operational authorisation from the CAA to fly the UAV.
With the addition of operational authorisation, the complexity and timescale required to operate in the specific category can typically increase, with expected approval times towards 3-4 months. The cost for the additional authorisation is £1800.
Part of the requirements for flying within the specific category before being considered a ‘certified’ operation is that the UAV has a MTOM < 150 kg, does not involve the transport of dangerous goods or people, and does not feature a characteristic dimension > 3 m while being flown over people. It should be noted that ultimately the CAA will determine the operational category dependent on their review of the risk assessment.
The authorisation is based on an operational safety case (OSC) that is evaluated by the CAA and based on the mitigations in place that reduce the risk posed to other aircraft, uninvolved personnel and populated areas and structures.
Methods that can be employed to mitigate risk often include operating away from populated areas as this reduces risk to people on the ground. Flying over the sea would be a sufficient mitigation to reduce risk to the public. The implementation of TDAs is a useful and practical method that has been implemented for UAVs already; temporarily limiting airspace for a set duration of operation. A TDA is valid for three months once activated and can be turned ‘on’ or ‘off’ as required. A practical approach to the use of TDAs is to segment the total TDA area into sections that can be implemented only when the UAV is flying through them, causing less disruption to other airspace users.
Another method, used for manned aircraft operation, is the employment of a transponder mandatory zone (TMZ) which, unlike a TDA, is a permanent traffic management system. The TMZ is a zone where only aircraft that carry transponders are permitted to operate. This mitigates the risk of collision between aircraft and UAV as the manned pilots are made aware of any UAVs in the area. At the time of this review (February 2022), there are currently no operational TMZs in the United Kingdom (UK) for the use of UAVs and therefore only the use of TDAs is considered further. This is largely due to the majority of UAVs not featuring the required transponders and therefore regulations not being fully developed at present.
The CAA and UAV industry are working towards more standardised pre-defined risk assessments (PDRAs) that cover more common use cases to reduce the complexity of operational approval in these instances. However, the use cases within the scope of this project are separate from common use and consequently the current PDRAs do not cover this type of operation.
An additional requirement for operation in the specific category is that the pilot should have a minimum level of competency. The general VLOS certificate (GVC) is the minimum requirement in terms of qualification that provides evidence of a pilot’s competency within the specific category for VLOS operation outlined in CAP722B documentation (CAA, 2020).
Commercial applications
The requirements for commercial application of UAV operations follow the requirements that all UAV users should follow and provide evidence of pilot competency through at least the GVC. Extended qualifications are available to further the envelope of operations when survey areas are located closer to congested public areas. It is essential that the correct insurance is acquired for use in commercial applications that adhere to the EC 785/2004 regulations.
Literature Review
Methods
A comprehensive literature search of items published within the past decade was conducted, up to and including February 2022. Information was taken from journal articles, reports, dissertations and anecdotal information gained from colleagues with experience of using UAVs. Searches were made primarily through Google Scholar, in addition to reference harvesting. Search terms were a combination of words or phrases including: ‘UAV’; ‘unmanned aerial vehicle’; ‘UAS’; ‘unmanned aerial system’; ‘unmanned aircraft’; ‘wintering waterfowl’; ‘waterbirds’; ‘seabirds’; ‘UK’; ‘flushing distance’; ‘flushing response’; ‘behavioural response’; ‘flight initiation distance’; ‘disturbance’; ‘displacement’; ‘aerial predators’, ’automation’, ‘applications’, ‘noise’, ‘capabilities and limitations’, ‘challenges’. In addition, the names of target species were also searched: ‘great northern diver’; ‘black-throated diver’; ‘Slavonian grebe’; ‘red-breasted merganser’; ‘velvet scoter’; ‘long-tailed duck’; ‘common eider’; ‘European shag’; and their respective Latin names, ‘Gavia immer’; ‘Gavia arctica’; ‘Podiceps auritus’; ‘Mergus serrator’; ‘Melanitta fusca’; ‘Clangula hyemalis’; ‘Somateria mollissima’; ‘Phalacrocorax aristotelis’. Although the Latin name of the European shag had recently changed to ‘Gulosus aristotelis’, ‘Phalacrocorax aristotelis’ was most likely to be used in previously published material.
Results
A summary of findings from the literature review is presented below. A brief description of each assessed paper/report is presented in Annex 2.
UAS Industry applications
The rapid enhancements in UAS technologies over the last 10 years has opened the possibilities for certain applications to be carried out using UASs. Applications are typically observed in aerial videography and photography, which are used extensively across a wide variety of sectors and heavily in advertising or television broadcasting. The benefits gained in cost, time, safety, and occasional improved capability have not been overlooked in other commercial applications either. Studies on various UAS applications include forestry mapping (Puliti et al., 2015 and Lisein et al., 2013), search and rescue or post-disaster assessment (Ezequiel et al., 2014, and Waharte, S. and Trigoni, N., 2010), aerial structure inspection (Stokkeland et al., 2015 and Zhang et al., 2017), methane monitoring (Emran et al., 2017 and Shaw et al., 2021) and, perhaps most extensively researched, agriculture (Tsouros et al., 2019, Hassler, S.C. and Baysal-Gurel, F., 2019, and Yang et al., 2017). These are just a sample of the uses that have been developed so far and more will arise as technologies advance and regulations evolve with growing use of UASs.
Hassler and Baysal-Gurel (2019) published a thorough literature review of the uses of UASs for the agricultural sector. They identified the use of small-scale fixed-wing or multirotor UAVs as the best suited and most utilised systems within the agricultural industry. This was largely due to the availability of systems, relative ease of operation and relatively low cost of the systems. The diversity of sensor options for UASs was demonstrated with red, green and blue (RGB), multispectral, thermal and hyperspectral imaging sensors as well as light detection and ranging (LiDAR) listed among other equipment more specific to agriculture used such as grabbing or spraying tools. Even in the extensively studied agricultural sector, Hassler and Baysal-Gural acknowledge that the current applications only scratch the surface of UAS potential and still require further research for current applications. In the lesser studied area of ecological monitoring the complexities are arguably greater than in agriculture and likely require far more dedicated research yet to be completed.
Similar observations were made by Tsouros et al. (2019) who explored the additional benefits of automation and artificial intelligence (AI) in data processing as a powerful and effective tool for object classification. However, the lack of standardised procedures and workflows proved one of the largest limitations that currently prevents the progression of UAS use along with the low endurance of most current technology. As with changes in survey methods of ornithology in the past, the procedure and guidelines for UAS operation will be critical to the acceptance of a new survey method.
UASs have been shown to be an effective tool for forestry mapping, particularly with the additional aid of airborne laser scanners (ALS), to measure biomass and canopy heights (Lisein et al., 2013 and Puliti et al., 2015). Fixed-wing systems were identified as the optimal method for forestry mapping applications due to the increased speed and often small increase in endurance of the system. UASs are most effective for smaller-scale survey areas when compared to other aerial survey methods utilising manned aircraft or satellite imagery, largely due to limited flight times and improved spatial resolution at lower altitudes. Challenges in operation of UASs in cold temperatures presented an issue with continuous data acquisition (Puliti et al., 2015). The UAV engine also caused vibration blur within the imagery at 4 cm ground sample distance (GSD). This will become an increased concern as the GSD is reduced to 2 cm to allow identification of birds (Bakó et al., 2014). Image stabilisation may therefore be required to limit the impacts of vibration.
To tackle the low endurance challenge that small UAVs pose, larger-scale UAVs have been developed with endurance ranging from four hours to upwards of twenty hours (FlyLogix Ltd, 2022 and Zappa et al., 2020). Technology developed by FlyLogix Ltd. (2022) has been utilised in monitoring methane concentrations in the offshore oil and gas industry. The long-range applications have been achieved using combustion engines over battery power. Operationally, FlyLogix have developed relationships with the CAA in order to successfully operate in areas BVLOS. While Zappa et al. (2020) explore the use of a UAS with an impressive endurance (Latitude Engineering HQ-60 VTOL UAV), the complexity in operational authorisation for UAVs of this size and particularly at longer range makes co-operation with operators a valuable asset to achieve large-scale surveying methods in ecology.
UAS in Ornithology
The potential advantages of UAVs as a tool for ornithological monitoring are evident. As with DASs, they can provide a transparent and auditable data trail, reducing observer bias from surveyors with varying expertise (Rush et al., 2018). UAVs can potentially provide a cheaper, quicker, safer and more environmentally friendly method than classic aerial or boat-based surveys (Brisson-Curadeau et al., 2017; McEvoy et al., 2016). Their ability to provide an aerial view at reduced altitudes increases the ease of achieving higher image resolution, and as a result can provide comparable, if not more precise, counts than both aerial and ground-based observer methods (Afán et al., 2018; Dunn et al., 2021; Hodgson et al., 2016). UAV counts of non-breeding Australian waterfowl using multirotor quadcopters (DJI Phantom 4 Pro and Matrice 210 V2), with 4k video at 60 frames per second (FPS), were more accurate than ground counts, exceeding them by 36% (Dundas et al., 2021). This was particularly true on waterbodies larger than 5 ha.
Their size and relative cost allows UAVs to target smaller areas at a finer spatial scale as well as be readily used for more frequently repeated studies. They reduce damage to surrounding habitat that can be caused by ground-based surveyors (Rush et al., 2018) and provide accessibility to areas not available by foot or visible from the ground (Afán et al., 2018).
Aquatic birds are the highest represented taxa in UAV studies (Mo and Bonatakis, 2022). However, current literature on the use of UAVs is somewhat limited in the context of wintering waterfowl.
UAVs have proven to be an effective method for surveying seabird colonies of a diverse range of species, including: chinstrap penguins (Pygoscelis antarctica), gentoo penguins (Pygoscelis papua) and South Georgia shags (Leucocarbo atriceps georgianus) (Dunn et al. 2021); black-browed albatross (Thalassarche melanophris) and southern rockhopper penguins (Eudyptes chrysocome) (Hayes et al., 2021); gannets (Morus bassanus) (Harris et al., 2019); common terns (Sterna hirundo) (Chabot et al., 2015); black-headed gulls (Chroicocephalus ridibundus) (Sardà-Palomera et al., 2012); lesser black-backed gulls (Larus fuscus) (Rush et al., 2018); and, Brünnich's guillemot (Uria lomvia), common guillemot (Uria aalge), glaucous gulls (Larus hyperboreous) and Iceland gulls (Larus glaucoides) (Brisson-Curadeau et al., 2017). Seabird colonies provide excellent use cases for UAVs, as breeding seabirds are generally confined to nest sites, exposed to the air (either on flat ground or cliffs), and are often inaccessible by foot or obscured when viewed from ground level by topography or vegetation.
Literature on the use of UAVs to survey waterfowl or shorebirds is limited. Many of the studies relate to nesting birds, including: lesser snow geese (Anser caerulescens) (Barnas et al., 2017); common eider (Ellis-Felege et al. 2022); glossy ibis (Plegadis falcinellus) and purple heron (Ardea purpurea) (Afán et al., 2018); great egret (Ardea alba) (Collins et al., 2019); and, several studies on mixed-species colonies including herons, egrets, spoonbills, and ibis (Barr et al., 2020; Francis et al., 2020).
Studies specific to wintering waterfowl are limited further still. McEvoy et al. (2016) and Dundas et al. (2021) evaluated disturbance from use of UAVs on wild non-breeding mixed waterfowl flocks in Australia, whilst Vallery (2018) assessed both breeding and non-breeding shorebirds and wading birds in Florida. Vas et al. (2015) conducted disturbance studies on semi-captive mallard (Anas platyrhynchos) and wild greenshank (Tringa nebularia) and there is anecdotal evidence on the reaction of whimbrel (Numenius phaeopus) (Allport, 2016). Jarrett et al. (2020) provides the most applicable evidence in the context of species and location, looking at disturbance of wintering waterbirds at coastal sites along the Firth of Forth. High levels of disturbance were recorded in response to a multirotor UAV flown at 30 m altitude, with flight responses significantly more likely at coastal and arable sites than inland lochs. Marchowski (2021) however, provides a more positive outlook. Assessing the interactions of 33 breeding and non-breeding waterbird species, including those relevant to this study, the author reports higher levels of ‘non-responses’ to UAVs above 50 m altitude.
Fewer studies exist on using UAVs to survey birds nearshore and even less offshore: Lieber et al. (2021) used multirotor UAVs to track surface foraging terns and Williamson et al. (2017) investigated the use of UAVs to record foraging seabird interactions with hydrodynamic surface features.
The sections below outline key findings in greater depth. These relate to factors including avian responses to UAVs (disturbance, hostility, habituation) and the effects of UAV type, image resolution, launch methodology, altitude, horizontal distance, angle of approach, speed, movement and environmental factors on the quality of aerial surveys for birds.
Disturbance
A literature review conducted by Mulero-Pázmány et al. (2017) concluded that birds were the most likely taxa to respond to UAVs. The impact of disturbing birds during surveys is twofold: firstly direct changes to behaviour, such as diving or flying, affects the ability of the survey to capture an accurate snapshot of the number of individuals present and their normal spatial distributions under non-observed conditions; and secondarily disturbance behaviours, such as increased activity or reduced feeding, can result in a net loss of energetic intake for the individual (Barnas et al., 2017). This may be particularly detrimental when energy demands are already high, such as during incubation and chick-rearing periods, or when resources are low during winter.
There is still very limited research on the direct impact of UAVs on birds (Allport, 2016), in particular wintering birds or waterfowl. Whilst UAVs have successfully counted colonies of breeding seabirds, this may not translate to wintering individuals.
The strength of a disturbance response is dictated by availability of alternative habitat and the potential cost to fitness (Gill et al., 2001). Wintering birds are less constrained to a specific location and are likely to show increased movement responses compared to their breeding counterparts. In fact, certain species, such as eider, may show increased nest attendance as an adaptive behaviour to aerial predators (Ellis-Felege et al., 2022); a strategy that further aids recording by UAV. Great egrets were more likely to flush in response to UAVs, and at greater distances, during the incubation stage (when there is less constraint to the nest), than the nestling stage (Collins et al., 2019). Flushing responses were higher in non-breeding seabirds than breeding birds (Brisson-Curadeau et al., 2017) and similar findings were reported by Marchowski (2021) in waterfowl, with an 18% disturbance response in non-breeding birds compared to only 3% in breeding individuals. The flushing of non-breeders has even been cited as a useful strategy for increasing the accuracy of breeding counts (Brisson-Curadeau et al., 2017; Harris et al., 2019).
There is also evidence to show disturbance responses are species-specific. Drever et al. (2015) reported gulls and dunlin were most likely to flush in response to a single rotor helicopter UAV, whereas duck species showed little reaction. Dundas et al. (2021) reported distinct species-specific responses in Australian ducks, with some flushing and others displaying no obvious reaction.
Flushing distances have also been positively correlated to colony and flock size. Birds in larger groups are more likely to flush, and at further distances, in response to UAVs, as there is a higher probability of encountering sensitive individuals (Barr et al., 2020; Jarret et al., 2018). This is in line with typical flock protection behaviour, utilised to avoid predators.
Hostility
Most reports of attacks on UAVs occurred during the breeding season and with active breeding adults protecting nests or young. Brisson-Curadeau et al. (2017) reported a herring gull (Larus argentatus) attack when passing over nests with young chicks, resulting in damage to the UAV. Marchowski (2021) reported attacks solely from breeding black tern (Chlidonias niger) despite assessing multiple species. However, this was not consistent across all species. Glaucous gulls and peregrine falcons (Falco peregrinus) did not respond to UAV, even within 5-10 m of nests (Brisson-Curadeau et al., 2017). Valle and Scarton (2019) reported active attacking of multirotor UAVs at an altitude of 20 m-30 m from Eurasian oystercatchers (Haematopus ostralegus). Anecdotal reports of hostility towards the Wingtra one GEN II from oystercatchers were also discussed with colleagues from BioConsult SH (2022). Behaviour was noticeably different to human observers with flushed birds spending longer periods away from nests before returning when the UAV was present. In general, adverse reactions from non-breeding birds comprised of fleeing, with few reports of UAV attacks.
UAV type
The size, shape and noise-profiles of UAVs can elicit different behavioural responses. The most noted stimulus was the wing-profile of the UAV. UAVs resembling aerial predators (i.e., fixed-wing UAVs) are more likely to elicit a disturbance response than smaller multirotor models (Barnas et al., 2017; Brisson-Curadeau et al., 2017; Egan et al., 2020; Ellis-Felege et al., 2022; McEvoy et al., 2016). This may range from low level responses, such as increased scanning and alertness, through medium level responses such as alarm calling to high-level escape responses such as flying or diving. The level of this displayed response depends on several variables including the height flown, species and breeding status. In McEvoy’s comparison of UAV models, the 2 m fixed delta-wing design of the TopoUAV-100 elicited the greatest flight response from non-breeding waterfowl, even over straight fixed-wing designs, as it most resembled a common aerial predator, the white-bellied sea eagle (Haliaeetus leucogaster). This was particularly evident in a direct, rather than tangential approach, at ≤80 m altitude. This can be counteracted by flying at higher altitudes but is then reliant on increased camera performance.
Smaller multirotor UAVs may counteract these aerial predator responses; however, their increased noise profile may elicit different behavioural reactions (McEvoy et al., 2016). The 8-rotor FoxTech Kraken-130 system assessed by McEvoy caused very little disturbance to non-breeding waterfowl when flown down to 40 m altitude, with mild swimming responses at 15 m. Single rotor UAVs have been used successfully to photograph wintering waterfowl, shorebirds and seabirds in Canada (Drever et al., 2015). It may be useful to assess the most common aerial predators of species in the survey area and choose UAV profiles accordingly.
UAV colour (white, black or blue) had no measurable effect on disturbance in mallard (Anas platyrhynchos) or greenshank (Tringa nebularia) (Vas et al., 2015). However, Egan et al. (2020) found birds displayed the lowest disturbance response to a white multirotor UAV as it was less visually conspicuous against its background compared to fixed-wing models. Mapes et al. (2020) reported reduced disturbance from sky blue colouring on the underside of a fixed-wing UAV, although alterations in environmental conditions and flight altitude make it uncertain as to whether the reduction was caused solely by the platform colouring.
UAVs with fuel engines generally increase animal disturbance responses over electric systems (Mulero-Pázmány et al., 2017). However, some studies suggest birds react more strongly to visual stimuli than noise. Egan et al. (2020) found that their predator-shaped UAV elicited the greatest disturbance from birds, despite it being the quietest model.
Image resolution
Sufficient image resolution is an important aspect in identifying birds to species level; particularly in marine SPAs where duck and diver species may share similar identification characteristics and where small cryptic species are present, such as Slavonian grebe.
McEvoy et al. (2016) concluded that only two camera systems allowed for clear identification of similar Australian duck species: their Phase 1 medium camera with 80 mm lens and 50 MP sensor allowing for a 5.5 mm/pixel resolution at 60 m altitude; and, the Sony A7-R with 50-70 mm lens and 36 MP sensor allowing for 7.2 mm/pixel at 50 m altitude.
Drever et al. (2015) recommends a GSD of ≤1.3 cm/pixel to discern plumage traits and identify species, particularly ducks.
Dundas et al. (2021) found that cameras angled down at 45° gave the best view of ducks for identification. Videos allowed for better identification than stills, due to the dynamic nature of waterfowl species, particularly faster fps (60 rather than 30 fps).
Launch
Protocols and locations for launching UAVs should be considered carefully. Flushing responses of non-breeding shorebirds were greatest during the launch sequence for both fixed-wing and multirotor UAVs (Vallery, 2018), with bungee-launched fixed-wing UAVs having the potential to cause greatest disturbance. McEvoy et al. (2016) recommended avoiding approaching birds during take-off as this can resemble aerial predator behaviour.
Launch distance of a fixed-wing UAV was not an important predictor of disturbance in nesting lesser snow geese (Anser caerulescens), however the minimum launch distance of 325 m from birds exceeded that of most studies (Barnas et al., 2017).
Rush et al. (2018) recommended a 20-50 m launch distance for multirotor UAV surveys of nesting lesser black-backed gulls, but breeding birds are likely to show less disturbance at shorter ranges than non-breeding birds. Leiber et al. (2021) launched and landed a multirotor UAV at 200 m distance to minimise disturbance of foraging terns. Vas et al. (2015) recommend a 100 m minimum launch distance for multirotor UAV surveys of wintering waterfowl to avoid disturbance. However, there is anecdotal evidence of a flock of non-breeding whimbrel (Numenius phaeopus) fleeing in response to a UAV being launched at 200 m distance (Allport, 2016).
As a precautionary approach, McEvoy et al. (2016) suggests that both take-off and landing should be undertaken out of sight of target birds.
Survey platform altitude
The height at which UAVs are flown (or ‘survey platform altitude’) is a compromise between disturbance of species, image resolution and field of view (FoV). There is very mixed evidence on the height at which to fly, as this is largely species-specific and dependent on season, UAV type and the objective of the survey.
Flight altitude of a fixed-wing UAV was not an important predictor of disturbance in nesting lesser snow geese (Anser caerulescens), between the range of 75 – 120 m AGL tested (Barnas et al., 2017). As a result, the authors recommend a minimum flight height of 75 m AGL for surveying nesting waterfowl with fixed-wing UAVs. The same heights were assessed by Ellis-Felege et al. (2017) on nesting common eider and no significant disturbance was reported, although slight increases in scanning behaviours did occur. However, reduced flight or “freeze” responses in nesting birds may be an anti-predator response. McEvoy et al. (2016) found minimal disturbance of wintering waterfowl species down to 70 m altitude with straight fixed-wing UAV models (excluding delta shaped-wings). Delta-shaped fixed-wing UAVs elicited responses at ≤80 m altitude.
Drever et al. (2015) found little disturbance of wintering waterfowl and shorebirds at ≥60 m altitude when using a single rotor helicopter UAV in Canada, however some disturbance was noted at all heights (<90 m).
The appeal of multirotor UAVs is that they can be flown at lower altitudes than their fixed-wing counterparts, providing the opportunity for closer-captured footage. Several heights have been tested in the current literature. Leiber et al. (2021) flew a multirotor UAV at 100 m ASL to reduce disturbance in surface foraging terns. Harris et al. (2019) successfully surveyed the Sule Skerry gannet colony with a multirotor UAV at 98 m elevation but noted that non-breeding birds were flushed. Barr et al. (2020) found multirotor UAV surveys at 122 m, 91 m, and 61 m had no effect on colony-wide disturbance across mixed waterbird species compared to control groups, whilst surveys at 46 m significantly increased disturbance. Laughing gulls were the exception, showing increased disturbance at 91 m. Collins et al. (2019) recommend a 50 m altitude for flying multirotor UAVs over great egret (Ardea alba) colonies. Breeding black-headed gulls showed no response to a model-aircraft UAS at 30-40 m AGL (Sardá-Palomera et al., 2012). Rush et al. (2018) reported no flight response and minimal disturbance effects from a multirotor UAV at 15 m altitude above nesting lesser black-backed gulls, if lowered carefully 20 m to the side of the colony following an initial acclimatization flight at 40 m altitude. However, as noted previously, breeding birds are less likely to flush due to the high reproductive cost of leaving nests.
Higher altitudes may be required for surveying wintering birds with multirotor UAVs. McEvoy et al. (2016) noted minimal disturbance of wintering waterfowl down to 40 m altitude, eliciting only mild swimming away responses at 15 m altitude. Jarrett et al. (2020) reported high levels of flight response in coastal wintering waterbirds, such as curlew, redshank, shelduck, and oystercatcher, to a small multirotor UAV when flown at a constant height of 30 m. However, no other altitudes were tested and birds were approached directly. Marchowski (2021) surveyed several breeding and wintering waterbird species and found unacceptable disturbance responses (such as flushing or attacking UAVs) to occur at an average of 35.8 m altitude. Vallery (2018) found that few shorebirds flushed at 20 m height when using a multirotor UAV. Vas et al. (2015) reported that disturbance occurred within ca. 10 m for semi-captive mallards and wild greenshank, with the ability to get as close as 4 m to some birds. However, this appears to be an exception in the current literature. It may therefore be advisable to conduct initial pilot studies with multirotor UAVs at a minimum altitude of 50 m.
Horizontal distance
Depending on the survey requirements, UAVs can be flown at a horizontal distance from birds, rather than directly above. This is especially suitable for cliff-nesting seabirds. Brisson-Curadeau et al. (2017) recommends 20-25 m distance for surveying cliff-nesting species with small UAVs. Lowering UAVs to the side of birds, rather than above, may enable a reduction in the achievable platform altitude, as was the case for Rush et al. (2018) where lowering the UAV to 20 m to the side of a lesser black-backed gull colony allowed a closer disturbance-free approach.
Angle of approach
Angle of approach was not a determining factor in disturbance of cliff-nesting birds, where vertical predation is less often experienced (Brisson-Curadeau et al., 2017). For open ground-nesting birds, such as lesser black-backed gulls, significant disturbance occurs when angling vertically down on colonies (Rush et al., 2018). Egan et al. (2020) found red-winged blackbirds were significantly more likely to alarm call at head-on approaches compared to overhead approaches regardless of UAV model.
Similar reactions are likely to be elicited from wintering waterfowl in open environments. Vas et al. (2015) noted that direction of approach on mallard and greenshank had a significant impact on flushing, with a vertical approach (90° from bird) eliciting the only disturbance responses. Birds showed no reaction at approach angles of 20°, 30° and 60°.
Mulero-Pázmány et al. (2017) confirmed vertical approaches had higher impacts than horizontal. However, it is worth considering that many studies looked at directly approaching birds. Mulero-Pázmány et al. (2017) found that animal responses were higher in studies conducting target orientated behaviour rather than indirect ‘lawn mower’ flight patterns such as those conducted when surveying. McEvoy et al. (2016) found that tangential flight paths do not cause disturbance.
Speed and movement
The optimal speed for surveying birds is a balance between species sensitivity to disturbance and survey requirements. Unsurprisingly many authors advise against rapid movements or sudden drops in elevation (Brisson-Curadeau et al., 2017; McEvoy et al., 2016; Rush et al., 2018), especially banking manoeuvres while changing altitude, as these movements are likely to resemble those displayed by aerial predators.
Drever et al. (2015) flew at 12-15 m/s groundspeed with a single rotor UAV, eliciting minimal responses above 61 m altitude, although disturbance did still occur.
Vas et al. (2015) found no measurable effect of the speed of a multirotor UAV on behaviour of mallard or greenshank when testing at 2, 4, 6 or 8 ms-1, and other studies have shown limited disturbance of birds using multirotor UAVs at ~3-4 ms-1 (Rush et al., 2018; Vallery, 2018).
Dundas et al. (2021) found that flying at higher speeds (20-25 kph or ~5.5-7 m/s) reduced disturbance to sitting waterfowl as there was less time for birds to respond.
Environmental factors
Egan et al. (2020) found that flight responses to UAVs decreased as background light intensity increased. The “disability glare hypothesis” suggests that high ambient light intensity can impair vision in birds and reduce predator escape responses (Fernández-Juricic et al., 2012). UAV surveys may benefit from being flown close to midday or in good weather to further reduce disturbance, although associated potential limitations of systems with respect to survey quality (e.g. due to glare) also need to be considered.
Habituation
Habituation, or the reduction of a bird’s responses after repeated exposure to UAVs, appears to be specific to species and individuals.
Drever et al. (2015) noted signs of habituation in gulls, dunlin and ducks across repeat flights. Jarrett et al. (2020) theorized that reduced responses of inland loch species to multirotor UAV approaches may have been a result of habituation to general human disturbance from dog walkers and boats etc. Terns quickly habituate to UAVs (Chabot et al., 2015) and similar reports are noted for gulls. Gulls, in this case Larus sp., returned to nests ~3 minutes after disturbance by multirotor UAVs, so the authors Brisson-Curadeau et al. (2017) suggest a 5 minute habituation period for gull species. Similarly, Rush et al. (2018) recommended a smooth 40 m flyover of lesser black-backed gull colonies to allow habituation.
However, some species appear not to habituate. No evidence of habituation to multirotor UAVs over the scale of minutes or days was apparent in common and Brünnich’s guillemot (Brisson-Curadeau et al., 2017), suggesting habituation flights are unnecessary for this species.
Consequently, it is worth not only considering the target and non-target species on site, but also the nature of the site in terms of existing disturbance levels (Allport, 2016). Whilst there is currently no research on whether the qualifying waterfowl and shag features of marine SPAs habituate to UAVs, some species such as eider have been reported to show habituation to vessel disturbance (Schwemmer et al., 2011).
Summary of literature review findings
Research on UAVs to survey waterfowl is still in its infancy, and studies on wintering birds are very limited. However, there are several key points based on current understanding from the literature review:
- Disturbance responses are species, situational and individual specific;
- Avian attacks on UAVs are most likely in the breeding season;
- Non-breeding birds show increased flight responses to UAVs as they are less constrained to a particular location;
- Flight responses are more likely at coastal sites than inland lochs;
- Flushing responses increase with flock size as the UAV is more likely to encounter sensitive individuals;
- Visual stimuli may have greater effect than noise;
- Fixed-wing UAVs that resemble aerial predators elicit greater disturbance responses - this can be counteracted by flying at higher altitudes but requires increased camera performance;
- Direct (head-on) or vertical (from 90° above) approaches elicit greater disturbance than passing overhead or tangential approaches;
- Optimal flight heights of UAVs are dependent on several variables, including species, breeding status, flock size, UAV type, angle of approach and UAV movement;
- Launching of UAVs can elicit high disturbance responses in close proximity to the survey site;
- Habituation to UAVs is species and individual specific – more research is needed on whether a habituation period or flight is required; and,
- UAV monitoring is possible under careful consideration and operation.
Based on the current available literature, we suggest a preliminary code of practice to reduce disturbance during UAV surveys of wintering waterfowl:
- Use a pilot with suitable experience;
- Avoid UAV profiles that resemble local aerial predators,
- Straight fixed-wing profile over delta-wing profile,
- Take-off and landing should be conducted out of sight from target birds, especially if using fixed-wing UAVs or bungee launch mechanisms, with a recommended precautionary 200 m distance advised for smaller multirotor UAVs with vertical launch;
- Avoid approaching birds during take-off as this resembles predatory behaviour;
- Given the mixed evidence on suitable altitudes, precautionary minimum altitudes for initial pilot studies are:
- 80 m ASL for delta shaped fixed-wing UAV,
- 70 m ASL for straight fixed-wing UAV,
- 60 m ASL for single-rotor helicopter UAV,
- 50-60 m ASL for multirotor UAV;
- Avoid quick movements, banking manoeuvres or sudden drops in altitude; and,
- Avoid approaching birds vertically (lowering from 90° above) or head-on.
There is little research on the impact of UAV speed, and this will likely be influenced by survey area and survey requirements. Further consideration on the colour of the UAV needs to take place.
Optioneering Study
As a method of determining the feasibility and effectiveness of a technology option against different use cases, the application of an option scoring (henceforth referred to as optioneering) study was developed. The purpose of the optioneering study was to develop, where possible, a quantified method of scoring a technology against a use case. This section outlines use cases identified from the literature review, the UAV technologies considered for use within the optioneering study and the metrics that each option was scored against with the weighting each metric carried. The output scores of each use case are evaluated. Optioneering output tables are presented for each use case with scores for a range of practical technologies.
Methods
The approach to the optioneering study was to first establish a set of use cases and UAV technologies that could be used as input values to a scoring system. To score each technology option, a series of weighted metrics was proposed that allowed an overall survey score for a given option within a use case.
Considered Use Cases
Three main use cases were identified in relation to UAV surveys at SPAs with IWW qualifying features, specifically Scapa Flow and North Orkney.
Use case 1: Large-scale site characterisation survey
Transect design surveys that cover the entirety of an SPA are the most efficient method of obtaining spatial distributions and abundance estimates of species across the whole site. Details are presented in Table 4.
Spatial target area (Size and location) | Entirety of the pSPA boundary: Scapa Flow SPA = 318.20 km2 North Orkney SPA = 211.71 km2 |
|---|---|
| Coverage required | >=25 % (as agreed for digital aerial surveys of Orkney SPAs) |
| Target species | All species in Table 1 |
| Non-target species | All species in Table 2 |
| Aims |
|
| Specific method requirements |
|
| Current approach | Digital aerial survey with transect design (Peters-Grundy et al,, 2025):
|
| Positives of current approach |
|
| Negatives of current approach |
|
Use case 2: Nearshore full coverage survey
Full coverage surveys, particularly of coastline areas, are required for the most accurate population estimates of nearshore species. These surveys provide more accurate population estimates of flocking species such as eider and long-tailed duck where distributions may be severely clumped and also those species that typically occur individually in small numbers, such as black-throated diver.
For developing this use case we considered Scapa Bay to St. Mary’s (sub-area 3) within Scapa Flow (Jackson, 2018). Ideally such surveys would extend to ~3 km offshore: covering the usual visibility range of ground-based observers and the further offshore ‘tricky zone’ (beyond 1.75 km) where visibility begins to decrease and species such as black-throated diver are likely to occur. Details are presented in Table 5.
Spatial target area (Size and location) | Coastline of SPAs – 0 to ~3 km offshore Sample areas: Scapa Flow SPA sub-area 3 - eastern Scapa Flow between Scapa Bay and St Mary’s (20.83km2) Sector 9 = 4.07 km2 Sector 10 = 2.19 km2 Sector 11 = 2.07 km2 Sector 12 = 2.87 km2 Sector 37 = 3.74 km2 Sector 38 = 5.90 km2 |
|---|---|
| Coverage required | 100 % or close to |
| Target species | All species in Table 1 |
| Non-target species | All species in Table 2 |
| Aims |
|
| Specific method requirements |
|
| Current approach | Shore-based vantage point counts: e.g. Scapa Flow
|
| Positives of current approach |
|
| Negatives of current approach |
|
Use case 3: Targeted development areas
Smaller coastal areas targeted for development require ornithological surveys before, during and after construction work. This allows for a direct comparison of species numbers and distributions, as part of pre- and post-consent monitoring.
As an example, we used the planned Hatston Logistic Base, located within sector 14 of the North Orkney SPA (Upton et al., 2018). Current proposals outline a planned development area of 7.5ha (0.075 km2). Ornithological monitoring requires an additional buffer zone around sites, the size of which varies dependent on the species present, the development works proposed and the predicted impacts. As an example, we used a 500 m buffer utilised on similar projects (Attric, 2018), providing a hypothetical survey area of 0.6 km2 or 0.78 km x 0.78 km. Details are presented in Table 6. Whilst larger buffers may be required in the presence of diver species, a buffer of this extent allowed for a use case of different spatial scale to that of use case 2.
Spatial target area (Size and location) | Example: Hatston Pier Project 7.5ha (0.075 km2) development area 500 m buffer used on similar projects (Attric, 2018) Theoretical survey area: ~ 0.6 km2 (0.774 km x 0.774 km) |
|---|---|
| Coverage required | ≤100 % |
| Target species | See Table 1. |
| Non-target species | See Table 2. |
| Aims | Assess and compare distribution and population estimates of species within the survey area before, during and after construction. |
| Specific method requirements |
|
| Current approach | Shore-based vantage point surveys |
| Positives of current approach |
|
| Negatives of current approach |
|
UAS Technology
This section provides an overview of the technologies considered for the use cases presented. Broadly speaking, three main types of UAV were considered and are categorised mainly by the MTOM of the UAV, and therefore the inherent risk associated with a critical failure, as well as the propulsion type. Each weight category fits within specific operational categories discussed previously.
- Smaller multirotor VLOS (MTOM < 25 kg)
- Smaller fixed-wing VLOS (MTOM < 25 kg)
- Larger fixed-wing/multirotor remote operation BVLOS (MTOM <150 kg)
In total 16 different technologies were considered for a range of technology features that determined their feasibility related to the target use cases. The importance of these features is outlined below. Of the platforms reviewed five were chosen to proceed with scoring against a given use case.
Technology features
The payload capacity and MTOM are crucial as they often determine the capabilities of the UAS. Typically, heavier UAVs will include larger or more powerful energy sources for propulsion and/or improved lifting technologies. The increased payload also allows for higher performance sensors to be mounted and therefore improvements in GSD is possible, as well as greater image swath giving increased coverage for a set flight path.
Flight speed was also considered as some use cases required large amounts of data collection over as short a temporal period as reasonably practicable. There are benefits of the ability to loiter or hover for some applications, however this has not been considered further during this project.
Range and endurance are arguably the main aspects that currently limit most UAS operations (Tsouros et al., 2019). The limited weight capacity of the majority of small UASs and the use of batteries as a power source inhibit the range and endurance, typically limited to less than 1 hr. Flights are therefore usually short or interrupted to change batteries before continuing. This could be accounted for by planning scheduled battery change breaks within transect style survey designs to reduce the time delay.
As with manned aircraft and other traditional survey methods, the environmental limitations for operation such as wind speed, cloud cover and precipitation also apply to UASs. While UASs may be able to operate at lower altitudes than manned aircraft, reducing the impact of cloud, the smaller structure inherently makes UASs more susceptible to wind gusts causing instability in the system and impacting data collection, particularly when imagery is involved. Many UAVs are also not rated for use in precipitation and therefore require dry weather to operate. This is particularly important to the Orkney SPAs, or other similar locations, where harsh environmental conditions are common and could limit operations.
Autopilot capabilities are a necessity for aerial surveying with UAS in order to maintain a consistent and stable flight path. Accurate GPS (global positioning system) based navigation or pre-defined flight plan waypoints reduces the human error and inconsistencies that would otherwise be inevitable during VLOS operation of UASs. This also aids in repeatability of surveys as exactly the same design can be flown.
Particularly for BVLOS operation, safety response systems as well as detect and avoid systems are required to provide suitable reduction in risk of collision with obstacles. It is also practical to have a direct method of understanding the telemetry of the UAV and therefore the transmitter ranges for the UAS were considered to allow BVLOS operations.
Disturbance effects are also considered in the choice of UAS relating to the size of UAS, its profile (i.e. silhouette shape from below) and image sensor specifications that determine the flight height requirements to obtain at least satisfactory GSD. Noise is also considered as a potential source of disturbance, although quantified data on most UASs are not readily available.
Considered technology options
The five UAS that are featured in this feasibility study are outlined in Table 7 and technical capabilities discussed for each UAS with a general overview of each presented below. Images of each UAV are presented in Figure 1.
| Feature | Wingtra One II | SenseFly eBee X | DJI Phantom 4 Pro V2 | DJI Matrice 300 RTK | Custom UAS |
|---|---|---|---|---|---|
| Type | Fixed-wing (VTOL) Profile: Delta | Fixed-wing Profile: Delta | Multirotor Profile: Quadcopter | Multirotor Profile: Quadcopter | Fixed-wing Profile: Straight |
| Operation type | VLOS / BVLOS | VLOS / BVLOS | VLOS / BVLOS | VLOS / BVLOS | BVLOS |
| Operation location | Semi-remote | Semi-remote | Semi-remote | Semi-remote | Remote |
| MTOM | 4.5 kg | 1.6 kg | 1.375 kg | 9 kg | <150 kg |
| Wingspan / Diameter | 1.25 m | 1.16 m | 0.35 m | 0.895 m | ~3 m |
| Flight speed | 16 m/s | 18 m/s | 14 m/s | 17 m/s | ~36 m/s |
| Endurance | 50-60 mins | 90 mins | 30 mins | 55 mins | ~5 hours |
| Wind limitations | 12 m/s | 12.8 m/s | 10 m/s | 15 m/s | 18 m/s |
| Sensor | RX1R II (1.5 cm GSD @120 m) Resolution: 8000x5460 Camera angle: Nadir FPS: 1.7 | SenseFly S.O.D.A (2 cm/px @ 96 m) Resolution: 5472 Camera angle: Nadir FPS: 1.0 | 1" CMOS 20 MP (2 cm/px @ 73 m) Resolution: 5472 x 3648 Camera angle: Oblique FPS: 2.0 | Zenmuse P1 (1.5 cm/px @ 120 m) Resolution: 8192 x 5460 Camera angle: Oblique FPS:1.4 | 3 x HiDef bespoke (1.2 cm/px @ 300 m) Resolution: 6480 x 2160 Camera angle: Oblique FPS: 8.0 |
| Coverage / hour | 6.91 km^2/hr | 7.09 km^2/hr | 7.52 km^2/hr | 5.52 km^2/hr | 50 km^2/hr |
| Control range | 10 km | 8 km | 6 km | 8 km | Unlimited |
| Noise | Low | Low | Low | Low | Medium |
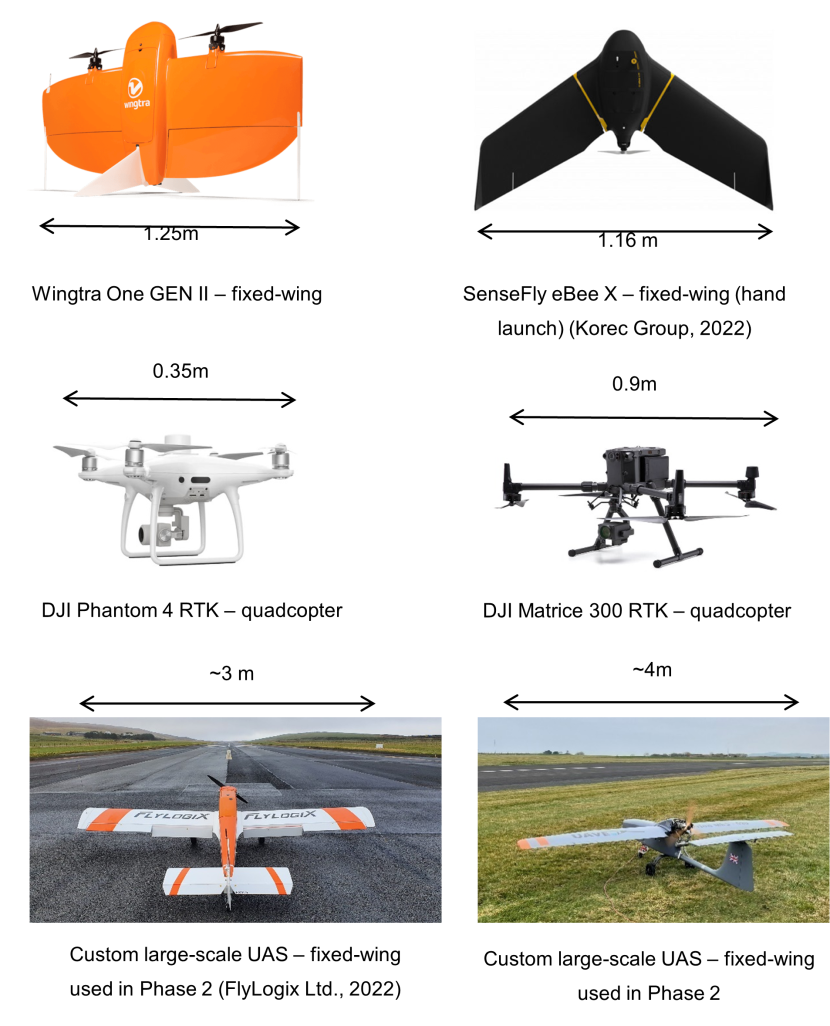
Figure 1. Example of UAS technologies and their visual appearance.
Click for a full description
Examples of two main types of unmanned aerial vehicles (UAS): fixed-wing and quadcopter.
Four fixed-wing models are presented:
- Wingtra One GEN II 1.25m
- SenseFly eBee X 1.16m
- Two custom models used in Phase 2 Technical Development and Trials
Two quadcopter models are presented:
- DJI Phantom 4 RTK 0.35m
- DJI Matrice 300 RTK 0.9m
For each model, the overall wingspan is show in metres. Further descriptions are now in Table 7.
Wingtra One GEN II
The Wingtra One GEN II (Wingtra, 2022) is a vertical take-off and landing (VTOL) fixed-wing UAV. This offers the benefits of reduced area requirements for take-off and landing that multirotor UAVs offer, with the added benefits of increased endurance and speed from the fixed-wing layout. The Wingtra has fully automated flight with mission planning capabilities and can be operated at BVLOS. For this study the Sony RX1R II sensor was chosen for its spatial resolution capabilities up to the maximum flight height of 120 m. The Wingtra One has been used by colleagues at BioConsult SH (2022) who were able to provide details on the operation of the UAS.
SenseFly eBee X
Utilised in multiple papers considered during the literature review (Gómez-Gutiérrez, A. and Gonçalves, G. R., 2020, Mapes et al., 2020., and Puliti et al., 2015), the SenseFly eBee (SenseFly, 2022) was chosen as a viable option for its fixed-wing configuration and low MTOM of 1.6 kg, offering ease of transport particularly in remote locations around SPA coastlines. The flight speed and endurance of 18 m/s and 90 minutes ranked highly in similar UAV types offering increased coverage per flight. The low MTOM does however limit the payload capability reflected in the GSD at 120 m altitude of 2.5 cm. However, this is not outside the limits of GSD for identification of birds and could be improved by flying lower, depending on disturbance impacts. This UAS has similar mission planning and autopilot functions to the Wingtra One and is again operated within VLOS but has been operated BVLOS in other countries.
DJI Phantom 4 RTK
DJI offer a range of multirotor style UAVs with adequate capabilities for relatively low cost. With the future of UAS flight tending toward BVLOS operation, DJI have implemented flight safety features into many of their UAVs, such as obstacle sensing that allows pilots to operate in more challenging environments and BVLOS. Such features are included on the UAVs considered here with the intent of future expansion of UAV operations as regulations develop.
The DJI Phantom 4 RTK (DJI, 2022) and similar models are commonly used UAVs for hobbyists and were regularly found within considered literature (Barr et al., 2020 and Brisson-Curadeau et al., 2017). This model’s ‘off the shelf’ capability makes it relatively easy to operate but limits its range of operation. However, low weight, coupled with reduced sensor capabilities (2 cm/pixel [px] GSD at 72 m) does increase the endurance of the system. The Phantom 4 can be operated BVLOS but its short endurance might limit the practicalities of operating in this category.
DJI Matrice 300 RTK
The final multi-copter considered was the Matrice 300 RTK which is included as a viable option for a large range of operations requiring reduced GSD below 2 cm/px. This is largely a function of the increased payload capabilities of the UAV allowing more sophisticated sensor attachments that also include thermal, LiDAR and hybrid sensors. For this application the Zenmuse P1 gimbal system is specified but the flexibility that this system would have is noted for future applications in ornithological surveying as technology advances and procedures develop. The Matrice 300 has additional obstacle sensing technologies that would allow BVLOS operation to be utilised if chosen.
Large-scale custom UAS
Several large UAV providers have developed current technology specifically for the use of long range BVLOS operation. The custom UAS has the largest endurance characteristics of any of the chosen technology options. As this option is customised for HiDef payload and use case, values for features in Table 7 are approximated. This UAS would also be operated in BVLOS and the specific category.
Bespoke custom UAV providers also have experience working closely with the CAA to develop use cases where TDAs are applied. Because of this, the custom UAV option is perhaps one of the few viable options for large-scale surveys where endurance of multiple hours is required with BVLOS operations. The operation of the large-scale custom UAS is within the specific category of the CAA legislation.
UAS technical challenges
To summarise, the key challenges that are faced during the application of UASs for ecological surveying are:
- Most commercially available UASs have low endurances of less than 1 hour that limit continuous data acquisition.
- Payload limitations restrict the sensor capabilities required for GSD < 2 cm.
- VLOS operation limits the horizontal range of operations without additional authorisation.
- Speed and altitude limitations increase the time required to achieve a given target coverage.
Disturbance characteristics of different platforms are inconclusive, causing uncertainty in UAS choice for a given application and meaning further testing is required before carrying out surveys.
Scoring Metrics
The metrics that were determined as influencing factors in the efficacy of a UAS with respect to the type of survey are outlined in Table 8 and described in further detail below. These were chosen and agreed with the project steering group (PSG) as practical metrics that allow the benefits and limitations of each technology option to be compared.
| Metric | Summary of Metric | Weighting (1-5, Higher is more important) | Scoring - relative to other options (1-5, Lower is better) |
|---|---|---|---|
| Duration of survey | The ability to capture a 'snapshot in time' of the survey area | 2 | Score in 20 % intervals between min & max duration of survey for a given use case (i.e. 0 % - 20 % above min time = 1) |
| Species identification | The ability to identify targeted species for a given use case | 5 | Score in 20 % intervals between min & max GSD, frames per second (fps) and camera angle of options for a given use case (i.e. 0 % - 20 % above min score = 1) |
| Operational complexity | A measure of the difficulty involved in the organisation and completion of a survey for given technology with respect to its use case (e.g. notice periods, disruption to other traffic etc.) | 3 | Score in 20 % intervals relative to other options for given use case (i.e. 0 % - 20 % above min time for flight approval = 1) |
| Weather limitations | A measure of the limitations of a technology with respect to weather conditions (e.g. cloud base, wind speeds etc.) | 2 | Score in 20 % intervals for average days available with suitable weather to successfully complete survey for a given use case (i.e. 80 % - 100 % = 1) |
| Sampling intensity / coverage | A measure of the amount of coverage achieved relative to a defined target for given use case | 3 | Score in 20 % intervals relative to target coverage for a given use case (i.e. 80 % -100 % = 1) |
| Disturbance impact | Measure of the disturbance of target species from survey platform | 4 | Relative to other options for given use case |
| Safety | A measure of the risks associated to the operator and public with respect to each technology | 2 | Relative to other options for a given use case against traditional survey methods |
| Cost | A measure of the normalised cost to conduct surveys | 3 | Score in 20 % intervals between min & max cost of options for a given use case (i.e. 0 % - 20 % above minimum survey cost = 1) |
A technology in this instance refers to a unique method of surveying. This includes traditional methods such as vantage point (VP) and DASs. Single UAVs may present multiple technology options through different survey design parameters such as GSD or area coverage.
Each metric was scored from 1-5 with lower values representing higher ranking scores. The metrics carried the respective weighting presented in Table 8 from 1-5 where higher values represent metrics that are more important for the output quality of data as agreed with the PSG.
For each option, the total score was calculated by multiplying the respective metric weighting and score together to provide a weighted score. The sum of the weighted metric scores for each option then output the total score as shown in Equation 1.
Weightingm is the metric weighting and Scorem is the metric score.
The total score gave the overall performance of an option within the use case. One aspect that has been discussed as a potential benefit from UASs is cost. Therefore, a cost normalised score is also output to identify options that may be more cost effective and feasible for lower budget organisations, projects or surveys. This was calculated by subtracting the costing metric score within the total output score and then multiplying by the survey cost (in thousands). For both total score and cost normalised score, lower values indicate better or more cost-effective performance respectively.
For each use case, a traditional method of surveying was included as a baseline measurement.
Duration of survey
The timeframe that the data is collected over is an important factor to reduce double counting of birds in imagery. Capturing data over the shortest practical time period reduces the risk of factors that cause bias in the data. This was therefore chosen as a metric after considering that flight speeds and reduced spatial resolution, and hence increased number of transects, could alter the time required to survey an area when compared to other traditional methods.
Factors that influence the duration of survey in respect to the UAS are the sensor swath, influenced by the target GSD and sensor resolution, and platform speed. These were used to determine an approximate value for the area that could be surveyed per unit hour for each technology option. This then allows for a reasonable scaling option as area sizes change between use cases and utilise different coverage targets. Equation 2 used for this is presented below.
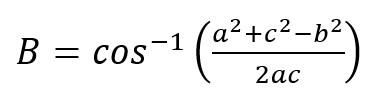
Equation 5
Where: GSD is in metres, Xpixel is the horizontal sensor resolution and v is the flight speed (m/s) of the UAS. A scaling factor of 2 was used to account for additional time spent turning and aligning for transects ahead of data recording.
Species identification
The ability to identify birds to species level from the imagery collected was a critical feature of the technology. NatureScot identified species identification as one of the limiting factors associated with other DAS methods. Therefore at least comparable species identification capabilities are required from any UAS technology.
Inputs that determine the ability to identify species were scored and weighted in a similar method to the overall scoring system. Inputs were scored 1-5 (lower being better) and weightings applied between 1-5 (higher being more important). An input score was calculated by multiplying the score and weighting. The sum of the scores from each input was then used to determine a species identification score relative to the other options in the use case.
The inputs used to determine the species identification scores were:
GSD – Reduced pixel size allows for clearer images and increased identification ability.
Number of images of each bird – Due to the periodic nature of wing beats and continuous movement of targets, there are benefits to capturing more than 1 image of each bird. Based on HiDef experience, the limit to the expected gains from this are up to 5 images.
Camera angle – There are two benefits to be gained from the camera being angled from the vertical plane: Firstly, on clear, bright days, glare off reflective surfaces (i.e. water) reduces the ability to detect and identify birds as images become over exposed and saturated. Operationally, this causes an issue when the Sun is at its maximum elevation during the zenith. Angling the camera reduces this impact of glare and allows for increased identification rates; and additionally, oblique imagery of a bird can give a more optimal perspective allowing greater confidence in identifications.
Operational complexity
The operational complexity was scored based on the approval process required to operate each technology option in a use case. To provide an approximate value to gauge this, the time period for operational authorisation from the respective regulatory bodies was used, measured in weeks.
While there are additional complexities in operating UAS particularly in BVLOS scenarios, the time increase for approval was viewed as a reasonable metric to quantify the challenges.
Weather limitations
Weather limitations were scored using inputs for survey altitude and platform resistance to wind and precipitation. Historical weather data from Kirkwall Airport for the days of 01 December 2021 to 17 February 2022 was collected to provide actual data on the proportion of days where operation would have been feasible (Aviation Weather Chart Archive, 2022). This was calculated as the number of days where cloud base was above the survey altitude, wind speeds were below the manufacturer specified platform limitations and there was little or no precipitation. The Kirkwall site was chosen due to its relatively central location to the Orkney SPAs and availability of historical data (see Annex 3).
Sampling intensity / coverage
The sampling intensity score aimed to provide a gauge on the power of the data and is related to the achievable coverage of a technology compared to the target coverage required for a given use case. The input value for this score was the percentage of the total survey area that would be surveyed for a given use case. The score is relative to the target survey coverage.
Disturbance impact
As discussed in the literature review, disturbance impacts are integral for assessing the use of UAS for ornithological surveying. Based on the research conducted, the size, survey altitude, noise and profile of the UAV were considered as inputs to the output score of this metric.
Platform size (wingspan or diameter) and survey altitude were used to calculate a perceived size which varies as the distance from the observer changes. This also allowed for a comparable value between all technologies for their respective altitudes.
Noise level was less of a contributing factor to disturbance but still worth considering particularly when comparing manned aircraft, UAS and human observers on the ground. A volume level of high, medium, low or minimal was used for each option within a use case.
The profile of each technology linked the perceived likeness to predators and hence the potential for increased disturbance.
All inputs related to a score ranging from 1-5 (lower being higher ranking) and the sum of all the scores related to an overall disturbance impact score.
Safety
The risk associated with using each technology was considered as a metric contributing to the technology options overall score. There are two factors to consider with safety; the operator / field observers’ risk of injury, and the risk posed to members of the public or property form the activity. The operation type was categorised for each technology option as either:
Vantage point – Ground observers in the field have minimal risk to others and low risk of injury to themselves. This was considered as the safest method of surveying.
Remote – Operating BVLOS, a pilot can be safely contained in mobile units reducing chance of pilot injury. Additional risk assessments during planning and operation in the specific category also mitigate risk to others and remote operation was therefore considered the second safest method.
Semi-remote – Operation in VLOS where the pilot must be out in the field similar to a VP observer exposed to similar risks. Additionally, risk to the public is increased, associated with the UAS flight although is minimised by pilot competency and correct operational procedures followed in line with the open category regulations. This was considered to be the third safest type of operation.
Manned aircraft – Although still a safe method of surveying within a highly regulated industry, this was considered to be the least safe method due to the operators being in the aircraft for long periods of time. The larger aircraft also poses a larger risk to others in the unlikely event of a failure.
Cost
The cost was input as the overall survey costing in £1000s. To establish approximate costings for a survey the platform cost, pilot daily rate and image processing / analysis are considered as contributing factors to an overall costing.
The costs associated with a fully qualified and experienced pilot, that would be required for operation, not least because of the potential complications of disturbance of birds, can typically be expected to be in the region of £300-£400 per day for standard commercial applications (UAV Scotland, 2022). Prices are expected to rise as the complexity and exclusivity of the application increases. An employed UAV pilot salary would likely be in the region of £40,000 per annum which, once accounting for days unable to fly, equates to similar daily rate.
The processing cost for the imagery is an area that requires further investigation and development. As with the actual flight of the UAS, autonomy is a key feature that helps improve the quality of the data being collected. During data processing, automation also offers reductions in time to analyse data using AI for object detection. Fewer hours spent analysing imagery for target species whatever the application equates to reduced survey costs overall.
At the time of this review, the autonomous applications for detection of birds using UASs is still in its infancy but has shown promising results (Hong et al., 2019 and Kellenberger et al., 2021).
An approximated cost for each technology within each use case are presented in the output tables presented in the optioneering study section of the report.
The score given to each option is relative to the scores for each technology within the use case with lower costs ranking higher.
Results - Optioneering Study
The results for the optioneering study of each use case are presented in this section. Inputs for target area, size, target species and coverage, presented in Tables 4, 5 and 6 for respective use cases, were used alongside technical inputs for each UAS outlined in Table 7. For traditional manned DAS, the HiDef bespoke system was used. Fully detailed specifications of this system are not shared for confidentiality reasons but have been suitably used within the scoring metrics.
It is worth noting that within these use cases, the UAV options do not address the availability bias in data caused by diving species. That is also experienced with traditional DAS. A similar method of applying bias correction factors to account for this would therefore be used for any UAV survey footage.
Use case 1: Large-scale site characterisation survey
Technologies considered for this use case were limited by endurance capabilities. Therefore, only the custom large-scale UAS is utilised. An overview of the technology options is provided below.
- Option 1: This was the traditional technology option for site characterisation based on a DAS using HiDef’s bespoke sensor system with 2 cm GSD and achieving the target coverage of 25 %.
- Option 2: Large-scale custom UAV with 2 cm GSD and 25 % coverage.
- Option 3: Large-scale custom UAV with 1.5 cm GSD and 25 % coverage.
- Option 4: Large-scale custom UAV with 1 cm GSD and 25 % coverage.
- Option 5: Large-scale custom UAV with 1 cm GSD and 12.5 % coverage.
The option inputs and the output values for each scoring metric are presented in Table 9.
| Inputs & Metric | Option 1 | Option 2 | Option 3 | Option 4 | Option 5 |
|---|---|---|---|---|---|
| UAV type | Manned | Fixed-wing BVLOS (Custom) | Fixed-wing BVLOS (Custom) | Fixed-wing BVLOS (Custom) | Fixed-wing BVLOS (Custom) |
| GSD ( cm) | 2 | 2 | 1.5 | 1 | 1 |
| Duration of survey (hours) | 3.1 | 10.4 | 13.8 | 20.8 | 10.4 |
| Coverage (%) | 25 % | 25 % | 25 % | 25 % | 12.5 % |
| Duration of survey score | 1 | 3 | 4 | 5 | 3 |
| Species identification score | 2 | 2 | 1 | 1 | 1 |
| Operational complexity score | 1 | 4 | 4 | 4 | 4 |
| Weather limitations score | 4 | 2 | 2 | 2 | 2 |
| Sampling intensity / coverage score | 1 | 1 | 1 | 1 | 5 |
| Disturbance impact score | 3 | 2 | 2 | 2 | 2 |
| Cost score | 1 | 1 | 3 | 5 | 1 |
| Safety score | 5 | 2 | 2 | 2 | 2 |
| Total score | 51 | 50 | 53 | 61 | 57 |
| Survey cost (£1000s) | 30 | 30 | 40 | 50 | 30 |
| Cost normalised score | 1440 | 1410 | 1760 | 2300 | 1620 |
From the total score alone, the highest performing option is option 2, the custom UAS at 2 cm GSD with a total score of 50. Option 2 is also the highest ranking cost normalised scoring option. While it offers similar capabilities to the traditional DAS method with respect to species identification and sampling intensity, there are benefits from improved safety and reduced weather limitations from cloud cover caused by lower flight altitudes at ~300 m. The reduced size of the UAS compared to a manned system as well as lower noise, would be expected to reduce disturbance but would require confirmation with trial flights and further research. The challenges faced with this option and all other UAS based options in this use case are the additional operational complexities associated with specific category authorisations and the use of TDAs.
The custom large-scale UAVs also fly slower than a manned aircraft, increasing the duration of the survey. The duration of survey for option 2 is over twice that of the endurance capabilities of the custom UAS and the available daylight hours in winter months (~5 hr). Using a single UAS, the survey would have to be completed over multiple days increasing the operational complexity and potential limitations from weather. This also potentially reduces the robustness of the data collected. A possible solution to mitigate this would be to fly two or three UASs at once however, further work with a UAV provider is required to determine the efficacy of this.
A noted option for this use case is for the custom UAS at 1 cm GSD and 12.5 % coverage. The improvement in GSD compared to 2 cm could allow for improved identification of species that pose a challenge with current DAS technology. The duration of survey for both option 2 and 5 are the same due to reduced coverage in the latter. As a result of this the survey costs are similar making option 5 a more cost-effective survey method than option 3 that, based on performance alone, ranks higher.
The continued progression of technology and use of UAS in industry is rapidly improving the capabilities and inevitably cost benefits. Another benefit from UASs that is often not considered is the ability to base a UAS at a location with relative ease and operate directly from that site. This reduces transit costs typically incurred with manned aircraft and can also result in a large reduction in carbon emissions.
Use case 2: Nearshore full coverage survey
For use case 2, the survey area was assigned an average value over the 7 sectors identified in Table 5, scaled up from the original range of 0-2 km offshore to 0-3 km range. This gave an average sector area of 5.5 km2 that was used as the input for use case 2. The target coverage for this use case was 100 % of the 0-3 km range from the shoreline. As the target areas are within the practical range of operation for the smaller VLOS UAVs, a wider variety of UAV types were considered for this use case:
- Option 1: The traditional survey method for this type of survey is by VP ground observations. For traditional VP surveys, it is recognised that species identification reduces beyond 1.75 km range and is limited to 2 km. Therefore, an approximate achievable coverage of 60 % of the sea surface area within 3 km of the shoreline was used for the traditional survey method. It is assumed that the average time to survey a sector is approximately 1 hour based on an assumption of 2 vantage points per sector, spending 20 minutes at each location with the additional walking between vantage points (~20 minutes).
- Option 2: Custom large-scale UAS with 2 cm GSD and 100 % survey area coverage.
- Option 3: Custom large-scale UAS with 1 cm GSD and 100 % survey area coverage.
- Option 4: Wingtra One GEN II (VTOL) UAV with 1.5 cm GSD. The practical limit for VLOS operation is ~1.2 km. As such, the coverage for all the VLOS options provided are limited to this and therefore have a coverage of 40 % of the sea surface area within 3 km of the shoreline.
- Option 5: SenseFly eBee X with 2 cm GSD and coverage of 40 %.
- Option 6: DJI Matrice 300 RTK multirotor UAV with 1.5 cm GSD and 40 % area coverage.
- Option 7: DJI Phantom 4 multirotor UAV with 2 cm GSD and 40 % area coverage.
An overview of the option inputs and total output scores with metric breakdown are presented in Table 10 for use case 2.
| Inputs & Metric | Option 1 | Option 2 | Option 3 | Option 4 | Option 5 | Option 6 | Option 7 |
|---|---|---|---|---|---|---|---|
| UAV type | Human observer: | Fixed-wing BVLOS (Custom) | Fixed-wing BVLOS (Custom) | Fixed-wing VLOS (Wingtra) | Fixed-wing VLOS (eBee X) | Multirotor VLOS (Matrice 300) | Multirotor VLOS (Phantom 4) |
| GSD ( cm) | N/A | 2 | 1 | 1.5 | 2 | 1.5 | 2 |
| Duration of survey (hours) | 1.0 | 0.4 | 0.8 | 0.8 | 0.8 | 0.7 | 1.0 |
| Coverage (%) | 60 % | 100 % | 100 % | 40 % | 40 % | 40 % | 40 % |
| Duration of survey score | 5 | 1 | 4 | 4 | 4 | 3 | 5 |
| Species identification score | 1 | 2 | 1 | 1 | 2 | 1 | 2 |
| Operational complexity score | 1 | 3 | 3 | 1 | 1 | 1 | 2 |
| Weather limitations score | 1 | 2 | 2 | 1 | 1 | 1 | 2 |
| Sampling intensity / coverage score | 3 | 1 | 1 | 4 | 4 | 4 | 4 |
| Disturbance impact score | 1 | 2 | 2 | 2 | 4 | 2 | 1 |
| Cost score | 1 | 5 | 5 | 2 | 2 | 2 | 2 |
| Safety score | 1 | 2 | 2 | 3 | 3 | 3 | 3 |
| Total score | 38 | 55 | 56 | 50 | 63 | 48 | 58 |
| Survey cost (£1000s) | 1 | 15 | 17.5 | 7 | 7 | 6 | 6 |
| Cost normalised score | 35 | 600 | 718 | 308 | 399 | 252 | 312 |
The VP method appears to be the most cost-effective method for nearshore surveys. The low cost, relatively straightforward operation and adequate identification of species are all contributing factors to this. However, it should be noted that this method does not address the issue of limited detectability of target species 2-3 km from the shoreline. While VLOS also limits the coverage capabilities of the UAS in this case, authorisation for BVLOS operations would allow 100 % coverage out to 3 km providing a unique case where species counts are currently limited. Furthermore, the repeatability of the surveys and ability to audit species identifications only stands to improve the quality and reliability of data from nearshore surveys.
BVLOS operation using the custom large-scale UAV would allow for all nearshore areas to be surveyed in shorter period compared to VP surveys. This may reduce operational time to within a day compared to several days in which case the benefits from shorter survey duration could balance out the trade-off with increased costs, which do not increase directly proportionally to survey area. This also increases the coverage out to 3 km from the shoreline which is currently unachievable using VP methods. This would also allow coverage over areas currently inaccessible using VP surveys such as remote islands.
The additional challenge however, as highlighted by the operational complexity scores for both large-scale UAS options in Table 10 (options 2 and 3), is that the UAS operation is then classed in the specific category. Additional costs for approval and planning time are required which reduces the cost effectiveness of the technology. If this was to be considered, it would be worthwhile upgrading to a larger UAS that could remain in the open category, if possible, to allow greater flexibility of operation in both open and specific categories.
Of the 6 UAS options addressed for use case 2, the DJI Matrice 300 RTK and Wingtra One GEN II are the highest ranking for overall performance and cost normalised scores after the VP option. Both would potentially be capable of surveying each sector within the endurance of the UAS. However, the pilot would require several replacement batteries to survey all 7 sectors. It is also worth noting that within VLOS operation, the coverage is also less than the VP survey. There would however be no reduction in detection and identification rates as the horizontal distance from the shoreline increased as is seen in VP surveys.
Use case 3: Targeted development areas
The input values for the final use case targeted at development areas were a survey area of 0.6 km2 with 100 % coverage if achievable, but not essential. The options chosen were related to the requirements and as such, the custom large-scale UAS was not considered for this application as they are more suited to larger-scale survey areas. The options considered for use case 3 were:
- Option 1: The traditional method for survey of this type of area is by VP, similar to the nearshore use case. The achievable coverage for this area was assumed to be 100 % based on the external ranges of the site being within 1.75 km. An approximate duration of 1 hour was assumed to survey the site from 2 VP locations.
- Option 2: Wingtra One Gen II operating in VLOS with 1.5 cm GSD and 100 % coverage.
- Option 3: SenseFly eBee X operating in VLOS with 2 cm GSD and 100 % coverage.
- Option 4: DJI Matrice RTK operating in VLOS with 1.5 cm GSD and 100 % coverage.
- Option 5: DJI Phantom 4 operating in VLOS with 2 cm GSD and 100 % coverage.
BVLOS is not necessary for the range in this use case, but may be considered for areas that are located further offshore.
The output scores from the optioneering study of use case 3 are presented in Table 11 below.
| Inputs & Metric | Option 1 | Option 2 | Option 3 | Option 4 | Option 5 |
|---|---|---|---|---|---|
| UAV type | Human observer: | Fixed-wing VLOS (Wingtra) | Fixed-wing VLOS (eBee X) | Multirotor VLOS (Matrice 300) | Multirotor VLOS (Phantom 4) |
| GSD ( cm) | N/A | 1.5 | 2 | 1.5 | 2 |
| Duration of survey (hours) | 0.5 | 0.2 | 0.2 | 0.2 | 0.3 |
| Coverage (%) | 100 % | 100 % | 100 % | 100 % | 100 % |
| Duration of survey score | 5 | 1 | 1 | 1 | 2 |
| Species identification score | 1 | 1 | 2 | 1 | 2 |
| Operational complexity score | 1 | 1 | 1 | 1 | 1 |
| Weather limitations score | 1 | 1 | 1 | 1 | 2 |
| Sampling intensity / coverage score | 3 | 1 | 1 | 1 | 1 |
| Disturbance impact score | 1 | 2 | 4 | 2 | 1 |
| Cost score | 1 | 5 | 5 | 5 | 5 |
| Safety score | 2 | 3 | 3 | 3 | 3 |
| Total score | 40 | 44 | 57 | 44 | 49 |
| Survey cost (£1000s) | 1 | 4 | 4 | 4 | 4 |
| Cost normalised score | 37 | 116 | 168 | 116 | 136 |
As with use case 2, the VP survey initially appears to be the optimal option. It receives the highest ranking for total and cost normalised scores at 40 and 37 respectively. However, as with use case 2, the issue of limited detection at 2 km offshore could be an issue for larger development areas.
Interestingly the Phantom 4 is the second highest ranking option with a total score of 49 that betters the Wingtra and Matrice 300, but a cost normalised score of 136 compared to 168 for other UAS options.
The tied total score for the Wingtra and Matrice 300 UAS is largely a function of their GSD. The GSD of the Phantom 4 and eBee X could be improved by flying at lower altitudes, however there is a risk of increasing disturbance impacts from this which are unconfirmed at present. The eBee X also resembles a profile similar to a predator with its delta-wing style that has already been proposed as a potential cause of disturbance.
The additional benefits in identification audit and directly repeatable surveys flown using autopilot functions allow for more robust data collection and analysis. For small-scale surveys such as the development area at Hatston pier, a UAS could be considered a practical solution or aid VP surveys if EVLOS or BVLOS operation is used to extend the area coverage further than 2 km offshore.
It is worth considering however that for this type of application, the survey is close to public and populated areas that add marginal complexity to operation and may limit operations, in particular the MTOM of the UAV and therefore its payload and sensing capabilities.
Phase 1: Conclusions and Recommendations
Conclusions
A review of past literature identifies there is a clear case to be made for using UASs to survey waterfowl species at locations such as the Orkney SPAs. UASs may provide solutions to a number of the challenges encountered in surveying wintering waterfowl, including detecting cryptic inshore species that may be hidden by vegetation or VP perspective; expanding visibility offshore for species at the edge of human vision; and counting roosting birds on inaccessible islands and coastlines. UAVs are limited by flight speed, increasing duration of the survey, however, this can be mitigated by using multiple units at low capital cost.
Of the wider selection of use cases identified from literature, use cases considered within this report include:
- Large-scale site characterisation surveys;
- Nearshore full coverage surveys;
- Targeted development areas.
The optioneering study was time-limited allowing evaluation of only three use cases. The three chosen use cases were assessed as they were identified as the most relevant to the Orkney SPAs based on past survey methods and ongoing development plans in the area.
The optioneering study of the three use cases identified some general points:
- VLOS operation limits the practical range of operation which reduces the effectiveness of the technology particularly when comparing to traditional VP methods.
- Operating in BVLOS adds further complexity to UAS operation but would be useful to overcome limitations in operating range and would also offer advantages around completion of the entire shoreline surveys in much shorter timeframes.
- Platform endurance is still a limiting factor for any survey larger than approximately 4-5 km2.
- Disturbance impacts are still uncertain, and an important aspect of feasibility would be to identify these for both target and non-target species in survey areas.
The optioneering study provided at least two potential use cases where UAVs could aid in surveying at small-scale targeted development areas as well as large-scale site characterisation surveys. Large-scale BVLOS UAVs such as the custom system were identified as an improved method of survey compared to traditional DAS. This is the only option across the use cases where a UAS approach produced a more cost-effective solution as opposed to the traditional method. It is noted that the benefit in this case is not from reduced cost, but improved performance given predicted (but not assessed) reduced disturbance, safety concerns and weather limitations.
Nearshore, full coverage surveys are difficult to achieve successfully using the custom UAV due to associated costs, although there are likely to be reasonable efficiencies gained if covering a higher proportion of the coastline than can be achieved using VP surveys with the additional benefit of auditing data. Smaller UAVs under VLOS operation like the Wingtra and Matrice 300 RTK do not improve survey outputs. BVLOS operation could allow for full coverage of the 0-3 km nearshore use case range and would also provide a method for surveying areas that are currently not possible with VP or boat surveys. It is noted, however, that use of UAVs does not currently address the availability of diving bird species; similarly to the traditional survey methods an availability bias correction can be applied to the data in the analysis phase.
For the targeted development use case, the eBee X option was the optimal UAS within the particular use case largely due to lower survey cost but still did not result in any cost benefit compared to traditional VP surveys. However, additional benefits from robust data acquisition and processing should be considered as a trade-off in this instance. More inaccessible or larger development sites would likely see closer comparability to VP surveys, and it is likely that UAVs would start to become more realistic options in such cases.
Small, low cost UASs such as the Phantom 4 could provide a potential technology option to be used in small-scale projects <1 km2. However, small-scale UAVs (MTOM<25 kg) have limited capabilities for endurance such that even if operated BVLOS they are unlikely to effectively survey areas larger than nearshore sectors without multiple flights or UAVs used.
The most likely use case based on optioneering outputs to benefit from UAS technology is the larger-scale site characterisation surveys using custom built, BVLOS, high endurance UAS. Larger UAVs operating BVLOS are at the start of development towards what is considered the most viable solution for larger site characterisation surveys and presented as a cost-effective solution that could also introduce a step change in spatial resolution capabilities within the aerial ecological surveying industry.
Research Gaps
Currently there are no targeted studies on the disturbance effects of UAVs on inshore wintering waterfowl (IWW). In addition, there are very limited studies on other species likely to be present in marine SPAs. Marchowski (2021) and Jarrett et al. (2020) present the most relevant findings from disturbance studies including species such as red-breasted merganser and long-tailed duck. However, the studies do not distinguish disturbance by species, but present results at a wider group level.
Further research on the safe operating thresholds at a local scale are required, with pilot studies aimed at examining behavioural responses of target species, particularly in the presence of predatory species (Barr et al., 2020; Brisson-Curadeau et al., 2017). Several variables should be considered including UAV type (shape and colour), launch distance, survey platform altitude, airspeed and noise. Systematic testing of responses during ‘monitoring’ style flights are encouraged, with independent observers present to assess disturbance. Habituation could also be investigated.
Research is also needed on the response of diving species, as previous studies have found it difficult to assess if diving was a response to UAVs or for foraging (Drever et al., 2015). Many of the qualifying interests of marine SPAs are diving species, including European shag, great northern diver and black-throated diver.
It is also worth noting that there is currently limited research on the physiological stress responses in birds in the absence of obvious behavioural reactions (Barnas et al., 2017). However, due to the unconstrained nature of wintering individuals, birds are most likely to exhibit an initial behavioural response if stressed (i.e. flying away or diving).
The automation of flights is already well established with autopilot reducing pilot input and so enabling accuracy and repeatability in flying to prescribed survey designs. The progression towards the use of AI in data processing could also provide an additional benefit towards UAS use, similarly to a manned DAS.
Phase 1 Summary
The optioneering study indicated more than one potentially viable use case for UASs. Based only on the information reviewed to date on the three use cases addressed in this report, noting that there are further use cases that were unable to be addressed due to time constraints, the use case that stands to gain the most at this time from additional development and resources within the next 12 months is the large-scale site characterisation surveys. This is equally transferable to other larger-scale targeted development areas as well as conducting full nearshore surveys. As such this option was proposed and accepted to progress to Phase 2.
Phase 2: Technical Development and Trials
System Technical Development
The use of unmanned aerial imagery is becoming more popular amongst hobbyist and commercial operators due to advancements in relatively small and lightweight UAVs that can offer reasonably high-quality imagery for low altitude (<50 m) flights. These are generally targeted to larger objects for terrestrial surveying of structures and forested or agricultural land. This type of activity and target are better suited to a low endurance UAS with rapid interchangeable batteries to reduce time between flights. However, the challenge with small-scale UASs is the transfer of capabilities to higher altitude and greater endurance flights, as the payload capacity becomes a limiting factor in system specification. Consequently, this inhibits the imaging sensor that can be integrated or the length of flight that can be conducted using batteries. Additionally, the review of current literature in Phase 1 indicated that, specifically towards ornithological uses, there is uncertainty in the disturbance impacts of low altitude drones.
HiDef currently operate a bespoke camera system that is purpose built for use in manned aircraft. The system is operated by trained personnel and the total mass of the system and operator is 100+ kg. Some systems in the industry integrate a more automated approach to image capture but still utilise large equipment with a high payload mass. However, as discovered during the literature review, one of the main limiting factors for effective aerial imaging with a UAS is the MTOM, which in turn constrains the endurance of the system. Consequently, this limits the payload capacity of a large proportion of the ‘off the shelf’ UAVs on the market as well as more specialised commercial UAVs developed by industry.
Typically, a large-scale UAV may be capable of carrying a payload in the region of 5-8 kg while still maintaining a suitable endurance for site characterisation surveys (~3-5hours). An additional challenge for a large-scale fixed-wing UAS is the available volume within the aircraft that can be utilised to install the payload. For example, the volume of space that the conventional HiDef aerial system occupies is approximately 0.5 m3, not including an operator and pilot. The available volume within a typical large-scale fixed-wing UAV is in the region of approximately 3-5 % of this, depending on the UAV type. With respect to MTOM, the payload capacity is limited to approximately 5-10 % in a UAS when compared to a typical manned system.
The system presented in this report has been developed as a proof-of-concept to meet the study’s objectives. The system meets the minimum requirements to achieve digital aerial image capture akin to the requirements of traditional methods, such as DAS for the same use case.
HiDef have collaborated with multiple UAV providers to develop an integrated sensor system that was used in two different large-scale UAV platforms during technical development and trials. The proposed use for the system was a large-scale site characterisation survey similar to that completed by a traditional DAS method. A full detailed summary of this use case has been presented in Table 4.
The requirements of this use case, while also keeping in mind that there may be other uses for the system, largely dictated the minimum requirements of the sensor system to be developed. This is, in part, caused by a requirement to achieve baseline capabilities that allow collection of an equivalent dataset to the manned DAS that is being compared to as a traditional method. A particular focus is on achieving comparable GSD while managing issues such as motion blur and vibration. However, it is anticipated that there could be some improvements in GSD achieved using a UAS. The purpose of this study was not to achieve improvements on data collection or image quality, but to investigate the feasibility of using UAV platforms as an alternative surveying method. Therefore, such improvements have not been targeted as primary objectives, but are explored to determine limitations of UASs.
System Requirements
The initial stages during the design of the sensor system were targeted towards the system requirements. These were split into the subject areas below:
- Image resolution and quality;
- data management;
- power supply; and
- structure and layout.
For each area of the design, multiple factors influenced the final decision, as outlined below. Some of the key considerations when selecting the equipment applied to all the components. These were the physical size, mass and power requirements of the apparatus. In all cases, the lower the respective value, the more suitable the apparatus may be for use in a UAS, providing it can supply the required output.
The aspects considered that influenced the requirements of the system are outlined in Table 12 with further detail below.
| Image Resolution and Quality | Data Management | Power Supply | Structure and Layout |
|---|---|---|---|
|
|
|
|
Image resolution and quality
HiDef have over a decade of experience in aerial imaging and consultancy, resulting in a market leading understanding of sensor technology and capability. The current cameras used by HiDef in their bespoke sensor system have been in operation since June 2021 with extensive testing completed on the camera capabilities in varying environmental conditions. There has also been a considerable effort put into determining the optimal setting configurations that result in the most effective image quality for the purpose of detecting and identifying birds in aerial video.
Initially, a review and consideration for the use of alternative camera technologies was considered with the intention of increasing the footprint captured per camera at a given flight altitude above sea level (ASL). The reasoning for this was linked to the payload limitations of UAVs. The ability to use as few cameras as practical to achieve a given swath would be highly beneficial to reduce the duration of survey.
When comparing alternative cameras, all were assumed to be using the same lens and flight altitude so that a fair comparison of GSD and swath could be considered. For these assumptions, the following values were used:
- Altitude = 825ft (251 m)
- Lens = focal length of 50 mm
These values were selected to provide direct comparison with the current DAS survey parameters to achieve the same GSD of ~2 cm.
Other viable options considered at the time of investigation had the same or larger pixel size as the current technology used by HiDef and would therefore output the same GSD at best using the same lens according to Equation 3.
(3)
GSD (cm) = pixel x d / f x 100
Therefore, the distinguishing factor between cameras was the resolution of the sensor itself, with larger sensor options resulting in approximately 45 % larger horizontal swath than the current technology that HiDef utilise. However, this presented a challenge of increasing the required data transfer rate of the system, which has consequential impacts to the data management of the system and power requirements.
Another important consideration when comparing camera technologies was the physical size of the system. As payload dimensions constrained the physical volume available, the system must be as compact as practically possible.
Following consideration of three suitable cameras, it was decided that the current HiDef camera was the most suitable option to use for the following reasons:
- Prior knowledge of the camera capability has been well established with a large resource of historical testing and proven survey use.
- The camera has sufficient specification to allow detection and identification of birds at the minimum GSD of 2 cm from a reasonable survey altitude.
- The camera has a relatively low physical mass and dimensions, as well as power requirements, compared to other options.
- If feasible, the use of the same camera as the manned DAS system would reduce the number of variable factors between datasets allowing for an improved comparison of platforms.
The specifications of the camera and lens combination used are summarised in Table 13:
| Feature | Value |
|---|---|
| Resolution | 31.4 MP |
| Field of view, Horizontal | Vertical (o) | 24.6 ̊ | 8.5 ̊ |
| GSD, @825ft ( cm) | ~2 cm |
| Swath, @825ft (m) | >125 m |
| Frames per second (fps) | 7-8 fps |
| Power requirement | 7-25VDC |
| Physical dimensions (mm) | 200 mm x 90 mm |
| Weight (kg) | 1.7 kg |
Data management
Data management was influenced by multiple factors consisting of the camera system, recording software and data transfer interface. To accelerate the development process, allowing more time for testing, and also to improve the comparability to the current DAS system, it was opted to utilise the same camera in both systems as discussed above. This sets the known requirements for data transfer.
The same recording software was used in the UAS as the DAS to avoid any differences between datasets arising from differences between image capture and post processing of data. As HiDef has years of experience with this software and camera equipment, there is a large knowledge base of the computer system requirements to reliably manage the software and data transfer / storage. Based on this, a small form factor Personal Computer (PC) was chosen, with technical specification outlined in Table 14.
| Feature | Value |
|---|---|
| Processor | Intel i7 |
| Memory | 32GB |
| Interfaces | 3 x USB 3.0 3 x USB 2.0 2 x USB-C thunderbolt 2 x HDMI 2 x LAN |
| Power requirement | 12-20VDC (+/- 5 %) |
| Physical dimensions (mm) | 117 mm x 112 mm x 50 mm |
| Weight (kg) | 0.5 kg |
As the file size of the imagery is larger than typical aerial camera equipment (transfer rates >850 mbps) it is not possible to wirelessly transfer the imagery directly at full image quality back to the operator or a remote file storage location. Therefore, it was a requirement that there must be sufficient and reliable onboard storage with suitable interface speeds. As with smaller UAVs, the ability to rapidly remove and replace items is of large benefit to reduce system downtime between flights. An additional requirement was that the chosen storage method be removable post flight for quick and easy data back-up, transport, or review.
Options considered for data storage are outlined in Table 15, specifying some of the key factors that informed a final design choice.
| Storage Type | Capacity (TB) | Interface Type | Interface Speed (Gbps) | Dimensions ,WxHxD (mm) | Weight (g) | Data Retrieval Method |
|---|---|---|---|---|---|---|
| Onboard – M.2 SSD | 1 | PCI 3.0 | 10 | 80.15 x 22.15 x 2.38 | 8 | Removal from PC or copy direct from PC |
| External 2.5in SSD | 1 | SATA | 4 | 100 x 70 x 7 | 62 | Removal from PC and copy to back up |
| ‘Off the shelf’ external SSD | 1 | USB 3.1 / USB-C | 10 | 57.3 x 74 x 10.5 | 51 | Remove USB and back up |
| USB drive (memory stick) | 0.5 | USB 3.1 | 1.2 | 29.8 x 14.3 x 5 | 4 | Remove USB and back up |
| External M.2 SSD Mount | 1 | USB-C | 10 | 108 x 34 x 11.5 | 48 | Remove external dock and back up |
An M.2 SSD was chosen from the considered options, housed in a USB external mounting as this took up a small volume of space, resulting in an efficient storage capacity to size and weight ratio. The external mounting could easily be removed post flight to allow quick access to back up data or review imagery. This also allowed for relatively simple storage capacity flexibility depending on in-flight recording time required. The maximum data transfer speed of the storage device is 10Gbps, well in excess of the requirements of the system and could therefore be utilised as a potential option for more data intense systems.
Power supply
Once the components that required power had been selected, theoretical power requirements were determined from documentation of each component. This was then verified with desktop testing, by recording the voltage and current draw of each component separately and combined in varied loading states that correlated to sequential stages during operation. The components that required an external electrical power source were the mini-PC and camera. It is noted that the mini-PC also provides power via USB interface to a GPS module, to provide location, speed, altitude and time data for the imagery. The power required for this is included in the mini-PC power draw.
To verify the power requirements, the current draw was recorded at varying voltages from 12V to 20V in intervals of 2V. This range was chosen based on the specifications of the equipment, which are not rated outside of these voltages. Theory suggests that if the power (P) requirement should remain constant, then as the voltage (V) increases, the current (I) decreases with a linear relationship (P=IV). The results of this test for the single camera system are presented in Table 16, outlining the stages of operation for each recording.
State | Voltage (V) | Current (A) | Power (W) |
|---|---|---|---|
| Mini-PC - Idle | 12 | 0.7 | 8.4 |
| Mini-PC - Idle | 14 | 0.5 | 7.0 |
| Mini-PC - Idle | 16 | 0.4 | 6.4 |
| Mini-PC - Idle | 18 | 0.4 | 7.2 |
| Mini-PC - Idle | 20 | 0.3 | 6.0 |
| Mini-PC + Camera - Idle | 12 | 1.2 | 14.4 |
| Mini-PC + Camera - Idle | 14 | 1.0 | 14.0 |
| Mini-PC + Camera - Idle | 16 | 0.8 | 12.8 |
| Mini-PC + Camera - Idle | 18 | 0.7 | 12.6 |
| Mini-PC + Camera - Idle | 20 | 0.7 | 14.0 |
| Mini-PC + Camera - Recording | 12 | 3.1 | 37.2 |
| Mini-PC + Camera - Recording | 14 | 2.6 | 36.4 |
| Mini-PC + Camera - Recording | 16 | 2.3 | 36.8 |
| Mini-PC + Camera - Recording | 18 | 2.0 | 36.0 |
| Mini-PC + Camera - Recording | 20 | 1.8 | 36.0 |
The outputs of this test indicate that approximately 36-38W is required to power the system during the highest loading state with a single camera. This can then be utilised as an input for specifying a suitable power supply option. For specifying the power supply, it was assumed 40W was required to allow for a buffer of 5-10 % in power fluctuation above the maximum recorded value. The same tests were completed for a two-camera system that indicated approximately 60W power consumption.
Two main methods of supplying power were considered for the system:
Batteries
The use of batteries for powering remote control vehicles is common for terrestrial and aerial environments. The recent surge in technology development within the UAV industry has brought with it improvements in battery capability. Lithium-ion (Li-ion) and more recently lithium polymer (LiPo) batteries are widely used due to the high energy density providing high capacity in a relatively low mass and size. LiPo batteries are often preferred as they have a high discharge rating for better UAV performance. However, they have to be handled correctly, particularly during charging / discharging and storage as the chemical composition can become dangerous and cause the battery to deteriorate reducing performance and even becoming a safety hazard in some cases.
Alternator
This would provide electrical power from the aircraft engine in the same way a car engine charges the car battery. The main advantage of this is that no additional payload is required if already installed in the UAV and that the power is always present during platform operation and remains in a constant state. It also completely removes the storage and charging risks associated with the use of batteries. The challenge however is that this component has to be installed into the UAV structure and some UAVs do not have this capability built in, as there has never been a requirement for it. It also renders the sensor system dependent on the UAV and if there were a failure of the alternator, the sensor system would also fail without a backup battery redundancy.
Both options were explored and trialled throughout Phase 2. Influenced by aircraft capability, LiPo batteries were chosen as the power supply for use in the initial trial flights. Further flights with a secondary provider allowed the use of an alternator and made the LiPo power solution redundant. Both options were successfully verified during flight testing. The LiPo batteries provided continual power to the mini-PC and camera independent of the aircraft engine which would be useful in the event of power fluctuations from on board alternators. The advantage of using the alternator was an increased flight endurance with less weight addition. During the further flight tests, various power outputs from the alternator were used to power cycle separately both the mini-PC and the cameras to reboot features. A combination of both may be practical on some systems to obtain the benefits from both methods.
An approximate guide to the impact of payload mass on the UAV endurance was provided by the UAV providers for the initial flight testing, allowing a trade-off between flight time and payload mass to be made. Using this relationship, the power requirements of the system and the expected time to complete a survey of the size of Scapa Flow SPA, the battery requirement could be specified. The expected time to complete the survey area of approximately 112.5 km2 at a ground speed of 70 knots and altitude ASL of 251.5 m (825 ft) was calculated to be in the region of 3.5 to 4.5 hours, depending on the weather conditions (wind speed, wind direction and cloud cover). The capacity of a battery is typically measured in Ampere hours (Ah) and allows for a measure of the time period a battery can operate at a given current draw. Figure 2 is a plot of the battery capacity required for a given endurance and the approximate payload limits to achieve said endurance.
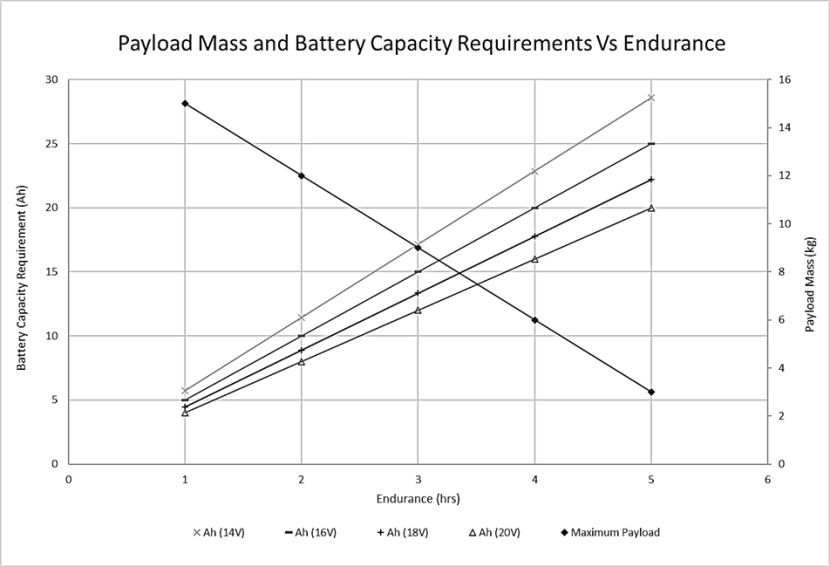
Figure 2. Payload mass, endurance and battery capacity requirement trade-off.
Click for a full description
Dual axis graph showing payload mass (kg) and battery capacity requirements (amp-hours, Ah) on the two y-axis and endurance (in hours) on the x-axis. There is a positive linear relationship between increased battery capacity and endurance, but a negative linear relationship between increased payload mass and endurance.
For an endurance of 3.5hours, a maximum payload of approximately 7 kg can be installed with a battery capacity in the region of 16Ah at 18-20VDC (direct current). A safety factor of two was applied when considering required battery capacity to ensure the battery would not be fully discharged, causing damage to the chemical structure, and to allow for a buffer period if flights were delayed mid survey due to technical or operational challenges.
LiPo batteries are typically supplied in multiples of single cells wired in series to increase the voltage of the overall unit. This offers more flexibility in the size, capacity and shape of the batteries. The number of cells within a battery unit is referred to in multiples of ‘S’ which indicates the voltage specification of the battery.
Each cell has a nominal charge of ~3.7V and peak charge of 4.2V and therefore multiple cells wired in series have an overall nominal voltage that is a multiple of this value. For example, Equation 4 shows that a 2S battery would have a nominal charge of:
(4)
2 x 3.7V = 7.4V
Based on the power requirements of the equipment, a 5S battery was chosen (with a nominal charge of 18.5V and peak charge of 21.0V) to stay within the rated voltages of the mini-PC and camera. A 4Ah capacity was selected as this would allow for multiple batteries to be wired together in parallel to increase the overall system capacity up to 16Ah with four 5S batteries. Based on theoretical calculations, each battery should be capable of powering the system at maximum load for an hour using 50 % of the battery charge. Desktop verification of this has been completed as discussed later in this report.
For the further flight testing conducted with a second UAV provider, an alternator was used as the power supply. The mini-PC and cameras were powered off separate power rails from the alternator, allowing the ability to power cycle either of the components without disrupting the other. The mini-PC was powered off a 15V rail and the cameras off a 24V rail to stay within voltage specifications of the equipment. This also provided a level of independence between the cameras and PC.
Structure and layout
While the system performance was of high priority and importance, ensuring the system could fit within payload dimensions was paramount. The development of the physical structure and layout of the camera system was a continual iterative process that was progressed through collaboration with the UAV providers. The design consisted of an equipment mounting plate that cameras would be fixed to. This was isolated from the UAV by anti-vibrational (AV) mounting, attaching to a base plate or rails inside the aircraft. This layout enabled easy variation of mounting options to investigate differing performance against aircraft vibration and motion.
Two different UAVs were trialled during the study as part of an ongoing development process and so two slightly different layouts were designed. They both contained the same components and followed the same general layout. However, the initial UAV flights were limited by available payload space and so consisted of a single camera design. The second stage of development, and further trial flights, were completed with a larger capacity aircraft and so the design was iterated upon to produce a dual camera prototype. This allowed for greater data gathering capability, doubling the swath of coverage recorded.
The ‘sandwich’ structure used with the first flight provider is shown in Figure 3, illustrating the isolation of the equipment mounting plate through the easily interchangeable AV mounts.
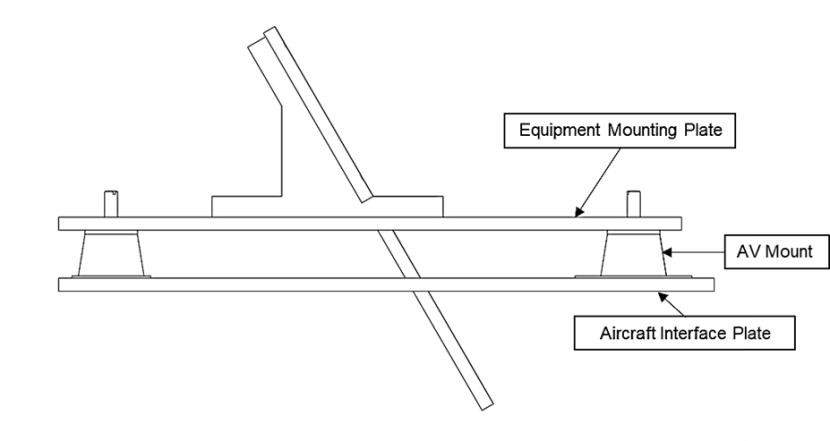
Figure 3. Diagram of sandwich design for camera system.
Click for a full description
A ‘sandwich’ structure design, illustrating the isolation of the equipment mounting plate through the easily interchangeable AV mounts.
For this design, to reduce weight, allow for rapid prototyping and maintain strength, the material chosen for the base plate and mounting plates was 6 mm plywood. Other manufacturing processes and materials were considered for the build of the plates including fabrications in metal and 3D (three dimensional) printing in plastics. However, the remote nature of the install location for the initial flights and requirement to make minor adjustments to the setup, meant that the use of an easily accessible material that can be easily manipulated, like plywood, was a better suited solution, which allowed for greater flexibility during the initial trial flights.
However, 3D printed parts were used for other mounting components such as angle brackets to achieve oblique imagery. It is anticipated that manufacturing processes such as 3D printing could be highly beneficial for future developments, particularly of bespoke systems, as a cost effective, quick and flexible development process.
For the secondary design used in the further flight trials, more time was available and so a more rigid design could be implemented, building on learning from the previous design. An aluminium cradle was opted for, losing the flexibility in adjustment but gaining more performance strength and so allowing reduction in material required. The clear major difference in design from the one initially used was the inclusion of the secondary camera. The two cameras were offset at angles either side of the centre line of aircraft flight direction. This gave the overall UAS twice as much swath as in the initial flights, meaning double the survey coverage would be recorded for the same distance flown.
Bench System Testing and Verification
To verify the system’s performance, a series of initial desktop tests were conducted before the system was installed and operated in a UAV. The purpose of the tests were:
- To verify the performance of the system powered on the isolated battery supply.
- To measure and validate the field of view (FoV) of the lens and therefore the achievable swath and GSD of the system.
- To measure the discharge rates of the batteries during operation to verify performance capabilities.
- To determine the final specification of the camera system as a single module.
The method and results for the testing carried out to achieve each of the above objectives are presented below.
System Performance and Discharge Rates
The initial testing of the system was to determine if there were any unexpected impacts on the function and performance of the system when run from the battery power supply as opposed to a controlled AC-DC (alternating current to direct current) mains supply.
Before powering from the batteries and from the mains adapter, a series of safety checks were completed to ensure the electrical wiring was connected correctly and supply voltages were not exceeding the rated voltages of the equipment with the correct polarity.
Once completed, the system was powered from a single battery and fully function tested, with three repeats to increase the reliability of the results. No functionality related issues were found.
The next phase of this testing was to validate the battery discharge rates from expected values to actual measurements. To measure the voltage and current, two multi-meters were connected into the circuit; one in parallel to measure voltage and one in series to measure current. The batteries were then fully charged to 100 % (21.0V) and plugged into the system. The highest loading state was then induced, and the voltage and current readings were recorded every 5 minutes for a period of 60 minutes. This was then repeated twice giving a total of three independent tests. Note that the tests do not start at 21.0V due to the time taken to configure the setup and begin recording. The results from these tests were averaged, with the battery charge percentage vs time plotted in Figure 4.
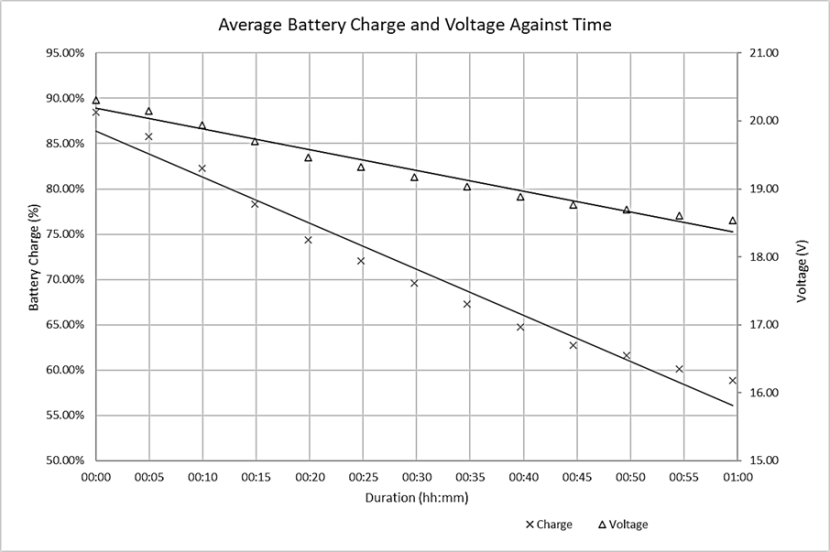
Figure 4 LiPO battery discharge test results.
Click for a full description
Dual axis graph showing validation results of battery discharge rates over a period of 1 hour. Battery charge (%) and voltage are presented on the two y-axis and duration on the x-axis. The batteries were then fully charged to 100 % (21.0V) and plugged into the system. The highest loading state was then induced, and the voltage and current readings were recorded every 5 minutes. Each point represents the mean value of battery charge/voltage from three replicates tests.
The results indicated that the variance between the measured result and the expected result is low, with an average percentage battery charge of 55 - 57% remaining after one hour of recording. This is 5 % more than expected from theoretical predictions, partly due to higher power requirement values used in the predictions. This shows that the battery option chosen is sufficient to provide power for the expected survey period of 3.5 – 4.5 hours.
Field of View
Before specifying the chosen lens option, the theoretical review of achievable GSDs and swaths was conducted using Equation 3 and varying lens options at a range of altitudes from 400 ft (120 m) up to 1650 ft (~ 500 m) ASL. One of the benefits identified in Phase 1 was that a UAS could have the ability to fly at lower altitudes than a comparative manned system. The factors that influenced this conclusion were:
- The smaller physical dimensions of the UAV mean that it would be perceived as being visually smaller than a manned aircraft at higher altitude, which is likely to reduce the disturbance impacts from the platform’s silhouette.
- Acoustic noise levels of UAVs during flight are expected to cause less disturbance than other factors such as platform shape, take-off proximity and approach angles (Egan et al., 2020). Noise profiles can also have an impact on disturbance, but typically disturbance is reported as being caused by higher frequency noise in literature (McEvoy et al., 2016) and from pilot experience reported by UAV operators.
- A lower altitude compared to a traditional DAS could be used to reduce GSD, presenting the possibility of a higher identification capability for smaller species.
- There are a larger number of days available to complete a survey due to reduced weather limitations on cloud base if flown at lower altitudes, offering more flexibility to target more desirable temporal requirements.
However, there are negative aspects to flying at lower altitudes such as reduced coverage per transect flown and therefore increased flight time to achieve the same sampling intensity as a survey flown at higher altitudes. There is also an additional operational aspect of maintaining separation from structures on the ground that becomes increasingly challenging at lower altitudes. It is also noted that further information on disturbance of particular target species for a given survey area should be considered before flying lower than the accepted altitudes of traditional methods.
From the theoretical study and considering the trade-offs associated with flying at lower versus higher altitudes, the proposed altitude for the UAV was chosen as 825ft (251 m). While the manufacturer of the lens provides the specifications of the lens, the actual FoV achieved is dependent on the camera (sensor) and lens combination rather than just the lens itself. The FoV of the system is of particular interest for aerial photogrammetry, as this is one of the influencing factors for the achievable swath and GSD.
To verify the actual value of the FoV achieved using the lens for the trial system, a desktop study was conducted. The camera and lens assembly were connected via ethernet to a computer system to allow the data stream from the camera to be viewed. The assembly was then mounted securely on a fixed platform with the ability to pivot the camera about a set point. The FoV was targeted at objects of known location in the local area from an elevated location to allow a more optimal viewing point with clear lines of sight. Measurements for the horizontal distance from the camera location (vertex B) to objects observed at the peripherals of the field of view (vertices A and C) were taken as well as a distance measurement between the two objects at opposite edges of the FoV. These three measurements formed the perimeter of a scalene triangle with sides abc from a ‘bird’s eye’ view as demonstrated on Figure 5.

Figure 5. Diagram of lens FoV, viewed from above the camera looking down.
Click for a full description
Scalene triangle shaped experimental set up used to determine actual field of view (FoV) angle of camera and lens assembly. Measurements (a,c) were taken from the camera location (B) to fixed objects on the peripherals of the field of view (A, C), as well as the distance between the objects (b). FoV angle was calculated using a modified Cosine rule, with the experiment repeated five times to generate a mean FoV value. This value was then used for predicting image swath and therefore GSD.
(5)
The angle of the FoV (∠ABC,denoted as B) was calculated using the Cosine rule rearranged into the form in Equation 5 below:
Equation 5
This process was repeated a total of five times for the horizontal FoV before taking an average of the results.
The technical specification for the lens used states the horizontal FoV as being 38o. From actual measured data, the achieved horizontal FoV of the camera and lens assembly was calculated to have an average of 24.6o. This value was used for predicting image swath and therefore GSD.
Anti-Vibration Mounting
One of the key challenges of aerial imaging is caused by the movement of the survey platform. This results in two characterisations of blur in the imagery; motion and vibration. Factors that influence the extent to which each type of blur impacts image quality include:
- GSD – The lower the GSD, the larger the observed impact from motion or vibration.
- Platform speed – As the aircraft moves through the air, there is a short distance moved for each frame captured by the camera during a single exposure period. As the flight speed increases, this distance also increases resulting in motion blur. Higher speeds also tend to result in higher engine revolutions per minute (RPM) which contributes to vibration frequencies in the aircraft structure. Depending on the natural frequencies of the structure, this could alter the impact of vibration on the imagery.
- Image stabilisation – This can be used to reduce the impact of vibration blur through either the mounting mechanism of the camera, utilising options such as gimbals or AV / damping fixings, or by means of electronic or optical image stabilisation.
The GSD of the system was chosen to provide the best comparative data between the UAS and manned DAS system and therefore maintained as a constant variable in the technical investigations. A UAV cruise speed of 70 knots was used for both platforms, roughly 50 knots slower than that of the manned DAS system, as this was the UAVs’ preferred speed. Therefore, to complete the survey in the minimum duration, so that the probability of double counting objects is reduced thereby increasing the statistical power of the two datasets, the maximum cruise speed of 70 knots was also kept as a constant feature of flight. However, it is accepted that wind speed will alter during flight, depending on aspects such as the direction at the UAV itself.
Utilising a lower flight speed, reduces the impact from motion blur. The maximum expected distance travelled by the aircraft during a single exposure would equate to 3.6 cm at 70 knots. Although this value is 1.6 cm larger than the (2 cm) GSD achieved, the use of colour sensors allows an increased tolerance to motion blur by a factor of 3. Experience on manned aircraft would suggest that this would be unlikely to have a negative impact on footage from the UAS. However, it is worth noting that this only accounts for forward motion of the aircraft. A more likely cause of blur is the rate of change in the roll, pitch or yawing moment of the airframe caused by wind or minor adjustments in control.
Image stabilisation has been investigated in addition to flight speed as an option for reducing the impact of mainly vibration blur. As the camera and lens have no built-in image stabilisation, various options for the mounting of the camera were explored.
Considered options ranged from no AV mounting at all, which would be the simplest path to an initial concept and probably the worst-case scenario for mounting, to the use of an active gimbal mount. While an active gimbal mounting would most likely be the most beneficial option in terms of stabilisation, this was not explored due to cost and time limitations. An ‘off the shelf’ gimbal mounting system would significantly affect balance and weight parameters within the UAV and the ones typically used in multi-rotor UAVs would be insufficient to cope with the size and weight of the equipment used in this trial. Larger commercial gimbal mounting systems are currently available but also carry increased weight penalties and incur a large asset expense. Finally, the physical volume limitations restricted expansion in the space surrounding the camera assembly, meaning an off-the-shelf gimbal system would unlikely be suitable for the custom design required for flight testing. Instead, a number of intermediary AV mount options were proposed for testing during trial flights in the form of passive damping or AV mounts. The four options chosen for initial flight testing can be seen in Figure 6 with a summary of each mounting type, their specified ratings, key features and trade-offs considered for each presented in Table 17.
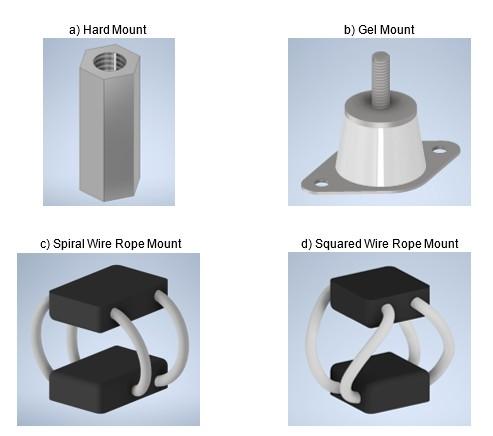
Figure 6 Anti-vibration mounting options for Summer 2022 trial flights
Click for a full description
Four options of anti-vibration mounts used for initial flight testing of UAV in summer 2022. A summer of each mounting type, including their specified ratings, key features and considered trade-offs are presented in Table 17.
| Mount | Weight, for 4 (kg) | Load Rating, for 4 (kg) | Vertical Dimension (mm) | Benefits | Negatives |
|---|---|---|---|---|---|
Hard Mount (Stainless Steel Standoff) | 0.047 | N/A | 25 |
|
|
| Silicone Gel Mount | 0.142 | 5-13 | 24 |
|
|
| Spiral Wire Rope | 0.155 | 6.24 | 30 |
|
|
| Squared Wire Rope | 0.106 | 6.60 | 30 |
|
|
| Rubber AV Mount | 0.116 | 6.51 | 48 |
|
|
To best understand the impact each mount would have on the imagery, it was proposed that each would be tested during the trial flights. However, of the five proposed flights with the initial UAV provider, only two were able to be completed due to UAV technical issues and adverse weather conditions. These were the hard mount and gel AV mount options. Due to testing fewer options than desired, further flight testing was conducted in a different UAV platform, providing an alternative circumstance to investigate platform stability as well as the effect of motion and vibration blur. A hard mount option was used for the further flight trials again to provide baseline data to compare to a rubber AV mount option for comparison. The mounts differed from those previously used in the initial test flights, which were directly underneath each corner of the equipment mounting plate, whereas the secondary trials used rubber mounts positioned diagonally to the equipment mounting plate at an angle of 45̊. This can be seen in Figure 7. Additionally, the rubber AV options were stiffer than the gel AV options used.
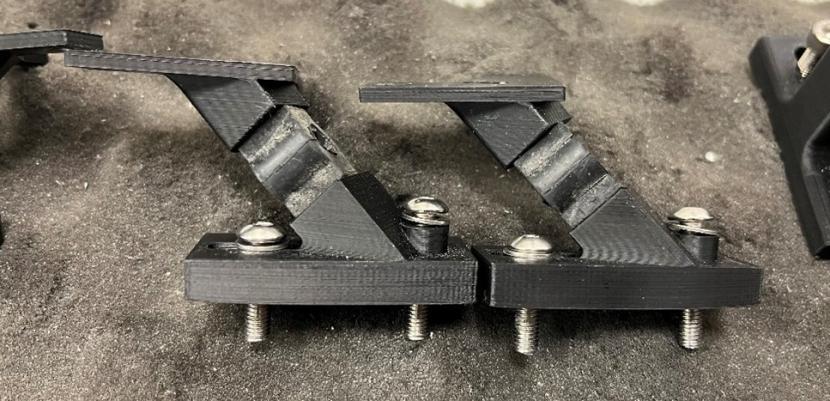
Figure 7. Anti-vibrational rubber mounts used for further trial flights in 2023.
Click for a full description
Rubber mounts designed to be positioned diagonally to the equipment mounting plate at an angle of 45̊. These provided a stiffer option than the gel AV options previously used.
System Installation
Following the development of the sensor system to a proof-of-concept that had been fully tested in controlled environments, the next stage was installation and integration into a large-scale UAV. For the initial technical trials, the available aircraft that the UAV provider was able to assign to the project was a development aircraft, typically used for pilot training and testing of new components. This came with some testing constraints, which would not have applied to their commercial vehicle, as summarised below:
- Visual line of sight (VLOS) operation – As the development aircraft was not certified to fly BVLOS, the initial trials were limited to VLOS only, with a maximum altitude ASL of 800 ft (~ 240 m) and range from the pilot of 1 km. As any large offshore survey can only be conducted BVLOS, the authors feel it a necessary part of testing to have completed operations BVLOS prior to conducting a survey.
- Endurance – A smaller fuel tank and different fuel injection and engine system is installed in the development aircraft which reduces the maximum endurance to approximately 30 minutes of flight time. The initially proposed survey was expected to last much longer than this (~3.5 hours) and therefore testing of the full UAS for this period of time is also a requirement before completion of a live survey.
- Payload – Although the smaller fuel tank would initially suggest that a larger payload could be installed, this was not the case. The alternative fuel delivery system and engine in the development aircraft have different weights to those fitted to the provider’s commercial UAVs. The commercial UAVs also have an upgraded wing design that improves aerodynamics. The combination of the upgrades not being installed in the development UAV meant that the payload weight was limited to <5 kg to achieve 30 minutes of flight.
The installation to the development aircraft was completed in collaboration with the UAV provider’s pilots and engineers. During the install, several design alterations were made as part of an iterative design and prototyping stage of the system development. These alterations were largely driven by spatial restrictions within the UAV structure from components such as fuel tanks, radio transponders and on-board batteries. These requirements for design adaptions left an appreciation of the effort required for structural changes and their impact on UAV characteristics. This process allows for improved planning during future installation to UAVs, likely reducing the number of design iterations required.
The final iteration of the design in the development UAV ultimately provided the most optimal structure to allow for alterations to the mounting options. The camera and data management system were mounted on an equipment mounting plate capable of isolating all the sensory equipment, except for batteries, from the aircraft structure. The interface between the equipment mounting plate and the UAV interface plate was via the chosen hard or AV mounting, creating a sandwich style layout as shown in Figure 3.
The batteries were securely fixed within the aircraft structure. The only contact to the equipment mounting plate was from a power lead to the battery that was secured, using a looped section, to avoid transmitting large vibrations to the plate.
Technical Trials – Provider 1
The trial flights were conducted with the following aims:
- To verify the performance of the system in its intended environment.
- To assess the importance of vibration mitigation on imagery recorded from a UAV.
- To validate the resolution of the imagery for a given altitude.
- To understand the practical limitations of operation with respect to planning, personnel and environmental conditions.
- To understand the flight characteristics of a large-scale UAV.
The location for the trials was based at a strategical operation site in Whinnyfold (Aberdeenshire, Scotland). This site is located close to the coastline situated over farmland, in a remote location with few populated dwellings in the local area. This site was chosen partly for the reduced requirement for operational applications, such as TDAs, as there are already approvals in place. It was also chosen for the geographical positioning. The ease of access to achieve recordings over land and the sea meant the location was ideal for verifying the transfer of technical capabilities from static objects over land to moving target (birds). Due to the nature of the site’s location and the Scottish weather, it also provided an appreciation for the challenges of operating in harsher environments. Figure 8 shows the trial site location (in yellow) in relation to the Orkney and Scapa Flow SPAs (in red). The flights were attempted during September 2022 over 10 days with weather limiting actual flight time significantly.
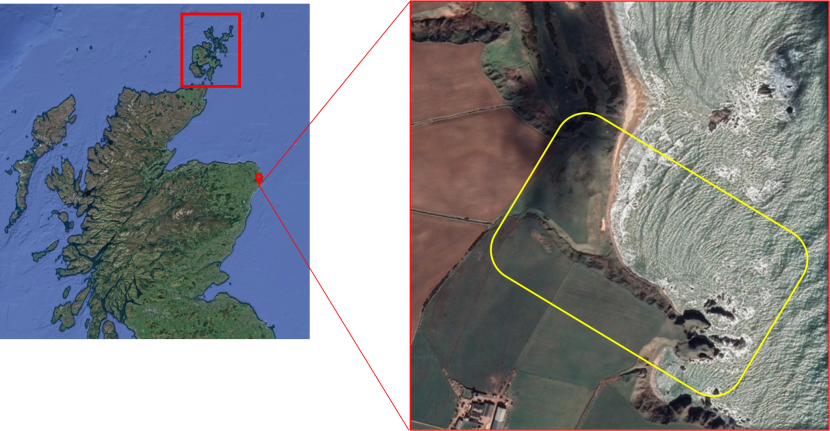
Figure 8. Aerial image of initial flight trial location (Google Earth, 2022).
Click for a full description
Aerial capture of initial flight trial strategical operation site for Provider 1, based at Whinnyfold, Aberdeenshire, Scotland. Situated in a rural setting with reduce requirement for operational applications and ease of access to record over both land and sea.
The design of the trial flights are discussed below, with justifications for each flight and its purpose. From these flights, the output data is to be analysed and linked back to the technical trial aims to determine the key conclusions and recommendations with respect to future field survey trials. These capabilities are summarised in a concise UAS specification that can be used as an input for design and planning of these surveys, including TDA applications.
Flight Planning and Method
This section of the report outlines the technical methodology used to design, conduct, and analyse the trial flights. The requirements for the trials are based on the objectives and resulted in the development of five trial flights that would have provided sufficient data to determine the achievable performance specifications of the UAS. However, as detailed throughout this section, environmental challenges and platform technical issues resulted in only two of the five flights being completed with the first flight provider in September 2022. While this is not desirable, the outputs from the two flights have allowed some conclusions to be drawn from the data that are sufficient to inform development of proposals towards trial surveys. To further verify system performance and, in particular, vibration options, the completion of further flight trials with a different platform and flight provider were conducted separately in 2023.
Test requirements
To best evaluate the requirements of the trials, each aim is discussed further below to identify methods of validating performance with respect to technical requirements.
To verify the system performance in its intended environment as a proof-of-concept design, a basic minimum requirement for the camera system was to operate the equipment as intended during a flight and be able to retrieve all the data expected with no issues experienced. This objective is met by conducting any number of flights and reviewing data post flight to verify impact. To gain more confidence in the system, a larger volume of shorter flights can be conducted and/or longer flights with longer mission time to verify the endurance of the system.
To assess the impact of vibration, footage of static and moving objects is desirable at the proposed survey altitude as well as lower altitudes to assess the change in impact as the GSD improves. Natural moving objects can be somewhat more difficult to capture as this is dependent on birds present at the time, however this trial area did allow for footage of birds to be captured in flight. To assess how different mounting types impact the footage, a baseline dataset was important, hence the inclusion of a hard mounting option that could be used as a reference to compare other mounting options against. To test multiple mounting options requires the repetition of the same or similar flight paths on separate flights, each with a different AV mount installed. Focus charts and objects with multiple straight and clearly defined edges are particularly useful for observing blur caused by vibration and/or motion. The authors also have an extensive knowledge and experience with analysing imagery for effects of vibration.
The requirements to verify and validate the GSD are similar to that of vibrational impacts and can therefore be combined into the same flights to reduce testing time and improve the efficiency of the trial design. Objects of known size are required to be captured in the footage. Ideally these are large objects that result in a more accurate average of the GSD being calculated. However, the area of the initial trial meant that most land-based recording was over fields with very few large distinguishable features that could be identified for measurement.
Environmental challenges also limited the available flight time. This experience aided understanding of the real-world limitations of UAS operation with respect to factors such as daylight hours, wind speed, precipitation, and pilot duty hours.
The challenges of the environment also provided information on the flight characteristics of the UAV in a range of conditions, allowing a more practical analysis and appreciation of platform stability. To further analyse this, flight logs were shared to aid in identifying thresholds related to blur induced by platform instability. Also extended testing in combination with weather data would aid in understanding the impact variations in weather may have on data outputs.
Operational constraints
Due to the UAV used for initial flight testing being utilised for development purposes and training only, the operational capability was restricted to VLOS with extended altitude ASL due to the site area and previously agreed safety cases with the Civil Aviation Authority (CAA). As most of the trial flights only required a short period of recording to verify system performance, this was not seen as causing any major impacts to the trials. It does however leave some uncertainty as to the system’s capabilities over extended flight range. The camera system has been designed and tested to operate without user input. To provide confidence in UAV capabilities under BVLOS operation, this should be tested fully with the camera system installed.
The aircraft provided also had a shorter endurance and range due to the use of a smaller volume fuel tank than typically used, reducing the flight time to approximately 30 minutes. This also did not pose any major risks to the completion of these trials, although did restrict any longer recording tests in potentially more adverse environments. The camera system can be thoroughly tested to the endurance requirements outside of the aircraft, but this does not provide sufficient in-situ testing that would be necessary before a live survey flight.
There are also operational constraints associated with uncontrollable factors such as the weather. The UAV could not take off in wind gusts in excess of 25 knots and this factor is not limited to only the aircraft in testing. As the aircraft is lighter than a manned platform, environmental factors are far more significant. As gusts are difficult to predict, this was likely to be one of the most limiting factors for completion of flights. Alongside this, any precipitation would also postpone any flights as the aircraft cannot take off under VLOS operation when it is raining due to the unknown development of the weather system which could cause the pilot to lose sight of the UAV altogether. Cloud would be an issue under 1000 ft (~ 300 m) but general experience on site was that even low cloud in adverse conditions when it was raining and windy stayed above this altitude and would not likely be the ultimate limiting factor.
Trial design
The original design of the trial flights is summarised in Table 18, with the identified target area highlighted in Figure 8.
| UAS Flight Number | Flight Provider | Mount Option | Purpose | Flight Path | Flight Time (min) | Flight Speed (Knots) | Altitude (ft) | Completed |
|---|---|---|---|---|---|---|---|---|
| 1 | 1 | Hard mount | Determine baseline footage with no AV option for comparison | Nearshore test circuit | 10-15 | 70 | 2 circuits @ 800 ft (240 m) 2 circuits @ 650 ft (200 m) 2 circuits @ 500 ft (150 m) | Yes |
| 2 | 1 | Gel mount (SF-2) | Determine efficacy / change from baseline footage using gel mounting option | Nearshore test circuit | 10-15 | 70 | 2 circuits @ 800 ft (240 m) 2 circuits @ 650 ft (200 m) 2 circuits @ 500 ft (150 m) | Yes |
| 3 | 1 | Squared wire rope | Determine efficacy / change from baseline footage using squared wire rope mounting option | Nearshore test circuit | 10-15 | 70 | 2 circuits @ 800 ft (240 m) 2 circuits @ 650 ft (200 m) 2 circuits @ 500 ft (150 m) | No |
| 4 | 1 | Spiral wire rope | Determine efficacy / change from baseline footage using spiral wire rope mounting option | Nearshore test circuit | 10-15 | 70 | 2 circuits @ 800 ft (240 m) 2 circuits @ 650 ft (200 m) 2 circuits @ 500 ft (150 m) | No |
| 5 | 1 | Mock survey with optimal mounting option | Targeted offshore over rocks and sea to gather data on birds to verify chosen mounting application on target objects (i.e. moving birds) | Nearshore test circuit + Scaled transect design | 25 | 70 | 2 circuits @ 800 ft (240 m) varying engine RPM Straight into: Survey design track @ 800 ft (240 m) | No |
| 3 (continued after first flight provider)Further flights planned with different platform provider in order to collect more footage for analysis | 2 | Hard mount | Determine baseline footage with no AV option for secondary flight platform/ provider | Airfield test circuit | 15 | 70 | 2 circuits @ 800 ft (240 m) 2 circuits @ 650 ft (200 m) 2 circuits @ 500 ft (150 m) | Yes |
| 4 Further flights planned with different platform provider in order to collect more footage for analysis | 2 | Hard mount | Additional gathering of baseline footage due to experiencing adverse weather conditions on UAS flight 3. | Airfield test circuit | 15 | 70 | 2 circuits @ 800 ft (240 m) 2 circuits @ 650 ft (200 m) 2 circuits @ 500 ft (150 m) | Yes |
| 5 Further flights planned with different platform provider in order to collect more footage for analysis | 2 | Rubber mount | Determine efficacy / change from baseline using rubber AV option and further comparison | Airfield test circuit | 15 | 70 | 2 circuits @ 800 ft (240 m) 2 circuits @ 650 ft (200 m) 2 circuits @ 500 ft (150 m) | Yes |
The planned first four flights would address the assessment of the vibration mounting and GSD at varying flight altitudes. These flights would follow a set circuit within the marked area in yellow. The final flight was targeted towards capturing data of the intended target objects to verify that the observations seen on static objects is transferable to moving ones. This flight was planned to be conducted mainly over sea, near the shoreline as the range from the pilot limited by VLOS operation must be adhered to for safety. All of the flights provide data on the system performance in the dynamic environment onboard the UAV, as well as the UAV’s performance capabilities with respect to normal and adverse conditions. While a longer endurance flight (>30 mins) was not capable with the development UAV, completion of the five flights would provide a starting level of confidence in the system for future use over longer periods.
All flights with the initial provider were flown with an advanced vibration meter fitted to the equipment mounting plate to measure the frequency and acceleration of vibration experienced by the camera itself. An ALTA Wireless Accelerometer - Advanced Vibration Meter was used for this purpose. This sensor has a frequency resolution and vibrational threshold resolution of 0.1Hz and 0.001 mm/s2 respectively. However, timing synchronisation issues meant this data could not be aligned with visual indications of blur when reviewing footage and was subsequently not used for the second flights.
The conduction of each flight followed a methodical planning process that initiated with ground systems and safety checks for both the aircraft, take-off area and camera system. Once all checks were passed and assessed as safe to take-off, the aircraft was transported to the take-off area before final engine tests. Once airborne and when the pilots were comfortable that all systems were operating as expected, the flight paths for the specific flight were commenced. During the flight, the authors continued to monitor the characteristics of the UAV itself with respect to stability in straight and level flight, turns/banking and perturbations caused by wind and took notes to compare with flight data post flight.
Once the flight route was complete, the UAV was landed, recordings stopped, and post flight systems checks completed. The data was immediately backed up from the onboard data storage to a backup drive. This also served as verification of the expected benefits of the data storage system chosen.
Technical challenges
Any survey, including traditional methods like a manned DAS, vantage point (VP) or boat surveys, carries a risk of technical issues resulting in delay or failure to complete a task. The use of a UAV is not exempt from this risk and technical challenges were experienced on four separate occasions during the initial trial flights. Ultimately, these challenges delayed multiple flights that could then not be flown due to environmental conditions changing such as wind speed and precipitation increasing above threshold values or ambient light conditions dropping below a safe level to fly. This highlights the importance of using a well built and maintained platform so that the full benefits in operation can be achieved. These include flying on days when the cloud base is at lower altitudes than a traditional DAS could be flown.
Challenges related to platform reliability are considered in this study’s recommendations as it is probable that the weather will be more restricting in the winter months at sites such as Scapa Flow SPA. Therefore, having a reliable platform that is unlikely to limit the opportunity to fly when narrow weather windows may be present is a necessity.
Technical Trials – Provider 2
As described above, only two flights of the originally intended 5 were able to be achieved with the first UAV provider. Therefore, a secondary provider was utilised in order to conduct more flights, gathering further data to increase the sample size but also to provide comparison between platforms and allow verification of initial findings. These further flights were carried out with the same objectives as the first.
The further trials were conducted at West Wales Airport (Cardigan, Wales) over several days in May 2023, which was the base of operations for the secondary UAV provider. This site was chosen due to it being the typical location where development testing from the flight provider occurs with necessary flight approvals in place. With the flights being carried out from the provider’s hanger, development and adjustments to the platform could be easily performed. The airfield was located near the coast but not directly on it and was surrounded by mostly farmland with occasional buildings.
Flight Planning and Method
Test requirements
The further test flights maintained consistent objectives as the previous trials. Further evidence of the system performance in its intended environment was required to verify any findings from the initial flights. The flight design was kept similar, which enabled verification of resolution from a given altitude, and allowed improved investigation of vibration on imagery quality recorded as different AV options were used. Larger buildings were targeted to be captured in the footage, allowing a more accurate assessment of GSD as well as comparison to the previous trial. The new platform allowed download of the autopilot system recordings post flight, which meant that roll, pitch and yaw (RPY) could be investigated versus synchronised frames in the video for the further flights.
Operational constraints
Differing from the previously used development platform, the platform used by the secondary flight provider was a bespoke UAV produced for integration with the sensor system, but still having the same airframe as their commercially operational UAVs. It had a 6L fuel tank, providing up to 5 hours endurance and could have been used to operate BVLOS. However due to this trial being the first usage of the newly developed aircraft, flying was limited to VLOS and a short period of time.
Weather was an inhibiting factor to flight testing, with the UAV provider waiting for ideal conditions for testing as this usage was the first for the newly developed system. Similar to the previous flight provider, the UAV could not take off in wind gusts in excess of 25 knots. Often the limiting factor would not be the speed but the direction of the wind, where a reasonable cross wind on the airstrip caused unsafe conditions for take-off.
Trial design
To maintain similarity with the first provider’s trial flights, a similar flight plan was used. This can be seen in Figure 9 showing a circuit pattern over the airfield.
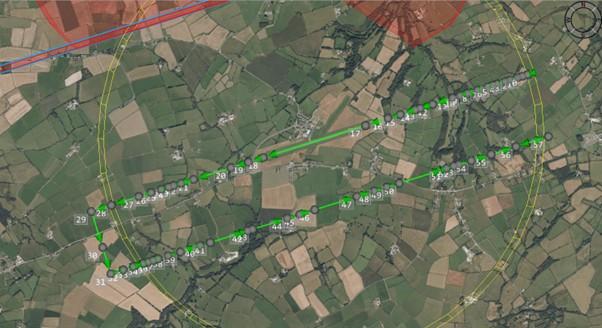
Figure 9. Further trials’ flight plan (UAVE, 2023).
Click for a full description
Flight path used for further trials undertaken by Provider 2, with a circuit pattern over the airfield, based at West Wales Airport, Ceredigion, Wales. To maintain similarity with the first provider’s trial flights, a similar flight plan was used.
This was flown at varying altitudes, again similar to the initial flights, allowing assessment of different GSDs. Flight details are in Table 18. Before each flight, ground safety checks were completed before taxiing to pre take-off position, before further checks and sensor system checks allowed take off approval. After landing, the footage was similarly backed up, and autopilot data downloaded for investigation.
Technical challenges
As with the initial flights, some technical issues and challenges were experienced during the trialling process. This is to be expected with developmental work. Sensory system positioning needed adjustment within the UAV due to electrical interference. Also, there were some UAV system errors that required correction.
The operational aspects of flying proved to be the most challenging aspect with both operators as weather and crew availability often led to delays in proposed flight times. This demonstrates a key challenge of using UAVs as the challenges that delayed VLOS flights are not expected to be removed for BVLOS and may in fact be inherently more limiting due to increased safety requirements when operating out of sight.
Technical Data Analysis
The total trial flights resulted in the completion of two flights with the first provider and three with the second provider. For both providers hard mounted options were used to gather baseline or potentially worst-case footage before conducting flights with the system mounted on AV mounts, either gel or rubber.
This section presents the main results for the validation of GSD and impact assessment of vibration and motion on the imagery. Where applicable, brief descriptions of how the data was calculated are also presented.
For each system characteristic (GSD, vibration and aircraft stability) the results are discussed below. The section concludes with the overarching outputs from the trials that provide inputs for the final technical specification of the UAS as single module.
Ground Sample Distance (GSD)
The ground sample distance was first determined from theory using both Equation 3, and 3D modelling of the camera and lens FoV from a specified altitude. From the authors’ experience, the method that has proven more accurate in calculating the GSD from a theoretical perspective, is to use the 3D model with measured camera and lens assembly FoV angles. The camera footprint can then be projected on the ground plane and measurements of the swath recorded in the modelling software. Once the swath is known, dividing by the number of horizontal pixels provides an average GSD or resolution per pixel.
The difference in final outputs from the two methods is relatively small with the outputs for average GSD using the equation versus the model values at the same altitude and lens type within ~2% of each other. Typically for manned systems, the measured values from imagery have less variance from the latter of the two methods and validate the 3D model method for determining GSD theoretically.
Using the 3D modelled method, a table of calibration GSDs at varying altitudes, ranging from 100 m up to 350 m, was calculated and used as inputs for a measuring tool that is installed as part of the reviewing software. This tool uses a calibration value for the distance between two pixels, which is input by the user. The value used is calculated by identifying the flight altitude ASL for a given frame and subtracting the ground altitude of the object being measured to identify the altitude above ground level (AGL). The AGL can then be used to determine the respective GSD from the calibration sheet. Measurements of objects were then taken from target points and compared to actual measurements taken of smaller objects on the ground, or measurements taken for larger objects using sources such as Google Earth (2022). A full list of reference objects and dimensions is in Annex 4 for reference.
For each measurement taken, the UAV altitude ASL and ground level ASL were recorded to give the UAV altitude AGL. This could then be used to determine the corresponding GSD that the frame was captured with. The measurement recorded using the calibrated GSD in the software was then compared to the actual measurements, outputting the error between the two values as a percentage to aid validation of the GSD that can be achieved with the system. The full list of results can be found in Table 19.
| Platform Provider | Measurement ID | Measurement ( cm) | Actual measurement ( cm) | Variance |
|---|---|---|---|---|
| 1 | CL1 | 390.3 | 391 | 0.2% |
| 1 | CL2 | 431.9 | 432 | 0.0 % |
| 1 | CL3 | 212.3 | 212 | 0.1% |
| 1 | CL4 | 222.3 | 222 | 0.1% |
| 1 | CL5 | 214.8 | 202 | 6.3% |
| 1 | CL6 | 392.4 | 386 | 1.7% |
| 1 | CL7 | 230.8 | 220 | 4.9% |
| 1 | CL8 | 202.5 | 204 | 0.7% |
| 1 | CL1 | 392.0 | 391 | 0.3% |
| 1 | CL2 | 431.9 | 432 | 0.0 % |
| 1 | CL3 | 211.3 | 212 | 0.3% |
| 1 | CL4 | 215.7 | 222 | 2.8% |
| 1 | CL5 | 198.9 | 202 | 1.5 % |
| 1 | CL6 | 375.6 | 386 | 2.7% |
| 1 | CL7 | 219.6 | 220 | 0.2% |
| 1 | CL8 | 193.0 | 204 | 5.4% |
| 1 | PD | 97.2 | 97 | 0.2% |
| 1 | CL1 | 389.8 | 391 | 0.3% |
| 1 | CL2 | 428.4 | 432 | 0.8% |
| 1 | CL3 | 210.9 | 212 | 0.5 % |
| 1 | CL4 | 230.0 | 222 | 3.6% |
| 1 | CL5 | 201.6 | 202 | 0.2% |
| 1 | CL6 | 412.1 | 386 | 6.8% |
| 1 | CL7 | 236.7 | 220 | 7.6% |
| 1 | CL8 | 209.0 | 204 | 2.5 % |
| 1 | FL | 6545.6 | 6466 | 1.2% |
| 1 | FL | 6488.1 | 6466 | 0.3% |
| 1 | FL | 6440.5 | 6466 | 0.4% |
| 1 | FL | 6408.0 | 6466 | 0.9% |
| 1 | FL | 6357.9 | 6466 | 1.7% |
| 1 | G1 | 367.0 | 368 | 0.3% |
| 1 | G2 | 307.8 | 307 | 0.3% |
| 1 | CF1 | 60.9 | 61 | 0.2% |
| 1 | SF1 | 59.9 | 61 | 1.8% |
| 1 | SF2 | 46.8 | 42 | 10.3% |
| 1 | CF1 | 61.4 | 61 | 0.7% |
| 1 | CF1 | 61.0 | 61 | 0.0 % |
| 1 | CF2 | 35.2 | 37 | 4.9% |
| 1 | CF1 | 59.6 | 61 | 2.3% |
| 1 | CF2 | 39.9 | 37 | 7.8% |
| 1 | P1L | 105.3 | 120 | 12.3% |
| 1 | P1W | 105.2 | 100 | 5.2% |
| 1 | P2L | 124.8 | 120 | 4.0 % |
| 1 | P2W | 70.8 | 80 | 11.5 % |
| 1 | SF1 | 62.6 | 61 | 2.6% |
| 1 | SF2 | 40.3 | 42 | 4.2% |
| 1 | CL1 | 391.1 | 391 | 0.0 % |
| 1 | CL2 | 430.2 | 432 | 0.4% |
| 1 | CL3 | 211.4 | 212 | 0.3% |
| 1 | SF1 | 61.6 | 61 | 1.0 % |
| 1 | SF2 | 42.3 | 42 | 0.7% |
| 1 | CF1 | 60.8 | 61 | 0.3% |
| 1 | CF2 | 36.7 | 37 | 0.8% |
| 2 | RW1 | 2990 | 2976 | 0.5 % |
| 2 | BR1 | 2608 | 2589 | 0.7% |
| 2 | RW2 | 4745 | 4652 | 2.0 % |
Due to restrictions with airspace for the initial flights, the maximum altitude that could be flown was 800 ft (~ 240 m) and therefore the majority of the data collected is at a lower altitude than planned for survey. Most of the data closer to planned survey altitude was captured over sea at a stable elevation, which meant objects captured within these frames were close to the desired GSD of 2 cm. During the secondary trial flights, footage recorded of large objects from survey altitude (825ft, ~250 m) was used to further verify GSD.
From the results in Table 19, the average error between physically measured data to that measured from imagery for the concrete lookout building dimensions (reference CL1 to CL8) was 1.87% with a maximum and minimum variance of 7.59% and 0.02% respectively. This building was relatively level compared to the ground plane and close to sea level, providing a good starting point to measure from. Of the measurements taken, it appeared that CL5 and CL7 most often produced the largest error in measurements from the imagery. The likely cause of this is potentially linked to the nature of their angle compared to the other edges that tended to run either perpendicular or parallel to the flight path during the recordings. The error is still relatively small for these edges (2.69% and 4.23% for CL5 and CL7 respectively) and could also be linked to errors in the measurement start and end points which are less obvious in the imagery for these edges.
For the initial flights, there were few large identifiable objects from the aerial imagery that could be easily measured in person or from other aerial imaging sources due to the nature of the location. One object that was identified was a straight section of fence line (referenced as FL in Table 19) with a distinctive post at either end. This fence line was measured over five consecutive frames and an average taken of the lengths. The actual physical measurement of this length of fencing was 64.66 m measured on site. From the aerial imagery, the average measurement for this fence line was 64.48 m. The error between the measurements is 0.28% which supports the GSD predicted from 3D models. This is in good agreement with the actual fence line length measured. This indicates that the system is capable of recording data at the specified 2 cm GSD.
There were some objects that were not in as accurate agreement with the predicted model GSD, in particular the pallets’ (P1L, P1W, P2L, P2W) and focus charts’ (CF1, CF2, SF1, SF2) dimensions, with error between predictions and actual measurements averaging 3.92%, with the maximum error of 12.3%. This inaccuracy could result in uncertainty in the identification of certain bird species or ageing based on size.
A contributory cause for this error was the nature of the landscape in the local area. Each of these objects could only be placed on a field that had a slope to it, banking towards the coastline. This meant that there was some uncertainty as to what the actual ground level elevation was, causing ambiguity in the altitude AGL and ultimately GSD. In addition to the bank of the field, aircraft banking angles also caused a distorted view of the objects, dependent on the direction of flight path or turn. As the viewing angle from the camera changes relative to a surface plane, the aspect ratio of a flat object on the ground changes with a non-linear relationship. The effect of this is that the same object viewed from two different angles is perceived as having different dimensions that are most exaggerated on edges farthest from the viewing point (the camera in this instance). The slope of the field in which the objects were located was around 5o sloping away from the direction of flight.
The variation in GSD vertically, from the centre of the frame to the top edge of the footprint on the ground (the maximum distance from the camera), can be as much as 4.5 % using the camera and lens combination installed in the system. This is also experienced horizontally across the sensor and has a non-linear relationship with variation increasing towards the outer edges of the frame. This means that objects that could not be measured centrally in the frame inherently carry some error due to the variation in GSD over the footprint of the image. The variation in GSD is also affected by the pitch and rolling angles of the aircraft. A change in pitch of 5o nose down causes a 5.7% variation in GSD at the centre of the frame. The pitch and rolling angles are inherently coupled during flight and it is more likely that the change in angles will have a compounded effect on the variation in GSD. Therefore, the expected variation for a 5o pitch change in reality would be higher than 5.7%.
As an example of the combination of error sources when measuring GSD during uneven and not straight flight, the change in UAV angle in the pitching axis required to cause a 5.7% variation in GSD was calculated to be 5o. This is a reasonable change in angle caused by wind gusts, and could be expected during flight. Considering that the UAV is rotating in 3D space, the combination of the pitching angle and smaller changes in angle (~2-3o) for roll or yaw, as well as the ground sloping angle could result in the variation at least doubling to 11.4%. This is in turn carried into object measurement at the centre of the frame. Accounting for the location of the object on the frame could increase the maximum potential measurement error up to approximately 15.9%, although objects at the outer extremities of the frames were not used for measurements for this reason. In further review of the footage captured during these sections of the flight, the rolling motion could be visually seen as objects deviated from straight paths through sequential frames, as seen in Figure 10.
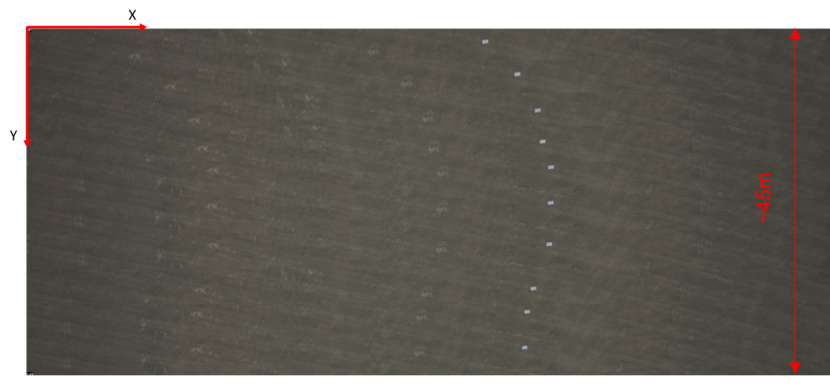
Figure 10. Visual representation showing the impact of RPY variation on footage stability.
Click for a full description
Overlaying of sequential frames of footage showing the deviation of objects from a straight path, driven by the roll, pitch and yaw (RPY) variation
An additional error could arise from human measurement during post processing. A slightly longer measurement (as little as a pixel on screen) could result in approximately 2-3% error alone for the focus charts dependent on altitude, due to the small size of the object. For future testing it would be preferable to mount objects parallel to the flight path altitude which is straight and level.
When further flights were conducted in the secondary platform, verification of the findings from the initial flights was performed. Due to the further flights taking place over an airfield, much larger objects were able used for measurement. The three objects measured were the airstrip width, a building width and the distance between two airstrip drains. These came out with variances of only 0.5 % (RW1), 0.7% (BR1) and 2% (RW2) between measurements from footage versus measurements from satellite imagery, which reaffirms confidence in the GSD achieved.
In conclusion, during straight and level flight, the GSD captured from the imagery is in good agreement with the predicted values, verifying that the proposed altitudes for the survey will achieve the desired GSD and therefore swath. Confidence was gained by gathering sufficient data with averaged measurements on numerous objects over separate instances across multiple flights.
The error caused by the change in RPY angles of the aircraft is linked closely to the platform stability of a UAV, which is inherently more susceptible to changes in environmental conditions compared to larger manned aircraft, given the lower size and weight of the platform. For optimal imagery from a UAS, it is likely to be necessary for a gimbal mount to be used to stabilise the swath the camera records throughout a flight, reducing variation in GSD and sample area.
Blur Analysis
The analysis of blur caused by motion and/or vibration was completed using two methods that complemented each other:
- Visual observation – Physically looking for blur in the imagery as an object passes through consecutive frames.
- Data analysis – RPY and acceleration data from the UAV could be used to identify rates of change in UAV altitude
- that also exhibit blur in the imagery linked more closely to motion as opposed to vibration.
Under visual observation, if vibration were to be causing an issue there are multiple indicators that can be identified when reviewing the footage:
- Objects would appear blurred and out of focus at ranges where they would not expect to be.
- The same object through consecutive frames would appear in focus and clear in one and blurred in another. This also would likely be observed in a cyclic pattern over a number of frames.
- Straight edges become indistinct or appear to be ‘doubled’.
Data and analysis for all flights with both UAV providers are presented below with the initial flight provider’s baseline hard mounted option first.
Flight provider 1 – UAS flight 1: Hard mount
Figure 11 shows six sample objects, images of focus charts, that have been captured in consecutive frames at different passes over the targets. These charts were captured at the same altitude AGL, so that the focus remains similar between examples. However, there may be a margin of error for the GSD due to the location of the charts on the landscape and RPY angle.
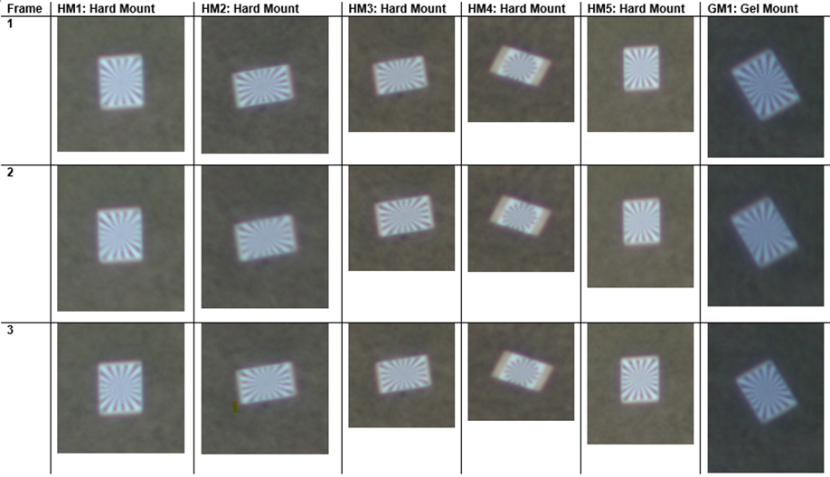
Figure 11 - part 1. Sample images of focus charts over consecutive frames showing large variation in image quality in poor weather.
Click for a full description
Images of focus charts showing variation in image quality over consecutive frames. Images were captured at the same altitude AGL. Highest image quality across appears to be capture at the midpoint of the number of frames in which the focus chart was captured. It is noted that the gel mount appears to have worse image quality than the hard mounts, though this is likely driven by high RPY rates influenced by a combination of only manual piloting and adverse weather conditions.
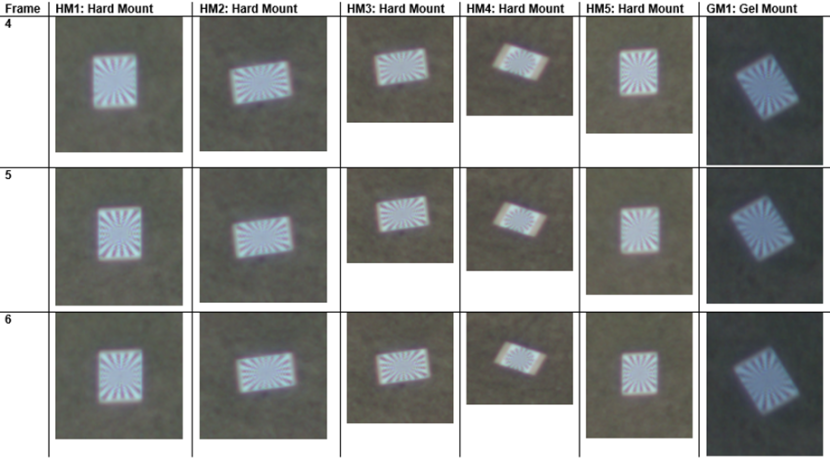
Figure 11 - part 2. Sample images of focus charts over consecutive frames showing large variation in image quality in poor weather.
Click for a full description
Images of focus charts showing variation in image quality over consecutive frames. Images were captured at the same altitude AGL. Highest image quality across appears to be capture at the midpoint of the number of frames in which the focus chart was captured. It is noted that the gel mount appears to have worse image quality than the hard mounts, though this is likely driven by high RPY rates influenced by a combination of only manual piloting and adverse weather conditions.
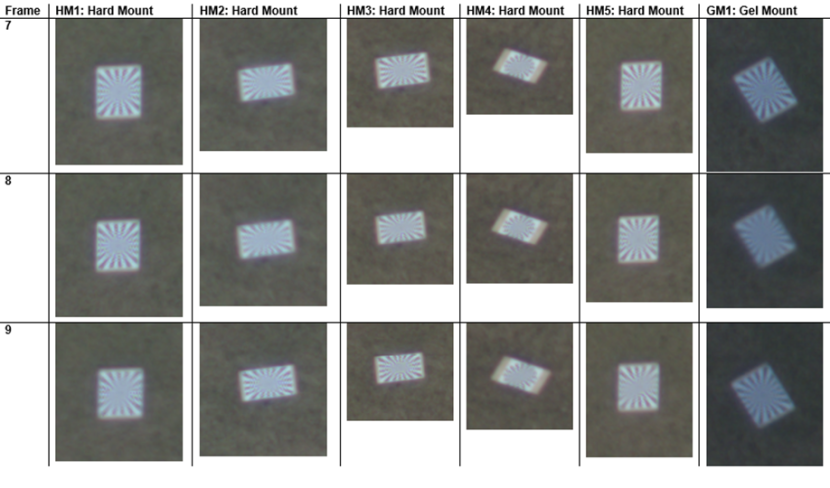
Figure 11 - part 3. Sample images of focus charts over consecutive frames showing large variation in image quality in poor weather.
Click for a full description
Images of focus charts showing variation in image quality over consecutive frames. Images were captured at the same altitude AGL. Highest image quality across appears to be capture at the midpoint of the number of frames in which the focus chart was captured. It is noted that the gel mount appears to have worse image quality than the hard mounts, though this is likely driven by high RPY rates influenced by a combination of only manual piloting and adverse weather conditions.
In these images it is first noted that the charts are in focus for the regions that they are expected to be. The central areas that appear blurred would only appear in focus at higher GSDs, for example in Figure 12, which shows a chart at approximately 30 % of the GSD in Figure 11 (smaller GSD values equate to better resolutions). At these levels of resolution, the impact of vibration and ground speed are experienced more in the imagery. This is of worthy note for surveys that require higher resolution, as the need for AV systems becomes greater, adding weight and in some cases power requirements to the system. It is also however promising that, even at these higher GSDs, there does not appear to be an impact from motion or vibration, although only two frames in total of this chart were captured at an improved resolution, making it difficult to ascertain concrete conclusions from this.
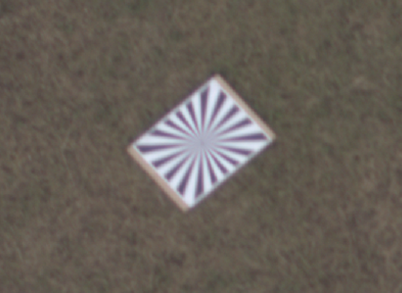
Figure 12. Focus chart at ~0.5 cm GSD.
Click for a full description
Focus chart captured at 0.5 cm GSD. The resolution of this image is higher than in the images presented in Figure 11, as it was captured approximately 30% of the GSD used. However, at these levels of resolution, the impact of vibration and ground speed are experienced more in the imagery.
Observations from the images in Figure 11 are summarised below:
- The charts, in all six cases, appear to achieve the best level of focus/clarity at the midpoint of the number of frames in which each object was captured. This is likely caused by the location of the object in the region of interest as focus can deteriorate by a small amount towards the outer most regions due to lens curvature. The impact of this is larger for lenses with wider FoVs.
- All frames of the objects appear to be very similar in terms of resolution throughout the sequence of images confirming they were all captured with a similar GSD as expected from the altitude AGL.
- While there are images that are in good focus, there are instances where the focus charts fluctuate between being in and out of focus during sequential frames.
Although the authors have a good knowledge of the capabilities of the camera, this was an unexpected initial result as the hard mounted option was predicted to incur an increased amount of imagery impacted by vibration. Impacted imagery could have been caused by different vibrational frequencies of the smaller engine when compared to a twin-engine manned aircraft as well as the location of the engines and material of the UAV.
These could also be caused by the RPY motion of the UAV. Similarly, when investigating the GSD, it was observed that objects of interest, in this case a focus chart, would deviate from a straight path over a series of sequential frames. This is shown in Figure 10 as a mosaic of equal strips of an arbitrary area of the image.
For straight and level flight, the white focus chart would be expected to follow a vertical path from the top of the image down to the bottom. Deviations in flight path from a rolling motion would appear as the object moving left or right between frames along the x axis. If there was a change in pitch, the distance between the object along the y-axis would be expected to fluctuate, increasing and then decreasing as the UAV makes alterations to its control surfaces to maintain a constant heading. From Figure 10 it is noticeable that the UAV is exhibiting rolling motion from the x-axis translation of chart between consecutive frames. There is also a variance in the y distance between frames caused by pitching rotations, although not generally as extreme and obvious as rolling motions.
An additional plot in Figure 13 presents the object locations on the sensor recorded for all charts observed in Figure 11. The central x and y pixel positions of the focus chart were recorded for this and normalised over the sensor width and height. This serves to provide visual information on the aircraft motion during the period that the charts are visible during different sections of the flight.
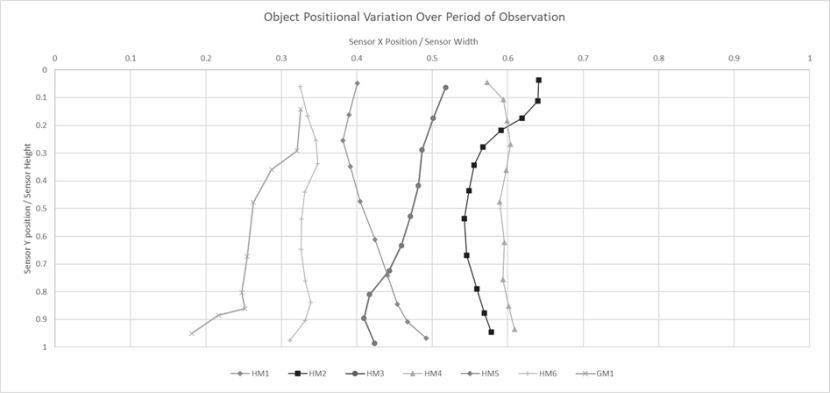
Figure 13. Variation in object position on sensor over sequential frames.
Click for a full description
Plot showing large variation in object position across sequential frames. This movement across both the x and y pixel locations throughout these range of frames was driven by rolling motion, with HM4 being the most stable in flight. The x axis is showing the sensor X position/sensor width, and the y axis is showing the sensor Y position/sensor height.
The change caused by rolling motion was experienced in all footage where the reference charts in Figure 11 were captured. Of these, HM4 was captured within the most stable section of flight. There are however still slight fluctuations in clarity between frames 4 through 7 of this object, suggesting that vibration may be influencing the imagery in combination with RPY perturbations.
It is also worth noting that this data was recorded in what is considered moderate conditions. The wind speeds were within tolerance (~10 knots), ambient light intensity was high with recordings taking place at ~16:00 local time (September) with relatively clear skies and patchy cloud cover above flight altitude. The result of this is that the exposure times of the camera are reduced when compared to footage captured in lower light levels. Darker conditions increase the susceptibility to motion and vibration blur as the required quantity of photons takes a longer period to enter the lens, therefore increasing the amount of time the shutter remains ‘open’. Higher light levels reduce the susceptibility to motion and vibration blur.
The average exposure time for this particular flight was 596µs, equating to roughly 60 % of the maximum allowable exposure time of the camera.
As ambient light and daylight hours reduce on average in winter months and, as the survey locations move further away from the equator towards the poles, the impact of vibration blur is likely to become more of a challenge. It would not be expected that motion blur from the aircraft speed would be an issue even in lower light conditions, as the distance moved by the aircraft at 70 knots during a single exposure is only 3.6 cm. As discussed earlier this is within tolerable values with the current camera and desired GSD.
Flight provider 1 – UAS flight 2: Gel mount
The same visual analysis was completed on footage captured using the gel mount option in flight 2. Sample images of the same focus chart are also presented in Figure 11 alongside the hard mount images for comparison.
It is noted first that the environmental conditions for flight 2 were considerably more variable than flight 1, with wind speeds of ~20 knots and likely higher with gusts. This flight was also completed in overcast conditions at approximately 19:00 on the 15th of September 2022 and therefore in much lower light levels. This resulted in exposure times averaging 825µs, roughly 38% longer than those in flight 1 and close to the maximum exposure of the camera, although well within its known limits of operation. In addition, due to a technical issue with the autopilot, this flight was also only flown by manual operation meaning RPY variation was more frequent.
Unfortunately, due to a technical engine fault, the flight was limited in duration and no further flights were able to be completed. The weather was a large influencing factor in this, grounding the aircraft, in addition to time constraints within the scope of the study.
Observations from the images captured using the gel AV mounts are summarised below:
- On average, over the 9 frames captured, the focus chart appears similar or worse in terms of clarity to that captured with the hard mounts in more desirable environmental conditions.
- There are fluctuations in focus between frames 1-3 and 6-9 where the chart alternates between being clear in one frame and then unclear in the next.
- Images are noticeably darker, caused by the lower light levels late in the day and in overcast conditions.
While there are signs of blur in the imagery, this is more likely caused by high RPY rates influenced by a combination of only manual piloting and adverse weather conditions that made it difficult to maintain straight and level flight. The plot for the (x,y) locations of the chart within these images in Figure 13 shows large variation in the change of both x and y pixel locations throughout this range of frames.
Flight provider 2 – UAS flight 3: Hard mount (adverse conditions)
Similar to the initial flights, the maiden flight with the second platform was conducted with hard mounting. The conditions for this flight were particularly unfavourable with strong wind speeds of around 20 knots. Due to the direction of the wind and the designed circuit route chosen to fly, the UAV experienced head or tail winds depending on the circuit side it was flying. When flying into the head wind, sometimes the UAV would be slowed so much that it captured multiple frames of nearly the same area and, depending on pitching, could even have an object move backwards in frame location before carrying on out of frame. This effect can be shown in Figure 14 which shows the variation of x and y pixel location within the camera sensor footprint for a signpost within 18 successive frames.
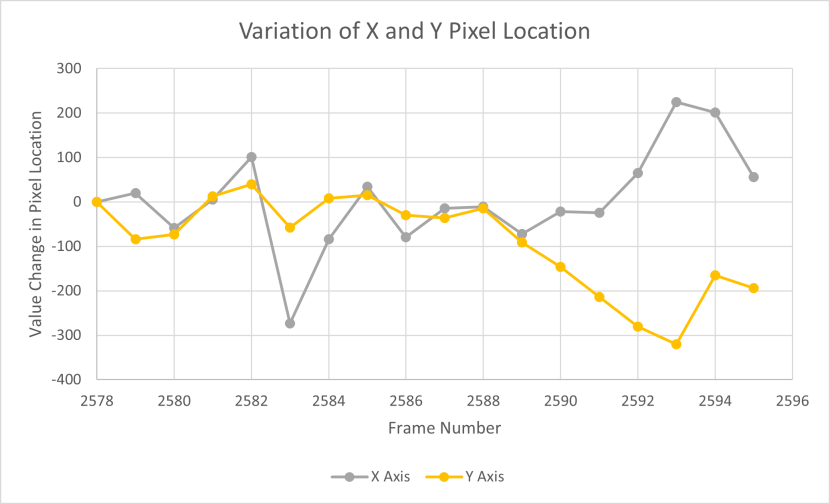
Figure 14. Variation of x and y pixel location for signpost in windy conditions.
Click for a full description
Plot showing x and y pixel location variation across 18 successive frames, caused by flying into a headwind. For a flight that is straight and level, no value change in pixel location would be expected and horizontal lines, with consistent change across the x and y values, would be observed across the plot.
For straight and level flight, it would be expected that this graph would show horizontal lines for the changes in both x and y pixel location, with the x pixel line along the x axis and y pixel line at a consistent non-zero value. These horizontal lines would show the same consistent change in x and y pixel value per frame and would be constant with the steady movement of a stationary object through a frame. As visible in Figure 14, this was not always the case during flight, with some steep changes in x, y position observed. Whenever the change in pixel value switches from a positive to negative value, or vice versa, the object has completely deviated in travel direction through the frame. This is observed six times in the x axis and four times in the y axis across the 18 frames seen in Figure 14. A change in the x pixel location shows rolling, which could give an inconsistent swath whilst surveying, and a change in the y pixel location would indicate pitching, which could lead to double counting of identified objects in extreme cases. Both of these possibilities are undesirable and so reducing variable changes of footage direction would help increase the consistency and reliability of the coverage. This could be achieved via usage of a stabilisation system such as a gimbal mount. When analysing the footage quality however, object image clarity stayed relatively high, with slight softening on some frames but generally maintaining consistently clear quality to perform identification of birds or mammals. Some example imagery from this flight is presented in Figure 15 showing multiple frames of a scrapyard captured at ~2 cm GSD. For this platform, the fact that image quality upholds even when experiencing adverse headwind conditions is of interest.
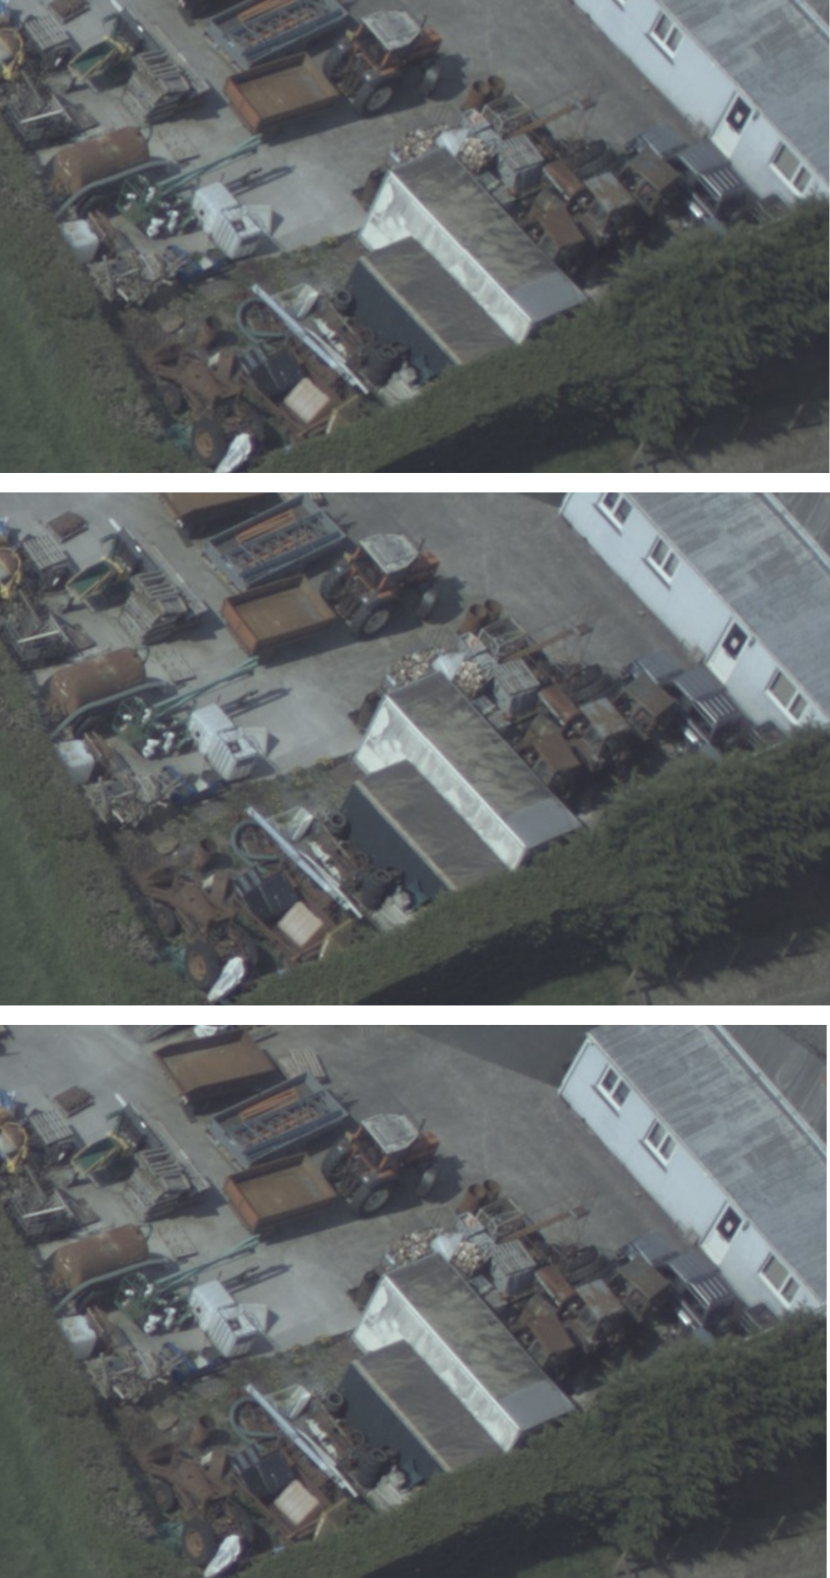
Figure 15. Secondary UAV platform example imagery (~2 cm GSD).
Click for a full description
Multiple frames of a scrapyard captured at ~2 cm GSD. Despite adverse headwind conditions, the footage maintained consistently clear and usable footage.
Having experienced considerable head and tail wind, another consideration is that for the headwind, more images of the same object would be achieved due to increased difficulty moving through the air at desired speed. This also increases the amount of time taken to complete a given survey area. However, with a tail wind, although throttle can be lowered to target the desirable surveying speed of 70 knots, there is the likelihood that the wind would carry the platform faster. Consequently, there would then be slightly fewer images of the object captured as more ground distance is covered during the same time flying at a higher speed. Nonetheless a tail wind is not deemed as a significant issue as the aircraft speed used for the manned DAS is 120 knots, where a surplus of object images are recorded for identification purposes. Therefore, no tail wind safe to fly in for a UAV platform would be nearing the camera frame recording limit for object identification.
Like the initial flights with the first provider, footage achieved with the hard mounts was again of unexpectedly sufficient quality in adverse weather and with no AV mounting. There was occasional observed softening of object images but only to a minimal degree and the imagery would still allow identification of birds and/or mammals. Sample imagery of some birds in flight recorded with the second platform are shown in Figure 16.
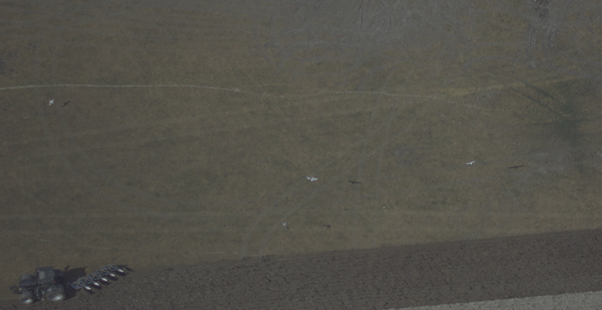
Figure 16. Sample image achieved with second platform of moving birds (alt. 197 m).
Click for a full description
Sample image captured by the second platform, showing moving birds trailing behind a ploughing tractor. Footage was captured with hard mounts attached and in adverse weather. Imagery would still allow identification of birds and/or mammals.
The most observable effect in this flight, as with the previous trial UAV, was the movement of the swath due to roll and pitch of the aircraft during gusts of wind. Without an active stabilisation system (such as a gimbal mount) and in windy conditions, it is unlikely the swath recorded would be consistent throughout a survey transect.
Flight provider 2 – UAS flight 4: Hard mount (favourable conditions)
Flights 4 and 5 were undertaken on a different day to flight 3 when weather conditions were much more favourable, around 10 knots of wind speed. For this reason, it was decided to conduct another hard-mounted flight to gather baseline conditions. For flights 4 and 5, a circuit route was flown over West Wales Airport, seen in Figure 9, achieving some footage of the airstrip as well as buildings at the airport and some farm buildings in the surrounding countryside. Two circuit loops were flown at each chosen altitude to capture footage at 2 cm, 1.5 cm and 1 cm GSD for analysis. A wheeled digger next to a brick building was used as an object of reference and comparison between frames within the footage and differing GSD conditions. This object was chosen as it was successfully flown over and clearly visible in all the flights in addition to being a large but complex object with lots of visibly distinctive outlines. Figure 17 shows a reference image achieved for the wheeled digger at 2 cm, 1.5 cm and 1 cm GSD during flight 4.
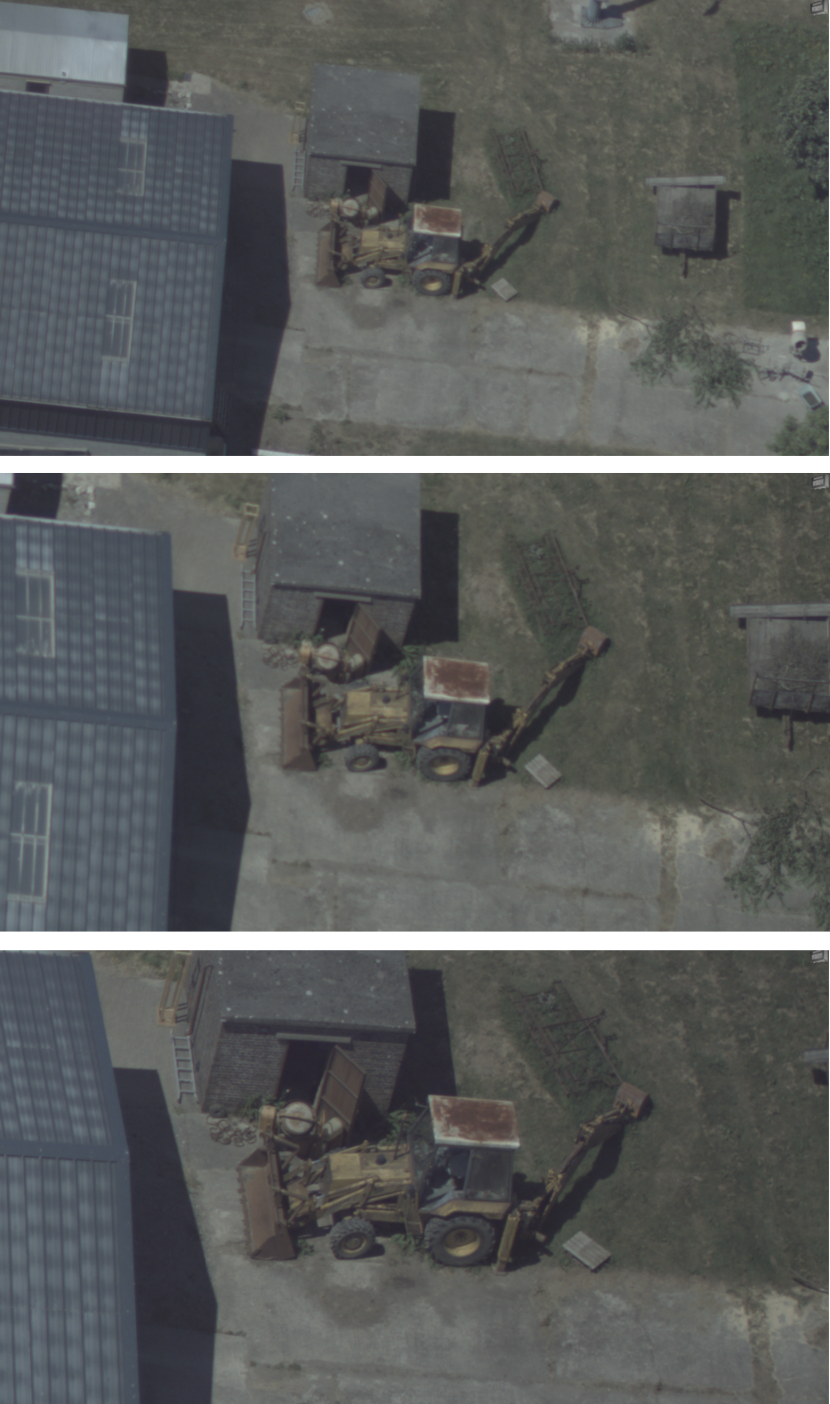
Figure 17. Reference object (wheeled digger) in 2 cm, 1.5 cm and 1 cm GSD
Click for a full description
Reference object (wheeled digger). This object was chosen due to being clearly visible in all flights, as well as being large but complex. To achieve 2 cm, 1.5 cm, and 1 cm GSD, two circuit loops were flown at each chosen altitude.
When analysing the reference object in detail over various frames at differing altitudes, some blurring was observed. Observing blur in the footage is not unexpected, as vibration was previously observed with the hard mounted option in poor weather too. This effect was observed at points during the test fight but was most clearly visible on one of the 600 ft (~180 m) circuits where over sequential frames the image was seen to go out and then back in focus shown in Figure 18. These are typical characteristics of vibration induced blur but are likely also to be influenced by the change in aircraft altitude over this period. This may either directly influence the imagery or alter the vibrational characteristics.
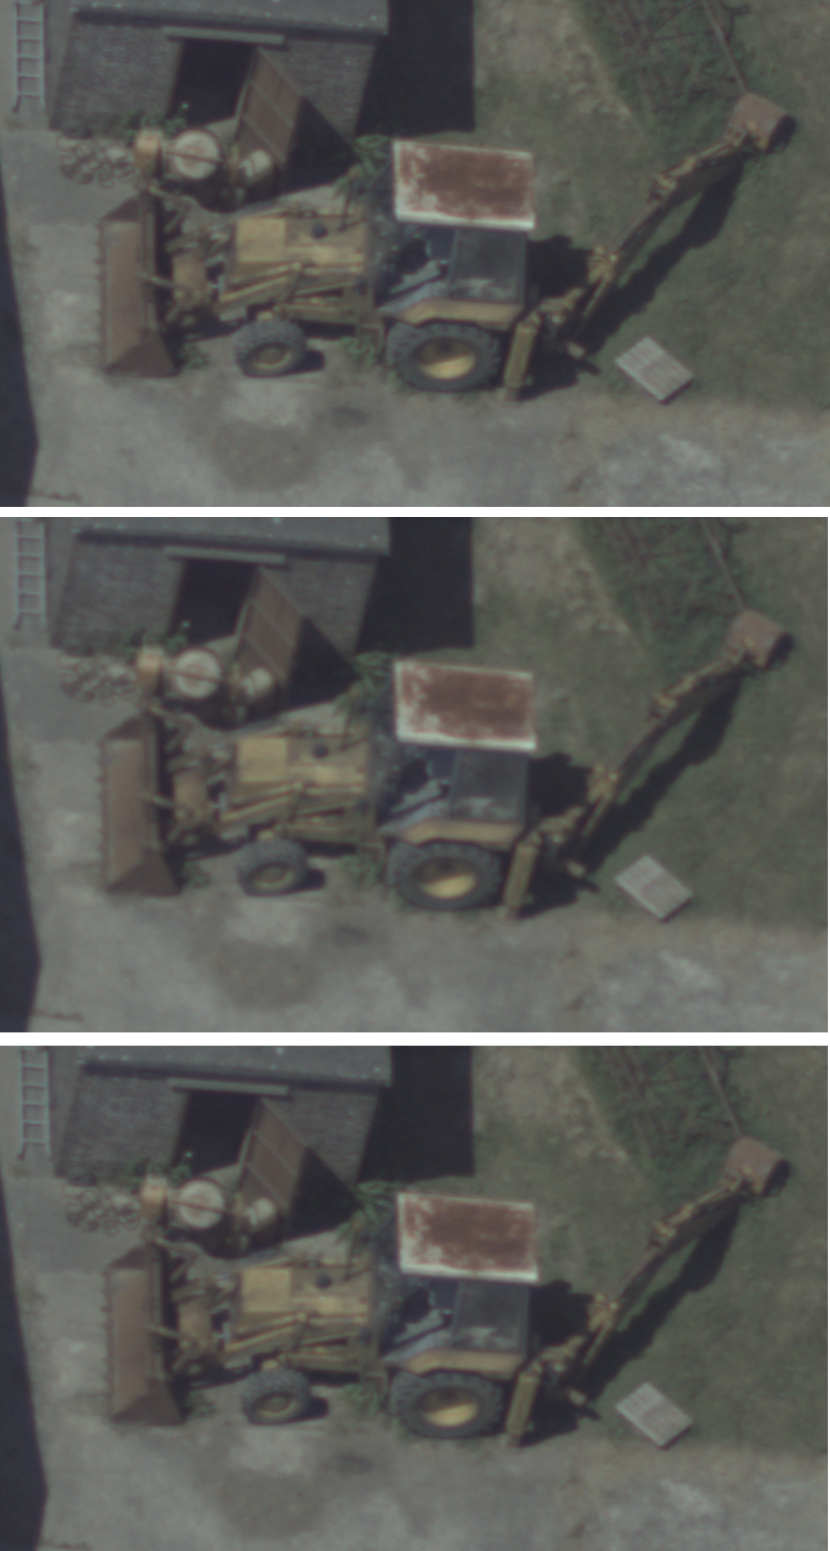
Figure 18. Sample blurred imagery induced by vibration.
Click for a full description
Sequential images showing reference object (wheeled digger), with blur caused by vibration. This effect was most clear at 600 ft (~ 180 m), where over sequential frames the image moved out and back into focus.
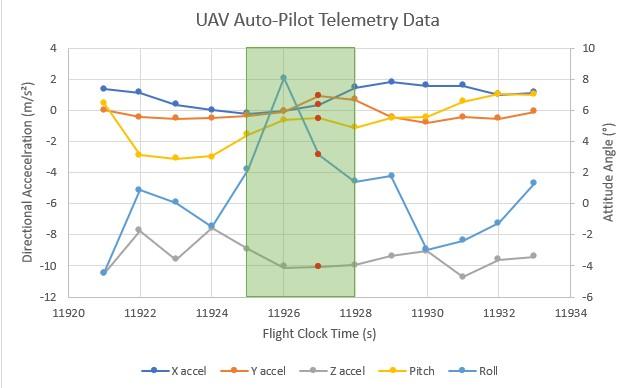
Figure 19. UAV autopilot telemetry data during observed vibration blur.
Click for a full description
Plot of telemetry data from a UAV with a hard mount. The three second interval between 11925 and 11929 seconds of the flight clock time, highlighted in green, shows when vibrational blur was experienced. A clear spike in roll angle is present at flight clock time 11926s, increasing 6° to 8° within one second. Vibrational blue was observed in frames during flight clock time 11927s, highlighted as red dots across all five lines. However, it is hard to determine the singular effect of a large increase in roll. The x axis is showing the flight clock time and the y axis is showing the directional acceleration.
Figure 19 shows a section of the autopilot telemetry data recorded during this flight. The frames of interest containing vibrational blur were recorded from flight clock time 11925 to 11928s so 5 seconds of data has been included before and after this time for comparative reference. Flight clock time was used as this counts from zero after system start up. When analysing the data visible in Figure 19 there is a clear spike in the roll angle from 2˚ to 8˚, equivalent to a roll rate of 6˚/s, just before the vibration is observed in the footage. Vibration blur was observed in frames during flight clock time 11927s, which is shown as a red dot on the graph within the highlighted green section. It is possible that the vibration occurred due to the corrective rolling of the UAV returning to level flight. However, the spike may not necessarily be the cause of the poorer footage observed. The telemetry data was recording at a frequency of 1Hz (one every second) whereas around seven frames of imagery are recorded every second. So with only one telemetry reading equating to seven frames and with some of the frames in focus, whilst others are out, it is hard to determine the singular effect of a large increase in roll. Nevertheless, motion and/or vibration blur are evidently present.
Flight provider 2 – UAS flight 5: Rubber mount
Flight 4 was undertaken in the morning, whereas flight 5 occurred later in the afternoon, so comparative imagery has noticeably different lighting and shadow characteristics. Despite the visual difference of increased shadows, there was no significant effect on the exposure time of the footage recorded, with flight 4 having an average exposure time of 105μs per frame and flight 5 having an average of 136μs. This difference is not enough to have any considerable effect on footage quality, such as motion blur due to much longer exposure times. Similar to the hard mounted footage captured on the same platform, images achieved with the rubber mount were of good quality, but when analysing individual frames of reference objects in further detail, this time no clear and obvious vibration was observed unlike the hard mounted footage. This evidence would suggest that rubber anti-vibrational mounts did improve the vibrational performance of the UAS system when compared to the hard mounts. This is demonstrated via the consistent footage quality when analysing images of the reference object, shown in Figure 20, at the same altitude as that at which vibration occurred in the hard mounted footage. When looking at the matching telemetry data in Figure 21 for these images, there is a change in altitude but not as large as that recorded in the hard mounted footage. This suggests that, in part, the rapid changes in altitude could contribute to the observed blur in the hard mounted footage.
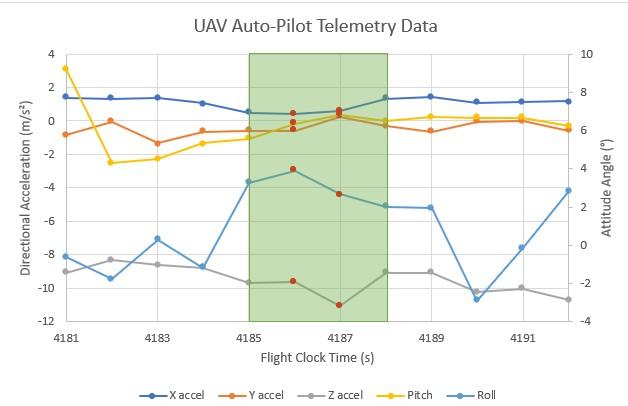
Figure 20. UAV autopilot telemetry data during comparative AV footage
Click for a full description
Plot of telemetry data from a UAV with a rubber mount. The three second interval between 4185 and 4188 seconds of the flight clock time, highlighted in green, demonstrates consistent footage quality when analysing images of the reference object. This is at the same altitude at which vibration occurred in the hard mounted footage in Figure 19. The x axis is showing the flight clock time and the y axis is showing the altitude angle.
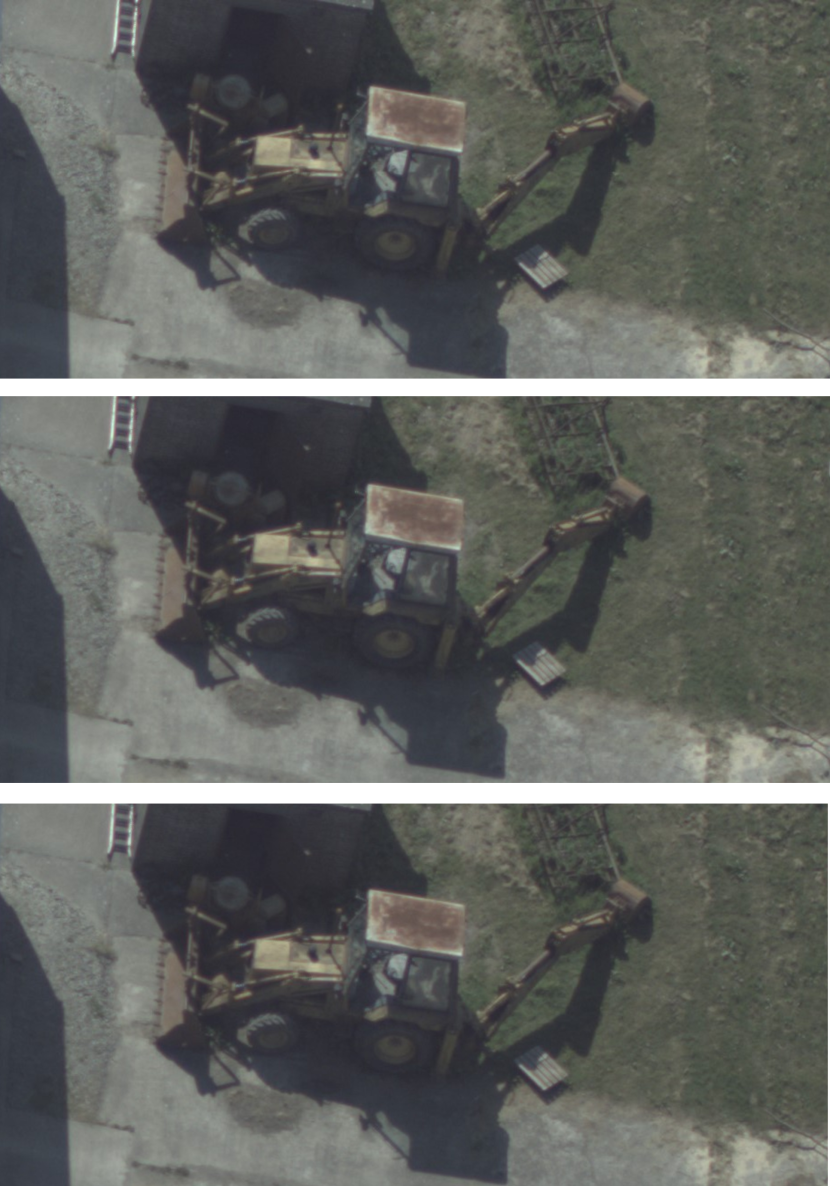
Figure 21. Sample unblurred imagery achieved from AV configuration.
Click for a full description
Images matched to telemetry data of a UAV with a rubber mount, presented in Figure 20. There is a distinct lack of blur in the images taken of the reference object. While there is a small change in altitude between images, this is smaller than observed in hard mounted UAV telemetry data, presented in Figure 19.
Disturbance Observations
Although no systematic exploration of disturbance was conducted during the trials, observations by the authors as well as pilot experience over a large number of hours flying in the area located at Whinnyfold are noted below:
- Some disturbance has been noted with birds occasionally taking off briefly and usually landing again during UAV take-off but birds are not noticeably disturbed by the UAV once airborne.
- The authors observed the same behaviour during the trial flights conducted, with birds exhibiting some disturbance characteristics such as wing fluttering and taking off during the take-off stage of flight.
- Pilots have also flown private hobby UAVs in the area (smaller quadcopter style) and have reported them to the authors as causing disturbance to wildlife. On occasion, birds have even targeted the smaller UAVs if flown too low.
These observations are similar to the findings from the literature review. This identified that higher frequency noises tended to disturb birds more than lower frequencies, supported by the change in behavioural patterns between the larger UAV and smaller hobby UAVs. It also suggested that take-off was the most likely stage of flight to cause any disturbance. However, it is still recommended that to fully understand the disturbance impacts of UASs, a scientific study should be conducted.
Based on trial flight observations and literature review to mitigate disturbance, it is suggested that the most influential factor to include in a flight plan for a UAV would be to locate the take-off area a suitable distance from the survey site to avoid influencing data in any way. A distance of at least 1 km would be recommended based on literature review, but a thorough study for any target species should also be completed.
Key Outputs
- The sensor system performed as expected and required during the flights and ground testing. This includes power performance on batteries and alternator, as well as software and processing requirements.
- During level flight, the expected GSD matches that achieved from measurements of objects in the footage and it therefore can be expected to achieve 2 cm GSD for survey flights. This is adequate for identification capabilities.
- Vibration caused by the engine and light perturbations of the aircraft in the air have an impact on footage with hard mounts.
- AV mount options improved image quality in good weather conditions compared to hard mounts.
- Motion blur from rapid changes in the RPY angles of the aircraft have an impact on imagery.
- Environmental conditions are likely to be one of, or the most, challenging aspects of operation in terms of trial surveys at marine sites in Scotland in winter.
- Although the flight originally planned to be a scaled survey design (flight 5 in Table 18) was unable to be completed, the flight paths for flights 1 and 2 covered some of the nearshore sea area at the original test location. There was a relatively large density of birds and seals near the shoreline that were captured in some of the footage presented in Figure 22. These are included as examples of targeted species only and are not indicative of scales or resolution.
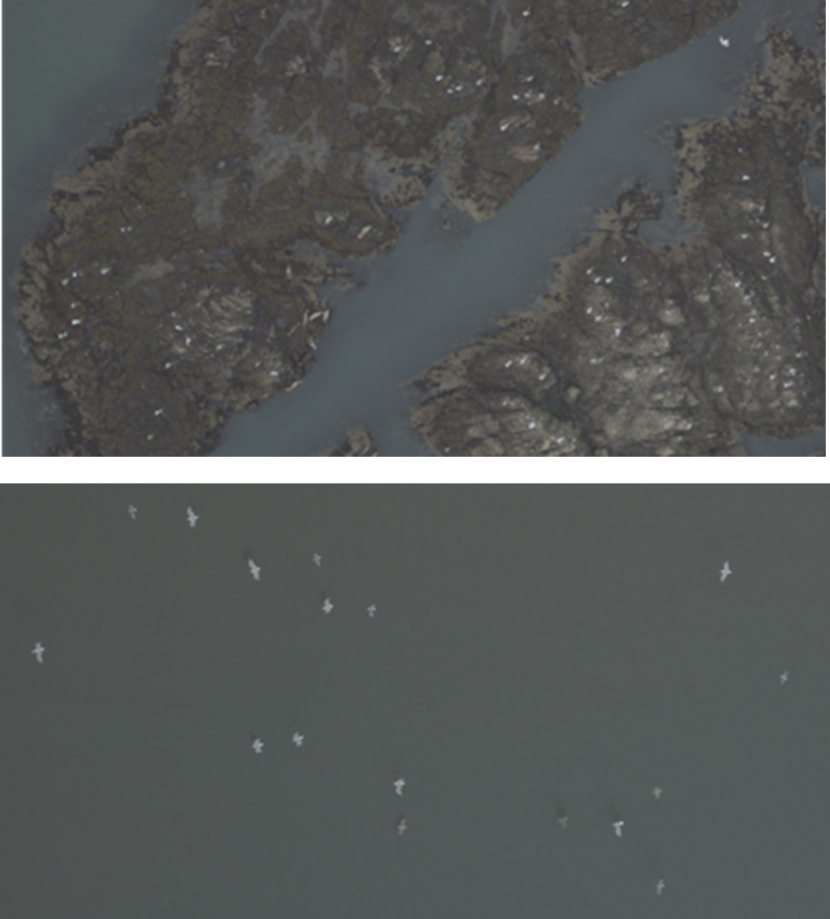
Figure 22. Example images of stationary and moving birds and seals from UAS (800 ft/ 240 m altitude ASL).
Click for a full description
Still images showing a relatively large density of birds and seals on the shoreline, and birds in flight. These are included as examples of targeted species only and are not indicative of scales or resolution.
System Specification
A summary of specification with respect to the final UAS system used during the second round of flights is presented in Table 20.
| Feature | Value |
|---|---|
| Power requirements (W) | 60W @ 18–20VDC |
| Dimensions, L x W x H (mm) | 285 mm x 165 mm x 280 mm |
| GSD ( cm) | 2 cm |
| Swath (m) | 250 m |
| Altitude (m / ft) | 251.5 m / 825 ft |
| Speed (knots) | 70 knots |
| Payload weight (kg) | 7.6 kg |
| Endurance (hours) | 5 hours |
| Maximum wind speed (knots) | 25k nots |
| Precipitation | No precipitation |
Temporary Danger Area (TDA) Application
The purpose of this section is to provide an overview of the application requirements and specifications for a temporary danger area (TDA). The expected timeframes for the approval process that have been provided by multiple operators is discussed. The example provided relates to an application for a TDA over part of Scapa Flow SPA, with a forethought towards a possible comparison survey in the future.
Requirements
A danger area is defined as an “airspace of defined dimensions within which activities dangerous to the flight of aircraft may exist at specified times”. For permission to fly a fixed-wing UAV BVLOS, an application must be made to the CAA for a TDA specifying both reasons for the requirement and a safety case to justify the permission.
Flying a UAV offshore, while not inherently dangerous, requires a degree of separation from other airspace users and a TDA could be utilised to facilitate this requirement. The TDA would request from 500–800 ft (~150 – 240 m) separation in all directions from other airspace users. In theory this would allow a manned DAS aircraft at 1650 ft (~500 m) and a UAV at 825 ft (~ 250 m) to operate simultaneously, but it is highly likely the safety case would state that the flights should alternate with morning and afternoon sessions for each. Consideration to other airspace users and engagement with local stakeholders for altitude clearance over structures such as tankers or rigs must be included in the wider planning.
Both vertical and lateral dimensions of the airspace together with operating hours and location are required to fit the minimum inputs necessary to enable the surveying tasks to be undertaken within it.
An example target area for a TDA for Scapa Flow is shown in Figure 23. This was requested following discussions with both UAV provider operations teams and balancing the requirements from NatureScot and HiDef personnel. This also allowed for special requirements to make turns at the end of transects and a buffer zone to avoid flying to the absolute extent of the TDA.
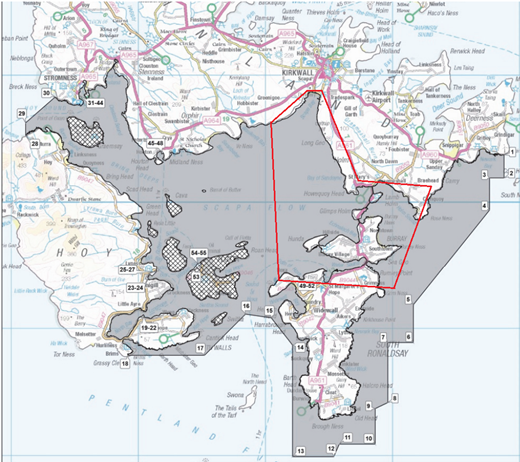
Figure 23. TDA area investigated for possible surveys.
Click for a full description
Example target area for a TDA within the Scapa Flow SPA. A TDA allowed for special requirements to made: the making of turns at the end of transects, and a buffer zone to avoid the absolute extent of the TDA. Further, a TDA balanced the requirements of both NatureScot, HiDef personnel and both UAV provider operations teams. The SPA area is defined by a grey semi-transparent polygon, while the TDA is shown as a red bordered polygon.
The example TDA permission took into account Kirkwall ATZ (Aircraft Traffic Zone), a private flying club and special permission required for the Flotta area, in addition to avoiding areas of urban density. It also aligns closely with shore-based vantage point (VP) survey locations shown in Figure 24 in which high densities of great northern divers, European shags, common eiders and long-tailed ducks were recorded in winter 2017/18 (Jackson, 2018).
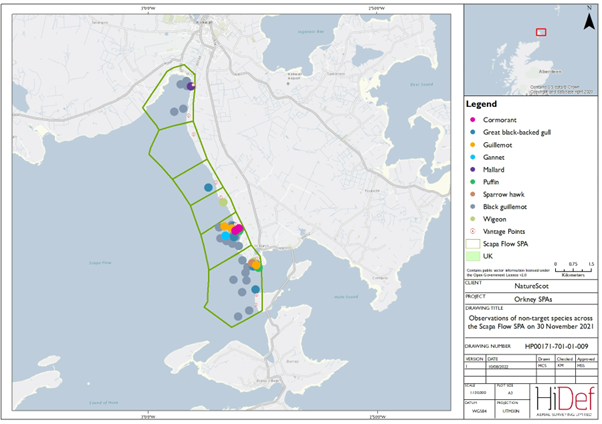
Figure 24. Vantage point areas with observed birds and count sectors
Click for a full description
Map of shore-based observations of non-target bird species within a small section of the Scapa Flow SPA in November 2021. The count sectors are defined as green polygons, with identified nine bird species within.
This TDA would provide ample opportunity to compare UAS data with both DAS and shore-based collection techniques.
As soon as the decision was taken by the project steering group (PSG) not to proceed to Phase 3 trials in Orkney in winter 2022/23, the TDA application process was discontinued. There was no exact timeline given from the CAA for the completion or approval for a TDA application and the timespan quoted ranged from 9 weeks to 21 weeks depending on complexity, location, and CAA operational workload. Time would also be required from an applicant for stakeholder engagement, including site visits, to progress any application.
The current use within Orkney of BVLOS UAVs for commercial purposes could provide some comfort to both the CAA and Kirkwall airport with respect to any future applications for TDAs to support survey flights.
Phase 2 Conclusions and Recommendations
Conclusions
The development of a proof-of-concept digital imaging system was completed with full desktop testing to verify capabilities. The purpose of this system was for use in large-scale site characterisation waterbird surveys. The system was integrated into two large-scale UAVs to produce an initial UAS, trialled in flights conducted during September 2022, with further flights carried out in a secondary platform in May 2023. Flights were completed in varying conditions and differing mounting options utilised to give assurances over the system’s capability in variable environments. The data and analysis from the system development and trial flights has been used to develop the following conclusions:
- The camera system, including the data management and power systems, were tested in controlled and intended environments. Analysis of the test data and trial flights showed that the system performed as expected and would be suitable to be utilised as part of a UAS to conduct trial surveys of inshore wintering waterfowl (IWW).
- A series of flights were designed to gather data to allow analysis of GSD, image blur and UAV performance.
- The GSD of the system was validated using measured objects on the ground but the impact of RPY in challenging conditions may have contributed to variations. In level flight, it is expected that the system would be capable of achieving the predicted GSD required.
- Vibrational impacts on the imagery were seen in flights using both hard and AV mounting options in adverse weather conditions. However, using AV mounts showed comparatively less direct impact in the footage. Visual observations of the imagery indicates that there is also a contribution to blur caused by RPY changes. It is anticipated that an AV mount similar to the rubber mount tested in this project, would be suitable for use in the UAV.
- The greater fluctuations in RPY angles of the UAS flights demonstrate the reduced platform stability of a smaller UAV in comparison to a manned aircraft and its greater susceptibility to environmental conditions such as wind and thermal effects. One method of countering would be to gimbal mount the camera system, so it is constantly compensating for the changing RPY of the aircraft. While gimbal mounting has not been part of this development process it may prove to be a necessary requirement for UAV platforms to effectively survey as they are significantly smaller and lighter than the manned aircraft currently in use.
- Wind and precipitation caused significant impact to the trial flights. This is likely to be similarly challenging during winter and early spring months and could reduce the operational days available. Logistically, the addition of planning a comparative survey with a manned aircraft and VP counts, amplifies challenges. These can be overcome, by ensuring ample timeframes are allowed where suitable personnel are available to take advantage of weather windows.
- Platform reliability provided challenges during trial flights. More pre-flight and flight testing with any selected UAV provider is desirable before live survey flights are completed in order to improve confidence in UAV platform.
- BVLOS testing of a UAS system planned on being used for survey usage is necessary to validate extended flight duration reliability.
- The TDA application and approval is a long and extensive process that is still in development with the CAA. The time taken for this process should not be underestimated particularly for projects when completion at specific dates is necessary. Although not fully explored due to study limitations, it is expected that this process becomes smoother and faster, with well established UAS operators in the UK at the forefront of involvement and development in the specific category regulatory approval approaches.
Recommendations
The trial flights indicate that a UAS, under current regulations and capabilities, has the potential to be used to conduct aerial surveys over inshore areas. It is therefore suggested that the camera system developed in this project would be capable of conducting trial surveys alongside DAS and VP surveys as a comparable survey method. However, the recommendations below need to be given careful consideration, and it is likely that further development of the system will be required.
Further assessment would be required for more remote locations and sites further from the shoreline to verify platform reliability over repeated extended flights.
It is recommended that to assess the performance of the UAS compared to a traditional method of survey (DAS in this instance), the UAS be flown at an altitude that would achieve the same GSD (~2 cm) as the manned DAS system and that, to further reduce differences in data collection, the same camera should be utilised.
For a comparison between surveying methods of DAS, UAS and VP, a sampling intensity of 12.5 % or ideally 25 % is recommended in order to reasonably carry out site characterisation. It is noted however that, due to the reduced flight speed of the UAV, the duration of survey for the entire area would be much longer than the equivalent manned DAS and for pilot studies it may be more suitable to target a specific area for comparison rather than an entire site.
Weather continually influenced operations during Phase 2 more than was anticipated from Phase 1 desktop studies. When considering the use of a UAV for surveys in harsh environments, this should be acknowledged to avoid the risk of not completing the survey at the desired time.
Based on trial flights and discussions with UAV pilots, various actions also identified in the literature review are recommended to reduce any disturbance of species in the area. In particular, the take-off area should be chosen at a distance of at least 1 km from the survey site to avoid any disturbance during engine start-up / testing, take-off and landing. Additionally, avoiding predator shaped UAVs, and flight paths that are directed straight towards the survey site should be avoided. Indirect approaches to the survey site would likely aid in reducing disturbance from direction of approach (i.e., use of buffer areas).
References
Aviation Weather Chart Archive. 2022. Metar. (Accessed 16 February 2022)
Afán, I., Máñez, M., and Díaz-Delgado, R. 2018. UAV monitoring of breeding waterbird populations: the case of the glossy ibis. UAVs, 2, 42, 1-13.
Allport, G. 2016. Fleeing by Whimbrel Numenius phaeopus in response to a recreational UAV in Maputo Bay, Mozambique. Biodiversity Observations, 7, 1-5.
Attric, 2018. Kilfinichen Pier Development: Non-Technical Summary. Kilfinichen Estate Isle of Mull.
Bakó, G., Tolnai, M. and Takács, Á., 2014. Introduction and testing of a monitoring and colony-mapping method for waterbird populations that uses high-speed and ultra-detailed aerial remote sensing. Sensors,14(7), pp.12828-12846.
Barnas, A., Newman, R., Felege, C.J., Corcoran, M.P., Hervey, S.D., Stechmann, T.J., Rockwel, l.R.F., Ellis-Felege, S.N. 2017. Evaluating behavioral responses of nesting lesser snow geese to unmanned aircraft surveys. Ecol Evol., 25; 8(2),1328-1338.
Barr, J.R., Green, M.C., DeMaso, S.J. et al. 2020. UAV Surveys Do Not Increase Colony-wide Flight Behaviour at Waterbird Nesting Sites, But Sensitivity Varies Among Species. Sci Rep 10, 3781, 1-10.
BioConsult SH. 2022. Internal communications with Marc Schnurawa.
Borrelle, S.B. and Fletcher, A.T., 2017. Will UAVs reduce investigator disturbance to surface-nesting seabirds?. Marine Ornithology,45, pp.89-94.
Brisson-Curadeau, É., Bird, D., Burke, C. et al. 2017. Seabird species vary in behavioural response to UAV census. Sci Rep, 7, 17884, 1-9.
Buckland, S.T., Anderson, D.R., Burnham, K.P., Laake, J.L., Borchers, D.L. and Thomas, L. 2001. Introduction to Distance sampling. Oxford University Press, London.
CAA. 2020. CAP722: Unmanned Aircraft System Operations in UK Airspace – Guidance. (8).
Cabell, R., Grosveld, F. and McSwain, R., 2016, June. Measured noise from small unmanned aerial vehicles. In Inter-Noise and Noise-Con Congress and Conference Proceedings (Vol. 252, No. 2, pp. 345-354). Institute of Noise Control Engineering.
Chabot, D., Craik, S.R. and Bird, D.M. 2015. Population Census of a Large Common Tern Colony with a Small Unmanned Aircraft. PLOS ONE, 10(4), 1-14.
Christiansen, F., Rojano-Doñate, L., Madsen, P.T. and Bejder, L., 2016. Noise levels of multirotor unmanned aerial vehicles with implications for potential underwater impacts on marine mammals. Frontiers in Marine Science, 3, p.277.
Collins, S. A., Giffin, G. J. and Strong, W. T. 2019. ‘Using flight initiation distance to evaluate responses of colonial‐nesting Great Egrets to the approach of an unmanned aerial vehicle’, Journal of Field Ornithology, 90(4), 382–390.
Dickens, J., Hollyman, P.R., Hart, T., Clucas, G.V., Murphy, E. J., Poncet, S., Trathan P.N. and Collins, M.A. 2021. Developing UAV Monitoring of South Georgia and the South Sandwich Islands’ Iconic Land-Based Marine Predators. Frontiers in Marine Science, 8, 630, 1-16.
DJI, 2022. (Accessed: 29 January 2022)
Drever, M.C., Chabot, D., O’Hara, P.D., Thomas, J.D., Breault, A. and Millikin, R.L. 2015. Evaluation of an unmanned rotorcraft to monitor wintering waterbirds and coastal habitats in British Columbia, Canada. Journal of Unmanned Vehicle Systems. 3, 256–267.
Dundas, S.J.; Vardanega, M.; O’Brien, P.; McLeod, S.R. 2021. Quantifying Waterfowl Numbers: Comparison of UAV and Ground-Based Survey Methods for Surveying Waterfowl on Artificial Waterbodies. UAVs, 5, 5, 1-13.
Dunn, M.J., Adlard, S., Taylor, A.P. et al. 2021. Un-crewed aerial vehicle population survey of three sympatrically breeding seabird species at Signy Island, South Orkney Islands. Polar Biol, 44, 717–727.
Duporge, I., Spiegel, M.P., Thomson, E.R., Chapman, T., Lamberth, C., Pond, C., Macdonald, D.W., Wang, T. and Klinck, H., 2021. Determination of optimal flight altitude to minimise acoustic UAV disturbance to wildlife using species audiograms. Methods in Ecology and Evolution, 12(11), pp.2196-2207.
Egan, C., Blackwell, B., Fernández-Juricic, E. and Klug, P. 2020. Testing a key assumption of using UAVs as frightening devices: Do birds perceive UAVs as risky? The Condor: Ornithological Applications, 122, 1-15.
Ellis-Felege, S.N., Stechmann, T., Hervey, S., Felege, C.J., Rockwell, R.F. and Barnas, A.F. 2022. Nesting Common Eiders (Somateria mollissima) show little behavioural response to fixed-wing UAV surveys. UAV Syst. Appl.,10, 1-14.
Emran, B.J., Tannant, D.D. and Najjaran, H., 2017. Low-altitude aerial methane concentration mapping. Remote Sensing, 9(8), p.823.
Ezequiel, C.A.F., Cua, M., Libatique, N.C., Tangonan, G.L., Alampay, R., Labuguen, R.T., Favila, C.M., Honrado, J.L.E., Canos, V., Devaney, C. and Loreto, A.B., 2014, May. UAV aerial imaging applications for post-disaster assessment, environmental management and infrastructure development. In 2014 International Conference on Unmanned Aircraft Systems (ICUAS) (pp. 274-283). IEEE.
Fernández-Juricic, E., Deisher, M., Stark, A. and Randolet, J. 2012. Predator Detection is Limited in Microhabitats with High Light Intensity: An Experiment with Brown‐Headed Cowbirds. Ethology, 118, 341–350.
FlyLogix Ltd. 2022. Communications and workshops.
Francis, R.J., Lyons, M.B., Kingsford, R.T. and Brandis, K.J. 2020. Counting mixed breeding aggregations of animal species using UAVs: lessons from waterbirds on semi-automation. Remote Sensing, 12(7), 1185, 1-17.
Gill, J., Gill, Norris, K. and Sutherland, W. 2001. Why behavioral responses may not reflect the population consequences of human disturbance. Biological Conservation, 97, 265-268.
Giordan, D., Adams, M.S., Aicardi, I., Alicandro, M., Allasia, P., Baldo, M., De Berardinis, P., Dominici, D., Godone, D., Hobbs, P. and Lechner, V., 2020. The use of unmanned aerial vehicles (UAVs) for engineering geology applications. Bulletin of Engineering Geology and the Environment, 79(7), pp.3437-3481.
Gómez-Gutiérrez, Á. and Gonçalves, G.R., 2020. Surveying coastal cliffs using two UAV platforms (multirotor and fixed-wing) and three different approaches for the estimation of volumetric changes. International Journal of Remote Sensing, 41(21), pp.8143-8175.
Google Earth. 2020. Whinnyfold, Scotland. Google Earth. [Online] Accessed: 12 September 2022
Graham, J, and Thompson, K., 2023. Approaches to monitoring wintering waterfowl in Marine Protected Areas – Moray Firth pilot study winter 2019/20. NatureScot Research Report No. 1281
Harris, M.P., Blackburn, J., Budworth, D. and Blackburn, A.C. 2019. Sule Skerry – an overspill gannetry from Sule Stack. Seabird, 32, 96 – 105.
Hassler, S.C. and Baysal-Gurel, F., 2019. Unmanned aircraft system (UAS) technology and applications in agriculture. Agronomy, 9(10), p.618.
Hayes, M.C., Gray, P. C., Harris, G., Sedgwick, W.C., Crawford, V.D., Chazal, N., Crofts, S. & Johnston, D.W. 2021. UAVs and deep learning produce accurate and efficient monitoring of large-scale seabird colonies, Ornithological Applications, 123(3).
Hodgson, J. C., Baylis, S.M., Mott, R., Herrod, A. and Clarke, R.H. 2016. Precision wildlife monitoring using unmanned aerial vehicles. Sci. Rep., 6, 22574, 1-7.
Hodgson, J. and Koh, L. 2016. Best practice for minimising unmanned aerial vehicle disturbance to wildlife in biological field research. Current Biology, 26, R404-R405.
Hong, S.J., Han, Y., Kim, S.Y., Lee, A.Y. and Kim, G., 2019. Application of deep-learning methods to bird detection using unmanned aerial vehicle imagery. Sensors, 19(7), p.1651.
Jackson, D. 2018. Scapa Flow proposed Special Protection Area (pSPA) – inshore wintering waterfowl survey 2017/18. Scottish Natural Heritage Research Report No. 1075
Jarrett, D., Calladine, J., Cotton, A., Wilson M.W. and Humphreys, E. 2020. Behavioural responses of non-breeding waterbirds to UAV approach are associated with flock size and habitat. Bird Study, 67(2), 190-196.
Kellenberger, B., Veen, T., Folmer, E. and Tuia, D., 2021. 21 000 birds in 4.5 h: efficient large-scale seabird detection with machine learning. Remote Sensing in Ecology and Conservation.
Korec Group. 2020. Accessed 12 February 2022.
Krause, D.J., Hinke, J.T., Goebel, M.E. and Perryman, W.L. 2021. UAVs Minimize Antarctic Predator Responses Relative to Ground Survey Methods: An Appeal for Context in Policy Advice. Front. Mar. Sci., 8, 648772, 1-15.
Lawson, J., Kober, K., Win, I., Bingham, C., Buxton, N.E., Mudge, G., Webb, A., Reid, J.B., Black, J., Way, L. & O’Brien, S. 2015. An assessment of numbers of wintering divers, seaduck and grebes in inshore marine areas of Scotland, (Revised 2018). JNCC Report 567, ISSN 0963-8091.
Lieber L., Langrock, R. and Nimmo-Smith W. A. M. 2021. A bird's-eye view on turbulence: seabird foraging associations with evolving surface flow features. Proc. R. Soc. B., 288: 20210592, 1-10.
Lisein, J., Pierrot-Deseilligny, M., Bonnet, S. and Lejeune, P., 2013. A photogrammetric workflow for the creation of a forest canopy height model from small unmanned aerial system imagery. Forests, 4(4), pp.922-944.
Mapes, K.L., Pricope, N.G., Baxley, J.B., Schaale, L.E. and Danner, R.M., 2020. Thermal Imaging of Beach-Nesting Bird Habitat with Unmanned Aerial Vehicles: Considerations for Reducing Disturbance and Enhanced Image Accuracy. UAVs, 4(2), p.12.
Marchowski, D., 2021. UAVs, automatic counting tools and artificial neural networks in wildlife population censusing. Authorea Preprints, pp.1-17.
McEvoy, J.F., Graham, P.H. and McDonald, P.G. 2016. Evaluation of unmanned aerial vehicle shape, flight path and camera type for waterfowl surveys: disturbance effects and species recognition. PeerJ, 4,e1831; 1-21.
Mo, M. and Bonatakis, K. 2022. An examination of trends in the growing scientific literature on approaching wildlife with UAVs. Journal of Unmanned Vehicle Systems, 10.1139/dsa-2021-0003, 1-41.
Mulero-Pázmány, M., Jenni-Eiermann, S., Strebel, N., Sattler, T., Negro, J.J., Tablado, Z. 2017. Unmanned aircraft systems as a new source of disturbance for wildlife: A systematic review. PLoS ONE, 12(6), e0178448.
Nowak, M.M., Dziób, K. and Bogawski, P. 2018. Unmanned Aerial Vehicles (UAVs) in environmental biology: A review. European Journal of Ecology, 4(2), pp.56-74
Peters-Grundy, R., Humphries, G., Harvey, J., Semple, M., Tyler, K., Harker, A.J., Pavat, D., Thomson, R., Olley, N. and Macleod, K. 2025. Scapa Flow and North Orkney Special Protection Areas (SPAs) - Inshore wintering waterfowl surveys 2021/22 and 2023 NatureScot Research report No. XXX
Puliti, S., Ørka, H.O., Gobakken, T. and Næsset, E., 2015. Inventory of small forest areas using an unmanned aerial system. Remote Sensing, 7(8), pp.9632-9654.
Rush, G., Clarke, L., Stone, M. and Wood, M. 2018. Can UAVs count gulls? Minimal disturbance and semiautomated image processing with an unmanned aerial vehicle for colony-nesting seabirds. Ecology and Evolution, 8, 10.1002/ece3.4495.
Sardà-Palomera, F., Bota, G., Viñolo, C., Pallares Valls, O., Sazatornil, V., Brotons, L., Gomariz, S. and Sardà, F. 2012. Fine-scale bird monitoring from light unmanned aircraft systems. Ibis, 154, 177-183.
Schwemmer, P., Mendel, B., Sonntag, N., Dierschke, V. and Garthe, S. 2011. Effects of ship traffic on seabirds in offshore waters: implications for marine conservation and spatial planning. Ecological Applications, 21(5), 1851-1860.
Scott, M.S., Humphries, G., Irwin, C., Peters-Grundy, R., Vilela, R., Southward, B. and Thompson, K., 2023. Inshore Wintering Waterfowl in Moray Firth Special Protection Area - 2019/20 digital aerial surveys and comparative analyses of aerial and shore-based surveys. NatureScot Research Report 1280.
SenseFly. 2022 (Accessed: 22 January 2022).
Shaw, J.T., Shah, A., Yong, H. and Allen, G., 2021. Methods for quantifying methane emissions using unmanned aerial vehicles: a review. Philosophical Transactions of the Royal Society A, 379(2210), p.20200450.
Snow, D. W. and Perrins, C. M. (editors). 1998. The Birds of the Western Palaearctic, Concise Edition (Volume 2). Oxford University Press, Oxford.
Stokkeland, M., Klausen, K. and Johansen, T.A., 2015, June. Autonomous visual navigation of unmanned aerial vehicle for wind turbine inspection. In 2015 International Conference on Unmanned Aircraft Systems (ICUAS) (pp. 998-1007). IEEE.
Thompson, S., A. and Price, J.J. 2006. Water Clarity and Diving Behavior in Wintering Common Loons, Waterbirds, 29(2), 169-175.
Tsouros, D.C., Bibi, S. and Sarigiannidis, P.G., 2019. A review on UAV-based applications for precision agriculture. Information 10 (11): 349.
UAV Scotland, 2022. Rates. (Accessed: 18 February 2022)
UAVE Limited (2023). Flight Plan. West Wales Airport: fig 9.
Upton, A.G., Williams, S.J. and Williams, E.J. 2018. North Orkney proposed Special Protection Area (pSPA) – inshore wintering waterfowl survey 2017/18. Scottish Natural Heritage Research Report No. 1074.
Valle, R.G. and Scarton, F., 2019. Effectiveness, efficiency, and safety of censusing Eurasian Oystercatchers Haematopus ostralegus by unmanned aircraft. Marine Ornithology, 47, pp.81-87.
Vallery, A. C. 2018. Assessment of shorebirds and wading birds in Galveston Bay using conventional and UAV techniques. Unpublished master’s thesis. University of Houston-Clear Lake. (Accessed 23 July 2025).
Vas, E., Lescroȅl, A., Duriez, O., Boguszewski, G. and Grémillet, D. 2015 Approaching birds with UAVs: first experiments and ethical guidelines. Biol. Lett., 11, 20140754.
Waharte, S. and Trigoni, N., 2010, September. Supporting search and rescue operations with UAVs. In 2010 International Conference on Emerging Security Technologies (pp. 142-147). IEEE.
Watanuki, Y., Takahashi, A., Daunt, F., Wanless, S., Harris, M., Sato, K. and Naito, Y. 2005. Regulation of stroke and glide in a foot-propelled avian diver. Journal of Experimental Biology, 208, 2207-2216.
Williamson, B., Fraser, S., Wade, H., Martin, J., McIlvenny, J., Wilson, J., Chimienti, M, Edwards, E., Williamson, L., Davies, I. and Scott, B. 2017. Using Unmanned Aerial Vehicles (UAVs) for environmental monitoring of tidal energy sites. Poster.
Wingtra. 2022. (Accessed: 10 January 2022)
Yang, G., Liu, J., Zhao, C., Li, Z., Huang, Y., Yu, H., Xu, B., Yang, X., Zhu, D., Zhang, X. and Zhang, R., 2017. Unmanned aerial vehicle remote sensing for field-based crop phenotyping: current status and perspectives. Frontiers in plant science, 8, p.1111.
Zappa, C.J., Brown, S.M., Laxague, N.J., Dhakal, T., Harris, R.A., Farber, A.M. and Subramaniam, A., 2020. Using ship-deployed high-endurance unmanned aerial vehicles for the study of ocean surface and atmospheric boundary layer processes. Frontiers in Marine Science, 6, p.777.
Zhang, D., Burnham, K., Mcdonald, L., Macleod, C., Dobie, G., Summan, R. and Pierce, G., 2017, September. Remote inspection of wind turbine blades using UAV with photogrammetry payload. In 56th Annual British Conference of Non-Destructive Testing-NDT 2017.