Methodological approach for the Genetic Scorecard for Wild Species in Scotland and the UK V2.0
Acknowledgements
We are very grateful to Keith Ballingall, Rob Brooker, Terry Burke, Ian Dawson, John Kerr, David Marshall, Robin Pakeman, Clare Trivedi, Eileen Wall and Frank Wright for their ideas and input to the first iteration of the original Genetic Scorecard methodology, cited below, that this current work is based upon:
Hollingsworth PM; O’Brien D; Ennos RA; Yahr R; Neaves L; Ahrends A; Ballingall KT; Brooker RW; Burke T; Cavers S; Dawson IK; Elston DA; Kerr J; Marshall DF; Pakeman RJ; Trivedi C; Wall E; Wright F; Ogden R (2020) Scotland’s Biodiversity Progress to 2020 Aichi Targets: Conserving Genetic Diversity – Development of a national approach for addressing Aichi Biodiversity Target 13 that includes wild species. Scottish Natural Heritage.
We are extremely grateful to SEFARI Gateway for funding support to make this work possible.
P.M.H. acknowledges funding from the Scottish Government's Rural and Environment Science and Analytical Services Division (RESAS).
Executive Summary
- The Genetic Scorecard method is designed for assessing risks to the genetic health of wild species including plants, animals and fungi in terrestrial, freshwater and marine ecosystems
- The approach was developed for Scotland / UK, but is designed to be widely applicable
- The Genetic Scorecard approach is not dependent on prior genetic knowledge. Direct genetic information is used where available, but where not, the approach uses structured expert opinion and demographic data
- The core of the approach is assessments of genetic risk, viewed through three primary perspectives, namely whether:
- Demographic declines are likely to have led to, or lead to, loss of genetic diversity (genetic erosion)
- Hybridisation is likely to have led to, or lead to, undesirable replacement of genetic diversity (genetic swamping)
- Restrictions to regeneration/turnover are likely to impede evolutionary change (genetic stasis)
- There follows an assessment of whether conservation actions for the species are sufficient to mitigate risks to genetic health
- The approach was originally developed for the 2020 reporting on Aichi Biodiversity Target 13, which focused on conserving genetic diversity
- The approach has since been refined, and updated to align with indicators associated with the Kunming Montreal Global Biodiversity Framework (GBF) Target 4: Maintain and restore genetic diversity, specifically, to accommodate
- Ne>500: An assessment of the proportion of populations measured with each species that have an effective population size of more than 500 individuals, as a proxy for the likelihood of genetic diversity being maintained within populations
- PM (proportion of populations maintained): An assessment of the extent of population losses, as a proxy for the likelihood of genetic diversity being maintained among populations
- This document describes the revised and updated methodology for implementing the Genetic Scorecard in Scotland for the 2025/2026 round of reporting to the GBF.
Contents
- Acknowledgements
- Executive Summary
- 1. Background: Genetic diversity
- 2. Conceptual Approach: Assessing genetic diversity
- 3. Methodological Details: Original scorecard
- 4. Methodological Details: GBF indicators
-
4.2 Defining populations
- 4.2.1. Working principles for defining populations
- 4.2.2. Using genetic data to define populations
- 4.2.3. Defining populations within continuously distributed ranges
- 4.2.4. Accommodating non-geographical isolation when defining populations
- 4.2.5. Population typologies
- 4.3. Defining individuals
- 4.4. Specific challenges in calculating PM
- 4.5. Use of the KOBO ToolBox for managing Ne and PM data
- 5. Methodological Details: Species choice
- 6. Example Scorecard
- 7. Bibliography
List of Tables and Figures
Table 1. Approaches for measuring or inferring amounts and distribution of genetic diversity
Table 2. Structure of the Genetic Scorecard approach
Figure 1. Summary of confidence levels used for genetic risk assessment
1. Background: Genetic diversity
1.1 Defining genetic diversity
Genetic diversity is a generic term for differences among individuals due to differences in their DNA sequence. It is useful to recognise that this generic definition encompasses two somewhat different components.
- Genetic variability: Genetic variability relates to the presence of different genetic types, with the focus being on the number and characteristics of different genetic types.
- Genetic distinctiveness: Genetic distinctiveness relates to the degree to which a given entity is different and distinct from other entities. This can include ‘evolutionary divergence’ (e.g., lineages that have been isolated for long periods of time and hence have become genetically distinct).
1.2 Why is genetic diversity useful?
- Loss of genetic diversity can reduce fitness and elevate extinction risks of varieties, populations and species.
- Genetic diversity loss also reduces the genetic resources available to enhance species traits for human utilization.
- Genetic diversity is involved in the adaptation of populations to the environmental conditions they occur in: different populations are often genetically adapted to those local conditions (e.g. wetter vs drier places, presence of endemic pathogens).
- Genetic diversity loss can impede future adaptive responses to environmental change (e.g. to climate change or new pest and pathogens).
- Loss of genetic diversity in key individual species can have impacts on diversity in other species and ecosystem processes (e.g. genetically determined differences in the chemistry of individual trees represents a form of habitat diversity for species associated with those trees).
- Genetically distinct lineages reflect an aspect of biodiversity that warrants conservation in its own right.
1.3 How genetic problems can arise?
- Genetic diversity can be lost where there is a decline in the size of a given population: all things being equal, larger populations hold more genetic diversity than smaller populations (Frankham, 1996). This principle generally holds for populations in the wild (in situ) and populations held ex situ (e.g. in a botanic garden, in a seed bank etc.).
- Genetic diversity can be lost when parts of a species range are lost (range contractions / loss of entire populations). As genetic diversity is typically geographically structured, the loss of a species from a given area can be associated with a loss of genetic diversity associated with that area (Frankham et al., 2017).
- If hybridisation occurs between previously isolated lineages (or different species) there is the potential for a different type of genetic problem (Todesco et al., 2016). This can occur due to a straightforward loss of purity or distinctiveness (the displacement of genetic diversity of one entity by another). It can also lead to a fitness reduction in offspring and an associated population decline if there are genetic incompatibilities between the taxa that hybridise. It is important to note, however, that hybridisation can sometimes be part of natural processes that confer adaptive traits.
- Another important element for conservation of genetic diversity is the maintenance of adaptive potential and evolutionary processes. This is particularly relevant to long-lived organisms which may experience recruitment/regeneration limitations, which reduce opportunity for genetic change and adaptive evolution to new environmental conditions.
Traits of individual species can affect their sensitivity to genetic change. The ways in which traits interact with sensitivity to diversity loss are complex and generalisations are difficult. However, species which naturally inbreed (e.g. self-pollinating plant species) typically show low levels of genetic variability within individual populations (Aguilar et al., 2006). This means that loss of individuals from populations of inbreeding species has limited impacts on genetic diversity as most individuals are genetically similar. This contrasts with the situation in outcrossing species, where reductions in the size of a given population can have marked impacts on maintenance of genetic diversity.
1.4 Approaches for conserving genetic diversity
Genetic diversity can be conserved ‘in the wild’ (in situ), outside of species’ natural habitat, often in collections (ex situ), or in highly managed systems (circa situ conservation).
1.4.1 In situ
Conserving genetic diversity in situ has the intrinsic benefit of allowing natural evolution and genetic change as populations are exposed to new environmental conditions and pressures. A key aspect of in situ management for genetic diversity is enabling these processes to take place, and of particular importance is turnover. This is relevant for long-lived organisms (e.g., forest trees) which can persist as individuals without regeneration if management conditions are sub-optimal, thus reducing opportunities for evolutionary change. An additional basic advantage of in situ conservation is that in many cases there can be greater available land area and the ability to support more individuals (and hence more genetic diversity) than for other conservation approaches.
1.4.2 Ex situ
Ex situ collections (e.g. seed banks, farms, zoos, botanic gardens, plantations, arboretums, cryopreservation) provide an accessible genetic resource and a ‘safe house’ where continued survival in situ is uncertain. The approach is particularly well suited for propagules such as seeds which can be stored for long periods of time in a space-efficient fashion. The key challenges are assembly costs, storage costs, and space requirements where living individuals are the only practical ex situ option. A general challenge for ex situ collections is that removal from in situ conditions typically precludes adaptation and evolution to changes in the in situ environment. Furthermore, for ex situ living collections (e.g., zoos, botanic gardens), generational turnover can lead to adaptation to ex situ conditions which may be undesirable if reintroduction to the wild is an ultimate goal. There is also the potential for elevated levels of hybridisation and (sometimes cryptic) loss of genetic integrity to take place in ex situ collections if multiple species are kept in close proximity.
1.4.3 Circa situ
Some species of agricultural importance are maintained circa situ, in highly managed systems within their native range. Examples include the management of stands of native forest trees as seed orchards, and more general management of species in an agricultural/agroforestry/urban landscape. These systems combine the benefits of the management control of ex situ collections, with some level of exposure to changes in ambient environmental conditions facilitating evolutionary change. Conversely, one limitation is that depending on the management practices applied, the species in question may be subject to atypical selection pressures leading to unwanted/unexpected evolutionary change.
1.5 How genetic diversity is measured/inferred
Table 1 summarises the different ways genetic diversity can be measured or inferred. There is no single measure of genetic diversity or methodology that is appropriate for all situations. As genetic diversity ultimately relates to differences in DNA sequence, an obvious starting assumption is that some measure of DNA sequence variation is the baseline unit of measurement. This, however, is not straightforward, and although DNA sequencing costs continue to fall, obtaining, managing and interpreting DNA sequence data for multiple species on a large scale is still expensive. Major biodiversity genomic sequencing projects such as the Darwin Tree of Life Project are addressing this (Darwin Tree of Life Project Consortium, 2022), but extensive work is still required before range-wide genome-wide sequence variation is available for most species.
1.6 Summary
Conserving genetic diversity requires consideration of different aspects of genetic diversity (amounts/types of diversity and levels of distinctiveness); the factors which might cause genetic problems (diversity loss, unwanted genetic replacement, constraints on evolution); the relative importance of in situ, circa situ, and ex situ conservation, and the practicalities of how genetic diversity can be measured and monitored.
Unit of measurement/ surrogate | Description | Applicability |
|---|---|---|
| Total genetically determined phenotype | All aspects of an individual that are genetically determined (e.g. appearance, traits, adaptive characteristics) | Extremely useful, but practically intractable in most cases. Comprehensive direct measurement of genetically determined traits requires detailed experiments as much variation among individuals is environmentally induced |
| Selected genetically determined trait/phenotype | Data on a selected subset of genetically determined traits or levels of fitness | Direct measures of adaptation/fitness/traits of interest can directly inform strategies to conserve this type of diversity. This does not capture the full range of potentially important adaptive variation, and evaluation can be confounded by environmental effects unless in controlled conditions |
| Completely sequenced genome | Comprehensive sequence and assembly of an individual’s genome providing a full representation of its genetic make-up | Extremely useful and a direct focus of the Darwin Tree of Life Project. Provides a way to directly compare levels of genetic variation and distinctiveness. However, producing a reference genome and subsequent whole genome sequencing of individuals from many different populations remains expensive to deliver at scale. |
| Genetic marker data | DNA data from a subset of the genome gathered to assess levels of variability and distinctiveness | Very useful measure of general amounts and distribution of genetic variation (and whether variation is higher or lower in some individuals/populations). Usually uninformative about particular traits or degree of adaptation, although marker data can be targeted to candidate genes for adaptation |
Ecological and environmental information | Data on population sizes, isolation, distribution and environmental variation. Indirect measure of underlying genetic and adaptive variation | Basic distributional data represents a surrogate measure for the distribution of genetic diversity as (a) Population size and isolation shows some correlation with genetic diversity (small/isolated populations ≈ lower diversity); and (b) Geographic distribution shows some correlation with distribution of genetic diversity (more geographically distant ≈ more different). Populations inhabiting different environments may show adaptive differences (bigger environmental differences ≈ bigger adaptive differences). Involves making assumptions/extrapolation from other studies, rather than directly measuring genetic information from the species concerned. Distributional data are widely available, data on population sizes are less widely available |
Collection information
| Data on number and richness of ex situ collection events/accessions
| Classic metric for stored material (cryopreservation, seedbanks, zoos, botanic gardens). Can provide a surrogate measure of level of coverage against an ‘ideal’ as to the degree to which variation in the wild is conserved ex situ. It is usually based on the assumptions outlined for “Ecological and environmental information” rather than directly measuring any genetic information from the species concerned |
2. Conceptual Approach: Assessing genetic diversity
2.1. The Genetic Scorecard for Wild Species
The Genetic Scorecard for Wild Species (hereafter, ‘the Scorecard’) is designed for assessing risks to the conservation of genetic diversity. It is based on a central working principle of a need to be flexible to allow use not only in Scotland/UK but also in other countries. Factors that vary among countries include:
- The presence of endemic divergent genetic lineages: Countries and regions which have not experienced major perturbations such as extinctions due to glacial cycles are more likely to have accumulated endemic divergent phylogenetic lineages, than countries with ‘young’ biotas which have been largely assembled over the last 10,000 years following ice-sheet retreat. A focus on divergent lineages is likely to be more appropriate in regions with long term historical climatic stability, compared to e.g. recent glaciated boreal countries like Scotland.
- Resource availability: The capacity of a given country to report on genetic diversity in wild species will depend on the resources available, the level of knowledge of a given biota, and the diversity and scale of the country in question. Key requirements of an effective system for reporting on wild species genetic diversity are scalability and applicability in situations where resource availability is limited.
- Geographical scales of data holdings: Where spatial data are used for reporting, a practical issue relates to the scale at which data are held. Additional steps may be required to up-scale or down-scale reporting where different datasets are held and curated at different levels (e.g. state vs national level). For example, this is a particular issue for the UK where considering priority species for Scotland requires either steps to extract Scotland-specific data from UK-wide compilations, or consideration of issues at a UK scale for Scottish priority species. In some cases, populations may extend over several countries and as a result, must be considered at this larger scale. This is often true of highly mobile species such as birds or marine mammals.
The Scorecard process involves the following stages (further details in Table 2):
- Summary of information on the target species, to articulate key issues and relevant species traits that may impact on susceptibility to genetic problems.
- A statement of the likely international importance of the national genetic diversity for the species, to contextualise the assessment.
- Evaluation of key genetic risks facing in situ populations:
- Diversity loss – focusing on population declines (e.g. general diversity loss), the loss of functional diversity (e.g. important traits or adaptive differences), or loss of populations that are likely to hold unique evolutionary lineages.
- This section includes the formal quantitative Global Biodiversity Framework Indicators which focus on the proportion of populations with an effective population size of >500 individuals (‘Ne500’), and the proportion of populations maintained (‘PM’).
- Hybridisation – focusing on risks of elevated mixing of genetic diversity leading to negative consequences (e.g. genetic pollution, genetic swamping, outbreeding depression).
- Low turnover – an approximation of the degree to which turnover is restricted. This is particularly important for long-lived species, such as forest trees, where lack of regeneration can impede evolutionary change.
- Diversity loss – focusing on population declines (e.g. general diversity loss), the loss of functional diversity (e.g. important traits or adaptive differences), or loss of populations that are likely to hold unique evolutionary lineages.
- Production of an overall in situ threat assessment based on expert opinion leading to a ‘negligible-moderate-serious’ genetic risk categorisation according to species attributes and the threats faced by the species.
- A statement of confidence on the overall in situ threat assessment. This step aims to transparently capture the level of certainty among experts as to the risk categorisation.
- The level of representation in ex situ collections. This step lends itself well to plant species that are suited for holding as ex situ collections in seed banks, but may also be applied to other taxa in managed ex situ conservation collections. An example of this approach for UK plant species would include:
- The number of 10 km squares represented in seedbank collections, as a proportion of the 10 km squares in which the species is known to occur.
- The extent of occurrence (EOO) of seed bank collections as a proportion of the EOO of in situ populations (where EOO = the minimum convex polygon around all points).
- The proportion of zones of provenance in which the species occurs in the UK that are represented in seedbank collections.
- A summary of existing management actions relevant to the species in the area of assessment.
- A final combined overall ‘traffic light score’ on the Genetic Health of the species. This is an expert opinion based on the species, its risks and current management responses.
| Header | Information required |
|---|---|
| Context - Background | Overview of what is known about the species, its distribution, key relevant biological traits (e.g. breeding system, mode of reproduction, any previous genetic studies). |
| Context - Current threats | Summary of threats facing the species (e.g. grazing, overharvesting, predation, persecution, climate change etc.). |
| Context - Contribution of Scottish / UK population to total species diversity | Assessment of the relative contribution of the taxon in the area of assessment to total species diversity (e.g. whether Scotland / UK has internationally important range representation, endemic subspecies, population differentiation). |
Genetic risks - Diversity loss: population declines
| Narrative assessment of likelihood of diversity loss (e.g. small or reduced population sizes, range contraction or fragmentation). Incorporation of direct genetic evidence if available. |
| Genetic risks - GBF Population definitions | How populations are defined when using the GBF indicators (Ne>500, and proportion of populations maintained) |
| Genetic risks - Ne500 | The headline GBF indicator for genetic diversity – the proportion of populations with an effective population size of more than 500 individuals |
| Genetic risks - PM | A complementary GBF indicator for genetic diversity – the proportion of populations maintained (e.g. populations extant / extant + historical populations) |
Genetic risks - Diversity loss: functional variation
| Narrative assessment of likelihood of important functional diversity (e.g. particular threats to specific ecotypes or phenotypic trait classes). Incorporation of direct genetic evidence if available. |
| Genetic risks - Diversity loss: divergent lineages | Narrative assessment of likelihood of loss to divergent populations (e.g. known or suspected distinct lineages). This can be based on morphological, geographical or historical data, or if available direct genetic evidence of divergent lineages. In animals, but less commonly in plants, such lineages are often referred to as evolutionary significant units. |
Genetic risks - Hybridisation/ introgression | Narrative assessment of likelihood of loss of genetic integrity via inter-specific hybridisation or inappropriate mixing. This can be based on direct genetic data, morphological assessments of hybridity, or proximity and abundance of known threats. |
Genetic risks - Low turnover/ constraints on adaptive opportunities | Narrative assessment of reproduction and recruitment as an indicator of potential for evolvability. If there are limitations to recruitment, the narrative should indicate the proportion of populations that are affected. |
| In situ genetic threat level | Expert opinion classifying in situ genetic risk as serious, moderate, or negligible. |
| Confidence in in situ threat level | Confidence based on evidence quality and agreement. |
| Cumulative risk summary - Ex situ representation | Narrative and/or quantitative summary of representation in viable and accessible ex situ conservation resource (e.g. number of zones of provenance represented in ex situ collection, range representation of zones of provenance in ex situ collection). |
| Cumulative risk summary - Current conservation actions | Narrative and ‘check-box’ summary of current approaches/in situ interventions to mitigate threat. |
| Cumulative risk summary - Population assessment/ monitoring - demographic | Details of demographic monitoring that underpins this report |
| Cumulative risk summary - Population assessment/ monitoring - Genetic | Details of any genetic monitoring that underpins this report |
| Cumulative risk summary - Overall Genetic Health status | Summary of genetic health status in the area of assessment, encompassing risk and efficacy of current mitigating actions. |
| Cumulative risk summary - Overall Genetic Health status explanation | Succinct explanation/justification of overall genetic health status. |
| Further work | Recommendations for future work to improve understanding of the species from the perspective of the scorecard aims |
| Assessor | Name of person or group who undertook the assessment. |
| Reviewer | Name of person or group who reviewed the assessment. |
3. Methodological Details: Original scorecard
3.1. Quantifying genetic risk
Compared to metrics focusing on demographic changes (e.g. IUCN Red Listing), there is no universally accepted standard for measuring genetic diversity, and by extension no universal standard for classifying loss of genetic diversity into different threat categories. Different genetic diversity metrics measure different properties (e.g. diversity of allelic variants within a population, diversity of allelic variants within individuals, overall differences between populations, the nature of the genetic differences between populations). Furthermore, different ways of measuring genetic diversity result in different sensitivities to genetic diversity loss (e.g. a population could simultaneously lose half of its genetic variation for some regions of its genome and lose no variation for others).
A second difference between genetic change and demographic change relates to the reversibility of losses. Individuals and populations experience demographic decline due to mortality that can be replenished by local births or migration. Genetic variation can be replenished by migration, but not where unique genetic variants are lost – mutation rates operate on a temporal scale that is often measured in thousands of years. Thus, all things being equal, in perfect conditions for a species, a loss of 50% of its genetic diversity would have a much longer recovery time than loss of 50% of its individuals.
Collectively, these differences complicate direct adoption/translation of threat categories from standard IUCN Red-Listing to genetic variation. Instead, we have developed generalised statements to steer expert opinion to a relatively consistent classification of genetic problems. A deliberate aim is not to constrain definitions too tightly, in recognition that different data types and scenarios may frequently be experienced.
Our scorecard assesses contemporary genetic issues, and likely future issues, during a 25-year window from the point of assessment. Genetic risks are classed as:
Negligible: No obviously detectable genetic problems occurring or expected over the next 25 years.
Moderate: Moderate genetic problems occurring or expected over the next 25 years; e.g.:
- Moderate loss of populations which are likely to contain unique diversity or steep declines in these populations (e.g. resulting in losses of up to 25% of important genetic types/distinct populations).
- Clearly observable fitness problems in up to 25% of populations due to low genetic variation and subsequent inbreeding depression and/or constraints in ability to adapt to environmental change.
- Marked and clearly observable loss of genetic integrity by hybridisation for up to 25% of populations.
- Severe restrictions on regeneration/recruitment/reproduction in many or most populations of long-lived species limiting evolutionary change in the immediate future.
Serious: Serious genetic problems occurring or expected over the next 25 years; e.g.:
- Severe loss of populations which are likely to contain unique diversity or steep declines in these populations (e.g. resulting in losses of > 25% of important genetic types/distinct populations).
- Loss of any highly divergent endemic lineages that are globally unique.
- Strong, clearly observable fitness problems in >25% of populations due to low genetic variation and subsequent inbreeding depression and/or constraints in ability to adapt to environmental change.
- Marked and clearly observable loss of genetic integrity by hybridisation at >25% of populations.
Currently low levels of genetic variation are often due to previous loss of genetic diversity. Where such losses are referred to in the narrative sections of the scorecard, we adopt the term historical change/loss to refer to genetic diversity change/loss post-1750, and past change/loss to refer to genetic diversity change/loss in the last 50 years (e.g. post-1975).
3.2. Quantifying uncertainty
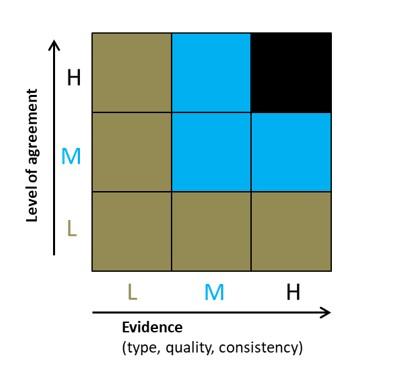
Figure 1. Summary of confidence levels used for genetic risk assessment (L = low, M= medium, H = high)
Click for a full description
For quantification of certainty we use the approach adopted for the UK Biodiversity Climate Change Impacts Report Card (Figure 1). This combines the level of agreement among experts and the type of available evidence. The overall confidence level is governed by the lowest score for either expert agreement or evidence availability.
4. Methodological Details: GBF indicators
4.1. The Ne>500 and PM indicators
The Global Biodiversity Framework (GBF) Ne>500 and PM indicators are proxy measures for genetic diversity.
“The Ne > 500 indicator measures the proportion of populations within species which are of sufficient size to maintain genetic diversity and adaptive potential. When a population is below a threshold of approximately Ne 500, genetic diversity loss starts to occur, and at population sizes much smaller than this threshold, genetic diversity loss can be very rapid. The ideal state is a value of 1, indicating all populations are of sufficient size (that each population is above Ne 500). The Ne > 500 indicator can be calculated across many species to provide a country level estimate of whether species are maintaining genetic diversity within populations.”
The most widely used method to estimate whether a population has an Ne > 500 is to use a ‘census-size to effective-population-size ratio’ of 0.1 (e.g. a population with more than 5000 individuals is considered to have an effective population size of Ne>500). This ratio can be adjusted where there is strong data to suggest it is not appropriate (e.g. in species which are not regenerating at all).
A complementary indicator to Ne>500, is the proportion of populations maintained (PM). This is simply estimated as the number of extant populations as a proportion of the total number of known populations, measured at a stated past timepoint. Adding the Ne>500 and Proportion of Populations Maintained to the scorecard was proposed in O'Brien et al., 2022.
4.2 Defining populations
A starting point for the Ne>500 indicator and the Proportion of Populations Maintained is to define what constitutes a population in the target species. This can be challenging. Our approach and considerations are outlined below.
4.2.1. Working principles for defining populations
- Use best available evidence collectively (e.g. do not use a hierarchical decision tree, as much of the interpretation will be context dependent).
- Harmonise with existing monitoring classifications of populations (coming up with a population definition that does not match monitoring data will make implementation challenging).
- State clearly the method used.
- Where there is ambiguity, err on the side of ‘splitting’, recognising that subsequent aggregation is easier than disaggregation.
- Ranges of estimates can be provided using different groupings of ‘populations’. Sensitivity analyses can establish if different equally logical approaches to population definitions result in materially different outcomes.
4.2.2. Using genetic data to define populations
- Genetic marker data which shows clear cut discontinuities over multiple unlinked nuclear loci can provide clear evidence for a lack of gene flow between populations and thus help define population units. There are, however, some areas where caution is required:
- Very large numbers of genetic markers can allow the discrimination of very genetically similar groups (e.g. there may be statistical significance, yet limited meaningful biological differences).
- Clear genetic differences can be found between populations in organelle loci despite extensive gene flow in species with asymmetric sex dispersal. For instance, wind-pollinated tree species can show strong population structure for plastid DNA (which is predominantly transmitted by seed), despite high-levels of pollen mediated gene flow and low levels of differentiation for the nuclear genes. Thus, organelle markers can lead to overestimation of population differentiation in these circumstances.
- Genetic marker data which shows similarity among populations can be challenging to interpret in recently fragmented systems, as it can be difficult to distinguish similarity attributable to historical (pre-fragmentation) gene flow versus contemporary gene flow.
4.2.3. Defining populations within continuously distributed ranges
- Widespread continuously distributed populations may have high levels of gene flow, but still have uneven distribution of adaptive genetic variation across their range and thus be susceptible to genetic diversity loss if parts of this continuously distributed range are lost.
- Continuously distributed species can thus be treated as single populations or divided into:
- Management Units representing defined geographical areas within a given species range.
- Pros – understood by stakeholders and likely to have data at this level of unit;
- Cons – may overestimate number of populations, possibly with broad environmental heterogeneity within these units – e.g. lowland and montane environments within a single management unit.
- Ecogeographic zones representing areas of environmental similarity within a given species range
- Pros – logical proxy for adaptive variation;
- Cons - monitoring data may not be structured and recorded in a way that corresponds to the boundaries between ecogeographic zones making recording/monitoring of population size and population persistence challenging.
- Management Units representing defined geographical areas within a given species range.
4.2.4. Accommodating non-geographical isolation when defining populations
- Isolation can occur at a single site where there are clearly distinct different environments. This can include shallow versus deep water populations, or differentially adapted populations occurring on different substrates which are distributed in a mosaic fashion.
- Where there is good evidence for ecotypic differentiation, a given site may be split into multiple populations, with the most granular unit being the habitat-type within a site (e.g. Site XX deep water population; Site XX shallow water population).
- Isolation can occur at a single site where there are temporally isolated populations. This may occur due to non-synchronous migratory patterns (e.g. alternative year breeding populations), or it could occur due to phenological differences (e.g. spring versus autumn breeding populations).
- Where there is good evidence for temporal differentiation, a given site may be split into multiple populations, with the most granular unit being the temporally connected breeding group within a site (e.g. Site XX even year breeding population; Site XX odd year breeding population).
4.2.5. Population typologies
Using the preceding considerations, we have adopted the following default positions for defining populations, recognising that on a case-by-case data other definitions and data sources may be appropriate.
- Species exists in small, isolated populations in the landscape and dispersal distances are likely to be poor
- Use geography to define the populations
- Species is continually distributed and efficiently dispersed over wider geographically distances, treat separately as:
- A single population, and
- Management Units (e.g. defined by geographical units - zones of provenance*)
- Species is patchily distributed but widely distributed and sites are possibly connected by high levels of gene flow and/or show metapopulation dynamics
- Treat connected (or most likely connected) clusters of occurrences as a population
- If major ambiguity exists, treat as a large single population, broken into Management Units
- Species is highly mobile over wide geographical distances
- Count as a single population, and
- If there are well established Management Units within this – undertake a sensitivity analysis by also considering the population as equivalent to the Management Unit
- Species has a composite mix of clearly distinct populations and more continuously distributed populations
- Treat spatially discrete populations as point 1
- Treat continuous populations as point 2
- Species occurs as distinct spatial patches within a small geographical area (e.g. different plant patches on a single mountain)
- Treat as a single population unless there is very good evidence to do otherwise
- Migratory species have clearly different breeding grounds
- Treat the clearly distinct breeding grounds as separate populations
- If movement or dispersal between breeding grounds is likely (particularly in juvenile life stages) treat as a single population (as per point 3)
- Species shows clear local ecotypic variants associated with adaptation to different micro-habitats
- Treat the different ecotypes within a site as distinct populations
- Species shows clear temporal breeding differences within a given geographic location
- Treat the different temporal breeding groups as distinct populations (e.g. even year versus odd year populations)
*For example, for widely distributed terrestrial species with continuous distributions in the UK, our default approach for the 2025 reporting is subdivision of continuous ranges into the four zones of provenance for UK seeds zones, treating Northern Ireland as a 5th zone (see Appendix 1 for more details on zones of provenance). These zones of provenance are a pragmatic method of dividing widely distributed species into smaller geographically defined units.
4.3. Defining individuals
Another practical challenge in implementing the Ne>500 indicator is how to define an individual. For obligately sexually reproducing organisms this is often straightforward, and there is no ambiguity where one individual starts and another finishes. For asexual or facultatively asexual individuals, it can be far from straightforward, and in organisms like clonal plant species, the number of genetically distinct individuals can be many orders of magnitude lower than the number of distinct stems/individuals in a population. In cases like this, without genetic data to estimate the extent of individual clones, there will be considerable uncertainty in the estimates of population sizes.
Options are to (a) extrapolate from direct genetic studies of clone distributions where available, (b) use a coverage area where known, and use area as a proxy for number of individuals, (c) report that it is not meaningfully calculable.
4.4. Specific challenges in calculating PM
Biological recording data can provide rich evidence of range contractions and species no longer being found in sites where they have been recorded in the past. Accommodating these important recent historical population losses in the derivation of PM metrics, however, can represent a challenge as information on the spatial extent and nature of past populations may be patchy. The further back in time a population was lost, the more likely information will be lacking. One possible approach is to treat these past populations as ‘presence in a given geographical region’ – and take a broad-brush approach to population continuity (e.g. assess whether there is there still a population present in a given geographical region, even if individual sites have been lost). Another is to express PM as a proportion of current records / past records at a fixed geographical scale (e.g. number of 10 km x 10 km squares currently occupied / number of 10 km x 10 km squares ever occupied).
A second challenge with PM is that past continuously distributed populations may become fragmented into multiple smaller populations leading to the counter-intuitive position of (numerically) more populations being present now than in the past, despite there being ‘losses’. A simplistic approach is just to consider whether or not the species still occurs in at least one location, within the original non-fragmented range, and in this case, the population is considered maintained. However, this approach could mask large scale demographic losses. The situation could be accommodated by a moving baseline approach E.g.
- Time point 1 – a widely distributed species has a baseline of a single population
- Time point 2 – the range is fragmented into multiple populations, but presence in the original geographical area persists, means that the original population is still maintained.
- Time point 3 takes the ‘time point 2’ fragments as the start point and assesses the proportion of these that are still extant.
- Time point 4 takes the ‘time point 3 fragments’ as the start point… etc.
The downside of this approach is that there can be multiple sequential fragmentation events not being registered in a cumulative fashion.
A third challenge is dealing with reintroduced / translocated populations. Where these are genuine conservation translocations these represent a genuine demographic net gain, and an increase in genetic resilience (e.g. lower likelihood of future genetic losses), even though genetic diversity has often simply been moved from elsewhere. In this case, treating these translocated populations as a genuine gain for PM makes sense. Conversely, there are also many cases of occasional individuals being translocated not for conservation purposes, and these may be recorded as a new non-natural population/occurrence. In cases where there is little conservation value to the ‘new population’ it should not be included as a ‘gain’ in PM calculations.
Recognising these challenges, as a default for the 2025/6 assessment, our working approach is to not attempt a definition of populations that has any historical context, and thus for this first round of reporting to include the GBF indicators we have not reported on PM as a default (except for cases where there is zero ambiguity). Our pragmatic approach is to use 2000 as a start point to define populations based on extant occurrences (as per Section 4.2) for estimating Ne500, and then use this as the baseline for any future assessments of PM (how many of these populations, as defined now, are maintained into the future).
4.5. Use of the KOBO ToolBox for managing Ne and PM data
The Kobo ToolBox has been used as a data gathering tool for Ne and PM to support organisation and review of data complying with the Code of Practice for Statistics. The Kobo ToolBox has been configured to allow structured upload of data on Ne and PM, with detailed guidance on use provided here.
5. Methodological Details: Species choice
It is important to consider and define the method used to choose species for inclusion in the Genetic Scorecard, based on criteria relevant to biodiversity monitoring within the geographic area of assessment. In selecting species for the 2025 round of Genetic Scorecard analysis in Scotland/UK, we wanted to maintain continuity with the original species list but also expand our approach to include additional taxa. To achieve this, we adopted the species selection approach developed by the Programme Advisory Group to the Scottish Biodiversity Strategy/Natural Environment Bill and informed by the IUCN. This identified the following categories:
- Species that are threatened with extinction.
- Species who are indicators of habitat restoration success.
- Species who are indicators of responses to pressures/drivers of change.
- Species for which Scotland/UK has a globally important representation.
- Species which are common but declining.
We identified one additional category to add to this, namely:
- Species providing ecosystem services (encompassing cultural, provisioning and regulating services).
The above approach overlaps heavily with that used in the original 2020 scorecard – which included:
- Species prioritised for conservation value.
- Species identified as being culturally important.
- Species providing important ecosystem services.
- Game species (wild species of direct commercial value through hunting).
- Species collected for food or medicine (forage species).
In finalising the choice of species within these categories, on pragmatic grounds, we have favoured species that are already included in monitoring programmes, and hence likely to have suitable data available.
6. Example Scorecard
| Scientific name | Genus species |
|---|---|
| Common Name | Common name here |
| IUCN Category | XX (Global) XX (Europe) XX (UK) XX (Scotland) |
| Genetic Health Status | Risk (colour coded) Scottish/UK Mitigation status (colour coded) Scottish/UK |
| Organism photo | UK distribution map showing Scottish border and Number of 10km squares recorded from Scotland/ UK |
| Background | To include:
|
|---|---|
| Current threats | Summary of threats facing the species (e.g. grazing, overharvesting, predation, persecution, climate change etc.). Note that the climate change risk will be of wider policy interest. |
| Contribution of Scottish/UK population to total species diversity | Assessment of the relative contribution of taxon in Scotland/UK to total species diversity (e.g. whether Scotland/UK has internationally important range representation, endemic subspecies, Scottish/UK population differentiation). |
| Diversity loss: population declines | Narrative assessment of likelihood/extent of diversity loss (e.g. small or reduced population sizes, range contraction or fragmentation). Incorporation of direct genetic evidence if available. |
|---|---|
| GBF Indicators - Population definitions | Population typology; Narrative justification. |
| GBF Indicators - Ne500* | Proportion of populations with Ne > 500 (Scotland) (mean/range) Proportion of populations with Ne > 500 (UK) (mean/range) |
| GBF Indicators - PM* | Proportion of populations maintained (Scotland) (mean/range) Proportion of populations maintained (UK) (mean/range) |
| Diversity loss: functional variation | Narrative assessment of likelihood/extent of important functional diversity (e.g. particular threats to specific ecotypes or phenotypic trait classes). Incorporation of direct genetic evidence if available. |
| Diversity loss: divergent lineages | Narrative assessment of likelihood/extent of loss of divergent populations (e.g. known or suspected distinct lineages). This can be based on morphological, geographical or historical data, or if available direct genetic evidence of divergent lineages. In animals, but less commonly in plants, such lineages are often referred to as evolutionary significant units. |
Hybridisation/ introgression | Narrative assessment of likelihood/extent of loss of genetic integrity via inter-specific hybridisation or inappropriate mixing. This can be based on direct genetic data, morphological assessments of hybridity, or proximity and abundance of known threats. |
| Low turnover/ constraints on adaptive opportunities | Narrative assessment of reproduction and recruitment as an indicator of potential for evolvability. If there are limitations to recruitment, the narrative should indicate the proportion of populations that are affected. |
| In situ genetic threat level | In situ Risk (Negligible / Moderate / Serious) Scotland; In situ Risk (Negligible / Moderate / Serious) UK; based on expert opinion. Then in parentheses (narrative statement explaining status). |
|---|---|
| Confidence in in situ threat level | Confidence score (e.g. High, Medium or Low) Scotland; Confidence score (e.g. High, Medium or Low) UK; then in parentheses (justification of confidence in terms of evidence quality and agreement). |
| Ex situ representation | Particularly relevant for plants, given extensive seed-banking in UK. Narrative and/or quantitative summary of representation in viable and accessible ex situ conservation resource (e.g. number of Regions of Provenance represented in ex situ collection, range representation of Regions of Provenance in ex situ collection).
Insert Maps of representativeness of ex situ for plants |
| Current conservation actions | Narrative and ‘check-box’ summary of current approaches/in situ interventions to mitigate threat. Make reference to actions in the Scottish Biodiversity Strategy in the narrative.
|
| Population assessment/ Demographic | Description of assessment/monitoring N pops assessed/monitored (Scotland) N pops assessed/monitored (UK) |
| Population assessment/ Genetic** | Description of assessment/monitoring N pops assessed/monitored (Scotland) N pops assessed/monitored (UK) |
| Overall Genetic Health status | Summary of genetic conservation status, encompassing risk and efficacy of current mitigating actions e.g. Risk (Negligible / Moderate / Serious) Scotland/UK Mitigation ([Not required; Effective], [Partially effective; Underway] [Not effective; Not in place]) Scotland/UK |
| Overall Genetic Health status explanation | Succinct explanation/justification of overall status at Scotland and UK levels |
| Further work | Recommendations for future work to improve understanding of the species from the perspective of the scorecard aims |
|---|---|
| Assessor | Name of person or group who undertook the assessment. |
| Reviewer | Name of person or group who reviewed the assessment. |
7. Bibliography
Aguilar, R., Ashworth, L., Galetto, L. & Aizen, M. A. 2006. Plant reproductive susceptibility to habitat fragmentation: review and synthesis through a meta-analysis. Ecology Letters, 9, 968-980.
Darwin Tree of Life Project Consortium (2022). Sequence locally, think globally: The Darwin Tree of Life Project. Proceedings of the National Academy of Sciences, 119, e2115642118. doi:doi:10.1073/pnas.2115642118
Frankham, R. 1996. Relationship of population size to genetic variation in wildlife. Conservation Biology, 10, 1500-1508.
Frankham, R., Ballou, J.D., Ralls, K., Eldridge, M., Dudash, M.R., Fenster, C.B., Lacy, R.C. & Sunnucks, P. 2017. Genetic management of fragmented animal and plant populations. Oxford, Oxford University Press.
Hvilsom, C., Segelbacher, G., Ekblom, R., Fischer, M.C., Laikre, L., Leus, K., O'Brien, D., Shaw, R. and Sork, V., 2022. Selecting species and populations for monitoring of genetic diversity. IUCN Publication.
Mastretta-Yanes, A., da Silva, J.M., Grueber, C.E., Castillo-Reina, L., Köppä, V., Forester, B.R., et al. 2024. Multinational evaluation of genetic diversity indicators for the Kunming-Montreal Global Biodiversity Framework. Ecology Letters. 27: e14461. doi
O'Brien, D., Laikre, L., Hoban, S., Bruford, M.W., Ekblom, R., Fischer, M.C., Hall, J., Hvilsom, C., Hollingsworth, P.M., et al. 2022. Bringing together approaches to reporting on within species genetic diversity. Journal of Applied Ecology, 59(9), pp.2227-2233.
Todesco, M., Pascual, M.A., Owens, G.L., Ostevik, K.L., Moyers, B.T., Hübner, S., Heredia, S.M., Hahn, M.A., Caseys, C., Bock, D.G. & Rieseberg, L.H. 2016. Hybridization and extinction. Evolutionary Applications, 9, 892-908.
Contributors
- Peter M. Hollingsworth (Royal Botanic Garden Edinburgh) Royal Botanic Garden Edinburgh, 20A Inverleith Row, Edinburgh, EH3 5LR, Scotland UK
- David O’Brien (NatureScot) NatureScot, Great Glen House, Leachkin Road, Inverness, IV3 8NW, Scotland UK
- Nattanon Meeprom (Royal Botanic Garden Edinburgh) Royal Botanic Garden Edinburgh, 20A Inverleith Row, Edinburgh, EH3 5LR, Scotland UK
- Eunice Pinn (NatureScot) NatureScot, Great Glen House, Leachkin Road, Inverness, IV3 8NW, Scotland UK
- Linda Neaves (Murdoch University) Murdoch University, 90 South Street, Murdoch, Western Australia 6150, Australia
- Rebecca Yahr (Royal Botanic Garden Edinburgh) Royal Botanic Garden Edinburgh, 20A Inverleith Row, Edinburgh, EH3 5LR, Scotland UK
- Isa-Rita Russo (University of Cardiff) University of Cardiff, Park Place, Cardiff CF10 3AT, Wales UK
- Alicia Mastretta-Yanes (Royal Botanic Gardens Kew) Royal Botanic Gardens Kew, Richmond, Surrey, TW9 3AB, England UK
- Eleanor Gourevitch (NatureScot) NatureScot, Great Glen House, Leachkin Road, Inverness, IV3 8NW, Scotland UK
- Alex Ball (Royal Zoological Society of Scotland) Royal Zoological Society of Scotland, 134 Corstorphine Road, Edinburgh, EH12 6TS, Scotland UK
- Owen Blake (Millenium Seed Bank, Royal Botanic Gardens, Kew) Millennium Seed Bank, Wakehurst, Ardingly, Haywards Heath, RH17 6TN, England UK
- Colin Bean (NatureScot) NatureScot, Great Glen House, Leachkin Road, Inverness, IV3 8NW, Scotland UK
- Tim Bean (Roslin Institute) Royal (Dick) School of Veterinary Studies and the Roslin Institute, University of Edinburgh, Easter Bush Campus, Midlothian, EH25 9RG, Scotland UK
- Vladimir Blagoderov (National Museums of Scotland) National Museums Scotland, Chambers Street, Edinburgh, EH1 1JF, Scotland UK
- Stephen Cavers (UK Centre for Ecology and Hydrology) Centre for Ecology and Hydrology, Bush Estate, Penicuik, Midlothian, EH26 0QB, Scotland UK
- David Elston (Botanical Society of Britain and Ireland) Botanical Society of Britain and Ireland, Moore Kingston Smith LLP, 4 Beaconsfield Road, St Albans, Hertfordshire, AL1 3RD, England UK
- Richard Ennos (University of Edinburgh) University of Edinburgh, Institute of Evolutionary Biology, Ashworth Laboratories, Kings Buildings, Charlotte Auerbach Road, Edinburgh, EH9 3FL, Scotland UK
- Aline Finger (Royal Botanic Garden Edinburgh) Royal Botanic Garden Edinburgh, 20A Inverleith Row, Edinburgh, EH3 5LR, Scotland UK
- Emily Humble (University of Edinburgh) University of Edinburgh, Institute of Evolutionary Biology, Ashworth Laboratories, Kings Buildings, Charlotte Auerbach Road, Edinburgh, EH9 3FL, Scotland UK
- Catherine Jones (University of Aberdeen) University of Aberdeen, Regent Walk, King’s College, Aberdeen, AB24 3FX, Scotland UK
- Lydia McGill (NatureScot) NatureScot, Great Glen House, Leachkin Road, Inverness, IV3 8NW, Scotland UK
- Leslie Noble (Nord University) Nord University, Universitetsalléen, 11, 8026 Bodø, Norway
- Stuart Piertney (University of Aberdeen) University of Aberdeen, Regent Walk, King’s College, Aberdeen, AB24 3FX, Scotland UK
- Victoria Pritchard (University of Highlands and Islands) University of Highlands and Islands, UHI House, Old Perth Road, Inverness, IV2 3JH, Scotland UK
- Connie Simon-Nutbrown (Royal Botanic Garden Edinburgh) Royal Botanic Garden Edinburgh, 20A Inverleith Row, Edinburgh, EH3 5LR, Scotland UK
- Abigail Sikes (Napier University) Napier University, Bankhead Avenue, Edinburgh, EH11 4DE, Scotland UK
- Emma-Louise Smith (University of Edinburgh)University of Edinburgh, Institute of Evolutionary Biology, Ashworth Laboratories, Kings Buildings, Charlotte Auerbach Road, Edinburgh, EH9 3FL, Scotland UK
- Martin Stervander (National Museums of Scotland) National Museums Scotland, Chambers Street, Edinburgh, EH1 1JF, Scotland UK
- Jenni Stockan (James Hutton Institute) James Hutton Institute, Craigiebuckler, Aberdeen, AB15 8QH, Scotland UK
- Pete Stroh (Botanical Society of Britain and Ireland) Botanical Society of Britain and Ireland, Moore Kingston Smith LLP, 4 Beaconsfield Road, St Albans, Hertfordshire, AL1 3RD, England UK
- Brodie Thomas (NatureScot) NatureScot, Great Glen House, Leachkin Road, Inverness, IV3 8NW, Scotland UK
- Alex Thomson (Scottish Association for Marine Sciences) Scottish Association for Marine Sciences, Dunbeg, Oban, PA37 1QA, Scotland UK
- Anthony Wetherhill (British Trust for Ornithology) British Trust for Ornithology, The Nunnery, Thetford, Norfolk, IP24 2PU, England UK
- Fenella Wood (NatureScot) NatureScot, Great Glen House, Leachkin Road, Inverness, IV3 8NW, Scotland UK
- Jack Bloodworth (RESAS, Scottish Government) RESAS, Scottish Government, Saughton House, Broomhouse Drive, Edinburgh, EH11 3XD, Scotland UK
- Theresa Robinson (Joint Nature Conservancy Council) Joint Nature Conservancy Council, Quay House, 2 East Station Road, Fletton Quays, Peterborough, PE2 8YY, England UK
- Joe Taylor (Joint Nature Conservancy Council) Joint Nature Conservancy Council, Quay House, 2 East Station Road, Fletton Quays, Peterborough, PE2 8YY, England UK
- Rob Ogden (University of Edinburgh) Royal (Dick) School of Veterinary Studies and the Roslin Institute, University of Edinburgh, Easter Bush Campus, Midlothian, EH25 9RG, Scotland UK
Correspondence: [email protected]; [email protected]; [email protected]