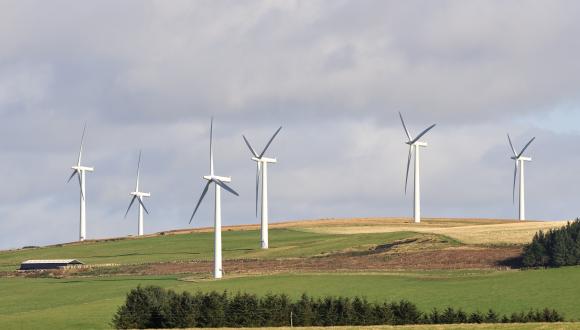
Wind farm impacts on birds - Flight Speeds and Biometrics for Collision Risk Modelling
Published: 2014
Background
Collision risk models require the use of single value biometric data and estimated flight speeds for bird species at risk of colliding with turbines (or power lines). Given the potential for greatly differing values being used in these calculations, SNH has prepared this note to identify published sources for such values.
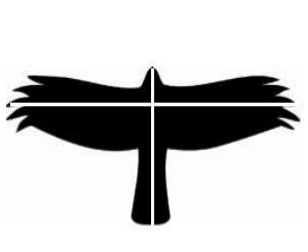
This is shown in this figure, showing a bird of prey in plan view with the measurements for bird length and wingspan identified. The data to be used are by necessity mean values for ‘typical’ individuals. Intraspecific variation (such as differences due to sex or race) cannot be incorporated without over-complicating such models. Biometric data sources are given in the reference section, primarily from published resources such as Birds of the Western Palearctic, (Snow & Perrins, 1998) or in the online resource, BTO BirdFacts.
Flight speed data
The use of a single value for flight speed poses a number of challenges. Clearly bird flight speeds will vary, sometimes considerably, and that variability will be intrinsic (bird size and shape, body condition and behaviour) and extrinsic (altitude, wind velocity, wind direction and light conditions).
Data are not always available for every species of interest. Even where they are, they may be based on measurements taken under very different conditions to those typically found at proposed renewable energy sites or transmission line routes. Birds adjust flight speeds according to the activity being undertaken. For example, foraging activity may lead to slower flight speeds in some species dependent on ambushing prey, whereas for pursuit predators, flight speed may show a rapid increase. Theoretical development of optimal flight speeds have focused on foraging, migration, and display flights (Hedenström & Alerstam, 1995).
In selecting flight speed data for use in collision risk models, we have only referred to published data sources. In addition, a key report we commissioned has also been used (Provan & Whitfield 2006). Flight speed data from this publication have been calculated directly from observations at proposed wind farm sites. The range of species for which data were available, however, was limited and with the expansion of the renewables industry, especially into marine waters, this has necessitated addition of other species. Two key sources of data are regularly used: Bruderer & Bolt (2001) and Alerstam et al. (2007). The latter publication incorporates some data from Bruderer & Bolt (op. cit.), but also provides new data for some species covered by Bruderer & Bolt (op. cit.). It is also important to note that collision risk will vary according to whether a bird is considered to use predominantly flapping or gliding flight as this can make a significant difference to collision risk calculations. The SNH Collision Risk Model (Band et al., 2007) calculates collision risk probabilities taking this into account. An example for a particular species for a specific turbine design is given in Figure 1. Where a bird uses both types of flight, collision risk modelling can use an estimate of collision probability calculated as a weighted average of the two flight behaviours.
Where data for any particular species are not available, we recommend the use of surrogate species. Alerstam et al. (2007) have shown that species that are similar both taxonomically and morphologically, have similar flight speeds, largely due to similar wing loadings. For example, a flight speed for golden plover (Pluvialis apricaria) is not given but the similar sized and closely related species grey plover (Pluvialis squatarola) may be suitable. Data for corncrake (Crex crex) cannot not be found in the literature, but the closely related spotted crake (Porzana porzana) gives a figure of 13.9 ms-1 which is very close to an estimate for corncrake suggested by Rhys Green of 13.8 ms-1 (Rhys Green pers. comm.).
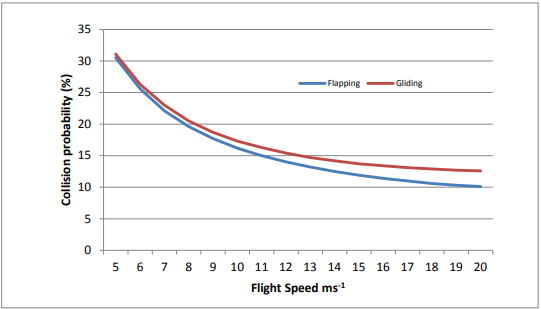
The absolute value of collision probability is not important (it is for a ‘theoretical bird’) shown in flapping and gliding flight separately. Collision probability is particularly sensitive to changes in flight speed when values are low; at higher flight speeds changes in collision risk are less marked. Values for gliding and flapping flight diverge as flight speed increases: this is simply a consequence of the model and may not have any underlying physical or biological basis given the many approximations inherent in the model.
The estimated mean flight speed is recommended as the single datum for collision risk modelling. However, variation in flight speeds can be used to estimate possible lower and upper values (many are quoted in Alerstam et al., 2007). In the tables, for some species only, a range is identified and data on standard deviation are not available. Where standard deviations are provided, a very rough approximation of the likely range can be calculated as plus or minus twice the standard deviation, which assumes that flight speeds are distributed normally. While this is unlikely, the approximation is suitable for estimating upper and lower bounds for collision probabilities. A slower (or faster) flight speed may be used where there is good empirical evidence from vantage point watches that a particular type of flight behaviour (e.g. foraging flight) predominates over other flight behaviours.
Environmental statements should routinely reference the source of biometric and flight speed data used in collision risk modelling calculations.
References
Alerstam T., Rosén M., Bäckman J., Ericson P.G.P., Hellgren O. 2007. Flight speeds among bird species: allometric and phylogenetic effects. PLoS Biol, 5, 1656-1662. DOI:10.1371/journal.pbio.0050197
Band, W., Madders, M., & Whitfield, D.P. 2007. Developing field and analytical methods to assess avian collision risk at wind farms. In: de Lucas, M., Janss, G.F.E. & Ferrer, M. (eds.) Birds and Wind Farms: Risk Assessment and Mitigation, pp. 259- 275. Quercus, Madrid.
BTO Bird Facts [web based information - http://www.bto.org/about-birds/birdfacts - downloaded 13/01/2014]
Bruderer, B. & Bolt, A. 2001. Flight characteristics of birds: I. Radar measurements of speeds. Ibis, 143, 178-204.
Hedenström, A. & Alerstam, T. 1995. Optimal flight speeds of birds. Phil. Trans. R. Soc. London B, 348, 471-487.
Provan, S. & Whitfield, D.P. 2006. Avian Flight Speeds and Biometrics for Use in Collision Risk Modelling. Unpublished Report to Scottish Natural Heritage.
Snow, D. & Perrins, C. M. 1998. The Birds of the Western Palearctic. Concise Edition. Oxford University Press, Oxford.
Contact Dr. Andy Douse
Policy & Advice Manager, Ornithology
Great Glen House
INVERNESS
IV3 8NW
Telephone: 01463 725241
Email: [email protected]
Date 28th October 2014
