Population modelling of five UK-breeding gull species to inform NatureScot licensing assessments
Authors: Langlois Lopez, S., Bennett, S., Boersch-Supan, P., Humphreys, E.M., and O’Hanlon, N. (British Trust for Ornithology)
Contents
Introduction
Gulls are found in many habitats, from uninhabited islands and intertidal areas to agricultural land and urban environments (Coulson, 2019). In the UK, most gull populations increased during the early 20th century, attributed to a decline in illegal persecution, their protection, and an increase in the availability of anthropogenic food via agriculture, refuse, and fishing activities (Cramp, Bourne and Sanders, 1974; Lloyd, Tasker and Partridge, 1991). By the end of the 20th century, there had been considerable expansion by several gull species into urban areas (Rock and Vaughan, 2013; Coulson, 2019). However, UK-wide declines have been recorded in natural-nesting populations of most gull species during the 21st century, leading to the classification of five of the most common breeding species to either the Amber (lesser black-backed gull Larus fuscus, and black-headed gull Chroicocephalus ridibundus) or Red list (great black-backed gull Larus marinus, herring gulls Larus argentatus, and common gull Larus canus) in the UK Birds of Conservation Concern Assessment (Burnell et al., 2023; Stanbury et al., 2024). The Seabird Monitoring Programme (SMP) defines populations nesting outside of urban areas as natural nesters and these have seen some of the greatest declines within the UK, ranging from 44% - 75% between 1998-2000 and 2015-2021 (Burnell et al., 2023 and Table A1). It is important to clarify that the term natural nester describes the type of breeding habitat used rather than a reflection of the behaviour of the bird, since gulls have moved into conurbations on their own accord. Meanwhile, the urban-nesting population is now estimated to be proportionally larger than the natural-nesting population for herring gulls and lesser black-backed gulls in the UK and Scotland (Burnell et al., 2023).
The expansion of gull populations into urban areas, and their interactions with people, has led to concerns arising from residential/industrial areas, landfill sites, and airports with the overall result of gulls being perceived as “nuisance species” (Belant, 1997; Young et al., 2016). Similarly, conflicts have arisen around agriculture and fishing activities (Belant, 1997). Consequently, gulls have been actively managed by statutory nature conservation agencies such as NatureScot to alleviate conflicts with human activities, where gulls are perceived to pose a risk to human health, food production, and air safety (Coulson, 2019). Additionally, gull populations may be managed where they predate or outcompete other protected seabird species within Special Protected Areas (Scopel and Diamond, 2017; Langlois Lopez et al., 2023).
In Scotland, until 2019, the legal control of some gulls species (herring, lesser black-backed and great black-backed gulls) fell under general licences issued by NatureScot, that allowed the unrestricted destruction by authorised personnel of gull nests, eggs, chicks and adults without the requirement to report on the numbers subjected to licenced control measures(NatureScot, 2020a, 2020b). In April 2020, gulls were removed from the general licences in Scotland due to concerns around observed declines in their breeding populations. These declines had already warranted the inclusion of the five gull species on the Amber and Red list in the Birds of Conservation Concern Assessment in previous years (Stanbury et al., 2024). but licensing arrangements were not changed immediately in response to changes in their status. Consequently, individual licences must now be obtained to remove gulls of any age, and their nests/eggs. There are several licence types that can be applied for:
- Preserving public health or safety;
- Air safety (under legislation this licence type also falls under preserving public health or safety, we include this licence type separately as it has differing limitations on the numbers of birds that may be controlled);
- Preventing serious damage to livestock, foodstuffs for livestock, crops, vegetables, fruit and growing timber;
- Conservation licences – killing gulls to protect other species (protection of wild birds);
- For the purposes of human consumption (eggs/humans).
Licences are issued with specific quotas and the requirement to provide licence returns, detailing the numbers of gulls or nests destroyed, to obtain a licence renewal. Work by Natural England, based on licensing totals for large gulls, provided an early indication that at projected levels of licenced action in England, population growth rates of herring gulls and lesser black-backed gulls would be significantly depressed, exacerbating population declines (pers. comm. Natural England). Following an internal review by NatureScot in 2023 on gull licensing data and applications, alongside the updated gull population data from Seabirds Count, revised guidance was issued (NatureScot, 2024). This guidance reiterated an emphasis on non-lethal control as a first step before lethal action is considered and clarified what constitutes a public health or safety risk, rather than a ‘nuisance’. This led to fewer licences being issued by NatureScot in 2024. However, there has not yet been any assessment of how the numbers licenced may impact the population growth and abundance of these species and whether it directly contributes to the declines observed in these breeding gulls in Scotland.
To understand the impacts of NatureScot’s licensing regime on the trends of gull populations in Scotland, we can model the future predicted abundance of populations using Population Viability Analysis (PVA) (Akçakaya and Per Sjögren-Gulve, 2000). In PVAs the basic demographic parameters of a species, such as survival and productivity, are used in addition to given initial population sizes to simulate the growth rate of a population assuming that these input parameters remain fairly consistent (Akçakaya and Per Sjögren-Gulve, 2000). Importantly, using PVAs, different age classes of a species can be specified separately as e.g., survival in adults of long-lived species such as gulls is generally higher than for first-year immatures. As such, the loss of adults can have a larger impact on population growth than the loss, or decline in survival, of immatures (Sæther and Bakke, 2000). Further, using PVAs we can model how defined impacts, such as a particular level of licenced control, may affect population trajectories and abundance while accounting for variation in the licenced control level between age classes (Langlois Lopez et al., 2023). Such work is vital to understand how we can balance the need to protect and preserve breeding populations of gulls in Scotland whilst safeguarding public interests and health and safety through licenced control. It is also important to consider that gull populations of all species are subject to increased extrinsic pressures other than licenced control, e.g., food shortages, poor weather conditions and disease (Dias et al., 2019; Burnell et al., 2023). In recent years, increased mortality from Highly Pathogenic Avian Influenza (HPAI) in particular has had severe negative impacts on many gull populations (Tremlett et al., 2025), potentially compounded by other pressures the gull populations face such as climate change and lack of food. Furthermore, large gulls have been identified as being vulnerable to both onshore and offshore wind farm developments (Furness, Wade and Masden, 2013) and are being considered for compensation measures associated with offshore renewable developments in the UK (i.e. Scotwind). Consequently, while modelling how gull populations are impacted by licenced control, it is important to note that baseline models already reflect some of the different anthropogenic stressors and sources of mortality these populations are subjected to.
While reasonable data on the demographic parameters, particularly productivity, required for a PVA exist for natural-nesting gull species in Scotland (Tyler et al., unpub.), there is greater uncertainty in the estimated population sizes and trends for these species, notably for those with large urban breeding populations. This is primarily because monitoring coverage of urban populations has been less comprehensive in both space and time prior to Seabirds Count, and thus obtaining nationally-representative trends for this component of the population is not possible using past seabird censuses. National urban population estimates in Seabirds Count are based on sample plots which have then been extrapolated (Burnell et al., 2023; Burnell, 2021; Woodward et al., 2020), although methodological details and sample-level count data remain unpublished. Improving the coverage of urban breeding populations would increase our confidence that the baseline PVA projections parameterised with available data fully reflect the current population dynamics of gulls in Scotland. Given these data constraints, the objective of this work is to quantify the magnitude of modelled gull population responses to licenced control and other sources of mortality.
In this study, we investigate how the population growth of the Scottish breeding populations of herring gulls, lesser black-backed gulls, great black-backed gulls, common gulls, and black-headed gulls may be affected by a set of scenarios that consider past and current levels of licenced control, as well as a HPAI-driven mass mortality event over a 25 year period (the typical life span of an offshore windfarm).
Methods
Throughout the following sections we refer to gull populations as either ‘urban’ or ‘natural-nesting’ in line with the terminology used by the SMP and the national censuses (Burnell et al., 2023; Harris et al., 2024). This distinction in the habitat used by breeding birds is between those nesting ‘on elevated urban fabric’ (Burnell, 2021), and those outside of that area. All nests in both habitats are considered natural in the true sense, but we retain use of the term ‘natural-nesting’ here for consistency with the SMP.
Analytical considerations
To model the populations of the five gull species, in agreement with NatureScot, we used the existing Natural England Population Viability Analysis (NEPVA) tool (https://github.com/naturalengland/Seabird_PVA_Tool/tree/master). This tool is the current standard PVA tool used in casework, such as offshore wind development, and is easily accessible online. In using an already developed tool, we needed to tailor its functionality to our needs. A summary of these requirements and the approach taken is described below:
The NEPVA tool makes some assumptions about populations. Firstly, it assumes that the population being modelled is closed (i.e., there is no exchange of breeding gulls between Scotland and other countries), which is unlikely to be true in reality. However, assuming a closed population is standard in this context, largely because quantifying the extent of movements between populations is difficult and was outside the remit of this work. For the purpose of this project, it was assumed there was zero net migration. Secondly, we were unable to use the function “demobase.bskippc”, used to include skipped breeding in PVAs. We therefore incorporated skipped breeding by multiplying baseline productivity by (1 - skipped breeding rate). The option to add a “burn-in” period to allow the population structure to stabilise prior to running the desired PVA also did not work as expected, often producing errors and stopping PVAs after only one or two years. After consultation with the NEPVA tool developer, we did not specify a burn-in period, but rather scheduled the impacts to start after four years, i.e. once the gulls hatched in year one of the model were recruited into the breeding population, accounting for survival up to age of first breeding, whilst maintaining the desired impacted period of 25 years. Lastly, the NEPVA tool does not allow two or more impacts of different magnitude and duration on the same population (e.g., licenced control for 25 years, but HPAI for only 2 years). We therefore “translated” licenced control mortality into a reduction in adult survival adult survival alone, to be compatible with the PVA tool used, and modelled the impacts of a stochastic HPAI event on these populations where the underlying demographic rates already accounted for licenced control pressures (see section “Impact scenarios”).
Crucial to the modelling process, PVAs must be populated with relevant and accurate demographic parameters that are thought to best represent the population of interest. Due to the need to model the gull populations of Scotland as a whole, we would ideally have used demographic rates specific to Scotland, however these data are limited (Tyler et al., unpub) who undertook a comprehensive review of all published and unpublished demographic data for UK seabirds to be used in PVAs of Environmental Impact Assessments). Therefore, average values of demographic parameters from Scotland, the UK, or elsewhere were selected (based on availability and goodness of fit to population count data; see section “Sourcing and validation of demographic parameters”). This approach cannot account for spatial variability in demographic parameters within Scotland, or any metapopulation mechanisms that influence the growth of gull populations at regional or local scales. For example, some populations may be sources of birds, i.e. populations where there is more emigration than immigration, and others sinks, i.e. populations where there is higher immigration than emigration, due to differences in productivity and dispersal. Additionally, knowledge about any density-dependence mechanisms in Scotland, where for example survival or breeding success decreases with increasing population size, is not available. Therefore, we assumed density independence. Overall, it is important to acknowledge that PVAs that aim to represent a single national population, which in reality is made up of several smaller populations with different population dynamics, greatly simplify the ecological mechanisms that operate in what is likely a complex gull metapopulation.
Due to variability in the availability of demographic parameters between species and populations, sense checking PVA outputs against empirical population counts is important to identify baseline populations that are as representative as possible of real populations. We obtained breeding population estimates for all species in Scotland from previous seabird censuses to carry out these validations (see “Analytical approach”). However, there were limitations regarding the use of lesser black-backed gull and herring gull population counts, as it is estimated that large proportions (~78% and ~63% in Scotland, respectively; Burnell et al., 2023) of their populations breed in urban areas where they have not been systematically counted in censuses prior to Seabirds Count (Burnell et al., 2023) and which are generally also not systematically monitored in between censuses by the Seabird Monitoring Programme (Harris et al., 2024). However, due to the large proportion of urban nesters in these species and the fact that licenced control mostly takes place in urban environments, we considered it necessary to combine natural nesting and urban nesting population counts of these species in our modelling, rather than only using natural nesters. Similarly, demographic rate estimates are predominantly collected from natural nesting populations.
Based on the limitations described above, it is imperative to understand that the research carried out here represents modelled populations of the five gull species that are as close a representation of the actual gull populations in Scotland as the limited available demographic data allows. The interpretation of the outputs from this work must therefore be used to understand the potential magnitude of the impacts that current and past levels of licenced control and management have on gull populations, rather than taking any estimated population size in a particular modelling scenario at face value in absolute terms.
Analytical approach
We built stochastic PVAs that incorporated temporal variance in demographic parameters to offer more biologically realistic models. Detailed information about how the NEPVA implements environmental stochasticity from variance in survival and breeding success is provided in the tool manual
We firstly constructed baseline models (see section “Sourcing and Validation of demographic parameters”) that intended to represent the dynamics of gull populations in Scotland. We then applied the following impact scenarios to these baseline populations.
- licenced control levels licensed by NatureScot in every year from 2020-2023;
- licenced control levels licensed by NatureScot in 2024, i.e. when there was an effort to reduce the number of lethal licences issued;
- an additional range of standardised licenced control scenarios that may be representative of future licensing and anthropogenic impacts, ranging from the annual maximum mortality permitted by NatureScot obtained from the 2020-2024 licensing data, and zero mortality;
- annual minimum and maximum licenced control levels licensed by NatureScot between 2020-2024, and a mass mortality event equivalent to that observed in wild gull populations from HPAI in the UK.
We ran these scenarios for 25 years and 5000 iterations, and present model outputs as changes in (geometric) mean population growth rate, relative changes in median population size, ratios between the final size of impacted populations and baseline populations, the probability of populations declining by 50% after 25 years, and the number of years it takes populations to reach extinction.
All statistical analyses were undertaken in R version 4.3.1 (R Core Team, 2021). Demographic parameters and model estimates are given + standard deviation (SD) unless stated otherwise.
Sourcing and validation of demographic parameters
We validated different combinations of demographic parameters against empirical population counts from previous seabird censuses to ensure that arising modelled populations sizes and trends reflected those observed in empirical data as best as possible. Four seabird censuses were available for PVA validations, undertaken in 1969-1970 (Operation Seafarer; Cramp, Bourne and Sanders, 1974), 1985-1988 (Seabird Colony Register; Lloyd, Tasker and Partridge, 1991), 1998-2002 (Seabird 2000; Mitchell et al., 2004), and 2015-2021 (Seabirds Count; Burnell et al., 2023). For great black-backed gulls, common gulls, and black-headed gulls, we used the two most recent censuses as they presented the most recent data and had the highest coverage and agreement in terms of sites and methodology (Burnell et al., 2023; Annex 1). However, for herring gulls and lesser black-backed gulls, we used Operation Seafarer as the starting point of validation PVAs because it is considered to provide the best comparison against Seabirds Count when combining natural and urban nesters since there were few urban nesting gulls in the 1970s. The parameters detailed in Table 1 are those that produced the best fitting models (i.e. empirical counts falling within the 95% confidence intervals of PVA projections whilst using appropriate sources of demographic parameters; Annex 2) and were therefore carried forwards for further modelling of impact scenarios. A selection of alternative parameters that were also considered, but not retained, during validation are presented in Annex 3 alongside final validation graphs.
As demographic rates may vary regionally, where possible we used Scotland-specific rates, however these data were not always available or did not produce appropriate outputs when validated, in which case we used UK values or published values from other populations (Table 1).
| Species | Initial population size (breeding pairs) | Maximum brood size | Age at first breeding | Productivity | Juvenile survival | Immature survival | Adult survival | Skipped breeding | Additional information |
|---|---|---|---|---|---|---|---|---|---|
| Herring gull | 100161 | 3 | 5 | 0.831 (0.399) | 0.777 (0.092) | 0.878 (0.034)¹ | 0.878 (0.034) | 0.350 | Annex 3 Table 1 |
| Lesser black-backed gull | 49662 | 3 | 5 | 0.594 (0.364) | 0.820 (0.022)¹ | 0.913 (0.022)¹ | 0.913 (0.022) | 0.337 | Annex 3 Table 2 |
| Great black-backed gull | 5404 | 3 | 5 | 1.026 (0.506) | 0.729 (0.025) | 0.810 (0.080)¹ | 0.810 (0.080) | 0.3503 | Annex 3 Table 3 |
| Common gull | 22755 | 3 | 3 | 0.585 (0.407) | 0.410 (0.010)² | 0.710 (0.010)² | 0.896 (0.010) | 0 | Annex 3 Table 4 |
| Black-headed gull | 10785 | 3 | 2 | 0.457 (0.412) | 0.610 (0.207)4 | 0.824 (0.207)¹ | 0.824 (0.207) | 0 | Annex 3 Table 5 |
Initial population size
Initial population sizes, defined as the number of breeding pairs, were obtained for all species from Burnell et al., (2023) (Table 1). We also included two additional population sizes based on 75% and 125% of the Burnell et al., (2023) estimates to account for potential uncertainty in the census, particularly around the urban population estimates of herring gulls and lesser black-backed gulls. We selected such a range of initial population sizes because the confidence intervals presented in Seabirds Count Burnell et al., (2023) were much narrower than for previous estimates (Burnell, 2021), and methodological details used in the census are unpublished. Thus, a wider range of initial populations provided a more precautionary approach given known difficulties in estimating the urban component of gull populations.
Adult survival
Adult survival rates and associated standard deviations for herring and lesser black-backed gulls were taken from Tyler et al., (unpub.) (only one study site was available for Scotland; Forth Islands), as were those for black-headed gulls, for which we used the UK mean. Survival of adult common gulls was obtained from a long-term study by Rattiste and Lilleleht (1995) in Estonia as the UK estimate from Tyler et al., (unpub.) exaggerated population declines compared to empirical counts. Adult survival rates for great black-backed gulls were taken from Layton-Mathews et al., 2024 (Table 1). The Tyler et al., (unpub.) UK survival rate was not used for this species as it was derived only from only one site and was unusually high, producing highly unrealistic population projections when contrasted against census data.
Juvenile and immature survival
Juvenile and immature survival estimates and associated standard deviations for herring gulls were obtained from Tyler et al., (unpub.) (only one study site was available for Scotland; Forth Islands). The UK mean was used for juvenile survival for lesser black-backed gulls, obtained from Tyler et al., (unpub), whereas immature survival was not available so was assumed to be the same as in adults. Juvenile survival of great black-backed gulls was obtained from Tyler et al., (unpub.), however immature survival was assumed to be the same as adult survival as the figure presented in Tyler et al., (unpub.) was very high and produced poor validation outputs. The UK mean was used for juvenile and immature survival for common gulls, obtained from Tyler et al., (unpub.). Black-headed gull juvenile survival was not available from Tyler et al., (unpub.). As juvenile survival is expected to be lower than adult survival, we used the ratio between juvenile and adult survival provided in Coulson, (2019) to obtain juvenile survival based on the adult survival estimate in Tyler et al., (unpub.) (Table 1).
Where there was no standard deviation available for juvenile or immature survival estimates, these were assumed to be the same as standard deviations of adult survival estimates (Table 1) This may underestimate the stochasticity of pre-adult survival rates, which are generally thought to be more variable than those of adults (Harris, Frederiksen, and Wanless, 2007; Monticelli et al., 2008).
Productivity
All productivity rates for all species were extracted from Tyler et al., (unpub.). Productivity in PVAs was defined as the number of chicks fledged per breeding pair. The UK mean productivity was used for herring gulls and lesser black-backed gulls as it produced the most realistic validation outputs, whereas the Scotland mean was used for great black-backed gulls, common gulls and black-headed gulls (Table 1).
Maximum brood size
For maximum brood size, or the highest possible number of chicks present at each nest, we sourced values from Tyler et al., (unpub.) for herring gulls, lesser black-backed gulls, and great black-backed gulls, and from BTO BirdFacts for common gulls and black-headed gulls. For all species the maximum brood size was three (Table 1).
Age at first breeding
For all five species the age at first breeding was obtained from Tyler et al., (unpub.), which ranged from two to five years (Table 1).
Rate of skipped breeding
We found no evidence of skipped breeding for common gulls or black-headed gulls, or similar-sized gull species in the limited literature available for these species, and so we considered this to be zero in all models for these species. For herring gulls and lesser black-backed gulls, skipped breeding rates were obtained from Tyler et al., (unpub.). As no estimate was available for great black-backed gulls, it was assumed to be the same as in herring gulls, which have a similar life history (Table 1).
Gull licensing data
A summary of the licensing data was provided by NatureScot which included the number of licences issued, the number of gull nests, eggs, chicks, and adults permitted to be destroyed, and the returns of those licences per species. These data were from 2020 to 2024 for the whole of Scotland, see these summarised data in Annex 4. We subset these data to only those licences that granted lethal control measures to be used for adults, chicks and eggs. Similar to the approach used by Natural England, we did not include licences for the destruction of nests without eggs or chicks only as it was assumed that breeding pairs that had their nest destroyed renested subsequently and were able to attempt to breed again. Not all licences during this period provided ‘returns’, or the number of gulls or eggs actually controlled under licence, a requirement for being granted a licence, as they were not submitted by the licence holders. Therefore, we make the assumption that all licences controlled the maximum number of gulls permitted to model the worst-case scenario. We also assume that correct identification of gull species has occurred, which may not always be the case. Although cases of misidentification may be low, no quantification of this has yet occurred.
Licences to control gull numbers at airports are not limited, i.e. as many gulls as are deemed necessary by the licence holder may be controlled under licence year-round. Consequently, we could not include the licences issued to airports as part of the data for licences ‘permitted’ as this would become infinite. We instead included separate impact scenarios for the combined impact of licenced control at airports using the returns from these sites, along with the number permitted from all other licence types, which we detail in section “Impact scenarios”.
Conversion factors
In the modelling approach that we used to estimate the impact of licenced control and egg removal on gull populations, only the number of adult birds controlled under licence may be directly modelled. However, to understand the overall impact of licenced control we must include a measure of all age-classes controlled/destroyed under licence, i.e., including chicks and eggs. We can indirectly include those non-adult age classes by approximating how many adults they equate to. For chicks, this can be done by estimating how many chicks survive to adulthood. Common to all gull species, survival of individuals in their first year is typically lower than in subsequent years. To estimate how many chicks survive their first year we can then multiply the number of chicks that fledge by the first-year survival rate. The number of years it takes for a fledged chick to become an adult varies between gull species: five years for the large gulls (herring gulls, lesser black-backed gulls, and great black-backed gulls), three years for the common gulls, and two for black-headed gulls. To estimate how many chicks survive to adulthood we can multiply the number that survive their first year by the survival rate of non-first year birds for each subsequent year that it takes to reach adulthood, as previously done by Natural England (pers. comm. Ivan Lakin). We lack sufficient data on the survival rate of gulls between their first years and reaching adulthood. As a result, here we consider the survival rate of gulls older than one to be the same as adults, though in reality this is likely an overestimate. For example, for Black-headed gulls we would estimate what proportion of chicks reach adulthood as: first year survival * adult survival * adult survival. Overall, we produced a conversion factor to estimate how many adults each chick controlled under licence equates to for each species using the following equation:
Chick conversion factor = 1st year survival * adult survivalNumber of years to reach adulthood-1
We then produced a conversion factor for the number of eggs destroyed. Here, we assumed that each egg had an equal contribution to the average productivity of each nest. Accordingly, we considered that the impact on a population through the loss of an egg was equivalent to the following equation:
Egg conversion factor = productivity/(maximum brood size) * chick conversion factor
Accordingly, using both of the above equations we were able to convert the number of chicks and eggs controlled or destroyed under licence into an equivalent number of adults, see Annex 5 for the conversion factors used for each species. Our approach differed slightly to that of Natural England’s approach; in this study we accounted for the likelihood of an egg becoming a chick when calculating the egg conversion factor. In comparison, Natural England calculated a third (based on a mean of three eggs per clutch) of the chick values based on overall nest productivity (pers. comm. Ivan Lakin).
Impact scenarios
Following the validation of demographic parameters, these were used to project baseline populations over a 25-year period upon which the different impacts of interest could be applied (Table 2).
| Scenario name | Description |
|---|---|
| Baseline | No licenced control impacts applied |
| 2020 levels | Licenced control levels permitted in 2020 applied to baseline population (with and without air licences) |
| 2021 levels | Licenced control levels permitted in 2021 applied to baseline population (with and without air licences) |
| 2022 levels | Licenced control levels permitted in 2022 applied to baseline population (with and without air licences) |
| 2023 levels | Licenced control levels permitted in 2023 applied to baseline population (with and without air licences) |
| 2024 levels | Licenced control levels permitted in 2024 applied to baseline population (with and without air licences) |
| 90% - 10% | A range of licenced control levels applied to the baseline population based on the maximum annual permitted licenced control identified between 2020-2024, reduced in 10% steps (with and without air licences) |
| Baseline + HPAI | HPAI mortality (30% over two years) applied to baseline population |
| Minimum + HPAI | HPAI mortality (30% over two years) applied to a population that accounts for the minimum licenced control levels permitted by NatureScot (i.e. 2024) (with air licences) |
| Maximum + HPAI | HPAI mortality (30% over two years) applied to a population that accounts for the maximum annual licenced control levels permitted by NatureScot between 2020-2023 (with air licences) |
NatureScot permitted numbers 2020-2024
We modelled the impacts of the different levels of permitted licenced control for each year between 2020 and 2024 in separate PVAs to be able to compare between years (Table 2). Licensed control was introduced as a constant number (total birds permitted in a particular year) of adult birds removed from the population every year of the 25-year PVA run. For example, if 8612 adult herring gulls were permitted to be controlled under licence in 2020, that number was removed from the modelled population in every year of the 25-year PVA run. We ran these scenarios with and without including the returns from airport licences.
Additional scenarios
Since the permitted number of gulls to be controlled under licence varies from year to year, we also modelled a range of additional scenarios to capture different levels of licensing. We identified the maximum permitted number of gulls that could be controlled under licence in any year between 2020-2024 and set such mortality as the upper limit. We then reduced this maximum mortality in 10% decrements until reaching the baseline (i.e., zero gulls controlled under licence per year), therefore providing an additional ten scenarios that could be representative of future years or that may be useful when considering the cumulative impacts of the actual number of gulls controlled under licence plus additional mortality from other anthropogenic pressures (Table 2) (e.g. onshore or offshore wind, fisheries bycatch etc.). We also ran these scenarios with and without the returns from airport licences.
Stochastic events: HPAI outbreak
We modelled the impacts of a two-year HPAI outbreak with an overall mortality of 30% (15% in each year) in all species. Such a mortality figure was selected based on Tremlett et al., (2025), as it is within the range of HPAI mortality observed in the UK gull species (from c.20% to 40% in 2022-2023). The same level of mortality was applied to all species to allow for species comparisons. The HPAI impact was applied in years 10 and 11 (of 25) of the PVAs as this provided several years post-impact to understand and quantify changes in population parameters.
As discussed in “Analytical considerations”, due to the inability to apply two separate impacts on a population in the NEPVA tool, we first translated the permitted number of birds that could be killed into reductions in survival. To do this, we built deterministic PVAs where we reduced adult survival in small steps until the final population size matched that of a PVA where the licenced control scenario of interest was applied. For example, to achieve a reduction in adult survival that represented the maximum permitted mortality for herring gulls, we first built a deterministic PVA where 8612 adult herring gulls were removed every year (i.e. the 2020 level of licenced control, which was the highest of any year between 2020-2024) using baseline demographic parameters. Secondly, we built a separate deterministic PVA where licenced control impacts were not applied, and we reduced adult survival in small steps until the final population size matched that of the impacted PVA. This produced an adult survival estimate that represented the maximum permitted licenced control for herring gulls and was used to build stochastic PVAs where the impacts of HPAI could be quantified.
The deterministic PVAs were run for eight years (as opposed to 25) as the populations of some species (e.g. great black-backed gull) sometimes reached extinction after this time, thus making comparisons between the two deterministic PVAs impossible beyond that stage.
Following this, we could apply the HPAI impacts in PVAs where the underlying demographic parameters represented no licenced control, minimum licenced control, or maximum licenced control (Table 2).
Results
For all species, the (geometric) mean population growth rate, relative changes in median population size, ratios between the final size of impacted populations and baseline populations, the probability of populations declining by 50% after 25 years, and the number of years it takes populations to reach extinction are presented. It is important to note that small variations in population growth rate can result in large changes in population size. For example, a reduction from 1 to 0.9, would indicate a change from stability to a strong population decline. In all figures and tables, the number of adults refers to the combination of adults and adult-equivalents derived from licenced control of eggs and chicks.
Herring gull
The baseline modelled population of herring gulls (without any licenced control) was predicted to be relatively stable over the 25-year period, with its mean population growth rate hovering at around one (Figure 1). Whilst observed trends in the combined urban and natural-nesting herring gull populations showed a decline of 37% during the validation period, the available demographic parameters produced a relatively stable population in the model, with other combinations of demographic parameters producing worse-fitting baseline populations (Annex 2, Figures A2 and A3).
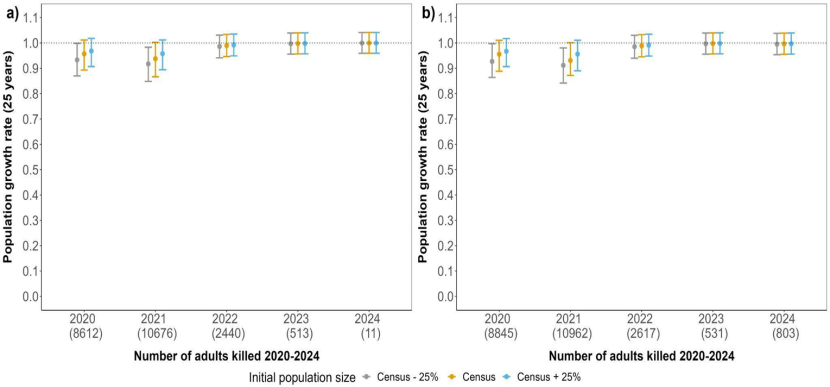
Figure 1. Modelled growth rates (geometric mean) of a herring gull population in response to permitted cull levels 2020:2024 inclusive a) excluding, and b) including those licence returns issued for air safety. Models were run with an initial population s
Click for a full description
View a larger version of this image.
Modelled growth rates (geometric mean) of a herring gull population in response to permitted cull levels 2020:2024 inclusive a) excluding, and b) including those licence returns issued for air safety. Models were run with an initial population size of that estimated in 2021 + 25% to account for uncertainty. The dashed line indicates a stable population where the growth rate = 1.
The licenced control levels permitted in 2023 and 2024 yielded a more stable population, similar to the baseline. A similar pattern was observed whether or not airport licenced control licences were included as mortality numbers did not change greatly.
When subjected to the licenced control pressure permitted in 2020 and 2021, mean growth rate dipped <1 (i.e. population decline). The licenced control levels permitted in 2023 and 2024 yielded a more stable population, similar to the baseline (Figures 1). A similar pattern was observed whether or not airport licenced control licences were included as mortality numbers did not change greatly (Figure 1). A wider range of predicted population growth rates in relation to reductions in licenced control numbers are presented in Figure 2.
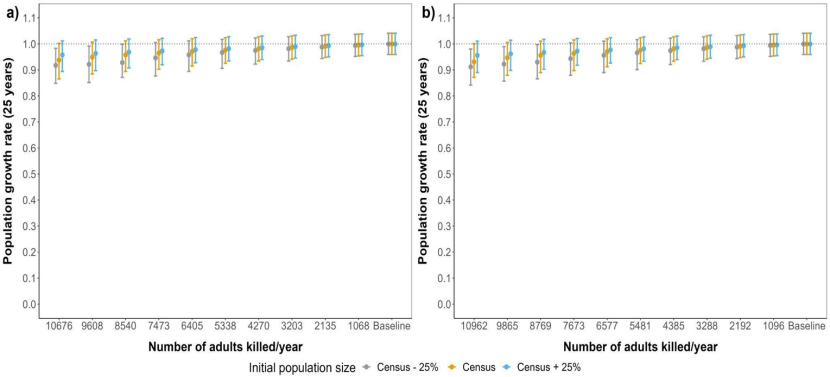
Figure 2. Modelled growth rates (geometric mean) of a herring gull population in response to cull rates from the maximum recorded number of licences permitted to 10% of this maximum cull rate in 10% decrements a) excluding, and b) including those licence
Click for a full description
View a larger version of this image.
Models were run with an initial population size of that estimated in 2021 + 25% to account for uncertainty in this estimate. The dashed line indicates a stable population where the growth rate = 1.
Importantly, it was predicted that the probability of the modelled herring gull population experiencing a 50% decline or more over the 25-year period surpassed 50% when approximately 5400 herring gulls were controlled under licence per year, and this probability reached almost 90% - 100% when licenced control levels were as high as those permitted in 2020, where extinction was also almost reached.
Importantly, it was predicted that the probability of the modelled herring gull population experiencing a 50% decline or more over the 25-year period surpassed 50% when approximately 5400 herring gulls were controlled under licence per year, and this probability reached almost 90 - 100% when licenced control levels were as high as those permitted in 2020, where extinction was also almost reached (Tables 3 and 4).
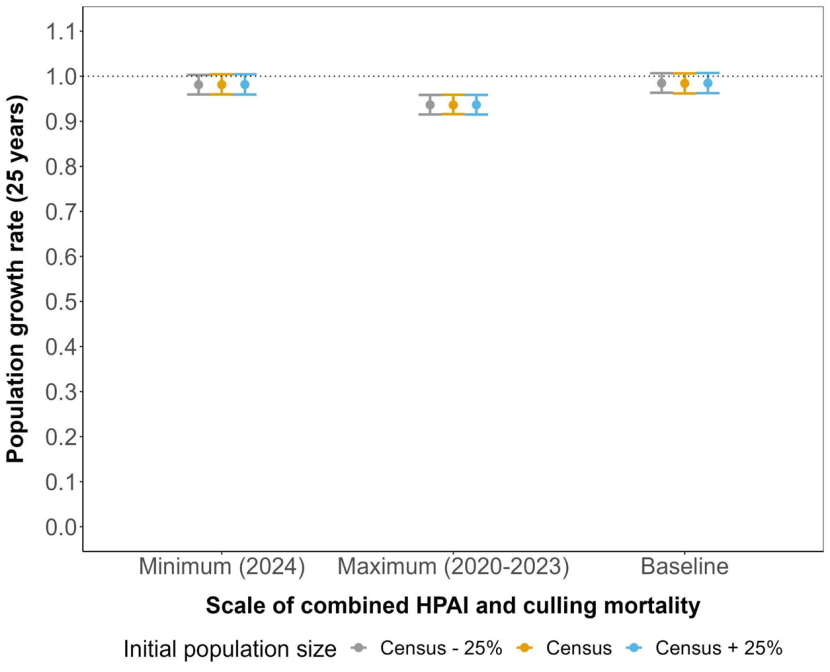
Figure 3. Modelled growth rates (geometric mean) of a herring gull population in response to an HPAI mortality event and the licenced control minimum levels observed in 2024, the maximum licenced control level, and the baseline population trajectory.
Click for a full description
Models were run with an initial population size of that estimated in 2021 + 25% to account for uncertainty in this estimate. The dashed line indicates a stable population where the growth rate = 1.
Both the baseline and 2024 licenced control level combined with an HPAI outbreak resulted in a slightly negative growth rate for the modelled herring gull population (0.98 – 0.99). The scenario including an HPAI outbreak combined with the maximum cull level permitted between 2020-2023 resulted in a lower negative growth rate (~ 0.95).
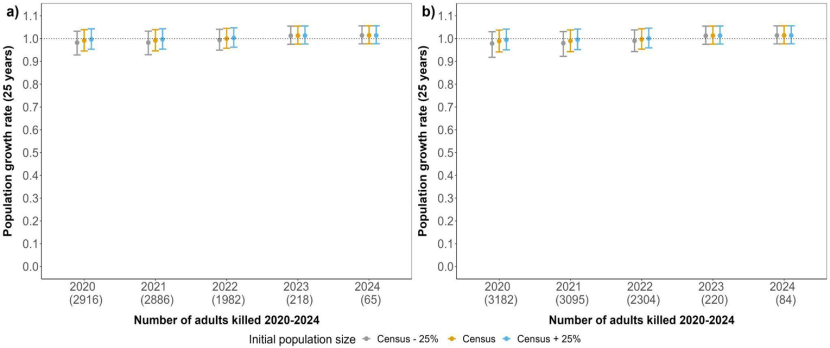
Figure 4. Modelled growth rates (geometric mean) of a lesser black-backed gull population in response to permitted cull levels 2020:2024 inclusive a) excluding, and b) including those licence returns issued for air safety.
Click for a full description
View a larger version of this image.
Models were run with an initial population size of that estimated in 2021 + 25% to account for uncertainty. The dashed line indicates a stable population where the growth.
The modelled baseline population of lesser black-backed gulls (without any licenced control) was predicted to increase over the 25-year period, with its mean population growth rate >1. When subjected to the licenced control pressure permitted in 2020 and 2021, mean growth rate dipped marginally <1 (population decline), although the confidence intervals overlapped with zero, and the mean growth rate of the largest initial population size hovered at around one. The licenced control levels permitted in 2023 and 2024 yielded positive population growth, similar to the baseline.
Both the baseline and 2024 licenced control level combined with an HPAI outbreak resulted in a negative growth rate for the modelled herring gull population (0.98 – 0.99). The scenario including an HPAI outbreak combined with the maximum control level permitted between 2020-2023 resulted in a lower negative growth rate (~ 0.95) (Figure 3). The probability of the modelled herring gull population experiencing a 50% decline was relatively low under the first two scenarios but was 100% under the maximum control level (Table 5).
Lesser black-backed gull
The modelled baseline population of lesser black-backed gulls (without any licenced control) was predicted to increase over the 25-year period, with its mean population growth rate >1 (Figure 4).
Figure 4. Modelled growth rates (geometric mean) of a lesser black-backed gull population in response to permitted cull levels 2020:2024 inclusive a) excluding, and b) including those licence returns issued for air safety.
Click for a full description
View a larger version of this image.
Models were run with an initial population size of that estimated in 2021 + 25% to account for uncertainty. The dashed line indicates a stable population where the growth.
The modelled baseline population of lesser black-backed gulls (without any licenced control) was predicted to increase over the 25-year period, with its mean population growth rate >1. When subjected to the licenced control pressure permitted in 2020 and 2021, mean growth rate dipped marginally <1 (population decline), although the confidence intervals overlapped with zero, and the mean growth rate of the largest initial population size hovered at around one. The licenced control levels permitted in 2023 and 2024 yielded positive population growth, similar to the baseline.
When subjected to the licenced control pressure permitted in 2020 and 2021, mean growth rate dipped marginally <1 (population decline), although the confidence intervals overlapped with zero, and the mean growth rate of the largest initial population size hovered at around one (Figure 4). The licenced control levels permitted in 2023 and 2024 yielded positive population growth, similar to the baseline (Figure 4). A similar pattern was observed whether or not airport licenced control licences were included as mortality numbers did not change greatly (Figure 4). A wider range of predicted population growth rates in relation to reductions in licenced control numbers are presented in Figure 5.
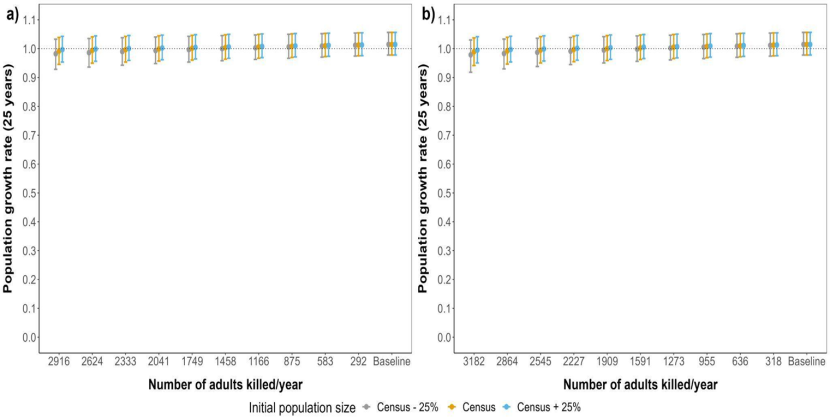
Figure 5. Modelled growth rates (geometric mean) of a lesser black-backed gull population in response to cull rates from the maximum recorded number of licences permitted to 10% of this maximum cull rate in 10% decrements a) excluding, and b) including th
Click for a full description
View a larger version of this image.
Models were run with an initial population size of that estimated in 2021 + 25% to account for uncertainty in this estimate. The dashed line indicates a stable population where the growth rate = 1. The probability of the modelled lesser black-backed gull population experiencing a 50% decline or more over the 25-year period remained relatively low under all licenced control scenarios, only approaching 40-50% when licenced control levels were similar to those from 2020 and 2021, when ~3000 birds were killed per year.
The probability of the modelled lesser black-backed gull population experiencing a 50% decline or more over the 25-year period remained relatively low under all licenced control scenarios, only approaching 40-50% when licenced control levels were similar to those from 2020 and 2021, when ~3000 birds were controlled per year (Tables 6 and 7). Under such licenced control pressure, the population was predicted to decline by approximately 3 to 45% depending on the initial population size, though confidence intervals were large (Tables 6 and 7).
Both the baseline and 2024 licenced control level combined with an HPAI outbreak resulted in a slightly positive growth rate for the modelled lesser black-backed gull. Conversely, the scenario including an HPAI outbreak combined with the maximum control level permitted resulted in a slightly negative growth rate (Figure 6).
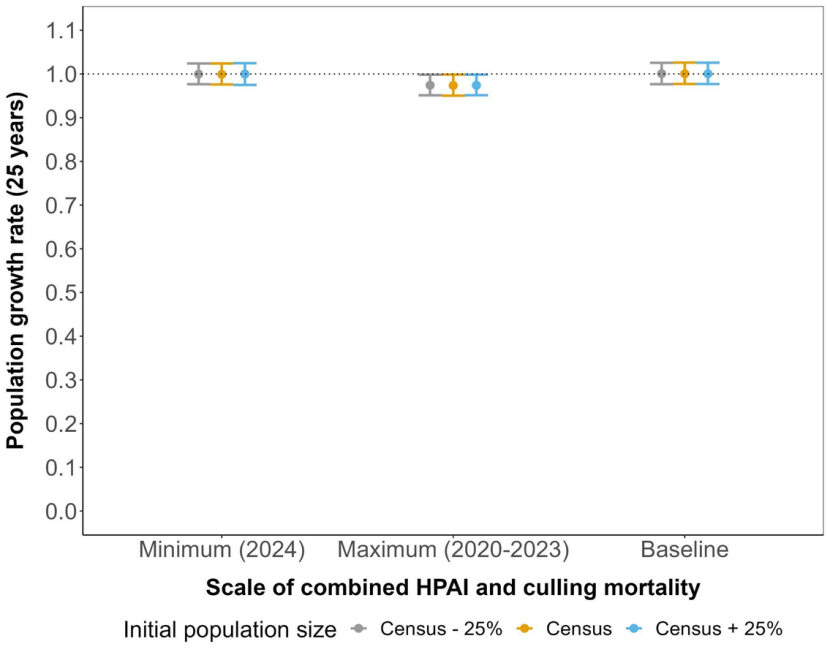
Figure 6. Modelled growth rates (geometric mean) of a lesser black-backed gull population in response to an HPAI mortality event and the licenced control levels observed in 2024, the maximum licenced control level, and the baseline population trajectory.
Click for a full description
Models were run with an initial population size of that estimated in 2021 + 25% to account for uncertainty in this estimate. The dashed line indicates a stable population where the growth rate = 1.
Both the baseline and 2024 licenced control level combined with an HPAI outbreak resulted in a slightly positive growth rate for the modelled lesser black-backed gull. Conversely, the scenario including an HPAI outbreak combined with the maximum cull level permitted resulted in a slightly negative growth rate.
In the baseline and 2024 HPAI-related scenarios the probability of the population declining by >50% in the survey period hovered at around 1%, however this probability increased to almost 50% when subjected to the maximum mortality scenario (Table 8).
Great black-backed gull
The modelled baseline population of great black-backed gulls (without any licenced control) was predicted to decline over the 25-year period, with its mean population growth rate (and confidence intervals) <1 (Figure 7).
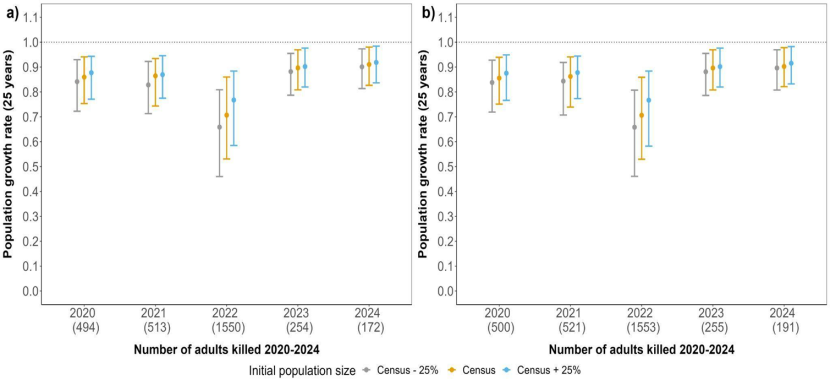
Figure 7. Modelled growth rates (geometric mean) of a great black-backed gull population in response to permitted cull levels 2020:2024 inclusive a) excluding, and b) including those licence returns issued for air safety.
Click for a full description
View a larger version of this image.
Models were run with an initial population size of that estimated in 2021 + 25% to account for uncertainty in this estimate. The dashed line indicates a stable population where the growth rate = 1.
The modelled baseline population of great black-backed gulls (without any licenced control) was predicted to decline over the 25-year period, with its mean population growth rate (and confidence intervals) <1. When subjected to the licenced control pressure permitted in 2020 and 2021, mean growth rate dipped further to ~0.7, indicating a steep decline. The licenced control levels permitted in 2023 and 2024 yielded a population growth slightly below the baseline, though still indicating a decline. A similar pattern was observed whether or not airport licenced control licences were included as mortality numbers did not change greatly.
When subjected to the licenced control pressure permitted in 2020 and 2021, mean growth rate dipped further to ~0.7, indicating a steep decline. The licenced control levels permitted in 2023 and 2024 yielded a population growth slightly below the baseline, though still indicating a decline (Figure 7). A similar pattern was observed whether or not airport licenced control licences were included as mortality numbers did not change greatly (Figure 7). A wider range of predicted population growth rates in relation to reductions in licenced control numbers are presented in Figure 8.
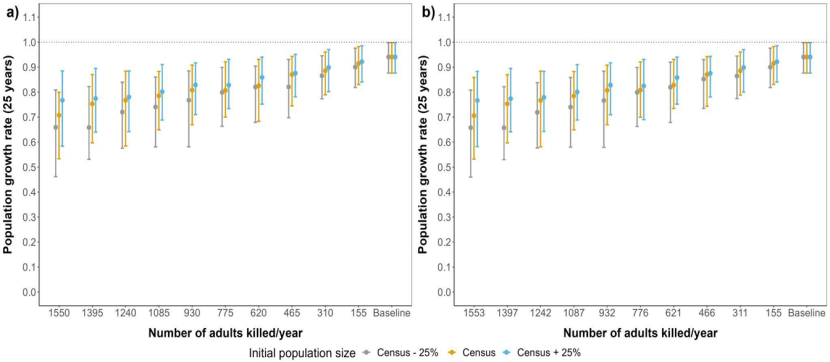
Figure 8. Modelled growth rates of a great black-backed gull population in response to cull rates from the maximum recorded number of licences permitted to 10% of this maximum cull rate in 10% decrements.
Click for a full description
View a larger version of this image.
Models were run with an initial population size of that estimated in 2021 + 25% to account for uncertainty in this estimate. The dashed line indicates a stable population where the growth rate = 1. As licenced control pressure decreased, the great black-backed gull population was proportionately less negatively affected. However, as the baseline population already depicted a decline, the probability of exceeding a 50% decline in 25 years was virtually 100% under all possible scenarios.
As licenced control pressure decreased, the great black-backed gull population was proportionately less negatively affected (Figure 8). However, as the baseline population already depicted a decline, the probability of exceeding a 50% decline in 25 years was virtually 100% under all possible scenarios. Furthermore, under high levels of permitted licenced control such as in 2020-2022, extinction was predicted to be reached as fast as after four years when considering the lower initial population size (Tables 9 and 10).
There was no large difference between the growth rate of the great black-backed gull population under the HPAI baseline scenario, and the scenario considering an HPAI outbreak and the minimum (2024) level of permitted licenced control, both largely <1. However, the growth rate estimated for the scenario considering an HPAI outbreak and the maximum permitted licenced control level was c.0.15 lower (Figure 9).
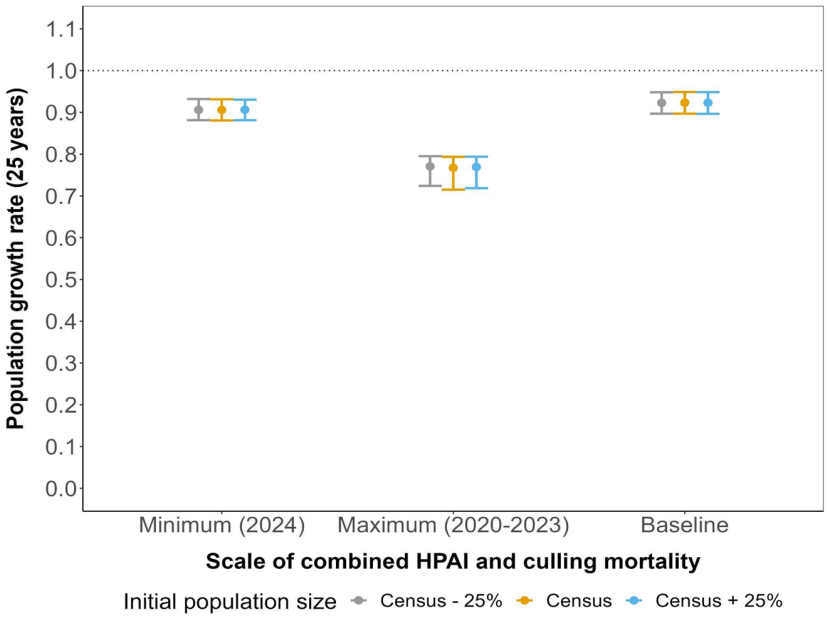
Figure 9. Modelled growth rates of a great black-backed gull population in response to an HPAI mortality event and the licenced control levels observed in 2024, the maximum licenced control level, and the baseline population trajectory.
Click for a full description
Models were run with an initial population size of that estimated in 2021 + 25% to account for uncertainty in this estimate. The dashed line indicates a stable population where the growth rate = 1. There was no large difference between the growth rate of the great black-backed gull population under the HPAI baseline scenario, and the scenario considering an HPAI outbreak and the minimum (2024) level of permitted licenced control, both largely <1. However, the growth rate estimated for the scenario considering an HPAI outbreak and the maximum permitted licenced control level was c.0.15 lower.
In all cases, the probability of declining by 50% or more was virtually 100%, and extinction was almost reached under the maximum control scenario (Table 11).
Common gull
The modelled baseline population of common gulls (without any licenced control) was predicted to decline over the 25-year period, with its mean population growth rate (and confidence intervals) <1 (Figure 10).
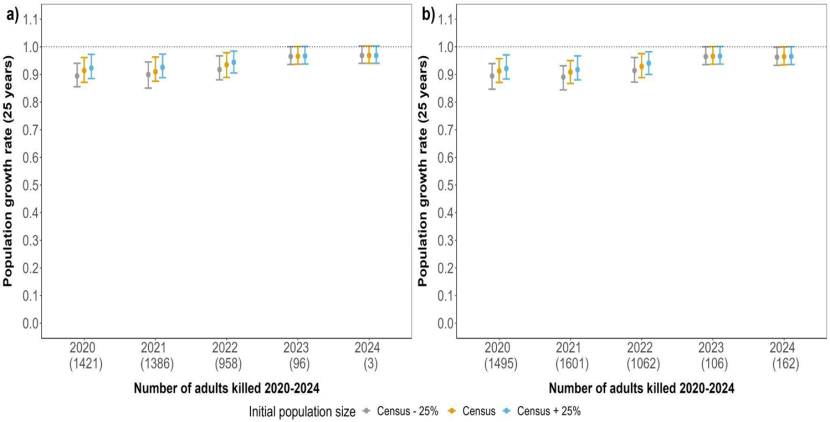
Figure 10. Modelled growth rates (geometric mean) of a common gull population in response to permitted cull levels 2020:2024 inclusive a) excluding, and b) including those licence returns issued for air safety.
Click for a full description
View a larger version of this image.
Models were run with an initial population size of that estimated in 2021 + 25% to account for uncertainty in this estimate. The dashed line indicates a stable population where the growth rate = 1.
The modelled baseline population of common gulls (without any licenced control) was predicted to decline over the 25-year period, with its mean population growth rate (and confidence intervals) <1 . When subjected to the licenced control pressure permitted in 2020 and 2021, mean growth rate dipped further to between 0.9-0.95 depending on initial population size, indicating a steep decline. The licenced control levels permitted in 2023 and 2024 yielded a population growth similar to the baseline, though still indicating a decline.
When subjected to the licenced control pressure permitted in 2020 and 2021, mean growth rate dipped further to between 0.9-0.95 depending on initial population size, indicating a steep decline. The licenced control levels permitted in 2023 and 2024 yielded a population growth similar to the baseline, though still indicating a decline (Figures 10). A similar pattern was observed whether or not airport licenced control licences were included as mortality numbers did not change greatly (Figure 10). A wider range of predicted population growth rates in relation to reductions in licenced control numbers are presented in Figure 11.
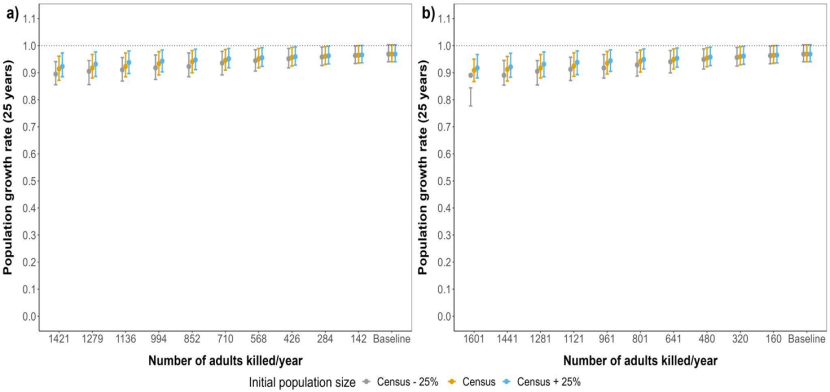
Figure 11. Modelled growth rates of a common gull population in response to cull rates from the maximum recorded number of licences permitted to 10% of this maximum cull rate in 10% decrements.
Click for a full description
View a larger version of this image.
Models were run with an initial population size of that estimated in 2021 + 25% to account for uncertainty in this estimate. The dashed line indicates a stable population where the growth rate = 1. As licenced control pressure decreased, the modelled common gull population was proportionately less negatively affected.
As licenced control pressure decreased, the modelled common gull population was proportionately less negatively affected. However, as the baseline population was already in decline, the probability of exceeding a 50% decline in 25 years was close to 100% under all possible scenarios as licenced control in any level exacerbated the decline.
As licenced control pressure decreased, the modelled common gull population was proportionately less negatively affected (Figure 11). However, as the baseline population was already in decline, the probability of exceeding a 50% decline in 25 years was close to 100% under all possible scenarios as licenced control in any level exacerbated the decline. Furthermore, under high levels of permitted licenced control such as in 2020-2022, extinction was predicted to be reached as fast as after 15 years when considering the lower initial population size (Tables 12 and 13).
The scenarios of the baseline and minimum licenced control levels with an HPAI outbreak showed a similar growth rate for common gulls. Growth rate declined further to ~0.92 when considering an HPAI outbreak combined with the maximum reported licenced control level (Figure 12).
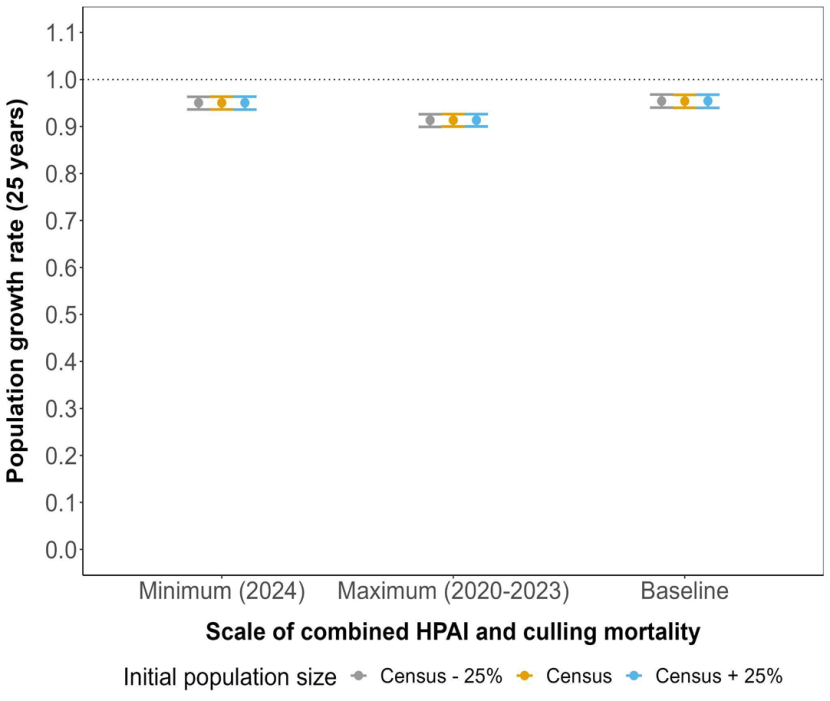
Figure 12. Modelled growth rates (geometric mean) of a common gull population in response to an HPAI mortality event and the licenced control levels observed in 2024, the maximum licenced control level, and the baseline population trajectory.
Click for a full description
Models were run with an initial population size of that estimated in 2021 + 25% to account for uncertainty in this estimate. The dashed line indicates a stable population where the growth rate = 1. The scenarios of the baseline and minimum licenced control levels with an HPAI outbreak showed a similar growth rate for common gulls. Growth rate declined further to ~0.92 when considering an HPAI outbreak combined with the maximum reported licenced control level.
In all scenarios, the probability of the population declining by >50% hovered around 100% (Table 14).
Black-headed gull
The modelled baseline population of black-headed gulls (without any licenced control) was predicted to decline over the 25-year period, with its mean population growth rate <1 (Figure 13).
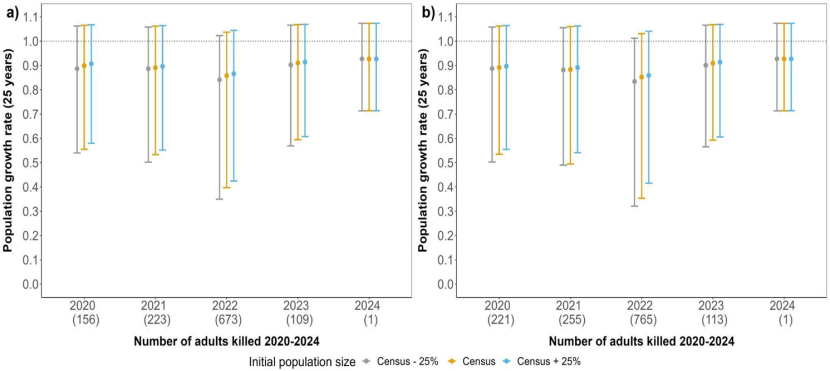
Figure 13. Modelled growth rates (geometric mean) of a black-headed gull population in response to permitted cull levels 2020:2024 inclusive a) excluding, and b) including those licence returns issued for air safety.
Click for a full description
View a larger version of this image.
Models were run with an initial population size of that estimated in 2021 + 25% to account for uncertainty in this estimate. The dashed line indicates a stable population where the growth rate = 1.
The modelled baseline population of black-headed gulls (without any licenced control) was predicted to decline over the 25-year period, with its mean population growth rate <1. However, there was large uncertainty in this figure with confidence intervals that included a large range of potential values, including negative and positive population growth, due to large variance in demographic parameters. When subjected to the licenced control pressure permitted in 2020-2023, the growth rate was slightly lower than when subjected to the licenced control pressure observed in 2023 and 2024. A similar pattern was observed whether or not airport licenced control licences were included as mortality numbers did not change greatly.
There was large uncertainty in this figure with confidence intervals that included a range of potential values, including negative and positive population growth, due to large variance in demographic parameters, presumably due to inter-annual variation (Tyler et al., unpub.). When subjected to the licenced control pressure permitted in 2020-2023, the growth rate was lower than when subjected to the licenced control pressure observed in 2023 and 2024 (Figure 13). A similar pattern was observed whether or not airport licenced control licences were included as mortality numbers did not change greatly (Figure 13). A wider range of predicted population growth rates in relation to reductions in licenced control numbers are presented in Figure 14.
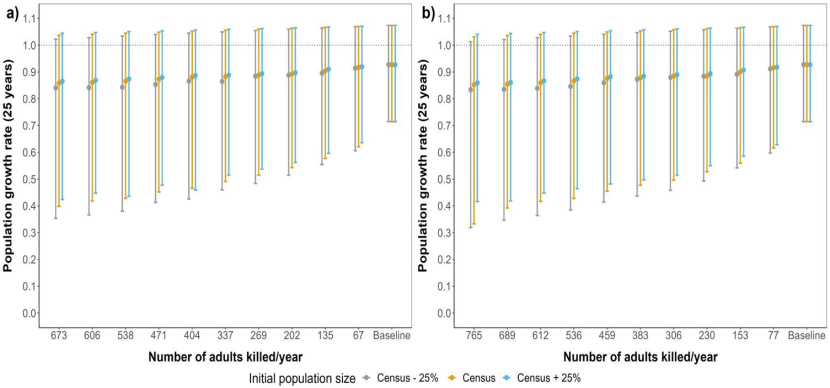
Figure 14.Modelled growth rates of a black-headed gull population in response to cull rates from the maximum recorded number of licences permitted to 10% of this maximum cull rate in 10% decrements.
Click for a full description
View a larger version of this image.
Models were run with an initial population size of that estimated in 2021 + 25% to account for uncertainty in this estimate. The dashed line indicates a stable population where the growth rate = 1.
Black-headed gulls were predicted to become extinct in Scotland if as little as 20% of the highest cull level issued since 2020 was sustained for 25 years. The only scenarios in which the population of black-headed gulls persisted was if fewer than 765 birds were killed per year.
Black-headed gulls were predicted to become extinct in Scotland if as little as 20% of the highest control level issued since 2020 was sustained for 25 years (Figure 14). The only scenarios in which the population of black-headed gulls persisted was if fewer than 765 birds were killed per year. Accordingly, the probability of black-headed gulls experiencing a 50% decline or more was > 90% in all scenarios except when licenced control levels matched those permitted in 2024 (Tables 15 and 16).
The inclusion of an HPAI outbreak in addition to the licenced control levels in 2024 did not clearly affect the growth rate of the modelled black-headed gull population compared to the baseline scenario. For black-headed gull, there was a decrease in growth rate to ~0.85 when an HPAI outbreak occurred in addition to the maximum permitted licenced control mortality (Figure 15).
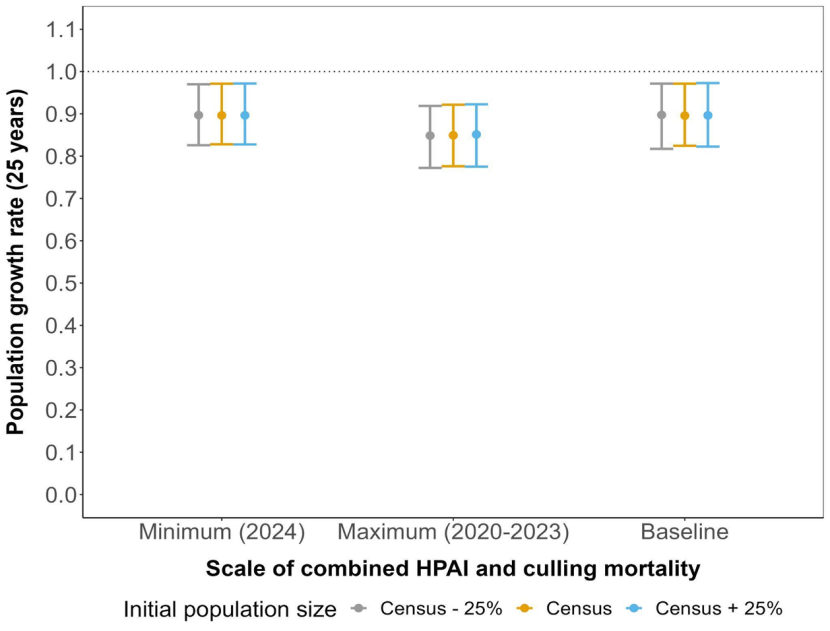
Figure 15. Modelled growth rates (geometric mean) of a black-headed gull population in response to an HPAI mortality event and the licenced control levels observed in 2024, the maximum licenced control level, and the baseline population trajectory.
Click for a full description
Models were run with an initial population size of that estimated in 2021 + 25% to account for uncertainty in this estimate. The dashed line indicates a stable population where the growth rate = 1.
The inclusion of an HPAI on break in addition to the licenced control levels in 2024 did not clearly affect the growth rate of the modelled black-headed gull population compared to the baseline scenario. For black-headed gull, there was a decrease in growth rate to ~0.85 when an HPAI outbreak occurred in addition to the maximum permitted licenced control mortality.
The population was not predicted to go extinct in any scenario, but the probability of the population declining by >50% was >90% in all scenarios (Table 17).
Discussion
Impacts of gull management
Modelled baseline populations, used here as an example to represent gull populations in Scotland in the absence of any licences being granted, showed a relatively stable population in one species (herring gull), a declining population (i.e. population growth mean below 1) in three species (great black-backed gull, common gull, and black-headed gull), and an increasing population in one species (lesser black-backed gull). These baseline populations closely followed the dynamics of those observed in Scottish populations based on previous censuses in the case of great black-backed gulls, common gulls, and black-headed gulls. However, selected demographic rates likely overestimated the growth rate of the herring gull baseline population when considering the observed 37% decline between Operation Seafarer (Cramp et al., 1974) and Seabirds Counts (Burnell et al., 2023). The baseline population of lesser black-backed gulls slightly underestimated population growth when compared to observed Scottish trends that included both urban and natural nesters. However, the natural-nesting component of the populations of the two latter species has undergone declines of 44% - 48% between Seabird 2000 (Mitchell et al. 2002) and Seabirds Counts (Burnell et al., 2023).
We found that licenced control of five gull species in Scotland at the levels permitted in the past impacted the modelled population dynamics of all species. The magnitude of the effect of licenced control on the modelled baseline populations increased with scenarios of higher control levels. The effect was particularly apparent in those populations already in steeper decline (e.g. great black-backed gulls, common gulls, and black-headed gulls). The scenarios were produced to show the magnitude of change across different levels of pressures rather than to present the absolute numbers involved for population change. As such, no recommendations for absolute thresholds are provided from the modelling scenarios.
There was a large contrast in the number of adults (which included adult equivalents from chicks and eggs) permitted to be controlled under licence between 2020-2023 and 2024 for all species, following new guidance to reduce licenced control pressure was made in 2024 by NatureScot. As such, impacts on population growth metrics were vastly different in most species between these two periods. The maximum permitted licenced control in any year between 2020-2023 resulted in severe population declines in all species, and extinction was reached in great black-backed gulls, common gulls, and black-headed gulls within 25 years. Extinction was also almost reached in the herring gull population where a lower initial population size was considered. Licensed control pressure permitted between 2020-2023 turned a baseline population increase in lesser black-backed gulls into a decline of 9 - 47% depending on the initial population size after 25 years. Contrastingly, the impacts of the permitted licenced control in 2024 (equivalent to the minimum permitted licenced control of any year in all species) were lower. The modelled lesser black-backed gull population continued to increase at approximately the same rate under the 2024 scenario as when no licenced control was applied, though confidence intervals were large, overlapping with both large population increases and declines. In herring gulls, the 2024 licenced control pressure resulted in a final median population size that was ~5% smaller than when no licenced control impact was applied. Impacts of the 2024 permitted licenced control on the population growth of great black-backed gulls, common gulls and black-headed gulls were also reduced compared to 2020-2023. However, due to the underlying declines in the baseline populations of these species, impacts were still evident. For example, in great black-backed gulls, the median population decline was of 99.7 - 100% when subjected to 2024 licenced control pressure, but ~80.5% when no licenced control was applied over the 25-year period. A similar pattern was observed in the modelled populations of common gulls, but not black-headed gulls as only one bird was permitted to be lethally controlled in 2024.
For illustrative purposes, if we assumed a precautionary scenario where the maximum permitted mortality was applied to all populations, the shifts observed in modelled population trends and size would be large enough to warrant changing the classification of all species if following IUCN criterion A2 (IUCN 2024) at a UK level. For example, lesser black-backed gulls would be upgraded from Least Concern to Vulnerable (decline >30% in three generations or less), and herring gulls from Least Concern to Critically Endangered (decline >80% in three generations or less). Due to the underlying declines in the remaining species, these would also be upgraded to Critically Endangered. Indeed, great black-backed gulls have been recommended to be upgraded from Least Concern to Vulnerable at a global scale (Langlois Lopez et al., 2023), and they are red listed in the UK together with common gulls and herring gulls (Stanbury et al., 2024).
In this work, all PVA scenarios were defined based on the permitted number of adult gulls (or adult equivalents) that could be controlled per year. In reality, these numbers appear to be rarely reached according to licence returns, although some returns are not submitted and thus the true level of licenced control remains unknown. We provide an indication of where the converted number of adults and adult equivalents from returns fall within the additional scenarios (i.e. the PVA scenario built using the highest level of lethal licenced control for each species) for each of the five gull species between 2020 and 2023 in Annex 6. However, it is important to emphasise that these values are not true return totals, with the minimum percentage of licences with incomplete final returns ranging from 3.4 to 18.9% between 2020 and 2023. It must also be considered that we did not include the impacts of destroying empty nests on gull populations, which, while not directly affecting mortality, may indirectly impact the fitness of individuals or their ability to breed elsewhere that same year.
Interactive effect of licenced control with HPAI
Disease outbreaks or other stochastic events such as extreme weather are primary threats to seabird populations, occasionally resulting in high pulses of mortality over short periods of time (Ortiz and Smith, 1994; Tremlett et al., 2025). Since 2021, HPAI has caused high mortality in many seabirds in the UK, with an estimated 20 - 40% mortality in gull populations over two years (Tremlett et al., 2025). Quantifying the cumulative effects of licenced control and these stochastic events is therefore important to understand how populations may respond in following years given different levels of licenced control pressure.
HPAI impacts on baseline populations (i.e. without licenced control) resulted in median population sizes that were lower than for a completely unimpacted population; the probability of these HPAI-only impacted final population sizes being larger than the final size of a completely unimpacted population ranged between 4 - 39% depending on initial population size. When considering the additional impacts from the minimum licenced control levels (2024), final median population size reduced further in all species, resulting in final populations that were approximately 1 - 6% lower than when only the HPAI impact was applied. Importantly, the addition of maximum permitted mortality (2020-2023) resulted in final population sizes that were 12 - 45% lower than in the previous two scenarios, with some populations almost reaching extinction. Therefore, high licenced control pressure also had important impacts in modelled populations that were subjected to other threats. This was particularly notable in herring gulls and lesser black-backed gulls, where the addition of HPAI and licenced control resulted in population declines, highlighting the crucial need to consider additional stressors when defining population management strategies. Furthermore, we must consider that here we only modelled HPAI impacts on adult survival, without associated mortality in immatures and productivity. Therefore, HPAI impacts would likely be larger in reality.
Considering cumulative pressures in the context of licenced control
It is important to note that the baseline PVA models, to which the licenced control scenarios were applied, likely already represented populations that were subjected to different anthropogenic pressures, particularly for species experiencing declines, since they intended to represent observed trends in Scottish gull populations. Gull populations across Scotland face multiple stressors that can affect their demographic rates, including adult survival. These stressors include predation (especially from non-native mammalian predators), reduced food availability due to changes in fishing bycatch and landfill management, collisions with onshore and offshore wind turbines, disease and pollution (as summarised in Burnell et al., 2023). Given the forecasted increase in offshore renewable development around Scotland (Scottish Government, 2020), with large gulls being particularly vulnerable to collision risk with turbines, the combined pressures of licenced control and increased mortality from offshore wind developments may mean that under such circumstances gull populations may be depressed even further. Since the permitted number of birds that can be controlled per licence was rarely reached between 2020 and 2024, the additional scenarios presented in this work based on the maximum permitted mortality can be used as reference points to interpret the potential effects of licenced control plus additional stressors such as those mentioned above.
Limitations and analytical considerations
As discussed in the section “Analytical considerations”, the use of closed-population PVAs to represent a single national population oversimplifies what is likely to be a complex metapopulation, for which there is no comprehensive information on population size, demographic rates, or dispersal. The work carried out here must therefore be interpreted with caution, and used as a reference to understand what the potential impacts of different levels of licenced control mortality could have on gull populations that show similar dynamics to the ones modelled here. Robust inferences about the impacts of population control will only be possible if step changes are achieved in how gull populations are monitored in Scotland and in neighbouring jurisdictions, as has been pointed out in previous reviews (Calladine et al., 2006). Population trends and demographic data for urban gull populations are a critical knowledge gap in this respect. This is particularly the case for herring gulls and lesser black-backed gulls because the results of the latest seabird census indicate there is now a higher proportion of these species nesting in urban environments (including coastal and inland urban areas) than in non-urban environments (Burnell et al.,2023).
Since the impacts of localised licenced control are likely to affect gull populations at local or regional scales, for example the urban population of a town or city, parameterising PVAs with demographic parameters specific to the population of interest is strongly desirable. Similarly, annual monitoring of the breeding population through the SMP would allow for better validation of baseline PVAs, and consequently more accurate outputs that better represent the expected impacts of licenced control. Demographic data, notably survival which is dependent on ringing and resighting/recatching data over many years, is scantly collected at the required scales for most of the species modelled here due to economic and logistical constraints, particularly in urban settings where much of the licenced control takes place. Relevant survival, productivity, and count data are essential for carrying out PVAs and being able to build more bespoke models to the populations of interest. Demographic parameters may furthermore not be independent of control efforts. For example increases in egg size, body size and body condition of adults, and a reduction in the age at recruitment, were observed following culls of breeding herring gulls on the Isle of May (Coulson, Duncan and Thomas, 1982), and elsewhere local control efforts have altered immigration and emigration rates between colonies leading to unpredictable effects of licenced control at the metapopulation level (Bosch, Pocino and Carrera, 2019; Bosch et al., 2000; Coulson, 1991).
Furthermore, it is important to emphasise that gulls are impacted by a suite of anthropogenic threats beyond licenced control, such as lethal and sublethal effects from renewable energy developments, fisheries bycatch, pollution, or entanglement, for example associated with landfill sites or fish farms (Dias et al., 2019; Furness, Wade and Masden, 2013). Therefore, a better understanding of this additional mortality would be beneficial to quantify overall anthropogenic-driven mortality in gull populations that can be considered when determining management strategies.
Eggs, chicks, and adults of several gull species have been actively killed for decades during the 20th and 21st century. Gull control measures have been implemented at SPAs where conservation concerns were raised for other seabird species since at least the 1970s (Coulson, Duncan and Thomas, 1982). Currently, the number of licences issued at SPAs is far fewer than in recent years/decades (with only one licence in 2024). The demand for population control measures will likely have been exacerbated by gull populations making greater use of areas of conurbations and associated infrastructure such landfills, for foraging and nesting (Coulson, 2019). Since 2020, whilst licence returns stating the number of eggs, chicks, and adults controlled is a requirement of licenced control licences, returns are not always provided, and thus true control mortality is unknown. Therefore, the scale of long-term licenced control mortality and its impacts on gull populations in terms of overall numbers and resulting changes in dispersal is hard to quantify. However, it is likely that the population estimates from previous seabird censuses reflected the impacts of long-term licenced control pressures to some extent, and, as such, our baseline PVAs may already represent populations that are affected by licenced control to some extent rather than representing completely unimpacted populations. Such a scenario would mean that the level of licenced control presented here could exaggerate impacts on population growth. However the lack of population trend and demographic data at the same spatial and temporal scale of past and present control measures means that it is currently not possible to assess to what extent the demographic parameters used for modelling in this report already reflect mortality and other demographic impacts from licenced control. Furthermore, the demographic rates used in this study appear to predominantly originate from non-urban colonies such as the Isle of May, Skomer, Skokholm, or Hornøya (Norway), where no active control has been undertaken, or where short pulses of intense control have taken place. If demographic rates were estimated over periods with no control, it is less likely that our baseline populations already accounted for licenced control mortality.
Conclusion
Many gull populations are routinely managed to alleviate potential conflicts with human activities, where gulls are perceived to pose a risk to human health and safety, food production, or other protected species. However, the application of such management is rarely informed by quantitative evidence on the expected outcome and the impacts on the population being managed. In this modelling exercise we demonstrated that the levels of licenced control permitted by NatureScot between 2020-2024 had impacts on the modelled population dynamics of five breeding gull species in Scotland, resulting in faster population declines than when no licenced control was applied, and sometimes resulting in the extinction of populations within 25 years for great black-backed gulls, common gulls, and black-headed gulls. The licensing regime change between 2020-2023 and 2024 did show that decreasing the number of licences issued greatly decreased the likely impacts on gull populations. However, the levels of licenced control permitted in all species between 2020-2023, and 2024 for some species, are unsustainable for gull populations that exhibit similar underlying dynamics to those modelled here. In reality, these permitted levels were not reached between 2020 and 2024 as the returns from most licences were lower than the permitted numbers, albeit some returns were missing. However, it is imperative that investigations into how populations may be impacted by licenced control be undertaken before control takes place, and that new licensing policy considers tying the extent of management to current population size as uncontrolled management could result in the loss of UK breeding species. Furthermore, management approaches must consider the cumulative impact of additional anthropogenic stressors and stochastic events such as HPAI since these may also affect population dynamics. Better approaches to population management could be achieved through improved monitoring of urban populations to produce more comprehensive estimates of population size and trends, survival, and productivity that allow for more bespoke population modelling.
Annexes
Annex 1 Trends in Scotland’s gull species
| Species | Population size for natural nesters Seabird 2000 | Population size for natural nesters Seabirds Count1 | Percentage change in population size between censuses |
|---|---|---|---|
| Herring gull | 67,295 | 37,349 | -44% |
| Lesser black-backed gull | 21,170 | 11,001 | -48% |
| Great black-backed gull | 14,744 | 5,404 | -63% |
| Common gull | 48,053 | 22,755 | -53% |
| Black-headed gull | 43,063 | 10,785 | -75% |
1 – for Great black-backed gulls, common gulls and black-headed gulls the total also includes urban nesters.
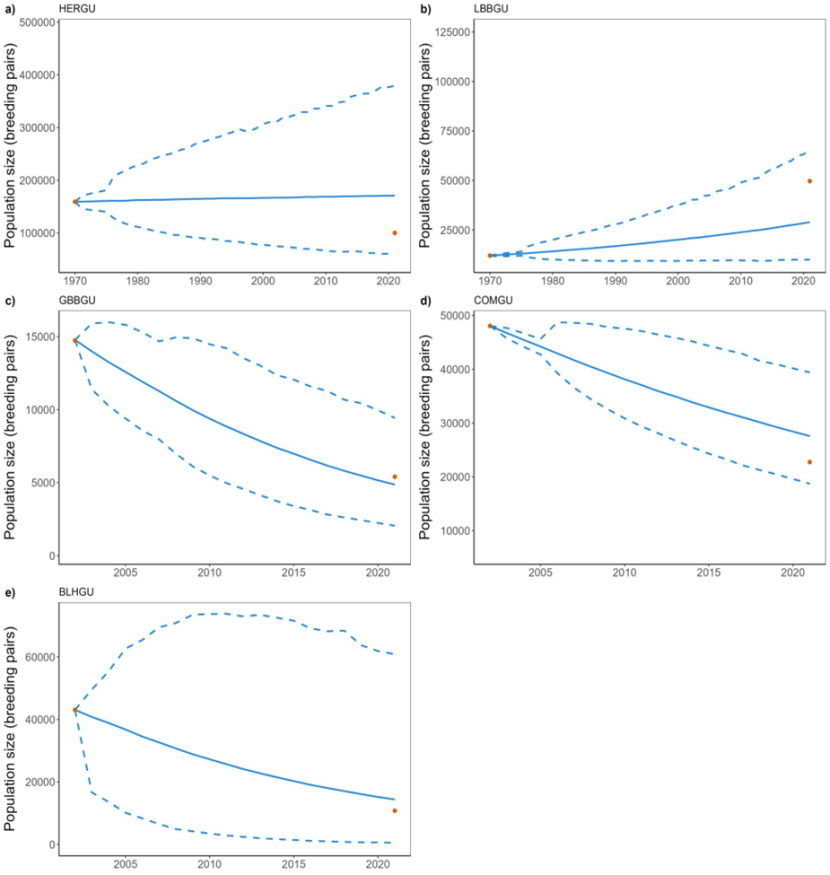
Annex Figure A1. Baseline population sizes and trends for each of the five gull species (HERGU = herring gull, LBBGU = lesser black-backed gull, GBBGU = great black-backed gull, COMGU = common gull, BLHGU = black-headed gull) from 1970 to 2021 in Scotland
Click for a full description
Red circles indicate raw count data. Blue lines show the modelled median population trends with 95% confidence intervals (dashed lines). Herring gulls show a stable population, great black-backed gulls, common gulls, and black-headed gulls show a declining population, and lesser black-backed gulls show an increasing population.
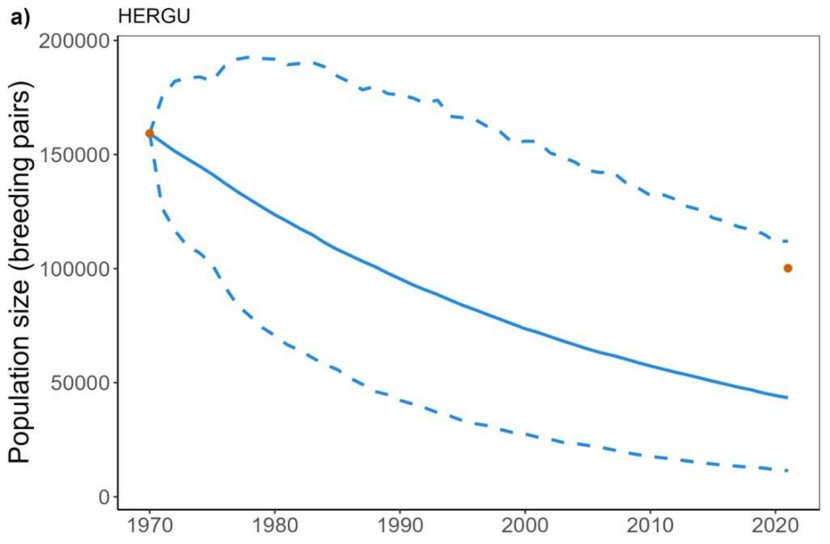
Annex Figure A2. Baseline population size and trend for herring gulls from 1970 to 2021 in Scotland using a different combination of demographic parameters available in Annex 3 Table 1 to those retained in the best-fitting baseline population.
Click for a full description
Red circles indicate raw count data. Blue lines show the modelled median population trend with 95% confidence intervals (dashed lines) of herring gull population. The population trend is strongly negative.
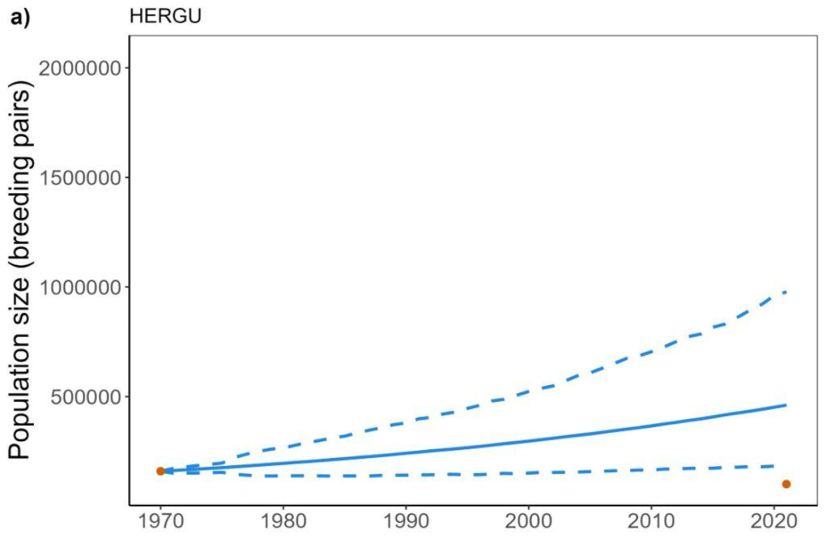
Annex Figure A3. Baseline population size and trend for herring gulls from 1970 to 2021 in Scotland using a different combination of demographic parameters available in Annex 3 Table 1 to those retained in the best-fitting baseline population.
Click for a full description
Red circles indicate raw count data. Blue lines show the modelled median population trend with 95% confidence intervals (dashed lines) of herring gull population. The population trend is strongly positive.
Annex 2 Modelled baseline populations
See document download.
Annex 3 Input parameters and associated data sources for PVAs
| Parameter | Value | Source | Retained for baseline PVA |
|---|---|---|---|
| Scotland AON (natural + urban) 2021 | 100161 | Seabirds Count, Burnell et al. 2023 | - |
| Scotland AON (natural) 1970 | 159237 | Operation Seafarer, Cramp et al. 1974 | - |
| Age of first breeding | 5 | Tyler et al. unpub. | yes |
| Maximum clutch size | 3 | Tyler et al. unpub. | yes |
| Breeding success (UK) | 0.831 (0.309) | Tyler et al. unpub. | yes |
| Breeding success (Scotland) | 1.014 (0.399) | Tyler et al. unpub. | no |
| Juvenile survival (Scotland) | 0.777 (0.092) | Tyler et al. unpub. | yes |
| Immature survival (Scotland) | Unknown | - | - |
| Adult survival (Scotland) | 0.878 (0.034) | Tyler et al. unpub. | yes |
| Juvenile survival (UK) | 0.795 (0.092) | Tyler et al. unpub. | no |
| Immature survival (UK) | Unknown | - | - |
| Adult survival (UK) | 0.834 (0.080) | Tyler et al. unpub. | no |
| Incidence of skipped breeding | 0.350 (0.028) | Tyler et al. unpub. | yes |
| Parameter | Value | Source | Retained for baseline PVA |
|---|---|---|---|
| Scotland AON (natural + urban) 2021 | 49662 | Seabirds Count, Burnell et al. 2023 | - |
| Scotland AON (natural) 1970 | 12031 | Operation Seafarer, Cramp et al. 1974 | - |
| Age of first breeding | 5 | Tyler et al. unpub. | yes |
| Maximum clutch size | 3 | Tyler et al. unpub. | yes |
| Breeding success (UK) | 0.594 (0.364) | Tyler et al. unpub. | yes |
| Breeding success (Scotland) | 0.872 (0.329) | Tyler et al. unpub. | no |
| Juvenile survival (Scotland) | 0.82 | Tyler et al. unpub.; Horswill and Robinson 2015 | no |
| Immature survival (Scotland) | unknown | - | - |
| Adult survival (Scotland) | 0.913 (0.022) | Tyler et al. unpub. | yes |
| Juvenile survival (UK) | 0.82 | Tyler et al. unpub. | yes |
| Immature survival (UK) | unknown | - | - |
| Adult survival (UK) | 0.884 (0.057) | Tyler et al. unpub. | no |
| Incidence of skipped breeding | 0.337 (0.065) | Tyler et al. unpub. | yes |
| Parameter | Value | Source | Retained for baseline PVA |
|---|---|---|---|
| Scotland AON (2021) | 5404 | Seabirds Count, Burnell et al. 2023 | - |
| Scotland AON (2002) | 14744 | Seabird 2000, Mitchell et al. 2004 | - |
| Age of first breeding | 5 | Tyler et al. unpub. | yes |
| Maximum clutch size | 3 | Tyler et al. unpub. | yes |
| Breeding success (UK) | 1.173 (0.497) | Tyler et al. unpub. | no |
| Breeding success (Scotland) | 1.026 (0.506) | Tyler et al. unpub. | yes |
| Juvenile survival (Scotland) | unknown | - | - |
| Immature survival (Scotland) | unknown | - | - |
| Adult survival (Scotland) | unknown | - | - |
| Juvenile survival (UK) | 0.729 (0.025) | Tyler et al. unpub. | yes |
| Immature survival (UK) | 0.886 (0.024) | Tyler et al. unpub. | no |
| Adult survival (UK) | 0.93 | Tyler et al. unpub. | no |
| Adult survival (Norway 2002- 2017) | 0.81 | Layton-Mathews et al. 2024 | yes |
| Incidence of skipped breeding | 0.350 | based on HERGU; Tyler et al. unpub. | yes |
| Parameter | Value | Source | Retained for baseline PVA |
|---|---|---|---|
| Scotland AON | 22755 | Seabirds Count, Burnell et al. 2023 | - |
| Scotland AON | 48053 | Seabird 2000, Mitchell et al. 2004 | - |
| Age of first breeding | 3 | Tyler et al. unpub. | yes |
| Maximum clutch size | 3 | BTO facts | yes |
| Breeding success (UK) | 0.519 (0.367) | Tyler et al. unpub. | no |
| Breeding success (Scotland) | 0.585 (0.407) | Tyler et al. unpub. | yes |
| Juvenile survival (Scotland) | unknown | - | - |
| Immature survival (Scotland) | unknown | - | - |
| Adult survival (Scotland) | unknown | - | - |
| Juvenile survival (UK) | 0.41 | Tyler et al. unpub. | yes |
| Immature survival (UK) | 0.71 | Tyler et al. unpub. | yes |
| Adult survival (UK) | 0.828 (0.05) | Tyler et al. unpub. | no |
| Adult survival (Estonia) 1963-1983 | 0.896 (0.010) | Rattiste and Lilleleht 1995 | yes |
| Incidence of skipped breeding | No evidence based on literature search | yes |
| Parameter | Value | Source | Retained for baseline PVA |
|---|---|---|---|
| Scotland AON 2021 | 10785 | Seabirds Count, Burnell et al. 2023 | - |
| Scotland AON 2002 | 43063 | Seabird 2000, Mitchell et al. 2004 | - |
| Age of first breeding | 2 | Tyler et al. unpub. | yes |
| Maximum clutch size | 3 | Goodbody 1955 | yes |
| Breeding success (UK) | 0.627 (0.414) | Tyler et al. unpub. | no |
| Breeding success (Scotland) | 0.457 (0.412) | Tyler et al. unpub. | yes |
| Juvenile survival (Scotland) | unknown | - | - |
| Immature survival (Scotland) | unknown | - | - |
| Adult survival (Scotland) | unknown | - | - |
| Juvenile survival (UK) | 0.61 | Coulson 2019; Tyler et al. unpub. | yes |
| Immature survival (UK) | unknown | - | yes |
| Adult survival (UK) | 0.824 (0.207) | Tyler et al. unpub. | yes |
| Incidence of skipped breeding | No evidence based on literature search | - | yes |
Annex 4 Summarised Licensing data
Species
| 2020 | 2020 | 2020 | 2021 | 2021 | 2021 | 2022 | 2022 | 2022 | 2023 | 2023 | 2023 | 2024 | 2024 | 2024 |
|---|---|---|---|---|---|---|---|---|---|---|---|---|---|---|---|
| - | Adults | Chicks | Eggs | Adults | Chicks | Eggs | Adults | Chicks | Eggs | Adults | Chicks | Eggs | Adults | Chicks | Eggs |
| Herring Gull | 1413 | 1089 | 52865 | 187 | 104 | 82374 | 271 | 70 | 16860 | 115 | 0 | 3140 | 11 | 1 | 0 |
| Lesser black-beaked gull | 537 | 649 | 17808 | 113 | 83 | 24164 | 115 | 39 | 16350 | 40 | 0 | 1530 | 2 | 0 | 560 |
| Great black-beaked gull | 401 | 81 | 631 | 227 | 8 | 2644 | 228 | 2 | 12410 | 152 | 0 | 950 | 130 | 0 | 390 |
| Common gull | 430 | 214 | 14336 | 6 | 8 | 21466 | 44 | 35 | 14060 | 15 | 0 | 1260 | 0 | 0 | 40 |
| Black-headed gull | 82 | 96 | 330 | 6 | 0 | 2835 | 10 | 0 | 8660 | 10 | 0 | 1290 | 0 | 0 | 10 |
Annex 5 Conversion factors
| Species | Conversion factor | Conversion factor |
|---|---|---|
| - | Chick | Egg |
| Herring gull | 0.46 | 0.13 |
| Lesser black-backed gull | 0.57 | 0.11 |
| Great black-backed gull | 0.31 | 0.11 |
| Common gull | 0.33 | 0.06 |
| Black-headed gull | 0.50 | 0.08 |
Annex 6 Summary returns data
Annex 6 Table 1. The converted number of adult equivalents from returns for each of the five gull species from 2020 to 2023. The additional scenario, i.e., the PVA scenario built using the highest level of lethal licenced control for each species, into which each total return falls are provided in brackets. Where returns were not distinguished for herring gull and lesser black-backed gull we apportioned 50% of the return to either species. It is important to emphasise that these values are included as a guide only as they underestimate true return totals. The minimum percentage of licences with incomplete final returns between 2020 and 2023 ranged from 3.4 to 18.9%. Returns were not included for 2024 as these were known to be incomplete as licensing data was obtained from NatureScot before the end of 2024.
| Species | Year (Additional scenario) | Year (Additional scenario) | Year (Additional scenario) | Year (Additional scenario) |
|---|---|---|---|---|
| - | 2020 | 2021 | 2022 | 2023 |
| Herring gull | 3017 (20%) | 4150 (30%) | 4092 (30%) | 3929 (30%) |
| Lesser black-backed gull | 726 (20%) | 1113 (30%) | 1201 (40%) | 879 (30%) |
| Great black-backed gull | 178 (10%) | 136 (<10%) | 193 (10%) | 240 (20%) |
| Common gull | 473 (30%) | 626 (40%) | 553 (30%) | 432 (20%) |
| Black-headed gull | 71 (10%) | 114 (10%) | 148 (20%) | 44 (<10%) |
References and Document containing Tables 3-7
References
Akçakaya, H.R. and Sjögren-Gulve, P. 2000. Population viability analyses in conservation planning: an overview. Ecological Bulletins, 9-21.
Belant, J.L. 1997. Gulls in urban environments: landscape-level management to reduce conflict. Landscape and Urban Planning, 38(3–4), 245–258. Available at: https://doi.org/10.1016/S0169-2046(97)00037-6.
Bosch, M., Oro, D., Cantos, F.J. and Zabala, M. 2000. Short‐term effects of licenced control on the ecology and population dynamics of the yellow‐legged gull. Journal of Applied Ecology, 37(2), 369-385.
Bosch, M., Pocino, N. and Carrera, E. 2019. Effects of Age and licenced control on Movements and Dispersal Rates of Yellow-legged Gulls (Larus michahellis) from a Western Mediterranean Colony. Waterbirds, 42(2), 179. Available at: https://doi.org/10.1675/063.042.0204.
Burnell, D., Perkins, A.J., Newton, S.F., Bolton, M, Tierney, T.D. and Dunn, T.D. 2023. Seabirds Count: A census of breeding seabirds in Britain and Ireland (2015-2021). Lynx Nature Books, Barcelona.
Burnell, D. 2021. Population estimates for urban and natural nesting Herring Gull Larus argentatus and Lesser Black-backed Gull Larus fuscus in England. JNCC Report.
Calladine, J.R., Park, K.J, Thompson, K. and Wernham, C.V. 2006. Review of Urban Gulls and their Management in Scotland (Research contract ENV/BTO/001/04). A report to the Scottish Executive Committee.
Coulson, J. 2019. Gulls. New Naturalist Library: HarperCollins Publishers.
Coulson, J.C. 1991. The population dynamics of licenced control herring gulls and lesser black-backed gulls. Bird Population Studies, 479-497.
Coulson, J.C., Duncan, N. and Thomas, C. 1982. Changes in the breeding biology of the Herring Gull (Larus argentatus) induced by reduction in the size and density of the colony. The Journal of Animal Ecology, 51(3), 739. Available at: https://doi.org/10.2307/4002.
Cramp, S., Bourne, W R P and Sanders, D. 1974. The Seabirds of Britain and Ireland. London: Collins.
Dias, M.P., Martin, R., Pearmain, E.J., Burfield, I.J., Small, C., Phillips, R.A., Yates, O., Lascelles, B., Borboroglu, P.G. and Croxall, J.P. 2019. Threats to seabirds: A global assessment. Biological Conservation, 237, 525–537. Available at: https://doi.org/10.1016/j.biocon.2019.06.033.
Furness, R.W., Wade, H.M. and Masden, E.A. 2013.Assessing vulnerability of marine bird populations to offshore wind farms. Journal of Environmental Management, 119, 56–66. Available at: https://doi.org/10.1016/j.jenvman.2013.01.025.
Akçakaya, H.R. and Sjögren-Gulve, P. 2000. Population viability analyses in conservation planning: An Overview. Ecological Bulletins, (48), 9–21.
Harris, M.P., Frederiksen, M. and Wanless, S. 2007. Within- and between-year variation in the juvenile survival of Common Guillemots Uria aalge. Ibis, 149, 472-481.
Harris, S.J., Baker, H., Balmer, D.E., Bolton, M., Burton, N.H.K., Caulfield, E., Clarke, J.A.E., Dunn, T.E., Evans, T.J., Hereward, H.R.F., Humphreys, E.M., Money, S. and O'Hanlon, N.J. 2024. Seabird Population Trends and Causes of Change: 1986–2023, the annual report of the Seabird Monitoring Programme. BTO Research Report 771. British Trust for Ornithology, Thetford.
IUCN Standards and Petitions Committee. 2024. Guidelines for Using the IUCN. Available at: https://www.iucnredlist.org/documents/RedListGuidelines.pdf.
Lopez, S.L., Bond, A.L., O’Hanlon, N.J., Wilson, J.M., Vitz, A., Mostello, C.S., Hamilton, F., Rail, J.F., Welch, L., Boettcher, R., Wilhelm, S.I., Anker-Nilssen, T., Daunt, F. and Masden, E. 2023. Global population and conservation status of the Great Black-backed Gull Larus marinus. Bird Conservation International, 33, e23. Available at: https://doi.org/10.1017/S0959270922000181.
Lopez, S.L., Daunt, F., Wilson, J., O'Hanlon, N.J., Searle, K.R., Bennett, S., Newell, M.A., Harris, M.P. and Masden, E., 2023. Quantifying the impacts of predation by Great Black-backed Gulls Larus marinus on an Atlantic Puffin Fratercula arctica population: Implications for conservation management and impact assessments. Marine Environmental Research, 188, 105994. Available at: https://doi.org/10.1016/j.marenvres.2023.105994.
Layton‐Matthews, K., Erikstad, K.E., Sandvik, H., Ballesteros, M., Hodges, K., Mesquita, M.D., Reiertsen, T.K., Yoccoz, N.G. and Bustnes, J.O., 2024. Path analysis reveals combined winter climate and pollution effects on the survival of a marine top predator. Journal of Animal Ecology, 93(9), 1351-1364.
Lloyd, C. S., Tasker, M.L. and Partridge, K. 1991. The status of seabirds in Britain and Ireland. T&AD Poyser, Calton.
Mitchell, P.I., Newton, S.F., Ratcliffe, N. and Dunn, T.E., 2004. Seabird populations of Britain and Ireland: results of the Seabird 2000 census. Poyser, London.
Monticelli, D., Ramos, J.A., Hines, J.E., Nichols, J.D. and Spendelow, J.A., 2008. Juvenile survival in a tropical population of roseate terns: interannual variation and effect of tick parasitism. Marine Ecology Progress Series, 365, 277–287. Available at: https://doi.org/10.3354/meps07508.
NatureScot. 2020a. Birds and licensing.
NatureScot. 2020b. Guidance - gull management.
NatureScot. 2024. New guidance to protect gull populations in serious decline. Available at: https://www.nature.scot/new-guidance-protect-gull-populations-serious-decline.
Ortiz, N.E. and Smith, G.R. 1994. Landfill sites, botulism and gulls. Epidemiology and Infection, 112(2), 385–391. Available at: https://doi.org/10.1017/S0950268800057794.
Rattiste, K. and Lilleleht, V. 1995. Survival rates of breeding common gulls in Estonia. Journal of Applied Statistics, 22(5–6), 1057–1062. Available at: https://doi.org/10.1080/02664769524801.
R Core Team. 2021. R: A language and environment for statistical computing. R Foundation for Statistical Computing, Vienna, Austria. URL https://www.R-project.org/.
IUCN. 2024. Red List Categories and Criteria. Version 16. Prepared by the Standards and Petitions
Rock, P. and Vaughan, I.P. 2013. Long-term estimates of adult survival rates of urban Herring Gulls Larus argentatus and Lesser Black-backed Gulls Larus fuscus. Ringing & Migration, 28(1), 21–29. Available at: https://doi.org/10.1080/03078698.2013.811179.
Sæther, B.-E. and Bakke, Ø. 2000. Avian life history variation and contribution of demographic traits to the population growth rate, Ecology, 81(3), 642–653. Available at: https://doi.org/10.1890/0012-9658(2000)081[0642:ALHVAC]2.0.CO;2.
Scopel, L.C. and Diamond, A.W. 2017. The case for lethal control of gulls on seabird colonies. The Journal of Wildlife Management, 81(4), 572–580. Available at: https://doi.org/10.1002/jwmg.21233.
Scottish Government. 2020. Sectoral Marine Plan for Offshore Wind Energy. Edinburgh, UK. ISBN: 978-1-80004-242-1
Stanbury, A.J., Burns, F., Aebischer, N.J., Baker, H., Balmer, D.E., Brown, A., Dunn, T., Lindley, P., Murphy, M., Noble, D.G. and Owens, R., 2024. The status of the UK’s breeding seabirds: an addendum to the fifth Birds of Conservation Concern in the United Kingdom, Channel Islands and Isle of Man and second IUCN Red List assessment of extinction risk for Great Britain. British Birds, 117, 471-487.
Tremlett, C.J., Cleasby, I.R., Bolton, M. and Wilson, L.J., 2025. Declines in UK breeding populations of seabird species of conservation concern following the outbreak of high pathogenicity avian influenza (HPAI) in 2021–2022. Bird Study, 1–18. Available at: https://doi.org/10.1080/00063657.2024.2438641.
Tyler, G., Pavat, D., Semple, M., Forster, J., Peden, W., Olley, O., Brown, P., Peters-Grundy, R., Thomson, R., Hall, R. and Baker, B. Review and update of seabird demographic rates for use in population modelling. Unpublished JNCC report, still in review.
Woodward, I.D., Austin, G.E., Balmer, D.E., Boersch-Supan, P., Irwin, C.G., Scott, M.S., Thaxter, C., Webb, A. & Burton, N.H.K. 2020. Improving methods for counting dispersed bird populations: Urban gull case study – Final Report. BTO, Thetford.
Young, J.C., Thompson, D.B., Moore, P., MacGugan, A., Watt, A. and Redpath, S.M., 2016. A conflict management tool for conservation agencies. Journal of Applied Ecology. 53(3), 705–711. Available at: https://doi.org/10.1111/1365-2664.12612.


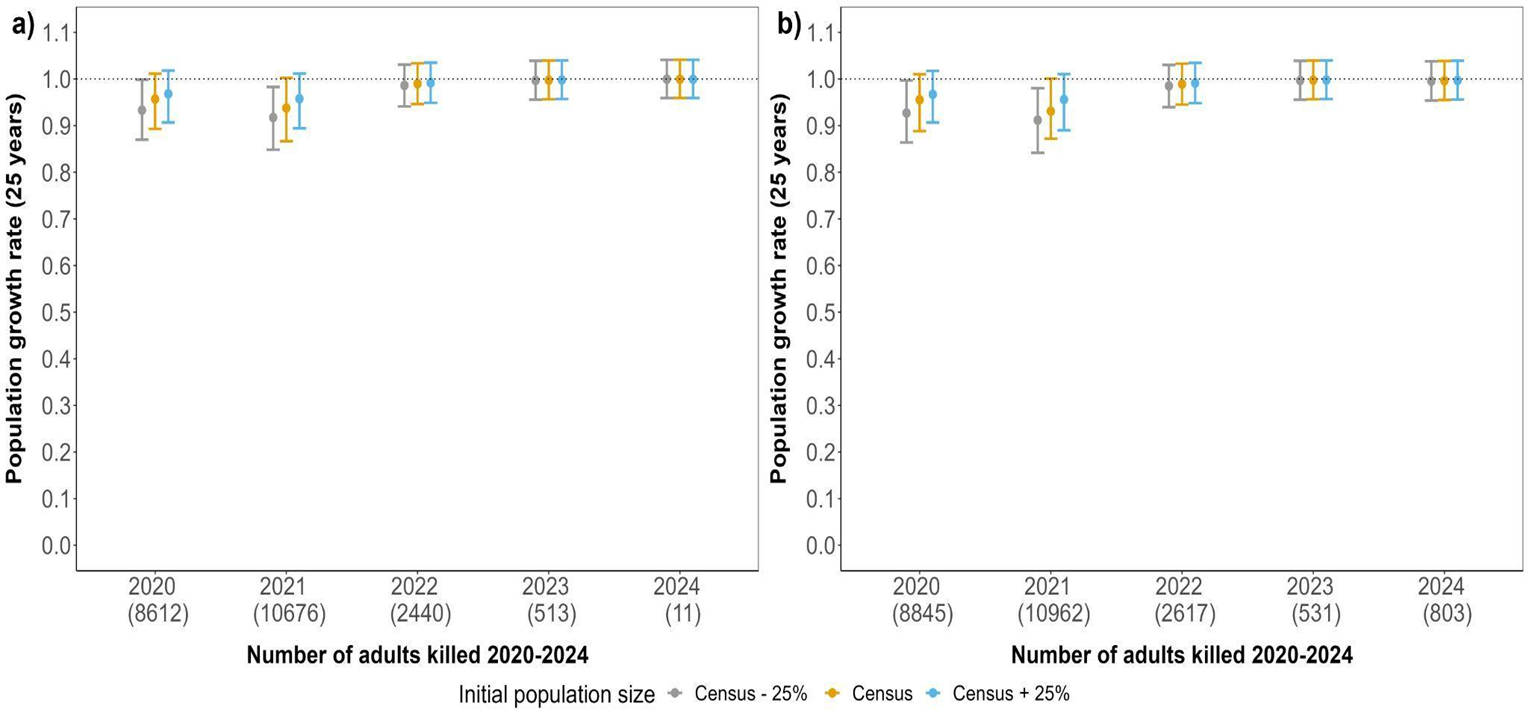
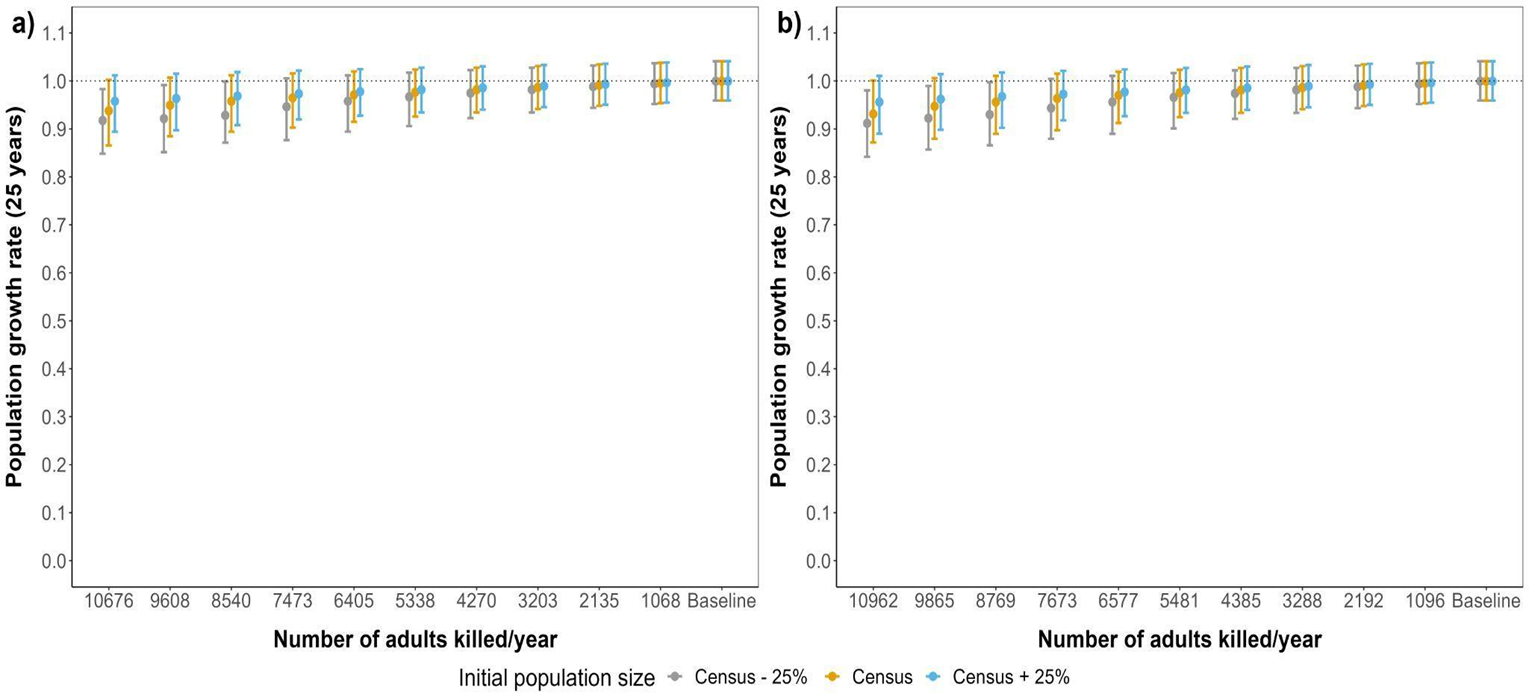
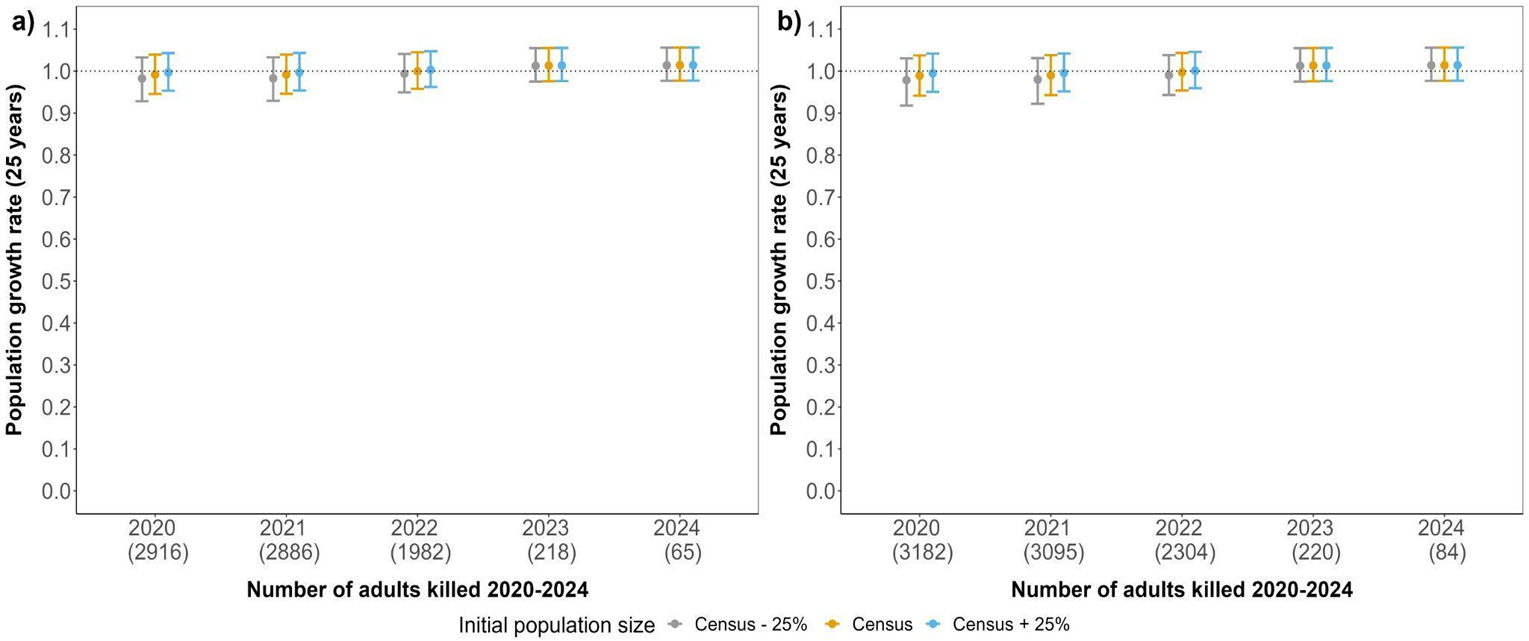
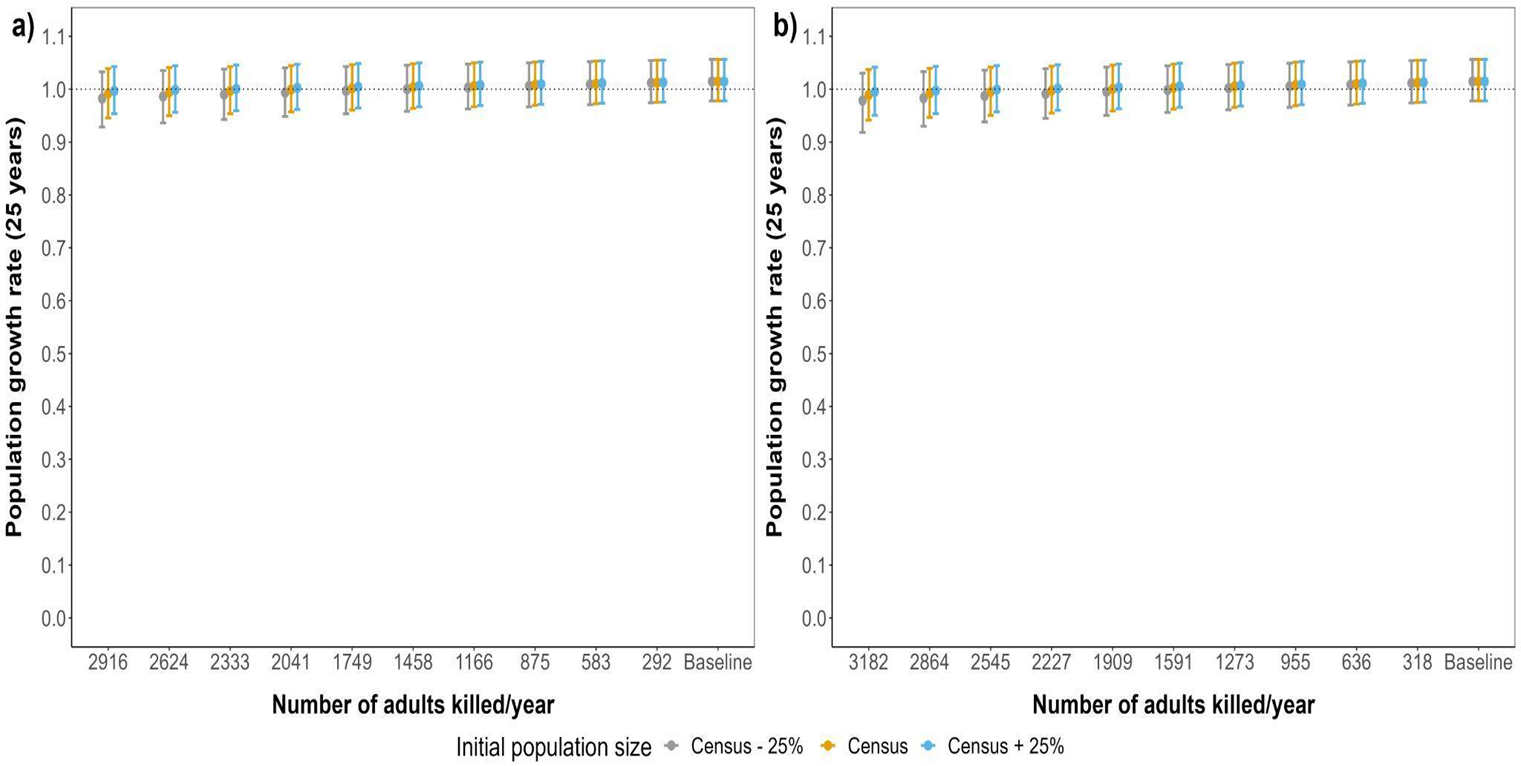
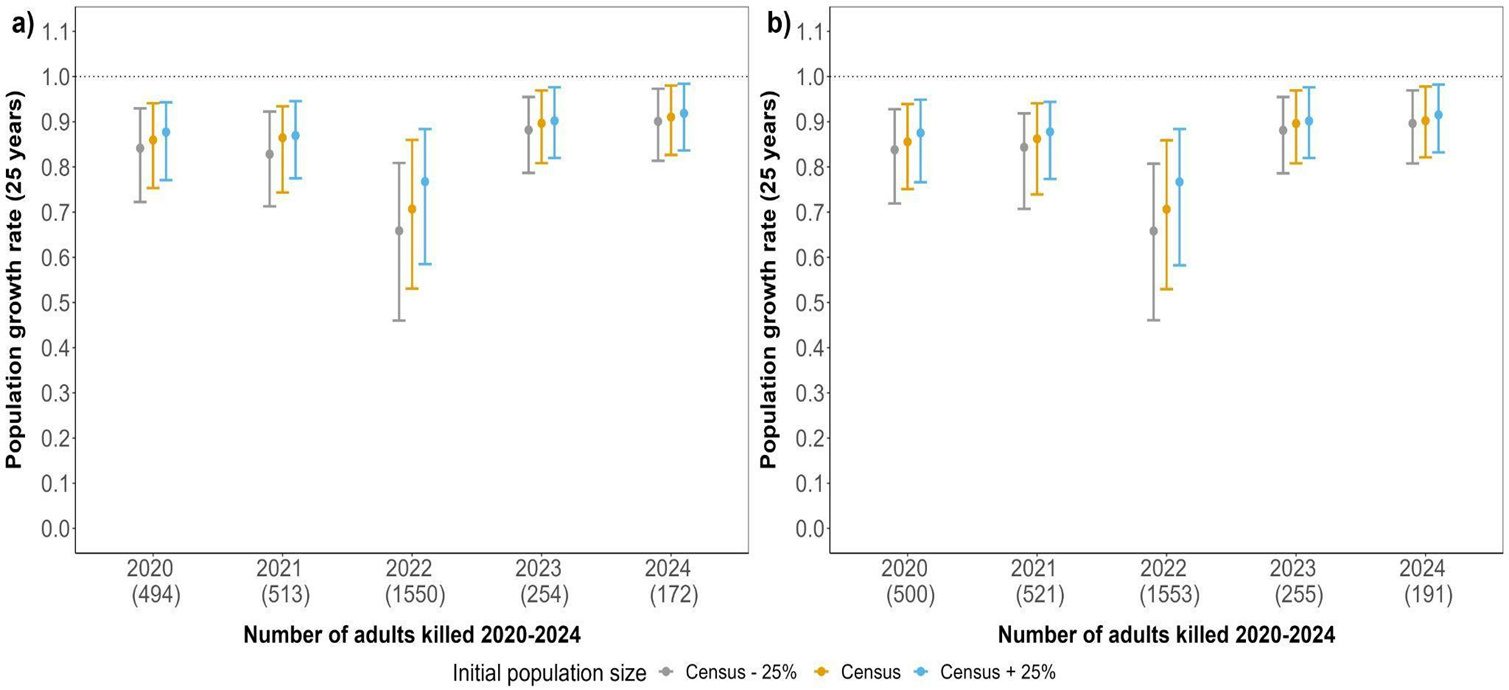
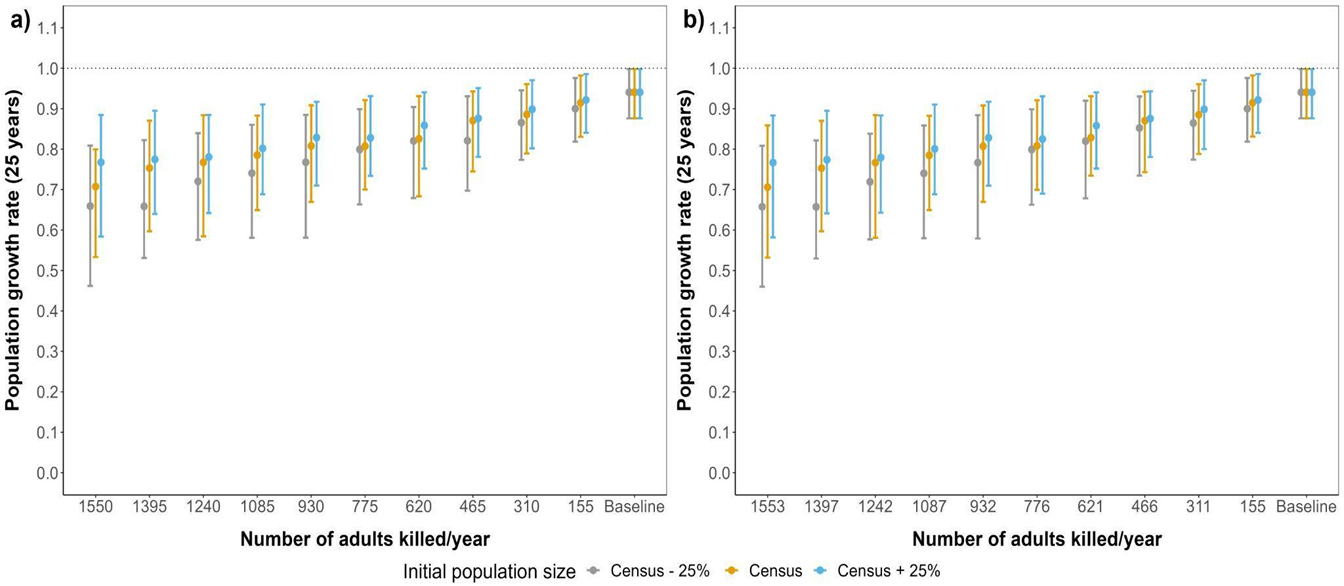
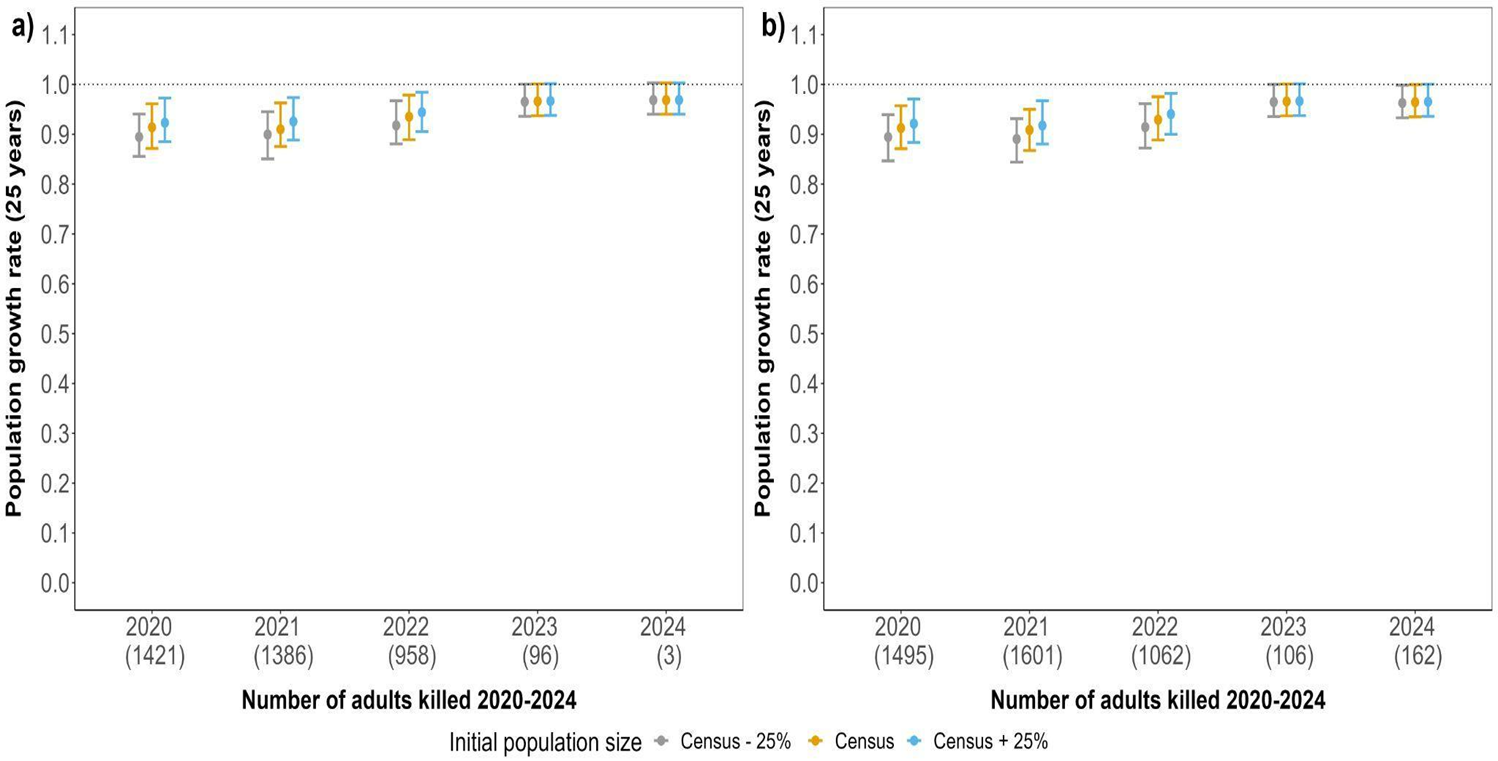
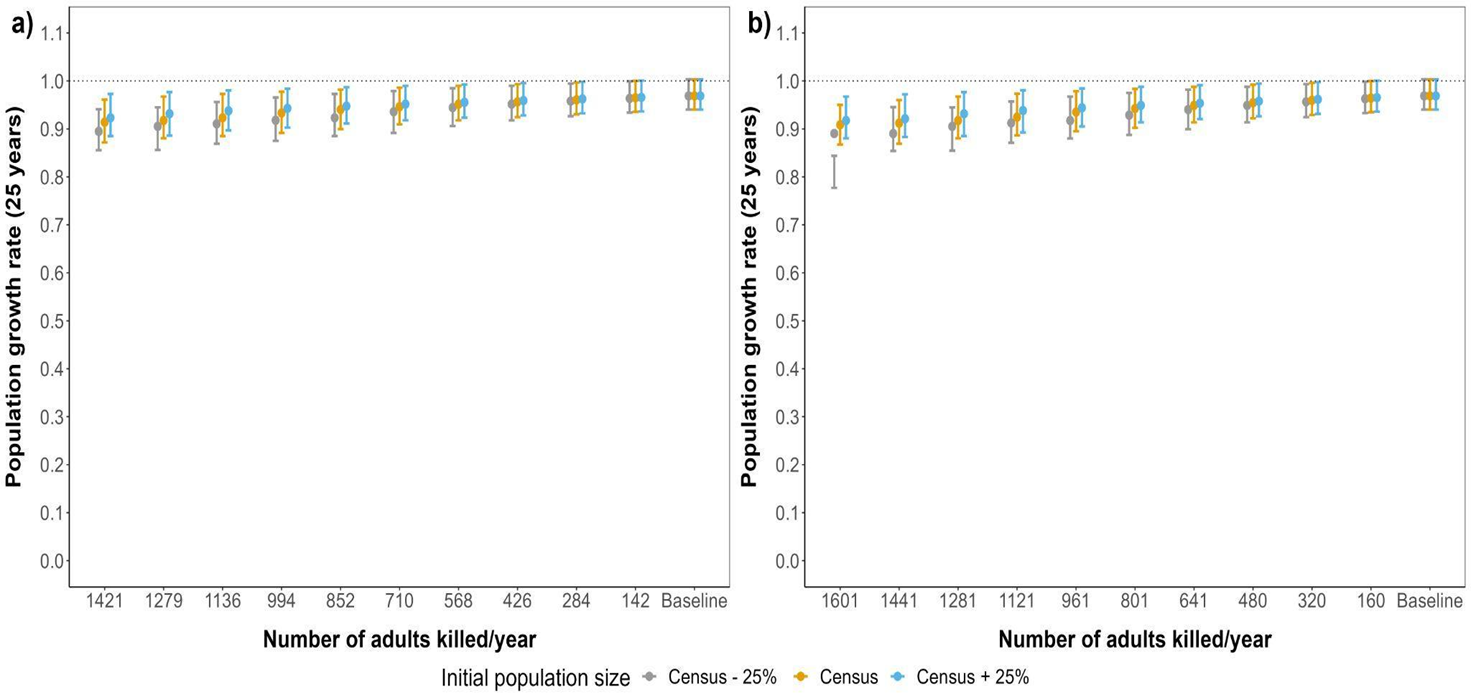
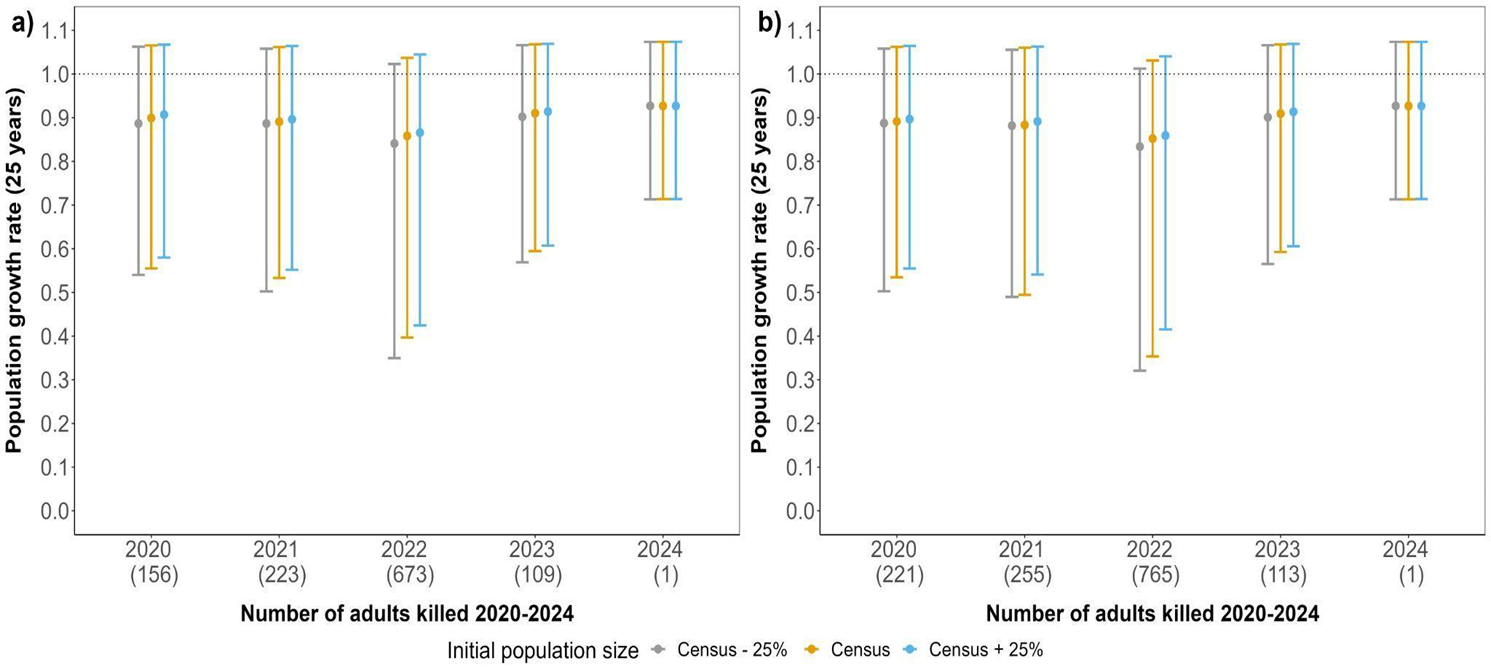
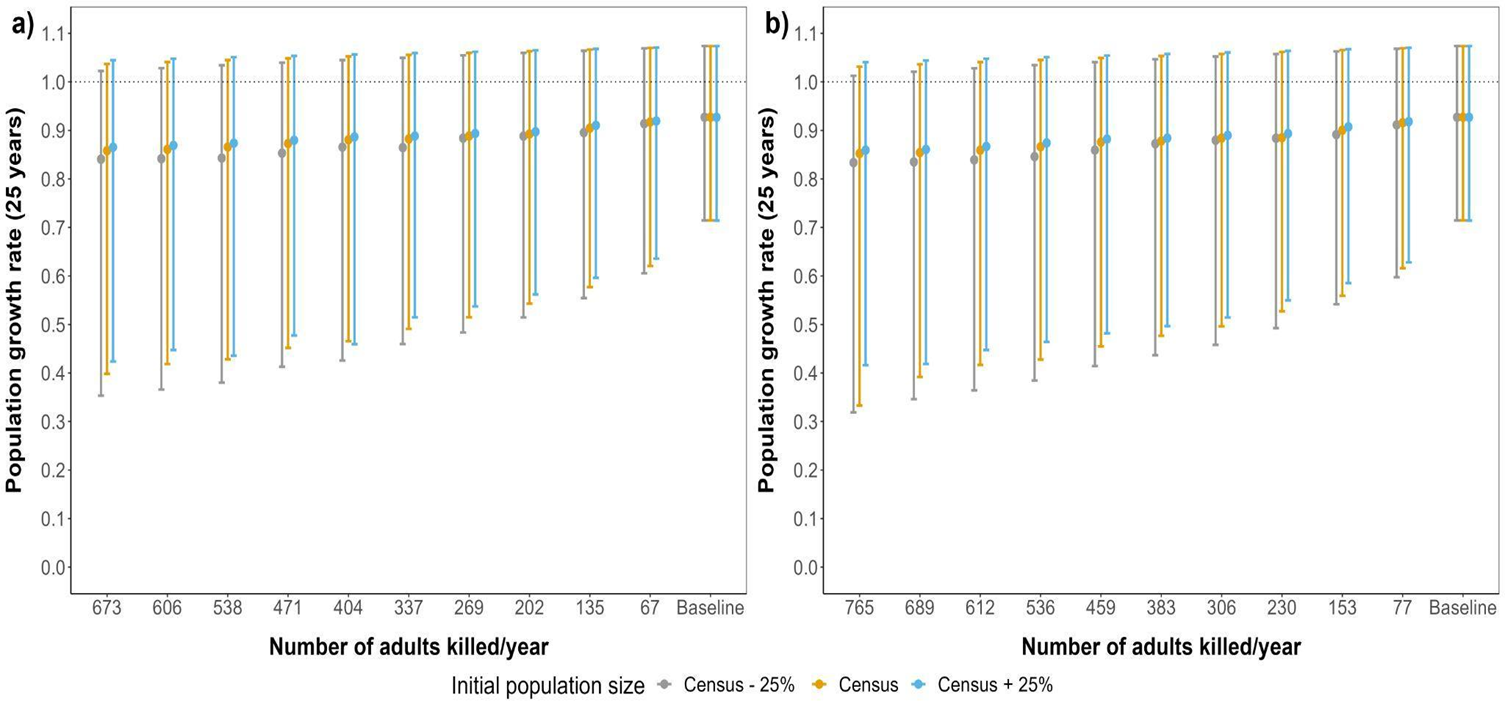