NatureScot Research Report 1421 - Aerial surveys of seals in Scotland during the harbour seal moult, 2021-2025
Published: 2026
Authors: Morris, C.D., Duck, C.D., Riddoch, N.G, Thompson, D. and Russell, D.J.F. (Sea Mammal Research Unit, University of St Andrews)
Cite as: Morris, C.D., Duck, C.D., Riddoch, N.G, Thompson, D. and Russell, D.J.F. (Sea Mammal Research Unit, University of St Andrews) Aerial surveys of seals in Scotland during the harbour seal moult, 2021-2025. NatureScot Research Report 1421.
Keywords
harbour seal; Phoca vitulina; grey seal; Halichoerus grypus; population monitoring; seal distribution; regional trends; Special Area of Conservation
Background
Scotland holds 20-25% of all harbour seals (Phoca vitulina) found in Europe. Information on population size and distribution of harbour seals in Scotland is vital to inform species conservation and management, as well as to fulfil various surveillance and reporting requirements set out in legislation.
The Sea Mammal Research Unit (SMRU) has been undertaking surveys of harbour seals in Scotland since the 1980s and currently aims to survey the entire Scottish coastline on a five-year cycle. Surveys are carried out during the August moult period, when the numbers of animals hauled out on shore are at their highest and provide a reliable index of harbour seal abundance. The seal count data can also be scaled-up to produce estimates of total harbour seal population. Grey seals (Halichoerus grypus) encountered during harbour seal moult surveys are also counted to provide information on their summer distribution.
Almost the entire Scottish coastline was surveyed by helicopter between 2021 and 2025 to provide the sixth full census of harbour seals in Scotland since the mid-1990s. This report presents these latest results in context of the long-term series of data and provides an updated assessment of abundance and trends in harbour seals at national, regional, and local scales.
Main findings
- The latest total counts for the whole of Scotland suggest that both harbour seal and grey seal numbers have declined since the last census in 2016-2019. During the most recent August surveys carried out in 2021-2025, 19,978 harbour seals and 16,042 grey seals were counted in Scotland. These are the lowest nation-wide totals ever recorded for both species since the first census in 1996/1997. Using estimated haul out probabilities from telemetry data to scale the most recent counts to total abundance produced estimates of approximately 27,750 (95% CI: 22,700-37,000) harbour seals and 63,800 (95% CI: 55,200-74,800) grey seals.
- Since the last census, harbour seals have declined in regions that had already seen the most dramatic declines during (Shetland) or since the early 2000s (North Coast & Orkney).
- Following significant increases in most parts of western Scotland in the 2010s, the latest harbour seal counts were 10-25% lower for all three western Seal Monitoring Units (SMUs) compared to the highest totals recorded in 2016-2019.
- For five of the seven SMUs, the latest harbour seal trend estimated was a significant decline, the exceptions being Southwest Scotland (non-significant decline) and Moray Firth (no trend), with the latter at a depleted level compared to the late 1990s.
- For all nine Special Areas of Conservation (SACs) for harbour seal in Scotland, the most recent count was, or was close to, the lowest in the time series.
- For grey seals, the low nation-wide total was mainly due to a very low count for Orkney in 2025.
- Continued seal population monitoring with comprehensive coverage is necessary to provide up-to-date abundance metrics and to reliably identify trends over time.
Acknowledgements
Helicopter surveys around the whole of Scotland were jointly funded by NatureScot and the UK Natural Environment Research Council (NERC; see below). Staff time as well as the fixed-wing surveys in the Moray Firth, the Tay and Eden Estuaries, and around offshore islands were funded by the NERC (National Capability National Public Good grants to SMRU: Grant no. NE/R015007/1 and NE/Y006194/1).
We are very grateful to PDG Aviation Services and their pilots and ground crew, engineers, and operations staff, who were all crucial in enabling us to conduct the surveys in a safe and efficient manner. Many thanks to Alex Ramsay and Jefferson Air Photography, as well as Bill Giles and Wooding Geospatial Solutions for their help with the Moray Firth, Firth of Tay, and offshore flights.
We are grateful to Rona Sinclair and Morven Carruthers at NatureScot for their support in management and administration of the survey agreement. Thanks to Sheila Gear (Foula Heritage Ranger Service) for providing ground counts for Foula in August 2025. Thanks to Craig Nisbet (National Trust for Scotland) for providing counts for St Kilda.
Abbreviations
Natural Environment Research Council (NERC)
Oslo-Paris Convention for the Protection of the Marine Environment of the North-East Atlantic (OSPAR)
Geographical Information System (GIS)
Special Committee on Seals (SCOS)
Special Area of Conservation (SAC)
Seal Management Area (SMA)
Seal Monitoring Unit (SMU)
Sea Mammal Research Unit (SMRU)
Site of Special Scientific Interest (SSSI)
Introduction
The Sea Mammal Research Unit’s seal count surveys play a central role in gathering knowledge on the size, distribution, and status of seal populations in the United Kingdom (UK). The Natural Environment Research Council (NERC) is obliged to submit such information to the UK and devolved governments under the Conservation of Seals Act 1970 and, for Scotland, the Marine (Scotland) Act 2010. The most recent advice is available from University of St Andrews Sea Mammal Research Unit webpage. The surveys also provide information required to satisfy surveillance and reporting obligations under the Habitats Directive (and Habitats Regulations as amended in Scotland), including in relation to the conservation status of seals within Special Areas of Conservation (SACs), as well as requirements to assess the status of the marine environment through OSPAR and under the UK Marine Strategy.
Estimates of seal abundance and population status rely on counts of animals that haul out on shore to rest, breed, or moult. Unlike grey seals, harbour seals do not congregate at breeding colonies. Newborn pups can swim from birth and often follow their mothers into the water. Therefore, harbour seal population monitoring surveys are commonly carried out during their annual moult period in August (Paterson et al., 2012; Thompson & Rothery, 1987), when the numbers of animals hauled-out during low tide periods are generally higher and less variable than at other times of the year (Thompson & Harwood, 1990). Counts obtained from these surveys represent an index of population size, as not all individuals are on shore at any one time. Lonergan et al. (2013) used satellite telemetry transmitters to estimate that 72% (95% CI: 54–88%) of all harbour seals are hauled out during the standard survey window. While land, boat, or drone surveys are suitable for monitoring seal numbers at specific haul-out sites or within relatively small areas, the most time- and cost-efficient method for covering larger areas is to carry out aerial photography surveys by plane or helicopter (Thompson & Harwood, 1990; SCOS, 2025).
The Sea Mammal Research Unit (SMRU) has been carrying out aerial surveys of harbour seals in Scotland since the late 1980s and currently aims to cover the entire Scottish coastline on a five-year cycle, with parts of the Moray Firth and the Firth of Tay & Eden Estuary usually being surveyed every year. The time series up to the previous survey round (2016-2019) showed striking differences in trends between regions. Northern and eastern regions of Scotland had seen significant declines in or since the early 2000s, with the most dramatic changes occurring around Orkney, Shetland, and in the Firth of Tay and Eden Estuary SAC. In contrast, harbour seal numbers in western regions had been either stable or increasing (Thompson et al., 2019; Morris et al., 2021).
Grey seals encountered during harbour seal moult surveys are also recorded and reported, providing useful information on their summer distribution. At this time of year, grey seal numbers at haul-outs can be more variable from day to day. Although UK grey seal abundance estimates have historically been based on a population model that uses pup production estimates obtained from surveys of grey seal breeding colonies (Russell et al., 2019; Thomas et al., 2019), the August counts provide independent estimates of the grey seal population size and are used in Potential Biological Removal (PBR) calculations. It is estimated that 25.15% (95% CI: 21.45 - 29.07) of grey seals are hauled out during the survey window (Russell and Carter 2021). As such the scalar from count to overall abundance for grey seals is much higher at around 4 compared to harbour seals (~1.4).
During the introduction of the Marine (Scotland) Act 2010, the Scottish coast was divided into seven Seal Management Areas (SMAs), which are used for reporting numbers of seals counted and for calculating PBR values at a regional level. The largest SMA, West Scotland, was split into three subdivisions, and North Coast & Orkney was split into two subdivisions (Figure 1). These Scottish SMAs are equivalent to UK Seal Monitoring Units (SMUs) in Scotland, commonly used for reporting seal haul-out counts and population trends at a UK level. To reduce the potential for confusion when comparing to other publications, we will be referring to Seal Monitoring Units in this report. The SMUs were divided into smaller Subunits, generally containing several tens of kilometres of coastline, to facilitate the analyses of abundance and distributional changes at a more local scale (Figure 2).
This report presents the results from the most recent series of aerial surveys carried out around the whole of Scotland, from 2021 to 2025, in the context of previous findings at a national, regional, and local level. These data represent the sixth full Scotland census of harbour seals obtained over the last 30 years. Ethical approval for this study was given by the University of St Andrews School of Biology Ethics Committee (approval numbers: SEC21032 and BL17766).
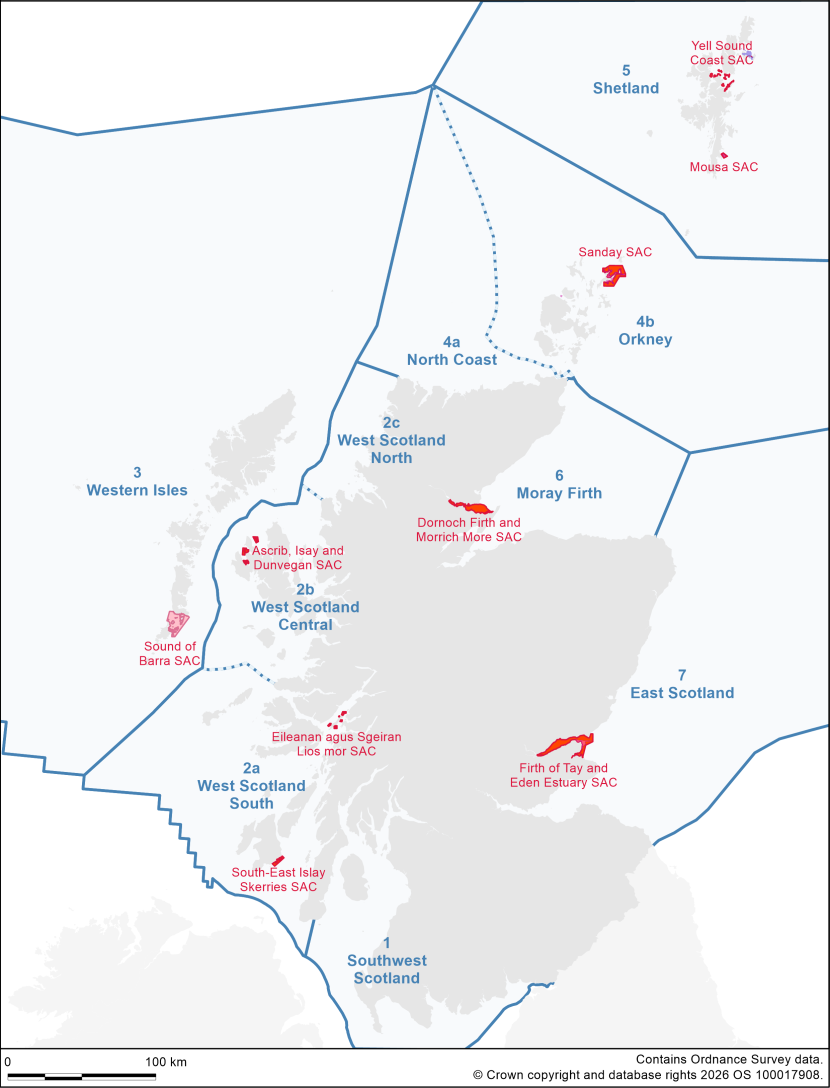
Figure 1. Map showing the seven Seal Monitoring Units (SMUs) in Scotland as well as the nine Special Areas of Conservation (SACs) for which Phoca vitulina is either a primary reason for site selection or a qualifying feature.
Click for a full description
Map of Scotland with Seal Monitoring Units (SMUs) delineated in blue (Subdivision lines for SMUs 2 and 4 are also shown):
1. Southwest Scotland
2a. West Scotland - South
2b. West Scotland - Central
2c. West Scotland - North
3. Western Isles
4a. North Coast
4b. Orkney
5. Shetland
6. Moray Firth
7. East Scotland
The boundaries of nine Special Areas of Conservation (SACs) designated for harbour seals are shown in red:
South-East Islay Skerries SAC
Eileanan agus Sgeiran Lios mor SAC
Ascrib, Isay and Dunvegan SAC
Sound of Barra SAC
Sanday SAC
Mousa SAC
Yell Sound Coast SAC
Dornoch Firth and Morrich More SAC
Firth of Tay and Eden Estuary SAC
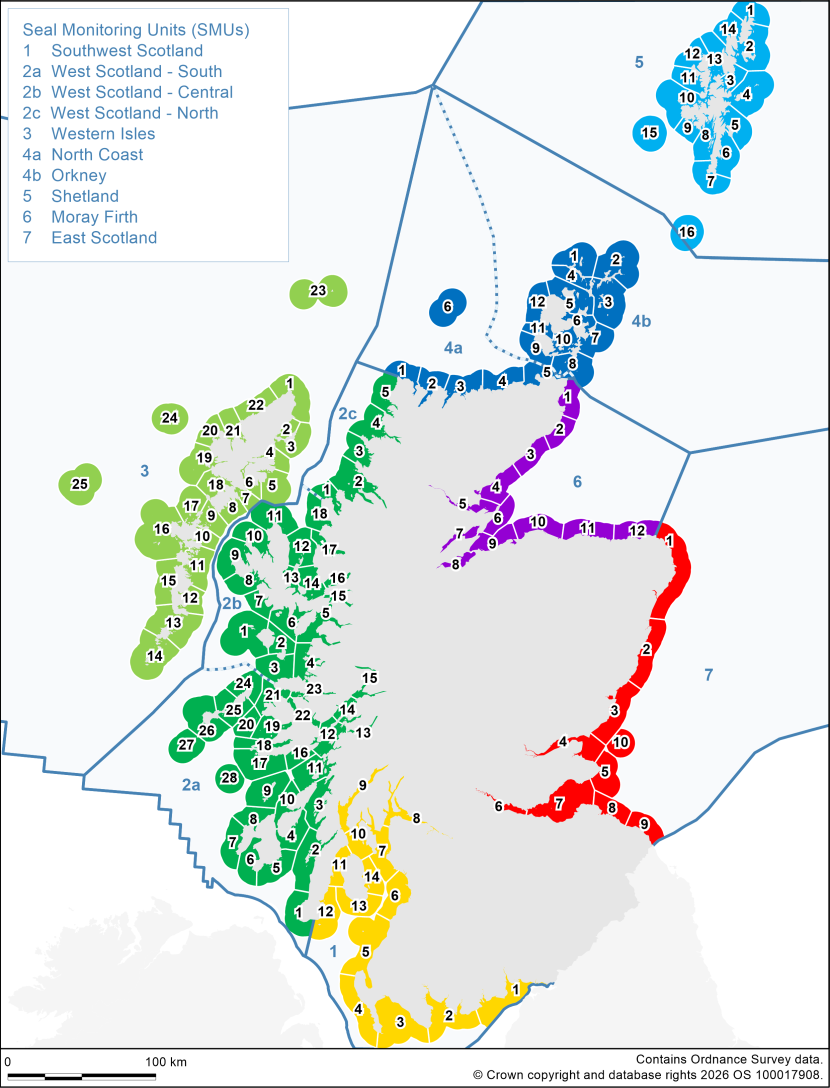
Figure 2. Map showing Subunits within Seal Monitoring Units and subdivisions. These are used to investigate regional differences and changes within the SMUs.
Click for a full description
Map of Scotland showing seal management areas split into smaller geographic sub-units. Seal management areas are delineated in the following colours:
1. Southwest Scotland - yellow
2a,b,c. West Scotland - dark green
3. Western Isles - light green
4a,b. North Coast and Orkney - dark blue
5. Shetland - light blue
6. Moray Firth - purple
7. East Scotland - red
Sub-units within each seal management area are numbered from 1 up to a maximum of 28.
Methods
Survey methods
All surveys were limited to the August harbour seal moult period and followed the standard SMRU protocol. Survey windows were restricted to periods within two hours either side of low water occurring between approximately 12:00 and 19:00, when haul-out numbers are considered to be relatively high and consistent (Thompson and Harwood, 1990; Russell et al., 2015; Russell and Carter 2021). The time-of-day rule needs to be relaxed occasionally to enable the surveying of haul-out sites that lie within restricted military Danger Areas, such as the outer parts of the Dornoch Firth and Morrich More SAC in the Moray Firth.
No flights were carried out during or following periods of heavy or prolonged rain, as very wet weather can affect the number of seals hauling out (Grellier et al., 1996). Standard survey altitude was around 200-300m, which is usually sufficiently high to avoid significant disturbance of seals and other wildlife. High-resolution photographs were taken of all seals seen on shore. Cameras were either connected to a GPS unit directly producing geo-tagged imagery (during helicopter surveys) or time-synced to two Garmin Foretrex 401 units that recorded detailed tracks of all flights (during fixed-wing surveys).
One of the challenges in planning intertidal surveys across large areas is making sure that all surveys are carried out within the survey windows available at different locations. Local low water times for over 160 locations around Scotland were extracted from POLTIPS (National Oceanographic Centre, Natural Environment Research Council) to create a calendar highlighting potential survey days for all areas. Flight times recorded during previous surveys were used to estimate expected survey duration for different parts of the coast. A provisional flight schedule was put together to minimise transect flights required before, during, and after survey sessions. This was continually adapted based on survey progress, expected weather conditions, and aircraft availability.
Distant offshore islands were not surveyed during the helicopter surveys, due to the high cost and relatively low numbers, or absence of, harbour seals. To obtain comprehensive information on grey seal distribution in August, an effort was made to survey most of them by fixed-wing aircraft. We do not conduct aerial surveys of St Kilda or Fair Isle due to their remote locations. However, in 2019, an opportunistic survey of Fair Isle was conducted while transiting from Orkney to Shetland by helicopter. Although an attempt was also made in 2025, the weather was very poor.
Helicopter thermal-imaging surveys
Scotland’s highly intricate coastline is over 18,000 km long, including over 800 islands (Baxter et al., 2011). Seals are found in almost all Scottish coastal areas, and for most of the coast (with the exception of some sandy estuaries on the east coast), the only method currently available, to search the coast in an efficient manor, is by helicopter using a thermal imager. All SMRU helicopter surveys were carried out with a Eurocopter AS350 Squirrel aircraft. The standard survey altitude was around 300m or lower and the aircraft generally remained a few hundred meters offshore where possible. Flying speed was over 100 kts when scanning straight sections of coastline, but this was reduced significantly when surveying more complex shorelines or areas with high concentrations of seals.
Rocky shores make up the vast majority of Scotland’s intertidal areas, and seals are often well camouflaged when lying on rocks or seaweed. Infrared (IR) sensors are essential for effectively finding and counting the seals in this environment; indeed, without such sensors, large numbers of seals would be missed. IR cameras use heat radiation to produce a thermal image, enabling the detection of warm bodies on a cooler background (Figure 3). Since 2016, SMRU has been using the multi-sensor camera gimbal SWE-400 by Trakka Systems, which has an integrated mapping and data recording system (Figure 4). The gyro-stabilised gimbal contains a thermal imaging video camera, a high-definition colour video camera, a Nikon D810 photo camera fitted with a 300mm lens, and a laser range finder. High-resolution photographs are taken of all seals detected with the thermal image. Time stamps and GPS coordinates are saved with all video and still image data. Breadcrumbs of the flight track and polygons of the areas covered by the sensors’ field of view (FoV) are saved in a metadata file.
Prior to 2016, a Barr and Stroud IR18 Thermal Imager was manually operated through the side door of the helicopter with the windowpane removed. Paper maps were used to record times and locations of seal sightings. Counts were originally conducted using just the thermal video recording, and the number of individuals in large groups of grey seals were estimated rather than counted in detail. From 2006, a hand-held digital single-lens reflex (DSLR) camera was used to take oblique photographs of sightings. This made counts of large groups more accurate and improved species identification. An overview of changes in the methods used during helicopter surveys is given in Table 1.
| Years | Finding seals | Identifying species | Counting animals | Locating site |
|---|---|---|---|---|
| 1988-2005 | Live video image from hand-operated thermal imager (IR-18 through open side-window) | Thermal image video (few film photographs) | Thermal image video (few film photographs) | Marked paper maps, true colour video |
| 2006-2009 | Live video image from hand-operated thermal imager (IR-18 through open side-window) | Hand-held digital photographs (8/10MP; 70-300mm lens) if available | Thermal image video & hand-held digital photographs (8/10MP; 70-300mm lens) | Marked paper maps, true colour video |
| 2010-2015 | Live video image from hand-operated thermal imager (IR-18 through open side-window) | Hand-held digital photographs (8/10MP; 70-300mm lens) if available | Thermal image video & hand-held digital photographs (8/10MP; 70-300mm lens) | GPS flight tracks, marked paper maps, true colour video |
| 2016-2025 | Live video image from thermal imager in gyro-stabilised SWE400 gimbal | Digital photographs taken with 38MP camera (300mm lens) in SWE400 | Thermal image video, digital photographs recorded with SWE400 | Geo-tagged imagery |
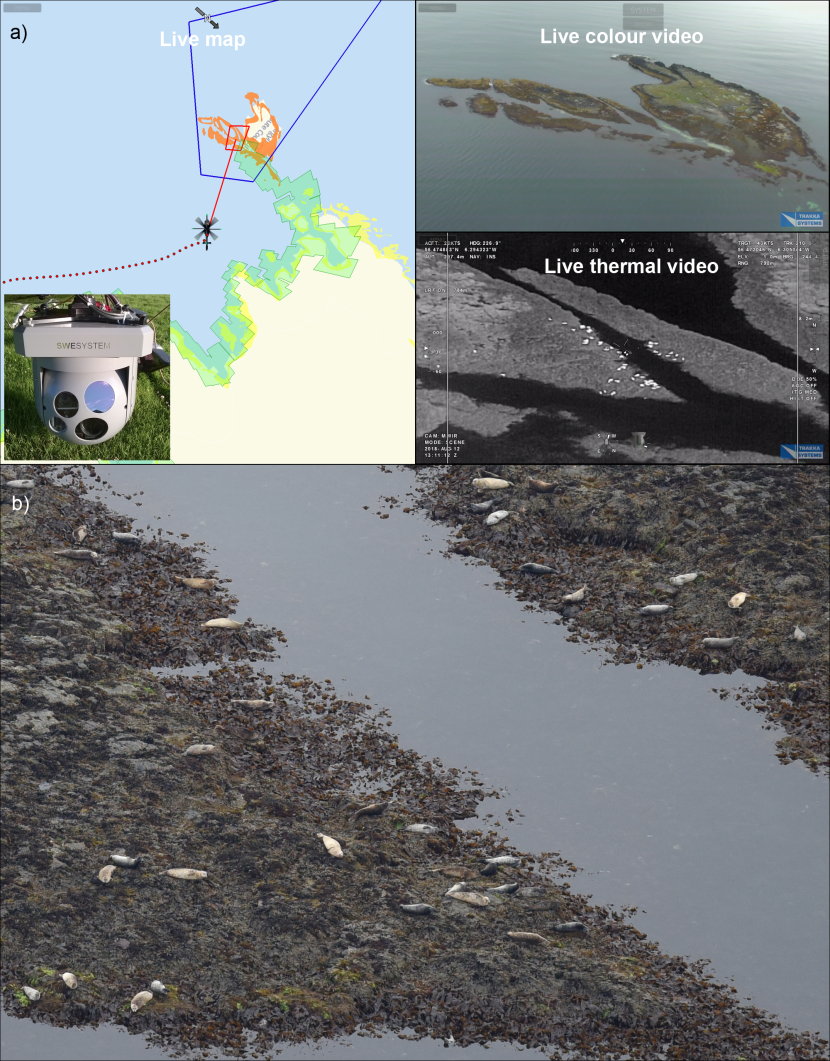
Figure 3. Examples of cropped digital still photographs with insets showing the same scene recorded by the thermal imaging camera.
Click for a full description
Images of seals on rocks. Seals are difficult to distinguish amongst rock and seaweed in the digital images, whereas they show up white against a dark background in the thermal images.
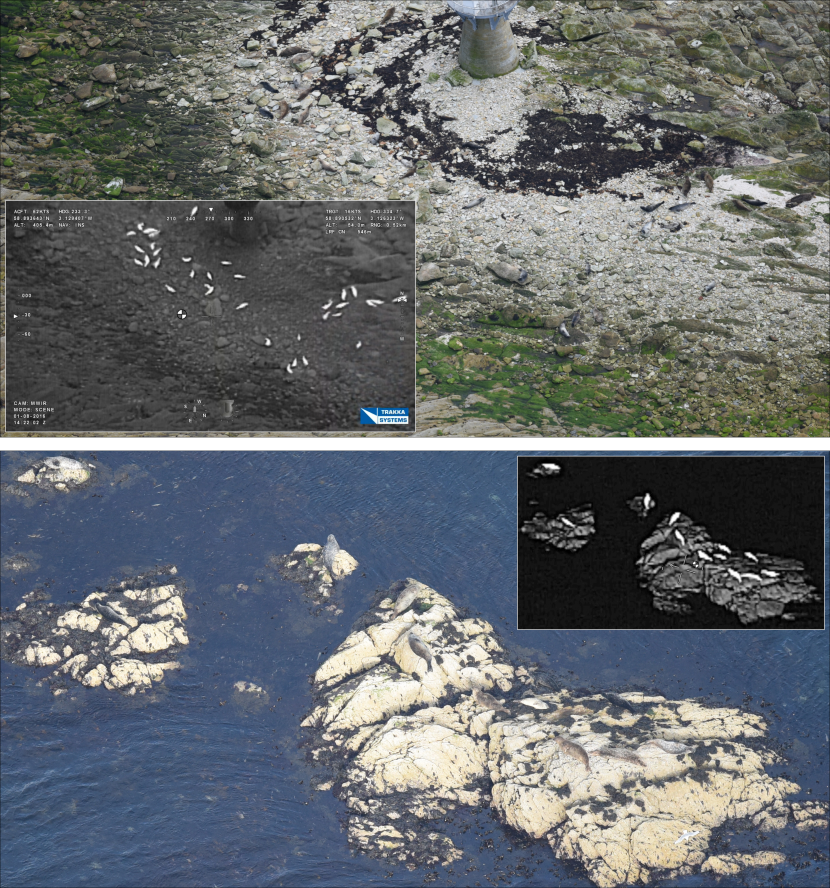
Figure 4. a) Screenshot of the TrakkaMap TM-100 software window and an inset showing the multi-sensor gimbal SWE-400. b) Cropped high-resolution photograph taken at the same time from around 800m away.
Click for a full description
Example of the live mapping software used during surveys, which provides the flight track and field of view of the thermal and digital videos. Insets show examples of the live colour video and the live thermal video, as well as a high resolution image of seals on rocks taken in the same location.
a) Screenshot of the TrakkaMap TM-100 software window and an inset showing the multi-sensor gimbal SWE-400. The live map (left) shows the flight track (red dots), the live footprints of the video sensors (blue polygon = colour video; red polygon = thermal video), and the areas already searched with the thermal image (semi-transparent green areas). The white spots near the centre of the thermal video are seals.
b) Cropped high-resolution photograph taken at the same time from a distance of ca. 800m. The cropped area represents <10% of the full image, and has been reduced in size to ca. 30%.
Fixed-wing surveys of sandy estuaries and offshore islands
The eastern Scotland SMUs encompass sandy haulouts for which a thermal imager is not required to detect the seals. Thus, for some parts of these SMUs, particularly between Helmsdale and Findhorn and in the Firth of Tay and Eden Estuary SAC, surveys are typically conducted by fixed-wing aircraft (usually a Cessna 172) using hand-held photography. Surveys are carried out at an altitude of around 200m. Standard flying speeds vary between 70-100kts depending on aircraft type and wind conditions. A DSLR camera fitted with a 70-300mm zoom lens is used to take images of all seals encountered.
Land-based surveys
To maximise consistency, and the area covered within a synoptic survey, where possible only data from the aerial surveys described above are used in the time series. However, for sites rarely surveyed, ground-counts are used to augment the dataset. The National Trust for Scotland obtained and shared ground counts for Hirta, the main island of St Kilda, in August 2024. In August 2025, the Foula Heritage Ranger Service was able to ground count haulout sites used by harbour seals on the eastern side of Foula which wasn’t covered by the helicopter survey that year.
Data analysis
Counting and mapping
Flight tracks and image locations from all aerial surveys were added to a GIS map. For the helicopter surveys, the video recordings were reviewed using the TM-100 software’s playback function, to ensure that no seal groups were missed (i.e. not photographed) during the survey. The high-resolution photographs were scrutinised in conjunction with the thermal video to obtain precise counts of harbour seals and grey seals. Hand-held photographs taken during the fixed-wing surveys are usually not as sharp as photographs taken with the gyro-stabilised helicopter gimbal (mainly due to motion blur), but the image quality is generally good enough to distinguish between the two species with high confidence. All seals visible on the imagery were counted using DotDotGoose software (Ersts, 2024). Counts of seal haulout groups were placed on a GIS map as accurately as possible using all the available imagery.
Data presentation
The census totals were calculated by combining the most recent survey data available within each census period. The most recent survey coverage for the 2021-2025 census is shown in Figure 5. The census counts are presented in Tables 2 & 6 showing totals by SMU (subdivision). The maps in Figures 6 & 10 show the Scotland-wide distribution of the most recent counts for both species aggregated by 10 km x 10 km gride cells.
At the SMU Subunit level (generally far less than 100 km of coastline), the time series mostly consists of counts pertaining to a single year. However, even at this local scale, it is not always possible to cover the entire Subunit during a given survey year. Figures showing the time series of counts for trend-areas (following Morris et al., 2021) are shown for each SMU.
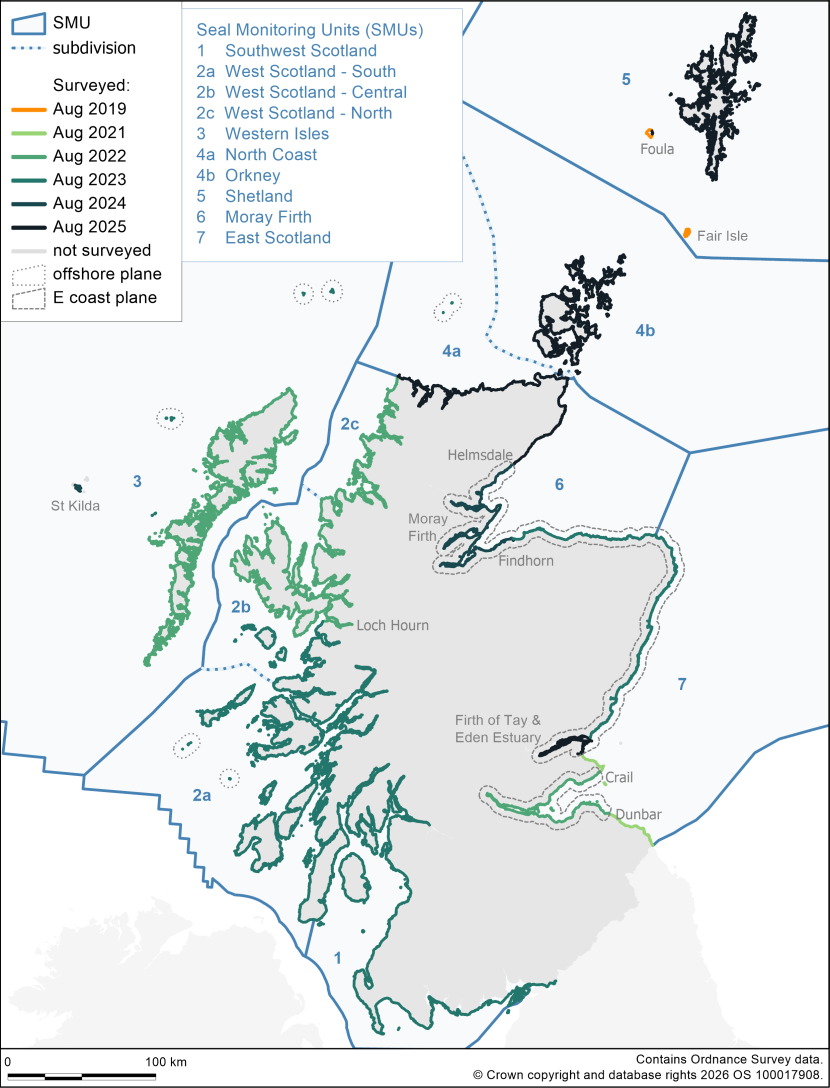
Figure 5. Map showing when the most recent surveys were carried out during the harbour seal moult in August. Most areas were surveyed by helicopter. Dotted buffer areas indicate the coasts most recently surveyed by plane.
Click for a full description
Land-based counts were conducted on St Kilda in 2024 (National Trust for Scotland) and on the east coast of Foula in 2025 (Foula Heritage).
Map of Scotland with coastline coloured in different shades of green to indicate when surveys were last undertaken. Two land-based surveys are included covering East Foula in 2025 and St Kilda in 2024. Remote offshore islands and most of the coast on the east coast between Helmsdale and Dunbar was last surveyed by plane. All other areas were surveyed by helicopter. The north coast, Orkney, Shetland, the Caithness coast from Duncansby Head to Helmsdale, and the Firth of Tay and Eden Estuary SAC were last surveyed in August 2025. The Inner Moray Firth was last surveyed in 2024. The southern half of the west coast between the English border and Loch Hourn, the east coast section between Findhorn and Carnoustie, and several remote offshore islands were last surveyed in 2023. The northern half of the west coast between Loch Hourn and Cape Wrath, the Western Isles, and the Firth of Forth from Crail and Dunbar were last surveyed in 2022. Small section on the east coast, between St Andrews and Crail in Fife and between Dunbar and the English border, were last surveyed in 2021. Fair Isle and West Foula were last surveyed in 2019.
Trend Analyses
To visualise and quantitively assess changes through time, analyses of the time series of counts (from 1989) was conducted on a SMU-level and, for SMU 2, on a subdivision level. For harbour seals, the analyses were repeated on an SAC-level. Note grey seals are often features of SACs on the basis of their abundance during the breeding season, and thus trends in August grey seal counts at SACs are not considered here. All analyses were conducted in R (R Core Team 2023) following methods used in Russell et al. (2025) except where otherwise stated. As such, the results replicate those presented in SCOS 2025 for SMUs 1-3. For SMUs 4-7, the analyses in this report incorporated additional data to that available for SCOS 2025.
Where possible, surveys of focal areas (SMUs, Subdivisions, SACs) were completed in a single year. However, in some cases surveys of areas were necessarily conducted over multiple years; the resulting count was assigned to the year that encompassed the majority of the total (focal year). For the trend analyses, counts from repeated surveys (including within a single census period) were used but the re-use of data from single surveys (e.g. less frequently surveyed subsets of SMUs) was avoided whenever possible. As such the latest count used in the trend analyses (Table 3) will not necessarily match the 2021-2025 census count in Table 2. Indeed, in SMUs for which a large majority is surveyed more regularly than the SMU as a whole, the trend analyses will be based on that majority (hereafter proxy) instead of, or as well as, the SMU as a whole. The relationship between the SMU and proxy counts in years when the whole area was surveyed can be used to assess how representative the proxy trends are likely to be of the SMU trends.
The West Scotland SMU is typically surveyed over multiple years; most recently 2022 (northern subdivision and part of central) and 2023 (southern subdivision and rest of central). For both species, at the SMU level, the majority of seals were counted in 2023 (56% for harbour seals, and 74% for grey seals). However, due to their differing distributions within the SMU, for the central subdivision the focal year differed between the species (2022 for harbour seals and 2023 for grey seals).
Counts were modelled as a function of year assuming negative binomial errors broadly following methods described in Thompson et al. (2019). For some SMUs, the limited number of data points resulted in problems estimating the theta parameter for the negative binomial distribution. In these cases, a Poisson distribution was assumed. For all datasets, at least three models were fitted: an intercept‐only GLM (null model; i.e. no trend), an exponential (linear on the link scale) year effect within a GLM, and a nonlinear smooth year effect within a GAM (restricted to 5 knots). Limited flexibility for the smooths represented a pragmatic approach aimed to estimate trends on the appropriate temporal scale. Model selection was conducted using AIC; the simplest model within Δ2 AIC of the lowest AIC was selected.
A survey of North Coast & Orkney (SMU4) was started in 2024 before being postponed (to 2025) due to equipment failure. As such, for a subset of Orkney (North-Outer trend-area, as well as the majority of North-Inner), counts were available for both 2024 and 2025. This subset of Orkney (the above trend-areas, excluding subunit 12 and Shapinsay (parts of subunit 5&6)) was also modelled separately for the whole time series excluding 2024. The count for 2024 was then overlaid onto the predicted trend to provide a point of comparison to the 2025 count (which was particularly low for grey seals).
Scotland-wide trends were generated by summing the mean predictions across SMUs. To generate appropriate confidence intervals, the parametric bootstraps (1000) were summed across all SMUs, and the 95% confidence intervals extracted.
For both species, the latest annual rate of change (i.e. leading up to the latest survey year) and change from the highest to latest estimate was generated for Scotland as a whole. For harbour seals, these changes were also estimated at the SMU and SAC level. Confidence intervals around these estimates were generated via parametric bootstrapping. At the SMU/SAC level, predictions were made for the temporal extent of the time series, and Scotland-wide predictions were only made in years for which predictions could be made for all SMUs.
Harbour seal specific models
There were declines in North Coast & Orkney, Shetland, and Moray Firth SMUs during multi-year gaps in surveys that spanned 2002, and indications of changes in trend around 2002 in East Scotland SMUs. Because of the unknown nature of these declines, additional models have previously been fitted for these SMUs (Russell et al., 2025). Specifically, additional models were fitted for SMUs 4-7 that allowed any combination of stable/exponential trends prior to and following 2002 (including the same trend across the time series) with a step change associated with 2002. If < 4 data points were available prior to 2002, only an intercept was offered to this period.
In this report, step change models from Russell et al. (2025) were used rather than those models being subject to selection. Instead, the period following the step change was subject to selection comparing a stable (i.e. no trend); an exponential (linear on the link scale), and a nonlinear smooth year effect within a GAM (restricted to 3 knots for Shetland due to the limited sample size). Note that a step change was still offered (and subject to selection) for SMUs/SACs for which it had not been selected previously.
For SMUs 1-3, additional analyses were conducted as in Russell et al. (2025). West Scotland is the largest SMU both in terms of geography (coastline) and proportion of the Scottish total of harbour seals and is thus split into three subdivisions (2a-2c: South, Central, and North). Visual inspection of the data for the SMUs and subdivisions indicated similar patterns across western Scotland. Following exploratory analyses (see Russell et al., 2025), the subdivisions of SMU 2 (but not SMU 2 as a whole), and SMU 3 (hereafter regions) were fitted in a single model. Specifically, the count was modelled as a function of region, a global smooth of year, and a region-specific smooth of year. By including a global smooth across regions, there was increased power to detect a trend, with the region-level smoother allowing the region-specific patterns to also be represented. This model had the advantage of the SMU 2 subdivisions being used to predict the overall SMU trend (rather than fitting the overall SMU trend separately) which minimised the masking of trends (by combining across subdivisions) and the use of data across multiple survey years being assigned to a single year.
Results
Harbour seals in Scotland
Based on data collected during the most recent surveys from August 2021-2025, the total number of harbour seals counted in Scotland was 19,978. This is the lowest total of the six nation-wide censuses conducted over the last 30 years. It is over 25% lower than the previous census in 2016-2019 and is 2% lower than the total recorded in 2007-2009, which was previously the lowest total count for Scotland (Table 2). The August seal counts can be used as an index of total population size and are generally reported without converting them into absolute abundance estimates. In 2013, Lonergan et al. used ARGOS telemetry data from flipper tags to estimate the mean proportion of the population hauled out during the standard survey window (i.e. available to count). Using their results (0.72; 95% CI: 0.54-0.88) together with the latest count data produces a total population estimate for Scotland of approximately 27,750 (95% CI: 22,700-37000) harbour seals. The Scotland-wide distribution of harbour seals, based on the newest August census data, is mapped by 10x10km grid cells in Figure 6. The distribution maps for the five previous census periods are shown in Figures A1-A5.
SMU and Scotland-wide trends in harbour seal counts collected over the last 30-35 years were estimated (Figure 7). The first year for which trends could be estimated for all SMUs, and thus Scotland as a whole, was 1997 (and the last 2022). For SMUs for which there was a step change in abundance during a multi-year gap in surveys, no predictions were made during that gap. As such, prior to 2006, 1997 was the only year for which predictions could be estimated for all SMUs or a proxy thereof In reality, 1997 likely represented the time associated with the highest harbour seal abundance in Scotland in the last 35 years; indeed 1996/1997 was the highest Scotland count of the time series of composite counts (Table 2). The predicted count in 2022 was less than three quarters of that in 1997; -27.8% (95% CIs: -34.3, -20.4). The current estimated trend for harbour seals in Scotland (2022) was -5.2% per annum (95% CIs: -6.9, -3.3).
The differing trajectories across SMUs have led to significant changes in the relative holdings of SMUs (Figure 8). In terms of relative abundance, the three SMUs in Western Scotland combined have grown from holding 42% of the Scotland total in 1996/1997 to holding 82% in 2021-2025. Whereas the two northern SMUs combined held 50% of all Scottish harbour seals in 1996/1997, this proportion has shrunk to 13% over time. Figure 9 shows a map for each of the six census periods, with SMU Subunits coloured by the total number of harbour seals counted. Some of the smaller scale changes in distribution and/or in the number of harbour seals within SMUs can be identified by comparing these maps.
| Seal Monitoring Unit (subdivision) | 1996-1997 | 2000-2006 | 2007-2009 | 2011-2015 | 2016-2019 | 2021-2025 | Latest % of Sco total | Latest pop. estimate | 95% confidence intervals | Latest Nmin |
|---|---|---|---|---|---|---|---|---|---|---|
| 1 Southwest Scotland | 929 | 623 | 923 | 1,200 | 1,709 | 1,563 | 7.8% | 2,171 | 1,776 - 2,894 | 2,001 |
| 2 West Scotland | 8,811 | 11,666 | 10,626 | 15,184 | 15,600 | 11,754 | 58.8% | 16,325 | 13,357 - 21,767 | 15,050 |
| 2a W Sco - South | 5,651 | 7,001 | 5,930 | 7,645 | 7,069 | 5,272 | 26.4% | 7,322 | 5,991 - 9,763 | 6,750 |
| 2b W Sco - Central | 2,700 | 3,956 | 4,004 | 6,424 | 7,447 | 5,563 | 27.8% | 7,726 | 6,322 - 10,302 | 7,123 |
| 2c W Sco - North | 460 | 709 | 692 | 1,115 | 1,084 | 919 | 4.6% | 1,276 | 1,044 - 1,702 | 1,177 |
| 3 Western Isles | 2,820 | 1,920 | 1,804 | 2,739 | 3,532 | 3,080 | 15.4% | 4,278 | 3,500 - 5,704 | 3,944 |
| 4 N Coast & Orkney | 8,787 | 4,388 | 2,979 | 1,938 | 1,405 | 880 | 4.4% | 1,222 | 1,000 - 1,630 | 1,127 |
| 4a North Coast | 265 | 150 | 112 | 73 | 109 | 146 | 0.7% | 203 | 166 - 270 | 187 |
| 4b Orkney | 8,522 | 4,238 | 2,867 | 1,865 | 1,296 | 734 | 3.7% | 1,019 | 834 - 1,359 | 940 |
| 5 Shetland | 5,994 | 3,038 | 3,039 | 3,369 | 3,180 | 1,744 | 8.7% | 2,422 | 1,982 - 3,230 | 2,233 |
| 6 Moray Firth | 1,409 | 1,028 | 776 | 745 | 1,077 | 765 | 3.8% | 1,063 | 869 - 1,417 | 980 |
| 7 East Scotland | 764 | 667 | 283 | 224 | 343 | 192 | 1.0% | 267 | 218 - 356 | 246 |
| Scotland total | 29,514 | 23,330 | 20,430 | 25,399 | 26,846 | 19,978 | 100% | 27,747 | 22,702 - 36,996 | 25,580 |
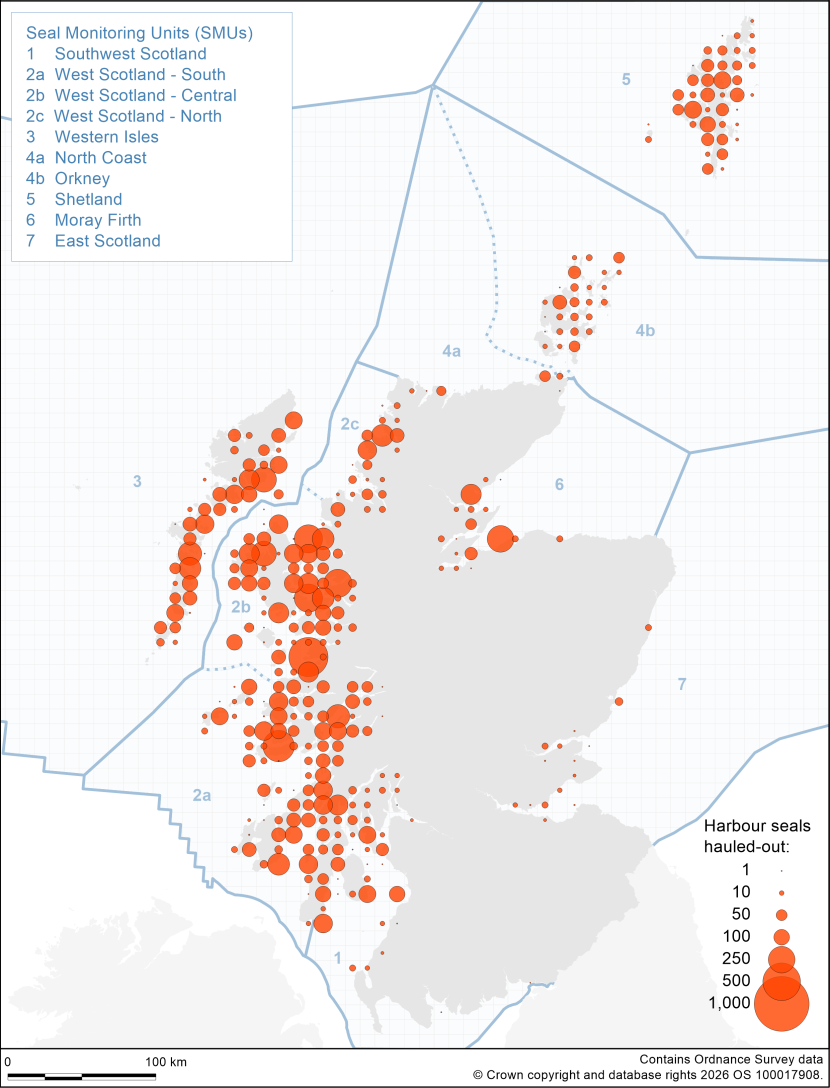
Figure 6. Map of harbour seal distribution by 10x10km grid cells based on haul-out counts obtained from the most recent aerial surveys carried out during the harbour seal moult in August 2021-2025.
Click for a full description
The proportion of the population hauled out during the survey window, and available to count, is estimated to be around 72% (95% CI: 54-88%; Lonergan et al., 2013).
Map of the number of hauled out harbour seals counted around Scotland's coast during August between 2021 and 2025. For each 10 km x 10 km grid square, proportionally sized red circles indicate the number of hauled out seals counted. The legend gives the symbol sizes for seven values. From smallest to largest these represent counts of 1, 10, 50, 100, 250, 500, 1000 seals.
The proportion of the population hauled out during the survey window, and available to count, is estimated to be around 72% (95% CI: 54-88%; Lonergan et al., 2013).
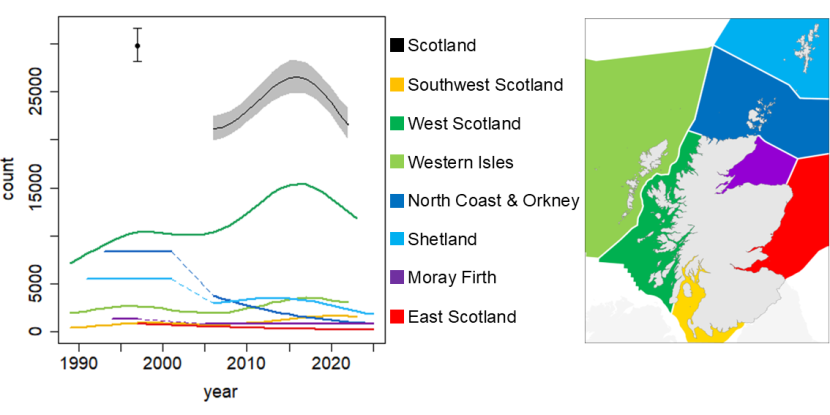
Figure 7. Predicted trends in August counts of harbour seals in each Seal Monitoring Unit (SMU) and for Scotland (black; 1997 and 2006-2022).
Click for a full description
For SMUs for which there was a step change in abundance during a multi-year gap in surveys, no predictions were made during that gap, and dashed lines joining the start and end of the gap are shown for illustrative purposes. As such the only Scotland-wide prediction prior to 2006 was 1997 (start of East Scotland time series and last year before gap for Moray Firth). Note that for the Moray Firth a proxy, rather than the SMU as a whole, was used. As such the predictions for the Moray Firth and Scotland as a whole are to illustrate trends only, rather than predicted counts. The lines (and single circle) indicate the mean prediction. The 95% confidence intervals are also shown for Scotland (whiskers/grey shading). Confidence intervals around the SMU-level trends are shown in the relevant SMU section.
Line graph showing mean predicted August counts of harbour seals in seven Seal Monitoring Units (SMUs) and Scotland as a whole, with year along the x axis (from 1989 to 2025) and predicted count size on the y axis (from 0 to 32,000). The seven Seal Monitoring Units are:
1 Southwest Scotland - yellow
2 West Scotland - dark green
3 Western Isles - light green
4 North Coast and Orkney - dark blue
5 Shetland - light blue
6 Moray Firth - purple
7 East Scotland - red
For SMUs for which there was a step change in abundance during a multi-year gap in surveys, no predictions were made during that gap, and dashed lines joining the start and end of the gap are shown for illustrative purposes only. Note that for the Moray Firth a proxy (representing slightly less than the SMU as a whole) was used. As such the predictions for the Moray Firth and Scotland as a whole are to illustrate trends only, rather than predicted counts.
The Scotland-wide trendline is shown in black. Because of the differing start years of the individual SMU time series as well as the multi-year gaps in three of the SMU trendlines, the only Scotland-wide prediction prior to 2006 was 1997. For Scotland, 95% confidence intervals are also shown (whiskers for single point estimate in 1997; grey shading for 2006-2022). Confidence intervals around the SMU-level trends are shown in the relevant SMU section. The Scotland-wide trend for 2006-2022 is heavily influenced by the trend predicted for the most populous SMU, West Scotland, increasing until around 2017 and then decreasing again.
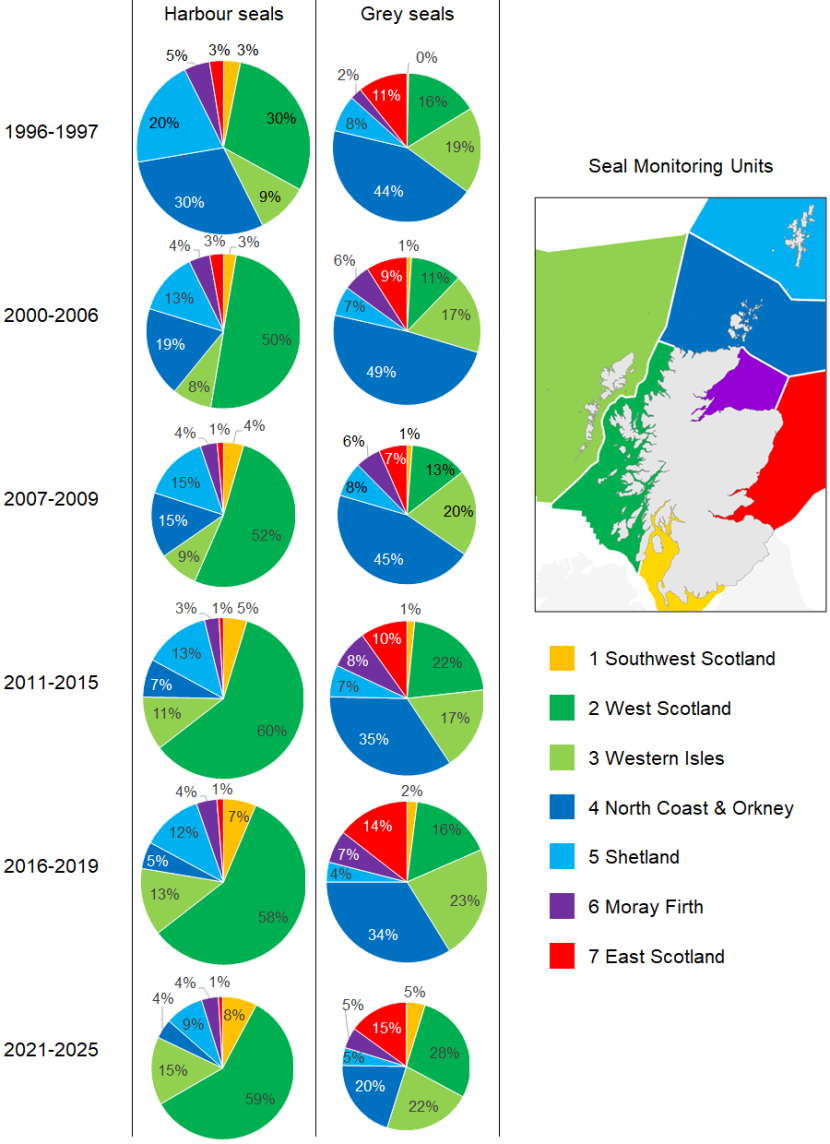
Figure 8. Pie charts showing the proportion of harbour seals and grey seals counted in each SMU during August, for all six censuses. The sizes of the pie charts reflect the total number of animals counted.
Click for a full description
Pie charts show the proportion of harbour seals and grey seals counted in the seven Seal Monitoring Units (SMUs) around Scotland, and how this has changed over six time periods: 1996-1997; 2000-2006; 2007-2009; 2011-2015; 2016-2019 and 2021-2025.
The different chart sizes correspond to the total number of animals counted, with the largest total being approx. 29,500 harbour seals in 1996-1997, and the smallest total being approx. 16,000 grey seals in 2021-2025. Fewer grey seals were counted in all censuses, but because the mean haul-out probability is three times lower for grey seals than harbour seals when counts are carried out, there were actually 2-4 times more grey seals in Scotland throughout the entire period.
Colours are used in the pie charts to represent different Seal Monitoring Units, and these also correspond with colours described in Figure 2. The proportion of harbour seals counted in the North Coast and Orkney SMU has decreased from 30% in 1996-1997 to 4% in 2021-2025, and in the Shetland SMU the proportion decreased from 20% to 9%. Over the same time period, the proportion of harbour seals counted in the West Scotland SMU has increased from 30% to 59% over the same period, and in the Western Isles SMU the proportion has increased from 9% to 15%.
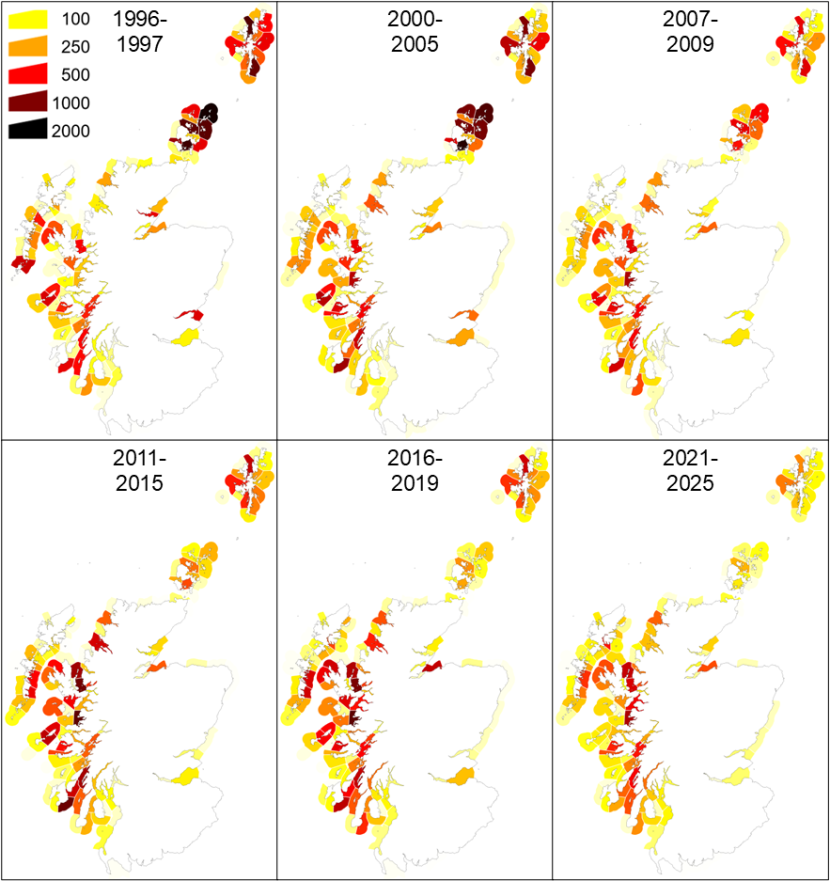
Figure 9. Comparison of August harbour seal counts by SMU Subunits for the six census periods between 1996-2025.
Click for a full description
Maps showing the numbers of harbour seals counted during August within sub-units around Scotland's coast over six different time periods: 1996-1997; 2000-2005; 2007-2009; 2011-2015; 2016-2019 and 2021-2025. Continuously graduated colours (from yellow to orange, to red, to dark red brown, to black) are used to represent numbers of seals counted. From yellow to black the five colours shown in the legend represent counts of 100, 250, 500, 1,000, and 2,000 seals.
Harbour seals by Seal Monitoring Units (SMUs)
The results from the trend analyses at the SMU and SAC level are summarised in Table 3. The following pages present the modelled harbour seal time series (predicted trend and associated 95% confidence intervals) for each SMU (subdivisions for West Scotland) with SAC trends overlaid. SMU-wide trends are shown in red. For SMU 6 (Moray Firth), the trend was fitted to a proxy region (Helmsdale to Findhorn; 96% of SMU total in 2024) instead (in black). SACs are shown according to the colour in the plot title. Note that a different axis scale for the SAC(s), if present, will be shown on the right-hand side of the plot. For each SMU (subdivision) there is also a plot showing the time series of counts for two or three trend-areas within the SMU (subdivision). These trend-areas were created by Morris et al. (2021) and were based on visually inspecting Tables A1-A10 (containing counts by Subunits) and combining adjoining Subunits that appear to be positively correlated for at least part(s) of the time series.
For both species, the time series of counts by SMU Subunits for each SMU (subdivision) are in Tables A1-A20.
| SMU (subdivision) | Area | Last survey year | Last count | N | Latest 1y change (%; 95% CI) | Change since HH (%; 95% CI; Year) |
|---|---|---|---|---|---|---|
| 1. Southwest Scotland | entire SMU | 2023 | 1,563 | 7 | -2.6 | -3.6 |
| 2. West Scotland | entire SMU | 2023 | 11,754 | 7 | -4.8 | -22.1 |
| 2a. West Scotland - south | entire SMU subdivision | 2023 | 5,272 | 7 | -5.4 | -27.7 |
| 2a. West Scotland - south | South-East Islay Skerries SAC | 2023 | 207 | 8 | -22.2 | -76.5 |
| 2a. West Scotland – south | Eileanan agus Sgeiran Lios mor SAC | 2023 | 197 | 11 | -2.1 | -50.5 |
| 2b. West Scotland - central | entire SMU subdivision | 2022 | 5,563 | 8 | -4.2 | -13.5 |
| 2b. West Scotland - central | Ascrib, Isay and Dunvegan SAC | 2022 | 340 | 12 | -5.2 | -46.4 |
| 2c. West Scotland - north | entire SMU subdivision | 2022 | 919 | 7 | -4.3 | -13.9 |
| 3. Western Isles | entire SMU | 2022 | 3,080 | 9 | -4.4 | -14 |
| 3. Western Isles | Sound of Barra SAC | 2022 | 91 | 10 | -2.4 | -89 |
| 4. North Coast & Orkney | entire SMU | 2025 | 880 | 11 | -7.9 | -90.4 |
| 4. North Coast & Orkney | Sanday SAC | 2025 | 32 | 14 | -12.9 | -98 |
| 5. Shetland | entire SMU | 2025 | 1,744 | 9 | -8.7 | -67 |
| 5. Shetland | Mousa SAC | 2025 | 4 | 9 | -16.8 | -99.1 |
| 5. Shetland | Yell Sound Coast SAC | 2025 | 111 | 9 | 0 | -44.6 |
| 6. Moray Firth | entire SMU | 2023 | 944 | - | - | - |
| 6. Moray Firth | Helmsdale to Findhorn | 2024 | 733 (97%) | 24 | 0 | -34 |
| 6. Moray Firth | Dornoch Firth and Morrich More SAC | 2024 | 46 | 32 | -7.6 | -92.1 |
| 7. East Scotland | entire SMU | 2023 | 192 | 7 | -5.2 | -75 |
| 7. East Scotland | Firth of Tay and Eden Estuary SAC | 2025 | 55 | 33 | 9.4 | -92.8 |
1 Southwest Scotland SMU
Harbour seal counts by Subunits within SMU 1 are given in Table A1. Although the 2023 counts for most Subunits were generally slightly higher than in 2018, a 30% reduction in the combined count for Subunits 11-13 resulted in a lower SMU total. The count for Subunit 12 was particularly high in 2018, representing 25% of the SMU total at the time.
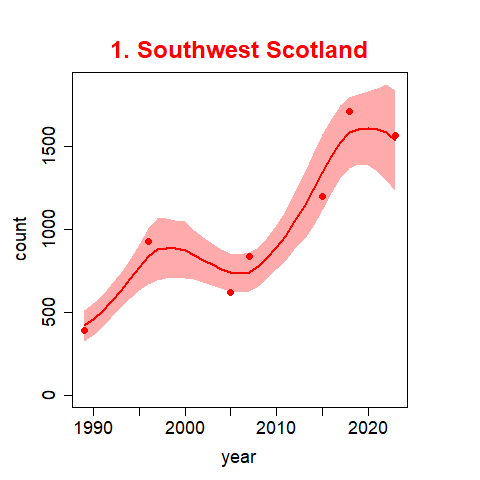
Figure 10. a) The predicted trend and associated 95% confidence intervals for harbour seal August counts in the Southwest Scotland SMU. The filled circle points represent the values used to fit the trends.
Click for a full description
Line graphs showing a) the predicted trend (red line) with 95% confidence intervals (red shaded area) and count values used to fit the trend (red points) for harbour seal counts in the Southwest Scotland SMU over the period 1989 – 2023, and b) counts for two trend-areas within the SMU.
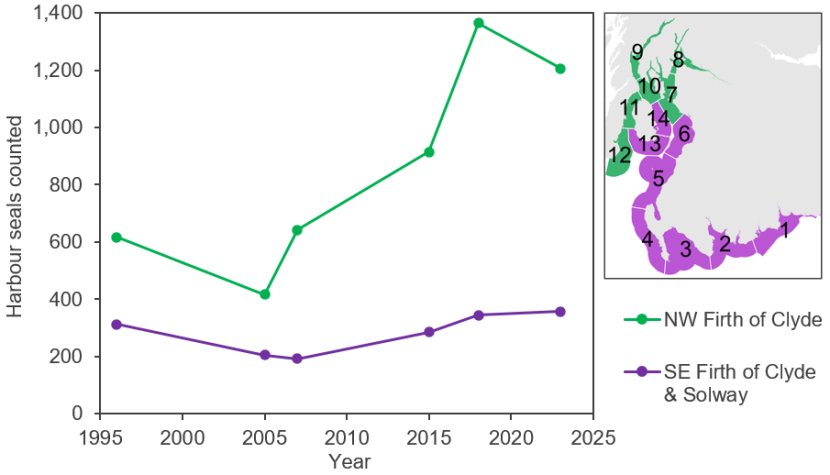
Figure 10. b) Trend-areas within the SMU.
Click for a full description
Counts in the NW Firth of Clyde (green) have increased, peaking in 2019, while counts in the SE Firth of Clyde and Solway area (purple) have remained relatively stable at a lower level.
2 West Scotland SMU
Harbour seal counts by Subunits within SMU 2 are given in Tables A2-A4. On a Scotland-wide level, increases in West Scotland after the mid-2000s had partly compensated for the declines seen in the north and east of Scotland since around 2000. However, more recent widespread declines across the West Scotland SMU, which has held around 60% of all harbour seals in Scotland since the late 2000s, have been the main contributing factor to the Scotland-wide trend in harbour seal numbers being in decline again. The latest total for West Scotland-South in 2023 is almost identical to the 2007 total, which was previously the lowest total in the time series. Although the totals recorded for the other two subdivisions, where numbers had been increasing since around 1990, were also lower in 2022/2023, the number of harbour seals counted was still well above pre-2010 levels. West Scotland – Central is the only SMU (subdivision) that still contains a significantly higher number of harbour seals than grey seals (twice as many) when scaling haulout counts using haul out probabilities.
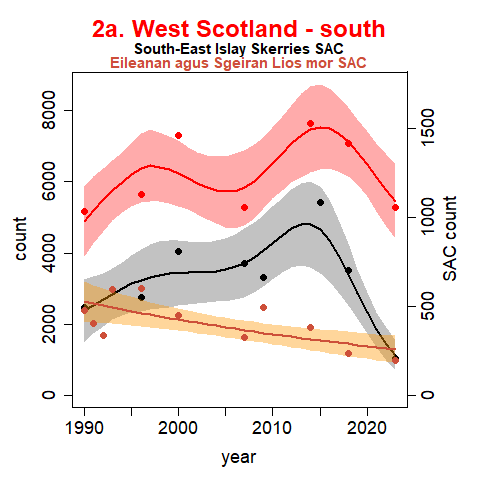
Figure 11. a) The predicted trend and associated 95% confidence intervals for harbour seal August counts in the southern part of West Scotland SMU and encompassed SACs. The filled circle points represent the values used to fit the trends.
Click for a full description
Note the different axes for the SACs.
Line graphs showing a) the predicted trend with 95% confidence intervals and count values used to fit the trend for harbour seal counts in the West Scotland – South SMU subdivision (red line with red shaded area and red points), in the South-east Islay Skerries Special Area of Conservation (SAC; black line with grey shaded area and black points), and in the Eileanan agus Sgeiran Lios mor SAC (light brown line with orange shaded area and brown points) over the period 1989 – 2023. The SMU subdivision counts increased and then decreased again twice, with inflection points around 1998 and around 2015. The trendline for South-east Islay Skerries SAC shows a similar pattern, whereas the counts for Eileanan agus Sgeiran Lios mor SAC show a decreasing trend across the entire period.
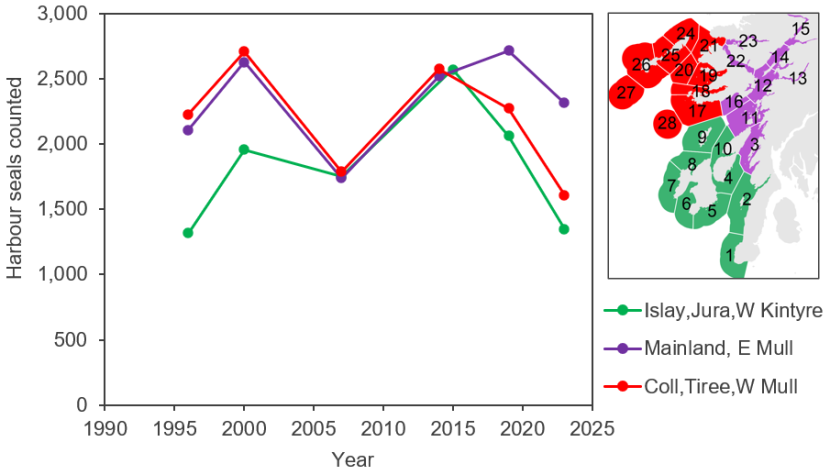
Figure 11. b) Trend-areas within the SMU subdivision.
Click for a full description
Line graph showing b) counts for three trend-areas within the SMU subdivision: Islay, Jura, W Kintyre (green); Mainland, E Mull (purple); Coll, Tiree, W Mull (red). Counts in all three trend-areas have increased and then decreased again twice, with peaks in 2000 and in 2015/2018.
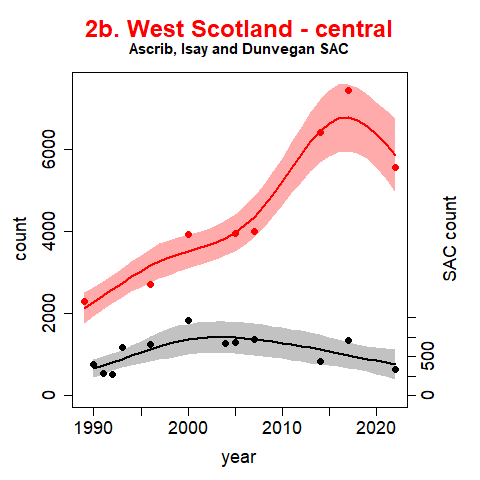
Figure 12. a) The predicted trend and associated 95% confidence intervals for harbour seal August counts in the central part of West Scotland SMU and encompassed SAC. The filled circle points represent the values used to fit the trends.
Click for a full description
Note the different axes for the SACs.
Line graphs showing a) the predicted trend with 95% confidence intervals and count values used to fit the trend for harbour seal counts in the West Scotland – Central SMU subdivision (red line with red shaded area and red points) and in the Ascrib, Isay and Dunvegan Special Area of Conservation (SAC; black line with grey shaded area and black points) over the period 1989 – 2023. The predicted SMU subdivision counts increased substantially over most of the time series, peaking around 2017/2018, before decreasing again slightly. The counts for the SAC increased until the early 2000s, before slowly decreasing over the rest of the time series.
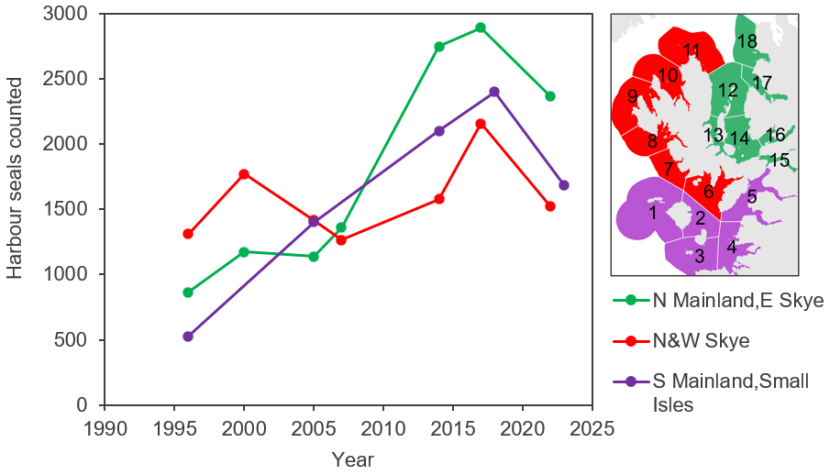
Figure 12. b) Trend-areas within the SMU subdivision.
Click for a full description
Line graph showing b) counts for three trend-areas within the SMU subdivision: N Mainland, E Skye (green); N&W Skye (red); S Mainland, Small Isles (purple). As for the SMU subdivision overall, counts in each of these trend-areas peaked in 2017/2018, before decreasing again.
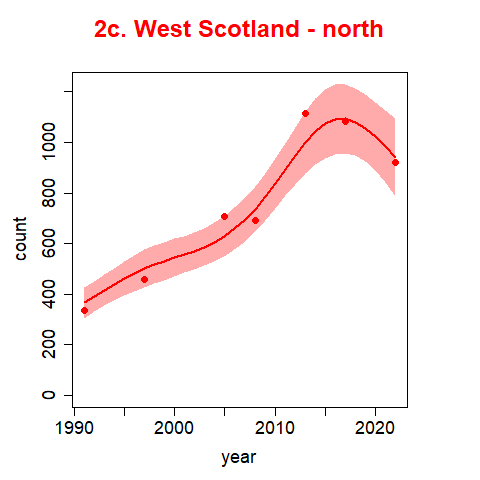
Figure 13. a) The predicted trend and associated 95% confidence intervals for harbour seal August counts in the northern part of West Scotland SMU. The filled circle points represent the values used to fit the trends.
Click for a full description
Line graphs showing a) the predicted trend with 95% confidence intervals and count values used to fit the trend for harbour seal counts in the West Scotland – North SMU subdivision (red line with red shaded area and red points) over the period 1991 – 2022. The predicted SMU subdivision counts increased substantially over most of the time series, peaking around 2017, before decreasing again slightly.
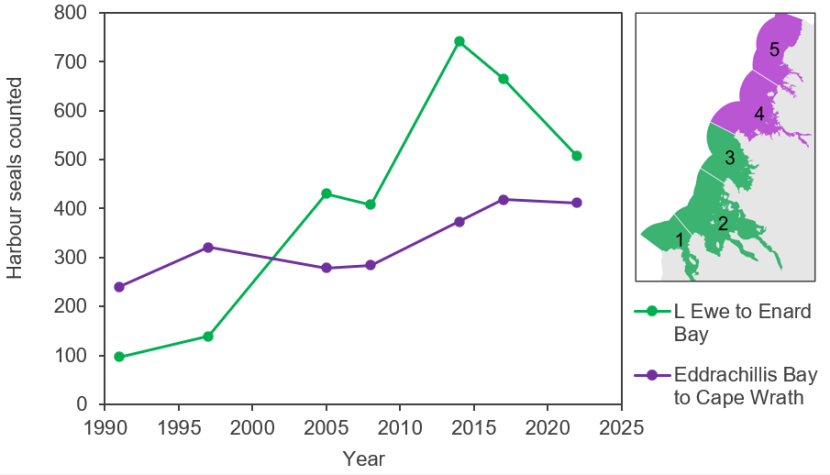
Figure 13. b) Trend-areas within the SMU subdivision.
Click for a full description
Line graph showing b) counts for two trend-areas within the SMU subdivision: L Ewe to Enard Bay (green); Eddrachillis Bay to Cape Wrath (purple). Counts in the former trend-area have increased steadily overall, whereas counts in the latter increased sharply until 2013 before decreasing again since.
3 Western Isles SMU
Harbour seal counts by Subunits within SMU 3 are given in Table A5. Although the most recent 2022 count was 13% lower than the previous count in 2017, this was still the second highest total recorded for SMU 3. While harbour seal numbers in the Sound of Barra and in the Sound of Harris declined through the 1990s and 2000s and then levelled out, numbers on the western side of the Western Isles have remained fairly stable at low densities. In contrast, harbour seal numbers along the eastern side (mainly found in sheltered sea lochs and bays) increased sharply from the late 2010s before dropping during the last survey in 2022. This eastern trend-area (and as a result the entire SMU) has been following a pattern similar to the trends seen in large parts of West Scotland (SMU 2).
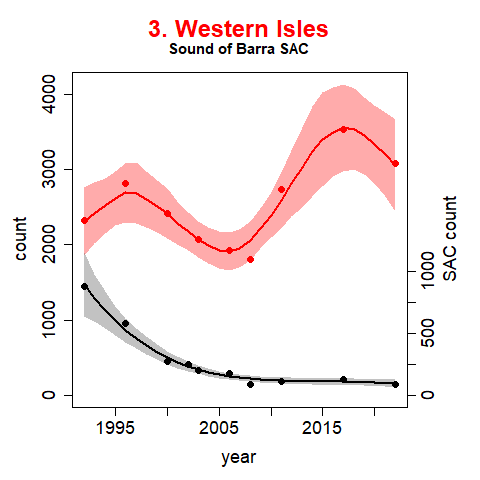
Figure 14. a) The predicted trend and associated 95% confidence intervals for harbour seal August counts in the Western Isles SMU and encompassed SAC.
Click for a full description
The filled circle points represent the values used to fit the trends. Note the different axes for the SACs.
Line graphs showing a) the predicted trend with 95% confidence intervals and count values used to fit the trend for harbour seal counts in the Western Isles SMU (red line with red shaded area and red points) and in the Sound of Barra Special Area of Conservation (SAC; black line with grey shaded area and black points) over the period 1992 – 2022. The SMU counts increased and then decreased again twice, with inflection points around 1996 and around 2017. The SAC count represented a large proportion of the entire SMU at the start of the time series but declined to a very low level by around 2005. The SAC count has remained at this low level ever since.
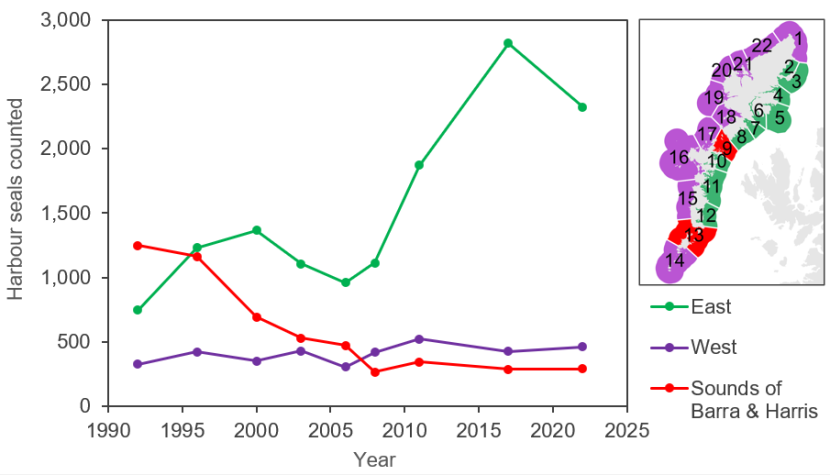
Figure 14. b) Trend-areas within the SMU.
Click for a full description
Line graph showing b) counts for three trend-areas within the SMU: East (green); West (purple); Sounds of Barra and Harris (red). Counts in the West have remained relatively low with a small increase overall. Counts in the East increased to 2000, decreased to 2006, then increased sharply, before decreasing between 2017 and 2022. In contrast, counts in the Sounds of Barra and Harris have decreased over the time series.
4 North Coast & Orkney SMU
Harbour seal counts by Subunits within SMU 4 are given in Tables A6 and A7. Since large-scale seal surveys began in Scotland in the late 1980s, the decline of harbour seals in Orkney (SMU 4b) since the early 2000s represents the most dramatic change in numbers. The most recent surveys conducted in 2024 (partial Orkney coverage) and 2025 indicate that this decline appears to be ongoing across all/most areas of Orkney. The Orkney total in 2025 was over 90% lower than the highest count recorded in 1997. In large parts of southern Orkney (Subunits 7-9&11) the latest count was 99% lower (16 compared to 1,604). A similar drop in numbers of ~98% was recorded in the Sanday SAC in northeastern Orkney (32 compared to 1,458 over the same period). Harbour seal numbers in the North-Inner trend-area have declined at a lower rate than the rest of Orkney. The 2025 counts for Subunits 4-6 were “only” between 84-87% lower than the highest recorded counts for these Subunits, compared to declines of 93-100% for all Subunits in the other two trend-areas.
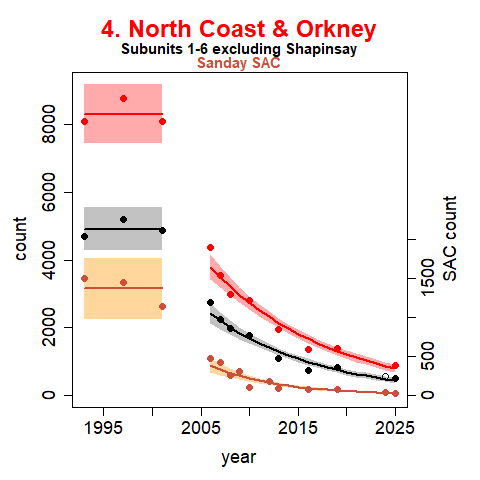
Figure 15. a) The predicted trend and associated 95% confidence intervals for harbour seal August counts in the North Coast & Orkney SMU, the 2024-coverage subset, and encompassed SAC. The filled circle points represent the values used to fit the trends.
Click for a full description
Line graphs showing a) the predicted trend with 95% confidence intervals and count values used to fit the trend for harbour seal counts in the North Coast & Orkney SMU (red line with red shaded area and red points), in SMU Subunits 1-6 (black line with grey shaded area and black points), and in the Sanday Special Area of Conservation (SAC; light brown line with orange shaded area and brown points) over the period 1993 – 2025. Counts for all three of these areas remained high and stable over the first few years of the time series, before decreasing very significantly.
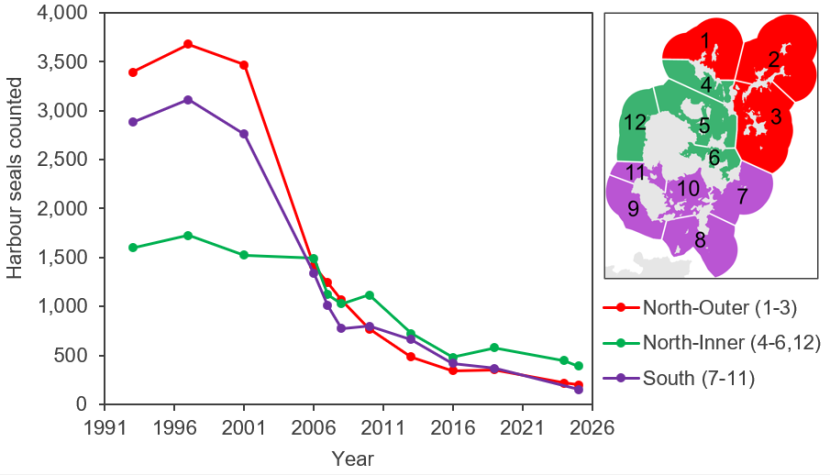
Figure 15. b) Trend-areas within the SMU.
Click for a full description
Line graph showing b) counts for three trend-areas within the SMU subdivision of Orkney: North-Outer (red); North-Inner (green) and South (purple). Counts have decreased in each of these subdivisions, but less dramatically in North-Inner.
5 Shetland SMU
Harbour seal counts by Subunits within SMU 5 are given in Table A8. The 2025 count for Shetland was 45% lower than the previous count in 2019, with numbers falling across the entire archipelago. This latest data point followed a period of apparent stability at a depleted level. During the trend analysis, the model selected for the period post-2002 was a GAM; the relatively minimal variability in the previous four surveys leading up to the 2025 survey resulted in a declining trend towards the latest count. Subsequent surveys will be required for robust trend analyses and to determine if the latest survey represents a step change in abundance or an ongoing decline. A comparison between the fitted trend for Shetland up until 2019 (Russell et al., 2025) and the latest count is illustrated in Figure A6.
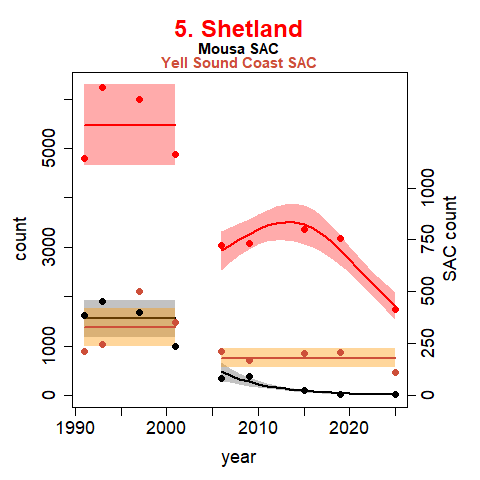
Figure 16. a) The predicted trend and associated 95% confidence intervals for harbour seal August counts in the Shetland SMU and encompassed SACs. The filled circle points represent the values used to fit the trends. Note the different axes for the SACs.
Click for a full description
Line graphs showing a) the predicted trend with 95% confidence intervals and count values used to fit the trend for harbour seal counts in the Shetland SMU (red line with red shaded area and red points), in the Mousa Special Area of Conservation (SAC; black line with grey shaded area and black points), and in the Yell Sound Coast SAC (light brown line with orange shaded area and brown points) over the period 1991 – 2025. Counts were relatively high at the start of the time series with no clear trend, before dropping significantly between 2001 and 2006. The SMU counts remained stable or increased slightly for several years but then decreased again to 2025. Counts for the Mousa SAC show a decreasing trend since 2006, with no harbour seals being counted there in 2025.
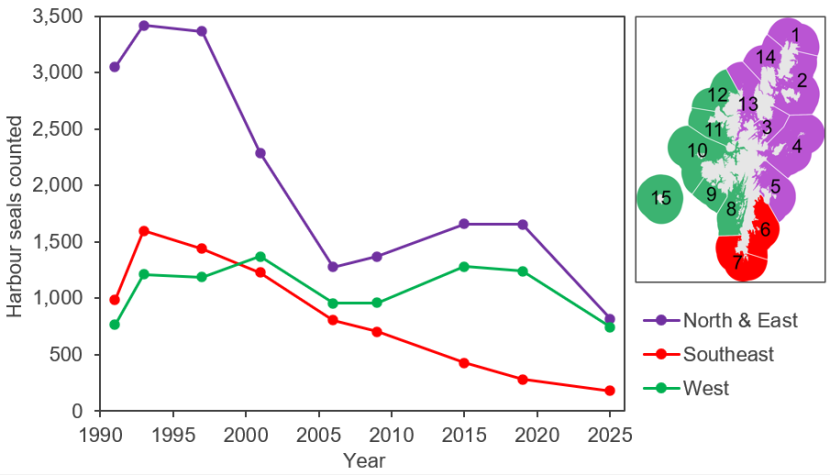
Figure 16. Line graph showing b) counts for three trend-areas within the SMU subdivision: North & East (purple); Southeast (red); and West (green).
Click for a full description
Counts in the West have shown no clear trend; in the Southeast they have continuously decreased since 1993. Counts in the North & East trend-area decreased rapidly between 1997 and 2006, before appearing to stabilise/increase. The most recent count in 2025 was significantly lower again for this trend-area.
6 Moray Firth SMU
Harbour seal counts by Subunits within SMU 6 are given in Table A9. Most harbour seals in the Moray Firth are found between Helmsdale and Findhorn, an area which was surveyed almost every year from 2005 to 2024. The counts were very variable throughout this period, and no overall trend was detected, but certain areas within this SMU have either declined or increased. The number of harbour seals counted in the three main firths (Dornoch, Cromarty, Beauly) have declined, most prominently displayed by the counts for the Dornoch Firth and Morrich More SAC. In contrast, the numbers counted at Culbin (in Subunit 9) have increased since the mid-2000s.
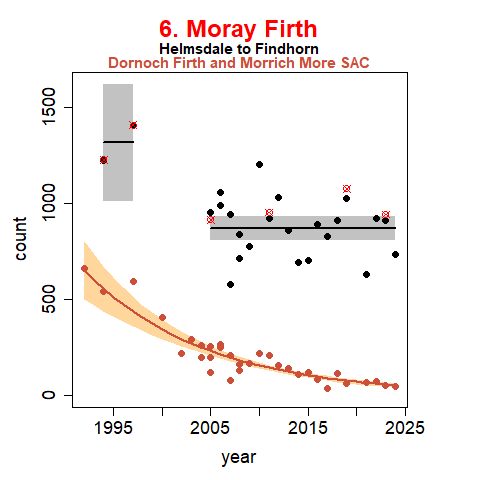
Figure 17. a) The predicted trend and associated 95% confidence intervals for harbour seal August counts in the Moray Firth SMU subset and encompassed SAC. The filled circle points represent the values used to fit the trends.
Click for a full description
Line graphs showing a) the predicted trend with 95% confidence intervals and count values used to fit the trend for harbour seal counts in the Moray Firth SMU proxy area Helmsdale to Findhorn (black line with grey shaded area and black points) and in the Dornoch Firth and Morrich More SAC (light brown line with orange shaded area and brown points) over the period 1992 – 2024. A few totals for the entire SMU are shown by red circle crosses. Following a drop between 1997 and 2005, the SMU proxy counts have not been following a clear trend. The SAC count has been decreasing continuously over the entire period and is now very low.
7 East Scotland SMU
Harbour seal counts by Subunits within SMU 7 are given in Table A10. Up until the late 2000s, the total count for the East Scotland SMU was heavily influenced by the number of harbour seals found in the Firth of Tay and Eden Estuary SAC. The SAC count declined by around 94% through the 2000s and has remained at a low level ever since (average of 43 since 2013). Although, the SAC trend analysis identified an increasing current trend, the actual number of seals involved is very small and thus further surveys will be required to assess if the SAC may be starting to recover.
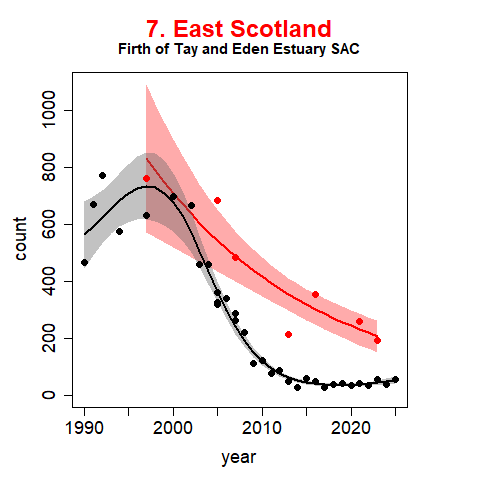
Figure 18. a) The predicted trend and associated 95% confidence intervals for harbour seal August counts in the East Scotland SMU and encompassed SAC. The filled circle points represent the values used to fit the trends.
Click for a full description
Line graphs showing a) the predicted trend with 95% confidence intervals and count values used to fit the trend for harbour seal counts in the East Scotland SMU (red line with red shaded area and red points) and in the Firth of Tay and Eden Estuary Special Area of Conservation (SAC; black line with grey shaded area and black points) over the period 1990 – 2025. The SMU counts have decreased significantly overall, but not as dramatically as in the SAC where counts have been very low over the past 10-15 years.
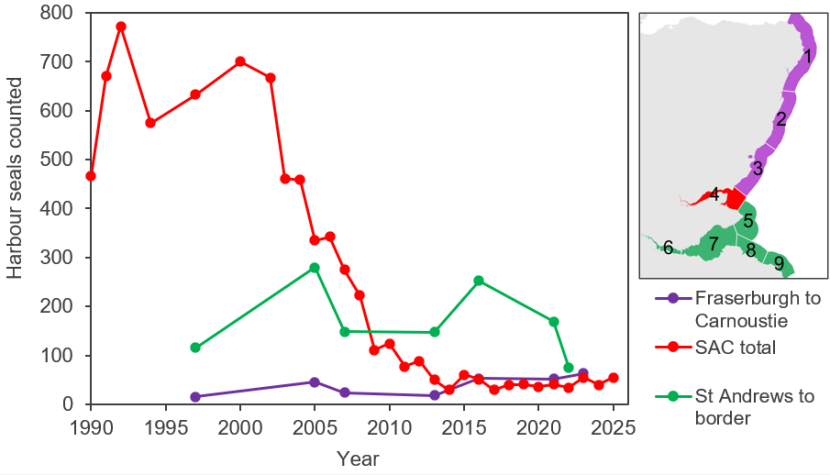
Figure 18. . b) Trend-areas within the SMU.
Click for a full description
Line graph showing b) counts for three trend-areas within the SMU: Fraserburgh to Carnoustie (purple); Firth of Tay and Eden Estuary SAC (red); St Andrews to border (green). Counts in the areas either side of the SAC have remained relatively stable, although the latest count for St Andrews to border was unusually low.
Protected areas
Special Areas of Conservation (SACs) for harbour seals
All SAC harbour seal counts are shown in Table 4 and plotted in Figure 10. For all nine SACs for harbour seal in Scotland the most recent count was, or was close to, the lowest in the time series. The number of harbour seals counted in these SACs as a proportion of the total Scottish count has shrunk over the time series from around 20% (in 1996/1997) to just over 5% in 2021-2025. The results from the trend analyses at the SAC level are included in Table 3. The SAC trendlines are shown in the SMU trend analysis plots in the previous section (Figures 11, 12, 14-18). Trends observed for counts made within the boundaries of an SAC are not necessarily representative of the harbour seal numbers recorded within a wider area (Morris et al., 2021).
table 4
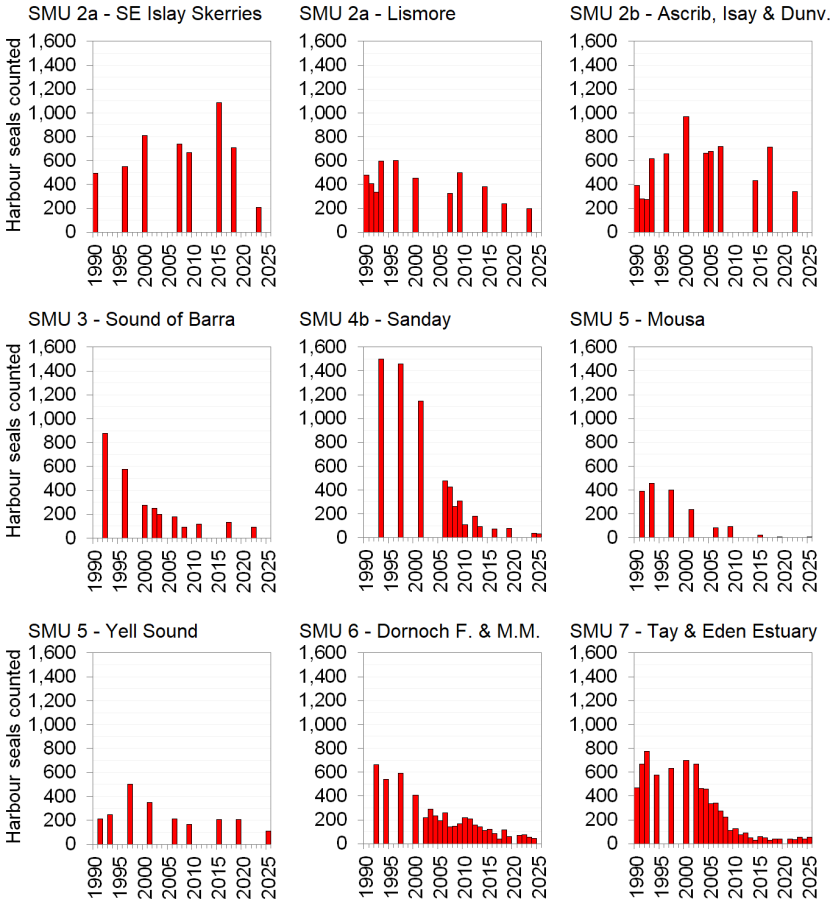
Figure 19. August harbour seal counts in Special Areas of Conservation (SACs) for which harbour seals are a primary reason for selection or a qualifying feature.
Click for a full description
Bar graphs show the number of harbour seals counted within the boundary of each Special Area od Conservation (SAC) designated for harbour seals in Scotland. In each graph year is along the x axis, from 1990 to 2025, and number of harbour seals counted is given on the y axis, on a scale which runs from 0 - 1,600. The nine SACs are: South-East Islay Skerries; Eileanan agus Sgeiran Lios mor; Ascrib Isay and Dunvegan; Sound of Barra; Sanday; Mousa; Yell Sound Coast; Dornoch Firth and Morrich More; Firth of Tay and Eden Estuary.
Sites of Special Scientific Interest (SSSIs) for harbour seals
Of the five harbour seal SSSIs in Scotland, only two are not covered by existing harbour seal SACs (Eynhallow in Orkney and the North Fetlar in Shetland). All SSSI harbour seal counts are shown in Table 5. The number of harbour seals counted in these SSSIs as a proportion of the total Scottish count has shrunk over the time series from around 10% (in 1996/1997) to ~0.5% in 2021-2025.
| Year | East Sanday Coast | Eynhallow | Mousa | North Fetlar | Tayport - Tentsmuir Coast | Total within all SSSIs | % of Scottish total |
|---|---|---|---|---|---|---|---|
| 1990 | - | - | - | - | 319 | - | - |
| 1991 | - | - | 388 | 236 | 428 | - | - |
| 1992 | - | - | - | - | 456 | - | - |
| 1993 | 1,504 | 106 | 455 | 428 | - | 2,949 | - |
| 1994 | - | - | - | - | 289 | - | - |
| 1995 | - | - | - | - | - | - | - |
| 1996 | - | - | - | - | - | - | - |
| 1997 | 1,481 | 632 | 402 | 182 | 262 | 2,959 | 10.0% |
| 1998 | - | - | - | - | - | - | - |
| 1999 | - | - | - | - | - | - | - |
| 2000 | - | - | - | - | 153 | - | - |
| 2001 | 1,152 | 620 | 235 | 71 | - | 2,231 | - |
| 2002 | - | - | - | - | 167 | - | - |
| 2003 | - | - | - | - | 53 | - | - |
| 2004 | - | - | - | - | 126 | - | - |
| 2005 | - | - | - | - | 63 | - | - |
| 2006 | 479 | 228 | 83 | 12 | 34 | 836 | 3.6% |
| 2007 | 435 | 206 | - | - | 31 | - | - |
| 2008 | 260 | 216 | - | - | 50 | - | - |
| 2009 | 315 | 238 | 93 | 53 | 8 | 707 | 3.5% |
| 2010 | 115 | 243 | - | - | 9 | - | - |
| 2011 | - | - | - | - | 0 | - | - |
| 2012 | 193 | 115 | - | - | 5 | - | - |
| 2013 | 99 | 104 | - | - | 0 | - | - |
| 2014 | - | - | - | - | 0 | - | - |
| 2015 | - | - | 23 | 9 | 0 | 235 | 0.9% |
| 2016 | 74 | 2 | - | - | 1 | - | - |
| 2017 | - | - | - | - | 0 | - | - |
| 2018 | - | - | - | - | 0 | - | - |
| 2019 | 78 | 76 | 7 | 44 | 0 | 205 | 0.8% |
| 2020 | - | - | - | - | - | - | - |
| 2021 | - | - | - | - | 0 | - | - |
| 2022 | - | - | - | - | 0 | - | - |
| 2023 | - | - | - | - | 0 | - | - |
| 2024 | 39 | 48 | - | - | 0 | - | - |
| 2025 | 32 | 55 | 4 | 25 | 0 | 116 | 0.6% |
Summer distribution of grey seals in Scotland
In contrast to harbour seals, grey seals in August are hauling out between foraging trips rather than moulting, resulting in a higher variability in haul-out counts. In addition, because grey seals can haul out in much larger groups, containing several hundreds or even thousands of individuals, the counts made at a small number of potentially large haul-out sites can greatly affect the totals calculated for Subunits or SMUs. For these reasons, summer counts of grey seals should always be interpreted with caution.
Based on data collected during the most recent surveys from August 2021-2025, the total number of grey seals counted in Scotland was 16,042. Following the highest ever recorded total in 2016-2019, this is the lowest total recorded to date. It is 37% lower than the previous total and 15% lower than 2007-2009, which was previously the lowest total count for Scotland (Table 6).
SMU and Scotland-wide trends in grey seal counts were estimated (Figure 21). The first year for which trends could be estimated for all SMUs, and thus Scotland as a whole, was 1997. The time series for SMU 4 (North Coast & Orkney) suggests that summer abundance of grey seals was increasing prior to this. The Scotland-wide trends are estimated up to 2022 (the last year for which trends could be estimated for all SMUs), with 2015 estimated to represent the highest summer abundance of grey seals. The current (i.e. 2022) mean estimate is significantly lower than for 2015; ‑13.3% (‑19.0, ‑7.0%). The current estimated trend for grey seals in Scotland (2022) is of a significant decline; ‑3.2% per annum (95% CIs: ‑4.6, ‑1.8). The Scotland-wide distribution of grey seals, based on the newest August census data, is mapped by 10x10km grid cells in Figure 20. The distribution maps for the five previous survey periods are shown in Figures A7-A11.
The apparent Scotland-wide decline in grey seals is driven by the low North Coast & Orkney (SMU 4) count in 2025. The latest Orkney grey seal count is ~60-70% lower than the previous seven counts obtained over the last 20 years (Table A17). The nature of the time series prior to the 2025 count, led to the trendline responding markedly to this latest count. It should be noted that a period of poor weather prior to a survey can lead to an exceptionally low proportion of grey seals hauled out, and thus anomalously low counts (such as in 2001 in SMU 4). However, the partial Orkney count obtained in 2024 was consistent with the trajectory estimated from the full time series of counts covering the same area up to 2025 (excluding 2024), suggesting that the 2025 count may represent a genuine decline in grey seals in SMU 4, and thus Scotland (Figure A12). Nevertheless, the fitted trendline for SMU 4, and thus for Scotland as a whole, should be interpreted with caution. Subsequent surveys will be required to robustly estimate if the decline is real, the degree of decline, and its nature (i.e. a step change in abundance or an ongoing decline).
In Shetland (SMU 5), the low August 2025 count did not result in a decreasing trend, when using all counts from 1991-2025 (Table A18). A model without a temporal trend was selected by AIC but the 2025 count was markedly lower than the lower confidence interval (Figure A13a). Indeed, if the first count in the time series (1991; which appears to be unusually low) was excluded, a decreasing trend was selected (Figure A13b).
The latest grey seal count (2022) for the Western Isles (SMU 3) was the lowest SMU total recorded in 20 years. This was due to a relatively low count for Subunit 16, which includes the Monach Isles (Table A15). During previous surveys, this Subunit has often contained 40-65% of all grey seals counted in SMU 3 (compared to 27% in 2022). The trend analysis did not identify a trend for this SMU (Figure 21).
The only Scottish SMU where grey seal numbers have increased throughout the time series is in Southwest Scotland (SMU 1). However, this has always been (and still is) the least populous of the seven Scottish SMUs (Table A11).
The latest grey seal count for West Scotland (2022/2023) was also relatively high, and the trend analysis suggests that numbers are increasing here (Figure 21).
In eastern Scotland, grey seal numbers counted in SMU 6 (Moray Firth) and SMU 7 (East Scotland) have always been heavily influenced by the number of animals found at a small number of sites (outer Dornoch Firth, sands near Whiteness Head, Culbin/Findhorn in SMU 6; Ythan River mouth, Abertay Sands in SMU 7). No trend has been identified for these two SMUs (Figure 21).
| Seal Monitoring Unit (subdivision) | 1996-1997 | 2000-2006 | 2007-2009 | 2011-2015 | 2016-2019 | 2021-2025 | Latest % of Sco total | Latest pop. estimate | 95% confidence intervals | Latest Nmin |
|---|---|---|---|---|---|---|---|---|---|---|
| 1 Southwest Scotland | 75 | 206 | 233 | 374 | 517 | 760 | 4.7% | 3,022 | 2,614 - 3,543 | 2,832 |
| 2 West Scotland | 3,435 | 2,383 | 2,524 | 5,064 | 4,174 | 4,508 | 28.1% | 17,924 | 15,507 - 21,016 | 16,798 |
| 2a W Sco - South | 2,125 | 1,771 | 1,788 | 3,618 | 2,922 | 2,846 | 17.7% | 11,316 | 9,790 - 13,268 | 10,605 |
| 2b W Sco - Central | 931 | 361 | 559 | 1,056 | 773 | 954 | 5.9% | 3,793 | 3,282 - 4,448 | 3,555 |
| 2c W Sco - North | 379 | 251 | 177 | 390 | 479 | 708 | 4.4% | 2,815 | 2,436 - 3,301 | 2,638 |
| 3 Western Isles | 4,062 | 3,674 | 3,808 | 4,085 | 5,773 | 3,532 | 22.0% | 14,044 | 12,150 - 16,466 | 13,162 |
| 4 N Coast & Orkney | 9,427 | 10,315 | 8,525 | 8,106 | 8,599 | 3,273 | 20.4% | 13,014 | 11,259 - 15,259 | 12,196 |
| 4a North Coast | 597 | 736 | 504 | 266 | 414 | 283 | 1.8% | 1,125 | 974 - 1,319 | 1,055 |
| 4b Orkney | 8,830 | 9,579 | 8,021 | 7,840 | 8,185 | 2,990 | 18.6% | 11,889 | 10,286 - 13,939 | 11,142 |
| 5 Shetland | 1,724 | 1,371 | 1,536 | 1,558 | 1,009 | 720 | 4.5% | 2,863 | 2,477 - 3,357 | 2,683 |
| 6 Moray Firth | 551 | 1,272 | 1,113 | 1,917 | 1,657 | 839 | 5.2% | 3,336 | 2,886 - 3,911 | 3,126 |
| 7 East Scotland | 2,328 | 1,898 | 1,238 | 2,296 | 3,683 | 2,410 | 15.0% | 9,583 | 8,290 - 11,235 | 8,981 |
| Scotland total | 21,602 | 21,119 | 18,977 | 23,400 | 25,412 | 16,042 | 100% | 63,785 | 55,184 - 74,788 | 59,778 |
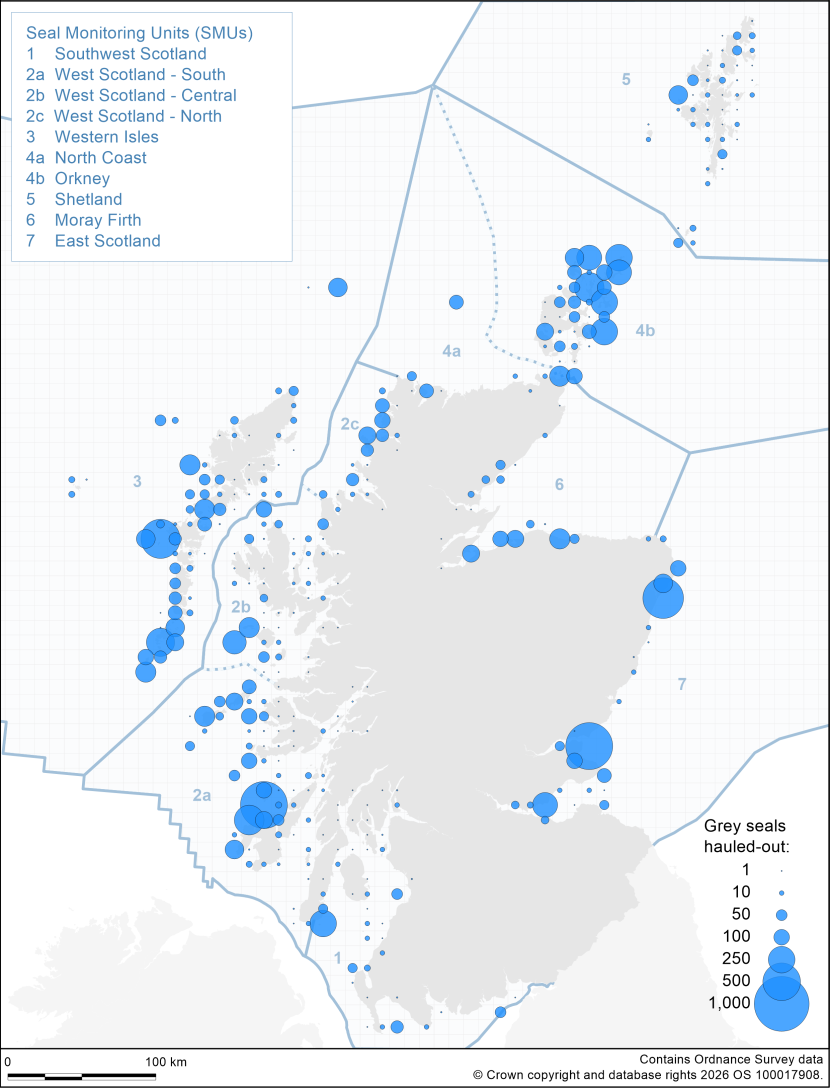
Figure 20. Map of grey seal distribution by 10x10km grid cells based on haul-out counts obtained from the most recent aerial surveys carried out in August 2021-2025.
Click for a full description
The proportion of the population hauled out during the survey window, and available to count, is estimated to be around 25.2% (95% CI: 21.5 – 29.1%; Russell & Carter, 2021).
Map of the number of hauled out grey seals counted around Scotland's coast during August between 2021 and 2025. For each 10 km x 10 km grid square, proportionally sized blue circles indicate the number of hauled out seals counted. The legend gives the symbol sizes for seven values. From smallest to largest these represent counts of 1, 10, 50, 100, 250, 500, 1000 seals.
The proportion of the population hauled out during the survey window, and available to count, is estimated to be around 25.2% (95% CI: 21.5 – 29.1%; Russell & Carter, 2021).
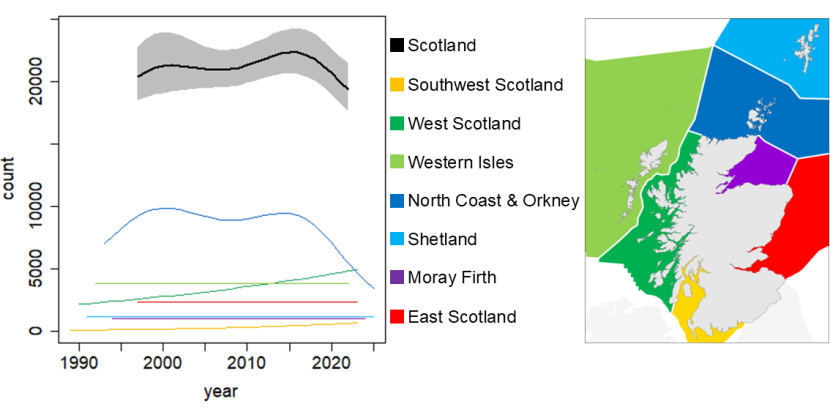
Figure 21. Predicted trends in August counts of grey seals in each Seal Monitoring Unit (SMU) and for Scotland (1997-2002; black).
Click for a full description
Note that for the Western Isles and for the Moray Firth, a proxy (93 and 73%, respectively) was used, rather than the SMU as a whole. As such the predictions for these two SMUs, and for Scotland as a whole, are to illustrate trends only, rather than predicted counts. The lines indicate the mean prediction. The 95% confidence intervals are also shown for Scotland (grey shading). The increase in grey seals in the North Coast & Orkney SMU during the early 1990s is not shown for the Scotland-wide trend due to the later start of the time series in eastern Scotland. The Scotland-wide trend (including the recent apparent decline) has been mainly driven by the number of animals counted in the North Coast & Orkney SMU.
Line graph showing mean predicted August counts of grey seals in seven Seal Monitoring Units (SMUs) and Scotland as a whole, with year along the x axis (from 1989 to 2025) and predicted count size on the y axis (from 0 to 25,000). The seven Seal Monitoring Units are:
1 Southwest Scotland - yellow
2 West Scotland - dark green
3 Western Isles - light green
4 North Coast and Orkney - dark blue
5 Shetland - light blue
6 Moray Firth - purple
7 East Scotland - red
For SMUs for which there was a step change in abundance during a multi-year gap in surveys, no predictions were made during that gap, and dashed lines joining the start and end of the gap are shown for illustrative purposes only. Note that for the Western Isles and for the Moray Firth a proxy was used. As such the predictions for these two SMUs and Scotland as a whole are to illustrate trends only, rather than predicted counts.
The Scotland-wide trendline is shown in black with 95% confidence intervals (grey shaded area). Confidence intervals around the SMU-level trends are shown in the relevant SMU section. The increase in grey seals in the North Coast & Orkney SMU during the early 1990s is not shown for the Scotland-wide trend due to the later start of the time series in eastern Scotland. The Scotland-wide trend (including the recent apparent decline) has been mainly driven by the number of animals counted in the North Coast & Orkney SMU.
Discussion and conclusions
Harbour seal abundance in Scotland had been recovering up to the latest survey report (up to 2019; Morris et al., 2021) from the time series low in the mid to late 2000s, but this latest count was a new time-series low demonstrating that harbour seal abundance has declined again. The recovery had been driven by increases in SMUs 1-3 which held close to 80% of Scottish harbour seals by the late 2010s. With the exception of the least populous SMU (Southwest Scotland), the SMUs in the west of Scotland are now in decline for unknown reasons. The North Coast & Orkney SMU has now been in continuous decline for at least 20 years. Shetland, which for ~15 years had likely been stable at a depleted level (Russell et al., 2025), now also appears to be in decline. The Moray Firth hosts a variable number of seals but the mean has remained stable at a depleted level since the mid-2000s. East Scotland has continued to decline but the SAC, where harbour seal numbers declined by ~94% in the 2000s and early 2010s, has not continued to decline over the last ten years, but numbers have remained very low. Although, the SAC trend analysis identified an increasing current trend, the actual number of seals involved is very small and thus further surveys will be required to assess if the SAC may be starting to recover.
DNA and tracking analyses have indicated that harbour seals in Scotland can be split into a western genetic cluster, consisting of SMUs 1-3, and three north/eastern clusters aligning with SMUs 4 & 6 combined, SMU 5, and SMU 7 (Carroll et al., 2020). This western and eastern split coincides with the overlying regional differences in trends observed in harbour seal counts until the mid to late 2010s, when harbour seals across the west of Scotland also began to decline. It is not feasible that the nation-wide decline of harbour seals could be explained by emigration. Although there is some connectivity between Scottish and Irish harbour seal populations (Carroll et al., 2020; Steinmetz et al., 2023), the Irish populations are relatively small and not increasing (Morris et al., 2025). The Scottish metapopulation is isolated from the England and continental European metapopulation, and in any case that metapopulation is also in decline (ICES, 2024). It is likely that the declines recorded in all parts of Scotland across the time series are the result of decreased demographic rates (survival and fecundity; Arso Civil et al., 2025). There are multiple potential factors that could have affected the historic and current trends, the importance of which will vary in time and space. These include disease, exposure to toxins from harmful algae blooms (Hall et al., 2024) limited prey availability (related in part to competition with grey seals; Langley et al., 2026); and predation by grey seals (Langley et al., 2025)and killer whales (Sutherland, 2024).
Scaling the haulout counts for both species using mean haul out probabilities estimated from telemetry data, to consider total abundance, reveals that no SMU holds more harbour seals than grey seals. Whereas the Southwest Scotland SMU and large parts of the West Scotland SMU have historically generally held more harbour seals than grey seals, the only SMU subdivision to hold more harbour seals during the most recent Scotland census is West Scotland – Central (SMU 2b).
August counts of grey seals are highly variable but give an indication of distribution and trends during the main foraging season. Grey seal breeding and summer abundance increased in the 1980s and 1990s as populations recovered from persecution. Following the highest Scotland-wide total recorded in August 2016-2019, the 2021-2025 count is the lowest total ever recorded (37% lower). Summer abundance in many SMUs is variable with no apparent overall trend from the start of the time series (late 1980s to early mid-1990s). This is with the exception of an increase in West Scotland (SMU 2) and changing trends in North Coast & Orkney (SMU 4). Abundance increased in the North Coast & Orkney SMU in the 1990s accounting for almost 50% of Scottish summer holdings in 2000-2006. However, the latest count for SMU 4 (2025) was ~60% lower than in 2019, with the SMU now accounting for only 20% of Scottish summer holdings. Although this apparent decrease should be interpreted with caution, the partial Orkney survey in 2024 supports this finding. It should also be noted that the number of grey seal pups estimated to have been born in Orkney in 2022 was 10-15% lower than the four previous estimates from surveys carried out through the 2010s (Morris et al., 2024). In contrast to harbour seals, a decrease in grey seals could be driven, at least in part, by emigration (McConnell et al., 1999; Russell et al., 2013). Indeed, there is considerable connectivity between Orkney and eastern England, and the latter hosts a significantly increasing number of grey seals in summer and in the breeding season (Russell et al., 2025).
Given that several local populations of both species have experienced rapid apparent changes in abundance throughout the time series, it is essential to continue regular comprehensive monitoring to update abundance metrics and enable reliable trend analyses.
References
Arso Civil, M., Tapp, S., Dickens, J., Langley, I., Hiley, H.M., Terrapon, M., Hague, E., Hewitt, R.C., Cordes, L.S., Graham, I.M., Cheney, B.J., Thompson, P.M., Hall, A. and Sparling, C.E. 2025. Reduced Adult Survival Estimated in Areas of Decline of Harbour Seal Populations in Scotland. Ecology and Evolution, 15.
Baxter, J.M., Boyd, I.L., Cox, M., Donald, A.E., Malcolm, S.J., Miles, H., Miller, B. and Moffat, C.F. eds, 2011. Scotland's Marine Atlas: Information for the national marine plan. Marine Scotland, Edinburgh.
Carroll, E.L., Hall, A., Olsen, M.T., Onoufriou, A.B., Gaggiotti, O.E. and Russell, D.J.F. 2020. Perturbation drives changing metapopulation dynamics in a top marine predator. Proceedings of the Royal Society B, 287.
Commission of the European Communities, 2003. Council directive 92/43/EEC of 21 May 1992 on the conservation of natural habitats and of wild fauna and flora. As amended by the Accession Act of Austria, Finland and Sweden (1995) and the Accession Act of the Czech Republic, the Republic of Estonia, the Republic of Cyprus, the Republic of Latvia, the Republic of Lithuania, the Republic of Hungary, the Republic of Malta, the Republic of Poland, the Republic of Slovenia and the Slovak Republic (2003). Official Journal of the European Union L 236 33 23.9.2003. Brussels. European Commission 1992/95/2003.
Ersts, P.J.[Internet] DotDotGoose (version 1.7.0). American Museum of Natural History, Center for Biodiversity and Conservation. Available from https://biodiversityinformatics.amnh.org/open_source/dotdotgoose. Accessed on 2024-05-23.
Grellier, K., Thompson, P.M. and Corpe, H.M. 1996. The effect of weather conditions on harbour seal (Phoca vitulina) haulout behaviour in the Moray Firth, northeast Scotland. Canadian Journal of Zoology–Revue Canadienne De Zoologie, 74, 1806-1811.
Hall, A.J., Kershaw J.L., Fraser S., Davidson, K., Rowland-Pilgrim, S., Turner, A.D. and McConnell, B. 2024. Estimating the Risks of Exposure to Harmful Algal Toxins Among Scottish Harbour Seals. Harmful Algae 136: 102653.
ICES. 2024. Working Group on Marine Mammal Ecology (WGMME). ICES Scientific Reports. 6:82. 239 pp.
Langley, I., Hammond, P.S., Thompson, P.M., Pierce, G.J., Wilson, L.J., Hall, A.J., Hastie, G.D. and Russell, D.J.F. 2026. Temporal changes in the dietary niche of sympatric seals provides insight into the role of competition in population declines. Oikos. 10.1002/oik.11875
Langley, I., Brownlow, A. and Russell, D.J.F. 2025. Intraguild Predation in Sympatric Seals and the Effect on a Declining Population. Journal of Animal Ecology. 10.1111/1365-2656.
Lonergan, M., Duck, C., Moss, S., Morris, C. and Thompson, D. 2013. Rescaling of aerial survey data with information from small numbers of telemetry tags to estimate the size of a declining harbour seal population. Aquatic Conservation: Marine and Freshwater Ecosystems, 23, 135-144.
McConnell, B., Fedak, M., Lovell, P. and Hammond, P. 1999. Movements and foraging areas of grey seals in the North Sea. Journal of Applied Ecology, 36, 573-590.
Morris, C.D., Duck, C.D. and Thompson, D. 2021. Aerial surveys of seals in Scotland during the harbour seal moult, 2016-2019. NatureScot Research Report 1256.
Morris, C.D., Riddoch, N.G., Duck, C.D. and Russell, D.J.F. 2024. Most recent grey seal pup production estimates for UK breeding colonies. SCOS Briefing paper 24/2, Sea Mammal Research Unit, University of St Andrews.
Morris, C.D, Riddoch, N.G., Duck, C.D., Waitland, S.A. and Russell, D.J.F. 2025. Aerial thermal-imaging survey of seals in Ireland in August 2024. Irish Wildlife Manuals, No. 158. National Parks and Wildlife Service, Department of Housing, Local Government and Heritage, Ireland.
Olsen, M.T., Islas, V., Graves, J.A., Onoufriou, A., Vincent, C., Brasseur, S., Frie, A.K. and Hall, A.J. 2017. Genetic population structure of harbour seals in the United Kingdom and neighbouring waters. Aquatic Conservation: Marine and Freshwater Ecosystems, 27, 839– 845.
Paterson, W., Sparling, C., Thompson, D., Pomeroy, P., Currie, J. and McCafferty, D. 2012. Seals like it hot: Changes in surface temperature of harbour seals (Phoca vitulina) from late pregnancy to moult. Journal of Thermal Biology, 37, 454-461.
Russell, D.J.F., McConnell, B., Thompson, D., Duck, C., Morris, C., Harwood, J. and Matthiopoulos, J. 2013. Uncovering the links between foraging and breeding regions in a highly mobile mammal. Journal of Applied Ecology, 50, 499-509.
Russell, D.J.F., McClintock, B.T., Matthiopoulos, J., Thompson, P.M., Thompson, D., Hammond, P.S., Jones, E.L., MacKenzie, M.L., Moss, S. and McConnell, B.J. 2015. Intrinsic and extrinsic drivers of activity budgets in sympatric grey and harbour seals. Oikos, 124, 1462-1472.
Russell, D.J.F., Morris, C.D., Duck, C.D., Thompson, D. and Hiby, L. 2019. Monitoring long‐term changes in UK grey seal pup production. Aquatic Conservation: Marine Freshwater Ecosystems, 29(S1), 24–39.
Russell, D.J.F. & Carter, M. 2021. Grey seal independent estimate scalar: converting counts to population estimates. SCOS Briefing paper 21/02, Sea Mammal Research Unit, University of St Andrews.
Russell, D.J.F., Morris, C.D., Duck, C.D., Thompson, D. and Waitland, S.A. 2025. Trends in seal abundance and grey seal pup production. SCOS Briefing paper 25/03, Sea Mammal Research Unit, University of St Andrews.
Special Committee on Seals, (SCOS). 2025. Scientific Advice on Matters Related to the Management of Seal Populations: 2025. Natural Environmental Research Council, Sea Mammal Research Unit, University of St Andrews.
Steinmetz, K., Murphy, S., Cadhla, O.Ó., Carroll, E.L., Onoufriou, A.B., Russell, D.J.F., Cronin, M. and Mirimin, L. 2023. Population structure and genetic connectivity reveals distinctiveness of Irish harbour seals (Phoca vitulina) and implications for conservation management. Aquatic Conservation: Marine and Freshwater Ecosystems, 33(2), 160–178.
Sutherland, J.C. 2024. Killer Whale Predation of Seals in the Inshore Waters of Shetland: Investigating the Ecological Drivers and Consequences of an Apex Predator–Prey Interaction. PhD thesis (unpublished), University of St Andrews.
Thomas, L., Russell, D.J.F., Duck, C.D., Morris, C.D., Lonergan, M., Empacher, F., Thompson, D. and Harwood, J. 2019. Modelling the population size and dynamics of the British grey seal. Aquatic Conservation: Marine Freshwater Ecosystems, 29(S1), 6-23.
Thompson, P.M. and Harwood, J. 1990. Methods for estimating the population size of common seals, Phoca vitulina. Journal of Applied Ecology, 27, 924-938.
Thompson, D., Duck, C.D., Morris, C.D. and Russell, D.J.F. 2019. The status of harbour seals (Phoca vitulina) in the UK. Aquatic Conservation: Marine Freshwater Ecosystems, 29(S1), 40-60.
Thompson, P.M. and Rothery, P. 1987. Age and sex differences in the timing of moult in the common seal, Phoca vitulina. Journal of Zoology, 212, 597-603.
Appendix 1 - Harbour seal counts by SMU Subunits, 1989-2025
| Subunits within SMU 1 - Southwest Scotland | 1989 | 1996 | 2005 | 2007 | 2015 | 2018 | 2023 |
|---|---|---|---|---|---|---|---|
| 1 Solway Firth to Orroland | - | 0 | 2 | 0 | 0 | 1 | 1 |
| 2 Kirkcudbright, Fleet, and Wigtown Bay | - | 1 | 12 | 0 | 0 | 0 | 1 |
| 3 Luce Bay | - | 0 | 1 | 0 | 4 | 4 | 0 |
| 4 Outer Rhins of Galloway | - | 0 | 0 | 9 | 0 | 0 | 0 |
| 5 Loch Ryan to Turnberry | 8 | 14 | 54 | 31 | 79 | 48 | 57 |
| 6 Turnberry to Irvine | 8 | 78 | 27 | 0 | 23 | 75 | 110 |
| 7 Ardrossan, Cumbrae Is, Loch Striven | 17 | 52 | 19 | 14 | 100 | 112 | 121 |
| 8 Loch Long, L Goil, Gare L, River Clyde | 1 | 12 | 33 | 16 | 33 | 57 | 73 |
| 9 Loch Fyne | 136 | 100 | 14 | 102 | 205 | 330 | 326 |
| 10 W Bute, Loch Riddon | 2 | 84 | 75 | 46 | 109 | 134 | 190 |
| 11 Kilbrannan Sound | 24 | 92 | 76 | 161 | 237 | 290 | 212 |
| 12 Saddell to Southend | 97 | 276 | 200 | 303 | 230 | 441 | 284 |
| 13 S Arran | 86 | 195 | 97 | 147 | 166 | 201 | 160 |
| 14 E Arran | 2 | 25 | 13 | 5 | 14 | 16 | 28 |
| Total for SMU | - | 929 | 623 | 834 | 1,200 | 1,709 | 1,563 |
| Subunits within SMUsd 2a - West Scotland - South | 1996 | 2000 | 2007 | 2009 | 2014 | 2015 | 2019 | 2023 |
|---|---|---|---|---|---|---|---|---|
| 1 SW Kintyre | 62 | 51 | 56 | 17 | - | 46 | 48 | 19 |
| 2 Gigha & West Loch Tarbert | 491 | 162 | 199 | 215 | - | 359 | 369 | 381 |
| 3 Snd of Jura, L Sween, L Caolisport | 514 | 691 | 492 | 527 | - | 843 | 732 | 524 |
| 4 SE Jura | 44 | 343 | 308 | 268 | - | 699 | 514 | 349 |
| 5 SE Islay | 593 | 877 | 808 | 666 | - | 1,154 | 757 | 247 |
| 6 Laggan Bay | 2 | 88 | 79 | 104 | - | 91 | 102 | 99 |
| 7 W Islay | 0 | 119 | 88 | 0 | - | 45 | 70 | 30 |
| 8 N Islay | 6 | 3 | 13 | 6 | - | 19 | 3 | 15 |
| 9 Colonsay & Oronsay | 83 | 177 | 61 | 87 | - | 65 | 91 | 101 |
| 10 W Jura | 35 | 138 | 137 | 213 | - | 93 | 109 | 107 |
| 11 NW Jura to Seil | 306 | 313 | 262 | 275 | 284 | 263 | 314 | 299 |
| 12 Seil to SW Loch Linnhe | 455 | 537 | 326 | 530 | 351 | - | 503 | 470 |
| 13 Loch Etive | 26 | 31 | 27 | - | 41 | - | 89 | 125 |
| 14 Inner Loch Linnhe, Loch Creran | 420 | 381 | 256 | 316 | 374 | - | 401 | 249 |
| 15 NE Loch Linnhe, L Eil, L Leven | 101 | 78 | 11 | - | 62 | - | 75 | 171 |
| 16 Loch Buie | 46 | 40 | 25 | 53 | 79 | - | 53 | 76 |
| 17 SW Ross of Mull | 186 | 140 | 171 | 223 | 125 | - | 143 | 135 |
| 18 Loch Scridain | 224 | 481 | 207 | 414 | 398 | - | 228 | 381 |
| 19 Loch na Keal, Ulva, Loch Tuath | 446 | 621 | 408 | 571 | 486 | - | 581 | 454 |
| 20 Treshnish Isles | 41 | 31 | 14 | - | 0 | - | 10 | 68 |
| 21 NW Mull, SW Ardnamurchan | 46 | 89 | 67 | 78 | 84 | - | 115 | 207 |
| 22 Sound of Mull | 114 | 274 | 219 | 273 | 242 | - | 226 | 173 |
| 23 Loch Sunart | 125 | 281 | 121 | - | 243 | - | 323 | 227 |
| 24 NE Coll | 464 | 485 | 279 | - | 614 | - | 508 | 144 |
| 25 E Tiree, SW Coll | 649 | 772 | 553 | - | 759 | - | 523 | 129 |
| 26 W Tiree | 172 | 87 | 89 | - | 94 | - | 166 | 92 |
| 27 Skerryvore | - | - | - | - | 12 | - | - | 0 |
| 28 Dubh Artach | - | - | - | - | 4 | - | - | 0 |
| Total for SMU | 5,651 | 7,290 | 5,276 | - | - | 7,645 | 7,053 | 5,272 |
| Subunits within SMUsd 2b - West Scotland - Central | 1996 | 2000 | 2005 | 2007 | 2014 | 2017 | 2018 | 2022 | 2023 |
|---|---|---|---|---|---|---|---|---|---|
| 1 Hyskeir, Canna, W Rum | 19 | - | 219 | - | 381 | - | 293 | - | 157 |
| 2 E Rum, N Eigg | 2 | - | 3 | - | 24 | - | 49 | - | 27 |
| 3 S Eigg, Muck, NW Ardnamurchan | 101 | 94 | 246 | 235 | 199 | - | 322 | - | 136 |
| 4 Loch Moidart, Arisaig | 219 | 715 | 771 | 819 | 1,264 | - | 1,258 | - | 819 |
| 5 Sound of Sleat | 185 | 146 | 162 | 154 | 232 | 244 | 477 | 413 | 542 |
| 6 L Eishort, L Slapin, L Scavaig, Soay | 356 | 530 | 438 | 379 | 535 | 616 | - | 276 | - |
| 7 L Eynort | 17 | 0 | 0 | 0 | 0 | 0 | - | 24 | - |
| 8 L Bracadale | 95 | 64 | 112 | 85 | 182 | 290 | - | 303 | - |
| 9 L Dunvegan | 446 | 628 | 385 | 440 | 347 | 555 | - | 377 | - |
| 10 L Snizort | 373 | 483 | 423 | 322 | 493 | 680 | - | 385 | - |
| 11 Fladda Chuain island group | 22 | 65 | 58 | 37 | 21 | 15 | - | 155 | - |
| 12 N Snd of Raasay, N Inner Sound | 137 | 320 | 230 | 412 | 868 | 807 | - | 726 | - |
| 13 S Snd of Raasay and Lochs | 4 | 29 | 53 | 2 | 26 | 126 | - | 94 | - |
| 14 S Inner Sound | 519 | 603 | 570 | 602 | 1,113 | 1,036 | - | 653 | - |
| 15 L Alsh, L Duich, Kyle Rhea | 39 | 36 | 72 | 63 | 118 | 205 | - | 144 | - |
| 16 L Carron | 156 | 150 | 194 | 227 | 428 | 410 | - | 389 | - |
| 17 L Torridon | 3 | 36 | 20 | 53 | 188 | 288 | - | 322 | - |
| 18 L Gairloch | 7 | - | 0 | 1 | 5 | 20 | - | 34 | - |
| Total for SMU | 2,700 | 3,927 | 3,956 | 4,053 | 6,424 | - | 7,447 | - | 5,563 |
| Subunits within SMUsd 2c - West Scotland - North | 1991 | 1997 | 2005 | 2008 | 2014 | 2017 | 2022 |
|---|---|---|---|---|---|---|---|
| 1 Loch Ewe | 7 | 1 | 28 | 33 | 20 | 67 | 105 |
| 2 Gruinard Bay, L Brooms, Summer Is | 84 | 125 | 372 | 337 | 666 | 459 | 208 |
| 3 Enard bay | 6 | 13 | 30 | 38 | 56 | 140 | 194 |
| 4 Eddrachillis Bay | 207 | 252 | 257 | 277 | 355 | 378 | 352 |
| 5 Loch Laxford, Loch Inchard | 33 | 69 | 22 | 7 | 18 | 40 | 60 |
| Total for SMU | 337 | 460 | 709 | 692 | 1,115 | 1,084 | 919 |
| Subunits within SMU 3 - Western Isles | 1992 | 1996 | 2000 | 2003 | 2006 | 2008 | 2011 | 2017 | 2022 |
|---|---|---|---|---|---|---|---|---|---|
| 1 Butt of Lewis | 0 | 3 | 0 | 0 | 0 | 0 | 0 | 0 | 0 |
| 2 Broad Bay | 47 | 105 | 131 | 175 | 121 | 113 | 96 | 236 | 179 |
| 3 Outer Eye Pen., Stornoway Harbr | 0 | 1 | 4 | 0 | 1 | 0 | 10 | 31 | 42 |
| 4 Loch Liurbost, Loch Eireasort | 19 | 34 | 58 | 32 | 26 | 9 | 18 | 177 | 191 |
| 5 Loch Sealg, Shiant Islands | 0 | 1 | 2 | 1 | 0 | 0 | 1 | 78 | 110 |
| 6 L Bhrolluim, L Claidh, L Seaforth | 97 | 258 | 174 | 96 | 146 | 138 | 171 | 390 | 466 |
| 7 Scalpay, East Loch Tarbert | 22 | 103 | 43 | 69 | 96 | 71 | 142 | 184 | 193 |
| 8 SE Harris | 1 | 28 | 13 | 29 | 3 | 61 | 86 | 235 | 145 |
| 9 Sound of Harris | 341 | 471 | 323 | 242 | 229 | 103 | 136 | 49 | 102 |
| 10 Loch Maddy, Loch Euphort | 78 | 218 | 290 | 180 | - | 260 | 268 | 160 | 253 |
| 11 SE N'Uist, E Benbecula, NE S'Uist | 277 | 301 | 299 | 246 | 312 | 285 | 502 | 644 | 427 |
| 12 Loch Eynort, Loch Boisdale | 208 | 182 | 352 | 278 | 255 | 178 | 578 | 683 | 319 |
| 13 Sound of Barra | 908 | 694 | 371 | 288 | 243 | 165 | 208 | 238 | 189 |
| 14 SW Barra to Berneray | 60 | 1 | 0 | 34 | 28 | 43 | 92 | 78 | 39 |
| 15 W South Uist | 15 | 43 | 98 | 120 | 78 | 130 | 146 | 123 | 99 |
| 16 Monach Isles, W N'Uist, Haskeir | 2 | 0 | 0 | 8 | 7 | 10 | 1 | 4 | 3 |
| 17 N N'Uist, Pabbay, Shillay | 131 | 211 | 143 | 185 | 141 | 170 | 216 | 53 | 74 |
| 18 Taransay, West Loch Tarbert | 17 | 25 | 44 | 7 | 1 | 28 | 33 | 86 | 119 |
| 19 Gasker, Scarp, Braigh Mor | 0 | 0 | 0 | 0 | 0 | 0 | 0 | 2 | 0 |
| 20 Islibhig to Valtos | 0 | 0 | 0 | 0 | 0 | 0 | 0 | 0 | 0 |
| 21 Loch Roag | 103 | 141 | 68 | 77 | 53 | 40 | 35 | 81 | 130 |
| 22 NW Lewis | 0 | 0 | 0 | 0 | 0 | 0 | 0 | 0 | 0 |
| 23 North Rona & Sula Sgeir | - | - | - | - | 0 | - | - | 0 | - |
| 24 Flannan Isles | - | - | - | - | 0 | - | - | 0 | - |
| 25 St Kilda | - | - | - | - | - | - | - | - | - |
| Total for SMU | 2,326 | 2,820 | 2,413 | 2,067 | 1,920 | 1,804 | 2,739 | 3,532 | 3,080 |
| Subunits within SMUsd 4a - North Coast | 1991 | 1997 | 2005 | 2008 | 2013 | 2016 | 2025 |
|---|---|---|---|---|---|---|---|
| 1 Cape Wrath to Faraid Head | 16 | 0 | 0 | 3 | 0 | 0 | 15 |
| 2 Faraid Head to Strathan | 147 | 32 | 39 | 0 | 0 | 4 | 1 |
| 3 Strathan to Strathy Pt | 48 | 92 | 34 | 26 | 14 | 24 | 47 |
| 4 Strathy Point to Thurso | 0 | 0 | 0 | 0 | 2 | 0 | 0 |
| 5 Thurso to Duncansby Head | 0 | 141 | 101 | 83 | 57 | 81 | 83 |
| 6 Sule Skerry & Sule Stack | - | - | 0 | - | - | 0 | 0 |
| Total for SMU | 211 | 265 | 174 | 112 | 73 | 109 | 146 |
| Subunits within SMUsd 4b - Orkney | 1993 | 1997 | 2001 | 2006 | 2007 | 2008 | 2010 | 2013 | 2016 | 2019 | 2024 |
|---|---|---|---|---|---|---|---|---|---|---|---|
| 1 N Westray & Papa Westray | 519 | 570 | 1,043 | 219 | 229 | 200 | 181 | 99 | 72 | 71 | 51 |
| 2 N Sanday & N'Ronaldsay | 1,735 | 1,829 | 1,369 | 702 | 602 | 521 | 297 | 228 | 208 | 189 | 104 |
| 3 S Sanday, Stronsay, E Eday | 1,138 | 1,283 | 1,055 | 489 | 413 | 342 | 294 | 156 | 63 | 91 | 64 |
| 4 NW Eday, S Westray | 264 | 264 | 297 | 278 | 167 | 144 | 127 | 127 | 87 | 60 | 44 |
| 5 N Mainland, Rousay, N Shap. | 580 | 1,261 | 1,021 | 800 | 612 | 572 | 715 | 330 | 171 | 280 | 226 |
| 6 Finstown to Mull Head | 746 | 169 | 203 | 392 | 310 | 304 | 254 | 217 | 188 | 207 | 164 |
| 7 Mull Head to Grim Ness | 433 | 596 | 338 | 8 | 20 | 55 | 32 | 30 | 20 | 34 | - |
| 8 S S'Ron. & islands to S | 122 | 57 | 91 | 46 | 24 | 14 | 25 | 6 | 0 | 1 | - |
| 9 SW Hoy | 43 | 59 | 13 | 2 | 24 | 4 | 8 | 0 | 1 | 0 | - |
| 10 Scapa Fl. (Houton to Switha) | 1,884 | 1,511 | 1,692 | 882 | 649 | 478 | 513 | 390 | 291 | 249 | - |
| 11 N Hoy & SW Mainland | 401 | 892 | 627 | 398 | 291 | 225 | 221 | 234 | 107 | 84 | - |
| 12 W Mainland | 8 | 31 | 3 | 22 | 33 | 8 | 20 | 48 | 32 | 30 | 14 |
| Total for SMUsd | 7,873 | 8,522 | 7,752 | 4,238 | 3,374 | 2,867 | 2,687 | 1,865 | 1,240 | 1,296 | - |
| Subunits within SMU 5 - Shetland | 1991 | 1993 | 1997 | 2001 | 2006 | 2009 | 2015 | 2019 | 2025 |
|---|---|---|---|---|---|---|---|---|---|
| 1 N Unst | 7 | 11 | 11 | 15 | 1 | 1 | 7 | 4 | 1 |
| 2 E&S Unst, E Yell, Fetlar | 611 | 791 | 500 | 177 | 55 | 98 | 96 | 106 | 102 |
| 3 SE Yell, NE Mainland | 337 | 266 | 336 | 248 | 165 | 147 | 262 | 293 | 171 |
| 4 Out Skerries, Whalsay, Dury Voe | 784 | 850 | 571 | 564 | 144 | 280 | 197 | 216 | 102 |
| 5 South Nesting Bay to Bressay | 253 | 377 | 373 | 193 | 189 | 183 | 316 | 285 | 120 |
| 6 SE Mainland (Lerwick to Exnaboe) | 723 | 1,262 | 1,176 | 1,016 | 698 | 618 | 307 | 183 | 123 |
| 7 SW Mainland (Exnaboe to St Ninian's) | 262 | 335 | 265 | 211 | 106 | 88 | 121 | 99 | 58 |
| 8 St Ninian's to The Deeps | 209 | 323 | 352 | 255 | 343 | 255 | 447 | 395 | 208 |
| 9 Gruting Voe, Vaila Sound | 50 | 70 | 72 | 73 | 62 | 50 | 70 | 81 | 57 |
| 10 Dale to Busta Voe,Papa Stour & Ve Sk. | 293 | 568 | 527 | 765 | 345 | 486 | 463 | 429 | 314 |
| 11 N St Magnus Bay, Esha Ness | 154 | 243 | 208 | 244 | 155 | 121 | 268 | 294 | 131 |
| 12 Ronas Voe, W North Roe | 60 | 6 | 26 | 31 | 15 | 14 | 16 | 17 | 4 |
| 13 Fethaland, Yell Sound, Sullom Voe | 827 | 869 | 1,357 | 987 | 659 | 589 | 733 | 692 | 290 |
| 14 N Yell, W Unst | 227 | 253 | 217 | 104 | 65 | 73 | 48 | 60 | 31 |
| 15 Foula | 0 | 3 | - | - | 36 | - | 18 | 26 | 32 |
| 16 Fair Isle | - | - | - | - | - | - | - | 0 | - |
| Total for SMU | 4,797 | 6,227 | 5,994 | 4,886 | 3,038 | 3,039 | 3,369 | 3,180 | 1,744 |
| Subunits within SMU 6 - Moray Firth | 1994 | 1997 | 2005 | 2008 | 2011 | 2013 | 2016 | 2019 | 2021 | 2023 | 2024 | 2025 |
|---|---|---|---|---|---|---|---|---|---|---|---|---|
| 1 Duncansby Head to Wick | 1 | 0 | 1 | 1 | - | - | - | 5 | - | - | - | 3 |
| 2 Wick to Lybster | 0 | 0 | 0 | 0 | 0 | - | - | 0 | - | - | 0 | 0 |
| 3 Lybster to Helmsdale | 1 | 1 | 0 | 0 | 0 | - | - | 0 | - | - | 0 | 0 |
| 4 Helmsdale to Loch Fleet | 108 | 220 | 184 | 155 | 200 | 205 | 185 | 126 | 142 | 175 | 176 | - |
| 5 Dornoch Firth | 542 | 593 | 191 | 145 | 208 | 143 | 85 | 62 | 69 | 55 | 46 | - |
| 6 Fearn Peninsula | 0 | 0 | 0 | 0 | 0 | 0 | 0 | 0 | 0 | - | - | - |
| 7 Cromarty Firth | 95 | 95 | 106 | 90 | 101 | 63 | 72 | 84 | 82 | 104 | 83 | - |
| 8 Beauly Firth to Fort George | 203 | 219 | 127 | 150 | 57 | 30 | 30 | 24 | 67 | 56 | 42 | - |
| 9 Ardersier to Findhorn | 279 | 280 | 303 | 237 | 358 | 417 | 520 | 729 | 273 | 522 | 386 | - |
| 10 Burghead Bay to River Spey | 0 | 0 | 0 | 0 | 0 | 0 | 0 | - | 0 | 0 | - | - |
| 11 River Spey to Macduff | 0 | 1 | 3 | 0 | 22 | 33 | 45 | - | 52 | 29 | - | - |
| 12 Macduff to Fraserburgh | 0 | 0 | 0 | 0 | 7 | 6 | 2 | - | 0 | 0 | - | - |
| Total for SMU | 1,229 | 1,409 | 915 | 778 | 954 | 898 | 940 | 1,077 | 690 | 946 | 767 | - |
| Subunits within SMU 7 - East Scotland | 1997 | 2005 | 2007 | 2013 | 2015 | 2016 | 2018 | 2021 | 2022 | 2023 | 2025 |
|---|---|---|---|---|---|---|---|---|---|---|---|
| 1 Fraserburgh to Ythan estuary | 0 | 14 | 22 | 2 | - | 8 | - | 0 | - | 0 | - |
| 2 Aberdeen to Doolie Ness | 15 | 22 | 0 | 0 | - | 17 | - | 21 | - | 26 | - |
| 3 Montrose to Carnoustie | 0 | 9 | 2 | 16 | - | 28 | - | 31 | - | 37 | - |
| 4 Tay and Eden estuaries | 633 | 335 | 275 | 50 | 60 | 51 | 40 | 41 | 34 | 55 | 55 |
| 5 Fife Ness, Isle of May | 0 | 0 | 0 | 0 | - | 0 | - | 0 | - | - | - |
| 6 Inner Firth of Forth | 0 | 17 | 10 | 23 | - | - | 45 | 52 | 16 | - | - |
| 7 Outer Firth of Forth | 116 | 249 | 138 | 123 | - | - | 204 | 117 | 58 | - | - |
| 8 Bass Rock to Pease Bay | 0 | 14 | 0 | - | 0 | - | 0 | 0 | 0 | - | - |
| 9 Pease Bay to border | 0 | 0 | 0 | - | 0 | - | 0 | 0 | - | - | - |
| 10 Bell Rock | - | - | - | - | - | - | - | - | - | - | - |
| Total for SMU | 764 | 660 | 447 | 214 | - | - | 342 | 262 | - | 192 | - |
Appendix 2 - Harbour seal distribution maps for previous census periods
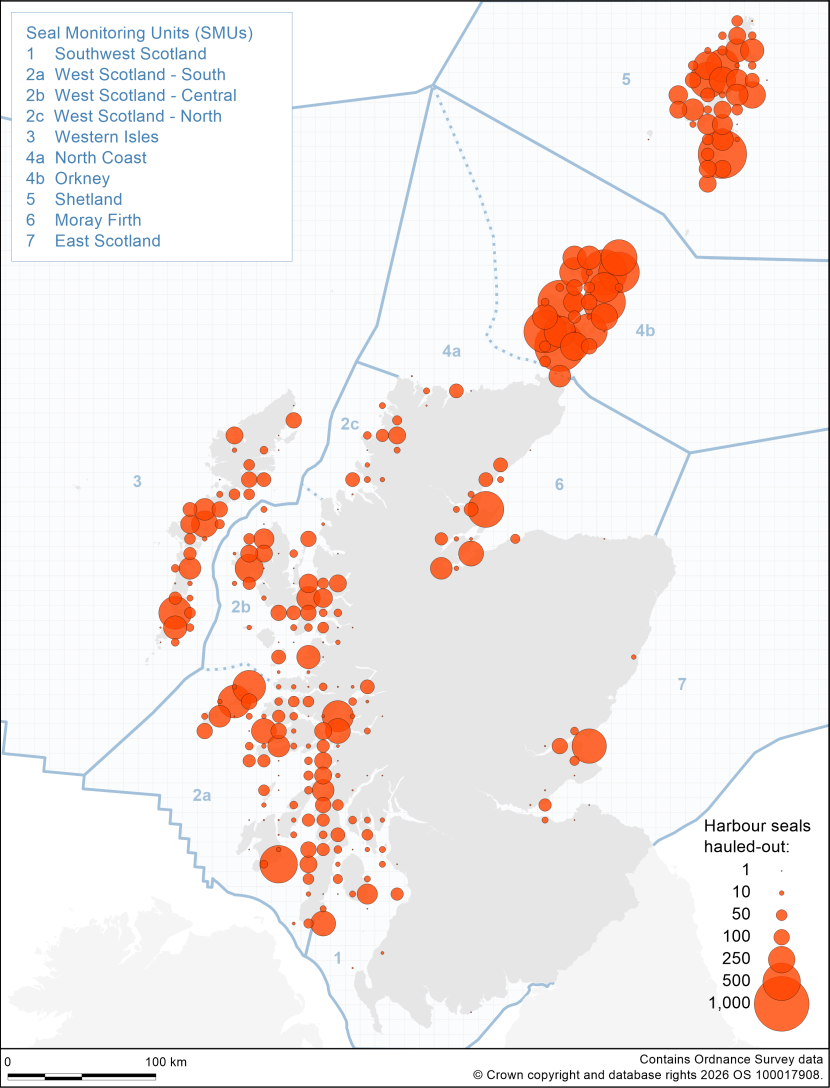
Figure A1. Map of harbour seal distribution by 10x10km grid cells based on haul-out counts obtained from the most recent aerial surveys carried out during the harbour seal moult in August 1996-1997.
Click for a full description
Map of the number of hauled out harbour seals counted around Scotland's coast during August in 1996 and 1997. For each 10 km x 10 km grid square, proportionally sized red circles indicate the number of hauled out seals counted. The legend gives the symbol sizes for seven values. From smallest to largest these represent counts of 1, 10, 50, 100, 250, 500, 1000 seals.
The proportion of the population hauled out during the survey window, and available to count, is estimated to be around 72% (95% CI: 54-88%; Lonergan et al., 2013).
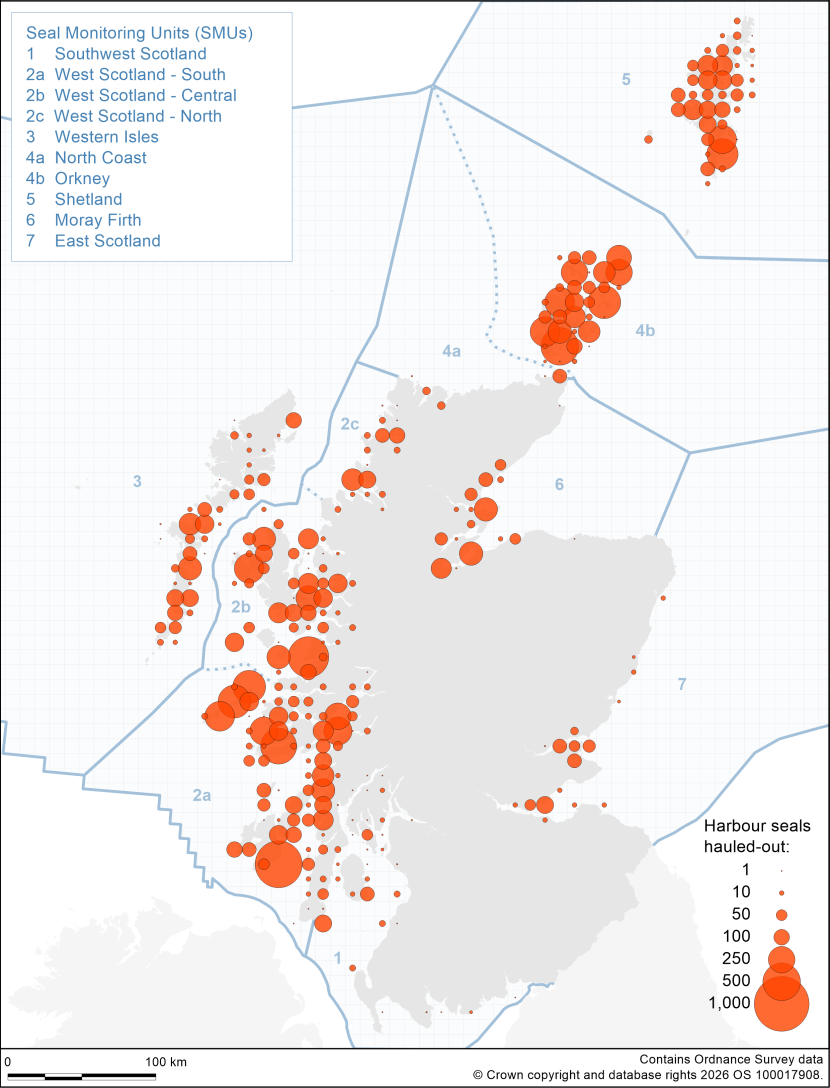
Figure A2. Map of harbour seal distribution by 10x10km grid cells based on haul-out counts obtained from the most recent aerial surveys carried out during the harbour seal moult in August 2000-2006.
Click for a full description
Map of the number of hauled out harbour seals counted around Scotland's coast during August between 2000 and 2006. For each 10 km x 10 km grid square, proportionally sized red circles indicate the number of hauled out seals counted. The legend gives the symbol sizes for seven values. From smallest to largest these represent counts of 1, 10, 50, 100, 250, 500, 1000 seals.
The proportion of the population hauled out during the survey window, and available to count, is estimated to be around 72% (95% CI: 54-88%; Lonergan et al., 2013).
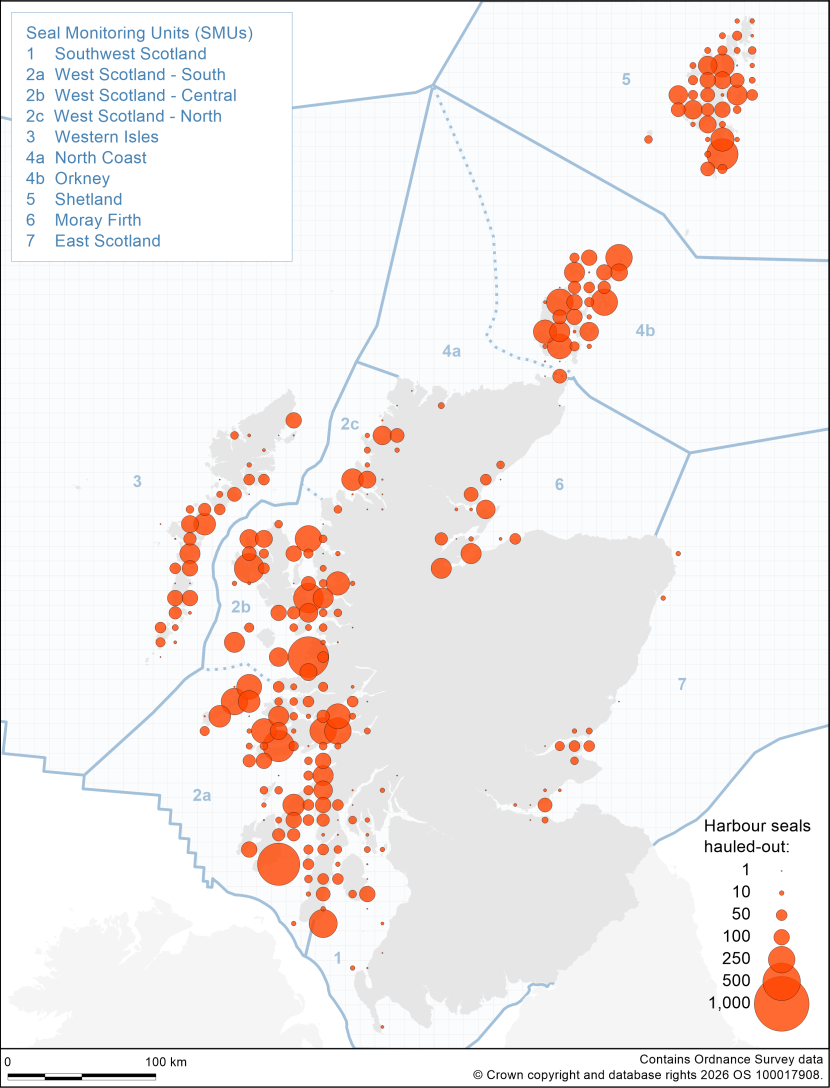
Figure A3. Map of harbour seal distribution by 10x10km grid cells based on haul-out counts obtained from the most recent aerial surveys carried out during the harbour seal moult in August 2007-2009.
Click for a full description
Map of the number of hauled out harbour seals counted around Scotland's coast during August between 2007 and 2009. For each 10 km x 10 km grid square, proportionally sized red circles indicate the number of hauled out seals counted. The legend gives the symbol sizes for seven values. From smallest to largest these represent counts of 1, 10, 50, 100, 250, 500, 1000 seals.
The proportion of the population hauled out during the survey window, and available to count, is estimated to be around 72% (95% CI: 54-88%; Lonergan et al., 2013).
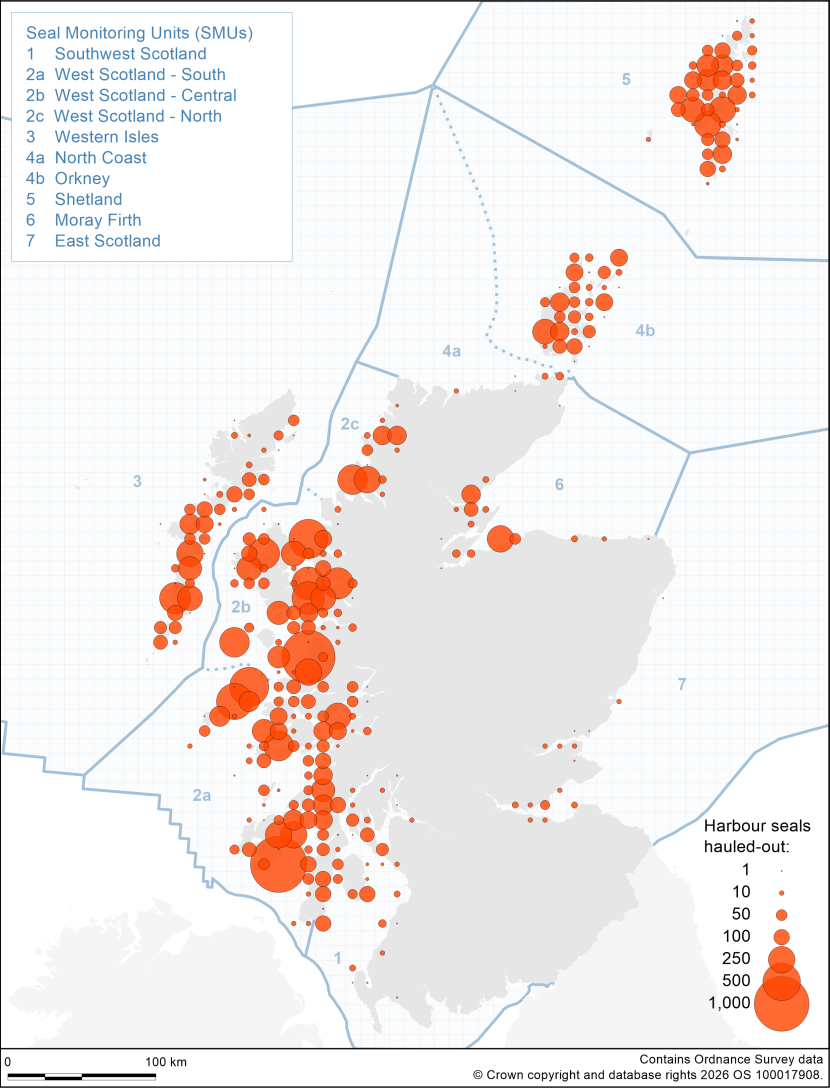
Figure A4. Map of harbour seal distribution by 10x10km grid cells based on haul-out counts obtained from the most recent aerial surveys carried out during the harbour seal moult in August 2011-2015.
Click for a full description
Map of the number of hauled out harbour seals counted around Scotland's coast during August between 2011 and 2015. For each 10 km x 10 km grid square, proportionally sized red circles indicate the number of hauled out seals counted. The legend gives the symbol sizes for seven values. From smallest to largest these represent counts of 1, 10, 50, 100, 250, 500, 1000 seals.
The proportion of the population hauled out during the survey window, and available to count, is estimated to be around 72% (95% CI: 54-88%; Lonergan et al., 2013).
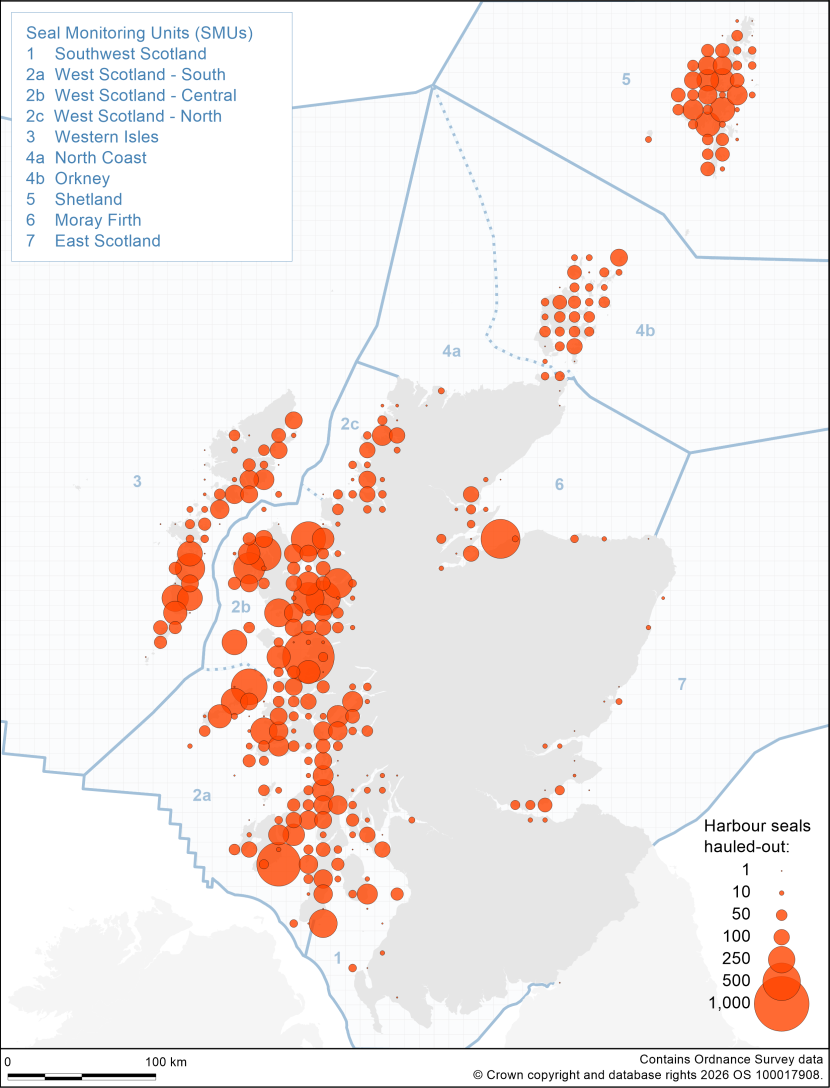
Figure A5. Map of harbour seal distribution by 10x10km grid cells based on haul-out counts obtained from the most recent aerial surveys carried out during the harbour seal moult in August 2016-2019.
Click for a full description
Map of the number of hauled out harbour seals counted around Scotland's coast during August between 2016 and 2019. For each 10 km x 10 km grid square, proportionally sized red circles indicate the number of hauled out seals counted. The legend gives the symbol sizes for seven values. From smallest to largest these represent counts of 1, 10, 50, 100, 250, 500, 1000 seals.
The proportion of the population hauled out during the survey window, and available to count, is estimated to be around 72% (95% CI: 54-88%; Lonergan et al., 2013).
Appendix 3 - Harbour seal trends in SMU 5
The selected model for harbour seal trends in SMU 5 is shown in the relevant section. However, as discussed there, whether the current abundance estimate represents an ongoing decline (as fitted) or a depletion is unknown. As such the model fitted to the data up to 2019 (Russell et al., 2025) is shown here and the latest data point displayed.
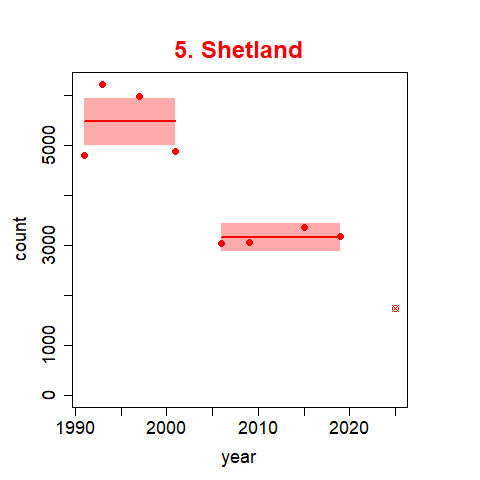
Figure A6. The predicted trend and associated 95% confidence intervals for harbour seal counts in Shetland up to 2019.
Click for a full description
The filled circle points represent the values used to fit the trends. The latest count (2025) is also shown.
Line graph showing the predicted trend with 95% confidence intervals and count values used to fit the trend for harbour seal counts in the Shetland SMU (red line with red shaded area filled red circle points) over the period 1991 – 2019. The latest count (2025), shown as a red circle cross symbol, was not included in the trend analysis shown here. Counts were relatively high at the start of the time series with no clear trend, before dropping significantly between 2001 and 2006, and then remaining stable at this lower level for several years. The 2025 count was significantly lower than the previous count in 2019.
Appendix 4 - Grey seal counts by SMU Subunits, 1989-2025
| Subunits within SMU 1 - Southwest Scotland | 1989 | 1996 | 2005 | 2007 | 2015 | 2018 | 2023 |
|---|---|---|---|---|---|---|---|
| 1 Solway Firth to Orroland | - | 36 | 23 | 45 | 0 | 23 | 58 |
| 2 Kirkcudbright, Fleet, and Wigtown Bay | - | 0 | 8 | 6 | 1 | 11 | 18 |
| 3 Luce Bay | - | 37 | 43 | 43 | 26 | 33 | 81 |
| 4 Outer Rhins of Galloway | - | 0 | 0 | 2 | 4 | 19 | 24 |
| 5 Loch Ryan to Turnberry | 0 | 2 | 6 | 18 | 96 | 38 | 111 |
| 6 Turnberry to Irvine | 20 | 0 | 27 | 23 | 50 | 21 | 65 |
| 7 Ardrossan, Cumbrae Is, Loch Striven | 7 | 0 | 13 | 16 | 24 | 9 | 17 |
| 8 Loch Long, L Goil, Gare L, River Clyde | 8 | 0 | 0 | 4 | 6 | 27 | 21 |
| 9 Loch Fyne | 20 | 0 | 0 | 6 | 6 | 4 | 5 |
| 10 W Bute, Loch Riddon | 0 | 0 | 3 | 13 | 3 | 4 | 7 |
| 11 Kilbrannan Sound | 0 | 0 | 6 | 11 | 18 | 16 | 20 |
| 12 Saddell to Southend | 60 | 0 | 65 | 166 | 115 | 287 | 314 |
| 13 S Arran | 0 | 0 | 12 | 14 | 21 | 19 | 18 |
| 14 E Arran | 2 | 0 | 0 | 7 | 4 | 6 | 1 |
| Total for SMU | - | 75 | 206 | 374 | 374 | 517 | 760 |
| Subunits within SMUsd 2a - West Scotland - South | 1996 | 2000 | 2007 | 2009 | 2014 | 2015 | 2019 | 2023 |
|---|---|---|---|---|---|---|---|---|
| 1 SW Kintyre | 3 | 3 | 0 | 4 | - | 70 | 14 | 27 |
| 2 Gigha & West Loch Tarbert | 3 | 9 | 13 | 2 | - | 22 | 25 | 24 |
| 3 Snd of Jura, L Sween, L Caolisport | 0 | 20 | 8 | 10 | - | 30 | 21 | 20 |
| 4 SE Jura | 0 | 21 | 43 | 10 | - | 36 | 40 | 26 |
| 5 SE Islay | 1 | 5 | 37 | 0 | - | 21 | 22 | 18 |
| 6 Laggan Bay | 4 | 18 | 3 | 44 | - | 29 | 25 | 32 |
| 7 W Islay | 143 | 33 | 59 | 257 | - | 230 | 100 | 170 |
| 8 N Islay | 293 | 343 | 445 | 351 | - | 489 | 362 | 488 |
| 9 Colonsay & Oronsay | 265 | 399 | 416 | 455 | - | 1,099 | 787 | 934 |
| 10 W Jura | 25 | 9 | 23 | 33 | - | 41 | 42 | 70 |
| 11 NW Jura to Seil | 2 | 4 | 9 | 10 | 14 | 26 | 19 | 38 |
| 12 Seil to SW Loch Linnhe | 0 | 27 | 3 | 5 | 21 | - | 6 | 10 |
| 13 Loch Etive | 0 | 0 | 0 | - | 0 | - | 8 | 7 |
| 14 Inner Loch Linnhe, Loch Creran | 0 | 1 | 1 | 6 | 8 | - | 8 | 12 |
| 15 NE Loch Linnhe, L Eil, L Leven | 0 | 0 | 0 | - | 0 | - | 3 | 4 |
| 16 Loch Buie | 0 | 4 | 5 | 2 | 9 | - | 3 | 2 |
| 17 SW Ross of Mull | 32 | 43 | 52 | 41 | 66 | - | 208 | 154 |
| 18 Loch Scridain | 6 | 23 | 13 | 17 | 6 | - | 20 | 15 |
| 19 Loch na Keal, Ulva, Loch Tuath | 23 | 7 | 13 | 17 | 13 | - | 21 | 17 |
| 20 Treshnish Isles | 170 | 65 | 73 | - | 85 | - | 209 | 169 |
| 21 NW Mull, SW Ardnamurchan | 1 | 11 | 17 | 23 | 17 | - | 16 | 19 |
| 22 Sound of Mull | 1 | 0 | 0 | 0 | 5 | - | 3 | 5 |
| 23 Loch Sunart | 0 | 5 | 0 | - | 3 | - | 3 | 0 |
| 24 NE Coll | 53 | 146 | 22 | - | 117 | - | 65 | 96 |
| 25 E Tiree, SW Coll | 240 | 158 | 83 | - | 466 | - | 234 | 193 |
| 26 W Tiree | 860 | 420 | 323 | - | 653 | - | 602 | 202 |
| 27 Skerryvore | - | - | - | - | 29 | - | - | 53 |
| 28 Dubh Artach | - | - | - | - | 27 | - | - | 41 |
| Total for SMU | 2,125 | 1,774 | 1,661 | - | - | 3,618 | 2,866 | 2,846 |
| Subunits within SMUsd 2b - West Scotland - Central | 1996 | 2000 | 2005 | 2007 | 2014 | 2017 | 2018 | 2022 | 2023 |
|---|---|---|---|---|---|---|---|---|---|
| 1 Hyskeir, Canna, W Rum | 479 | - | 126 | - | 563 | - | 221 | - | 410 |
| 2 E Rum, N Eigg | 50 | - | 9 | - | 6 | - | 9 | - | 15 |
| 3 S Eigg, Muck, NW Ardnamurchan | 22 | 22 | 39 | 39 | 94 | - | 37 | - | 77 |
| 4 Loch Moidart, Arisaig | 0 | 4 | 9 | 4 | 8 | - | 10 | - | 8 |
| 5 Sound of Sleat | 2 | 19 | 7 | 1 | 4 | 5 | 2 | 2 | 3 |
| 6 L Eishort, L Slapin, L Scavaig, Soay | 5 | 7 | 6 | 10 | 26 | 9 | - | 11 | - |
| 7 L Eynort | 0 | 9 | 9 | 6 | 13 | 17 | - | 34 | - |
| 8 L Bracadale | 76 | 61 | 16 | 39 | 26 | 40 | - | 21 | - |
| 9 L Dunvegan | 9 | 7 | 8 | 32 | 7 | 21 | - | 7 | - |
| 10 L Snizort | 75 | 104 | 17 | 31 | 61 | 40 | - | 47 | - |
| 11 Fladda Chuain island group | 213 | 135 | 74 | 64 | 98 | 271 | - | 152 | - |
| 12 N Snd of Raasay, N Inner Sound | 0 | 9 | 11 | 13 | 70 | 39 | - | 54 | - |
| 13 S Snd of Raasay and Lochs | 0 | 0 | 0 | 0 | 5 | 2 | - | 4 | - |
| 14 S Inner Sound | 0 | 3 | 6 | 12 | 18 | 18 | - | 25 | - |
| 15 L Alsh, L Duich, Kyle Rhea | 0 | 1 | 19 | 4 | 24 | 9 | - | 12 | - |
| 16 L Carron | 0 | 1 | 0 | 0 | 1 | 1 | - | 1 | - |
| 17 L Torridon | 0 | 0 | 5 | 0 | 28 | 17 | - | 16 | - |
| 18 L Gairloch | 0 | 0 | 0 | 3 | 4 | 10 | - | 57 | - |
| Total for SMU | 931 | 911 | 361 | 393 | 1,056 | - | 773 | - | 954 |
| Subunits within SMUsd 2c - West Scotland - North | 1991 | 1997 | 2005 | 2008 | 2014 | 2017 | 2022 |
|---|---|---|---|---|---|---|---|
| 1 Loch Ewe | 0 | 15 | 1 | 3 | 22 | 10 | 51 |
| 2 Gruinard Bay, L Brooms, Summer Is | 21 | 24 | 87 | 68 | 164 | 116 | 109 |
| 3 Enard bay | 9 | 51 | 7 | 7 | 9 | 85 | 91 |
| 4 Eddrachillis Bay | 3 | 153 | 116 | 54 | 166 | 210 | 326 |
| 5 Loch Laxford, Loch Inchard | 157 | 136 | 40 | 45 | 29 | 58 | 131 |
| Total for SMU | 190 | 379 | 251 | 177 | 390 | 479 | 708 |
| Subunits within SMU 3 - Western Isles | 1992 | 1996 | 2000 | 2003 | 2006 | 2008 | 2011 | 2017 | 2022 | 2023 |
|---|---|---|---|---|---|---|---|---|---|---|
| 1 Butt of Lewis | 107 | 106 | 211 | 72 | 68 | 23 | 58 | 59 | 80 | - |
| 2 Broad Bay | 4 | 40 | 45 | 122 | 48 | 97 | 17 | 316 | 24 | - |
| 3 Outer Eye Pen., Stornoway Harbr | 2 | 9 | 31 | 0 | 3 | 1 | 4 | 9 | 8 | - |
| 4 Loch Liurbost, Loch Eireasort | 3 | 0 | 7 | 3 | 0 | 4 | 1 | 21 | 3 | - |
| 5 Loch Sealg, Shiant Islands | 19 | 99 | 121 | 0 | 150 | 193 | 114 | 250 | 49 | - |
| 6 L Bhrolluim, L Claidh, L Seaforth | 5 | 7 | 16 | 13 | 16 | 29 | 7 | 31 | 18 | - |
| 7 Scalpay, East Loch Tarbert | 0 | 0 | 0 | 0 | 0 | 1 | 2 | 6 | 5 | - |
| 8 SE Harris | 0 | 12 | 22 | 8 | 1 | 7 | 4 | 6 | 1 | - |
| 9 Sound of Harris | 183 | 157 | 474 | 212 | 211 | 179 | 285 | 299 | 355 | - |
| 10 Loch Maddy, Loch Euphort | 0 | 3 | 8 | 3 | - | 0 | 1 | 0 | 0 | - |
| 11 SE N'Uist, E Benbecula, NE S'Uist | 1 | 0 | 11 | 14 | 7 | 12 | 42 | 61 | 33 | - |
| 12 Loch Eynort, Loch Boisdale | 8 | 19 | 29 | 6 | 5 | 10 | 45 | 52 | 16 | - |
| 13 Sound of Barra | 223 | 289 | 634 | 417 | 214 | 281 | 420 | 382 | 398 | - |
| 14 SW Barra to Berneray | 124 | 781 | 316 | 295 | 227 | 280 | 670 | 681 | 669 | - |
| 15 W South Uist | 43 | 212 | 196 | 103 | 82 | 159 | 201 | 118 | 197 | - |
| 16 Monach Isles, W N'Uist, Haskeir | 1,808 | 2,059 | 2,622 | 1,372 | 2,043 | 1,529 | 1,613 | 2,895 | 886 | - |
| 17 N N'Uist, Pabbay, Shillay | 113 | 58 | 106 | 199 | 30 | 145 | 107 | 41 | 141 | - |
| 18 Taransay, West Loch Tarbert | 34 | 45 | 92 | 95 | 11 | 99 | 67 | 65 | 106 | - |
| 19 Gasker, Scarp, Braigh Mor | 90 | 117 | 133 | 117 | 40 | 296 | 60 | 56 | 185 | - |
| 20 Islibhig to Valtos | 7 | 13 | 3 | 5 | 0 | 15 | 3 | 11 | 2 | - |
| 21 Loch Roag | 52 | 36 | 99 | 8 | 114 | 45 | 20 | 119 | 56 | - |
| 22 NW Lewis | 0 | 0 | 3 | 0 | 0 | 2 | 2 | 0 | 0 | - |
| 23 North Rona & Sula Sgeir | - | - | - | - | 179 | - | - | 209 | - | 151 |
| 24 Flannan Isles | - | - | - | - | 222 | - | - | 86 | - | 90 |
| 25 St Kilda | - | - | - | - | - | - | - | - | - | - |
| Total for SMU | 2,826 | 4,062 | 5,179 | 3,064 | 3,674 | 3,808 | 4,144 | 5,773 | 3,232 | - |
| Subunits within SMUsd 4a - North Coast | 1991 | 1997 | 2005 | 2008 | 2013 | 2016 | 2025 |
|---|---|---|---|---|---|---|---|
| 1 Cape Wrath to Faraid Head | 60 | 203 | 41 | 45 | 68 | 21 | 45 |
| 2 Faraid Head to Strathan | 26 | 365 | 309 | 190 | 31 | 169 | 92 |
| 3 Strathan to Strathy Pt | 2 | 29 | 3 | 43 | 10 | 4 | 3 |
| 4 Strathy Point to Thurso | 0 | 0 | 0 | 1 | 0 | 0 | 15 |
| 5 Thurso to Duncansby Head | 1 | 0 | 2 | 65 | 86 | 149 | 38 |
| 6 Sule Skerry & Sule Stack | - | - | 160 | - | - | 71 | 90 |
| Total for SMU | 89 | 597 | 515 | 504 | 355 | 414 | 283 |
| Subunits within SMUsd 4b - Orkney | 1993 | 1997 | 2001 | 2006 | 2007 | 2008 | 2010 | 2013 | 2016 | 2019 |
|---|---|---|---|---|---|---|---|---|---|---|
| 1 N Westray & Papa Westray | 153 | 551 | 178 | 287 | 756 | 895 | 557 | 364 | 501 | 321 |
| 2 N Sanday & N'Ronaldsay | 1,368 | 1,495 | 480 | 1,335 | 1,508 | 678 | 264 | 808 | 1,303 | 1,513 |
| 3 S Sanday, Stronsay, E Eday | 1,621 | 3,669 | 822 | 1,914 | 1,672 | 2,368 | 2,407 | 2,513 | 2,048 | 2,471 |
| 4 NW Eday, S Westray | 350 | 389 | 689 | 669 | 613 | 670 | 460 | 632 | 401 | 308 |
| 5 N Mainland, Rousay, N Shap. | 229 | 790 | 246 | 715 | 604 | 769 | 435 | 506 | 346 | 581 |
| 6 Finstown to Mull Head | 122 | 66 | 21 | 175 | 108 | 112 | 92 | 311 | 66 | 200 |
| 7 Mull Head to Grim Ness | 177 | 757 | 86 | 443 | 162 | 354 | 535 | 657 | 571 | 538 |
| 8 S S'Ron. & islands to S | 2,481 | 501 | 183 | 3,372 | 1,187 | 1,602 | 3,862 | 1,182 | 2,830 | 1,154 |
| 9 SW Hoy | 165 | 31 | 0 | 30 | 111 | 298 | 200 | 2 | 276 | 163 |
| 10 Scapa Fl. (Houton to Switha) | 35 | 268 | 17 | 351 | 249 | 196 | 175 | 540 | 691 | 748 |
| 11 N Hoy & SW Mainland | 115 | 292 | 163 | 288 | 125 | 79 | 94 | 318 | 258 | 187 |
| 12 W Mainland | 5 | 21 | 28 | 0 | 20 | 0 | 2 | 7 | 9 | 1 |
| Total for SMUsd | 6,821 | 8,830 | 2,913 | 9,579 | 7,115 | 8,021 | 9,083 | 7,840 | 9,300 | 8,185 |
| Subunits within SMU 5 - Shetland | 1991 | 1993 | 1997 | 2001 | 2006 | 2009 | 2015 | 2019 | 2025 |
|---|---|---|---|---|---|---|---|---|---|
| 1 N Unst | 25 | 62 | 75 | 17 | 1 | 5 | 16 | 0 | 3 |
| 2 E&S Unst, E Yell, Fetlar | 102 | 17 | 38 | 10 | 19 | 106 | 144 | 52 | 88 |
| 3 SE Yell, NE Mainland | 0 | 2 | 63 | 1 | 14 | 42 | 95 | 69 | 33 |
| 4 Out Skerries, Whalsay, Dury Voe | 10 | 0 | 436 | 247 | 129 | 143 | 425 | 344 | 22 |
| 5 South Nesting Bay to Bressay | 1 | 0 | 86 | 5 | 157 | 165 | 126 | 49 | 23 |
| 6 SE Mainland (Lerwick to Exnaboe) | 2 | 29 | 60 | 24 | 134 | 85 | 69 | 57 | 58 |
| 7 SW Mainland (Exnaboe to St Ninian's) | 45 | 605 | 639 | 705 | 70 | 383 | 84 | 67 | 26 |
| 8 St Ninian's to The Deeps | 20 | 27 | 22 | 4 | 4 | 68 | 106 | 25 | 38 |
| 9 Gruting Voe, Vaila Sound | 0 | 1 | 0 | 0 | 6 | 13 | 16 | 11 | 24 |
| 10 Dale to Busta Voe,Papa Stour & Ve Sk. | 29 | 349 | 84 | 185 | 451 | 225 | 223 | 96 | 177 |
| 11 N St Magnus Bay, Esha Ness | 44 | 37 | 43 | 20 | 91 | 17 | 62 | 34 | 60 |
| 12 Ronas Voe, W North Roe | 30 | 71 | 35 | 28 | 35 | 0 | 9 | 9 | 0 |
| 13 Fethaland, Yell Sound, Sullom Voe | 12 | 31 | 70 | 18 | 64 | 92 | 126 | 80 | 35 |
| 14 N Yell, W Unst | 20 | 21 | 35 | 14 | 18 | 14 | 8 | 11 | 31 |
| 15 Foula | 37 | 38 | - | - | 178 | - | 49 | 24 | 21 |
| 16 Fair Isle | - | - | - | - | - | - | - | 81 | - |
| Total for SMU | 377 | 1,290 | 1,724 | 1,316 | 1,371 | 1,536 | 1,558 | 1,009 | 720 |
| Subunits within SMU 6 - Moray Firth | 1994 | 1997 | 2005 | 2008 | 2011 | 2013 | 2016 | 2019 | 2021 | 2023 |
|---|---|---|---|---|---|---|---|---|---|---|
| 1 Duncansby Head to Wick | 8 | 0 | 18 | 7 | - | - | - | 19 | - | - |
| 2 Wick to Lybster | 25 | 0 | 31 | 2 | 4 | - | - | 31 | - | - |
| 3 Lybster to Helmsdale | 0 | 0 | 10 | 0 | 4 | - | - | 0 | - | - |
| 4 Helmsdale to Loch Fleet | 0 | 3 | 101 | 450 | 163 | 99 | 59 | 208 | 275 | 78 |
| 5 Dornoch Firth | 903 | 456 | 431 | 523 | 679 | 604 | 387 | 401 | 639 | 135 |
| 6 Fearn Peninsula | 0 | 0 | 0 | 0 | 0 | 0 | 0 | 0 | 0 | - |
| 7 Cromarty Firth | 0 | 0 | 0 | 0 | 2 | 3 | 1 | 0 | 1 | 2 |
| 8 Beauly Firth to Fort George | 2 | 3 | 0 | 0 | 3 | 5 | 2 | 1 | 14 | 1 |
| 9 Ardersier to Findhorn | 36 | 24 | 66 | 217 | 253 | 327 | 745 | 954 | 393 | 609 |
| 10 Burghead Bay to River Spey | 30 | 21 | 76 | 8 | 12 | 0 | 38 | - | 93 | 38 |
| 11 River Spey to Macduff | 0 | 11 | 51 | 30 | 6 | 86 | 1 | - | 298 | 224 |
| 12 Macduff to Fraserburgh | 0 | 33 | 78 | 23 | 0 | 172 | 4 | - | 93 | 19 |
| Total for SMU | 1,004 | 551 | 862 | 1,260 | 1,133 | 1,311 | 1,252 | 1,657 | 1,856 | 1,156 |
| Subunits within SMU 7 - East Scotland | 1997 | 2005 | 2007 | 2013 | 2015 | 2016 | 2018 | 2021 | 2022 | 2023 |
|---|---|---|---|---|---|---|---|---|---|---|
| 1 Fraserburgh to Ythan estuary | 130 | 400 | 388 | 987 | - | 2,197 | - | 335 | - | 900 |
| 2 Aberdeen to Doolie Ness | 15 | 11 | 12 | 2 | - | 64 | - | 15 | - | 46 |
| 3 Montrose to Carnoustie | 0 | 0 | 0 | 2 | - | 4 | - | 10 | - | 10 |
| 4 Tay and Eden estuaries | 1,891 | 843 | 1,519 | 482 | 836 | 936 | 765 | 1,940 | 2,192 | 812 |
| 5 Fife Ness, Isle of May | 65 | 21 | 158 | 87 | - | 85 | - | 98 | - | - |
| 6 Inner Firth of Forth | 0 | 8 | 1 | 11 | - | - | 19 | 48 | 30 | - |
| 7 Outer Firth of Forth | 224 | 78 | 182 | 364 | - | - | 471 | 266 | 325 | - |
| 8 Bass Rock to Pease Bay | 2 | 1 | 47 | - | 0 | - | 76 | 0 | 45 | - |
| 9 Pease Bay to border | 1 | 0 | 0 | - | 26 | - | 81 | 0 | - | - |
| 10 Bell Rock | - | - | - | - | - | - | - | - | - | - |
| Total for SMU | 2,328 | 1,362 | 2,307 | 1,982 | - | - | 3,762 | 2,712 | - | 2,266 |
Appendix 5 - Grey seal distribution maps for previous census periods
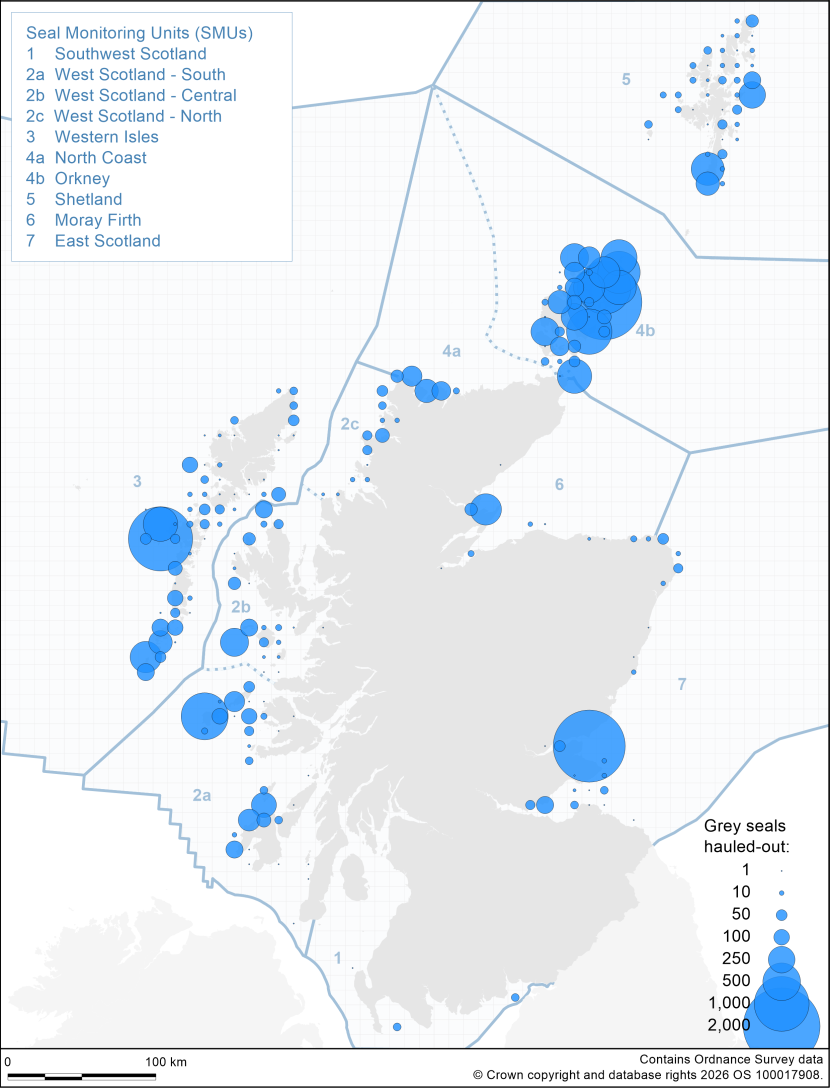
Figure A7. Map of grey seal distribution by 10x10km grid cells based on haul-out counts obtained from the most recent aerial surveys carried out during the grey seal moult in August 1996-1997.
Click for a full description
Map of the number of hauled out grey seals counted around Scotland's coast during August in 1996 and 1997. For each 10 km x 10 km grid square, proportionally sized blue circles indicate the number of hauled out seals counted. The legend gives the symbol sizes for eight values. From smallest to largest these represent counts of 1, 10, 50, 100, 250, 500, 1000, 2000 seals.
The proportion of the population hauled out during the survey window, and available to count, is estimated to be around 25.2% (95% CI: 21.5 – 29.1%; Russell & Carter, 2021).
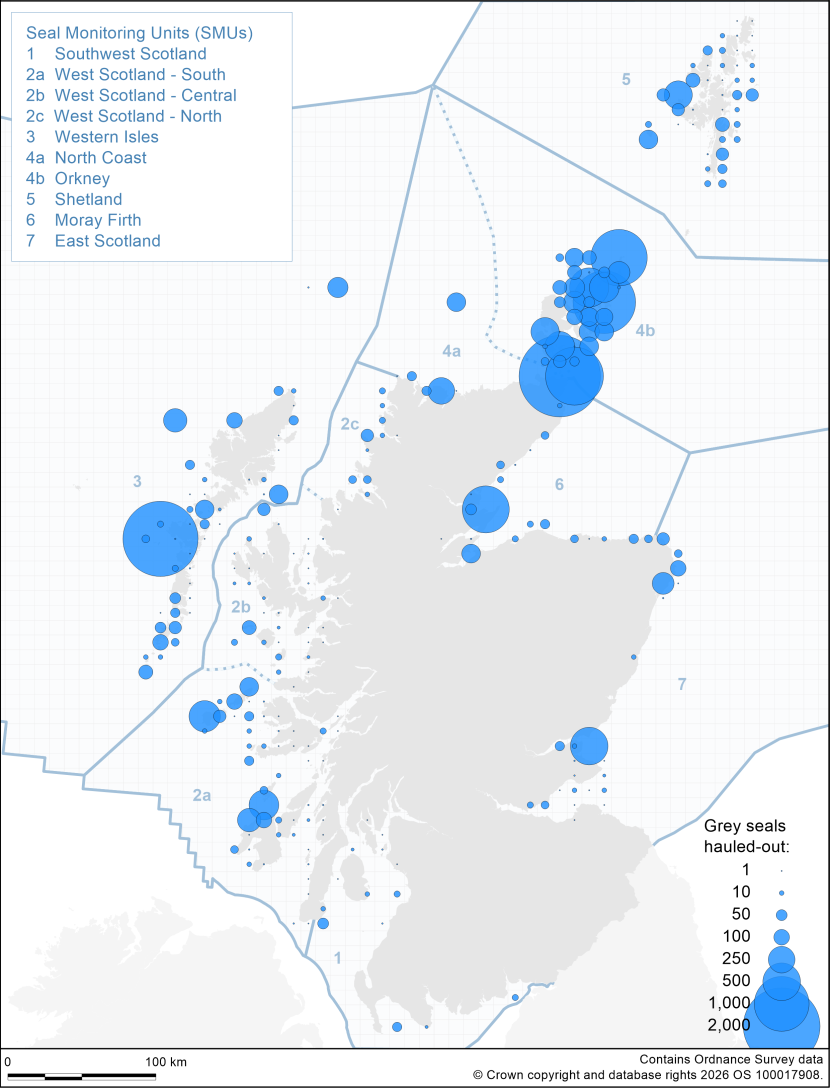
Figure A8. Map of grey seal distribution by 10x10km grid cells based on haul-out counts obtained from the most recent aerial surveys carried out during the grey seal moult in August 2000-2006.
Click for a full description
Map of the number of hauled out grey seals counted around Scotland's coast during August between 2000 and 2006. For each 10 km x 10 km grid square, proportionally sized blue circles indicate the number of hauled out seals counted. The legend gives the symbol sizes for eight values. From smallest to largest these represent counts of 1, 10, 50, 100, 250, 500, 1000, 2000 seals.
The proportion of the population hauled out during the survey window, and available to count, is estimated to be around 25.2% (95% CI: 21.5 – 29.1%; Russell & Carter, 2021).
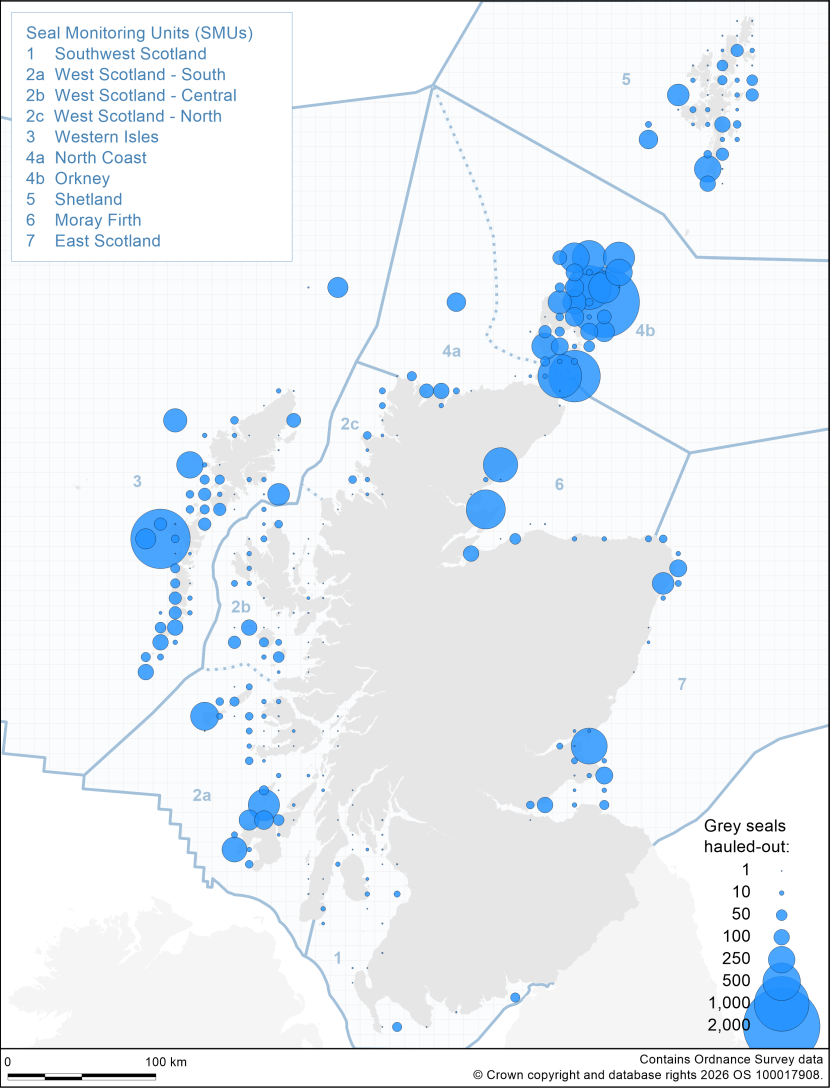
Figure A9. Map of grey seal distribution by 10x10km grid cells based on haul-out counts obtained from the most recent aerial surveys carried out during the grey seal moult in August 2007-2009.
Click for a full description
Map of the number of hauled out grey seals counted around Scotland's coast during August between 2007 and 2009. For each 10 km x 10 km grid square, proportionally sized blue circles indicate the number of hauled out seals counted. The legend gives the symbol sizes for eight values. From smallest to largest these represent counts of 1, 10, 50, 100, 250, 500, 1000, 2000 seals.
The proportion of the population hauled out during the survey window, and available to count, is estimated to be around 25.2% (95% CI: 21.5 – 29.1%; Russell & Carter, 2021).
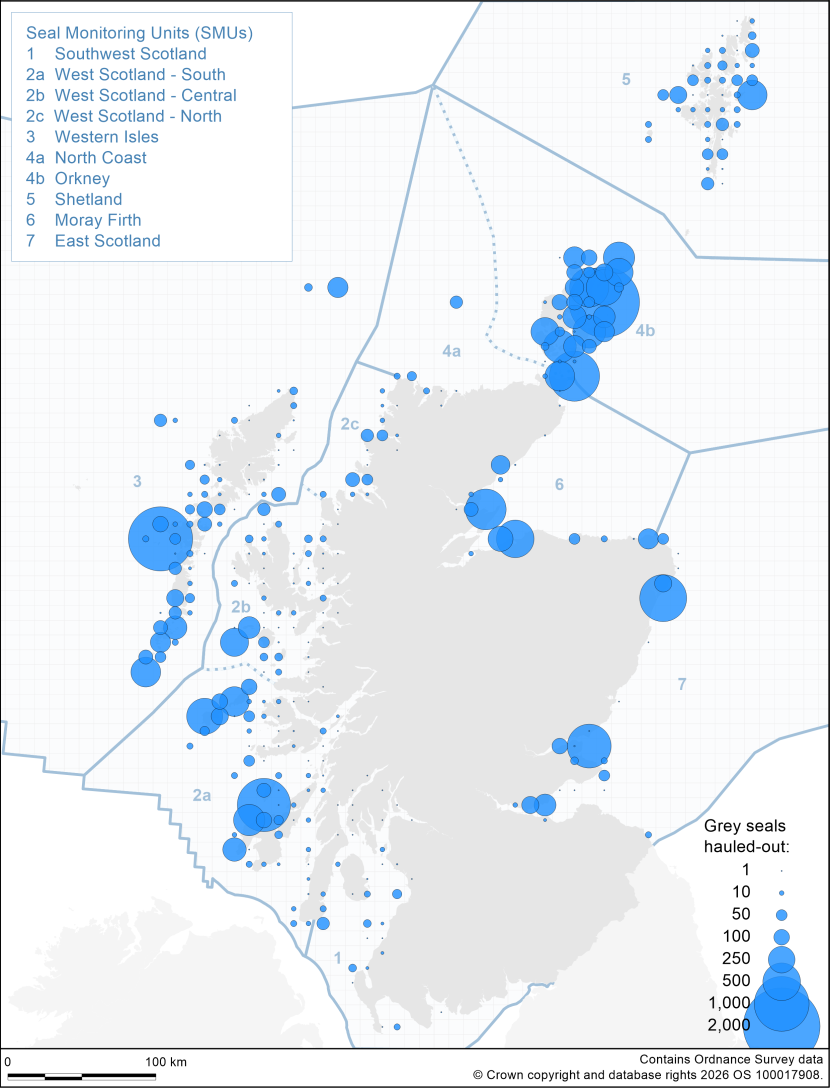
Figure A10. Map of grey seal distribution by 10x10km grid cells based on haul-out counts obtained from the most recent aerial surveys carried out during the grey seal moult in August 2011-2015.
Click for a full description
Map of the number of hauled out grey seals counted around Scotland's coast during August between 2011 and 2015. For each 10 km x 10 km grid square, proportionally sized blue circles indicate the number of hauled out seals counted. The legend gives the symbol sizes for eight values. From smallest to largest these represent counts of 1, 10, 50, 100, 250, 500, 1000, 2000 seals.
The proportion of the population hauled out during the survey window, and available to count, is estimated to be around 25.2% (95% CI: 21.5 – 29.1%; Russell & Carter, 2021).
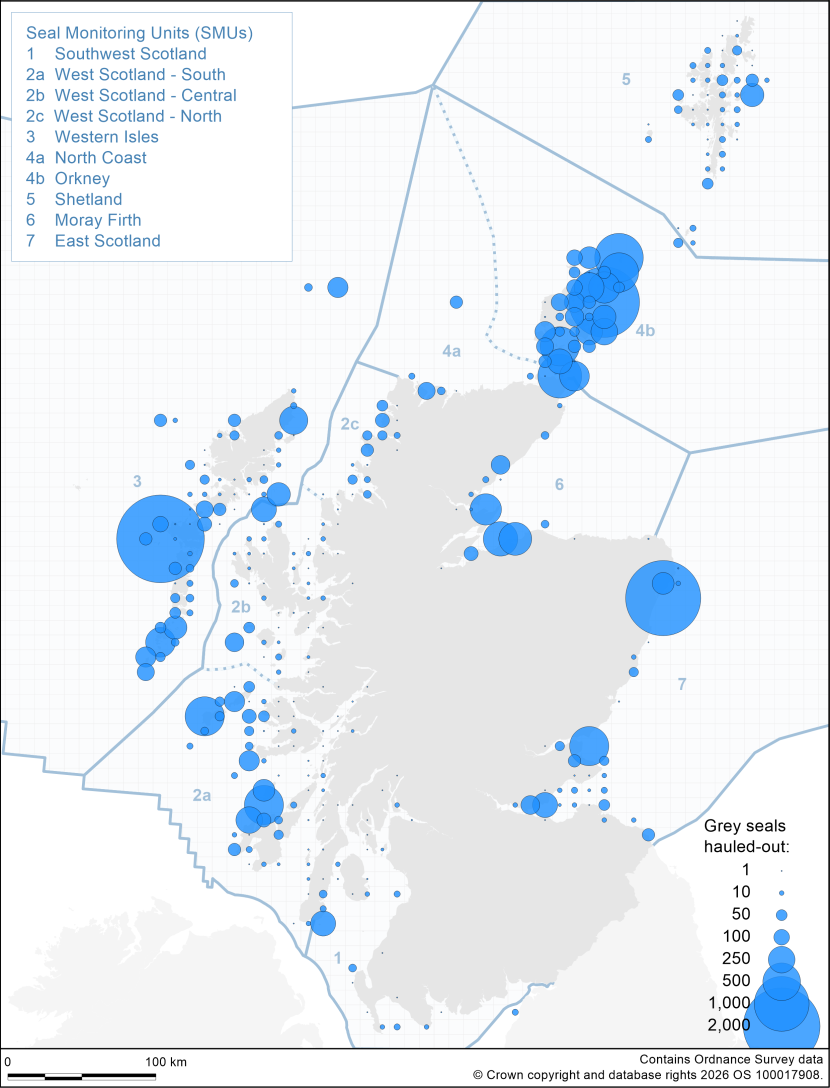
Figure A11. Map of grey seal distribution by 10x10km grid cells based on haul-out counts obtained from the most recent aerial surveys carried out during the grey seal moult in August 2016-2019.
Click for a full description
Map of the number of hauled out grey seals counted around Scotland's coast during August between 2016 and 2019. For each 10 km x 10 km grid square, proportionally sized blue circles indicate the number of hauled out seals counted. The legend gives the symbol sizes for eight values. From smallest to largest these represent counts of 1, 10, 50, 100, 250, 500, 1000, 2000 seals.
The proportion of the population hauled out during the survey window, and available to count, is estimated to be around 25.2% (95% CI: 21.5 – 29.1%; Russell & Carter, 2021).
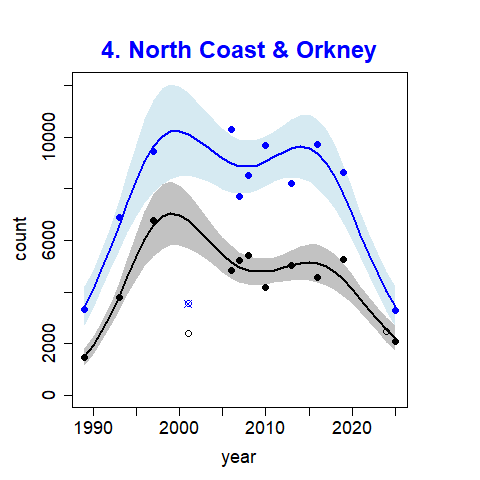
Figure A12. The predicted trend and associated 95% confidence intervals for grey seal August counts in Orkney.
Click for a full description
The filled circle points represent the values used to fit the trends. The grey seal count in 2001 was unusually (possible due to poor weather in the days prior to the survey) and was excluded. The black line indicates the area surveyed in both 2024 and 2025. Note the 2024 count was not used to fit the trend.
Line graph showing the predicted trend with 95% confidence intervals and count values used to fit the trend for grey seal counts in the North Coast & Orkney SMU (blue line with blue shaded area and blue points) and in SMU Subunits 1-6 (black line with grey shaded area and black points) over the period 1993 – 2025. The grey seal count in 2001 was unusually low (possibly due to poor weather in the days prior to the survey) and was excluded from the trend analysis. The 2001 values are shown with a blue circle cross (for the SMU) and with a black circle (for SMU Subunits 1-6). SMU Subunits 1-6 represents the coverage of the partial Orkney survey in 2024. The 2024 count, shown as a black circle, was not used to fit the trend, but is consistent with the declining trajectory estimated from the full time series.
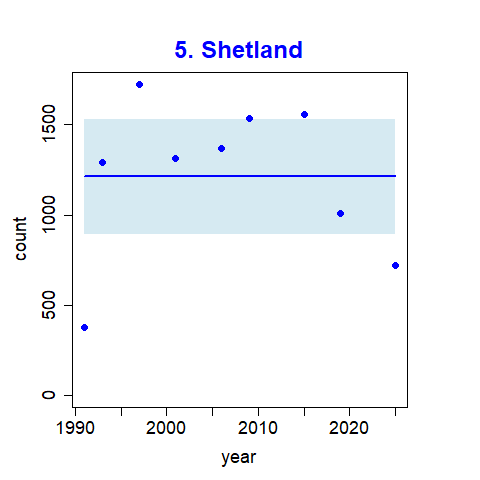
Figure A13a The predicted trend and associated 95% confidence intervals for grey seal August counts in Shetland. The filled circle points represent the values used to fit the trends. a) The left-hand plot was selected
Click for a full description
Line graphs showing the predicted trend with 95% confidence intervals and count values used to fit the trend for grey seal counts in the Shetland SMU (blue line with blue shaded area and blue points) over the period a) 1991 – 2025 and b) 1993 - 2025. The grey seal count in 1991 was unusually low. The left-hand plot (a) shows the model selected when all data points were included, with no trend being detected over the entire time series.
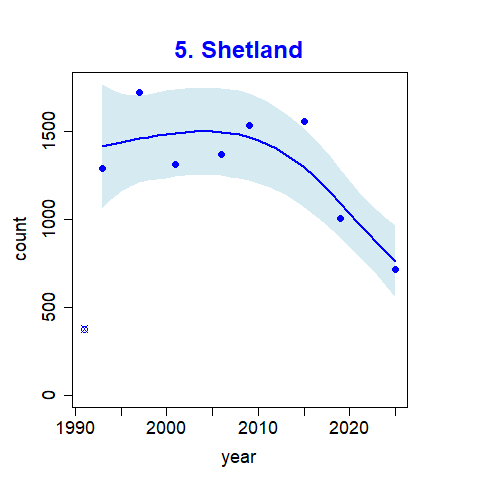
Figure A13 b) The right-hand plot shows the trend from the selected model when the unusually low 1991 count was excluded (see text).
Click for a full description
The right-hand plot (b) shows the trend from the model selected when the 1991 count was excluded, with a marked decrease over the past 25 years.
Appendix 6 - Grey seal trends in SMUs 4 & 5
Figure A12. The predicted trend and associated 95% confidence intervals for grey seal August counts in Orkney.
Click for a full description
The filled circle points represent the values used to fit the trends. The grey seal count in 2001 was unusually (possible due to poor weather in the days prior to the survey) and was excluded. The black line indicates the area surveyed in both 2024 and 2025. Note the 2024 count was not used to fit the trend.
Line graph showing the predicted trend with 95% confidence intervals and count values used to fit the trend for grey seal counts in the North Coast & Orkney SMU (blue line with blue shaded area and blue points) and in SMU Subunits 1-6 (black line with grey shaded area and black points) over the period 1993 – 2025. The grey seal count in 2001 was unusually low (possibly due to poor weather in the days prior to the survey) and was excluded from the trend analysis. The 2001 values are shown with a blue circle cross (for the SMU) and with a black circle (for SMU Subunits 1-6). SMU Subunits 1-6 represents the coverage of the partial Orkney survey in 2024. The 2024 count, shown as a black circle, was not used to fit the trend, but is consistent with the declining trajectory estimated from the full time series.
Figure A13a The predicted trend and associated 95% confidence intervals for grey seal August counts in Shetland. The filled circle points represent the values used to fit the trends. a) The left-hand plot was selected
Click for a full description
Line graphs showing the predicted trend with 95% confidence intervals and count values used to fit the trend for grey seal counts in the Shetland SMU (blue line with blue shaded area and blue points) over the period a) 1991 – 2025 and b) 1993 - 2025. The grey seal count in 1991 was unusually low. The left-hand plot (a) shows the model selected when all data points were included, with no trend being detected over the entire time series.
Figure A13 b) The right-hand plot shows the trend from the selected model when the unusually low 1991 count was excluded (see text).
Click for a full description
The right-hand plot (b) shows the trend from the model selected when the 1991 count was excluded, with a marked decrease over the past 25 years.