NatureScot Research Report 1357 - NatureScot opinion survey 2023
Published: 2024
Authors: McGregor, D. and Strachan, V. (Progressive Partnership)
Cite as: McGregor, D. and Strachan, V. 2024. NatureScot opinion survey 2023. NatureScot Research Report 1357.
Keywords
environmental attitudes; biodiversity loss; climate change; corporate identity; public awareness; National Nature Reserves; Countryside Rangers
Background
Introduction
The NatureScot Opinion Survey (NOS) is an annual survey designed to measure the public’s awareness of NatureScot, their understanding of the organisation’s work, and their attitudes to a range of topics that fall within the organisation’s remit.
The topics covered in the survey include:
- NatureScot, its brand and its activities
- National Nature Reserves
- Scotland’s Great Trails
- Scotland’s landscapes
- Wilding greenspace
- Environmental issues
The NOS is the successor to the Scottish Nature Omnibus (SNO), a survey commissioned by Scottish Natural Heritage between 2009 and 2019. This report presents results from the 2023 NOS.
The survey questions used for the NOS differ from those in the SNO, reflecting the organisation’s new priorities and to enable current issues to be explored. Where appropriate, comparison have been made with findings from the SNO 2019 and with a short version of the NOS run in 2022. A copy of the 2023 questionnaire is included in the methodology annexe.
Method
The survey was administered online by a portfolio of panels during November 2023. It collected views from a representative sample of adults aged 18 and over in Scotland. Quotas were set to ensure the sample was representative of the Scottish adult population, in terms of gender, age and socio-economic group (see Table 1 below). The survey was also designed to ensure that views were collected from respondents across the length and breadth of the country in line with the Scottish regional profile. The profile of the sample is shown on Table 1 below, with more detail on the survey approach provided in the methodology annexe.
Table 1. Sample profile by gender, age groups and socio-economic groups, for both the weighted and unweighted samples
| Sample characteristics | Unweighted sample: Number | Unweighted sample: % | Weighted sample: Number | Weighted sample: % |
|---|---|---|---|---|
| Man | 519 | 48% | 521 | 48% |
| Woman | 567 | 52% | 565 | 52% |
| Non-binary | 6 | 1% | 6 | 1% |
| 18-24 | 95 | 9% | 109 | 10% |
| 25-44 | 353 | 32% | 338 | 31% |
| 45-64 | 390 | 36% | 382 | 35% |
| 65+ | 253 | 23% | 262 | 24% |
| Prefer not to say age | 1 | <1% | 1 | <1% |
| ABC1 | 587 | 54% | 542 | 50% |
| C2DE | 498 | 46% | 543 | 50% |
| Prefer not to say social group | 7 | 1% | 7 | 1% |
| Total | 1092 | - | 1092 | - |
Main findings
- Approximately half of the sample had heard of NatureScot, while one in five of those also know what the organisation does. Logo recognition has grown slightly since 2022, with 20% of people indicating they have seen it before.
- Most people who have heard of NatureScot have a fairly accurate idea of what NatureScot does, with respondents typically mentioning activities such as looking after Scotland’s nature and landscapes, protecting wildlife and preserving the environment. However, a significant minority (15%) mentioned activities relating to heritage, the built environment, historical sites and so on.
- There is a mixed picture in terms of detailed awareness of NatureScot’s work: 65% of people are aware of the recent reintroduction of beavers in Scotland, but only 23% have heard of the 30 by 30 commitment.
- Four out of five people are aware that in Scotland their access rights mean they can go onto most land to enjoy the outdoors, as long as they behave responsibly. Three quarters of respondents said their access rights were either very or fairly important to them.
- More than half of people have heard of National Nature Reserves, and around half of people have visited at least one in the last year. Feedback from those that visited NNRs was overwhelmingly positive.
- An overwhelming majority of people feel that Scotland’s landscapes should be protected. Three quarters of people also felt that Scotland’s landscapes were important for their own sense of place and identity.
- People feel more strongly about the seriousness of climate change as compared to biodiversity loss, and are more proactive and informed about the steps taken to tackle it.
- A majority of people support green spaces being managed for biodiversity and climate change. There is a positive relationship between support for wilding greenspace and nature connectedness.
Abbreviations
National Nature Reserve (NNR)
NatureScot Opinion Survey (NOS)
Nature Connection Index (NCI)
Scottish Index of Multiple Deprivation (SIMD)
Scottish Nature Omnibus (SNO)
Scottish Natural Heritage (SNH)
Scotland’s Great Trails (SGTs)
Special Area of Conservation (SAC)
Findings
NatureScot
Public awareness of NatureScot
Around half of people in Scotland have heard of NatureScot, but logo recognition is somewhat lower.
The present survey was conducted three years after Scottish Natural Heritage (SNH) adopted the name NatureScot. Findings suggest that just under half of the population have heard of NatureScot, with 11% stating that they had heard of the organisation and knew what they do, while a further 36% had heard of the organisation but were not sure of what they do. This is in line with the levels of awareness found in the 2022 NOS (12% and 35% respectively). Around half of respondents (51%) had never heard of NatureScot.
Until August 2020 the organisation was called Scottish Natural Heritage. A similar question was asked in the 2019 Scottish Nature Omnibus (SNO) in relation to awareness of SNH. As shown on Table 2, awareness levels of SNH were significantly higher, with a total of 79% having heard of the organisation.
Table 2. Awareness of NatureScot
| Which of these statements best describes your level of awareness of the organisation NatureScot? | 2015 (SNH) | 2017 (SNH) | 2019 (SNH) | 2022 (NatureScot) | 2023 (NatureScot) |
|---|---|---|---|---|---|
| I have heard of NatureScot (SNH 2015-19), and I know what they do | 23% | 27% | 29% | 12% | 11% |
| I have heard of NatureScot (SNH 2015-19), but I’m not sure what they do | 46% | 51% | 49% | 35% | 36% |
| I have never heard of NatureScot (SNH 2015-19) | 28% | 18% | 18% | 49% | 51% |
| Don’t know | 3% | 4% | 3% | 4% | 1% |
| NET name recognition | 69% | 78% | 79% | 47% | 47% |
| Base | 1,151 | 1,063 | 1,101 | 1,010 | 1,092 |
Awareness of NatureScot varied amongst different demographic groups:
- Age – younger people were more likely to be aware of NatureScot - 56% of under 45s, compared with 44% of 45-64 year olds and 37% of those 65+
- Working status – people in work were (53%) were more likely to have heard of NatureScot, compared with retired people (35%) and those not in work (44%).
In addition to the NatureScot name, respondents were asked if they recognised the NatureScot logo. Overall, 20% of respondents said they did. This figure represents a small increase on 2022 findings in which 15% of people recognised the logo.
Public understanding of NatureScot’s role
Most people who have heard of NatureScot have a reasonable idea of what the organisation does. Protecting native plants and animals, and our finest landscapes, are considered our most important activities.
We asked participants who said they had heard of NatureScot to type in what they thought the organisation does. This was an open-ended question which allowed respondents to express their perceptions of NatureScot’s role in their own words. These responses were subsequently coded and grouped into similar sentiments.
The majority of respondents, including those who stated in the previous question that they did not know what NatureScot did, appeared to have a fairly accurate idea of the organisation’s role, with responses typically mentioning activities such as looking after Scotland’s nature and landscapes, protecting wildlife and preserving the environment. (see Figure 1)
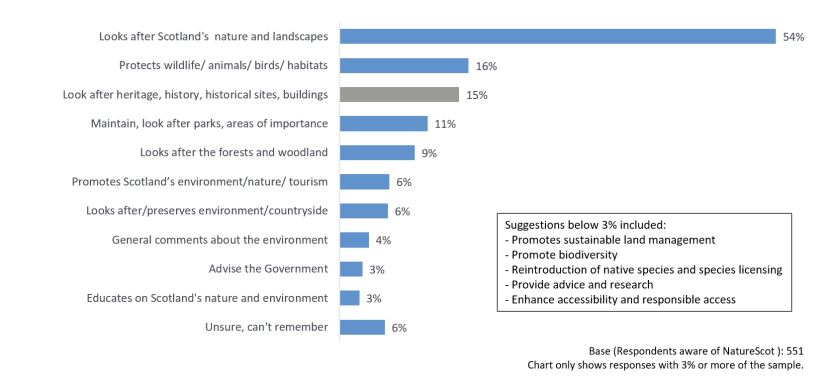
Figure 1. Activities undertaken by NatureScot – open-ended question, unprompted
Click for a full description
The bar chart shows the types of work respondents who had heard of NatureScot thoughts the organization did. The survey question was unprompted. Responses on the bar chart are ranked, from the most frequently to the less frequently mentioned activities. Examples of activities mentioned by only a handful of respondents are listed on a box on the chart.
Some examples of individual comments are provided below:
- 'I would expect an organisation named this to protect nature, flora, land and wildlife'
- 'It is responsible for all of Scotland’s natural heritage'
- 'Great as it helps keep Scotland’s nature protected'
- 'I expect them to keep nature parks, wildlife in order in Scotland. Taking care of them, visitor centres and running or organising events'
- 'Protects vulnerable wildlife'
- 'Looks after places of natural beauty and cares for the wildlife plants etc. Promotes the areas for recreation.'
It is worth noting that a significant minority of respondents (around 15%) mentioned activities relating to heritage, the built environment, historical sites and so on. For comparison, mentions of these activities had been around similar levels when the organisation was called SNH, but had dipped to under 1% by 2022 following NatureScot’s name change. It was hoped that this reflected the impact of the new name on the public’s understanding of the organisation’s role. These new findings suggest that further work may be required to disassociate NatureScot from the work of heritage organisations.
All respondents were then given a list of activities undertaken by NatureScot and asked to select those which they considered to be most important. A maximum of five options could be selected.
As Figure 2 shows, the largest percentages selected ‘protecting native plants and animals’ (57%), ‘protecting Scotland’s finest landscapes’ (51%), ‘helping people enjoy and benefit from nature’ (37%) and managing National Nature Reserves (37%).
In contrast the least frequently selected activities were ‘establishing new National Parks’ (16%), ‘promoting the Scottish Outdoor Access Code’ (15%), ‘helping to control deer numbers’ (10%) and ‘providing opportunities for volunteering’ (10%).
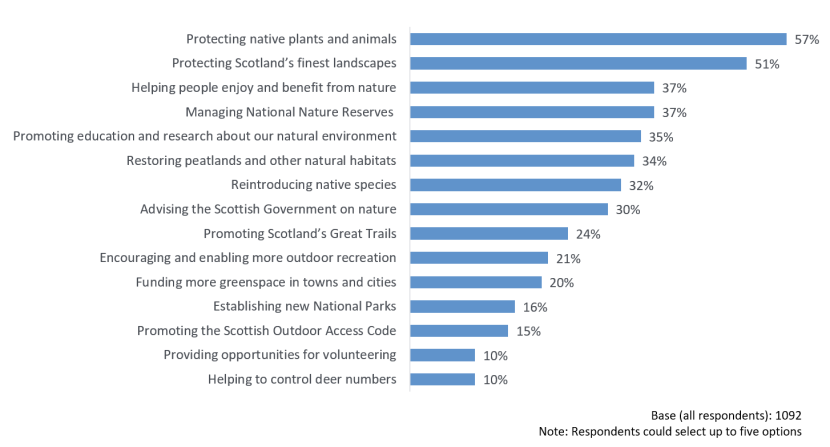
Figure 2. Most important activities undertaken by NatureScot – prompted
Click for a full description
The bar chart ranks fifteen areas of NatureScot’s work according to their importance to respondents. Most important are protecting native plants and animals and protecting Scotland finest landscapes.
Notably, there was very little difference in respondents’ responses on important activities for NatureScot between those who indicated in the earlier question that they were aware of the organisation and what it does and those who were not. The only exceptions were:
- Establishing new national parks: 18% of those aware of NatureScot selected this activity compared with 13% of those unaware.
- Advising the Scottish Government on nature: 34% of those aware compared with 27% of those unaware
- Helping people to enjoy and benefit from nature: 35% of those aware compared with 40% of those unaware (significant at the 90% level)
- Providing opportunities for volunteering: 13% of those aware compared with 9% of those unaware (significant at the 90% level)
Views on the priorities for NatureScot varied by age. The youngest age group (under 35s) were less likely than others to select managing the National Nature Reserves (30%) and were more likely than others to select establishing new National Parks (22%) as important. The oldest age group (55+) were more likely than others to select protecting native plants and animals (61%), restoring peatlands and other natural habitats (41%) and helping to control deer numbers (13%) as important.
Public favourability towards NatureScot
Public attitudes towards NatureScot are generally favourable, with only a very small minority holding an unfavourable opinion of the organisation.
Respondents were asked to rate a selection of organisations (including NatureScot) based on how favourably they viewed them. The figure below excludes responses from those who had not heard of the organisations in question. It shows that three-fifths of respondents commenting had a favourable opinion of NatureScot (60%), while a further 35% said their opinion was neither favourable nor unfavourable. Very few people (5%) held an unfavourable opinion. The average favourability score (based on assigning a score of 5 for ‘very favourable’ through to 1 point for ‘unfavourable’, and again excluding ‘don’t knows’) allows for comparison between organisations. NatureScot achieved an average score of 3.73, reflecting a high proportion of responses in the ‘neither nor’ code, rather than an unfavourable rating.
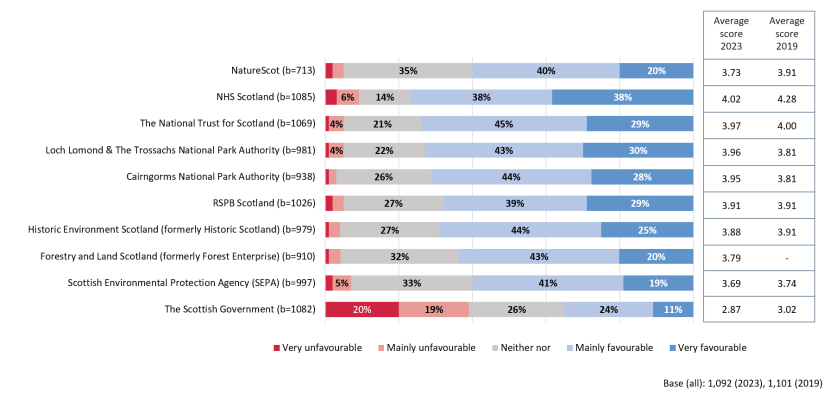
Figure 3. Public opinion on organisations
Click for a full description
A set of ten stacked bar charts show how favourably respondents view a range of organisations. The responses are presented on a five-point scale from very unfavourable through to very favourable. There is also a ‘not aware of them’ option. The organisations compared on the chart comprised the main national bodies with a remit for landscape and nature, including Forest and Land Scotland, Scottish Environmental Protection Agency, the National Trust for Scotland and both of the national park authorities.
To the right of the stacked bar chart is a table which shows the average scores for each organisation. These are calculated from the raw survey data (excluding the ‘not aware’ responses) by allocating a score of 1 to those saying ‘very unfavourable’ through to 5 for saying ‘very favourable’. Average scores are provided for both 2023 and for 2019 where these are available.
Awareness of NatureScot’s work
There is a mixed picture in terms of public awareness of NatureScot’s work and activities.
Respondents were asked about their awareness of a number of key areas of NatureScot’s work.
30 by 30 Commitment
Just under a quarter of participants (23%) stated they were aware of the Scottish Government’s commitment to protect 30% of land and sea for nature by 2030. Those most likely to be aware of the commitment were young people aged 18-34 (31%) and those who have visited a National Nature Reserve (NNR) or one of Scotland’s Great Trails (SGTs) in the last year (29%).
Table 3. Awareness of the Scottish Government’s 30 by 30 commitment
| Have you heard of the Scottish Government’s commitment to protect 30% of land and sea for nature by 2030 (sometimes referred to as the 30 by 30 commitment)? | % |
|---|---|
| Yes | 23% |
| No | 70% |
| Don’t know | 7% |
| Base | 1,092 |
Reintroduction of beavers
Nearly two-thirds of respondents (65%) knew that beavers have been reintroduced to Scotland. This has been a key area of work and a high profile action for NatureScot; the survey suggests that this has achieved a strong level impact with the public.
Older people were more likely to be aware of the reintroduction of beavers: 87% of people aged over 65 were aware, dropping to 74% among 45-64 year-olds, 49% among those aged 25-44, and 44% of those aged 18-24. Others who were more likely to be aware included, those living in remote/rural areas (77%-88% compared with 62%-67% for urban areas) and those who have visited an NNR/SGT compared with others (69% versus 62%).
Table 4. Awareness that beavers have been reintroduced to Scotland
| Are you aware that beavers have been reintroduced in Scotland? | % |
|---|---|
| Yes | 65% |
| No | 32% |
| Don’t know | 3% |
| Base | 1,092 |
Countryside Rangers
Just over half of respondents (55%) said they were aware that Scotland has Countryside Rangers, a lower figure than when this question was asked in 2022 (61%). Awareness of Rangers increases with age: 43% people aged 18-34, 52% of those aged 35-54 and 64% of those aged 55+. Those who have visited an NNR/SGT (63%) in the last year were more likely than others to be aware that Scotland has Countryside Rangers.
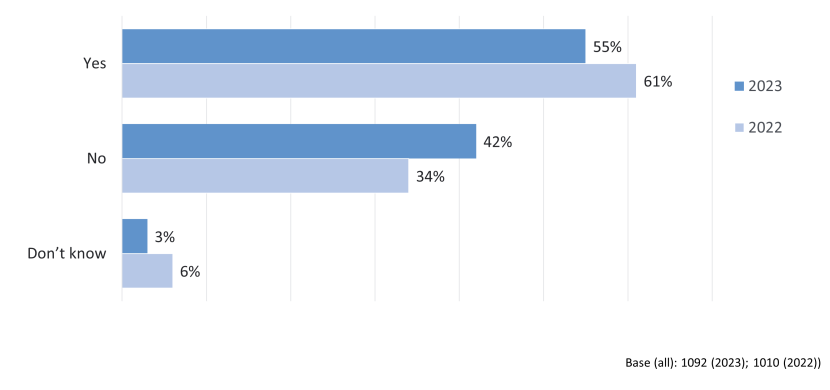
Figure 4. Awareness of Countryside Rangers: 2023, 2022
Click for a full description
The bar chart shows awareness Countryside Rangers. Three response options are given: yes, no and don’t know. Data are shown for two years: 2023 and 2022 are shown. This question was asked of all respondents.
Outdoor access
Respondents were asked if they were aware that in Scotland their access rights mean they can go onto most land to enjoy the outdoors, as long as they behave responsibly. Four fifths (81%) said they were aware of these rights.
Three-quarters of all respondents (76%) said that their access rights were either very or fairly important to them, while just 6% said they were not important to them.
Those more likely to say their access rights were important to them were:
- Younger people: 85% of 18-34 year olds versus 75% of 35-54 years olds and 71% of 55+ years olds
- Households with children: 82% of those with children versus 74% of those without children
- People who had visited an NNR/SGT in the last year: 84% of those who have visited versus 61% of those who have not.
Table 5. Importance of access rights
| How important are your access rights to you? | % |
|---|---|
| Very important | 39% |
| Fairly important | 37% |
| Neither important nor unimportant | 16% |
| Not very important | 4% |
| Not at all important | 2% |
| Don’t know/not sure | 2% |
| Base | 1,092 |
An open-ended question was asked of respondents who said their access rights were important to them and to those who said they were not to ask them the reasons for their views.
The main reasons people gave for valuing their access rights are shown Figure 12. These relate to being able to enjoy and benefit from being outdoors and in nature, and stressing the importance of being able to have access to lands across the country.
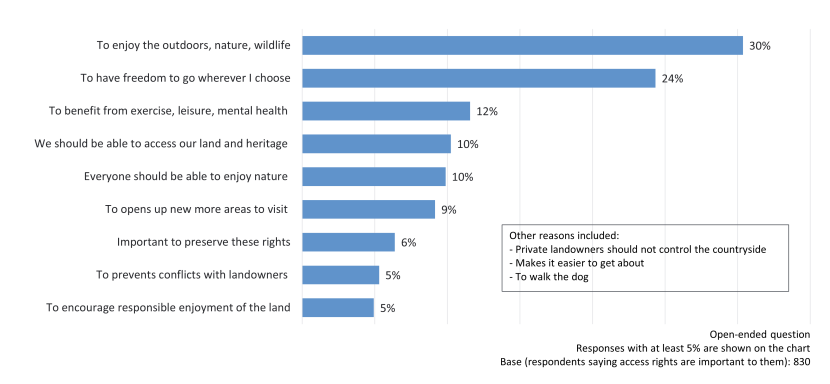
Figure 5. Reasons why access rights are important – unprompted
Click for a full description
Bar chart showing reasons why access rights are important to respondents, given to an unprompted question asked of those who agreed that access rights are important to them. Listed are the reasons given by at least 5% of respondents.
Among the small percentage who said their access rights were not important, the most cited reason (26%) was that they did not visit the countryside or new places. Other reasons included that people preferred main walkways, had no interest in walking, or that they did not go out.
National Nature Reserves
Most people have heard of National Nature Reserves, and around half of people have visited at least one in the last year. Feedback from people who visited NNRs was overwhelmingly positive.
Just under three in five respondents (58%) had heard of National Nature Reserves (NNRs) before, while just over a third (35%) had not heard of them (and 8% were unsure). As shown in Figure 6, the awareness of NNRs appears to have grown since 2019.
The respondents who were more likely to have heard of the NNRs were older respondents aged 65+ (65%) and those living in remote rural areas (73%)
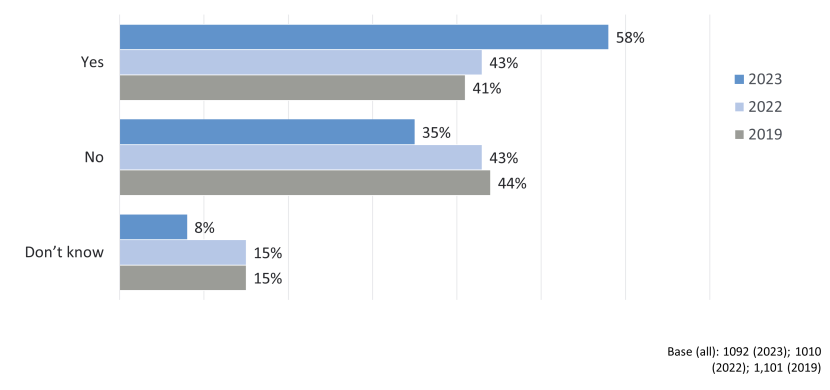
Figure 6. Awareness of NNRs: 2023, 2022, 2019
Click for a full description
The bar chart shows awareness of NNRs. Three response options are given: yes, no and don’t know. Data are shown for three years: 2023, 2022 and 2019. This question was asked of all respondents in 2023.
Visits to NNRs
All respondents were shown a map and list of the 43 NNRs in Scotland. They were asked to identify which, if any, they had visited in the last 12 months. As shown in Figure 7, 55% stated that they had visited at least one NNR during the last 12 months.
This figure is lower than the 61% who indicated they had visited an NNR in the 2022 NOS, but similar to level reported in 2019 (54%), and substantially higher than the level mentioned in any of the previous years. It is possible that the 2022 survey included a covid-19 impact, when people were restricted from and/or reluctant to travel abroad, so took more holidays/trips locally.
The likelihood of having visited an NNR decreased with age (an inverse of the relationship between age and awareness of NNRs): 67% of those aged 18-34 had visited, compared with 55% of those aged 35-54 and 47% of those aged 55+.
Figure 7 below shows those NNRs which were visited by at least 5% of the sample. The most visited NNRs were Loch Lomond, Glencoe and Loch Leven. These NNRs have typically topped the most-visited list in previous waves of NNR monitoring.
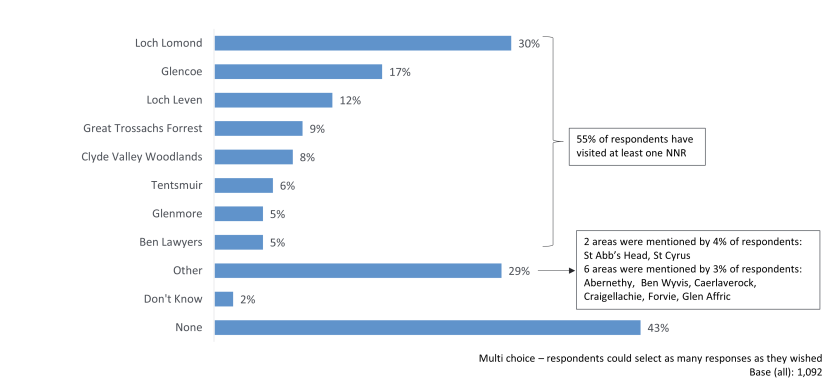
Figure 7. NNRs visited in the last 12 months
Click for a full description
The bar chart shows the National Nature Reserves (NNRs) that respondents have visited in the last 12 months. Respondents chose from a list and map of all 43 NNRs in Scotland. The chart shows those NNRs with at least 5% of respondents. A text box list those visited by 3% and 4% of respondents. The chart also shows that 43% of respondents did not visit any of the NNRs in the last year.
Profile of visits
Respondents were also asked how often they visited each of the NNRs. This is shown of Figure 8 for the ten most visited NNRs. This suggests that, not only is Loch Lomond most likely to be visited, it’s also the most likely to be visited repeatedly.
Most of those who visit an NNR will visit only a few times across the year, with between 40% and 65% doing so only once.
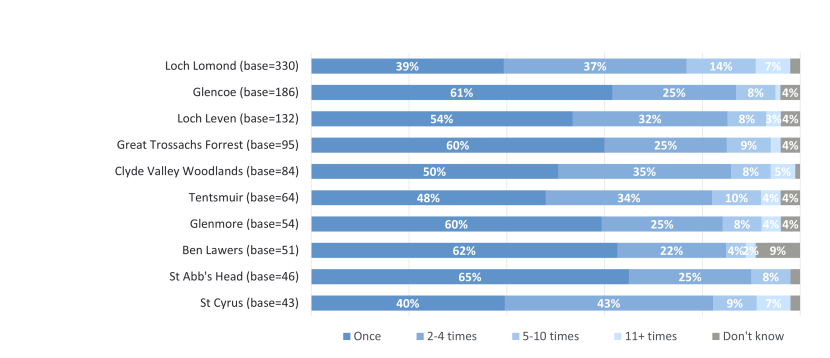
Figure 8. Frequency of visiting NNRs over the last 12 months
Click for a full description
The stacked bar chart lists the ten National Nature Reserves (NNRs) that were most likely to have been visited by respondents over the last year. For each NNR it shows the number of visits people made to the park. This is shown in bands of one visit, two to three visits, five to ten visits, and eleven and over.
Experience of visits
Respondents who had visited an NNR during the last 12 months were asked the extent to which they agreed with a series of statements relating to their last visit, as shown in Figure 9.
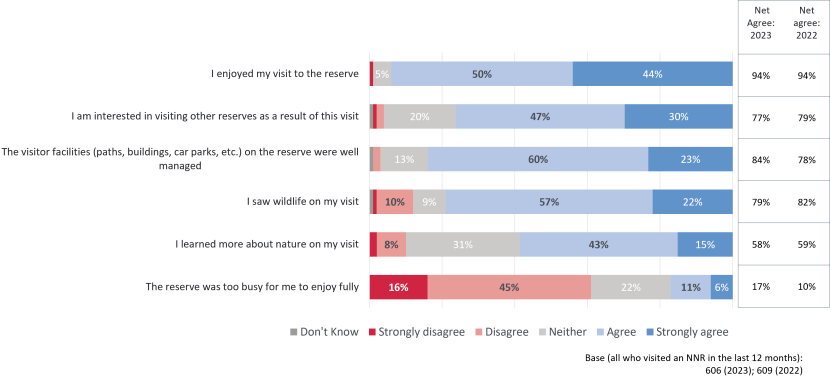
Figure 9. Experience of recent NNR visit
Click for a full description
A set of six stacked bar charts that show the extent to which people agree or disagree with statements about their most recent visit to a Nature Reserve visitor. The responses are presented on a five-point scale from very dissatisfied through to very satisfied.
To the right of the chart is a table which shows the net agree scores for each statement and compares them with the net agree scores from 2022 where these are available.
Almost all either agreed (50%) or agreed strongly (44%) that they enjoyed their visit to the reserve, while most (77%) also agreed they would be interested visiting other reserves as a result of their visit.
A minority (17%) agreed with the negative statement ‘the reserve was too busy for me to enjoy fully’. Most likely to agree with this statement were: people 18-34 years (25%) and 35-54 years (18%), compared with those aged 55+ years (8%); and households with children (27%) compared with those without children (12%).
Findings for 2023 were broadly similar to those from 2022, with increases in the proportion of respondents who agreed that the NNR was too busy and that the facilities were well managed. It is also worth noting that these results are not disaggregated by individual NNR and therefore represent an overall impression of public experiences that is skewed towards the most visited sites.
Parking charges
It is currently free to park at all NNRs. Respondents were asked how much they would be willing to pay for a day’s parking at an NNR (not including overnight parking). Just under a third (30%) said parking should remain free, while a quarter said any parking charge should be less than £3 (the smallest option offered). A further 29% reported they would be willing to pay between £3 and £5 for parking at an NNR.
- There were no differences in the views of those who have and haven’t visited an NNR/SGT in the last year.
- Those who never visit the outdoors for recreation and leisure were much more likely to say they thought parking should be free (48%) than those who visit at least once a week (30%).
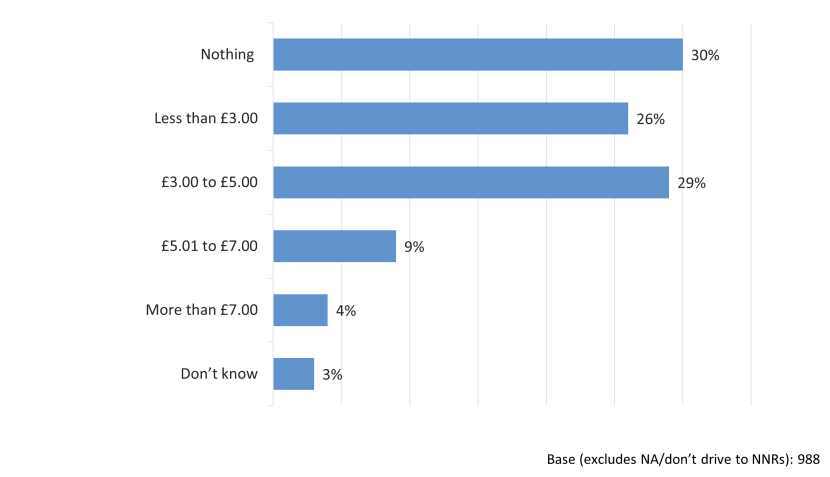
Figure 10. Views on willingness to pay for daytime parking at NNRs
Click for a full description
The bar chart shows how much people would be willing to pay to park for a day at a Nature Reserve (not including overnight parking). The options offered were, parking should be free, less than £3, £3 to £5, £5 to £7, and over £7. Respondents could also say this question did not apply to them or that they didn’t know.
Respondents were also asked which methods of payment they prefer using to pay for parking charges: card/phone (51%) and cash (41%) were most popular, followed by an app (24%). A further 15% said they had no preference.
Preference for card and app payments decreased with age. For example, 66% of 18-34 year-olds preferred cards and 38% apps, compared with 41% and 10% respectively of those age 55+. Others who were less likely to prefer an app were people living in the Highlands and Islands (8%), compared with other regions; and people living in Remote Rural areas (7%) compared with other areas, which might suggest a concern around connectivity in some rural areas.
Scotland’s Great Trails
All respondents were asked if they had heard of Scotland’s Great Trails (SGTs). Awareness was fairly low, with just over two-fifths (43%) of respondents saying they had, while nearly half (47%) said they hadn’t, and a further tenth (10%) said they didn’t know.
Respondents were shown the SGT logo and asked if they recognised it. Again, awareness was low, with only one-fifth (20%) of respondents saying they remembered seeing it before.
All respondents were then shown a map and list of the 29 SGTs and were asked to identify which, if any, they had ever visited. Those who had visited one or more of the SGTs were also asked which, if any, they had visited within the last 12 months.
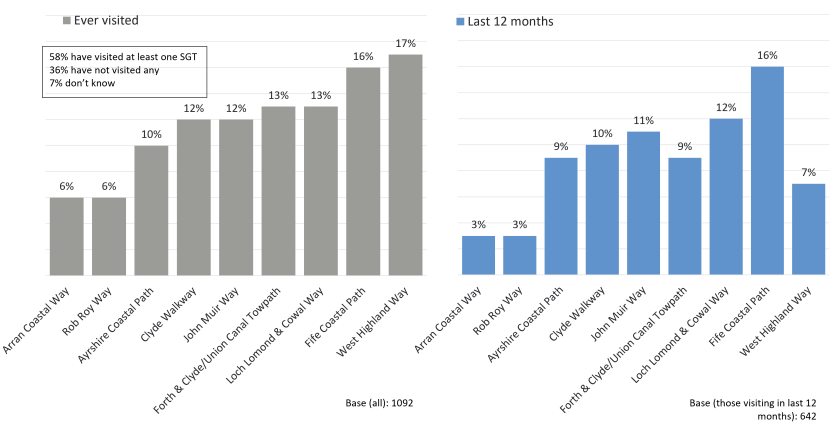
Figure 11. Scotland’s Great Trails, all visited and visited in the last 12 months
Click for a full description
The bar charts show the Great Trails that respondents visited, focusing on those visited by at least 6% of respondents. There are two bar chart charts. The first shows the percentage of all respondents who have visited the named Trails. The second shows the percentage of all visitors who have visited each of the named Trails within the last 12 months.
Once prompted, more than half of all respondents (58%) said they had visited at least one of the SGTs. The most frequently mentioned was the West Highland Way (by 17%), the Fife Coastal Path (16%), Loch Lomond and Cowal Way (13%) and the Forth and Clyde/union Canal Towpath (13%).
43% of people had visited one or more of Scotland's Great Trails over the previous 12 months. Notably, The Fife Coastal Path, the Loch Lomond and Cowal Way, the John Muir Way, and the Clyde Walkway – all of which are reasonably accessible to the main cities – were the most frequently mentioned SGTs used within the last 12 months. This possibly suggests that more easily accessible trails are used more regularly by people, and the longer and/or more remote walks, such as the West Highland Way, are used less frequently and are seen as more of an ‘event’ to visit.
Comparing responses amongst different demographic groups, those more likely to have visited an SGT were the younger age groups 18-34 (62%) and 35-54 (61%, compared with 53% for those aged 55+ years), social groups ABC1 (62%, compared with 54% for C2DE), people with children (66%, compared 55% for those without children) and those without disabilities (60%, compared with 53% for those with a disability).
Scotland’s landscapes
General attitudes
Respondents were shown a list of statements relating to Scotland’s landscape and asked to what extent they agreed or disagreed with each.
The vast majority agreed with the statement ‘Scotland’s areas of wildland should be protected’ (93% agreed or agreed strongly) and with ‘Scotland’s landscapes make an important contribution to the economy’ (90%). These figures represent an increase of roughly ten percentage points over the 2019 results.
Three quarters of respondents agreed that Scotland’s landscapes were important for their sense of place and identity.
Around three fifths of people agreed that Scotland’s finest landscapes were well looked after, but three quarters agreed that more effort is needed to improve the landscape in and around the country’s towns and cities. Three fifths of people also agreed that Scotland’s landscapes are changing due to climate change. Just a third of people agreed that Scotland’s landscapes are changing for the better and that new development in the countryside is having a positive impact on Scotland’s landscapes. These results were broadly similar to those recorded in 2019.
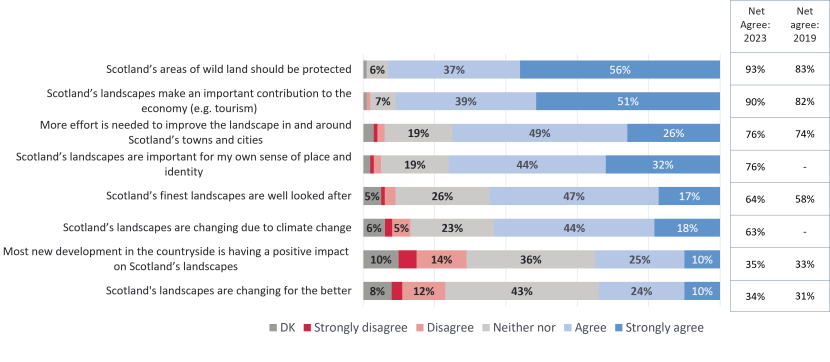
Figure 12. Views on Scotland’s landscapes
Click for a full description
A set of eight stacked bar charts that show the extent to which people agree or disagree with statements about Scotland’s landscapes. The responses are presented on a five-point scale from disagree strongly through to agree strongly.
To the right of the chart is a table which shows the net agree scores for each statement and compares them with the net agree scores from 2019 where these are available.
Responses to each of the statements differed somewhat by population groups including the following significant variations:
- Scotland’s areas of wildland should be protected: overall 93% agreed with this statement, with levels of agreement are higher among people aged 55+ (96% vs 91% 18-54),
- Scotland’s landscapes make an important contribution to the economy: overall 90% agreed with this statement with higher levels of agreement amongst white ethnicities versus non white ethnicities (91% vs 77%) and those who visited an NNR/SGT in the past year (93% vs not visited 88%)
- Scotland’s landscapes are important for my sense of identity: overall 76% agreed with this statement with higher levels of agreement amongst white ethnicities versus non white ethnicities (77% vs 63%) and those who visited an NNR/SGT in the past year (84% vs not visited 65%)
- Scotland’s landscapes are changing due to climate change: overall 63% agreed with this statement, with levels of agreement higher amongst people aged 18-34 (68% vs 60% 55+) and ABC1s vs C2DEs (68% vs 58%).
- New development in the countryside is having a positive impact on Scotland’s landscapes: overall 35% agreed with this statement with agreement declining as respondents get older (44% 18-34 vs 37% 35-54 vs 29% 55+), and higher levels of agreement among households with children than those without (43% vs 33%) and those that visited an NNR/SGT in the past year (40% vs not visited 29%)
- Scotland’s landscapes are changing for the better: overall 34% agreed with this statement, with levels of agreement higher among people aged 18-34 (42% vs 33% 35-54 and 31% 55+), households with children than those without (43% vs 31%) and those who visited an NNR/SGT in the past year (39% vs not visited 26%).
Wind farms
Respondents were asked to think specifically about wind farms (including onshore and offshore wind farms) and say to what extent they agreed with a series of statements. While around three-fifths of respondents consider wind farms in Scotland to be generally well-designed and located, there is much less appetite for further development, with around two-fifths (43%) saying the landscape close to their home could accommodate more windfarms and a similar proportion (40%) saying the areas they like to visit could accommodate more wind farms. These figures are in line with the findings from the 2022 NOS.
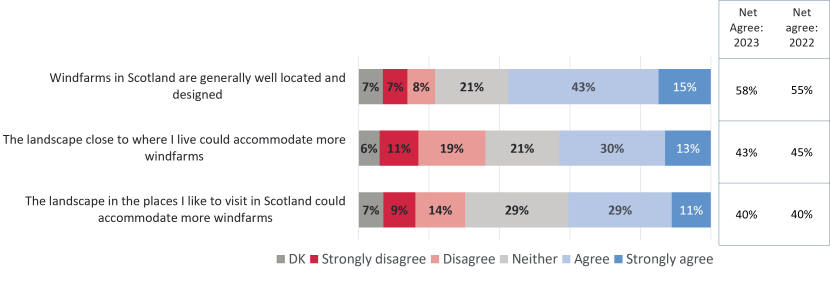
Figure 13. Views on wind farms, including onshore and offshore wind farms
Click for a full description
A set of three stacked bar charts that show the extent to which people agree or disagree with statements about wind farms, including statements designed to determine whether Scotland has capacity to accommodate more wind farms. The responses are presented on a five-point scale from disagree strongly through to agree strongly.
To the right of the chart is a table which shows the net agree scores for each statement and compares them with the net agree scores from 2022.
Responses to each of the statements differed somewhat by population groups, with younger people, those with children and people from higher social groups, as well as those who have recently visited an NNT/SGT typically more supportive of wind farms:
- Wind farms in Scotland are generally well located and designed: agreement with this statement declined as respondents get older (71% 18-34 vs 60% 35-54 vs 47% 55+), and there were higher levels of agreement among households with children than those without (63% vs 56%) and those that had visited an NNR/SGT in the past year (63% vs not visited 50%)
- The landscape close to where I live could accommodate more wind farms: agreement with this statement declined as respondents get older (55% 18-34 vs 46% 35-54 vs 34% 55+), and there were higher levels of agreement among households with children than those without (53% vs 40%), non-white versus white ethnicities (57% vs 42%) and those that had visited an NNR/SGT in the past year (49% vs not visited 35%). Agreement was lower in remote rural areas than in other areas (36%).
- The landscape in places I visit could accommodate more wind farms: agreement with this statement declined as respondents get older (53% 18-34 vs 43% 35-54 vs 31% 55+), and there were higher levels of agreement among ABC1s versus C2DEs (44% vs 37%), households with children than those without (50% vs 37%), non-white versus white ethnicities (64% vs 39%) and those that had visited an NNR/SGT in the past year (46% vs not visited 33%). Agreement was lower in remote rural areas than in other areas (24%).
Rating of local landscapes
Respondents were asked to indicate how they rate the landscape in their local area. As Table 5 shows, around three-fifths (63%) of respondents are positive about their local landscape, rating it as either ‘very good’ (25%) or ‘good’ (38%). Only a small proportion of respondents rated their local landscape as ‘poor’ or ‘very poor’ (8%).
The sub-groups more likely to be positive about their local area were households with children (69%) and people who have visited an NNR/SGT recently (68%). People less likely to be positive about their local area were young people aged 18-24 (49%), people living in the most deprived SIMD areas (50%) and people living in large urban areas (52%).
Table 6. Local landscape rating
| How would you rate the landscape in your local area? | % |
|---|---|
| Very good | 25% |
| Good | 38% |
| Fair | 27% |
| Poor | 6% |
| Very poor | 1% |
| Don’t know | 2% |
| Base | 1,092 |
Respondents were asked to indicate whether they thought the landscape of their local area has got better, stayed the same or got worse during the last three years. In line with previous surveys, when this question has been asked, more respondents felt their local landscape has got worse (25%) than better (18%) in the last three years. Around half of respondents (51%) felt that their local landscape has remained the same.
Young people were more likely to think the local area had improved (21% of those under 35 vs 14% of those 55+); notably, there were no differences in percentages thinking their local area had declined. People with a disability were more likely to say their area had declined (30%) and less likely to say it had improved (15%) than others.
Table 7. Change in local landscape over recent years
| Thinking about the landscape of your local area, do you think things have got better, stayed the same or got worse during the last 3 years? | % |
|---|---|
| Got a lot better | 5% |
| Got a little better | 14% |
| Stayed the same | 51% |
| Got a little worse | 21% |
| Got much worse | 4% |
| Don’t know | 5% |
| Base | 1,092 |
Respondents were asked to explain why they felt their local landscape had become better or worse in the last three years. Figure 16 shows the main reasons given by those who felt their area had improved over recent years. These were mainly related to the better management and investment in the area and people taking more pride and care of their surroundings.
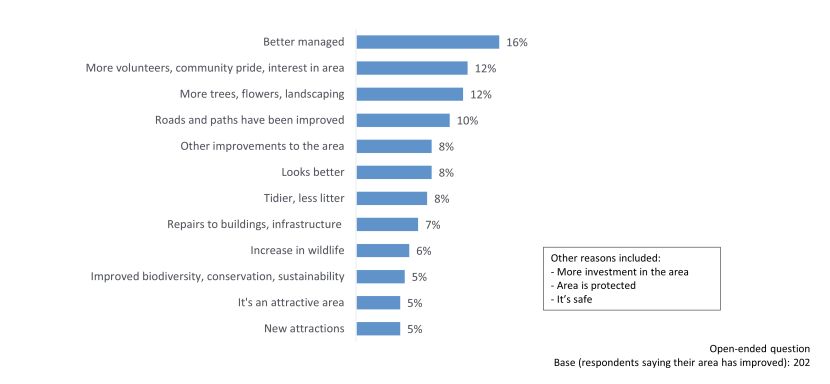
Figure 14. Reasons why the local landscape has improved
Click for a full description
The bar chart shows the reasons respondents consider the landscape of their area has improved over the last three years. The chart shows those reasons given by at least 5% of respondents. A text box lists a small number of other common responses.
Those who felt their landscape has become worse in the last three years were most likely to refer to over-development, poor maintenance and management of the area, a general lack of investment and disrepair.
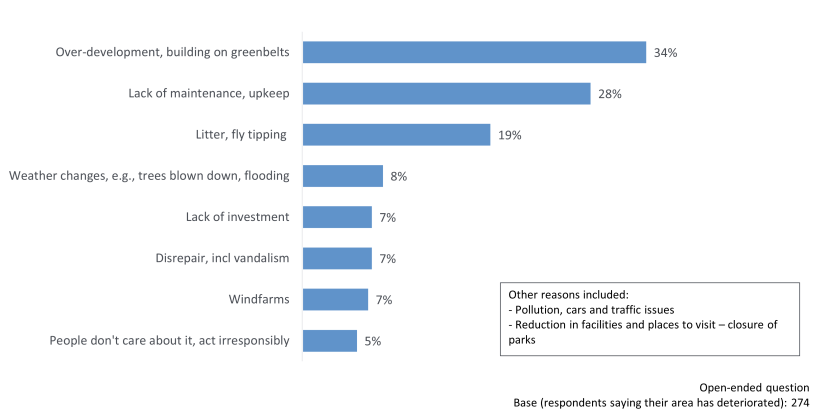
Figure 15. Reasons why the local landscape has deteriorated
Click for a full description
The bar chart shows the reasons respondents consider the landscape of their area has deteriorated over the last three years. The chart shows those reasons given by at least 5% of respondents. A text box lists a number of other common responses.
As seen above, development is a key issue for many. All respondents were asked how well informed they feel about proposals that could change the landscape of the local area in some way. A third (33%) said they felt either very well or quite well informed, while nearly two thirds (62%) said either not very well or not at all well informed.
Table 8. Informed about potential changes to the local landscape
| How well informed do you feel about proposals which could change the landscape of your local area in some way? | % |
|---|---|
| Very well informed | 5% |
| Quite well informed | 28% |
| Not very well informed | 42% |
| Not at all well informed | 20% |
| Don’t know | 5% |
| Base | 1,092 |
Levels of support for wilding greenspace
Respondents were asked to what extent they support or oppose local parks and other green spaces being managed for biodiversity and climate change. As shown in Table 8, the majority (74%) expressed support, with 34% strongly supporting. Just 3% opposed these measures, while 5% didn’t know.
Table 9. Support green spaces being managed for biodiversity and climate change
| To what extent would you support or oppose local parks and other green spaces being managed for biodiversity and climate change? | Total % |
|---|---|
| Strongly support | 34% |
| Support | 40% |
| Neutral | 18% |
| Oppose | 2% |
| Strongly oppose | 1% |
| Don’t know | 5% |
| Base | 1,092 |
There is a positive relationship between support for wilding greenspace and nature connectedness, with people receiving higher Nature Connectivity Index (NCI) scores were more likely to support wilding greenspace:
- 48% of people with an NCI score of 0-30 supported wilding greenspace
- 71% of people with NCI 31-50
- 83% of people with NCI 51-80
- 88% of people with NCI 81-100
Those with a higher NCI score (above 50) were much less likely than others to give a neutral response about wilding greenspace. Levels of opposition to the measures were very low across all groups.
Respondents were asked to think specifically about their local parks and other green spaces and say to what extent they supported or opposed a series of statements relating to the management of these area. The vast majority of respondents supported the more positive measures on the lists (shown above the line on the figure), although just 54% supported ‘areas of mown grass should be converted to wildflower meadow’.
Views were mixed on the more challenging measures (those shown below the line), with just under half (46%) supporting ‘dead wood, fallen trees and leaves which are untidy and should always be cleared’ and around a third (36%) supporting ‘grass should always be mowed short’.
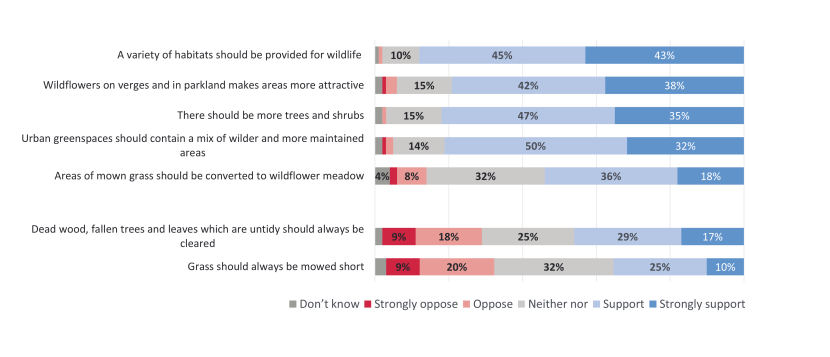
Figure 16. Views on managing greenspaces
Click for a full description
A set of seven stacked bar charts that show the extent to which people agree or disagree with statements relating to managing parks and greenspaces. The responses are presented on a five-point scale from strongly oppose through to strongly support.
The first upper five statements on the chart represent actions that would generally be regarded as good for greenspaces (for example planting more trees and shrubs; providing a variety of habitats for wildlife). The lower two statements represent actions that are increasingly considered to have a less beneficial impact on greenspaces: keeping grass mowed short and always clearing away dead branches, leaves and so on.
Environmental issues
People feel more strongly about the seriousness of climate change as compared to biodiversity loss, and are more proactive and informed about the steps taken to tackle it.
Biodiversity loss
Respondents were shown a series of statements relating to their understanding of and attitude towards biodiversity loss and asked to what extent they agreed or disagreed with each.
As shown in Figure 20 below, the majority (62%) of respondents agreed to some extent that biodiversity loss is an immediate and urgent problem, while around a quarter said they were unsure. Levels of agreement increase as levels of nature connectivity increase: rising from 26% agreement for those with a NCI score of 0-30, to 62% for score 31-50, 69% for a score of 51-80 and 79% for a score of 81-100. These results indicate a strong relationship between NCI and the importance placed on biodiversity loss.
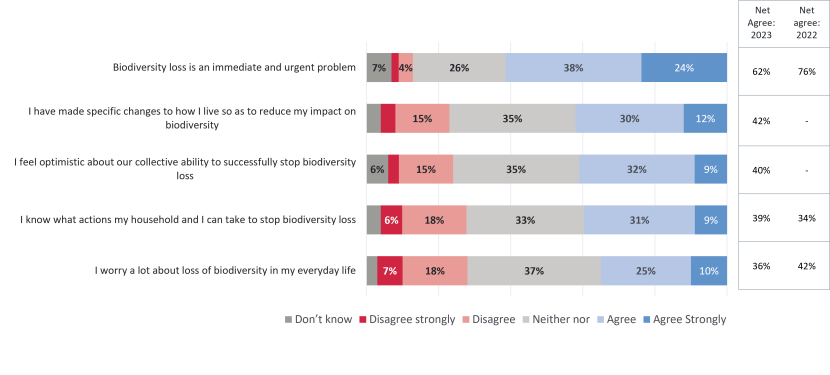
Figure 17. Views on biodiversity
Click for a full description
A set of five stacked bar charts that show the extent to which people agree or disagree with statements relating to biodiversity, or the variety of natural habitats and species in Scotland. The responses are presented on a five-point scale from disagree strongly through to agree strongly. There is also a don’t know option.
Table 10. Agreement with statements on biodiversity, by banded Nature Connectivity Index score
| Total agreement with the following statements, and by the Nature Connectivity Index Score (Banded) | Total | 0-30 | 31-50 | 51-80 | 81-100 |
|---|---|---|---|---|---|
| Biodiversity loss is an immediate and urgent problem | 62% | 26% | 62% | 69% | 79% |
| I have made specific changes to how I live so as to reduce my impact on biodiversity | 42% | 14% | 39% | 50% | 60% |
| I feel optimistic about our collective ability to successfully stop biodiversity loss | 40% | 12% | 39% | 48% | 55% |
| I know what actions my household and I can take to stop biodiversity loss | 39% | 12% | 35% | 48% | 56% |
| I worry a lot about loss of biodiversity in my everyday life | 36% | 11% | 29% | 41% | 60% |
Considerably less than half of respondents agreed with the other statements relating to making changes to their lives to reduce their impact on biodiversity, feeling optimistic about our collective ability to stop biodiversity loss, knowing what actions their household can take to stop biodiversity loss and worrying about loss of diversity in everyday life. Levels of agreement for these statements were higher amongst those aged 18-44 than 55+, and for households with children than those without. There were also marked differences in opinions in line with their connectivity to nature index score, with likelihood to agree with statements increasing as the NCI score increased.
However, there was considerably less support for action to reduce deer numbers to allow native woodland to re-establish in the uplands, with under half (44%) of respondents supporting this. Older people aged 65+ (53%), people living in remote rural areas (64%) and people who have visited an NNR/SGT (49%) were more likely to support this action. As above, there were also marked differences in opinions in line with connectivity to nature index score, with likelihood to agree with statements increasing as the NCI score increased.
Respondents were asked their views on a series of actions designed to address biodiversity loss. Most agreed with establishing more national parks and nature reserves; increasing government investment in restoring wildlife; managing at least 30% of the land and seas for nature; reintroducing more species that have become extinct in Scotland; and accepting short-term restrictions on access rights to protect wildlife.
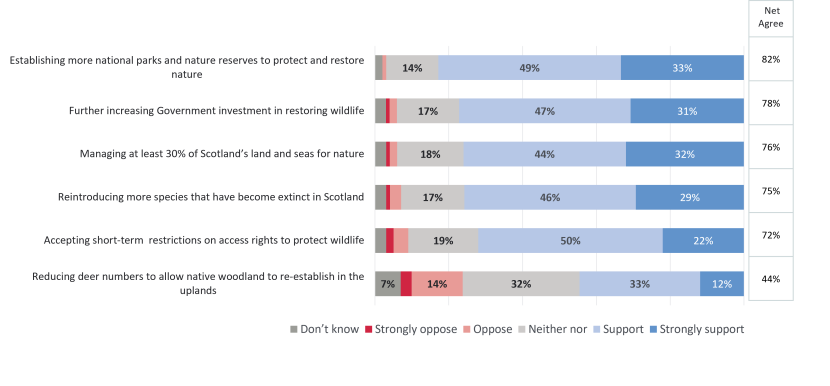
Figure 18. Views on actions to reverse biodiversity loss
Click for a full description
Six stacked bar charts that show the extent to which people support a series of actions designed to reverse biodiversity loss. The responses are presented on a five-point scale from disagree strongly through to agree strongly. There is also a don’t know option.
Table 11. Agreement with various actions designed to reverse biodiversity loss, by banded Nature Connectivity Index score
| Total agreement with the following statements, and by the Nature Connectivity Index Score (Banded) | Total | 0-30 | 31-50 | 51-80 | 81-100 |
|---|---|---|---|---|---|
| Establishing more national parks and nature reserves to protect and restore nature | 82% | 53% | 83% | 89% | 94% |
| Further increasing Government investment in restoring wildlife | 78% | 48% | 77% | 88% | 90% |
| Managing at least 30% of Scotland’s land and seas for nature | 76% | 46% | 75% | 85% | 89% |
| Reintroducing more species that have become extinct in Scotland | 75% | 53% | 76% | 79% | 86% |
| Accepting short-term restrictions on access rights to protect wildlife | 72% | 50% | 72% | 77% | 83% |
| Reducing deer numbers to allow native woodland to re-establish in the uplands | 44% | 25% | 42% | 53% | 51% |
Climate change
Respondents were shown a series of statements relating to climate change and asked to what extent they agreed or disagreed with each.
As shown in Figure 22, the majority agreed that climate change is an immediate and urgent problem, that they know the actions their household can take to tackle climate change and that they have made specific changes to how they live to reduce their contribution to climate change. Those with lower NCI scores were less likely than others to agree with these statements, with just 29% of those in the 0-30 band saying they had made changes to the way they live, compared with 60% of those in band 31-50 and 69%/75% of those in the upper bands.
Responses were more varied in relation to the statements regarding level of everyday worry about climate change and optimism about our collective ability to tackle climate change. Younger age groups, households with children and people in in the upper NCI bands were more likely to agree with both of these statements.
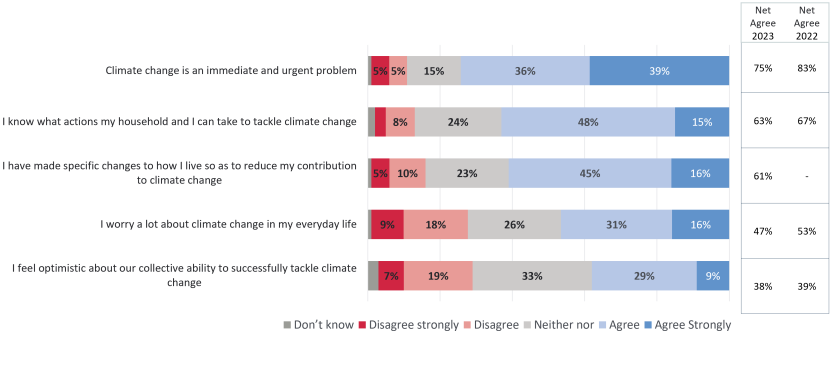
Figure 19. Views on climate change
Click for a full description
A set of five stacked bar charts that show the extent to which people agree or disagree with statements relating to climate change. The responses are presented on a five-point scale from disagree strongly through to agree strongly. There is also a don’t know option.
Table 12. Agreement with various statements on climate change, by banded Nature Connectivity Index score
| Total agreement with the following statements, and by the Nature Connectivity Index Score (Banded) | Total | 0-30 | 31-50 | 51-80 | 81-100 |
|---|---|---|---|---|---|
| Climate change is an immediate and urgent problem | 75% | 53% | 73% | 81% | 86% |
| I know what actions my household and I can take to tackle climate change | 63% | 32% | 63% | 71% | 78% |
| I have made specific changes to how I live so as to reduce my contribution to climate change | 61% | 29% | 60% | 69% | 75% |
| I worry a lot about climate change in my everyday life | 47% | 19% | 41% | 56% | 66% |
| I feel optimistic about our collective ability to successfully tackle climate change | 38% | 14% | 39% | 44% | 47% |
Respondents were specifically asked whether they agreed or disagreed with the statement that ‘climate change and biodiversity loss are linked and we need to tackle both together’. Over two-thirds (69%) either agreed or strongly agreed with the statement, which is lower than in 2022 (74%).
Table 13. Link between climate change and biodiversity loss
| To what extent do you agree with the statement that “climate change and biodiversity loss are linked, and we need to tackle both together”? | 2023 | 2022 |
|---|---|---|
| Agree strongly | 30% | 30% |
| Agree | 39% | 44% |
| Neither agree nor disagree | 18% | 14% |
| Disagree | 3% | 3% |
| Disagree strongly | 2% | 2% |
| Don’t know | 8% | 6% |
| Base | 1,092 | 1,010 |
Figure 23 compares levels of agreement with statements which were asked in relation to both biodiversity loss and climate change. It is notable that levels of agreement were higher for all of the statements in relation to climate change, with the one exception being the statement ‘I feel optimistic about our ability to impact’. Only around two-fifths of respondents agreed with this statement for both climate change and biodiversity loss.
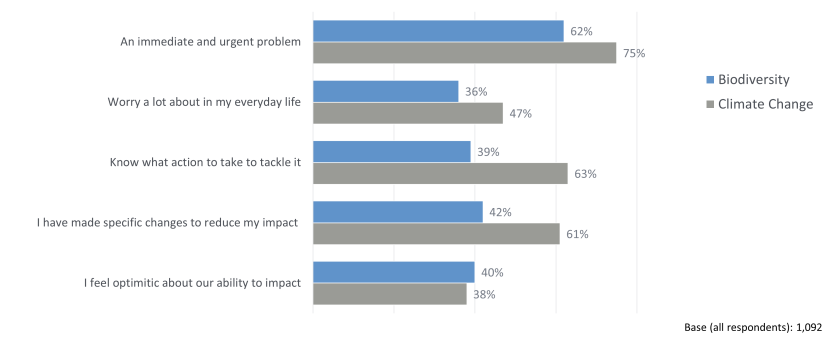
Figure 20. Comparison of views on biodiversity loss and climate change: % agreeing with related statements
Click for a full description
A set of five bar charts that show the extent to which people agree or disagree with similar questions relating to climate change and biodiversity loss. The bars shows the total percentage of respondents who either agree or strongly agree with each of the five listed statements.
Annex 1 - Methodology
The NatureScot Opinion Survey (NOS) is an annual quantitative population survey designed to measure public awareness of the organisation, understanding of their work, and attitudes towards a range of topics that fall within the organisation’s remit. NOS 2024 was conducted as an online self-completion survey.
Sampling
The target group for the research was a representative quota sample of adults aged 18+ living in Scotland from a portfolio of panel providers in Scotland (Cint, Dynata and Panelbase). Quotas were managed for age, gender and social group, with broad location, ethnicity and rurality expected to fall out naturally.
Data collection
Because the NOS will be repeated annually care was taken to minimise resampling. This will help ensure that respondents’ recognition of NatureScot, as well as their awareness of and response to the issues the issues covered in the questionnaire, will not be biased by having previously taken part in the survey. The data collection approach was therefore to work with a portfolio of panel providers (Cint, Dynata and Panelbase), each responsible for a share of the target sample. This enabled them to commit to providing fresh sample for the first two years of the survey.
When Progressive works with panels, the following protocols are used to validate the data:
- All respondents can only submit one response due to a system of unique IDs used by panel providers.
- Panellist IDs are also checked for duplication as part of Progressive’s fieldwork checks.
- Where more than one panel provider is used, cookies are used to ensure the same individual cannot complete the same survey via two different sample providers.
The fieldwork took place between 26 October and 6 December 2023.
Data processing and analysis
The survey generated 1092 responses.
On completion of the survey, the data was weighted to reflect the target population: age and gender based on the 2022 Census and social group (the 2011 Census).
As noted above, quotas were used to guide sample selection for this study. This means that we cannot provide statistically precise margins of error or significance testing as the sampling type is non-probability. The margins of error outlined below should therefore be treated as indicative, based on an equivalent probability sample. The overall sample size of 1,092 provides a dataset with an approximate margin of error of between ±0.59% and ±2.97%, calculated at the 95% confidence level (market research industry standard).
The data processing department undertakes a number of quality checks on the data to ensure its validity and integrity. These checks include:
- Every project has a live pilot stage, covering the first few days/shifts of fieldwork. The raw data and topline numbers are checked after the pilot to ensure questionnaire routing is working correctly and there are no unexpected responses or patterns in the data.
- Responses checked for duplicates where unidentified responses permitted. Cookies are also used and open-ended response are checked to avoid duplicate responses.
- The raw data is monitored throughout fieldwork to check for flatlining responses, quality of open-ended responses and speed of completion. Rules will be agreed with the data processing team at the start to determine when to exclude data based on these checks. Where the sample source was an online panel, the IDs of all respondents removed from analysis are referred back to the panel provider to assist with on-going quality improvements.
- A computer edit is carried out prior to analysis, involving both range (checking for outliers) and inter-variable checks. Any further inconsistencies identified at this stage are investigated by reference back to the raw data where possible.
- Where an ‘other – specify’ codes is used, open-ended responses are checked against the parent question for possible up-coding.
- Responses to open-ended questions will be spell and sense checked. Where required these responses may be grouped using a coding frame, which can be used in analysis. The code frame will be developed by the executive or operations team and will be based on the analysis of minimum 50 responses.
- Open-ended coding is validated using a dependent approach, whereby a second person has access to the original coding and checks a minimum of 5% of cases coded. Once responses are fully coded and validated, the completed code frame is given a final check by the Executive responsible for the project, and any queries or amends are passed back to the Data Project manager.
All research projects undertaken by Progressive comply fully with the requirements of ISO 20252, the GDPR and the MRS Code of Conduct.


