NatureScot Research Report 1340 - Scapa Flow and North Orkney Special Protection Areas (SPAs) - Inshore wintering waterfowl surveys 2021/22 and 2022/2023
Published: 2026
Authors: Peters-Grundy, R., Thompson, K., Humphries, G., Harvey, J., Semple, M., Tyler, K., Harker, A.J., Pavat, D., Thomson, R., Olley, N. and Macleod, K.
Cite as: Peters-Grundy, R., Thompson, K., Humphries, G., Harvey, J., Semple, M., Tyler, K., Harker, A.J., Pavat, D., Thomson, R., Olley, N. and Macleod, K. Scapa Flow and North Orkney Special Protection Areas (SPAs) - Inshore wintering waterfowl surveys 2021/22 and 2022/2023. NatureScot Research Report 1340.
Contents
- Keywords
- Background
- Main findings
- Abbreviations
- Introduction
- Methods
-
Results
- Survey effort
- Digital aerial survey count totals
- Digital aerial survey population estimates (strip transect analysis)
- Digital aerial survey population estimates (Bayesian point processing)
- Shore-based survey counts
- Scapa Flow SPA
- North Orkney SPA
- Comparison of the results of DAS and shore-based surveys
- North Orkney Comparison
- Discussion
- Conclusion
Keywords
Scapa Flow SPA; North Orkney SPA; digital aerial survey; wintering waterfowl; great northern diver; black-throated diver; Slavonian grebe; red-breasted merganser; velvet scoter; long-tailed duck; common eider; European shag
Background
The seas surrounding Orkney support several internationally important populations of wintering waterfowl (divers, grebes, sea ducks) and shag. In 2022, two areas of these waters were designated under The Birds Directive (2009/147/EC2) as marine Special Protection Areas (SPAs): Scapa Flow SPA and North Orkney SPA.
These seas are also of interest for current and future developments. As a part of the Orkney Harbours Masterplan Phase 1, Orkney Islands Council have proposed several developments, including a Scapa Flow deep water port, and expansion of Hatston pier (located within the North Orkney SPA) to extend the existing quay and create a facility for marine economic sectors (Orkney Islands Council, 2022).
In November 2021, NatureScot commissioned HiDef Aerial Surveying Ltd to undertake a programme of high-resolution digital aerial surveys (DAS) and shore-based counts of wintering waterfowl in the winters of 2021/22 and 2022/23. In particular, the surveys focused on eight target species, which together comprise the non-breeding qualifying features of the two SPAs: great northern diver (Gavia immer), black-throated diver (Gavia arctica), Slavonian grebe (Podiceps auratus), red-breasted merganser (Mergus serrator), velvet scoter (Melanitta fusca), long-tailed duck (Clangula hyemalis), common eider (Somateria mollissima) and European shag (Gulosus aristotelis).
The DAS surveys were designed to cover the extent of both SPAs, whilst the shore-based counts targeted a limited number of key inshore areas earmarked for development. The aim of the surveys was to supplement existing information on populations of wintering marine birds in these marine SPAs and provide finer-scale information on the distribution of birds within these key development areas. Results of the shore-based surveys would also assist interpretation of the DAS, for species which may pose challenges for broadscale aerial snapshot survey.
This report presents the results from the DAS which were conducted across both SPAs in February 2022 and January 2023 and eleven shore-based surveys targeted in nearshore areas conducted over the winters of 2021/22 and 2022/23. Population estimates with associated confidence and credible limits were calculated using both design-based strip transect analysis and model-based Bayesian point processing and are presented for the eight non-breeding qualifying features. The distributions and densities of target species across the SPAs have also been mapped. These density estimates between the 2021/22 and 2022/23 DAS have been compared with each other, as well as with previous surveys undertaken across the SPAs. Observations during the 20 January 2023 shore-based counts were also compared with the observations from the DAS conducted on the same day.
Main findings
- Two Digital Aerial Surveys (DAS) were successfully completed of Scapa Flow SPA and North Orkney SPA on 21 February 2022 and 20 January 2023, as well as eleven shore-based surveys targeted in nearshore areas conducted over the winters of 2021/22 and 2022/23. This included simultaneous shore-based and DAS on 20 January 2023, in order to compare results from the two methods.
- Over 10,000 birds were detected during the February 2022 DAS, and 18,000 during the January 2023 DAS, with an overall identification rate to species level of 97.54 % and 93.8 %, respectively.
- For eight key wintering waterfowl species, which are qualifying features of one or both of the SPAs, population estimates for the SPAs were derived from the DAS using both design-based blocked bootstrapping (where the transect is the sampling unit) and model-based Bayesian point processing methods.
- Across the key species, more birds were detected during the January 2023 DAS compared with February 2022, which may be attributed to a variety of factors such as natural fluctuations in populations within or between winter seasons, or bird distribution being impacted by poor weather conditions observed prior to the 2022 DAS being conducted. The population estimates from the January 2023 DAS, as estimated using Bayesian point processing are therefore summarised here:
- Great northern diver were recorded in both SPAs in both years, widely distributed across shallow and deep-water environments. Population estimates from the January 2023 survey were for Scapa Flow 1,072 birds (95 % credible interval 884 – 1,232) and for North Orkney 208 birds (95 % credible limits 145 – 282).
- Black-throated diver were predominantly recorded in the west of Scapa Flow SPA (seven birds recorded in total across the whole area), with only one bird recorded at North Orkney SPA in February 2022 where it is not a qualifying feature and no birds in January 2023. Bayesian analysis was not undertaken for black-throated diver due to an insufficient number of records. Higher numbers of birds were detected in the shore-based counts within limited areas of Scapa Flow.
- Slavonian grebe were recorded in both SPAs; primarily located close to shore. Population estimates from the January 2023 survey were for Scapa Flow 114 birds (95 % credible interval 69 – 175), and for North Orkney 103 birds (95 % credible interval 61 – 163).
- Red-breasted merganser are a qualifying feature of the Scapa Flow SPA. They were recorded in both SPAs, primarily located close to shore. Population estimates from the January 2023 survey were for Scapa Flow 338 birds (95 % credible interval 255 – 435) and for North Orkney 331 birds (95 % credible interval 236 – 521).
- Velvet scoter were not recorded in the digital aerial survey in either SPA, across both surveys. The species is not a qualifying feature of the Scapa Flow SPA.
- Long-tailed duck are a qualifying feature of the Scapa Flow SPA. They were the most abundant target species recorded in both SPAs, in both the 2022 and 2023 surveys and had a widespread distribution across both sites. Population estimates from the January 2023 survey were for Scapa Flow 3,678 birds (95 % credible interval 3,321 – 4,343) and for North Orkney 2,428 birds (95 % credible interval 2,199 – 2,654).
- Common eider are a qualifying feature of the Scapa Flow SPA. They were recorded in both SPAs, predominantly distributed in shallow coastline waters. Population estimates from the January 2023 survey were for Scapa Flow 1,504 birds (95 % credible interval 1,322 – 1,706) and for North Orkney 2,134 birds (95 % credible interval 1,887 – 2,421).
- European shag are a qualifying feature of the Scapa Flow SPA. They were recorded in both SPAs, with a widespread distribution across both sites. Population estimates from the January survey were for Scapa Flow 872 birds (95 % credible limits 597 – 1,560) and for North Orkney 1,667 birds (95 % credible limits 1,356 – 2,189).
- A comparison of the DAS and shore-based survey data from 20 January 2023 concluded that method selection should be dependent both on the target species and the characteristics of the environment (i.e. open sea vs shallow coastal waters). For example, more great northern diver, eider and long-tailed duck were detected during the DAS compared with the shore-based counts, suggesting that DAS may be better suited for these species. Conversely, Slavonian grebe and European shag had higher detections during the shore-based counts, which may be attributed to their small size and dark plumage respectively, making detection during DAS more difficult. However, this comparison is likely to have been influenced by the temporal and spatial mismatch between the surveys. Both red-breasted merganser and black-throated diver were primarily recorded outwith the shore-based count survey area during the DAS and thus a comparison of the data is more complex. No velvet scoter were recorded during the DAS.
- Inshore wintering waterfowl populations fluctuate naturally within and between seasons, such that single snapshot surveys cannot be used in isolation to assess possible underlying trends over time. This was evident in the monthly shore-based surveys of smaller areas, as detailed in the report, as well as high variation observed between the February 2022 and January 2023 DAS.
- Overall, DAS methods proved to be effective for detection and identification of populations of multiple waterfowl species, such as long-tailed duck and common eider. Supplementation of aerial data with shore-based surveys may be beneficial for cryptic species which form mixed flocks or which favour nearshore areas, or for species that spend time roosting on land or inter-tidal rocks such as velvet scoter, Slavonian grebe and European shag respectively.
Abbreviations
Area of Search (AoS)
Coefficient of Variation (CV)
Confidence Interval (CI)
Confidence Limits (CLs)
Digital Aerial Survey (DAS)
Gaussian Markov Random Field (GMRF)
Generalised Additive Model (GAM)
Generalised Linear Model (GLM)
Global Positioning System (GPS)
Integrated Nested Laplace Approximation (INLA)
Kernel Density Estimation(KDE)
Log Gaussian Cox Process (LGCP)
Markov Chain Monte Carlo (MCMC)
Mean Low Water Springs (MLWS)
National Planning Framework (NPF)
proposed Special Protection Area (pSPA)
Quality Assurance (QA)
Special Protection Area (SPA)
Stochastic Partial Differential Equation (SPDE)
Visual Aerial Survey (VAS)
Introduction
The seas surrounding Orkney support several internationally important populations of wintering waterfowl (divers, grebes, sea ducks) and shag. In 2022, two areas of these waters were designated under The Birds Directive (2009/147/EC2) as marine Special Protection Areas (SPAs): Scapa Flow SPA and North Orkney SPA.
Scapa Flow SPA covers an area of 318.20 km2 and is designated for the protection of eight qualifying features, including the Annex I species great northern diver (Gavia immer), black-throated diver (Gavia arctica) and Slavonian grebe (Podiceps auratus) and migratory red-breasted merganser (Mergus serrator), long-tailed duck (Clangula hyemalis), common eider (Somateria mollissima), and European shag (Gulosus aristotelis) in the non-breeding season (Table 1). Additionally, it is designated for Annex I red-throated diver (Gavia stellata) in the breeding season.
North Orkney SPA covers an area of 211.73 km2 and is designated for the protection of four qualifying features, namely, Annex I great northern diver and Slavonian grebe together with migratory velvet scoter (Melanitta fusca) in the non-breeding season, and Annex I red-throated diver in the breeding season (Table 1).
| Species (season) | Not qualifying features of the designated SPA but which were included in the pSPA | Annex 1 or migratory | Population size in Scapa Flow SPA (%GB) | Population size in North Orkney SPA (%GB) |
|---|---|---|---|---|
| Great northern diver | Non-breeding | Annex 1 | 505 (20.2) | 308 (12.3) |
| Black-throated diver | Non-breeding | Annex 1 | 57 (9.5) | N/A |
| Slavonian grebe | Non-breeding | Annex 1 | 135 (12.3) | 120 (10.9) |
| Red-breasted merganser | Non-breeding | Migratory | 539 (6.4) | 344 (4.1) |
| Velvet scoter | Non-breeding | Migratory | N/A | 147 (5.9) |
| Long-tailed duck | Non-breeding | Migratory | 1,395 (12.7) | 937 (8.5) |
| Common eider | Non-breeding | Migratory | 1,997 (3.6) | 1,453 (2.4) |
| European shag | Non-breeding | Migratory | 2,927 (2.9) | 1,742 (1.6) |
| Red-throated diver | Breeding | Annex 1 | 76 pairs (6.1) | 47 pairs (3.7) |
These seas are also of interest for current and future developments with the proposed Scapa Flow Deep Water Quay identified as a national development under Draft National Planning Framework (NPF4).
As part of the Orkney Harbours Masterplan Phase 1, Orkney Islands Council have proposals in place for several developments, including development of a Scapa Flow deep water port, and expansion of Hatston pier (located within the North Orkney SPA) to extend the existing quay and create a facility for marine economic sectors (Orkney Islands Council, 2022). Successful management of protected areas requires monitoring. Not only is this important for guiding site management measures but also for informing planning and development. The potential impacts of developments on SPAs needs to be considered through a Habitats Regulation Appraisal (HRA). Robust data to carefully assess the potential impacts of development on the qualifying features of the sites is required and can further inform the development of appropriate management measures as necessary.
Previous surveys have been undertaken at both sites to quantify the number of inshore wintering waterfowl and have comprised a composite of survey methods. A mixture of visual aerial survey (VAS), shore-based counts and boat-based surveys underpinned the initial selection of proposed SPAs for wintering waterfowl across Scotland; termed the ‘Original Areas of Search’ (AoS) (Lawson et al., 2015). Further surveys were undertaken in Orkney in the winter of 2017/18 to assess the numbers of identified target species within the then proposed SPA (pSPA) boundaries, using a combination of shore-based and boat-based surveys across the Scapa Flow (Jackson, 2018) and shore-based counts only across North Orkney (Upton et al., 2018). Previously, no DAS have been undertaken to assess the populations of wintering birds within the finalised SPA boundaries. A visual comparison of the original AoS, pSPA and SPA boundaries is presented in Figure 1.
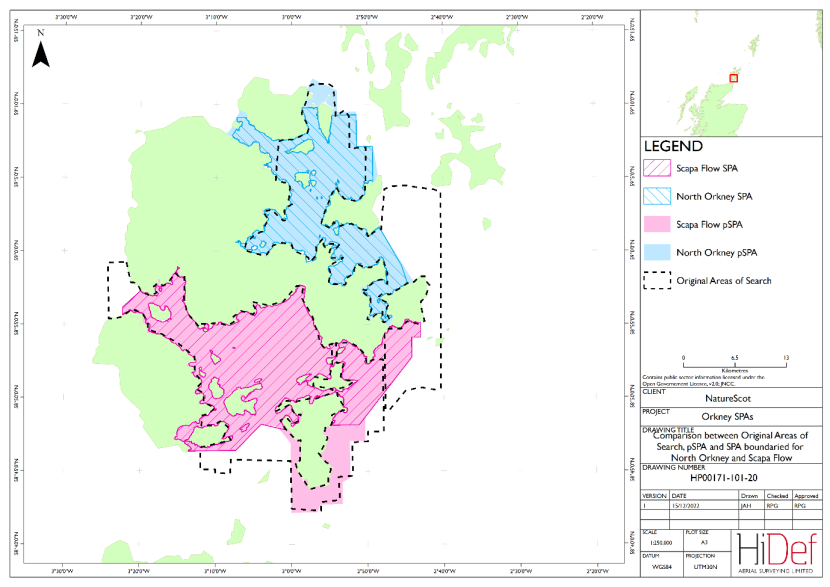
Figure 1. Comparison of previous survey boundaries across North Orkney and Scapa Flow, including the Original Areas of Search (Lawson et al., 2015), the 2017/18 pSPA boundaries (Jackson and Upton et al., 2018) and the finalised SPA boundaries.
Click for a full description
The dotted black line highlights the original Areas of Search surveyed by Lawson et al. (2015) used to underpin the initial selection of proposed SPAs for wintering waterfowl across Scotland. There are two coloured areas shown. The colour filled areas represent the pSPA boundaries used in the 2017/18 wintering waterfowl surveys undertaken by Jackson (2018) and Upton et al. (2018); with the Scapa Flow pSPA in pink and the North Orkney pSPA in blue. The hatched areas represent the final SPA boundaries used within this study; with Scapa Flow SPA in pink hatching and North Orkney SPA in blue hatching. The pSPA areas decreased in size compared to the final SPA areas.
In November 2021, NatureScot, in partnership with Marine Scotland and Orkney Islands Council, commissioned HiDef Aerial Surveying Ltd (‘HiDef’) to undertake a programme of high-resolution DAS and shore-based counts of wintering waterfowl across winter 2021/22 and 2022/23. The DAS surveys were designed to cover the extent of the SPAs, whilst the shore-based counts targeted a limited number of inshore areas.
The DAS, plus targeted shore-based vantage point (VP) surveys of selected areas, supplement existing information on populations of wintering marine birds in these marine SPAs and provide finer scale information on the distribution of birds within key areas targeted for development. The targeted shore-based VP surveys also assist interpretation of the DAS results. Some of the target species are particularly challenging for broadscale aerial snapshot surveys as they occur close inshore at low densities and spend substantial periods of time below the water surface.
This report presents the results from the DAS which were conducted across both SPAs in February 2022 and January 2023 and eleven shore-based surveys targeted in nearshore areas conducted over the winters of 2021/22 and 2022/23. Population estimates with associated confidence and credible limits were calculated using both design-based strip transect analysis and a model-based Bayesian point processing model and are presented for the eight non-breeding qualifying features. The distributions and densities of target species across the SPAs have also been mapped. Density estimates have been compared between the 2021/22 and 2022/23 DAS. Additionally, comparisons are made of density estimates within the targeted inshore areas from the DAS and shore-based surveys conducted within a similar time frame on 20 January 2023.
Methods
Shore-based surveys
The VP counts were undertaken on a selection of smaller inshore areas, hereafter referred to as ‘sectors’, utilised in previous surveys of the pSPAs (Jackson, 2018; Upton et al., 2018). These sectors were selected as being key areas targeted for potential development. Monthly shore-based VP counts were undertaken within the relevant sectors at both SPAs across the non-breeding season in 2021/22 and 2022/23.
The defined sectors and VPs used during the shore-based surveys are presented in Figure 2.
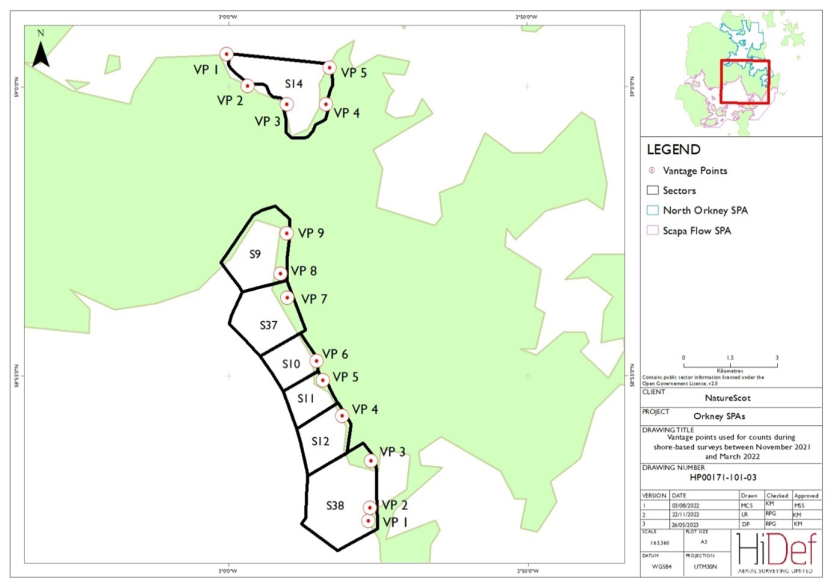
Figure 2. Defined survey sectors and VPs used during shore-based surveys of the Orkney SPAs throughout winters 2021/22 and 2022/23.
Click for a full description
A map showing the vantage points used for the shore-based surveys between November 2021 and March 2022, and November 2022 and March 2023 at the Special Protection Areas. There are five vantage points at the North Orkney Special Protection Area and nine vantage points at the Scapa Flow Special Protection Area. At the North Orkney site there is one defined survey sector which encompasses all five of the vantage points. At the Scapa Flow site there are six defined survey sectors, each contains either one, two or three vantage points.
Five counts were undertaken at each sector in winter 2021/22, and six were undertaken at each sector in winter 2022/23, as presented in Table 2. In 2023, an additional shore-based count was undertaken on 20 January 2023 to coincide with the DAS in order to compare the abundance and densities of animals recorded using these two methods. However, due to difficulties with the terrain and access issues on 20 January 2023, the shore-based survey at sector 37 could not be undertaken and has not been included in the analysis for that month.
| Sector | November | December | January | February | March |
|---|---|---|---|---|---|
| 9 | 30/11/2021 | 19/12/2021 | 09/01/2022 | 13/02/2022 | 05/03/2022 |
| 10 | 30/11/2021 | 19/12/2021 | 09/01/2022 | 13/02/2022 | 05/03/2022 |
| 11 | 30/11/2021 | 19/12/2021 | 09/01/2022 | 13/02/2022 | 05/03/2022 |
| 12 | 30/11/2021 | 19/12/2021 | 09/01/2022 | 13/02/2022 | 05/03/2022 |
| 14 | 23/11/2021 | 18/12/2021 | 15/01/2022 | 14/02/2022 | 06/03/2022 |
| 37 | 30/11/2021 | 19/12/2021 | 09/01/2022 | 13/02/2022 | 05/03/2022 |
| 38 | 30/11/2021 | 19/12/2021 | 09/01/2022 | 13/02/2022 | 05/03/2022 |
| 9 | 12/11/2022 | 13/12/2022 | 12/01/2023 and 20/01/2023 | 14/02/2023 | 04/03/2023 |
| 10 | 12/11/2022 | 13/12/2022 | 12/01/2023 and 20/01/2023 | 14/02/2023 | 04/03/2023 |
| 11 | 12/11/2022 | 13/12/2022 | 12/01/2023 and 20/01/2023 | 14/02/2023 | 04/03/2023 |
| 12 | 12/11/2022 | 13/12/2022 | 12/01/2023 and 20/01/2023 | 14/02/2023 | 04/03/2023 |
| 14 | 07/11/2022 | 05/12/2022 | 12/01/2023 and 20/01/2023 | 13/02/2023 | 04/03/2023 |
| 37 | 12/11/2022 | 13/12/2022 | 12/01/2023 and 20/01/2023 (this on 20 January 2023 was not completed due to difficulties with access, and this survey has not been considered further.) | 14/02/2023 | 04/03/2023 |
| 38 | 12/11/2022 | 13/12/2022 | 12/01/2023 and 20/01/2023 | 14/02/2023 | 04/03/2023 |
The VPs were selected based on ease of access and view, assuming that if there was at least 5 m elevation above sea level that birds would be detected, identified and accurately counted up to 2 km (Jackson, 2018) with the aid of a spotting scope.
Count protocols were based on those used by Jackson (2018). This is based on 15-20 minute counts at each site, including range and bearing of offshore birds. Each shore-based survey was conducted by an experienced ornithologist. All target species were searched for and recorded, including birds on the sea and roosting birds on the adjacent shoreline, islets and rocks. Flying birds were not included in count totals unless birds took off from or landed in the count area. Double counting was reduced as far as possible by avoiding spatial overlap and by minimising the time between recording adjacent areas by systematically working along the coast.
Digital aerial survey
Two DAS of inshore wintering waterfowl per winter were undertaken, on the 21 February 2022 and 20 January 2023. The survey design (HiDef Aerial Surveying Ltd, 2023) placed 23 strip transects across both the Scapa Flow and North Orkney SPAs, spaced 2 km apart. The survey was originally designed for the previous pSPA boundaries, creating an overall survey area of 558.07 km2. The final SPA boundaries, as designated in February 2022 cover a slightly smaller combined area of 530.29 km2 (Figure 1).
The strip transects were orientated roughly north to south, perpendicular to the depth contours along the coast. Such a design ensured that each transect sampled a similar range of habitats (primarily relating to water depth) and would reduce the variation in bird and mammal abundance estimates between transects.
However, in the 2022 survey, a number of transects were rotated by roughly 90 degrees in the west of the Scapa Flow, shortly prior to the flight, due to the pilot having safety concerns with flying across the channel between Hoy and Orkney Mainland. To maintain consistency across both DAS, the survey in 2023 was conducted following the same transect pattern (Figure 3).
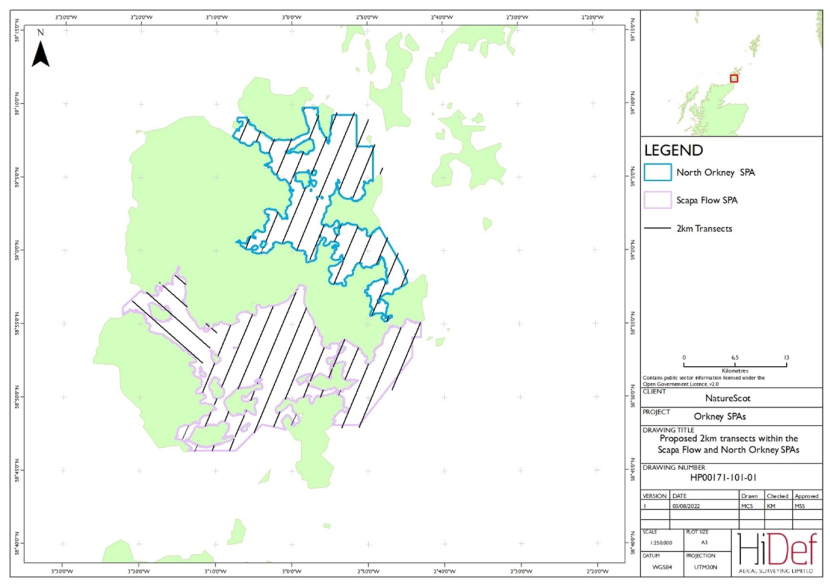
Figure 3. Orkney SPAs aerial survey design with 2 km-spaced transects flown on 21 February 2022 and 20 January 2023.
Click for a full description
Map of Orkney Islands with the North Orkney (outlined in blue) and Scapa Flow (outlined in pink) Special Protection Areas plotted. The 2 km-spaced aerial survey transect lines are also plotted and show they are covering the entirety of the SPAs.
A comparison of the location of the DAS transects with the inshore sectors used for shore-based counts during winter 2021/22 and winter 2022/23 can be found in Figure 4.
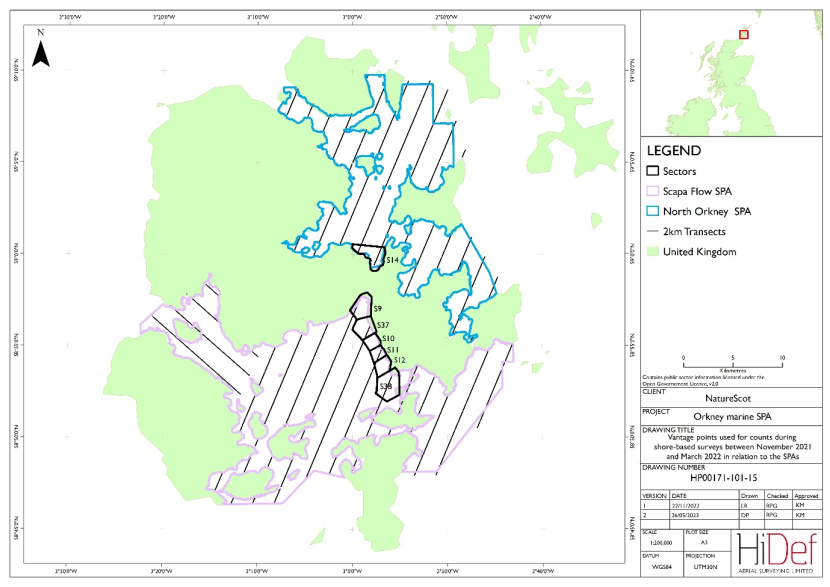
Figure 4. Location of survey sectors used during shore-based surveys of the Orkney SPAs in winter 2021/22 and 2022/23 in comparison to the DAS transects flown on 21 February 2022 and 20 January 2023.
Click for a full description
A map showing the inshore survey sectors used for the shore-based surveys between November 2021 and March 2022 and November 2022 and March 2023 at the Orkney Special Protection Areas (shown in black outline). There is one sector within the North Orkney Special Protection Area (outlined in blue) covering Kirkwall Bay and six sectors within the Scapa Flow Special Protection Area (outlined in pink) extending from Scapa Bay to Glimps Holm. The sectors are overlaid on the transects flown by the DAS on the 21 February 2022 and 20 January 2023, which cover the full extent of both SPAs.
Both DAS surveys were undertaken using a Diamond DA42 Twin Star aircraft equipped with four HiDef Gen II cameras with sensors set to a resolution of 2cm Ground Sample Distance (GSD). Each camera sampled a strip of 125 m width, separated from the next camera by ~20 m, thus providing a combined sampled width of 500 m within a ~560 m overall strip (Figure 5).
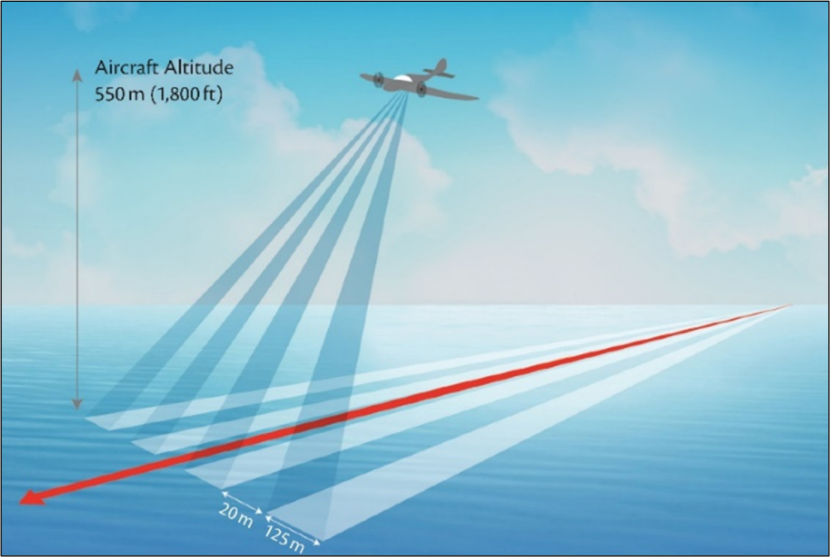
Figure 5. Schematic of HiDef four-camera system and DAS strip width.
Click for a full description
Schematic diagram of aircraft equipped with four HiDef cameras, used to undertake the DAS on 21 February 2022 and 20 January 2023. Each camera sampled a strip of 125 m width, separated from the next camera by ~25 m, thus providing a combined sampled width of 500 m within a 575 m overall strip.
A minimum target of 24.3 % site coverage was agreed, with data from all four cameras being processed. This was to ensure a survey with sufficient coverage and number of transects for precise abundance estimation.
The survey was flown along the transect pattern shown in Figure 3 at a height of approximately 550 m above sea level (ASL; ~1,800’). Flying at this height ensured that there was reduced risk of flushing species that are easily disturbed by aircraft noise. Thaxter et al.(2015) recommend a minimum flight altitude of 460 m ASL.
Position data for the aircraft was captured from a Garmin GPSMap 296 receiver with differential Global Positioning System (GPS) enabled to give 1 m accuracy for the positions and recording updates in location at one second intervals for later matching to bird observations.
Data review and object detection
Data were viewed by trained reviewers who marked any objects in the footage as requiring further analysis, as well as determining which were birds, marine megafauna or anthropogenic objects such as ships or buoys.
As part of HiDef’s quality assurance (QA) process, an additional ‘blind’ review of 20 % of the raw data was carried out and the results compared with those of the original review. If 90 % agreement was not attained during the QA process, then the remaining data set was reviewed and where appropriate, the failed reviewer’s data discarded and the entire dataset re-reviewed.
Objects were only recorded where they reached a reference line (known as ‘the red line’) which defines the true transect width of 125 m for each camera. By excluding objects that did not cross the red line, biases to abundance estimates caused by flux (movement of objects in the video footage relative to the aircraft, such as where the survey craft is buffeted by airflow) were eliminated.
Species identification
Images marked as requiring further analysis were reviewed by the ID Team of ornithologists (HiDef currently employs two of the ten current members of the British Birds Rarities Committee (‘BBRC’) as expert ornithologists) for identification to the lowest taxonomic level possible and for assessment of the approximate age and the sex of each animal, as well as any behaviour traits visible from the imagery.
At least 20 % of all objects were selected at random and subjected to a separate ‘blind’ QA process. If less than 90 % agreement was attained then corrective action was initiated: if appropriate, the failed identifier’s data were discarded, and the data re-identified. Any disputed identifications were passed to a third-party expert ornithologist for a final decision1. The level of agreement within the QA process is calculated as the final number of agreements as a percentage of all identifications subjected to QA for the entire survey.
All objects were assigned to a species group and where possible, each of these then further identified to species level. The species identifications were given a confidence rating of ‘possible’, ‘probable’ or ‘definite’ (Definite: as certain as reasonably possible. Probable: very likely to be this species or species group. Possible: more likely to be this species or species group than anything else.).
It is important to note that confidence ratings are not standardised. The likelihood of achieving a definite or probable identification is not consistent for all component members of a species group. For example, someone undertaking identification of a large auk will find it easier to be confident of guillemot (Uria aalge) identification than razorbill (Alca torda). Confidence scores should not be used to filter or weight the probability of ‘large auk’ being one species or another in any analysis, as this will lead to biased results, particularly if the identification rate is low.
Any animals that could not be identified to species level were assigned to a category ‘No ID’ and only identified to group level. If, on occasion, the unidentified bird is suspected of belonging to two possible genera, then a broader group category may be used. For example, a bird would usually be assigned to the group category ‘Shearwater species’ if identified as a Manx shearwater (Puffinus puffinus), or to ‘Large Auk species’ if identified as a guillemot. However, if the bird has the potential to be either, then it would be assigned to a wider group category ‘Shearwater / Auk species’ and the species level recorded as ‘No ID’.
Additional information was recorded on basic behaviour (i.e., whether the bird was sitting; loafing on land or other objects; flying; diving or taking off). Detail was recorded where possible on foraging behaviour, approximate age, sex and any other details of interest. Ageing of birds was based on moults and was conducted where possible on species which show seasonal variation in plumage.
Final processing
All data were geo-referenced, taking into account the offset from the transect line of the cameras, and compiled into a single output; Geographical Information System (GIS) files for the Observation and Track data are issued in ArcGIS shapefile format, using UTM30N projection, WGS84 datum.
Data analysis
Data treatment - DAS
Survey data from the DAS were split between Scapa Flow SPA and North Orkney SPA. As many birds were recorded along the shoreline, just beyond the perimeter of the marine SPA boundaries, raw counts are presented for two scenarios: for the marine SPAs including birds just beyond the perimeter (‘untrimmed’ counts) and for the marine SPA boundaries directly (‘trimmed’ counts).
No apportioning of ‘unidentified’ birds to species level was undertaken. All confidence levels of species identifications (i.e. Definite, Probable and Possible (as explained earlier)) were used in the analysis.
Population estimates: design-based strip transect approach
Population estimates were calculated for the Scapa Flow SPA and North Orkney SPA separately. Along the coasts, observations were trimmed to mean low water springs (MLWS) to match the SPA boundaries, and as such, roosting birds beyond these boundaries were not included in resulting estimates.
Each strip transect was treated as a statistically independent random sample from the site. The length and breadth (i.e., the width of the field of view of the camera) of each transect were multiplied together to give the transect area; dividing the number of observations for each species on each transect by the transect area gives a point estimate of the density of that species for the transect. The density of animals at the site (and hence the population size by multiplying by the area of the site), the standard deviation, the 95 % confidence intervals (CIs) and coefficient of variation (CV) were then estimated using a non-parametric block bootstrap method with replacement (Buckland et al., 2001), to ensure equal transect effort was sampled across each bootstrap iteration. This was done by using transect ID as the sampling unit with replacement. A group of transects were randomly sampled until their total length equalled approximately the same length as the total survey length.
To avoid autocorrelation, checks were built into the procedure. If autocorrelation in the randomly sampled group of transects was detected, then the distance between the sampled transects was adjusted to remove autocorrelation. No autocorrelation was detected during the generation of these estimates.
A total of 1,000 bootstrap iterations were performed from which we calculated the mean and standard deviation of the sampled means, as well as the relative standard deviation (or CV) as defined by the standard deviation divided by the mean. Data were processed in the R programming language (version 4.1.1).
The density estimate is expressed as the average number of birds per square km in the whole SPA boundary. The population estimate is expressed as the estimated number of birds within the whole SPA boundary. The upper and lower confidence limits (CLs) define the range that the population estimate falls within with 95 % certainty. The CV is a measure of the precision of the population and density estimates. Detailed definitions of statistical terms used are presented in Table 3.
| Term | Definition |
|---|---|
| Density estimate (n/km2) | The mean number of birds per square km across the whole SPA. |
Population estimate (number)
| The mean number of birds estimated within the SPA. |
Coefficient of variation (CV) | The coefficient of variation is a standard measure that describes the dispersion of data points around the mean. The lower the CV the more precise the estimate. It is calculated as the SD / mean. |
| Relative abundance | In the case of diving birds, this is the estimated population size based on birds recorded on or above the sea surface and does not account for any that may be diving and thus submerged at the time of survey. |
| Absolute abundance | The most accurate estimate of population size. In the case of diving birds, this includes an estimate for the number that are believed to be submerged at the time of survey. |
Standard deviation (SD) | The amount of variation or dispersion of a set of values. A low SD indicates that the bootstrap values tend to be close to the mean of the set. |
Coefficient of determination (R2) | The coefficient of determination is the proportion of variance in the response variable that is explained by the predictor variable. This ranges between 0 and 1. |
| Root mean squared error | The standard deviation of the residuals, which are a measure of the variance that is unexplained by the model. A lower RMSE signals a better fitting model as there is less unexplained variance in the data. |
| Term | Definition |
|---|---|
| 95 % confidence interval (CI) | A measure of uncertainty in the mean value. If the analysis was repeated, 95 % of the time the mean population estimate would fall within this range. The smaller the CI range the more confident we can be that the mean estimate is an accurate reflection of the true population size. |
| 95 % confidence limits (CLs) | The upper and lower values that define the range of the 95 % confidence interval. |
| Term | Definition |
|---|---|
| Credible interval | The interval within which 95 % of the estimated distribution of values fall. |
| Credible limit | The upper and lower values that define the range of the 95 % credible interval. |
Deviance information criterion (DIC) | The DIC is used to compare the fit of a set of Bayesian models. It is used for model selection, with the lowest DIC indicating the best fitting model. |
For most species these abundance estimates relate to absolute abundance, but for diving species such as shags and divers, these estimates relate to relative abundance due to an unquantified proportion of animals being submerged at the time of survey.
Population estimates: model-based Bayesian point processing
An alternative approach to density and abundance estimation is to use stochastic spatially explicit modelling of observations with associated covariates, and then predicting (extrapolating) into areas where we have information on the covariates, but not on observations. Using georeferenced observations as an input, extrapolation can be done using a point pattern process in a Bayesian framework. The Bayesian point process model offers an advantage over standard Kernel Density Estimates (KDE) approaches as it takes into account any potential unequal survey effort within transects (for example, should there be a change in the number of cameras processed along the transect) and between transects (differences in transect lengths).
A point pattern records the occurrence of events in a study region where the locations of these observations depend on an underlying spatial process. This spatial process can be characterised using the Cox process, which is a Poisson process with intensity λ(s) that varies in space. This intensity function measures the average number of events per unit of space, and it can be modelled to depend on covariates and other effects (Diggle, 2014; Baddeley et al., 2015).
Under the log-Cox point process model assumption, log intensity of the Cox process is modelled with a Gaussian linear predictor. In this case, the log-Cox process is known as a log Gaussian Cox process (LGCP, Møller et al., 1998), and inference can be made using the Integrated Nested Laplace Approximation approach (INLA; Illian et al., 2012), which was developed as a computationally efficient alternative to Markov Chain Monte Carlo (MCMC) methods (Robert and Casella, 2004, Brooks et al., 2011). The log-Gaussian part of the LGCP name comes from modelling log(λ(s)) as a latent Gaussian (conditional on a set of hyper-parameters), in the typical Generalised Linear Model (GLM)/ Generalised Additive Model (GAM) framework.
To fit these models in INLA we used the stochastic partial differential equation (SPDE) approach (Simpson et al., 2016). The SPDE approach consists of representing a continuous spatial process (e.g., a latent stationary Gaussian Field) with the Matèrn covariance function as a discretely indexed spatial random process (e.g., a Gaussian Markov Random Field (GMRF); Rue and Held, 2005). This approach is computationally efficient while accounting for spatio-temporal interdependence and autocorrelation in the data and it considers a direct approximation of the log-Cox point process model likelihood, where observations are modelled considering their exact locations instead of binning them into cells. Along with the flexibility for defining a mesh, this approach can handle non-rectangular areas.
The DAS were modelled using only the spatial process (i.e. x and y coordinates of observations) as covariates which characterised the distribution and abundance of birds based on the location of individual observations. Environmental covariates were not used due to time constraints on data acquisition and tuning of hyperparameters that would be required to fit the model.
Species with a sample size of <10 observations were not included in the analysis, as model accuracy decreases sharply with sample sizes under this threshold (Stockwell & Peterson, 2002). Including species with a low sample size could lead to poor estimates of the species' distribution elsewhere in the study area.
The inlabru package (Bachl et al., 2019) automates much of the process to perform Bayesian inference in the INLA framework, making it a relatively lightweight option for performing density surface models. In this case, only the spatial component of the observations was modelled using the log Gaussian Cox process method. There are two hyper-parameters that need to be tuned here; the range (i.e., the mean distance at which we expect spatial autocorrelation to dissipate) and sigma (i.e., the standard deviation around the mean estimate of spatial autocorrelation) prior distributions, which are used for abundance estimation. The range parameter is determined from the mesh and the minimum nearest neighbour distance. It should not be smaller than the mesh resolution as the resolution of the mesh defines the minimum scale at which we can model the process. The range must be at least the minimum nearest neighbour distance between points as it uses the spatial smooth to model spatial correlation structures between the points. Therefore, it must be larger than this distance as the minimum distance across which points are correlated cannot be smaller than the distance between the points themselves. Using this information, the range parameter was chosen by fitting several models with different values for the range and identifying the model with the lowest DIC score.
Model predictions were output to a 1 x 1 km grid resolution with each grid of the output raster containing a predicted density of birds.
As with the design-based estimates, observations during Bayesian analysis were trimmed to each SPA boundary respectively, and as such, roosting birds above MLWS were not included in resulting estimates.
Detailed definitions of statistical terms used in the presentation of the results are presented in Table 3.
Shore-based counts
Counts of each target species within each sector per shore-based survey were recorded and summed. The mean percentage use per sector was also calculated.
Field maps were digitised in ArcMap (version 10.8.1). Dot maps were created to display the distribution of target species within the shore-based counts of the Scapa Flow SPA (sectors 9 – 12 and 37-38) and North Orkney SPA (sector 14), shown in Figure 2. Dot size indicates ‘flock’ size.
Comparison of shore-based counts and DAS
A qualitative comparison between the density estimates has been conducted for the simultaneous DAS and shore-based counts undertaken on 20 January 2023. Given the low coverage of the DAS, and low number of transects which intersect the shore-based count sectors, it was not possible to generate a robust population estimate for these sectors from the DAS or to conduct any other quantitative spatial analysis in order to compare the methods. Therefore, for each 500 m segment along the DAS within the shore-based count sectors, observations of birds across the four cameras were grouped and are represented by a single point where the larger the point, the more birds were observed in that 500 m segment. These have been mapped against the shore-based count observations for each of the key species for visual comparison, with the approximate location of the DAS camera swathe also indicated. However, it should be noted that these maps do not show the 20 m gap between cameras. Grey buffer marks 1.75 km from shore are also given, which indicated the distance at which shore-based detection is known to deteriorate (Webb and Reid, 2004)
Results
Survey effort
The survey effort undertaken during the DAS on 21 February 2022 and 20 January 2023 is shown in Table 4. The number of transects and the total length of transects presented for the SPAs are those used in subsequent population analysis (see Figure 6 for the aircraft flight patterns).
| Survey area | Whole | Scapa Flow SPA | North Orkney SPA |
|---|---|---|---|
| Number of transects analysed | 20 | 16 | 14 |
| Total length of transects analysed (km) | 257.09 | 155.58 | 101.52 |
| Area covered (km2) | 128.55 | 77.79 | 50.76 |
| Area covered (%) | 24.26 | 24.43 | 23.96 |
| Survey area | Whole | Scapa Flow SPA | North Orkney SPA |
|---|---|---|---|
| Number of transects analysed | 20 | 16 | 14 |
| Total length of transects analysed (km) | 253.49 | 158.82 | 107.77 |
| Area covered (km2) | 126.75 | 79.41 | 53.88 |
| Area covered (%) | 23.92 | 24.04 | 23.67 |
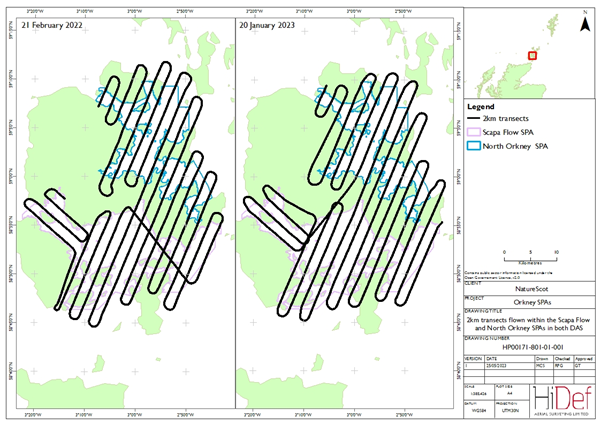
Figure 6. Flight pattern for DAS flown on 21 February 2022 and 20 January 2023.
Click for a full description
Map of Orkney Islands showing the North Orkney and Scapa Flow Special Protection Areas and the flight patterns which were flown on the 21 February 2022 and 20 January 2023 to cover the 2 km-spaced transect survey design. Flight pattern shows that the entirety of the SPAs were covered.
Environmental conditions during the surveys were good, with air clarity, glare and turbidity recorded as very low or slight. Across the survey area sea state varied, with scoring criteria on the World Meteorological Organisation (WMO) Sea State Code ranging between 0 ‘calm’ (0 m wave height) and 5 ‘rough’ (2.5 m to 4 m wave height) during the 2022 survey, and predominantly between 0 ‘calm’ and 3 ‘Slight’ (0.5 to 1.25 m wave height) across the 2023 survey. A map of sea states across the survey area for each survey recorded from footage is presented in Figure 7. During the 2022 survey sea states ranged between 0 and 5, with 4 being the most commonly observed value. Sea state was generally calmest close to shore and within sheltered bays. The highest sea states (sea state 5) were generally recorded in the east, such as the eastern Scapa Flow, east of Burray and south and north of Shapinsay. In the January 2023 survey, sea states were generally substantially lower, with the highest sea state of 4 observed in the west of the survey area between north-east Hoy and Graemsay.
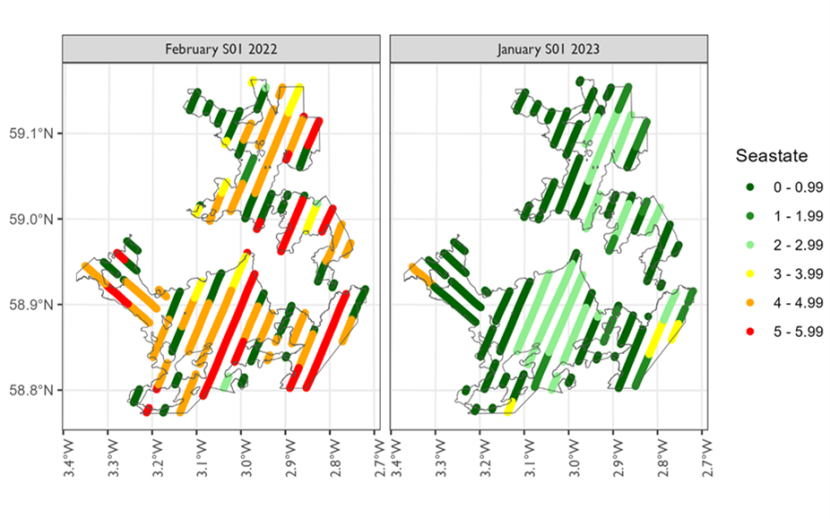
Figure 7. Average sea state (WMO Sea State Code) recorded on footage during the DAS flown on 21 February 2022 (left) and 20 January 2023 (right).
Click for a full description
A map of the Orkney islands showing the average sea state recorded on footage during the DAS of Scapa Flow and North Orkney SPAs flown on 21 February 2022 and 20 January 2023. Sea state is measured using the World Meteorological Organization Sea State Code, which ranges from 0 (Calm) to 9 (Phenomenal Over). Footage is rated for sea state every 500 frames. HiDef do not fly surveys over sea state 5. On 21 February 2022 (left), sea states ranged between 0 – 5, with 4 being the most commonly observed value. Sea states recorded in the 20 January 2023 survey (right) predominantly ranging from 0 – 2 but peaked at 4 in a small area to the south of the site. In this rating system 0 ‘Calm (glassy)’ equates to 0 m waves; 1 ‘Calm (ripped)’ equates to 0 – 0.1 m waves; 2 ‘Smooth (wavelets)’ equates to 0.1 to 0.5 m waves; 3 ‘Slight’ equates to 0.5 to 1.25 m waves; 4 ‘Moderate’ equates to 1.25 to 2.5 m waves and 5 ‘Rough’ equates to 2.5 to 4 m waves.
Digital aerial survey count totals
The total number of birds identified to species level during the DAS of the Orkney SPAs are presented in Table 5 and Table 6 for the surveys conducted on 21 February and 20 January 2023, respectively. For the purposes of presenting raw counts, the ‘untrimmed’ records include shoreline birds just outside the perimeter of each SPA boundary and are presented for context as these birds are likely to use the SPA waters. The ‘trimmed’ records relate to birds found directly within the marine SPA boundary and these go on to inform the population analysis. The percentage difference between the trimmed and untrimmed counts is also presented. The overall identification rate of birds to species level, with possible, probable, and definite confidence (Definite: as certain as reasonably possible. Probable: very likely to be this species or species group. Possible: more likely to be this species or species group than anything else.) was 97.54 % in the 2022 survey, and 93.8 % in the 2023 survey.
| Target species/ Non-Target Species | Species | Scientific Name | Scapa Flow SPA Un-trimmed | Scapa Flow SPA Trimmed to SPA boundary | Scapa Flow SPA % Diff | North Orkney SPA Un-trimmed | North Orkney SPA Trimmed to SPA boundary | North Orkney SPA % Diff |
|---|---|---|---|---|---|---|---|---|
| Target species | Great northern diver | Gavia immer | 66 | 64 | 3.03 | 28 | 19 | 32.14 |
| Target species | Black-throated diver | Gavia arctica | 3 | 3 | 0.00 | 1 | 1 | 0.00 |
| Target species | Slavonian grebe | Podiceps auritus | 18 | 18 | 0.00 | 9 | 9 | 0.00 |
| Target species | Red-breasted merganser | Mergus serrator | 29 | 19 | 34.48 | 65 | 51 | 21.54 |
| Target species | Velvet scoter | Melanitta fusca | 0 | 0 | 0.00 | 0 | 0 | 0.00 |
| Target species | Long-tailed duck | Clangula hyemalis | 359 | 336 | 6.41 | 377 | 374 | 0.80 |
| Target species | Common eider | Somateria mollissima | 192 | 139 | 27.60 | 224 | 201 | 10.27 |
| Target species | European shag | Gulosus aristotelis | 40 | 32 | 20.00 | 43 | 36 | 16.28 |
| Target species | Red-throated diver | Gavia stellata | 5 | 3 | 40.00 | 1 | 1 | 0.00 |
| Non-target species | Barnacle goose | Branta leucopsis | 1 | 1 | 0.00 | 0 | 0 | 0.00 |
| Non-target species | Greylag goose | Anser anser | 106 | 60 | 43.40 | 661 | 529 | 19.97 |
| Non-target species | Pink-footed goose | Anser brachyrhynchus | 0 | 0 | 0.00 | 17 | 13 | 23.53 |
| Non-target species | Mute swan | Cygnus olor | 0 | 0 | 0.00 | 2 | 0 | 100.00 |
| Non-target species | Whooper swan | Cygnus cygnus | 1 | 0 | 100.00 | 0 | 0 | 0.00 |
| Non-target species | Shelduck | Tadorna tadorna | 2 | 0 | 100.00 | 4 | 0 | 100.00 |
| Non-target species | Wigeon | Mareca penelope | 1,270 | 245 | 80.71 | 2,558 | 411 | 83.93 |
| Non-target species | Mallard | Anas platyrhynchos | 45 | 0 | 100.00 | 137 | 13 | 90.51 |
| Non-target species | Teal | Anas crecca | 14 | 9 | 35.71 | 143 | 0 | 100.00 |
Non-target species | Common scoter | Melanitta nigra | 3 | 3 | 0.00 | 2 | 2 | 0.00 |
| Non-target species | Goldeneye | Bucephala clangula | 13 | 4 | 69.23 | 6 | 0 | 100.00 |
| Non-target species | Oystercatcher | Haematopus ostralegus | 159 | 7 | 95.60 | 50 | 0 | 100.00 |
| Non-target species | Lapwing | Vanellus vanellus | 122 | 122 | 0.00 | 40 | 39 | 2.50 |
| Non-target species | Curlew | Numenius aquata | 69 | 2 | 97.10 | 747 | 113 | 84.87 |
| Non-target species | Bar-tailed godwit | Limosa lapponica | 0 | 0 | 0.00 | 2 | 2 | 0.00 |
| Non-target species | Turnstone | Arenaria interpres | 0 | 0 | 0.00 | 19 | 0 | 100.00 |
| Non-target species | Purple sandpiper | Calidris maritima | 7 | 0 | 100.00 | 0 | 0 | 0.00 |
| Non-target species | Redshank | Tringa totanus | 3 | 3 | 0.00 | 3 | 3 | 0.00 |
| Non-target species | Kittiwake | Rissa tridactyla | 10 | 10 | 0.00 | 12 | 11 | 8.33 |
| Non-target species | Black-headed gull | Chroicocephalus ridibundus | 47 | 44 | 6.38 | 34 | 17 | 50.00 |
| Non-target species | Common gull | Larus canus | 479 | 330 | 31.11 | 629 | 240 | 61.84 |
| Non-target species | Great black-backed gull | Larus marinus | 40 | 35 | 12.50 | 38 | 23 | 39.47 |
| Non-target species | Iceland gull | Larus glaucoides | 1 | 1 | 0.00 | 0 | 0 | 0.00 |
| Non-target species | Herring gull | Larus argentatus | 105 | 55 | 47.6 | 96 | 43 | 55.21 |
| Non-target species | Little auk | Alle alle | 3 | 3 | 0.00 | 3 | 3 | 0.00 |
| Non-target species | Guillemot | Uria aalge | 59 | 59 | 0.00 | 17 | 16 | 5.88 |
| Non-target species | Razorbill | Alca torda | 25 | 25 | 0.00 | 8 | 7 | 12.50 |
| Non-target species | Black guillemot | Cepphus grylle | 54 | 46 | 14.81 | 74 | 69 | 6.76 |
| Non-target species | White-billed diver | Gavia adamsii | 1 | 1 | 0.00 | 0 | 0 | 0.00 |
| Non-target species | Fulmar | Fulmarus glacialis | 463 | 366 | 20.95 | 355 | 279 | 21.41 |
| Non-target species | Cormorant | Phalacrocorax carbo | 5 | 3 | 40.00 | 5 | 3 | 40.00 |
| - | Total | Total | 3,819 | 2,048 | 46.37 | 6,410 | 2,528 | 60.56 |
| Target Species/ Non-target species | Species | Scientific Name | Scapa Flow SPA Un-trimmed | Scapa Flow SPA Trimmed to SPA boundary | Scapa Flow SPA % Diff | North Orkney SPA Un-trimmed | North Orkney SPA Trimmed to SPA boundary | North Orkney SPA % Diff |
|---|---|---|---|---|---|---|---|---|
| Target Species | Great northern diver | Gavia immer | 221 | 220 | 0.45 | 45 | 45 | 0.00 |
| Target Species | Black-throated diver | Gavia arctica | 7 | 7 | 0.00 | 0 | 0 | - |
| Target Species | Slavonian grebe | Podiceps auritus | 29 | 24 | 17.24 | 22 | 22 | 0.00 |
| Target Species | Red-breasted merganser | Mergus serrator | 86 | 80 | 6.98 | 78 | 67 | 14.10 |
| Target Species | Velvet scoter | Melanitta fusca | 0 | 0 | 0.00 | 0 | 0 | 0.00 |
| Target Species | Long-tailed duck | Clangula hyemalis | 786 | 757 | 3.69 | 590 | 517 | 12.37 |
| Target Species | Common eider | Somateria mollissima | 354 | 351 | 0.85 | 556 | 543 | 2.34 |
| Target Species | European shag | Gulosus aristotelis | 198 | 184 | 7.07 | 329 | 318 | 3.34 |
| Target Species | Red-throated diver | Gavia stellata | 2 | 2 | 0.00 | 5 | 5 | 0.00 |
| Non-target species | Barnacle goose | Branta leucopsis | 13 | 11 | 15.38 | 5 | 5 | 0.00 |
| Non-target species | Greylag goose | Anser anser | 1,497 | 1,101 | 26.45 | 423 | 413 | 2.36 |
| Non-target species | Pink-footed goose | Anser brachyrhynchus | 63 | 63 | 0.00 | 555 | 554 | 0.18 |
| Non-target species | Wigeon | Mareca penelope | 1,146 | 1,015 | 11.43 | 3,366 | 1,538 | 54.31 |
| Non-target species | Mallard | Anas platyrhynchos | 72 | 28 | 61.11 | 104 | 55 | 47.12 |
| Non-target species | Teal | Anas crecca | 225 | 60 | 73.33 | 139 | 60 | 56.83 |
| Non-target species | Common scoter | Melanitta nigra | 4 | 4 | 0.00 | 0 | 0 | - |
| Non-target species | Goldeneye | Bucephala clangula | 11 | 9 | 18.18 | 14 | 0 | 100.00 |
| Non-target species | Oystercatcher | Haematopus ostralegus | 4 | 3 | 25.00 | 18 | 3 | 83.33 |
| Non-target species | Lapwing | Vanellus vanellus | 0 | 0 | - | 27 | 0 | 100.00 |
| Non-target species | Golden plover | Pluvialis apricaria | 0 | 0 | - | 367 | 0 | 100.00 |
| Non-target species | Ringed plover | Charadrius hiaticula | 0 | 0 | - | 6 | 0 | 100.00 |
| Non-target species | Curlew | Numenius aquata | 155 | 114 | 26.45 | 630 | 220 | 65.08 |
| Non-target species | Bar-tailed godwit | Limosa lapponica | 0 | 0 | - | 3 | 0 | 100.00 |
| Non-target species | Dunlin | Calidris alpina | 0 | 0 | - | 302 | 0 | 100.00 |
| Non-target species | Purple sandpiper | Calidris maritima | 0 | 0 | - | 13 | 0 | 100.00 |
| Non-target species | Redshank | Tringa totanus | 23 | 10 | 56.52 | 52 | 34 | 34.62 |
| Non-target species | Kittiwake | Rissa tridactyla | 15 | 15 | 0.00 | 1 | 0 | 100.00 |
| Non-target species | Black-headed gull | Chroicocephalus ridibundus | 7 | 5 | 28.57 | 185 | 25 | 86.49 |
| Non-target species | Common gull | Larus canus | 201 | 158 | 21.39 | 428 | 141 | 67.06 |
| Non-target species | Great black-backed gull | Larus marinus | 102 | 84 | 17.65 | 62 | 46 | 25.81 |
| Non-target species | Glaucous gull | Larus hyperboreus | 0 | 0 | - | 1 | 1 | 0.00 |
| Non-target species | Herring gull | Larus argentatus | 370 | 287 | 22.43 | 2,214 | 1,934 | 12.65 |
| Non-target species | Little auk | Alle alle | 4 | 4 | 0.00 | 5 | 5 | 0.00 |
| Non-target species | Guillemot | Uria aalge | 287 | 287 | 0.00 | 69 | 63 | 8.70 |
| Non-target species | Razorbill | Alca torda | 35 | 33 | 5.71 | 22 | 21 | 4.55 |
| Non-target species | Black guillemot | Cepphus grylle | 390 | 375 | 3.85 | 406 | 386 | 4.93 |
| Non-target species | Fulmar | Fulmarus glacialis | 708 | 647 | 8.62 | 386 | 325 | 15.80 |
| Non-target species | Cormorant | Phalacrocorax carbo | 0 | 0 | - | 2 | 2 | 0.00 |
| Non-target species | Grey heron | Ardea cinerea | 12 | 5 | 58.33 | 11 | 3 | 72.73 |
| Non-target species | Total | Total | 7,027 | 5,943 | 18.56 | 11,441 | 7,351 | 44.13 |
The total number of birds for which a species level identification could not be made, for both DAS, are presented in Table 7.
| Date | Species Group (Unidentified birds) | Scapa Flow SPA Untrimmed | Scapa Flow SPA Trimmed to SPA boundary | Scapa Flow SPA % Diff | North Orkney SPA Untrimmed | North Orkney SPA Trimmed to SPA boundary | North Orkney SPA % Diff |
|---|---|---|---|---|---|---|---|
| 21 February 2022 Survey | Duck species | 95 | 18 | 81.05 | 18 | 6 | 66.67 |
| 21 February 2022 Survey | Wader species | 0 | 0 | 0.00 | 51 | 1 | 98.04 |
| 21 February 2022 Survey | Small gull species | 3 | 0 | 100.00 | 19 | 4 | 78.95 |
| 21 February 2022 Survey | Black-backed gull species | 1 | 1 | 0.00 | 0 | 0 | 0.00 |
| 21 February 2022 Survey | Large gull species | 1 | 1 | 0.00 | 2 | 1 | 50.00 |
| 21 February 2022 Survey | Gull species | 5 | 3 | 40.00 | 3 | 3 | 0.00 |
| 21 February 2022 Survey | Large auk | 8 | 7 | 12.50 | 0 | 0 | 0.00 |
| 21 February 2022 Survey | Auk species | 14 | 11 | 21.43 | 10 | 9 | 10.00 |
| 21 February 2022 Survey | Auk / small gull | 4 | 3 | 25.00 | 2 | 2 | 0.00 |
| 21 February 2022 Survey | Diver species | 3 | 3 | 0.00 | 7 | 6 | 14.29 |
| 21 February 2022 Survey | Fulmar / gull species | 3 | 2 | 33.33 | 8 | 5 | 37.50 |
| 21 February 2022 Survey | Total | 137 | 49 | 64.23 | 120 | 37 | 69.17 |
| 20 January 2023 Survey | Goose species | 2 | 2 | 0.00 | 0 | - | - |
| 20 January 2023 Survey | Duck species | 67 | 48 | 28.36 | 132 | 89 | 32.58 |
| 20 January 2023 Survey | Wader species | 81 | 72 | 11.11 | 325 | 29 | 91.08 |
| 20 January 2023 Survey | Small gull species | 7 | 4 | 42.86 | 15 | 10 | 33.33 |
| 20 January 2023 Survey | Large gull species | 6 | 5 | 16.67 | 6 | 6 | 0.00 |
| 20 January 2023 Survey | Gull species | 52 | 41 | 21.15 | 175 | 25 | 85.71 |
| 20 January 2023 Survey | Large auk | 52 | 51 | 1.92 | 19 | 18 | 5.26 |
| 20 January 2023 Survey | Auk species | 79 | 76 | 3.80 | 78 | 72 | 7.69 |
| 20 January 2023 Survey | Auk / small gull | 5 | 5 | 0.00 | 0 | - | - |
| 20 January 2023 Survey | Large auk / diver species | 1 | 1 | 0.00 | 0 | - | - |
| 20 January 2023 Survey | Diver species | 7 | 7 | 0.00 | 7 | 7 | 0.00 |
| 20 January 2023 Survey | Fulmar / gull species | 20 | 17 | 15.00 | 17 | 14 | 17.65 |
| Total | 433 | 329 | 24.02 | 774 | 270 | 65.12 |
The behaviours of target species recorded within the marine SPA boundaries are presented in Table 8 for both surveys. In general, very low proportions of birds were recorded flying through the SPA, with the exception of European shag with up to 25 % of birds observed flying during the February 2022 survey in North Orkney SPA.
| Date | Species | Scapa Flow SPA - Flying | Scapa Flow SPA - Sitting | Scapa Flow SPA - % Flying | North Orkney SPA - Flying | North Orkney SPA - Sitting | North Orkney SPA – % Flying |
|---|---|---|---|---|---|---|---|
| 21 February 2022 Survey | Great northern diver | 0 | 64 | 0 | 0 | 19 | 0 |
| 21 February 2022 Survey | Black-throated diver | 0 | 3 | 0 | 0 | 1 | 0 |
| 21 February 2022 Survey | Slavonian grebe | 0 | 18 | 0 | 0 | 9 | 0 |
| 21 February 2022 Survey | Red-breasted merganser | 0 | 19 | 0 | 0 | 51 | 0 |
| 21 February 2022 Survey | Velvet scoter | N/A | N/A | N/A | N/A | N/A | N/A |
| 21 February 2022 Survey | Long-tailed duck | 2 | 334 | 0.60 | 21 | 353 | 5.61 |
| 21 February 2022 Survey | Common eider | 2 | 137 | 1.44 | 2 | 199 | 1.00 |
| 21 February 2022 Survey | European shag | 5 | 27 | 15.63 | 9 | 27 | 25.00 |
| 20 January 2023 | Great northern diver | 1 | 219 | 0.46 | 1 | 44 | 2.27 |
| 20 January 2023 | Black-throated diver | 0 | 7 | 0.00 | N/A | N/A | N/A |
| 20 January 2023 | Slavonian grebe | 0 | 24 | 0.00 | 0 | 22 | 0.00 |
| 20 January 2023 | Red-breasted merganser | 1 | 79 | 1.27 | 1 | 66 | 1.52 |
| 20 January 2023 | Velvet scoter | N/A | N/A | N/A | N/A | N/A | N/A |
| 20 January 2023 | Long-tailed duck | 0 | 757 | 0.00 | 6 | 511 | 1.17 |
| 20 January 2023 | Common eider | 4 | 345 | 1.16 | 4 | 539 | 0.74 |
| 20 January 2023 | European shag | 7 | 162 | 4.38 | 19 | 297 | 6.46 |
Digital aerial survey population estimates (strip transect analysis)
The design-based density and population estimates of all species and species groups within the Scapa Flow SPA, calculated via strip transect analysis following the DAS, are presented in Tables 9 to 11 for target species and Tables 12 to 14 for all species groups. Estimates are for within the marine SPA boundary only and do not include birds roosting outside of this area. Estimates are presented for three scenarios: all birds within the SPA (flying and non-flying); records excluding flying birds, and flying birds only.
| Date | Species | Density estimate (n/km²) | Population estimate (number) | Lower 95 % confidence limit of population (number) | Upper 95 % confidence limit of population (number) | Standard deviation of population estimate (number) | CV |
|---|---|---|---|---|---|---|---|
| 21 February 2022 | Great northern diver | 0.83 | 263 | 174 | 369 | 52 | 0.20 |
| 21 February 2022 | Black-throated diver | 0.04 | 13 | 0 | 32 | 9 | 0.71 |
| 21 February 2022 | Slavonian grebe | 0.23 | 73 | 29 | 123 | 24 | 0.32 |
| 21 February 2022 | Red-breasted merganser | 0.25 | 79 | 25 | 157 | 34 | 0.43 |
| 21 February 2022 | Long-tailed duck | 4.34 | 1,381 | 719 | 2,160 | 370 | 0.27 |
| 21 February 2022 | Common eider | 1.82 | 581 | 263 | 961 | 179 | 0.31 |
| 21 February 2022 | European shag | 0.41 | 130 | 58 | 227 | 44 | 0.34 |
| 20 January 2023 | Great northern diver | 2.78 | 919 | 572 | 1,310 | 189 | 0.21 |
| 20 January 2023 | Black-throated diver | 0.09 | 30 | 0 | 84 | 26 | 0.86 |
| 20 January 2023 | Slavonian grebe | 0.30 | 100 | 50 | 159 | 28 | 0.28 |
| 20 January 2023 | Red-breasted merganser | 1.00 | 330 | 147 | 569 | 109 | 0.33 |
| 20 January 2023 | Long-tailed duck | 9.53 | 3,149 | 625 | 7,559 | 2,025 | 0.64 |
| 20 January 2023 | Common eider | 4.41 | 1,456 | 454 | 2,938 | 677 | 0.46 |
| 20 January 2023 | European shag | 2.31 | 764 | 253 | 1,416 | 305 | 0.40 |
| Date | Species | Density estimate (n/km²) | Population estimate (number) | Lower 95 % confidence limit of population (number) | Upper 95 % confidence limit of population (number) | Standard deviation of population estimate (number) | CV |
|---|---|---|---|---|---|---|---|
| 21 February 2022 | Great northern diver | 0.82 | 263 | 166 | 365 | 52 | 0.20 |
| 21 February 2022 | Black-throated diver | 0.04 | 12 | 0 | 32 | 9 | 0.71 |
| 21 February 2022 | Slavonian grebe | 0.23 | 74 | 33 | 123 | 24 | 0.31 |
| 21 February 2022 | Red-breasted merganser | 0.25 | 79 | 25 | 146 | 32 | 0.40 |
| 21 February 2022 | Long-tailed duck | 4.37 | 1,391 | 729 | 2,117 | 376 | 0.27 |
| 21 February 2022 | Common eider | 1.78 | 566 | 249 | 937 | 179 | 0.32 |
| 21 February 2022 | European shag | 0.35 | 113 | 40 | 211 | 46 | 0.41 |
| 20 January 2023 | Great northern diver | 2.75 | 908 | 551 | 1,321 | 202 | 0.22 |
| 20 January 2023 | Black-throated diver | 0.08 | 29 | 0 | 84 | 25 | 0.87 |
| 20 January 2023 | Slavonian grebe | 0.31 | 102 | 52 | 162 | 28 | 0.27 |
| 20 January 2023 | Red-breasted merganser | 1.01 | 336 | 150 | 572 | 107 | 0.32 |
| 20 January 2023 | Long-tailed duck | 9.55 | 3,155 | 621 | 8,621 | 2,087 | 0.66. |
| 20 January 2023 | Common eider | 4.46 | 1,475 | 512 | 2,984 | 666 | 0.45 |
| 20 January 2023 | European shag | 2.07 | 684 | 209 | 1,257 | 268 | 0.39 |
| Date | Species | Density estimate (n/km²) | Population estimate (number) | Lower 95 % confidence limit of population (number) | Upper 95 % confidence limit of population (number) | Standard deviation of population estimate (number) | CV |
|---|---|---|---|---|---|---|---|
| 21 February 2022 | Long-tailed duck | 0.03 | 9 | 0 | 21 | 6 | 0.64 |
| 21 February 2022 | Common eider | 0.03 | 9 | 0 | 25 | 9 | 0.96 |
| 21 February 2022 | European shag | 0.07 | 21 | 4 | 41 | 10 | 0.45 |
| 20 January 2023 | Great northern diver | 0.01 | 5 | 0 | 13 | 4 | 0.95 |
| 20 January 2023 | Red-breasted merganser | 0.01 | 5 | 0 | 13 | 5 | 0.97 |
| 20 January 2023 | Common eider | 0.05 | 17 | 0 | 50 | 17 | 0.96 |
| 20 January 2023 | European shag | 0.09 | 29 | 0 | 66 | 17 | 0.56 |
| Date | Species group | Density estimate (n/km²) | Population estimate (number) | Lower 95 % confidence limit of population (number) | Upper 95 % confidence limit of population (number) | Standard deviation of population estimate (number) | CV |
|---|---|---|---|---|---|---|---|
| 21 February 2022 | Goose species | 0.78 | 250 | 52 | 490 | 116 | 0.47 |
| 21 February 2022 | Duck species | 9.94 | 3,165 | 1,386 | 5,843 | 1,154 | 0.36 |
| 21 February 2022 | Grebe species | 0.23 | 73 | 33 | 120 | 23 | 0.31 |
| 21 February 2022 | Wader species | 1.71 | 546 | 8 | 1,408 | 392 | 0.72 |
| 21 February 2022 | Small gull species | 4.34 | 1,383 | 405 | 2,916 | 639 | 0.46 |
| 21 February 2022 | Black-backed gull species | 0.14 | 46 | 13 | 85 | 19 | 0.41 |
| 21 February 2022 | Large gull species | 0.85 | 271 | 187 | 377 | 51 | 0.19 |
| 21 February 2022 | Gull species | 0.77 | 246 | 49 | 570 | 139 | 0.56 |
| 21 February 2022 | Large auk | 1.01 | 322 | 236 | 409 | 46 | 0.14 |
| 21 February 2022 | Auk species | 0.9 | 286 | 166 | 420 | 68 | 0.24 |
| 21 February 2022 | Auk / small gull | 0.05 | 17 | 0 | 37 | 10 | 0.60 |
| 21 February 2022 | Diver species | 0.94 | 300 | 212 | 409 | 52 | 0.17 |
| 21 February 2022 | Fulmar / gull species | 4.74 | 1,511 | 1,047 | 1,955 | 227 | 0.15 |
| 21 February 2022 | Cormorant / shag | 0.46 | 146 | 69 | 241 | 46 | 0.31 |
| 20 January 2023 | Goose species | 15.17 | 5,013 | 1,198 | 10,585 | 2,531 | 0.50 |
| 20 January 2023 | Duck species | 30.14 | 9,957 | 3,270 | 19,423 | 4,266 | 0.42 |
| 20 January 2023 | Grebe species | 0.30 | 99 | 50 | 163 | 29 | 0.29 |
| 20 January 2023 | Wader species | 2.51 | 830 | 199 | 1,804 | 418 | 0.50 |
| 20 January 2023 | Small gull species | 1.72 | 570 | 180 | 1,142 | 260 | 0.46 |
| 20 January 2023 | Large gull species | 4.62 | 1,527 | 780 | 2,585 | 471 | 0.31 |
| 20 January 2023 | Gull species | 1.18 | 389 | 154 | 671 | 134 | 0.34 |
| 20 January 2023 | Large auk | 4.48 | 1,481 | 930 | 2,035 | 288 | 0.19 |
| 20 January 2023 | Auk species | 5.89 | 1,947 | 1,458 | 2,448 | 257 | 0.13 |
| 20 January 2023 | Auk / small gull | 0.08 | 25 | 8 | 45 | 10 | 0.39 |
| 20 January 2023 | Large auk / diver species | 0.03 | 9 | 0 | 21 | 7 | 0.70 |
| 20 January 2023 | Diver species | 2.98 | 985 | 628 | 1,394 | 196 | 0.20 |
| 20 January 2023 | Fulmar / gull species | 8.55 | 2,826 | 1,959 | 3,771 | 476 | 0.17 |
| 20 January 2023 | Cormorant / shag | 2.31 | 762 | 268 | 1,415 | 303 | 0.40 |
| 20 January 2023 | Heron species | 0.06 | 21 | 5 | 44 | 11 | 0.51 |
| Date | Species group | Density estimate (n/km²) | Population estimate (number) | Lower 95 % confidence limit of population (number) | Upper 95 % confidence limit of population (number) | Standard deviation of population estimate (number) | CV |
|---|---|---|---|---|---|---|---|
| 21 February 2022 | Goose species | 0.03 | 9 | 0 | 25 | 8 | 0.98 |
| 21 February 2022 | Duck species | 9.47 | 3,015 | 1,261 | 5,544 | 1,187 | 0.39 |
| 21 February 2022 | Grebe species | 0.23 | 74 | 33 | 123 | 23 | 0.31 |
| 21 February 2022 | Small gull species | 2.63 | 839 | 36 | 2,235 | 594 | 0.71 |
| 21 February 2022 | Black-backed gull species | 0.06 | 21 | 0 | 49 | 13 | 0.62 |
| 21 February 2022 | Large gull species | 0.48 | 152 | 78 | 241 | 43 | 0.28 |
| 21 February 2022 | Gull species | 0.61 | 193 | 25 | 465 | 130 | 0.67 |
| 21 February 2022 | Large auk | 1 | 318 | 231 | 405 | 45 | 0.14 |
| 21 February 2022 | Auk species | 0.87 | 277 | 155 | 427 | 68 | 0.25 |
| 21 February 2022 | Auk / small gull | 0.05 | 17 | 0 | 37 | 10 | 0.60 |
| 21 February 2022 | Diver species | 0.96 | 307 | 202 | 432 | 58 | 0.19 |
| 21 February 2022 | Fulmar / gull species | 2.39 | 763 | 482 | 1,126 | 160 | 0.21 |
| 21 February 2022 | Cormorant / shag | 0.38 | 121 | 49 | 221 | 43 | 0.35 |
| 20 January 2023 | Goose species | 1.77 | 586 | 47 | 1,368 | 334 | 0.57 |
| 20 January 2023 | Duck species | 17.05 | 5,634 | 2,211 | 10,797 | 2,299 | 0.41 |
| 20 January 2023 | Grebe species | 0.30 | 101 | 54 | 160 | 28 | 0.27 |
| 20 January 2023 | Wader species | 0.13 | 44 | 0 | 134 | 40 | 0.91 |
| 20 January 2023 | Small gull species | 0.93 | 307 | 50 | 703 | 172 | 0.56 |
| 20 January 2023 | Large gull species | 2.13 | 703 | 335 | 1,217 | 233 | 0.33 |
| 20 January 2023 | Gull species | 0.70 | 231 | 75 | 434 | 93 | 0.40 |
| 20 January 2023 | Large auk | 4.34 | 1,435 | 898 | 2,002 | 283 | 0.20 |
| 20 January 2023 | Auk species | 5.89 | 1,946 | 1,488 | 2,459 | 251 | 0.13 |
| 20 January 2023 | Auk / small gull | 0.07 | 25 | 8 | 46 | 10 | 0.39 |
| 20 January 2023 | Large auk / diver species | 0.03 | 9 | 0 | 21 | 6 | 0.71 |
| 20 January 2023 | Diver species | 2.98 | 984 | 612 | 1,365 | 196 | 0.20 |
| 20 January 2023 | Fulmar / gull species | 4.94 | 1,632 | 890 | 2,477 | 413 | 0.25 |
| 20 January 2023 | Cormorant / shag | 2.09 | 689 | 214 | 1,307 | 286 | 0.41 |
| 20 January 2023 | Heron species | 0.01 | 5 | 0 | 13 | 5 | 1.05 |
| Date | Species group | Density estimate (n/km²) | Population estimate (number) | Lower 95 % confidence limit of population (number) | Upper 95 % confidence limit of population (number) | Standard deviation of population estimate (number) | CV |
|---|---|---|---|---|---|---|---|
| 21 February 2022 | Goose species | 0.76 | 243 | 49 | 516 | 122 | 0.50 |
| 21 February 2022 | Duck species | 0.59 | 190 | 9 | 522 | 156 | 0.82 |
| 21 February 2022 | Wader species | 1.72 | 550 | 8 | 1,502 | 395 | 0.72 |
| 21 February 2022 | Small gull species | 1.76 | 561 | 196 | 1,026 | 210 | 0.37 |
| 21 February 2022 | Black-backed gull species | 0.05 | 17 | 0 | 37 | 10 | 0.56 |
| 21 February 2022 | Large gull species | 0.37 | 119 | 73 | 167 | 25 | 0.20 |
| 21 February 2022 | Gull species | 0.06 | 21 | 4 | 41 | 10 | 0.48 |
| 21 February 2022 | Large auk | 0.01 | 4 | 0 | 13 | 4 | 0.97 |
| 21 February 2022 | Auk species | 0.03 | 9 | 0 | 20 | 6 | 0.62 |
| 21 February 2022 | Fulmar / gull species | 2.35 | 748 | 495 | 1,030 | 141 | 0.19 |
| 21 February 2022 | Cormorant / shag | 0.06 | 21 | 4 | 41 | 11 | 0.49 |
| 20 January 2023 | Goose species | 13.04 | 4,307 | 693 | 9,867 | 2,454 | 0.57 |
| 20 January 2023 | Duck species | 11.10 | 3,666 | 262 | 10,287 | 2,870 | 0.78 |
| 20 January 2023 | Wader species | 0.49 | 163 | 49 | 361 | 83 | 0.51 |
| 20 January 2023 | Small gull species | 0.55 | 181 | 91 | 292 | 52 | 0.29 |
| 20 January 2023 | Large gull species | 1.45 | 481 | 233 | 830 | 153 | 0.32 |
| 20 January 2023 | Gull species | 0.08 | 26 | 9 | 46 | 10 | 0.38 |
| 20 January 2023 | Large auk | 0.12 | 41 | 0 | 100 | 27 | 0.65 |
| 20 January 2023 | Auk species | 0.01 | 5 | 0 | 13 | 4 | 0.98 |
| 20 January 2023 | Diver species | 0.01 | 5 | 0 | 13 | 4 | 0.95 |
| 20 January 2023 | Fulmar / gull species | 3.36 | 1,111 | 699 | 1,626 | 236 | 0.21 |
| 20 January 2023 | Cormorant / shag | 0.09 | 29 | 0 | 66 | 17 | 0.56 |
The density and population estimates of all species and species groups within the North Orkney SPA, calculated via strip transect analysis following the DAS, are presented in Tables 15 to 17 for the target species and Tables 18 to 20 for all species groups. Estimates are for within the marine SPA boundary only and do not include birds roosting outside of this area. Estimates are presented for three scenarios: all birds within the SPA (flying and non-flying); records excluding flying birds, and flying birds only.
| Date | Species | Density estimate (n/km²) | Population estimate (number) | Lower 95 % confidence limit of population (number) | Upper 95 % confidence limit of population (number) | Standard deviation of population estimate (number) | CV |
|---|---|---|---|---|---|---|---|
| 21 February 2022 | Great northern diver | 0.37 | 79 | 30 | 140 | 29 | 0.37 |
| 21 February 2022 | Black-throated diver | 0.02 | 5 | 0 | 13 | 4 | 0.98 |
| 21 February 2022 | Slavonian grebe | 0.18 | 38 | 13 | 66 | 14 | 0.36 |
| 21 February 2022 | Red-breasted merganser | 1.01 | 214 | 37 | 506 | 127 | 0.59 |
| 21 February 2022 | Long-tailed duck | 7.41 | 1,570 | 554 | 3,170 | 684 | 0.44 |
| 21 February 2022 | Common eider | 3.96 | 840 | 328 | 1,535 | 317 | 0.38 |
| 21 February 2022 | European shag | 0.71 | 150 | 79 | 239 | 42 | 0.28 |
| 20 January 2023 | Great northern diver | 0.84 | 191 | 105 | 300 | 51 | 0.26 |
| 20 January 2023 | Slavonian grebe | 0.41 | 94 | 24 | 206 | 52 | 0.55 |
| 20 January 2023 | Red-breasted merganser | 1.25 | 284 | 68 | 663 | 159 | 0.56 |
| 20 January 2023 | Long-tailed duck | 9.62 | 2,190 | 1,051 | 3,331 | 576 | 0.26 |
| 20 January 2023 | Common eider | 9.95 | 2,266 | 285 | 5,842 | 1,586 | 0.70 |
| 20 January 2023 | European shag | 5.91 | 1,345 | 432 | 2,562 | 541 | 0.40 |
| Date | Species | Density estimate (n/km²) | Population estimate (number) | Lower 95 % confidence limit of population (number) | Upper 95 % confidence limit of population (number) | Standard deviation of population estimate (number) | CV |
|---|---|---|---|---|---|---|---|
| 21 February 2022 | Great northern diver | 0.38 | 81 | 37 | 143 | 29 | 0.35 |
| 21 February 2022 | Black-throated diver | 0.02 | 5 | 0 | 13 | 5 | 0.97 |
| 21 February 2022 | Slavonian grebe | 0.18 | 38 | 16 | 66 | 14 | 0.35 |
| 21 February 2022 | Red-breasted merganser | 1.02 | 217 | 34 | 537 | 137 | 0.63 |
| 21 February 2022 | Long-tailed duck | 7.01 | 1,486 | 540 | 2,911 | 629 | 0.42 |
| 21 February 2022 | Common eider | 3.95 | 837 | 307 | 1,481 | 310 | 0.37 |
| 21 February 2022 | European shag | 0.54 | 115 | 50 | 192 | 36 | 0.31 |
| 20 January 2023 | Great northern diver | 0.81 | 186 | 104 | 299 | 51 | 0.27 |
| 20 January 2023 | Slavonian grebe | 0.41 | 93 | 23 | 208 | 51 | 0.55 |
| 20 January 2023 | Red-breasted merganser | 1.23 | 281 | 62 | 673 | 168 | 0.60 |
| 20 January 2023 | Long-tailed duck | 9.31 | 2,119 | 1,038 | 3,205 | 576 | 0.27 |
| 20 January 2023 | Common eider | 10.06 | 2,291 | 254 | 5,782 | 1,578 | 0.69 |
| 20 January 2023 | European shag | 5.61 | 1,276 | 433 | 2,375 | 507 | 0.40 |
| Dae | Species | Density estimate (n/km²) | Population estimate (number) | Lower 95 % confidence limit of population (number) | Upper 95 % confidence limit of population (number) | Standard deviation of population estimate (number) | CV |
|---|---|---|---|---|---|---|---|
| 21 February 2022 | Long-tailed duck | 0.41 | 88 | 0 | 254 | 80 | 0.91 |
| 21 February 2022 | Common eider | 0.04 | 9 | 0 | 26 | 9 | 0.94 |
| 21 February 2022 | European shag | 0.18 | 38 | 9 | 80 | 19 | 0.50 |
| 20 January 2023 | Great northern diver | 0.02 | 5 | 0 | 13 | 5 | 0.97 |
| 20 January 2023 | Red-breasted merganser | 0.02 | 5 | 0 | 13 | 5 | 0.94 |
| 20 January 2023 | Long-tailed duck | 0.11 | 26 | 5 | 54 | 14 | 0.51 |
| 20 January 2023 | Common eider | 0.08 | 18 | 0 | 48 | 13 | 0.75 |
| 20 January 2023 | European shag | 0.37 | 84 | 17 | 186 | 46 | 0.55 |
| Date | Species group | Density estimate (n/km²) | Population estimate (number) | Lower 95 % confidence limit of population (number) | Upper 95 % confidence limit of population (number) | Standard deviation of population estimate (number) | CV |
|---|---|---|---|---|---|---|---|
| 21 February 2022 | Goose species | 10.54 | 2,233 | 474 | 4,657 | 1,089 | 0.49 |
| 21 February 2022 | Duck species | 20.99 | 4,449 | 2,400 | 7,317 | 12,51 | 0.28 |
| 21 February 2022 | Grebe species | 0.18 | 38 | 13 | 67 | 14 | 0.36 |
| 21 February 2022 | Wader species | 3.14 | 666 | 54 | 1,512 | 382 | 0.57 |
| 21 February 2022 | Small gull species | 5.21 | 1,104 | 403 | 2,099 | 454 | 0.41 |
| 21 February 2022 | Black-backed gull species | 0.24 | 51 | 17 | 90 | 19 | 0.37 |
| 21 February 2022 | Large gull species | 0.91 | 193 | 103 | 296 | 50 | 0.26 |
| 21 February 2022 | Gull species | 0.29 | 63 | 24 | 116 | 24 | 0.38 |
| 21 February 2022 | Large auk | 0.34 | 72 | 37 | 112 | 20 | 0.27 |
| 21 February 2022 | Auk species | 1.72 | 365 | 234 | 510 | 70 | 0.19 |
| 21 February 2022 | Auk / small gull | 0.04 | 9 | 0 | 21 | 6 | 0.70 |
| 21 February 2022 | Diver species | 0.54 | 116 | 57 | 184 | 33 | 0.28 |
| 21 February 2022 | Fulmar / gull species | 5.49 | 1,165 | 653 | 1,828 | 305 | 0.26 |
| 21 February 2022 | Cormorant / shag | 0.78 | 166 | 89 | 250 | 43 | 0.25 |
| 20 January 2023 | Goose species | 17.90 | 4,075 | 165 | 10,117 | 2,705 | 0.66 |
| 20 January 2023 | Duck species | 52.73 | 12,002 | 4,934 | 20,713 | 3,986 | 0.33 |
| 20 January 2023 | Grebe species | 0.42 | 96 | 24 | 212 | 52 | 0.55 |
| 20 January 2023 | Wader species | 5.40 | 1,229 | 240 | 2,457 | 576 | 0.47 |
| 20 January 2023 | Small gull species | 3.04 | 692 | 399 | 1,103 | 190 | 0.27 |
| 20 January 2023 | Large gull species | 35.5 | 8,080 | 672 | 22,448 | 6,172 | 0.76 |
| 20 January 2023 | Gull species | 0.98 | 223 | 112 | 355 | 63 | 0.28 |
| 20 January 2023 | Large auk | 1.64 | 375 | 274 | 484 | 55 | 0.15 |
| 20 January 2023 | Auk species | 8.79 | 2,002 | 1,713 | 2,279 | 145 | 0.07 |
| 20 January 2023 | Auk / small gull | 0.02 | 5 | 0 | 12 | 4 | 0.84 |
| 20 January 2023 | Diver species | 1.04 | 237 | 140 | 361 | 56 | 0.24 |
| 20 January 2023 | Fulmar / gull species | 6.50 | 1,481 | 737 | 2,519 | 458 | 0.31 |
| 20 January 2023 | Cormorant / shag | 5.95 | 1,356 | 475 | 2,684 | 564 | 0.42 |
| 20 January 2023 | Heron species | 0.05 | 13 | 0 | 34 | 10 | 0.74 |
| Date | Species group | Density estimate (n/km²) | Population estimate (number) | Lower 95 % confidence limit of population (number) | Upper 95 % confidence limit of population (number) | Standard deviation of population estimate (number) | CV |
|---|---|---|---|---|---|---|---|
| 21 February 2022 | Duck species | 14.21 | 3,011 | 1,651 | 4,715 | 799 | 0.27 |
| 21 February 2022 | Grebe species | 0.18 | 38 | 16 | 63 | 13 | 0.34 |
| 21 February 2022 | Small gull species | 1.46 | 309 | 67 | 675 | 163 | 0.52 |
| 21 February 2022 | Black-backed gull species | 0.08 | 17 | 0 | 41 | 11 | 0.60 |
| 21 February 2022 | Large gull species | 0.25 | 54 | 21 | 102 | 21 | 0.38 |
| 21 February 2022 | Gull species | 0.17 | 37 | 9 | 79 | 19 | 0.51 |
| 21 February 2022 | Large auk | 0.32 | 67 | 34 | 104 | 18 | 0.26 |
| 21 February 2022 | Auk species | 1.6 | 339 | 212 | 480 | 70 | 0.20 |
| 21 February 2022 | Auk / small gull | 0.04 | 9 | 0 | 21 | 7 | 0.70 |
| 21 February 2022 | Diver species | 0.53 | 113 | 57 | 187 | 33 | 0.29 |
| 21 February 2022 | Fulmar / gull species | 3.21 | 680 | 333 | 1,144 | 219 | 0.32 |
| 21 February 2022 | Cormorant / shag | 0.53 | 113 | 50 | 192 | 37 | 0.33 |
| 20 January 2023 | Goose species | 0.30 | 68 | 0 | 195 | 63 | 0.91 |
| 20 January 2023 | Duck species | 41.30 | 9,402 | 3,183 | 18,093 | 3,713 | 0.39 |
| 20 January 2023 | Grebe species | 0.42 | 96 | 22 | 219 | 54 | 0.56 |
| 20 January 2023 | Small gull species | 0.82 | 187 | 77 | 329 | 65 | 0.35 |
| 20 January 2023 | Large gull species | 33.53 | 7,634 | 252 | 21,306 | 6,061 | 0.79 |
| 20 January 2023 | Gull species | 0.51 | 117 | 51 | 192 | 36 | 0.30 |
| 20 January 2023 | Large auk | 1.35 | 308 | 188 | 442 | 67 | 0.22 |
| 20 January 2023 | Auk species | 8.69 | 1,978 | 1,682 | 2,258 | 146 | 0.07 |
| 20 January 2023 | Auk / small gull | 0.02 | 5 | 0 | 13 | 4 | 0.85 |
| 20 January 2023 | Diver species | 1.03 | 235 | 138 | 351 | 56 | 0.24 |
| 20 January 2023 | Fulmar / gull species | 4.62 | 1,051 | 366 | 1,971 | 430 | 0.41 |
| 20 January 2023 | Cormorant / shag | 5.58 | 1,272 | 395 | 2,412 | 525 | 0.41 |
| Date | Species group | Density estimate (n/km²) | Population estimate (number) | Lower 95 % confidence limit of population (number) | Upper 95 % confidence limit of population (number) | Standard deviation of population estimate (number) | CV |
|---|---|---|---|---|---|---|---|
| 21 February 2022 | Goose species | 10.71 | 2,269 | 518 | 4,521 | 1,058 | 0.47 |
| 21 February 2022 | Duck species | 6.58 | 1,394 | 201 | 3,165 | 755 | 0.54 |
| 21 February 2022 | Wader species | 3.13 | 665 | 46 | 1,511 | 380 | 0.57 |
| 21 February 2022 | Small gull species | 3.77 | 799 | 304 | 1,467 | 314 | 0.39 |
| 21 February 2022 | Black-backed gull species | 0.16 | 34 | 13 | 64 | 14 | 0.41 |
| 21 February 2022 | Large gull species | 0.63 | 134 | 66 | 214 | 38 | 0.28 |
| 21 February 2022 | Gull species | 0.12 | 25 | 8 | 47 | 11 | 0.43 |
| 21 February 2022 | Large auk | 0.02 | 5 | 0 | 13 | 4 | 0.92 |
| 21 February 2022 | Auk species | 0.14 | 30 | 5 | 55 | 14 | 0.45 |
| 21 February 2022 | Fulmar / gull species | 2.3 | 488 | 299 | 696 | 101 | 0.21 |
| 21 February 2022 | Cormorant / shag | 0.24 | 52 | 21 | 95 | 20 | 0.37 |
| 20 January 2023 | Goose species | 17.98 | 4,093 | 163 | 10,594 | 2,883 | 0.70 |
| 20 January 2023 | Duck species | 11.13 | 2,535 | 467 | 5,458 | 1,314 | 0.52 |
| 20 January 2023 | Wader species | 5.24 | 1,192 | 214 | 2,452 | 580 | 0.49 |
| 20 January 2023 | Small gull species | 1.37 | 311 | 182 | 456 | 69 | 0.22 |
| 20 January 2023 | Large gull species | 2.53 | 575 | 199 | 1,112 | 248 | 0.43 |
| 20 January 2023 | Gull species | 0.13 | 30 | 4 | 63 | 16 | 0.53 |
| 20 January 2023 | Large auk | 0.30 | 70 | 5 | 149 | 38 | 0.54 |
| 20 January 2023 | Auk species | 0.09 | 22 | 4 | 47 | 12 | 0.54 |
| 20 January 2023 | Diver species | 0.02 | 5 | 0 | 13 | 5 | 0.92 |
| 20 January 2023 | Fulmar / gull species | 1.66 | 377 | 239 | 545 | 77 | 0.20 |
| 20 January 2023 | Cormorant / shag | 0.35 | 80 | 17 | 187 | 45 | 0.56 |
The density and population estimates of all non-target species within the Scapa Flow SPA and North Orkney SPA, calculated via strip transect analysis following the DAS are presented in Table A. 1 to Table A. 12 in the Appendix. Estimates are presented for three scenarios: all birds within the SPA (flying and non-flying); records excluding flying birds, and flying birds only.
| Target species/ Non-target species | Species | Density estimate (n/km²) | Population estimate (number) | Lower 95 % confidence limit of population (number) | Upper 95 % confidence limit of population (number) | Standard deviation of population estimate (number) | CV |
|---|---|---|---|---|---|---|---|
| Target species | Great northern diver | 0.83 | 263 | 174 | 369 | 52 | 0.20 |
| Target species | Black-throated diver | 0.04 | 13 | 0 | 32 | 9 | 0.71 |
| Target species | Slavonian grebe | 0.23 | 73 | 29 | 123 | 24 | 0.32 |
| Target species | Red-breasted merganser | 0.25 | 79 | 25 | 157 | 34 | 0.43 |
| Target species | Long-tailed duck | 4.34 | 1,381 | 719 | 2,160 | 370 | 0.27 |
| Target species | Common eider | 1.82 | 581 | 263 | 961 | 179 | 0.31 |
| Target species | European shag | 0.41 | 130 | 58 | 227 | 44 | 0.34 |
| Target species | Red-throated diver | 0.04 | 13 | 0 | 28 | 7 | 0.54 |
| Non-target species | Barnacle goose | 0.01 | 5 | 0 | 16 | 5 | 0.98 |
| Non-target species | Greylag goose | 0.75 | 240 | 56 | 494 | 115 | 0.48 |
| Non-target species | Wigeon | 3.15 | 1,004 | 8 | 3,039 | 811 | 0.81 |
| Non-target species | Teal | 0.12 | 38 | 0 | 140 | 39 | 1.02 |
| Non-target species | Common scoter | 0.04 | 13 | 0 | 45 | 13 | 1.03 |
| Non-target species | Goldeneye | 0.05 | 17 | 0 | 50 | 17 | 0.98 |
| Non-target species | Oystercatcher | 0.09 | 29 | 0 | 82 | 26 | 0.90 |
| Non-target species | Lapwing | 1.53 | 487 | 0 | 1,414 | 383 | 0.79 |
| Non-target species | Curlew | 0.03 | 9 | 0 | 25 | 8 | 0.96 |
| Non-target species | Redshank | 0.04 | 13 | 0 | 37 | 13 | 0.98 |
| Non-target species | Kittiwake | 0.13 | 41 | 12 | 86 | 20 | 0.48 |
| Non-target species | Black-headed gull | 0.57 | 182 | 39 | 371 | 86 | 0.47 |
| Non-target species | Common gull | 4.32 | 1,377 | 324 | 2,991 | 702 | 0.51 |
| Non-target species | Great black- backed gull | 0.46 | 146 | 93 | 207 | 30 | 0.20 |
| Non-target species | Iceland gull | 0.01 | 5 | 0 | 13 | 4 | 0.89 |
| Non-target species | Herring gull | 0.70 | 224 | 128 | 334 | 54 | 0.24 |
| Non-target species | Little auk | 0.04 | 13 | 0 | 36 | 10 | 0.77 |
| Non-target species | Guillemot | 0.76 | 242 | 171 | 313 | 37 | 0.15 |
| Non-target species | Razorbill | 0.33 | 104 | 33 | 196 | 41 | 0.39 |
| Non-target species | Black guillemot | 0.58 | 184 | 112 | 263 | 40 | 0.21 |
| Non-target species | White-billed diver | 0.01 | 4 | 0 | 13 | 4 | 1.02 |
| Non-target species | Fulmar | 4.69 | 1,495 | 1,056 | 1,941 | 224 | 0.15 |
| Non-target species | Cormorant | 0.04 | 13 | 0 | 29 | 7 | 0.56 |
| Target species/ Non-target species | Species | Density estimate (n/km²) | Population estimate (number) | Lower 95 % confidence limit of population (number) | Upper 95 % confidence limit of population (number) | Standard deviation of population estimate (number) | CV |
|---|---|---|---|---|---|---|---|
| Target species | Great northern diver | 2.78 | 919 | 572 | 1,310 | 189 | 0.21 |
| Target species | Black-throated diver | 0.09 | 30 | 0 | 84 | 26 | 0.86 |
| Target species | Slavonian grebe | 0.30 | 100 | 50 | 159 | 28 | 0.28 |
| Target species | Red-breasted merganser | 1.00 | 330 | 147 | 569 | 109 | 0.33 |
| Target species | Long-tailed duck | 9.53 | 3,149 | 625 | 7,559 | 2,025 | 0.64 |
| Target species | Common eider | 4.41 | 1,456 | 454 | 2,938 | 677 | 0.46 |
| Target species | European shag | 2.31 | 764 | 253 | 1,416 | 305 | 0.40 |
| Non-target species | Barnacle goose | 0.14 | 47 | 0 | 147 | 41 | 0.88 |
| Non-target species | Greylag goose | 13.94 | 4,606 | 967 | 10,342 | 2,468 | 0.54 |
| Non-target species | Pink-footed goose | 0.80 | 266 | 0 | 653 | 189 | 0.71 |
| Non-target species | Wigeon | 13.05 | 4,312 | 382 | 10,915 | 3,224 | 0.75 |
| Non-target species | Mallard | 0.34 | 113 | 5 | 299 | 82 | 0.72 |
| Non-target species | Teal | 0.80 | 264 | 0 | 829 | 222 | 0.84 |
| Non-target species | Common scoter | 0.05 | 17 | 0 | 50 | 17 | 1.03 |
| Non-target species | Goldeneye | 0.11 | 38 | 0 | 108 | 34 | 0.88 |
| Non-target species | Oystercatcher | 0.04 | 13 | 0 | 29 | 7 | 0.53 |
| Non-target species | Curlew | 1.41 | 466 | 119 | 1,007 | 230 | 0.49 |
| Non-target species | Redshank | 0.13 | 42 | 0 | 124 | 38 | 0.90 |
| Non-target species | Kittiwake | 0.19 | 63 | 25 | 106 | 21 | 0.32 |
| Non-target species | Black-headed gull | 0.06 | 21 | 5 | 41 | 10 | 0.47 |
| Non-target species | Common gull | 1.97 | 653 | 254 | 1,230 | 260 | 0.40 |
| Non-target species | Great black-backed gull | 1.06 | 350 | 194 | 565 | 96 | 0.27 |
| Non-target species | Herring gull | 3.57 | 1,181 | 567 | 1,998 | 372 | 0.31 |
| Non-target species | Little auk | 0.05 | 17 | 4 | 34 | 8 | 0.47 |
| Non-target species | Guillemot | 3.61 | 1,193 | 694 | 1,689 | 262 | 0.22 |
| Non-target species | Razorbill | 0.42 | 138 | 66 | 221 | 42 | 0.30 |
| Non-target species | Black guillemot | 4.71 | 1,556 | 1,173 | 2,040 | 217 | 0.14 |
| Non-target species | Red-throated diver | 0.03 | 9 | 0 | 21 | 6 | 0.61 |
| Non-target species | Black-throated diver | 0.09 | 30 | 0 | 84 | 26 | 0.86 |
| Non-target species | Fulmar | 8.18 | 2,702 | 1,883 | 3,655 | 457 | 0.17 |
| Non-target species | Grey heron | 0.06 | 21 | 5 | 46 | 11 | 0.52 |
| Target species/ Non-target species | Species | Density estimate (n/km²) | Population estimate (number) | Lower 95 % confidence limit of population (number) | Upper 95 % confidence limit of population (number) | Standard deviation of population estimate (number) | CV |
|---|---|---|---|---|---|---|---|
| Target species | Great northern diver | 0.82 | 263 | 166 | 365 | 52 | 0.20 |
| Target species | Black-throated diver | 0.04 | 12 | 0 | 32 | 9 | 0.71 |
| Target species | Slavonian grebe | 0.23 | 74 | 33 | 123 | 24 | 0.31 |
| Target species | Red-breasted merganser | 0.25 | 79 | 25 | 146 | 32 | 0.40 |
| Target species | Long-tailed duck | 4.37 | 1,391 | 729 | 2,117 | 376 | 0.27 |
| Target species | Common eider | 1.78 | 566 | 249 | 937 | 179 | 0.32 |
| Target species | European shag | 0.35 | 113 | 40 | 211 | 46 | 0.41 |
| Target species | Red-throated diver | 0.04 | 13 | 0 | 27 | 7 | 0.54 |
| Non-target species | Greylag goose | 0.02 | 8 | 0 | 25 | 8 | 1.00 |
| Non-target species | Wigeon | 2.65 | 845 | 8 | 2,385 | 761 | 0.90 |
| Non-target species | Teal | 0.12 | 38 | 0 | 111 | 38 | 1.01 |
| Non-target species | Common scoter | 0.04 | 13 | 0 | 37 | 13 | 0.96 |
| Non-target species | Goldeneye | 0.05 | 17 | 0 | 50 | 17 | 1.01 |
| Non-target species | Kittiwake | 0.01 | 5 | 0 | 16 | 5 | 0.98 |
| Non-target species | Common gull | 3.04 | 970 | 80 | 2,562 | 672 | 0.69 |
| Non-target species | Great black-backed gull | 0.28 | 90 | 44 | 149 | 27 | 0.29 |
| Non-target species | Herring gull | 0.37 | 118 | 48 | 202 | 42 | 0.35 |
| Non-target species | Little auk | 0.04 | 13 | 0 | 37 | 10 | 0.77 |
| Non-target species | Guillemot | 0.74 | 237 | 169 | 305 | 36 | 0.15 |
| Non-target species | Razorbill | 0.31 | 100 | 32 | 183 | 39 | 0.39 |
| Non-target species | Black guillemot | 0.54 | 173 | 101 | 260 | 42 | 0.24 |
| Non-target species | White-billed diver | 0.01 | 5 | 0 | 16 | 5 | 1.02 |
| Non-target species | Fulmar | 2.38 | 758 | 462 | 1,063 | 153 | 0.20 |
| Non-target species | Cormorant | 0.04 | 12 | 0 | 28 | 7 | 0.56 |
| Target species/ Non-target species | Species | Density estimate (n/km²) | Population estimate (number) | Lower 95 % confidence limit of population (number) | Upper 95 % confidence limit of population (number) | Standard deviation of population estimate (number) | CV |
|---|---|---|---|---|---|---|---|
| Target species | Great northern diver | 2.75 | 908 | 551 | 1,321 | 202 | 0.22 |
| Target species | Black-throated diver | 0.08 | 29 | 0 | 84 | 25 | 0.87 |
| Target species | Slavonian grebe | 0.31 | 102 | 52 | 162 | 28 | 0.27 |
| Target species | Red-breasted merganser | 1.01 | 336 | 150 | 572 | 107 | 0.32 |
| Target species | Long-tailed duck | 9.55 | 3,155 | 621 | 8,621 | 2,087 | 0.66 |
| Target species | Common eider | 4.46 | 1,475 | 512 | 2,984 | 666 | 0.45 |
| Target species | European shag | 2.07 | 684 | 209 | 1,257 | 268 | 0.39 |
| Target species | Red-throated diver | 0.03 | 9 | 0 | 21 | 6 | 0.65 |
| Non-target species | Barnacle goose | 1.61 | 533 | 48 | 1,192 | 318 | 0.60 |
| Non-target species | Greylag goose | 0.16 | 52 | 0 | 162 | 52 | 1.00 |
| Non-target species | Pink-footed goose | 1.40 | 462 | 33 | 1,200 | 347 | 0.75 |
| Non-target species | Wigeon | 0.02 | 8 | 0 | 25 | 9 | 1.02 |
| Non-target species | Mallard | 0.01 | 5 | 0 | 13 | 5 | 1.00 |
| Non-target species | Teal | 1.61 | 533 | 48 | 1,192 | 318 | 0.60 |
| Non-target species | Common scoter | 0.05 | 17 | 0 | 63 | 18 | 1.04 |
| Non-target species | Goldeneye | 0.11 | 37 | 0 | 104 | 32 | 0.86 |
| Non-target species | Redshank | 0.13 | 43 | 0 | 124 | 39 | 0.90 |
| Non-target species | Kittiwake | 0.01 | 5 | 0 | 13 | 4 | 0.94 |
| Non-target species | Black-headed gull | 0.01 | 5 | 0 | 16 | 5 | 1.05 |
| Non-target species | Common gull | 1.28 | 423 | 125 | 786 | 178 | 0.42 |
| Non-target species | Great black-backed gull | 0.54 | 180 | 106 | 263 | 42 | 0.23 |
| Non-target species | Herring gull | 1.62 | 535 | 221 | 961 | 199 | 0.37 |
| Non-target species | Little auk | 0.05 | 17 | 4 | 32 | 8 | 0.46 |
| Non-target species | Guillemot | 3.54 | 1,171 | 708 | 1,711 | 257 | 0.22 |
| Non-target species | Razorbill | 0.38 | 126 | 53 | 203 | 39 | 0.30 |
| Non-target species | Black guillemot | 4.72 | 1,561 | 1,145 | 2,062 | 231 | 0.15 |
| Non-target species | Fulmar | 4.62 | 1,528 | 797 | 2,455 | 422 | 0.28 |
| Non-target species | Grey heron | 0.01 | 5 | 0 | 13 | 5 | 0.95 |
| Target species/ Non-target species | Species | Density estimate (n/km²) | Population estimate (number) | Lower 95 % confidence limit of population (number) | Upper 95 % confidence limit of population (number) | Standard deviation of population estimate (number) | CV |
|---|---|---|---|---|---|---|---|
| Target species | Long-tailed duck | 0.03 | 9 | 0 | 21 | 6 | 0.64 |
| Target species | Common eider | 0.03 | 9 | 0 | 25 | 9 | 0.96 |
| Target species | European shag | 0.07 | 21 | 4 | 41 | 10 | 0.45 |
| Non-target species | Barnacle goose | 0.01 | 5 | 0 | 13 | 5 | 1.02 |
| Non-target species | Greylag goose | 0.73 | 234 | 47 | 486 | 120 | 0.51 |
| Non-target species | Wigeon | 0.58 | 187 | 0 | 600 | 161 | 0.86 |
| Non-target species | Oystercatcher | 0.09 | 30 | 0 | 82 | 25 | 0.86 |
| Non-target species | Lapwing | 1.6 | 509 | 0 | 1,456 | 387 | 0.76 |
| Non-target species | Curlew | 0.03 | 9 | 0 | 25 | 8 | 0.96 |
| Non-target species | Kittiwake | 0.12 | 37 | 5 | 82 | 20 | 0.54 |
| Non-target species | Black-headed gull | 0.52 | 167 | 24 | 332 | 81 | 0.48 |
| Non-target species | Common gull | 1.09 | 347 | 119 | 629 | 133 | 0.38 |
| Non-target species | Great black-backed gull | 0.14 | 45 | 23 | 70 | 13 | 0.28 |
| Non-target species | Iceland gull | 0.01 | 5 | 0 | 13 | 4 | 0.97 |
| Non-target species | Herring gull | 0.32 | 102 | 61 | 148 | 23 | 0.22 |
| Non-target species | Razorbill | 0.01 | 5 | 0 | 13 | 4 | 0.92 |
| Non-target species | Black guillemot | 0.03 | 9 | 0 | 20 | 6 | 0.58 |
| Non-target species | Fulmar | 2.34 | 746 | 490 | 1,066 | 146 | 0.20 |
| Target species/ Non-target species | Species | Density estimate (n/km²) | Population estimate (number) | Lower 95 % confidence limit of population (number) | Upper 95 % confidence limit of population (number) | Standard deviation of population estimate (number) | CV |
|---|---|---|---|---|---|---|---|
| Target species | Great northern diver | 0.01 | 5 | 0 | 13 | 4 | 0.95 |
| Target species | Red-breasted merganser | 0.01 | 5 | 0 | 13 | 5 | 0.98 |
| Target species | Common eider | 0.05 | 17 | 0 | 50 | 17 | 0.96 |
| Target species | European shag | 0.09 | 29 | 0 | 66 | 17 | 0.56 |
| Non-target species | Barnacle goose | 0.14 | 46 | 0 | 125 | 38 | 0.81 |
| Non-target species | Greylag goose | 12.48 | 4,124 | 573 | 10,311 | 2,571 | 0.62 |
| Non-target species | Pink-footed goose | 0.38 | 125 | 0 | 468 | 128 | 1.03 |
| Non-target species | Wigeon | 9.82 | 3,245 | 217 | 10,631 | 2,844 | 0.88 |
| Non-target species | Mallard | 0.33 | 110 | 0 | 301 | 86 | 0.79 |
| Non-target species | Teal | 0.78 | 258 | 0 | 793 | 215 | 0.83 |
| Non-target species | Oystercatcher | 0.04 | 13 | 0 | 28 | 7 | 0.51 |
| Non-target species | Curlew | 0.45 | 150 | 37 | 330 | 83 | 0.55 |
| Non-target species | Kittiwake | 0.18 | 59 | 28 | 95 | 18 | 0.30 |
| Non-target species | Black-headed gull | 0.05 | 17 | 4 | 36 | 9 | 0.52 |
| Non-target species | Common gull | 0.37 | 124 | 50 | 213 | 43 | 0.34 |
| Non-target species | Great black-backed gull | 0.35 | 118 | 46 | 215 | 45 | 0.38 |
| Non-target species | Herring gull | 1.08 | 356 | 172 | 605 | 113 | 0.32 |
| Non-target species | Guillemot | 0.09 | 29 | 0 | 67 | 19 | 0.65 |
| Non-target species | Razorbill | 0.04 | 13 | 0 | 38 | 13 | 0.95 |
| Non-target species | Black guillemot | 0.01 | 5 | 0 | 16 | 5 | 1.02 |
| Non-target species | Fulmar | 0.01 | 5 | 0 | 13 | 4 | 0.95 |
| Non-target species | Grey heron | 3.39 | 1,120 | 703 | 1,617 | 237 | 0.21 |
| Target species/ Non-target species | Species | Density estimate (n/km²) | Population estimate (number) | Lower 95 % confidence limit of population (number) | Upper 95 % confidence limit of population (number) | Standard deviation of population estimate (number) | CV |
|---|---|---|---|---|---|---|---|
| Target species | Great northern diver | 0.37 | 79 | 30 | 140 | 29 | 0.37 |
| Target species | Black-throated diver | 0.02 | 5 | 0 | 13 | 4 | 0.98 |
| Target species | Slavonian grebe | 0.18 | 38 | 13 | 66 | 14 | 0.36 |
| Target species | Red-breasted merganser | 1.01 | 214 | 37 | 506 | 127 | 0.59 |
| Target species | Long-tailed duck | 7.41 | 1,570 | 554 | 3,170 | 684 | 0.44 |
| Target species | Common eider | 3.96 | 840 | 328 | 1,535 | 317 | 0.38 |
| Target species | European shag | 0.71 | 150 | 79 | 239 | 42 | 0.28 |
| Target species | Red-throated diver | 0.02 | 4 | 0 | 13 | 5 | 1.03 |
| Non-target species | Greylag goose | 10.38 | 2,199 | 475 | 4,692 | 1,107 | 0.50 |
| Non-target species | Pink-footed goose | 0.26 | 56 | 0 | 152 | 45 | 0.80 |
| Non-target species | Wigeon | 8.21 | 1,740 | 208 | 3,674 | 882 | 0.51 |
| Non-target species | Mallard | 0.27 | 58 | 0 | 153 | 43 | 0.73 |
| Non-target species | Common scoter | 0.04 | 9 | 0 | 25 | 9 | 0.94 |
| Non-target species | Lapwing | 0.77 | 163 | 0 | 486 | 158 | 0.97 |
| Non-target species | Curlew | 2.28 | 484 | 0 | 1,193 | 332 | 0.69 |
| Non-target species | Bar-tailed godwit | 0.04 | 9 | 0 | 26 | 9 | 0.98 |
| Non-target species | Redshank | 0.06 | 13 | 0 | 33 | 10 | 0.73 |
| Non-target species | Kittiwake | 0.21 | 46 | 9 | 97 | 24 | 0.52 |
| Non-target species | Black-headed gull | 0.33 | 70 | 16 | 144 | 33 | 0.47 |
| Non-target species | Common gull | 4.65 | 986 | 338 | 1,978 | 436 | 0.44 |
| Non-target species | Great black-backed gull | 0.46 | 98 | 42 | 170 | 34 | 0.34 |
| Non-target species | Herring gull | 0.82 | 175 | 93 | 267 | 46 | 0.26 |
| Non-target species | Little auk | 0.06 | 13 | 0 | 37 | 10 | 0.74 |
| Non-target species | Guillemot | 0.32 | 67 | 30 | 113 | 21 | 0.31 |
| Non-target species | Razorbill | 0.14 | 29 | 5 | 62 | 16 | 0.54 |
| Non-target species | Black guillemot | 1.38 | 292 | 191 | 410 | 56 | 0.19 |
| Non-target species | Fulmar | 5.48 | 1,162 | 624 | 1,818 | 301 | 0.26 |
| Non-target species | Cormorant | 0.06 | 13 | 0 | 29 | 7 | 0.55 |
| Target species/ Non-target species | Species | Density estimate (n/km²) | Population estimate (number) | Lower 95 % confidence limit of population (number) | Upper 95 % confidence limit of population (number) | Standard deviation of population estimate (number) | CV |
|---|---|---|---|---|---|---|---|
| Target species | Great northern diver | 0.84 | 191 | 105 | 300 | 51 | 0.26 |
| Target species | Slavonian grebe | 0.41 | 94 | 24 | 206 | 52 | 0.55 |
| Target species | Red-breasted merganser | 1.25 | 284 | 68 | 663 | 159 | 0.56 |
| Target species | Long-tailed duck | 9.62 | 2,190 | 1,051 | 3,331 | 576 | 0.26 |
| Target species | Common eider | 9.95 | 2,266 | 285 | 5,842 | 1,586 | 0.70 |
| Target species | European shag | 5.91 | 1,345 | 432 | 2,562 | 541 | 0.40 |
| Target species | Red-throated diver | 0.09 | 22 | 0 | 49 | 13 | 0.60 |
| Non-target species | Barnacle goose | 0.09 | 21 | 0 | 64 | 22 | 1.05 |
| Non-target species | Greylag goose | 7.30 | 1,661 | 135 | 4,607 | 1,338 | 0.81 |
| Non-target species | Pink-footed goose | 10.21 | 2,325 | 0 | 6,933 | 2,236 | 0.96 |
| Non-target species | Wigeon | 28.99 | 6,599 | 1,395 | 15,906 | 3,830 | 0.58 |
| Non-target species | Mallard | 1.02 | 232 | 71 | 440 | 98 | 0.42 |
| Non-target species | Teal | 1.11 | 253 | 58 | 527 | 119 | 0.47 |
| Non-target species | Oystercatcher | 0.05 | 13 | 0 | 39 | 13 | 1.03 |
| Non-target species | Curlew | 4.05 | 923 | 58 | 2,084 | 512 | 0.55 |
| Non-target species | Redshank | 0.66 | 151 | 0 | 472 | 135 | 0.89 |
| Non-target species | Black-headed gull | 0.47 | 108 | 13 | 253 | 66 | 0.61 |
| Non-target species | Common gull | 2.67 | 608 | 278 | 1,041 | 202 | 0.33 |
| Non-target species | Great black-backed gull | 0.86 | 195 | 128 | 277 | 40 | 0.20 |
| Non-target species | Glaucous gull | 0.02 | 5 | 0 | 13 | 4 | 0.83 |
| Non-target species | Herring gull | 34.73 | 7,905 | 523 | 22,218 | 5,999 | 0.76 |
| Non-target species | Little auk | 0.09 | 21 | 5 | 38 | 9 | 0.41 |
| Non-target species | Guillemot | 1.16 | 265 | 176 | 350 | 45 | 0.17 |
| Non-target species | Razorbill | 0.39 | 90 | 17 | 209 | 52 | 0.57 |
| Non-target species | Black guillemot | 7.16 | 1,629 | 1,364 | 1,911 | 142 | 0.09 |
| Non-target species | Fulmar | 6.10 | 1,389 | 632 | 2,438 | 472 | 0.34 |
| Non-target species | Cormorant | 0.04 | 9 | 0 | 22 | 7 | 0.73 |
| Non-target species | Grey heron | 0.05 | 13 | 0 | 37 | 10 | 0.78 |
| Target species/ Non-target species | Species | Density estimate (n/km²) | Population estimate (number) | Lower 95 % confidence limit of population (number) | Upper 95 % confidence limit of population (number) | Standard deviation of population estimate (number) | CV |
|---|---|---|---|---|---|---|---|
| Target species | Great northern diver | 0.38 | 81 | 37 | 143 | 29 | 0.35 |
| Target species | Black-throated diver | 0.02 | 5 | 0 | 13 | 5 | 0.97 |
| Target species | Slavonian grebe | 0.18 | 38 | 16 | 66 | 14 | 0.35 |
| Target species | Red-breasted merganser | 1.02 | 217 | 34 | 537 | 137 | 0.63 |
| Target species | Long-tailed duck | 7.01 | 1,486 | 540 | 2,911 | 629 | 0.42 |
| Target species | Common eider | 3.95 | 837 | 307 | 1,481 | 310 | 0.37 |
| Target species | European shag | 0.54 | 115 | 50 | 192 | 36 | 0.31 |
| Target species | Red-throated diver | 0.02 | 5 | 0 | 13 | 4 | 0.95 |
| Non-target species | Wigeon | 2.11 | 448 | 0 | 1,327 | 436 | 0.97 |
| Non-target species | Mallard | 0.16 | 35 | 0 | 96 | 26 | 0.72 |
| Non-target species | Common scoter | 0.04 | 9 | 0 | 25 | 8 | 0.96 |
| Non-target species | Kittiwake | 0.14 | 29 | 0 | 74 | 21 | 0.69 |
| Non-target species | Common gull | 1.34 | 284 | 67 | 638 | 153 | 0.54 |
| Non-target species | Great black-backed gull | 0.14 | 30 | 4 | 74 | 19 | 0.62 |
| Non-target species | Herring gull | 0.28 | 59 | 30 | 92 | 16 | 0.27 |
| Non-target species | Little auk | 0.06 | 13 | 0 | 33 | 9 | 0.70 |
| Non-target species | Guillemot | 0.29 | 62 | 29 | 104 | 20 | 0.31 |
| Non-target species | Razorbill | 0.14 | 31 | 5 | 67 | 16 | 0.53 |
| Non-target species | Black guillemot | 1.23 | 262 | 172 | 363 | 50 | 0.19 |
| Non-target species | Fulmar | 3.1 | 656 | 295 | 1,119 | 213 | 0.32 |
| Target species/ Non-target species | Species | Density estimate (n/km²) | Population estimate (number) | Lower 95 % confidence limit of population (number) | Upper 95 % confidence limit of population (number) | Standard deviation of population estimate (number) | CV |
|---|---|---|---|---|---|---|---|
| Target species | Great northern diver | 0.81 | 186 | 104 | 299 | 51 | 0.27 |
| Target species | Slavonian grebe | 0.41 | 93 | 23 | 208 | 51 | 0.55 |
| Target species | Red-breasted merganser | 1.23 | 281 | 62 | 673 | 168 | 0.60 |
| Target species | Long-tailed duck | 9.31 | 2,119 | 1,038 | 3,205 | 576 | 0.27 |
| Target species | Common eider | 10.06 | 2,291 | 254 | 5,782 | 1,578 | 0.69 |
| Target species | European shag | 5.61 | 1,276 | 433 | 2,375 | 507 | 0.40 |
| Target species | Red-throated diver | 0.09 | 22 | 0 | 52 | 14 | 0.62 |
| Non-target species | Greylag goose | 0.29 | 66 | 0 | 198 | 62 | 0.94 |
| Non-target species | Wigeon | 17.35 | 3,949 | 253 | 10,637 | 3,218 | 0.81 |
| Non-target species | Mallard | 0.56 | 129 | 15 | 281 | 70 | 0.54 |
| Non-target species | Teal | 0.70 | 160 | 0 | 404 | 106 | 0.66 |
| Non-target species | Black-headed gull | 0.05 | 13 | 0 | 29 | 8 | 0.59 |
| Non-target species | Common gull | 0.73 | 167 | 66 | 310 | 65 | 0.39 |
| Non-target species | Great black-backed gull | 0.56 | 129 | 64 | 200 | 35 | 0.27 |
| Non-target species | Glaucous gull | 0.02 | 5 | 0 | 13 | 4 | 0.84 |
| Non-target species | Herring gull | 32.45 | 7,387 | 216 | 20,334 | 5,662 | 0.77 |
| Non-target species | Little auk | 0.09 | 22 | 9 | 42 | 9 | 0.42 |
| Non-target species | Guillemot | 0.87 | 197 | 135 | 265 | 33 | 0.17 |
| Non-target species | Razorbill | 0.39 | 90 | 17 | 199 | 50 | 0.55 |
| Non-target species | Black guillemot | 7.07 | 1,610 | 1,298 | 1,894 | 153 | 0.09 |
| Non-target species | Fulmar | 4.27 | 972 | 318 | 1,915 | 417 | 0.43 |
| Non-target species | Cormorant | 0.02 | 5 | 0 | 15 | 5 | 1.00 |
| Non-target species | Grey heron | 0.02 | 5 | 0 | 16 | 5 | 1.01 |
| Target species/ Non-target species | Species | Density estimate (n/km²) | Population estimate (number) | Lower 95 % confidence limit of population (number) | Upper 95 % confidence limit of population (number) | Standard deviation of population estimate (number) | CV |
|---|---|---|---|---|---|---|---|
| Target species | Common eider | 0.04 | 9 | 0 | 26 | 9 | 0.94 |
| Target species | Long-tailed duck | 0.41 | 88 | 0 | 254 | 80 | 0.91 |
| Target species | European shag | 0.18 | 38 | 9 | 80 | 19 | 0.50 |
| Non-target species | Greylag goose | 10.32 | 2,187 | 492 | 4,707 | 1,108 | 0.51 |
| Non-target species | Pink-footed goose | 0.26 | 56 | 0 | 159 | 47 | 0.84 |
| Non-target species | Wigeon | 6.03 | 1,279 | 130 | 2,986 | 733 | 0.57 |
| Non-target species | Mallard | 0.1 | 21 | 0 | 63 | 21 | 1.02 |
| Non-target species | Lapwing | 0.77 | 164 | 0 | 487 | 157 | 0.95 |
| Non-target species | Curlew | 2.28 | 485 | 0 | 1,259 | 343 | 0.71 |
| Non-target species | Bar-tailed godwit | 0.04 | 9 | 0 | 33 | 9 | 1.00 |
| Non-target species | Redshank | 0.02 | 5 | 0 | 13 | 5 | 1.00 |
| Non-target species | Kittiwake | 0.08 | 17 | 5 | 33 | 8 | 0.44 |
| Non-target species | Black-headed gull | 0.33 | 71 | 17 | 146 | 34 | 0.47 |
| Non-target species | Common gull | 3.42 | 724 | 245 | 1,385 | 297 | 0.41 |
| Non-target species | Great black-backed gull | 0.32 | 67 | 28 | 117 | 24 | 0.36 |
| Non-target species | Herring gull | 0.53 | 112 | 54 | 180 | 33 | 0.29 |
| Non-target species | Guillemot | 0.02 | 5 | 0 | 13 | 5 | 0.99 |
| Non-target species | Black guillemot | 0.14 | 30 | 5 | 58 | 14 | 0.46 |
| Non-target species | Fulmar | 2.31 | 489 | 294 | 699 | 106 | 0.22 |
| Non-target species | Cormorant | 0.06 | 13 | 0 | 25 | 7 | 0.52 |
| Target species/ Non-target species | Species | Density estimate (n/km²) | Population estimate (number) | Lower 95 % confidence limit of population (number) | Upper 95 % confidence limit of population (number) | Standard deviation of population estimate (number) | CV |
|---|---|---|---|---|---|---|---|
| Target species | Great northern diver | 0.02 | 5 | 0 | 13 | 5 | 0.97 |
| Target species | Red-breasted merganser | 0.02 | 5 | 0 | 13 | 5 | 0.94 |
| Target species | Long-tailed duck | 0.11 | 26 | 5 | 54 | 14 | 0.51 |
| Target species | Common eider | 0.08 | 18 | 0 | 48 | 13 | 0.75 |
| Target species | European shag | 0.37 | 84 | 17 | 186 | 46 | 0.55 |
| Non-target species | Barnacle goose | 0.09 | 21 | 0 | 63 | 21 | 0.97 |
| Non-target species | Greylag goose | 7.31 | 1,665 | 133 | 5,547 | 1,434 | 0.86 |
| Non-target species | Pink-footed goose | 10.28 | 2,341 | 0 | 6,932 | 2,243 | 0.96 |
| Non-target species | Wigeon | 9.79 | 2,230 | 342 | 5,055 | 1,223 | 0.55 |
| Non-target species | Mallard | 0.42 | 95 | 0 | 263 | 69 | 0.73 |
| Non-target species | Teal | 0.39 | 89 | 0 | 220 | 61 | 0.69 |
| Non-target species | Oystercatcher | 0.06 | 13 | 0 | 38 | 14 | 1.01 |
| Non-target species | Curlew | 4.01 | 914 | 66 | 2,165 | 524 | 0.57 |
| Non-target species | Redshank | 0.62 | 142 | 0 | 407 | 128 | 0.90 |
| Non-target species | Black-headed gull | 0.41 | 93 | 13 | 223 | 59 | 0.63 |
| Non-target species | Common gull | 1.01 | 231 | 118 | 380 | 70 | 0.30 |
| Non-target species | Great black-backed gull | 0.15 | 34 | 12 | 62 | 13 | 0.38 |
| Non-target species | Herring gull | 2.37 | 539 | 165 | 1,078 | 244 | 0.45 |
| Non-target species | Guillemot | 0.29 | 67 | 5 | 145 | 38 | 0.57 |
| Non-target species | Black guillemot | 0.09 | 21 | 4 | 46 | 12 | 0.53 |
| Non-target species | Fulmar | 1.59 | 363 | 232 | 523 | 75 | 0.21 |
Digital aerial survey population estimates (Bayesian point processing)
Population estimates of the eight target species within the Scapa Flow SPA, calculated via Bayesian point processing of the DAS data, are presented in Table 21. Estimates are derived from all birds, both flying and sitting, within the SPA boundary only and do not include birds roosting outside of this area.
| Date | Species | Population estimate (Mean) | Lower 95 % credible limits of population | Upper 95 % credible limits of population | R2 | Root mean squared error | Deviance information criterion |
|---|---|---|---|---|---|---|---|
| 21 February 2022 Survey | Great Northern diver | 262 | 197 | 343 | 0.15 | 0.82 | 540.87 |
| 21 February 2022 Survey | Black-throated diver* | - | - | - | - | - | - |
| 21 February 2022 Survey | Slavonian grebe | 70 | 40 | 123 | 0.39 | 0.27 | 145.82 |
| 21 February 2022 Survey | Velvet scoter | N/A | N/A | N/A | N/A | N/A | N/A |
| 21 February 2022 Survey | Red-breasted merganser | 102 | 56 | 200 | 0.33 | 0.61 | 131.04 |
| 21 February 2022 Survey | Long-tailed duck | 1,502 | 1,279 | 1,792 | 0.49 | 6.10 | 1,995.07 |
| 21 February 2022 Survey | Common eider | 676 | 534 | 824 | 0.42 | 2.88 | 839.85 |
| 21 February 2022 Survey | European shag | 134 | 88 | 193 | 0.22 | 0.47 | 281.52 |
| 20 January 2023 Survey | Great Northern diver | 1,072 | 884 | 1,232 | 0.33 | 4.05 | 538.42 |
| 20 January 2023 Survey | Black-throated diver* | - | - | - | - | - | - |
| 20 January 2023 Survey | Slavonian grebe | 114 | 69 | 175 | 0.23 | 0.43 | 54.56 |
| 20 January 2023 Survey | Velvet scoter | N/A | N/A | N/A | N/A | N/A | N/A |
| 20 January 2023 Survey | Red-breasted merganser | 338 | 255 | 435 | 0.33 | 1.27 | 198.57 |
| 20 January 2023 Survey | Long-tailed duck | 3,678 | 3,321 | 4,343 | 0.17 | 20.16 | 4,218.97 |
| 20 January 2023 Survey | Common eider | 1,504 | 1,322 | 1,706 | 0.11 | 8.62 | 1,574.91 |
| 20 January 2023 Survey | European shag | 872 | 597 | 1,560 | 0.18 | 3.77 | 837.84 |
Population estimates of the eight target species within the North Orkney SPA, calculated via Bayesian point processing of the DAS data, are presented in Table 22. Estimates are derived from all birds, both flying and sitting, within the SPA boundary only and do not include birds roosting outside of this area.
| Date | Species | Population estimate (Mean) | Lower 95 % credible limits of population | Upper 95 % credible limits of population | R2 | Root mean squared error | Deviance information criterion |
|---|---|---|---|---|---|---|---|
| 21 February 2022 Survey | Great northern diver | 76 | 43 | 122 | 0.14 | 0.53 | 142.68 |
| 21 February 2022 Survey | Black-throated diver* | - | - | - | - | - | - |
| 21 February 2022 Survey | Slavonian grebe* | - | - | - | - | - | - |
| 21 February 2022 Survey | Velvet scoter* | - | - | - | - | - | - |
| 21 February 2022 Survey | Red-breasted merganser | 214 | 135 | 305 | 0.78 | 2.26 | 179.13 |
| 21 February 2022 Survey | Long-tailed duck | 1,915 | 1,668 | 2,734 | 0.73 | 14.79 | 1,636.94 |
| 21 February 2022 Survey | Common eider | 905 | 759 | 1,580 | 0.56 | 5.56 | 1,150.25 |
| 21 February 2022 Survey | European shag | 161 | 109 | 218 | 0.27 | 0.74 | 291.22 |
| 20 January 2023 Survey | Great northern diver | 208 | 145 | 282 | 0.30 | 0.91 | 110.55 |
| 20 January 2023 Survey | Black-throated diver* | - | - | - | - | - | - |
| 20 January 2023 Survey | Slavonian grebe | 103 | 61 | 163 | 0.36 | 0.72 | 0.53 |
| 20 January 2023 Survey | Velvet scoter* | - | - | - | - | - | - |
| 20 January 2023 Survey | Red-breasted merganser | 331 | 236 | 521 | 0.56 | 2.08 | 37.17 |
| 20 January 2023 Survey | Long-tailed duck | 2,428 | 2,199 | 2,654 | 0.38 | 11.03 | 2,307.24 |
| 20 January 2023 Survey | Common eider | 2,134 | 1,887 | 2,421 | 0.44 | 20.45 | 1,459.23 |
| 20 January 2023 Survey | European shag | 1,667 | 1,356 | 2,189 | 0.43 | 13.62 | 805.28 |
*Analysis not undertaken due to insufficient records (<10 birds)
Shore-based survey counts
Shore-based count totals are presented within each relevant species section. All surveys were conducted successfully, with the exception of sector 37 which could not be surveyed on 20 January 2023 due to access difficulties. Additionally in the 20 January 2023 survey, the shore-based counts at sectors 12 and 38 were conducted in suboptimal lighting conditions. Visibility during these surveys may have been hindered by the low sun and fading light, as a result of being conducted close to sunset (approximately 16:33), due to challenges in conducting all shore-based surveys on the same day in order to coincide with the DAS.
Species accounts – interpretation of maps
In the following species accounts for each of the two aerial surveys, maps are provided showing the locations of aerial observations of the species within the named SPA (e.g. Figure 8). In addition, where there were sufficient (10 or more) observations of a target species within an SPA, the following information generated through Bayesian point processing is presented in two figures:
- Maps (e.g. Figure 10) showing 1. the predicted mean densities of the species across the SPA and 2. the coefficient of variation (CV) in these estimates across the SPA. A lower CV indicates a more precise estimate.
- Maps (e.g. Figure 11) showing 1. the lower and 2. the upper credible density estimate limits across the SPA. The credible limits are a measure of uncertainty in the mean estimate. They define the range of the credible interval, within which 95 % of the estimated distribution of values fell, i.e. if the analysis was repeated, 95 % of the time the mean population estimate would fall within this range. The smaller this range the more confident we can be that the mean estimate is an accurate reflection of the true population size.
Additional maps summarise the shore-based observations in the relevant survey sectors for the named SPA (e.g. Figure 14). In these maps, observations are represented by circles of increasing size relating to the number of birds seen. The circle markers are also coloured by survey month.
Scapa Flow SPA
Great northern diver
A total of 66 great northern diver were recorded in the February 2022 DAS, with an additional three birds identified as ‘diver sp’ which could not be identified to species level (Table 5). A greater number of great northern diver were observed in January 2023, with a total of 221 great northern diver recorded and an additional seven birds identified as 'diver sp.' (Table 6). The distribution of great northern diver observations in the 2022 and 2023 surveys is illustrated in Figure 8 and Figure 9, respectively. Birds were widely distributed across the Scapa Flow SPA, including in the deeper waters of central Scapa Flow in both surveys.
Design-based strip transect analysis of the aerial survey data estimated the Scapa Flow SPA population at 263 birds (95 %CI 174 - 369) at the time of the February 2022 survey, and 919 birds (95 %CI 572 – 1,310) at the time of the January 2023 survey (Table 9), equating to a density of 0.83 birds/km2 and 2.78 birds/km2, respectively. This compares to an estimated 262 birds (95 % credible limits 197 – 343) in 2022 and 1,072 birds (95 % credible interval 884 – 1,232) in 2023 from Bayesian point processing (Table 21).
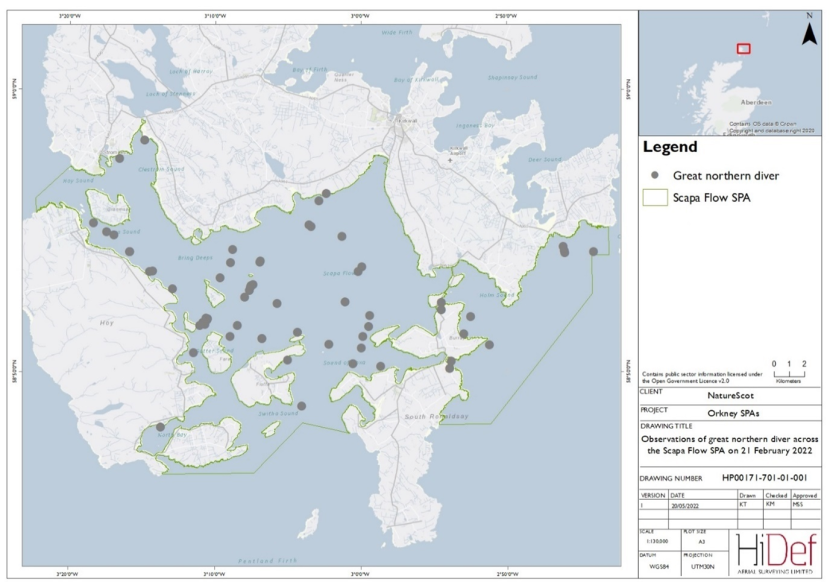
Figure 8. Aerial observations of great northern diver within the Scapa Flow SPA on 21 February 2022.
Click for a full description
Map of Scapa Flow Special Protection Area with circles marking the locations of great northern divers that were observed during the aerial survey of 21 February 2022. There are 66 observations marked, and they are widely distributed across the site, including in the deeper waters of central Scapa Flow.
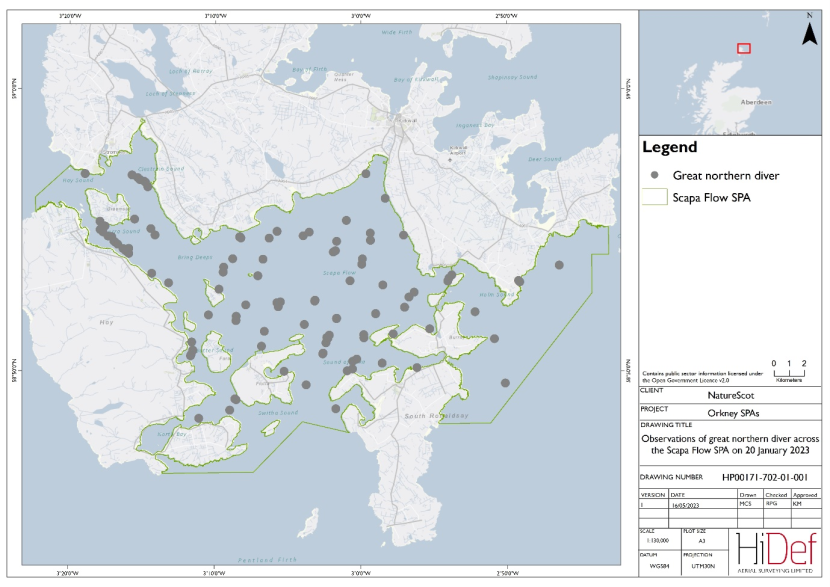
Figure 9. Aerial observations of great northern diver within the Scapa Flow SPA on 20 January 2023.
Click for a full description
Map of Scapa Flow Special Protected Area with circles marking the locations of great northern divers that were observed during the aerial survey of 20 January 2023. There are 220 observations marked, and they are generally widely distributed across the site, with small clusters in the Burra Sound.
The predicted mean densities of great northern diver across the Scapa Flow SPA generated through model-based Bayesian point processing are presented for the February 2022 and January 2023 surveys in Figure 10 and Figure 12 respectively, alongside the CV in these estimates. The lower and upper credible limits are mapped in Figure 11 and Figure 13 respectively.
During the February 2022 survey, the highest densities of 2 – 4.99 birds/km2 were recorded in the west of the SPA area, particularly between the islands of Cava and Fara; the areas directly surrounding this area show density estimates of 1 – 1.99 birds/km2, with the majority of the SPA having a density estimate of 0.5 - 0.99 birds/km2. The lowest density estimates of 0.2 – 0.49 birds/km2 occurred between Scapa Bay and St Mary’s (sub-area 3), to the east of Burray and to the south of Flotta.
During the January 2023 survey, the highest densities of 10 – 19.9 birds/km2 were observed across the central Scapa Flow, with lowest densities observed off to the east and south of the SPA. The rest of the SPA predominantly had estimated densities between 2 – 4.99 birds/km2.
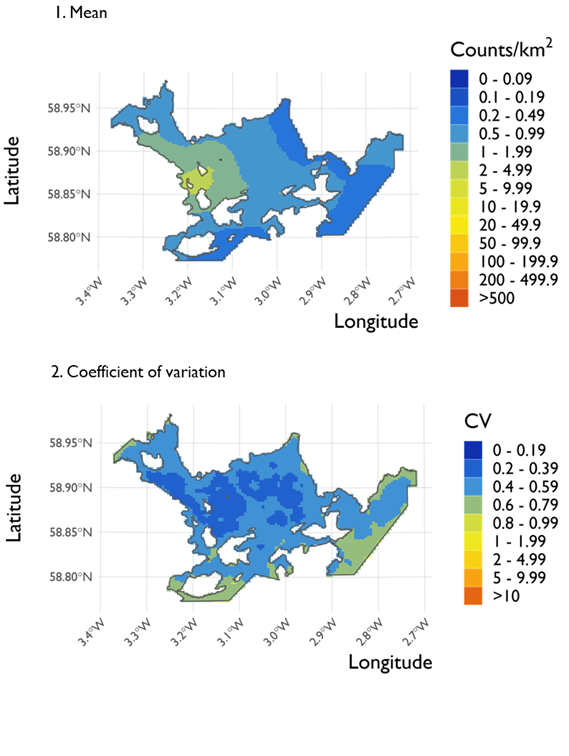
Figure 10. Two maps showing (1) the predicted density of great northern divers in the Scapa Flow SPA and (2) the coefficient of variation (CV) in these estimates across the SPA on 21 February 2022.
Click for a full description
Two maps of the Scapa Flow Special Protection Area organised vertically. Map 1 shows the predicted densities generated using Inlabru. The gradient used to indicate density estimates across the area goes from blue to green to yellow to red as values increase. The highest counts of 2 – 4.99 counts/km2 are recorded in the west of the Special Protection Area, creating a hot spot with a centre at approximately 58.85°N 3.2°W. The areas directly surrounding this hotspot show density estimates of 1 – 1.99 counts/km2, with the majority of the area having a density estimate of 0.5 – 0.99 counts/km2. The lowest density estimates of 0.2 – 0.49 counts/km2 occurred to the east of the Special Protection Area and at points along the northern and southern border of the site.
The second map uses the same colour gradient to show the coefficient of variation associated with the estimated counts. The highest levels of variation (0.6 – 0.79) are found scattered across the border of the Special Protection Area, with the largest area occurring at the south-east of the site. The majority of the site has less variation with values of 0.4 – 0.59, in addition to areas with values of 0.2 – 0.39, particularly within deeper waters in the centre of the site and through Hoy sound.
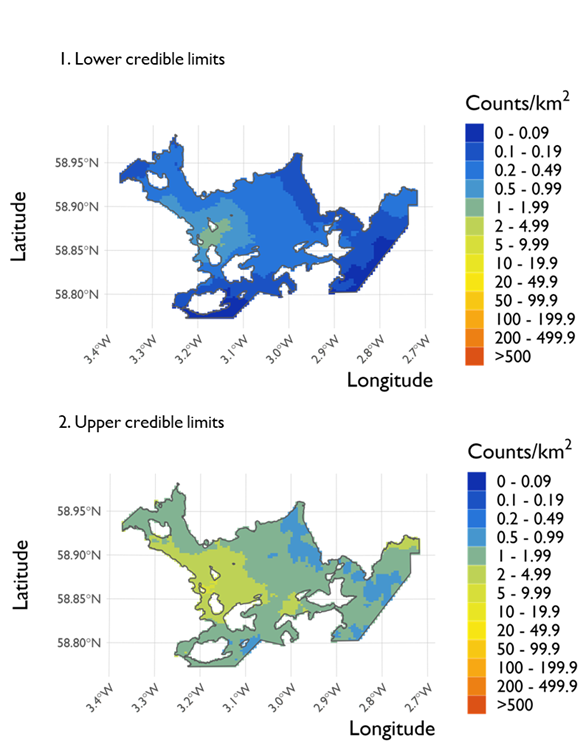
Figure 11. Two maps showing (1) the lower credible limits of density estimates for great northern divers at the Scapa Flow SPA and (2) the upper credible limits of these estimates across the SPA from the surveys conducted on 21 February 2022.
Click for a full description
Two maps of the Scapa Flow Special Protection Area organised vertically. The map 1 shows the lower credible limits of predicted densities generated using Inlabru. The gradient used to indicate density counts across the area goes from blue to green to yellow to red as values increase. The highest counts are recorded in the west of the site with values of 1 – 1.99 counts/km2. The area surrounding this hotspot shows counts of 0.5 – 0.99 counts/km2, further decreasing to 0.2-0.49 counts/km2 as the distance increases. The lowest estimates are found at the borders of the Special Protection Area, particularly at the east and south borders with estimates reaching 0 – 0.09 counts/km2.
The second map shows the upper credible limits. The majority of the map shows density estimates of 1 – 1.99 counts/km2, with an area to the east of the Special Protection Area having higher counts of 2 – 4.99 counts/km2 along the eastern border. The lowest density estimates are found in the north-east of the site and show density estimates of 0.5 - 0.99 counts/km2.

Figure 12. Two maps showing (1) the predicted density of great northern diver in the Scapa Flow SPA and (2) the coefficient of variation in these estimates across the SPA from the surveys conducted on 20 January 2023.
Click for a full description
Two maps of the Scapa Flow Special Protected Area organised vertically. Map 1 shows the predicted densities generated using Inlabru. The centre of the map has the highest predictions, in the range 10 – 19.9 counts/km2, with surrounding areas near the centre and towards the west border having predictions between 5 – 9.99 counts/km2. The east has the lowest predictions, which are in the range 0.2 – 0.99 counts/km2. The densities are lower in areas closer to the east border. There is also a small part along the southern border that has low predictions between 0.5 – 0.99 counts/km2.
Map 2 shows the coefficient of variation associated with the mean densities shown in map 1. The lowest variation is found in the centre of the map, which corresponds to the areas with higher density shown in map 1. The west and south borders have higher variation between 0.6 – 0.99, and the area with the highest variation is in the north-east border. This part of the map has variation in the range 1 – 1.99.
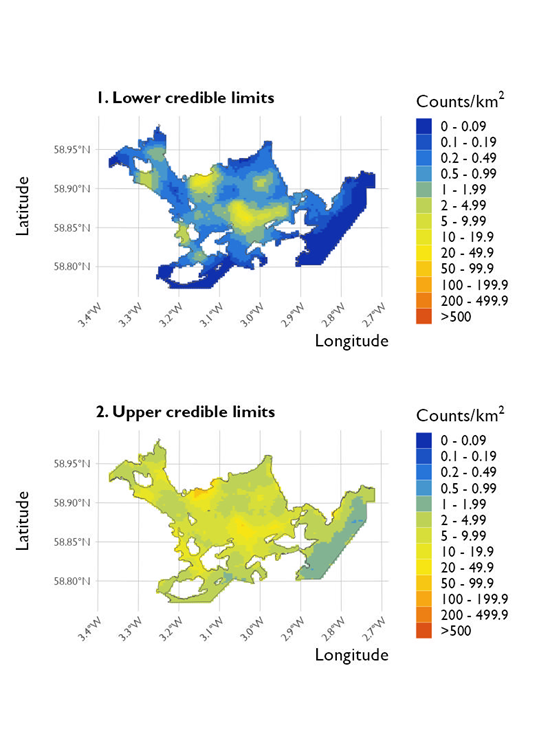
Figure 13. Two maps showing (1) the lower credible limits of density estimates for great northern diver at the Scapa Flow SPA and (2) the upper credible limits of these estimates across the SPA from the surveys conducted on 20 January 2023.
Click for a full description
Two maps of the Scapa Flow Special Protected Area organised vertically. Map 1 shows the lower credible limits of predicted densities generated using Inlabru. This map shows that the central area and towards the west have the highest densities of 2 – 4.99 counts/km2. The east and southern borders have the lowest densities, in the range 0 – 0.99 counts/km2. The north-west corner of the map also has low density between 0.1 – 0.49 counts/km2.
Map 2 shows the upper credible limits of density estimates, which are similar across most of the map. The overall range of density estimates is between 1 – 9.99 counts/km2. The centre of the map has the highest density of around 5 – 9.99 counts/km2, and areas in the north, south and west of the map have slightly lower predictions between 2 – 9.99 counts/km2. The area with the lowest density is the eastern side of the map, which has predictions of 0.5 – 1.99 counts/km2.
Great northern diver were present in all sectors surveyed during the winter 2021/22 and 2022/23 shore-based counts. Total counts and mean percentage per sector are presented in Table 23 and Table 24 respectively for these surveys. During the winter 2021/22 surveys, the highest count of great northern diver across all shoreline sectors occurred in January 2022 (74 birds), followed by November 2021 (59 birds), whereas the highest count during the winter 2022/23 surveys was in November 2022 (105 birds). Markedly lower numbers were recorded in February during winter 2021/22 (6 birds), and in January (survey 2) in winter 2022/23 (7 birds).
The distribution of great northern diver across sectors 9 – 12 and 37 – 38 is presented in Figure 14 and Figure 15 respectively for the winter 2021/22 and winter 2022/23 surveys. The majority of birds were recorded in the southerly sectors (sector 12 and 38) across both winter seasons. The largest flocks were generally recorded further offshore (>1 km).
| Sector | Nov ‘21 | Dec ‘21 | Jan ‘22 | Feb ‘22 | Mar ‘22 | Mean % |
|---|---|---|---|---|---|---|
| 9 | 0 | 5 | 1 | 1 | 2 | 9.69 % |
| 10 | 0 | 1 | 13 | 0 | 0 | 4.16 % |
| 11 | 1 | 0 | 2 | 0 | 0 | 0.88 % |
| 12 | 14 | 8 | 28 | 2 | 5 | 31.28 % |
| 37 | 0 | 0 | 6 | 0 | 0 | 1.62 % |
| 38 | 44 | 17 | 24 | 3 | 7 | 52.37 % |
| Total | 59 | 31 | 74 | 6 | 14 | 100 % |
| Sector | Nov ‘22 | Dec ‘22 | Jan ‘23 (survey 1) | Jan ’23 (survey 2) | Feb ‘23 | Mar ‘23 | Mean % |
|---|---|---|---|---|---|---|---|
| 9 | 5 | 2 | 2 | 0 | 2 | 3 | 6.06 % |
| 10 | 6 | 4 | 3 | 0 | 5 | 2 | 10.85 % |
| 11 | 20 | 2 | 1 | 2 | 1 | 13 | 15.38 % |
| 12 | 30 | 1 | 8 | 1 | 4 | 3 | 14.63 % |
| 37 | 1 | 4 | 10 | - | 2 | 1 | 10.22 % |
| 38 | 43 | 4 | 50 | 4 | 4 | 28 | 44.57 % |
| Total | 105 | 17 | 74 | 7 | 18 | 50 | 100.00 % |
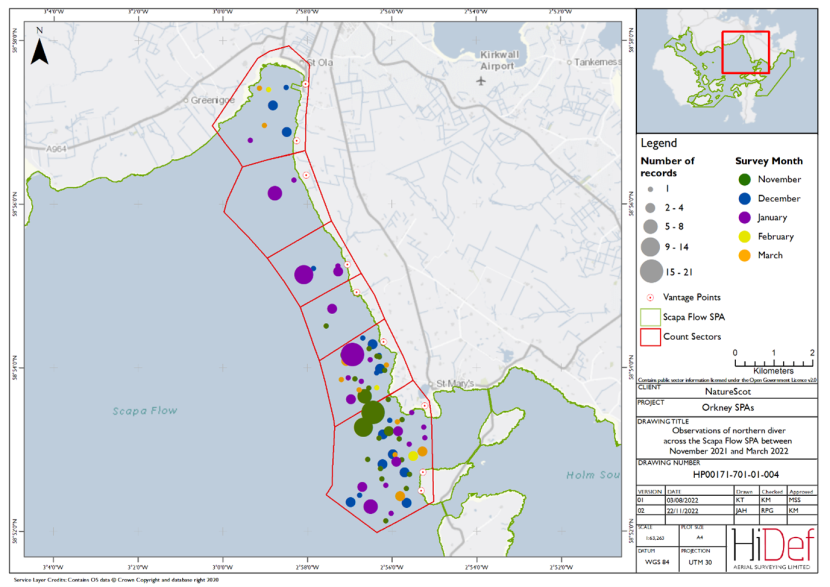
Figure 14. Shore-based observations of great northern diver within the Scapa Flow SPA inshore survey sectors between November 2021 and March 2022.
Click for a full description
Map of shore-based observations of great northern diver in survey sectors at the Scapa Flow Special Protection Area during the winter 2021/22 surveys. Observations are represented by circles of increasing size relating to the number of birds seen. The circle markers are also coloured by survey month. The majority of observations are in the two southernmost sectors which are in closest proximity to the village of St Mary’s. The month of January recorded the most observations.
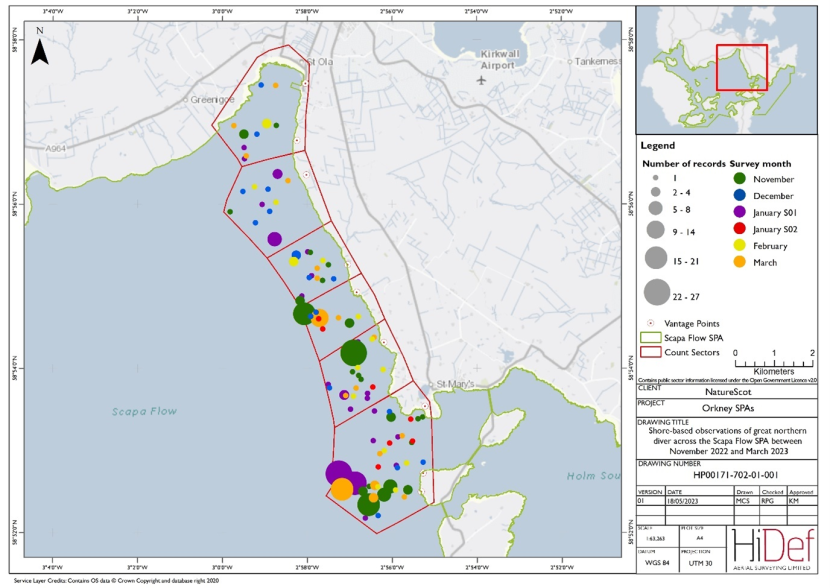
Figure 15. Shore-based observations of great northern diver within the Scapa Flow SPA sectors between November 2022 and March 2023.
Click for a full description
Map of shore-based observations of great northern diver in survey sectors at the Scapa Flow Special Protected Area during the winter 2022/23 shore-based surveys. Observations are represented by circles of increasing size relating to the number of birds seen. The circle markers are also coloured by survey month. The survey in sector 37 on 20 January 2023 was not completed due to difficulties with access. The majority of observations are in the two southernmost sectors with larger flocks recorded further offshore.
Black-throated diver
Only three and seven black-throated diver were recorded in the February 2022 and January 2023 DAS, respectively (Table 5 and Table 6). An additional three and seven birds respectively were identified as ‘diver sp’ but could not be identified to species level in these surveys. The distribution of black-throated diver is illustrated in Figure 16 and Figure 17. During the February 2022 survey, birds were present in the north-west of the SPA, closer to the coast than their great northern counterparts; with one individual in Hoy Sound, one individual in Burra Sound and one individual east of Orphir on Mainland Orkney. During the January 2023 survey, birds were only observed in the waters to the east of Hoy, near Farra and Flotta.
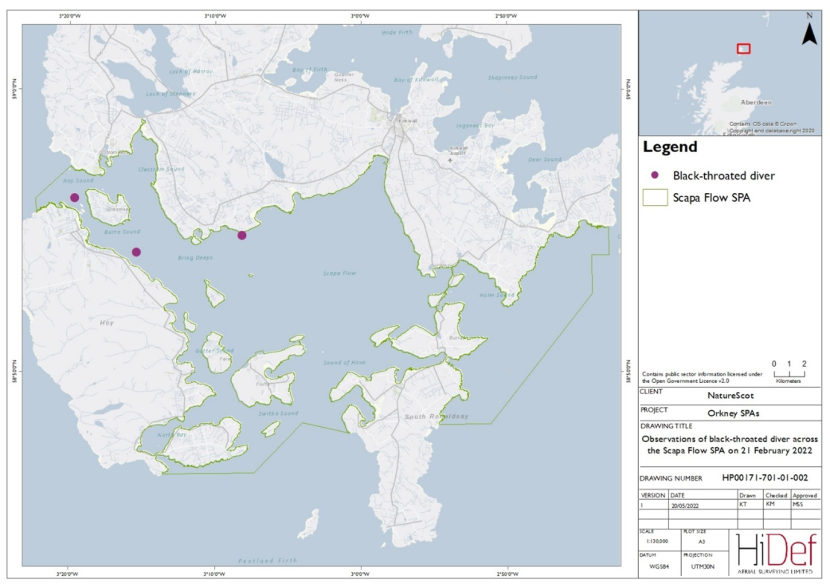
Figure 16. Aerial observations of black-throated diver within the Scapa Flow SPA on 21 February 2022.
Click for a full description
Map of Scapa Flow Special Protection Area with circles marking the locations of black-throated divers that were observed during the aerial survey of 21 February 2022. There are 3 observations marked, all near the coast towards the northwest of the site with one individual in Hoy Sound, one individual in Burra Sound and one individual east of Orphir.
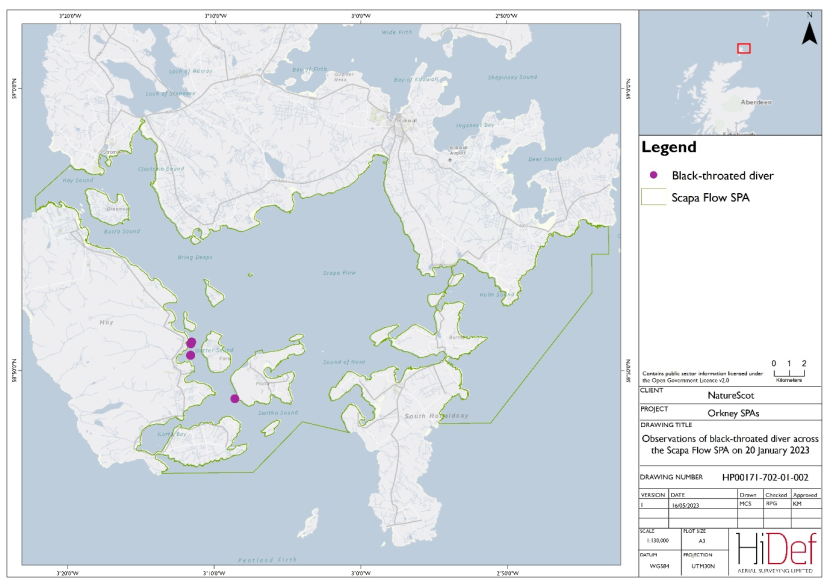
Figure 17. Aerial observations of black-throated diver within the Scapa Flow SPA on 20 January 2023.
Click for a full description
Map of Scapa Flow Special Protected Area with circles marking the locations of black-throated divers that were observed during the aerial survey of 20 January 2023. There are 7 observations marked, with most observed in the Gutter Sound and one individual on the west coast of Flotta.
Design-based strip transect analysis of the aerial survey data estimated the Scapa Flow SPA population at 13 birds (95 %CI 0 – 32) and 30 birds (95 %CI 0 – 84) in the February 2022 and January 2023 surveys respectively (Table 9), equating to a density of 0.04 birds/km2 and 0.09 birds/km2.
Density surface mapping was not undertaken for black-throated diver, as fewer than 10 observations were recorded in both surveys.
Black-throated diver were only present in the January survey of the winter 2021/22 shore-based counts and birds were present in sectors 11 (14 birds) and 38 (12 birds) only. In the winter 2022/23 surveys, birds were present in all surveys except February 2023, but were absent from sectors 10,11 and 38 across all surveys. Observations of black-throated diver peaked in March 2023 with 19 observations followed by December 2022 with 14 birds recorded. Total counts and mean percentage per sector for the winter 2021/22 and 2022/23 surveys are presented in Table 25 and Table 26, respectively. The distribution of black-throated diver across sectors 9 – 12 and 37 – 38 is presented in Figure 18 and Figure 19 respectively for the winter 2021/22 and winter 2022/23 surveys.
| Sector | Nov ‘21 | Dec ‘21 | Jan ‘22 | Feb ‘22 | Mar ‘22 | Mean % |
|---|---|---|---|---|---|---|
| 9 | 0 | 0 | 0 | 0 | 0 | 0.00 % |
| 10 | 0 | 0 | 0 | 0 | 0 | 0.00 % |
| 11 | 0 | 0 | 14 | 0 | 0 | 53.85 % |
| 12 | 0 | 0 | 0 | 0 | 0 | 0.00 % |
| 37 | 0 | 0 | 0 | 0 | 0 | 0.00 % |
| 38 | 0 | 0 | 12 | 0 | 0 | 46.15 % |
| Total | 0 | 0 | 26 | 0 | 0 | 100.00 % |
| Sector | Nov ‘22 | Dec ‘22 | Jan ‘23 (survey 1) | Jan ’23 (survey 2) | Feb ‘23 | Mar ‘23 | Mean % |
|---|---|---|---|---|---|---|---|
| 9 | 0 | 14 | 0 | 1 | 0 | 0 | 33.33 % |
| 10 | 0 | 0 | 0 | 0 | 0 | 0 | 0.00 % |
| 11 | 0 | 0 | 0 | 0 | 0 | 0 | 0.00 % |
| 12 | 12 | 0 | 7 | 0 | 0 | 0 | 33.33 % |
| 37 | 0 | 0 | 0 | - | 0 | 19 | 20.00 % |
| 38 | 0 | 0 | 0 | 0 | 0 | 0 | 0.00 % |
| Total | 12 | 14 | 7 | 1 | 0 | 19 | 83.33 % |
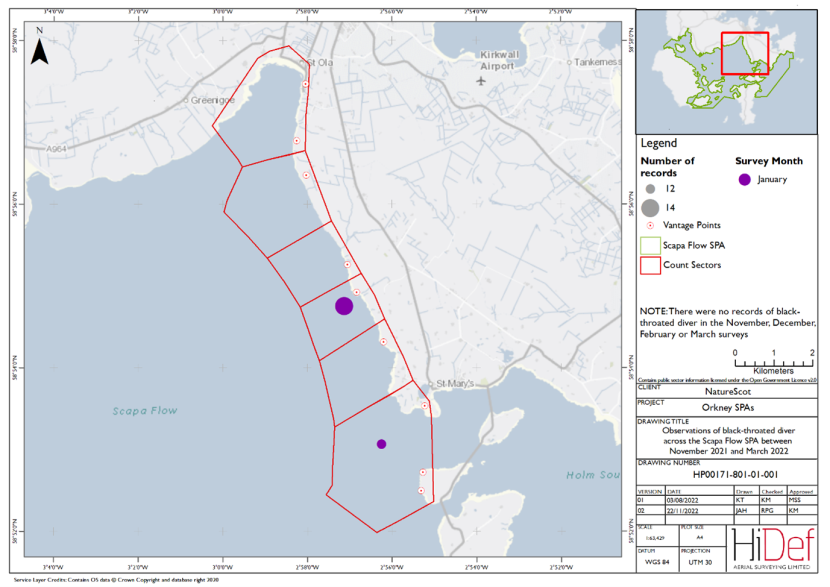
Figure 18. Shore-based observations of black-throated diver within the Scapa Flow SPA sectors between November 2021 and March 2022.
Click for a full description
Map of shore-based observations of black-throated diver in survey sectors at the Scapa Flow Special Protection Area during the winter 2021/22 shore-based surveys. Observations are represented by circles of increasing size relating to the number of birds seen. There are just two sets of observations, both of which were in January, with12 birds at a central sector and 14 at the most southerly sector near to St Mary’s village. Black-throated diver were only recorded in the January 2022 shore-based surveys.
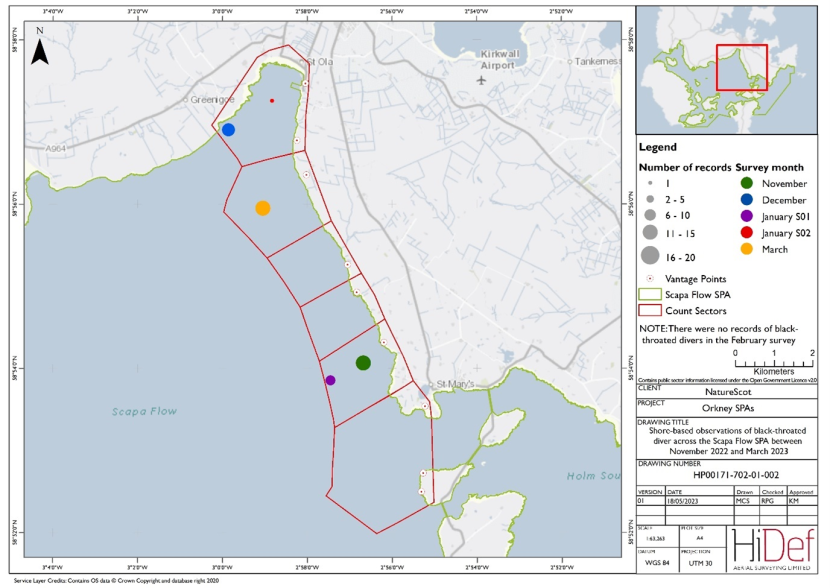
Figure 19. Shore-based observations of black-throated diver within the Scapa Flow SPA sectors between November 2022 and March 2023.
Click for a full description
Map of shore-based observations of black-throated diver in survey sectors at the Scapa Flow Special Protected Area in the winter 2022/23 shore-based surveys. Observations are represented by circles of increasing size relating to the number of birds seen. Black-throated divers were recorded in all shore-based surveys apart from February 2023. The survey in sector 37 on 20 January 2023 was not completed due to difficulties with access. The highest number of birds were recorded in March 2023 (19 birds) in a central sector and 15 birds recorded in the most northerly sector in Scapa Bay during the December 2022 and January Survey 02 2023.
Slavonian grebe
A total of 18 and 24 Slavonian grebe were recorded in the DAS in February 2022 and January 2023 respectively (Table 5 and Table 6). The distribution of birds for these surveys is illustrated in Figure 20 and Figure 21. Slavonian grebe are a coastal species, and this is evident with individuals found close to shore such as surrounding North Bay, Fara, Flotta, and South Ronaldsay in the south; Burray and Lamb Holm in the east and within Scapa Bay and Swanbister Bay in the north in both surveys.
Design-based strip transect analysis of the aerial survey data estimated the Scapa Flow SPA population at 73 birds (95 %CI 29 - 123) and 100 birds (95 % CI 50 – 159) in the February 2022 and January 2023 surveys respectively (Table 9), equating to densities of 0.23 birds/km2 and 0.3 birds/km2. This compares to a marginally lower estimate of 70 birds (95 % credible limits 40 - 123) during February 2022 and a marginally higher estimate of 114 birds (95 % credible interval 69 – 175) during January 2023 from model-based Bayesian point processing (Table 21).
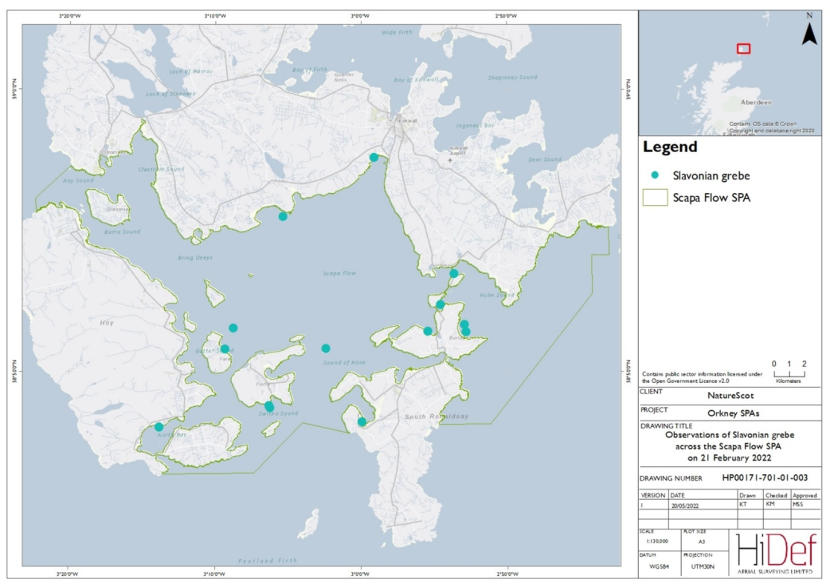
Figure 20. Aerial observations of Slavonian grebe within the Scapa Flow SPA on 21 February 2022.
Click for a full description
Map of Scapa Flow Special Protection Area with circles marking the locations of Slavonian grebe that were observed during the aerial survey of 21 February 2022. There are 18 observations marked, all of which are in close proximity to the coast. Sightings are at the shore surrounding North Bay, Fara, Flotta, and South Ronaldsay in the south; Burray and Lambholm in the east and within Scapa Bay and Swanbister Bay in the north.

Figure 21. DAS observations of Slavonian grebe within the Scapa Flow SPA on 20 January 2023.
Click for a full description
Map of Scapa Flow Special Protected Area with circles marking the locations of Slavonian grebe that were observed during the DAS on 20 January 2023. Clusters of birds are observed in the Clestrain Sound in the northwest of the survey area as well as on the shores of southerly islands including Fara, Flotta and North Bay. Birds were also recorded in the east around Burray and in the Holm Sound.
The predicted mean densities of Slavonian grebe across the Scapa Flow SPA generated through Bayesian point processing for the February 2022 and January 2023 surveys are presented in Figure 22 and Figure 24 respectively, alongside the CV. Bayesian point process analysis estimated birds at a density of up to 0.2 – 0.49 birds/km2 across the majority of the SPA during both surveys. In 2023 there are areas of higher density (2 – 4.99 birds/km2) at the south-west of the SPA, between Hoy and Flotta, as well as in the Bay of Ireland to the north-west of the SPA. In the February 2022 surveys, similar densities were recorded around Burray and within Scapa Bay. The lower and upper credible limits are mapped in Figure 23 and Figure 25 for the February 2022 and January 2023 surveys respectively.
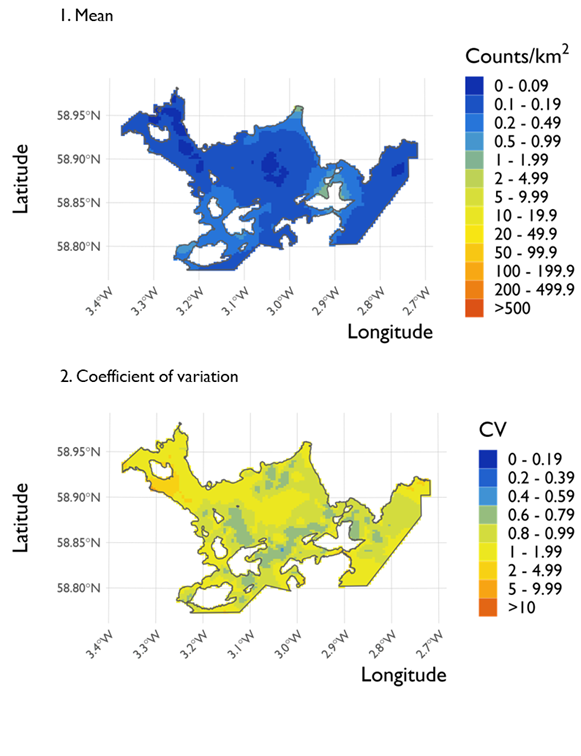
Figure 22. Two maps showing (1) the predicted density of Slavonian grebe in the Scapa Flow SPA and (2) the coefficient of variation (CV) in these estimates across the SPA from the surveys conducted on 21 February 2022.
Click for a full description
Two maps of the Scapa Flow Special Protection Area organised vertically. Map 1 shows the predicted densities generated using Inlabru. The gradient used to indicate density estimates across the area goes from blue to green to yellow to red as values increase. The first map showing the mean density estimates for the Slavonian grebe indicates that the majority of the Special Protection Area has a density estimate of 0.1 – 0.19 counts/km2. There are areas with higher density estimates of 0.2 – 0.49 counts/km2 at the south-west of the Special Protection Area, as well as the east and north borders. The highest density estimates of 1 – 1.99 counts/km2 occur at the edges of the Special Protection Area in the north and east towards the edges of the areas with estimates of 0.2 – 0.49 counts/km2.
The second map shows the coefficient of variation associated with the density estimates shown in map 1. The lowest variation recorded was 0.6 – 0.79 counts/km2, which are scattered throughout the Special Protection Area. The highest levels of variation are found in the north- west of the Special Protection Area, with values peaking at 2 – 4.99 counts/km2.
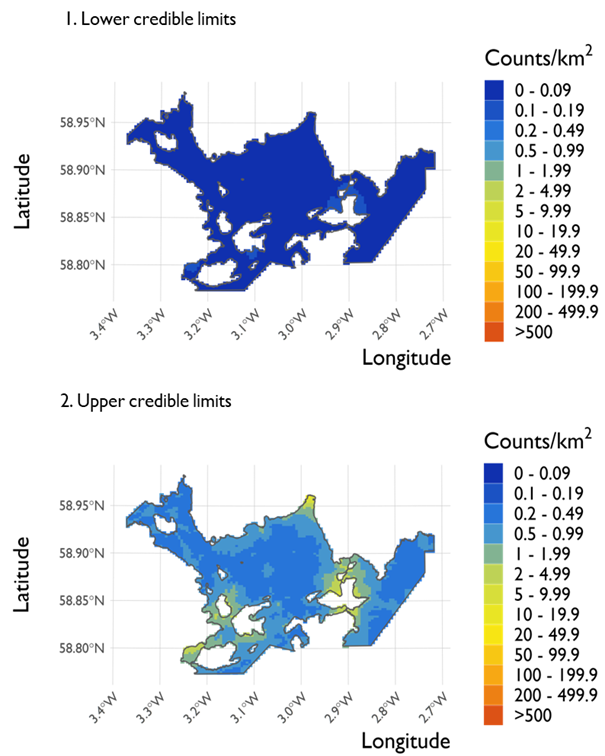
Figure 23. Two maps showing (1) the lower credible limits of density estimates for Slavonian grebes at the Scapa Flow SPA and (2) the upper credible limits of these estimates across the SPA from the surveys conducted on 21 February 2022.
Click for a full description
Two maps of the Scapa Flow Special Protection Area organised vertically. The map 1 shows the lower credible limits of predicted counts generated using Inlabru. The gradient used to indicate density estimates across the area goes from blue to green to yellow to red as values increase. Map 1 shows the lower credible limits of density estimates for the majority of the SPA is 0 – 0.09 counts/km2. There are areas with slightly higher estimates of 0.2 – 0.99 counts/km2 in the east and south-west of the Special Protection Area.
The second map shows the upper credible limits of density estimates. The centre of the Special Protection Area shows estimates of 0.2 – 0.49 counts/km2, with estimates increasing gradually from 0.5 - 0.99, to 1 – 1.99 and 2-4.99 counts/km2 towards the coastal edges of Scapa Flow Special Protection Area.
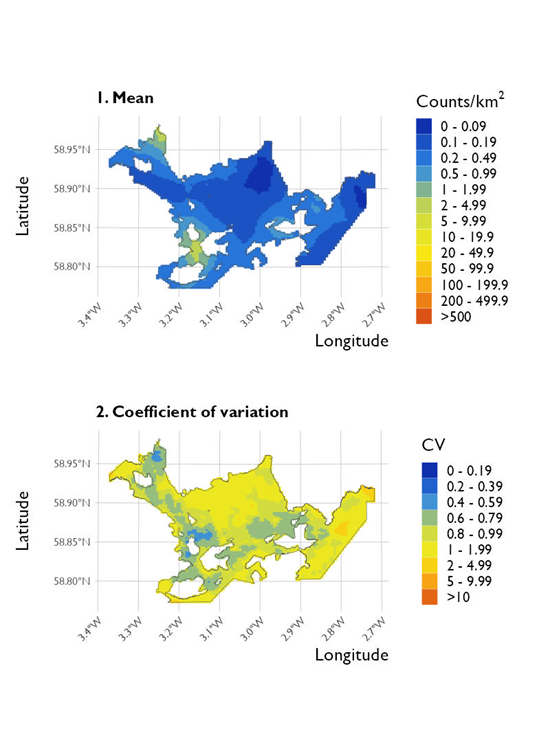
Figure 24 Two maps showing (1) the predicted density of Slavonian grebe in the Scapa Flow SPA and (2) the coefficient of variation in these estimates across the SPA from the surveys conducted on 20 January 2023.
Click for a full description
Two maps of the Scapa Flow Special Protected Area organised vertically. Map 1 shows the predicted densities generated using Inlabru. The majority of the map shows densities in the range 0 – 0.99 counts/km2, with two areas in the north-west and south-west that have higher predictions of 1 – 9.99 counts/km2. There are two areas with predictions in the range 0 – 0.09 counts/km2, and these are found in the north and north-east of the map.
Map 2 shows the coefficient of variation associated with the mean densities shown in map 1. Almost all of the map has variation in the range 1 – 1.99 counts/km2. There are two areas of lower variation which correspond to higher densities in map 1. These areas have variation in the range 0.4 – 0.79 counts/km2. There are also two small areas of higher variation in the range 2 – 4.99 counts/km2, which are found on the east of the site.
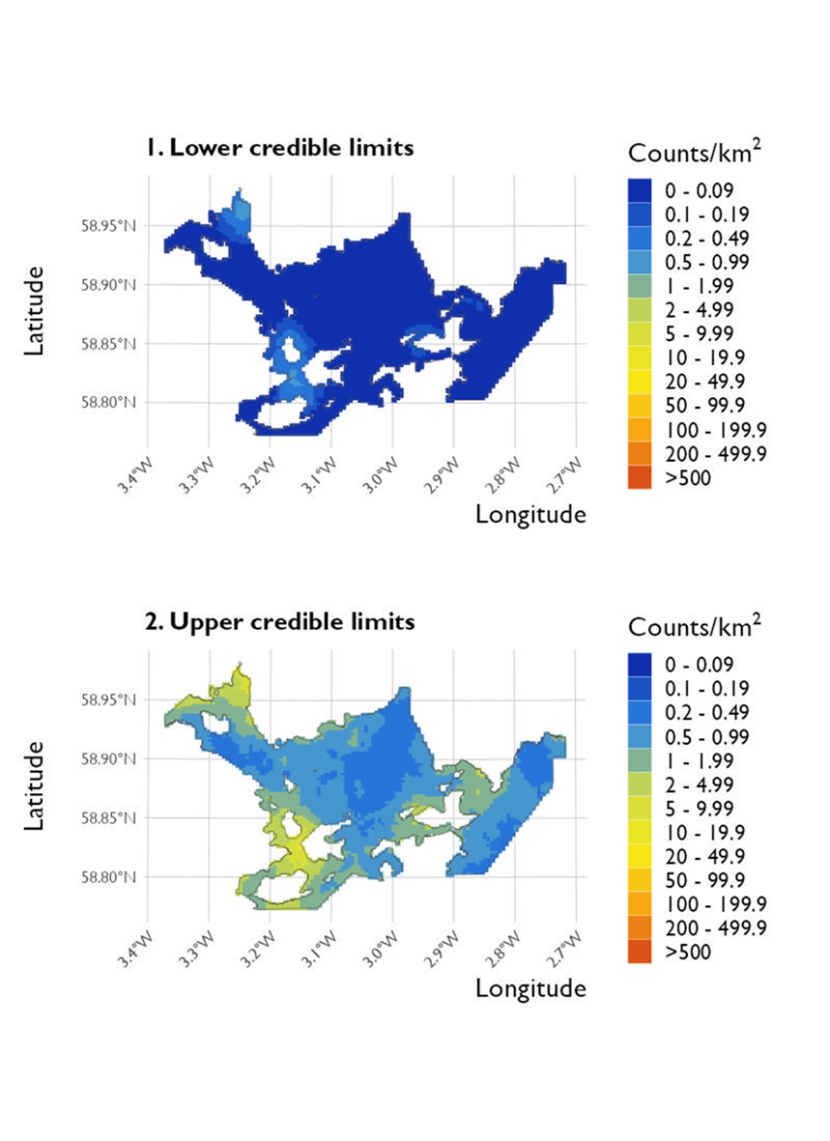
Figure 25. Two maps showing (1) the lower credible limits of density estimates for Slavonian grebe at the Scapa Flow SPA and (2) the upper credible limits of these estimates across the SPA from the surveys conducted on 20 January 2023.
Click for a full description
Two maps of the Scapa Flow Special Protected Area organised vertically. Map 1 shows the lower credible limits of predicted densities generated using Inlabru. The predictions are low across the whole map, however there are two areas of slightly higher predictions in the north-west and south-west. These areas have predictions between 0.2 – 0.99 counts/km2. The rest of the map has predictions between 0 – 0.09 counts/km2.
Map 2 shows the upper credible limits of density estimates. The centre and east areas have lower predictions of 0.2 – 0.99 counts/km2, as well as some parts of the west. The highest predictions are between 5 – 49.9 counts/km2, and these are found in the north-west and south-west parts of the site.
Slavonian grebe were present in all monthly shore-based surveys throughout winter 2021/22 and 2022/23 surveys. In winter 2021/22, increased numbers were observed in December 2021 (17 birds) and January 2022 (21 birds), whilst in winter 2022/23 low numbers of birds (2 – 5 birds) were observed in all months except the second January survey (35 birds). Total counts and mean percentage per sector are presented in Table 27 and Table 28 respectively for the winter 2021/22 and 2022/23 surveys. Birds were observed in all sectors except sector 37 across the winter 2021/22 surveys, and only one bird was observed in this sector across the winter 2022/23 surveys. In both winters, the majority of observations occurred in sectors 9 (inner Scapa Bay; 2022: ~25 %; 2023 ~50 % mean percentage occurrence) and 38 (St. Mary’s Bay; 2022: ~44 %; 2023: ~27 % mean percentage occurrence).
The distribution of Slavonian grebe across sectors 9 – 12 and 37 – 38 is presented in Figure 26 and Figure 27 respectively for the winter 2021/22 and winter 2022/23 surveys. As expected, birds were recorded relatively close to shore, preferring shallow inshore waters in both surveys.
| Sector | Nov ‘21 | Dec ‘21 | Jan ‘22 | Feb ‘22 | Mar ‘22 | Mean % |
|---|---|---|---|---|---|---|
| 9 | 0 | 11 | 6 | 1 | 0 | 25.32 % |
| 10 | 0 | 0 | 7 | 0 | 0 | 6.67 % |
| 11 | 0 | 0 | 2 | 0 | 0 | 1.90 % |
| 12 | 3 | 0 | 2 | 2 | 0 | 21.90 % |
| 37 | 0 | 0 | 0 | 0 | 0 | 0.00 % |
| 38 | 6 | 6 | 4 | 0 | 2 | 44.20 % |
| Total | 9 | 17 | 21 | 3 | 2 | 100.00 % |
| Sector | Nov ‘22 | Dec ‘22 | Jan ‘23 (survey 1) | Jan ’23 (survey 2) | Feb ‘23 | Mar ‘23 | Mean % |
|---|---|---|---|---|---|---|---|
| 9 | 0 | 1 | 3 | 6 | 2 | 2 | 49.52 % |
| 10 | 0 | 0 | 0 | 4 | 0 | 0 | 1.90 % |
| 11 | 1 | 1 | 0 | 0 | 0 | 0 | 11.67 % |
| 12 | 0 | 2 | 0 | 0 | 0 | 0 | 6.67 % |
| 37 | 0 | 0 | 1 | - | 0 | 0 | 4.00 % |
| 38 | 1 | 1 | 1 | 25 | 0 | 0 | 26.90 % |
| Total | 2 | 5 | 5 | 35 | 2 | 2 | 100.00 % |
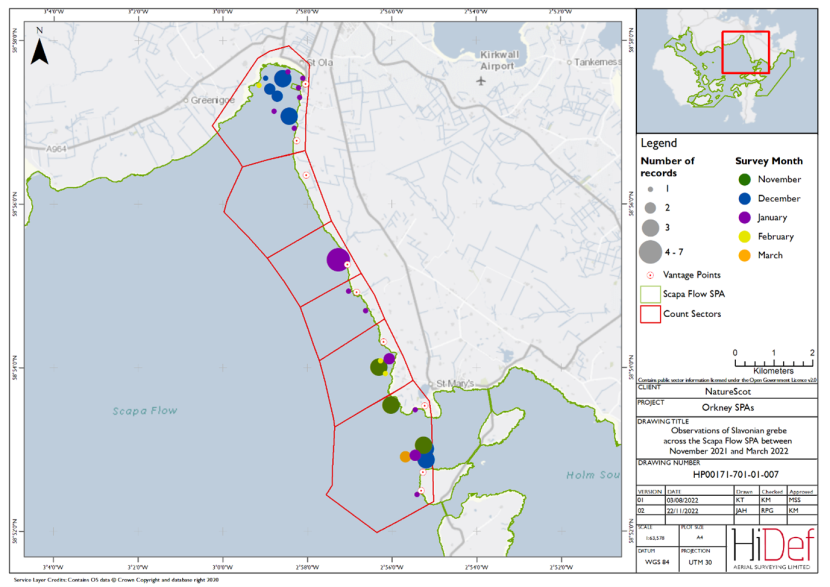
Figure 26. Shore-based observations of Slavonian grebe within the Scapa Flow SPA sectors between November 2021 and March 2022.
Click for a full description
Map of shore-based observations of Slavonian grebe in survey sectors at the Scapa Flow Special Protection Area during the winter 2021/22 shore-based surveys. Observations are represented by circles of increasing size relating to the number of birds seen. The circle markers are also coloured by survey month. Observations are positioned close to the shore, with clusters of sightings located to the northwest of Glimps Holm and also Scapa Bay, here particularly in December.
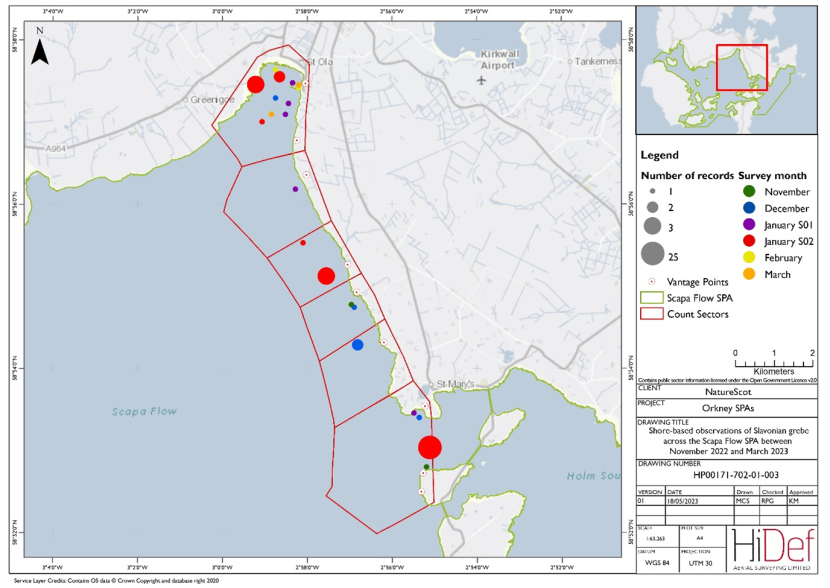
Figure 27. Shore-based observations of Slavonian grebe within the Scapa Flow SPA sectors between November 2022 and March 2023.
Click for a full description
Map of shore-based observations of Slavonian grebe in survey sectors at the Scapa Flow Special Protected Area during the 2022/23 shore-based surveys. Observations are represented by circles of increasing size relating to the number of birds seen. The circle markers are also coloured by survey month. The survey in sector 37 on 20 January 2023 was not completed due to difficulties with access. Birds were recorded close to the shore, with clusters of sightings located within Scapa Bay and to the north of Glimps Holm island. The highest numbers of birds were recorded during the survey on 20 January 2023.
Red-breasted merganser
More than twice as many red-breasted merganser were recorded in the January 2023 survey (86 birds) than the February 2022 survey (29 birds) (Table 5 and Table 6). An additional 95 birds during February 2022 and 67 birds during January 2023 were identified as ‘duck sp.’ but could not be identified to species level. The distribution of red-breasted merganser is illustrated in Figure 28 and Figure 29 for the February 2022 and January 2023 surveys respectively. In both surveys, birds were distributed close to shore. In the February 2022 survey birds were primarily observed in the south and east of the SPA, including North Bay, Flotta, South Ronaldsay, Burray and St. Mary’s Bay. In the January 2023 survey, birds were also observed in the northwest of the site with high numbers in Clestrain sound.
Design-based strip transect analysis of the aerial survey data estimated the Scapa Flow SPA population at 79 birds (95 %CI 25 - 157) during the February 2022 survey compared with 330 birds (95 %CI 147 – 569) during the January 2023 survey (Table 9), equating to densities of 0.25 birds/km2 and 1 bird/km2 respectively. This compares to a higher estimate of 102 birds (95 % credible limits 56 - 200) in February 2022, and slightly higher estimate of 338 birds (95 % credible interval 255 – 435), from Bayesian point processing (Table 21).

Figure 28. DAS observations of red-breasted merganser within the Scapa Flow SPA on 21 February 2022.
Click for a full description
Map of Scapa Flow Special Protection Area with circles marking the locations of red-breasted merganser that were observed during the aerial survey of 21 February 2022. There are 29 observations marked, distributed close to shore: restricted to the south and east of the Special Protection Area, including North Bay, Flotta, South Ronaldsay, Burray and St. Mary’s Bay. A bird was also recorded within inner Scapa Bay.

Figure 29. DAS observations of red-breasted merganser within the Scapa Flow SPA on 20 January 2023.
Click for a full description
Map of Scapa Flow Special Protected Area with circles marking the locations of red-breasted merganser that were observed during the 20 January 2023 DAS. Observations were located close to shore, primarily on the west shores of South Ronaldsay and Burray as well as in the north of the Clestrain Sound. Small numbers of birds were recorded within Scapa Bay.
The predicted mean densities of red-breasted merganser across the Scapa Flow SPA generated through Bayesian point processing are presented for the February 2022 and January 2023 surveys in Figure 30 and Figure 32 respectively, alongside the CV.
Bayesian model-based analysis estimated highest densities of red-breasted merganser 5 – 9.99 birds/km2 in both surveys in nearshore waters around the Scapa Flow SPA. Estimated density reduced out from these points, with 0 – 0.09 birds/km2 estimated across the majority of the SPA in the February 2022 survey, and around 0.5 – 1.99 birds/km2 in the January 2023 survey. Lowest densities were observed across the deeper waters in the central Scapa Flow in both surveys. The lower and upper credible limits are mapped in Figure 31 and Figure 33 for February 2022 and January 2023 respectively.
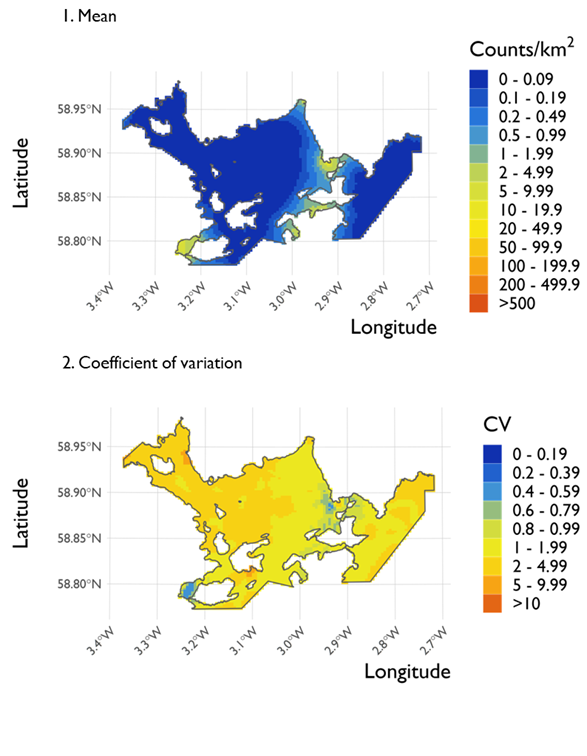
Figure 30. Two maps showing (1) the predicted density of red-breasted merganser in the Scapa Flow SPA and (2) the coefficient of variation (CV) in these estimates across the SPA from the surveys conducted on 21 February 2022.
Click for a full description
Two maps of the Scapa Flow Special Protection Area organised vertically. The gradient used to indicate density estimates across the area goes from blue to green to yellow to red as values increase. The first map showing the mean density estimates for the red-breasted merganser shows density estimates of 0 – 0.09 counts/km2 across the majority of the Special Protection Area, with increased estimates up to 5 - 9.99 close to shore within inshore coastal waters at Hoy’s North Bay; South Ronaldsay’s Widewall Bay and St Margaret’s Hope Bay, and the Bay of Sandber, Bay of Ayre and wider St. Mary’s Bay and inner Scapa Bay. in counts/km2 towards the centre of the site. The same increase is seen towards the south-west of the Special Protection Area.
The second map shows the coefficient of variation associated with the density estimates predicted by Inlabru. The centre of the site shows variation of 1 – 1.99, with the west of the Special Protection Area showing variation of 2 – 4.99. The lowest levels of variation are found in parts of the north-east and south-west of the Special Protection Area.
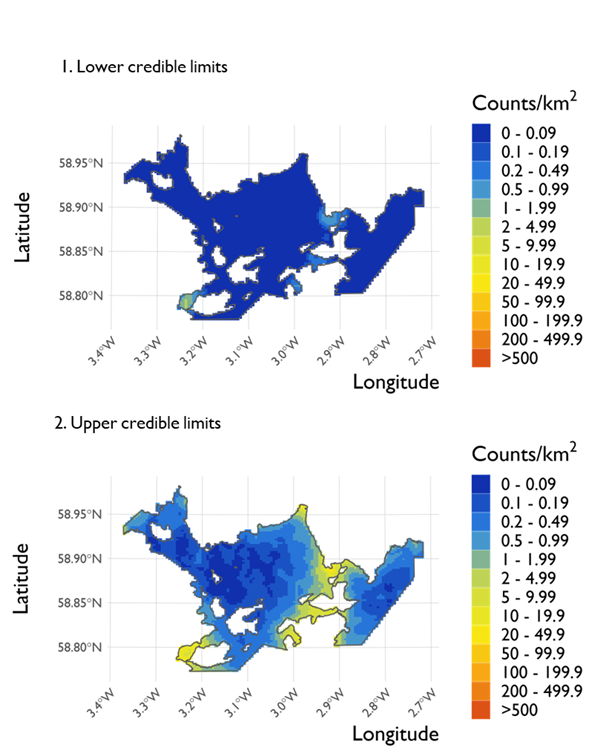
Figure 31. Two maps showing (1) the lower credible limits of density estimates for red-breasted merganser at the Scapa Flow SPA and (2) the upper credible limits of these estimates across the SPA from the surveys conducted on 21 February 2022.
Click for a full description
Two maps of the Scapa Flow Special Protection Area organised vertically. The map 1 shows the lower credible limits of predicted densities generated using Inlabru. The gradient used to indicate density estimates across the area goes from blue to green to yellow to red as values increase. Map 1 shows the lower credible limits for the majority of the Special Protection Area is 0 – 0.09 counts/km2. The highest estimates are found in the south-west of the Special Protection Area, reaching values of 5 – 9.99 counts/km2. There are also areas of higher estimates of 0.5 – 0.99 counts/km2 scattered across the east of the Special Protection Area.
The second Map shows the upper credible limits. The majority of the estimates range from 0 – 0.99 counts/km2, with peaks of 10 – 19.9 counts/km2 at the coastal fringes of the Special Protection Area in the north, south-west and around South Ronaldsay, Burray and Holms extending to St Mary’s Bay.
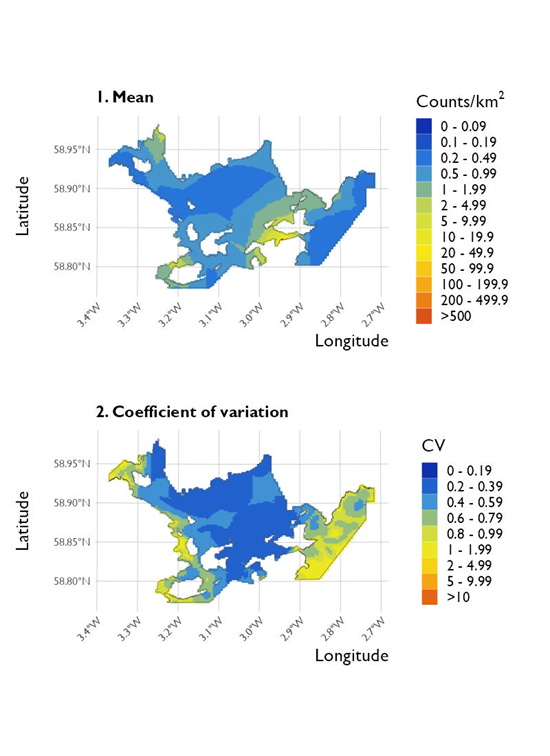
Figure 32. Two maps showing (1) the predicted density of red-breasted merganser in the Scapa Flow SPA and (2) the coefficient of variation in these estimates across the SPA from the surveys conducted on 20 January 2023.
Click for a full description
Two maps of the Scapa Flow Special Protected Area organised vertically. Map 1 shows the predicted densities generated using Inlabru. Most of the site has density predictions around 0.2 – 0.99 counts/km2, with small areas in the north-west, central-east, and south with higher densities of 5 – 19.9 counts/ km2. The lowest density predictions are on the east side, south and north of the map. These areas have densities 0.2 – 0.99 counts/km2.
Map 2 shows the coefficient of variation associated with the mean densities shown in map 1. The centre of the map has the lowest variation of 0 – 0.59 counts/ km2. The areas with highest variation are found on the east, as well as the western border and along the southern border. These areas have variation between 0.6 – 1.99 counts/ km2.
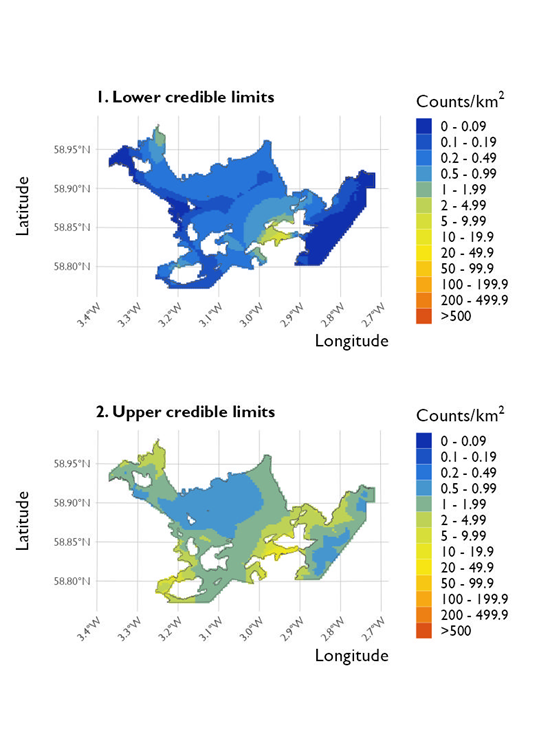
Figure 33. Two maps showing (1) the lower credible limits of density estimates for red-breasted merganser at the Scapa Flow SPA and (2) the upper credible limits of these estimates across the SPA from the surveys conducted on 20 January 2023.
Click for a full description
Two maps of the Scapa Flow Special Protected Area organised vertically. Map 1 shows the lower credible limits of predicted densities generated using Inlabru. Most of the map have densities from 0 – 0.49 counts/km2, but there is one main hotspot just east of the centre of the map that has density predictions from 2 – 19.9 counts/km2. There is another small area with higher predictions on the north-eastern corner of the site, where densities are 2 – 4.99 counts/km2.The areas with lowest density are found along the western border, and on the east side. These areas have densities in the range 0 – 0.19 counts/km2.
Map 2 shows the upper credible limits of density estimates. The lowest density estimates are found in the centre and east side of the map, where the density is in the range 0.5 – 1.99 counts/km2. There are areas of higher density just east of the centre, towards the south, and in the north-west corner. These areas have density in the range 10 – 49.9 counts/km2.
Red-breasted merganser were present in all monthly shore-based surveys throughout both winter survey periods, with the highest numbers occurring in January (2022: 24 birds; 2023: 15 birds). Total counts and mean percentage per sector are presented in Table 29 and Table 30 respectively for the winter 2021/22 and 2022/23 surveys. Birds were observed in all sectors except sector 37 in both winters. The majority of observations occurred in sector 9 (inner Scapa Bay) during the winter 2021/22 surveys (~61 % mean percentage occurrence), while in the winter 2022/23 surveys, most observations occurred in sector 38 (St Mary’s Bay) (~51 % mean percentage occurrence).
The distribution of red-breasted merganser across sectors 9 – 12 and 37 – 38 is presented in Figure 34 and Figure 35 for the winter 2021/22 and winter 2022/23 surveys respectively. As expected, birds were mostly recorded close to shore; preferring sheltered coastlines during both surveys.
| Sector | Nov ‘21 | Dec ‘21 | Jan ‘22 | Feb ‘22 | Mar ‘22 | Mean % |
|---|---|---|---|---|---|---|
| 9 | 8 | 12 | 12 | 6 | 8 | 61.03 % |
| 10 | 0 | 0 | 4 | 0 | 0 | 3.33 % |
| 11 | 0 | 0 | 2 | 0 | 0 | 1.67 % |
| 12 | 2 | 2 | 2 | 5 | 0 | 16.28 % |
| 37 | 0 | 0 | 0 | 0 | 0 | 0.00 % |
| 38 | 5 | 0 | 4 | 0 | 5 | 17.69 % |
| Total | 15 | 14 | 24 | 11 | 13 | 100.00 % |
| Sector | Nov ‘22 | Dec ‘22 | Jan ‘23 (survey 1) | Jan ’23 (survey 2) | Feb ‘23 | Mar ‘23 | Mean % |
|---|---|---|---|---|---|---|---|
| 9 | 2 | 0 | 3 | 1 | 2 | 1 | 36.03 % |
| 10 | 0 | 2 | 0 | 2 | 0 | 0 | 5.93 % |
| 11 | 0 | 2 | 0 | 0 | 0 | 0 | 3.70 % |
| 12 | 0 | 2 | 0 | 0 | 0 | 0 | 3.70 % |
| 37 | 0 | 0 | 0 | - | 0 | 0 | 0.00 % |
| 38 | 4 | 3 | 4 | 12 | 0 | 2 | 50.63 % |
| Total | 6 | 9 | 7 | 15 | 2 | 3 | 100.00 % |
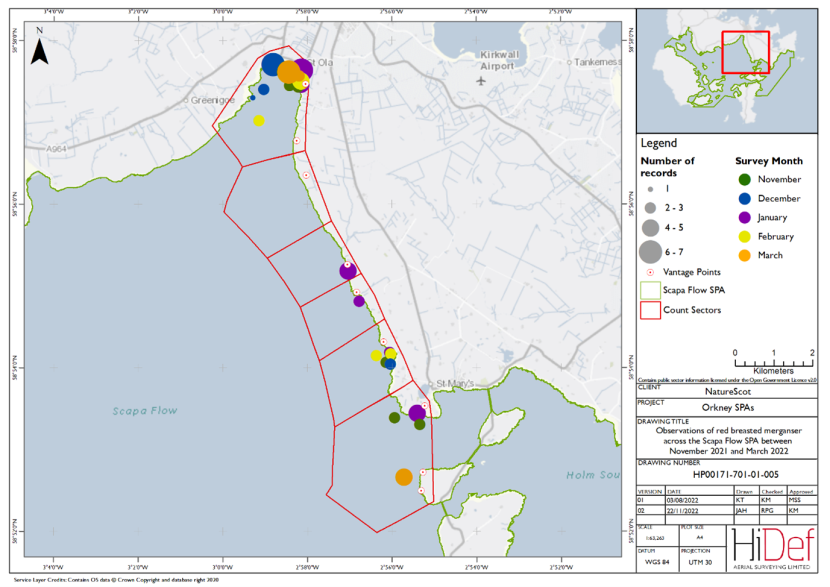
Figure 34. Shore-based observations of red-breasted merganser within the Scapa Flow SPA sectors between November 2021 and March 2022.
Click for a full description
Map of shore-based observations of red-breasted merganser in survey sectors at the Scapa Flow Special Protection Area during the winter 2021/22 shore-based surveys. Observations are represented by circles of increasing size relating to the number of birds seen. The circle markers are also coloured by survey month. Most observations are positioned close to the shore, with a cluster of sightings at Scapa Bay. Observations were made throughout the survey months: November, December, January, February and March.
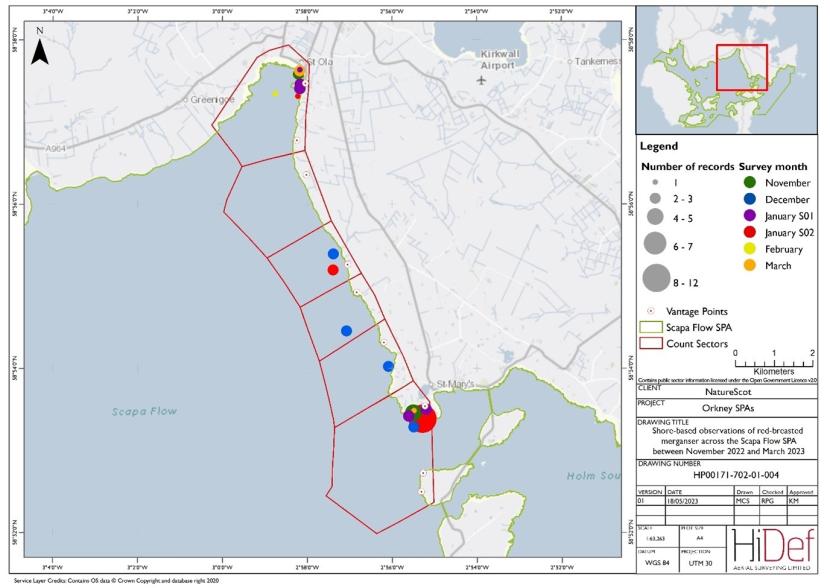
Figure 35. Shore-based observations of red-breasted merganser within the Scapa Flow SPA sectors between November 2022 and March 2023.
Click for a full description
Map of shore-based observations of red-breasted merganser in survey sectors at the Scapa Flow Special Protected Area during the winter 2022/23 shore-based surveys. Observations are represented by circles of increasing size relating to the number of birds seen. The circle markers are also coloured by survey month. The survey in sector 37 on 20 January 2023 was not completed due to difficulties with access. Most observations were made close to the shore, with a cluster of sightings at Scapa Bay and in the most southerly sector close to St Mary’s.
Velvet scoter
Velvet scoter is not a qualifying feature of the Scapa Flow SPA.
No velvet scoter were recorded in the aerial surveys of Scapa Flow in February 2022 or January 2023. Consequently, no design-based strip transect or model-based Bayesian point process analyses were undertaken.
A flock of seven birds were recorded in sector 38 (St. Mary’s Bay) in the January 2022 shore-based count (Table 31) at a distance of ~850 m offshore from Glimps Holm (Figure 36). No velvet scoter were observed in any other shore-based count across the winter 2021/22 and winter 2022/23 surveys.
| Sector | Nov ‘21 | Dec ‘21 | Jan ‘22 | Feb ‘22 | Mar ‘22 | Mean % |
|---|---|---|---|---|---|---|
| 9 | 0 | 0 | 0 | 0 | 0 | 0.00 % |
| 10 | 0 | 0 | 0 | 0 | 0 | 0.00 % |
| 11 | 0 | 0 | 0 | 0 | 0 | 0.00 % |
| 12 | 0 | 0 | 0 | 0 | 0 | 0.00 % |
| 37 | 0 | 0 | 0 | 0 | 0 | 0.00 % |
| 38 | 0 | 0 | 7 | 0 | 0 | 100.00 % |
| Total | 0 | 0 | 7 | 0 | 0 | 100.00 % |
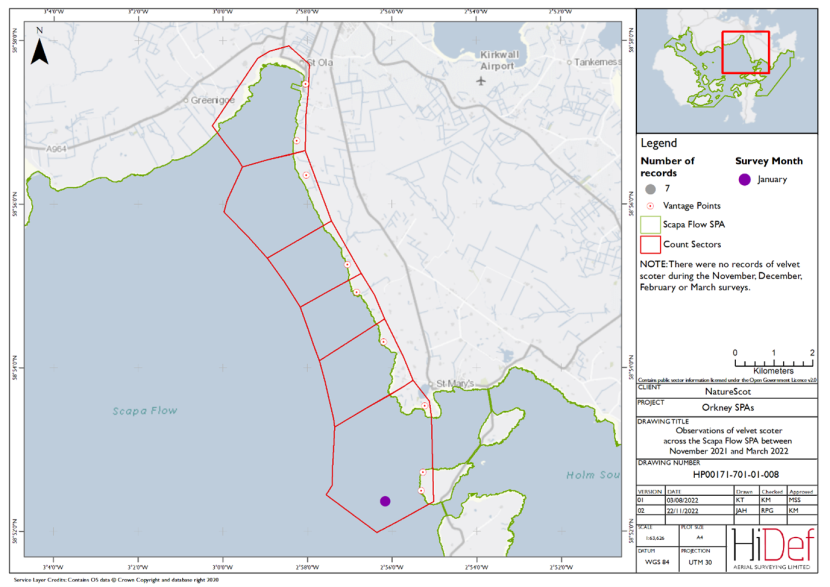
Figure 36. Shore-based observations of velvet scoter within the Scapa Flow SPA sectors between November 2021 and March 2022.
Click for a full description
Map of shore-based observations of velvet scoter in survey sectors at the Scapa Flow Special Protection Area during the winter 2021/22 shore-based surveys. There is a single flock of seven birds marked in the southern most sector approximately 850 m west of Glimps Holm, January 2022.
Long-tailed duck
Long-tailed duck was the most abundant target species recorded in both aerial surveys of Scapa Flow SPA; although, more birds were observed during the January 2023 (786 birds) survey compared with the February 2022 survey (359 birds) (Table 5 and Table 6). An additional 95 and 67 birds were identified as ‘duck sp.’ but could not be identified to species level during the February 2022 and January 2023 surveys respectively (Table 7). The distribution of long-tailed duck is illustrated in Figure 37 and Figure 38. Birds were widely distributed across the Scapa Flow SPA during both surveys, with birds preferring waters closer to the coastlines and islands and avoiding the deeper waters of the central Scapa Flow.
Design-based strip transect analysis of the aerial survey data estimated the Scapa Flow SPA population at 1,381 birds (95 %CI 719 – 2,160) during the February 2022 survey, and 3,149 birds (95 %CI 625 – 7,559) during the January 2023 survey (Table 9), equating to densities of 4.34 birds/km2 and 9.53 birds/km2, respectively. This compares to higher estimates of 1,502 birds (95 % credible limits 1,279 – 1,792) during the February 2022 survey and 3,678 birds (95 % credible interval 3,321 – 4,343) during the January 2023 survey from Bayesian point processing, although there is overlap in the confidence intervals of both approaches (Table 21).

Figure 37. DAS observations of long-tailed duck within the Scapa Flow SPA on 21 February 2022.
Click for a full description
Map of Scapa Flow Special Protection Area with circles marking the locations of long-tailed duck that were observed during the aerial survey of 21 February 2022. There are 359 observations marked, and they are widely distributed across the Scapa Flow Special Protection Area, with birds preferring waters closer to the coastlines and islands and avoiding the central Scapa Flow.

Figure 38. DAS observations of long-tailed duck within the Scapa Flow SPA on 20 January 2023.
Click for a full description
Map of Scapa Flow Special Protected Area with circles marking the locations of long-tailed duck that were observed during the 20 January 2023 DAS. There are 757 observations marked, and they are widely distributed across the Scapa Flow Special Protected Area, with more birds observed closer to the coastlines and islands and avoiding the central Scapa Flow.
The predicted mean density of long-tailed duck across the Scapa Flow SPA generated through model-based Bayesian point processing is presented in Figure 39 and Figure 41 respectively for the February 2022 and January 2023 surveys, alongside the CV in these estimates.
The highest estimated density during the February 2022 survey was 50 – 99.9 birds/km2, with generally higher densities observed around the shallow inlets and along the coast. In the January 2023 surveys, the highest densities of over 500 birds/km2 were observed within the western parts of the SPA. Birds have been recorded frequenting the eastern areas of Hoy and Fara and were commonly found in waters around fish farms (Jackson, 2018), although detailed analysis on the spatial distribution of marine birds in relation to fish farms was not carried out. Birds appeared to avoid the deeper, central parts of the Scapa Flow during the February 2022 survey, where estimated density reduced to between 0 – 0.49 birds/km2 in these areas, whereas moderate densities (2 – 9.99 birds/km2) were observed across this area during the February 2023 survey. The lower and upper credible limits are mapped in Figure 40 and Figure 42.
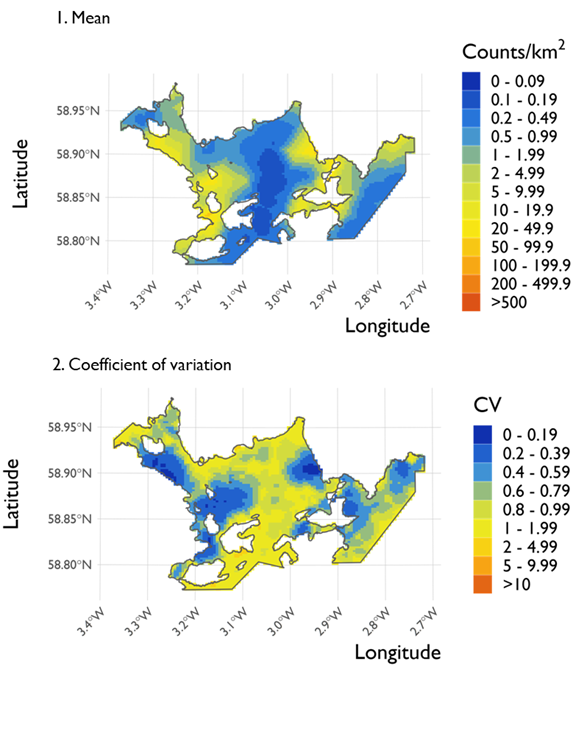
Figure 39. Two maps showing (1) the predicted density of long-tailed duck in the Scapa Flow SPA and (2) the coefficient of variation (CV) in these estimates across the SPA from the surveys conducted on 21 February 2022.
Click for a full description
Two maps of the Scapa Flow Special Protection Area organised vertically. Map 1 shows the predicted densities generated using Inlabru. The gradient used to indicate density estimates across the area goes from blue to green to yellow to red as values increase. The centre of the map shows density estimates of 0 – 0.09 counts/km2. Estimates increase towards the western edges of the site, with large areas of density estimates reaching 20 – 49.9 counts/km2. Towards the east of the site estimates gradually increase to 20 – 49.9 counts/km2 around coastlines before decreasing to 0.2 – 0.49 counts/km2 towards the site borders to the east of Burray and South Ronaldsay. The northern tips of the Special Protection Area also show higher density estimates of 10 – 19.9 counts/km2.
Map 2 shows the coefficient of variation associated with the density estimates shown in Map 1. The highest levels of variation are found in the centre of the Special Protection Area with values ranging from 0.6 – 1.99. There are areas of lower variation along the coastal fringes of the Special Protection Area with values ranging from 0 – 0.59.
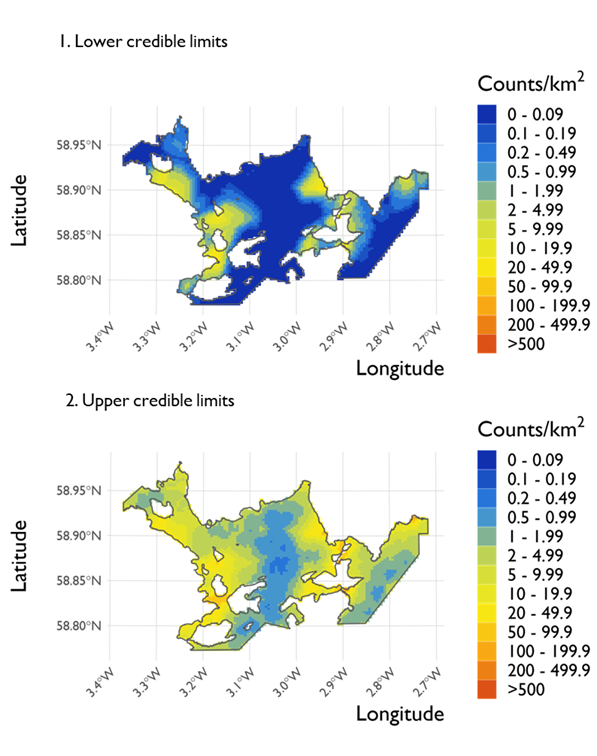
Figure 40. Two maps showing (1) the lower credible limits of density estimates for long-tailed duck at the Scapa Flow SPA and (2) the upper credible limits of these estimates across the SPA from the surveys conducted on 21 February 2022.
Click for a full description
Two maps of the Scapa Flow Special Protection Area organised vertically. The map 1 shows the lower credible limits of predicted densities generated using Inlabru. The gradient used to indicate density estimates across the area goes from blue to green to yellow to red as values increase. Lower estimates of 0 – 0.09 counts/km2 are shown along across the centre of the Special Protection Area from the north to south of the Special Protection Area, as well as along the eastern boundary of the site. Areas of higher densities reach High densities of 20 – 49.9 birds/km2 in the west of the Special Protection Area along the eastern shoreline of Hoy, and surrounding Burray, Lamb Holm, the Bay of Sandoyne and Sandisbrae in the east. The highest density of 50 – 99.9 birds/km2 was estimated near Ore Bay on the east coast of Hoy.
Map 2 shows the upper credible limits of the density estimates produced by Inlabru. Lower estimates are found in the centre of the Special Protection Area ranging from 0.2 – 0.99 counts/km2. Towards the west of the Special Protection Area density estimates increase to 20 – 49.9 counts/km2, with a peak of 50 – 99.9 counts/km2 in the south-west of the site. Towards the east, estimates increase to 20 – 49.9 counts/km2 before decreasing to 1 – 1.99 counts/km2.
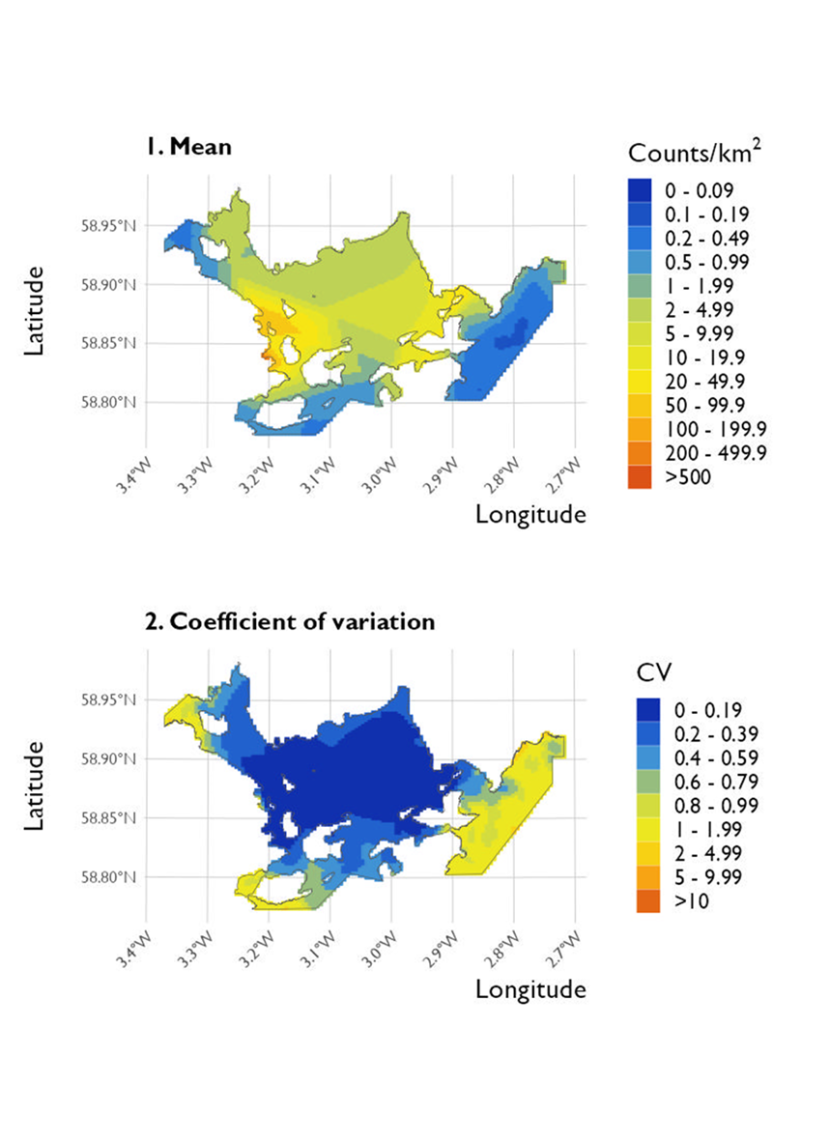
Figure 41. Two maps showing (1) the predicted density of long-tailed duck in the Scapa Flow SPA and (2) the coefficient of variation in these estimates across the SPA from the surveys conducted on 20 January 2023.
Click for a full description
Two maps of the Scapa Flow Special Protected Area organised vertically. Map 1 shows the predicted densities generated using Inlabru. The centre of the map has the highest density predictions, most of it ranging from 2 – 499.9 counts/km2, with one small hotspot on the west predicted to have density greater than 500 counts/km2. The east side, north-west and south of the site all have the lowest density, ranging from 0.1 – 0.99 counts/km2.
Map 2 shows the coefficient of variation associated with the mean densities shown in map 1. The centre of the map has the lowest variation of 0 – 0.59 counts/km2. This area corresponds to the high-density hotspots in map 1. The areas with highest variation correspond to the areas with low density shown in map 1 – these areas are the east side, north-west and south of the site. These areas have variation around 1 – 9.99 counts/km2.
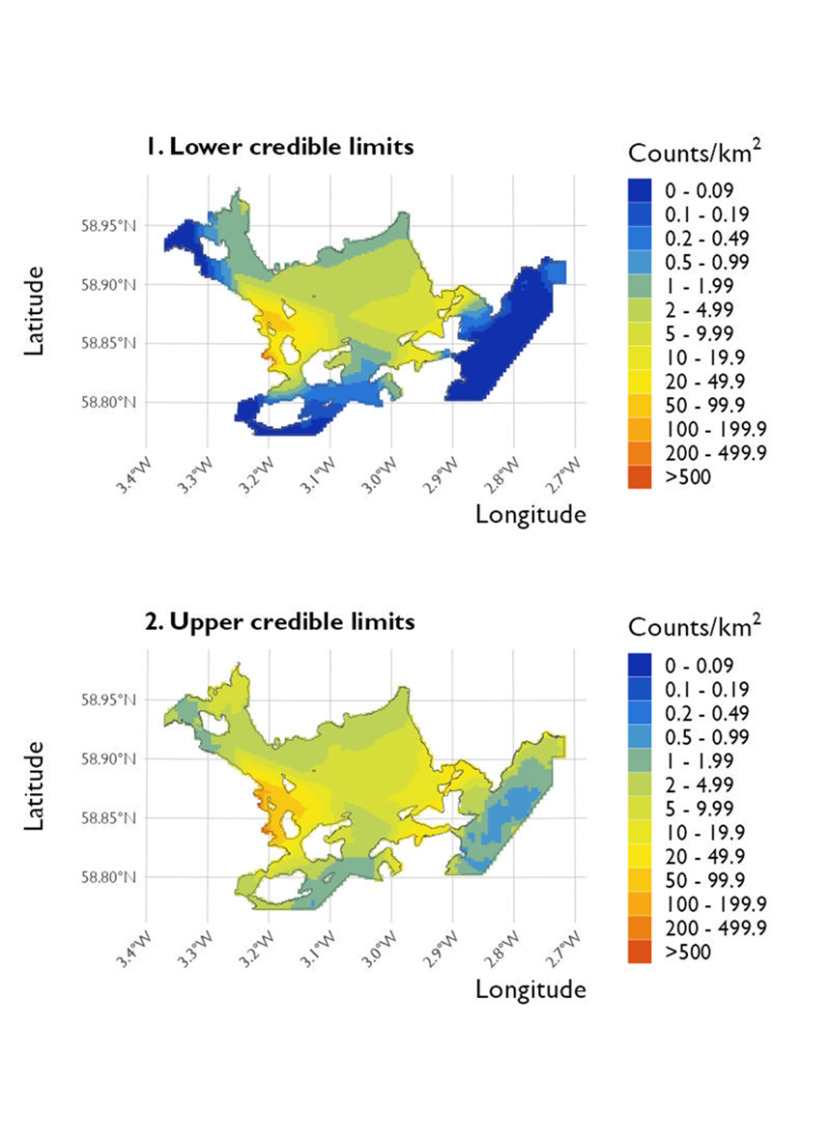
Figure 42. Two maps showing (1) the lower credible limits of density estimates for long-tailed duck at the Scapa Flow SPA and (2) the upper credible limits of these estimates across the SPA from the surveys conducted on 20 January 2023.
Click for a full description
Two maps of the Scapa Flow Special Protected Area organised vertically. Map 1 shows the lower credible limits of predicted densities generated using Inlabru. This map shows high density estimates in the centre, which range from 2 – 499.9 counts/km2. There is a small hotspot of high density on the west border of the map, where the estimates are 200 – 499.9 counts/km2. This is opposed to the east side, southern border, and north-west corner of the map, where the density predictions are between 0 – 0.09 counts/km2.
Map 2 shows the upper credible limits of density estimates, which are similar across most of the map. Almost all density estimates are between 0.2 – 499.9 counts/km2. The hotspot on the west is larger in map 2 than in map 1, and values exceed 500 counts/km2. The lowest density is on the east of the site, where density predictions are between 0.5 - 0.99 counts/km2.
Long-tailed duck were present in all monthly shore-based surveys throughout winter 2021/22 and 2022/23. The highest numbers occurred in December 2022 (265 birds), compared with a peak in the previous winter of 168 birds in January 2022. Total counts and mean percentage per sector are presented in Table 32 and Table 33 respectively for the winter 2021/22 and 2022/23 surveys. As with other species, birds were observed in all sectors except sector 37 across the winter 2021/22 surveys, and only three birds were observed in this sector across the winter 2022/23 surveys. The majority of winter observations occurred in sector 12 (Bay of Sandoyne) across both the 2021/22 (~48 % mean percentage occurrence) and 2022/23 (~57 % mean percentage occurrence) surveys.
The distribution of long-tailed duck across sectors 9 – 12 and 37 – 38 is presented in Figure 43 and Figure 44 respectively for the winter 2021/22 and winter 2022/23 surveys. Birds were present in varying flock size, generally along the shallowest inshore waters during the winter 2021/22 surveys, compared with slightly further offshore during the winter 2022/23 surveys.
| Sector | Nov ‘21 | Dec ‘21 | Jan ‘22 | Feb ‘22 | Mar ‘22 | Mean % |
|---|---|---|---|---|---|---|
| 9 | 34 | 41 | 45 | 8 | 33 | 29.31 % |
| 10 | 3 | 4 | 6 | 0 | 7 | 3.37 % |
| 11 | 4 | 0 | 7 | 2 | 0 | 2.74 % |
| 12 | 58 | 93 | 85 | 14 | 28 | 48.13 % |
| 37 | 0 | 0 | 0 | 0 | 0 | 0.00 % |
| 38 | 11 | 5 | 25 | 10 | 22 | 16.45 % |
| Total | 110 | 143 | 168 | 34 | 90 | 100.00 % |
| Sector | Nov ‘22 | Dec ‘22 | Jan ‘23 (survey 1) | Jan ’23 (survey 2) | Feb ‘23 | Mar ‘23 | Mean % |
|---|---|---|---|---|---|---|---|
| 9 | 29 | 26 | 5 | 20 | 10 | 16 | 18.39 % |
| 10 | 15 | 19 | 15 | 1 | 0 | 0 | 4.30 % |
| 11 | 7 | 10 | 3 | 4 | 0 | 0 | 3.59 % |
| 12 | 113 | 200 | 132 | 0 | 62 | 118 | 56.51 % |
| 37 | 0 | 0 | 0 | - | 0 | 3 | 0.40 % |
| 38 | 57 | 10 | 19 | 6 | 36 | 12 | 16.87 % |
| Total | 221 | 265 | 174 | 31 | 108 | 149 | 100.00 % |
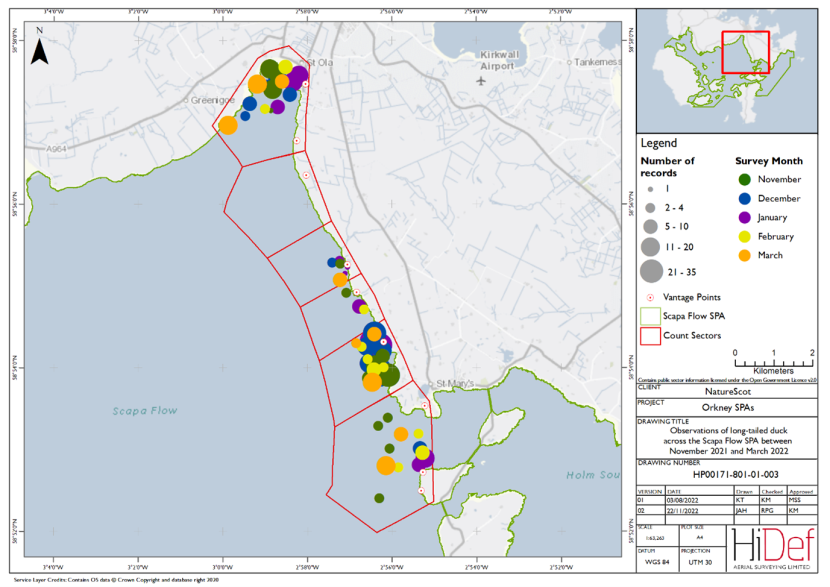
Figure 43. Shore-based observations of long-tailed duck within the Scapa Flow SPA sectors between November 2021 and March 2022.
Click for a full description
Map of shore-based observations of long-tailed duck in survey sectors at the Scapa Flow Special Protection Area during the winter 2021/22 shore-based surveys. Observations are represented by circles of increasing size relating to the number of birds seen, and different colours represent month. Long-tailed duck were present in all shore-based counts throughout winter 2021/2022, with the highest numbers occurring in January. Birds were observed in all sectors bar one, however the majority of observations occurred in the sector which covers the Bay of Sandoyne. The largest flock is 35 individuals approximately 300 m offshore in this sector in November.
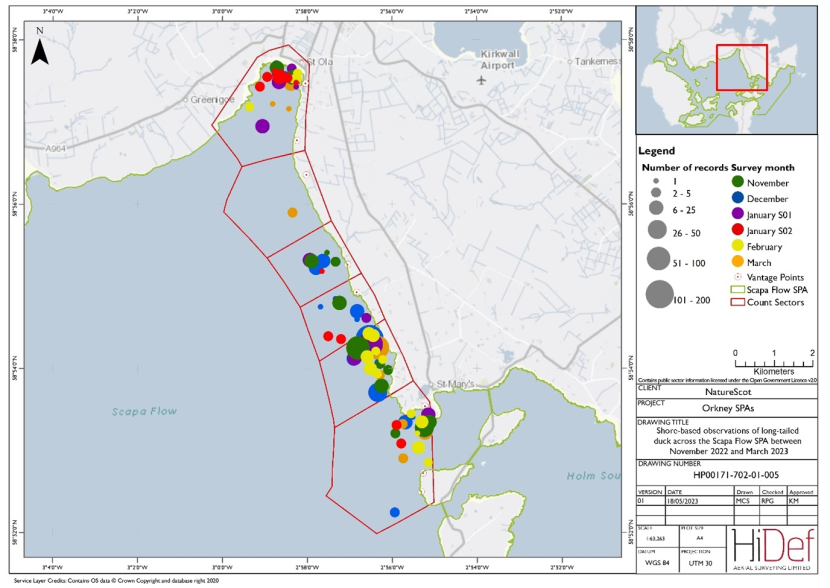
Figure 44. Shore-based observations of long-tailed duck within the Scapa Flow SPA sectors between November 2022 and March 2023
Click for a full description
Map of shore-based observations of long-tailed duck in survey sectors at the Scapa Flow Special Protected Area during the winter 2022/23 shore-based surveys. Observations are represented by circles of increasing size relating to the number of birds seen, and different colours represent month. The survey in sector 37 on 20 January 2023 was not completed due to difficulties with access. Large numbers of long-tailed duck were recorded throughout the winter 2022/23, with the highest numbers recorded in December 2022. Birds were observed in all sectors with most observations in the sector which covers the Bay of Sandoyne. The largest flock recorded was 200 individuals observed in December 2022 close to the shore.
Common eider
A total of 192 common eider were recorded in the February 2022 DAS, compared with 354 common eider during the January 2023 survey (Table 5 and Table 6). An additional 95 birds and 67 birds were identified as ‘duck sp.’ but could not be identified to species level in the February 2022 and January 2023 surveys respectively. The distribution of common eider is illustrated in Figure 45 and Figure 46. Birds were widely distributed along the shallow coastline waters surrounding the Scapa Flow SPA, with birds completely avoiding the central Scapa Flow in both surveys.
Design-based strip transect analysis of the February 2022 aerial survey data estimated the Scapa Flow SPA population at 581 birds (95 %CI 263 - 961) at the time of survey (Table 9), equating to a density of 1.82 birds/km2. In the January 2023 survey, the estimate was much higher at 1,456 birds (95 %CI 454 – 2,938). This compares to higher estimates, of 676 birds (95 % credible limits 534 - 824) during the February 2022 survey and 1,504 birds (95 % credible interval 1,322 – 1,706) during the January 2023 survey, estimated from model-based Bayesian point processing (Table 21).
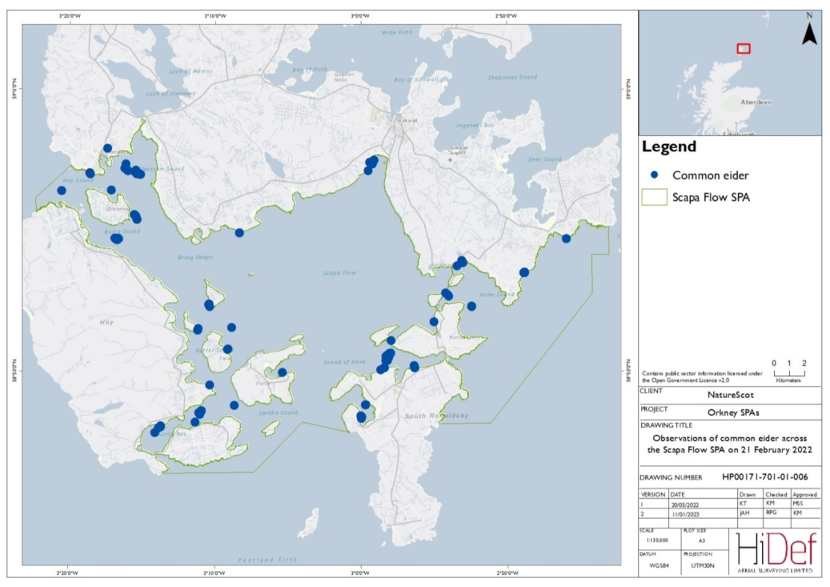
Figure 45. DAS observations of common eider within the Scapa Flow SPA on 21 February 2022.
Click for a full description
Map of Scapa Flow Special Protection Area with circles marking the locations of common eider that were observed during the aerial survey of 21 February 2022. There are 192 observations marked, and they are widely distributed along the shallow coastline waters surrounding the Scapa Flow SPA, with birds completely avoiding central Scapa Flow.
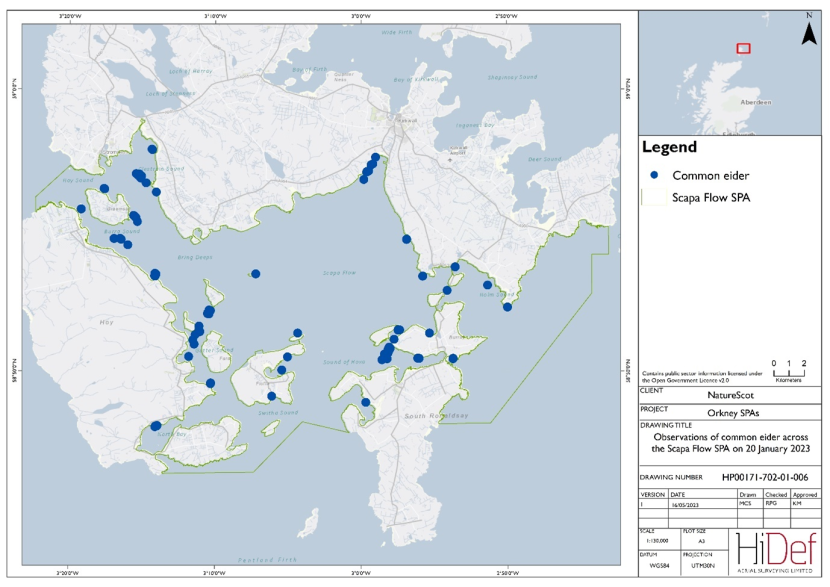
Figure 46. DAS observations of common eider within the Scapa Flow SPA on 20 January 2023.
Click for a full description
Map of Scapa Flow Special Protected Area with circles marking the locations of common eider that were observed during the 20 January 2023 DAS. There are 351 observations marked, and they are widely distributed along the shallow coastline waters surrounding the Scapa Flow SPA, with birds generally avoiding the central Scapa Flow.
The predicted mean density of common eider, alongside the CV, across the Scapa Flow SPA generated through Bayesian point processing is presented in Figure 47 and Figure 49 respectively for February 2022 and January 2023.
Bayesian analysis estimated birds at higher densities of between 2 – 49.9 birds/km2 in the west of the SPA around Graemsay and Hoy, and in the east, between South Ronaldsay and Burray, and around Lamb Holm in both surveys. In February 2022, the highest density of between 50 – 99.9 birds/km2 was estimated in inner Scapa Bay. In the January 2023 survey, birds were more evenly distributed across the SPA, although still with lower densities (0.1 – 0.99 birds/km2) in the deeper Scapa Flow waters and to the east of the SPA. The highest densities (between 2 – 49.9 birds/km2) of common eider were observed along the coast and towards the west of the SPA, with low densities (0 – 0.19 birds/km2) in the deeper waters in the middle and towards the east of Scapa Flow observed in both surveys. The lower and upper credible limits are mapped in Figure 48 and Figure 50.
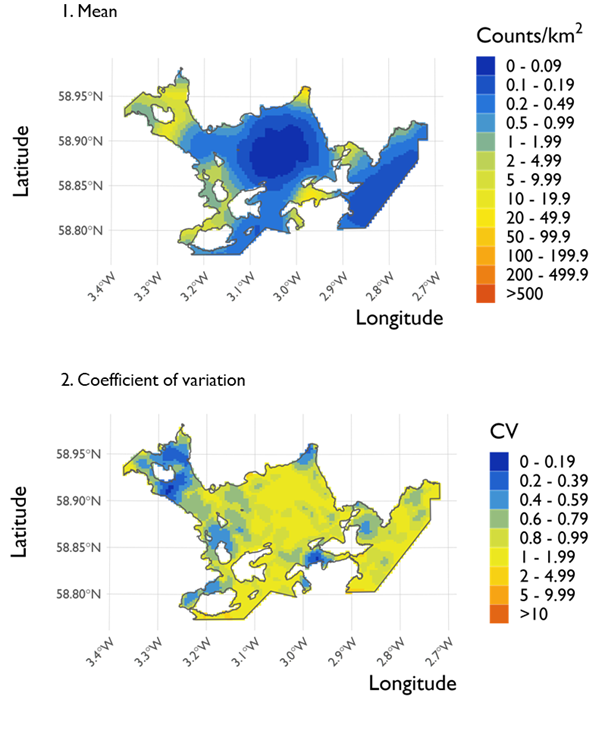
Figure 47. Two maps showing (1) the predicted density of common eider in the Scapa Flow SPA and (2) the coefficient of variation (CV) in these estimates across the SPA from the surveys conducted on 21 February 2022.
Click for a full description
Two maps of the Scapa Flow Special Protection Area organised vertically. Map 1 shows the predicted densities generated using Inlabru. The gradient used to indicate density estimates across the area goes from blue to green to yellow to red as values increase. The lowest densities occur in the centre of the map with values of 0 – 0.09 counts/km2. As you move towards the north-west and west side of the map densities increase to a maximum of 20 – 49.9 counts/km2. The highest density of 50 – 99.9 counts/km2 were observed in Scapa Bay in the north of the SPA. Other areas of high densities occur towards the north and to the east of the low-density centre area. At the southern and eastern edges of the Special Protection Area, low densities are recorded with 0.1 – 0.19 and 0 – 0.09 counts/km2 respectively.
Map 2 shows the coefficient of variation associated with the density estimates in Map 1. The majority of the Special Protection Area shows variation ranging from 0.6 – 1.99. There are areas with less variation scattered throughout the Special Protection Area with the largest around Graemsay in the north-west with values of 0 – 0.19.
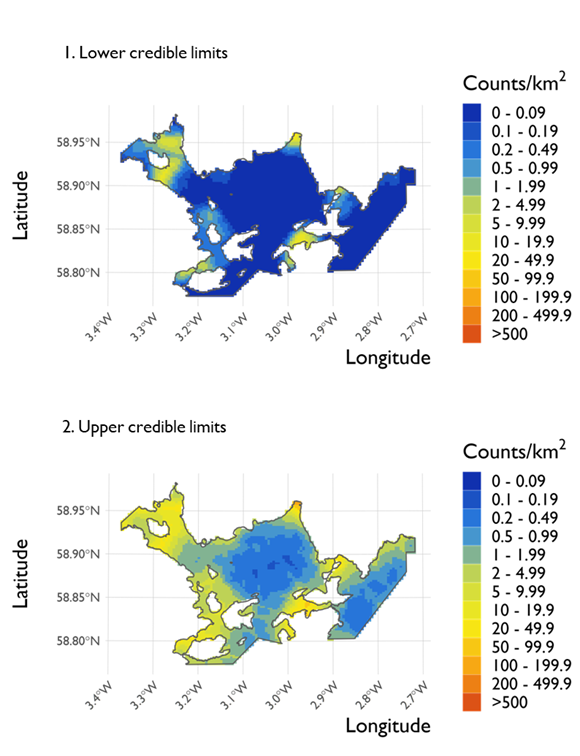
Figure 48. Two maps showing (1) the lower credible limits of density estimates for common eider at the Scapa Flow SPA and (2) the upper credible limits of these estimates across the SPA from the surveys conducted on 21 February 2022.
Click for a full description
Two maps of the Scapa Flow Special Protection Area organised vertically. The map 1 shows the lower credible limits of predicted densities generated using Inlabru. The gradient used to indicate density estimates across the area goes from blue to green to yellow to red as values increase. The majority of the Special Protection Area has a lower credible limits of 0 – 0.09 counts/km2. Areas of higher density occur across the site close to the borders reporting densities of 0.5 – 19.9 counts/km2. The largest of these areas occurs at the north-west of the site.
Map 2 shows the upper credible limits of common eiders at the Scapa Flow Special Protection Area. A low density area occurs in the centre of Special Protection Area with the majority reporting densities of 0.2 – 0.49 counts/km2 with three small areas of 0.1 – 0.19 counts/km2. Another area of low common eider density occurs to the eastern edge of the site. Along the southern coastal fringes of the site and between the two areas of low densities, higher densities are reported, varying from 1 – 49.9 counts/km2. The highest density in the site is 50 – 99.9 counts/km2 occurring in inner Scapa Bay.
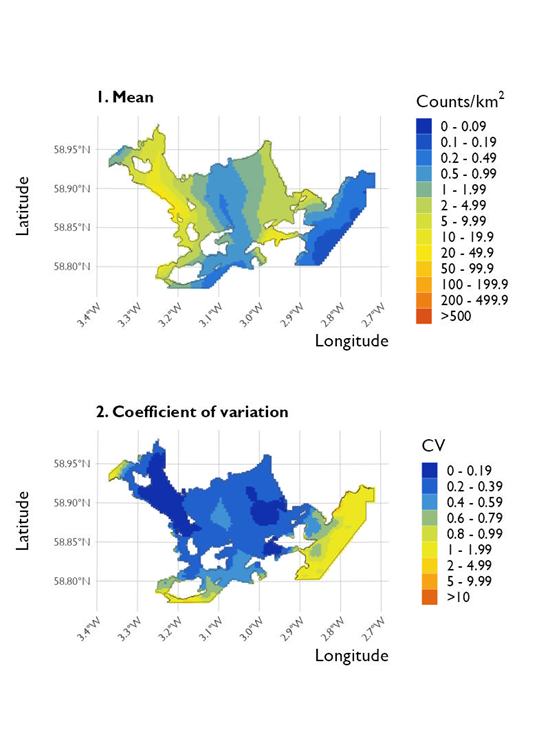
Figure 49. Two maps showing (1) the predicted density of common eider in the Scapa Flow SPA and (2) the coefficient of variation in these estimates across the SPA from the surveys conducted on 20 January 2023.
Click for a full description
Two maps of the Scapa Flow Special Protected Area organised vertically. Map 1 shows the predicted densities generated using Inlabru. The centre of the map shows densities around 0.1 – 0.49 counts/km2, and these areas are surrounded by higher density predictions of 2 – 49.9 counts/km2 on the west and towards the east. However, the far east has the lowest density of around 0 – 0.19 counts/km2.
Map 2 shows the coefficient of variation associated with the mean densities shown in map 1. Most of the map shows variance with values between 0 – 0.59 counts/km2. The lowest variance of 0 – 0.19 counts/km2 can be found the north-west and towards the east, corresponding to the higher density predictions shown in map 1. The far east, far west and the southernmost border show higher variance of between 1- 4.99 counts/km2, which correspond to lower density estimates from map 1.
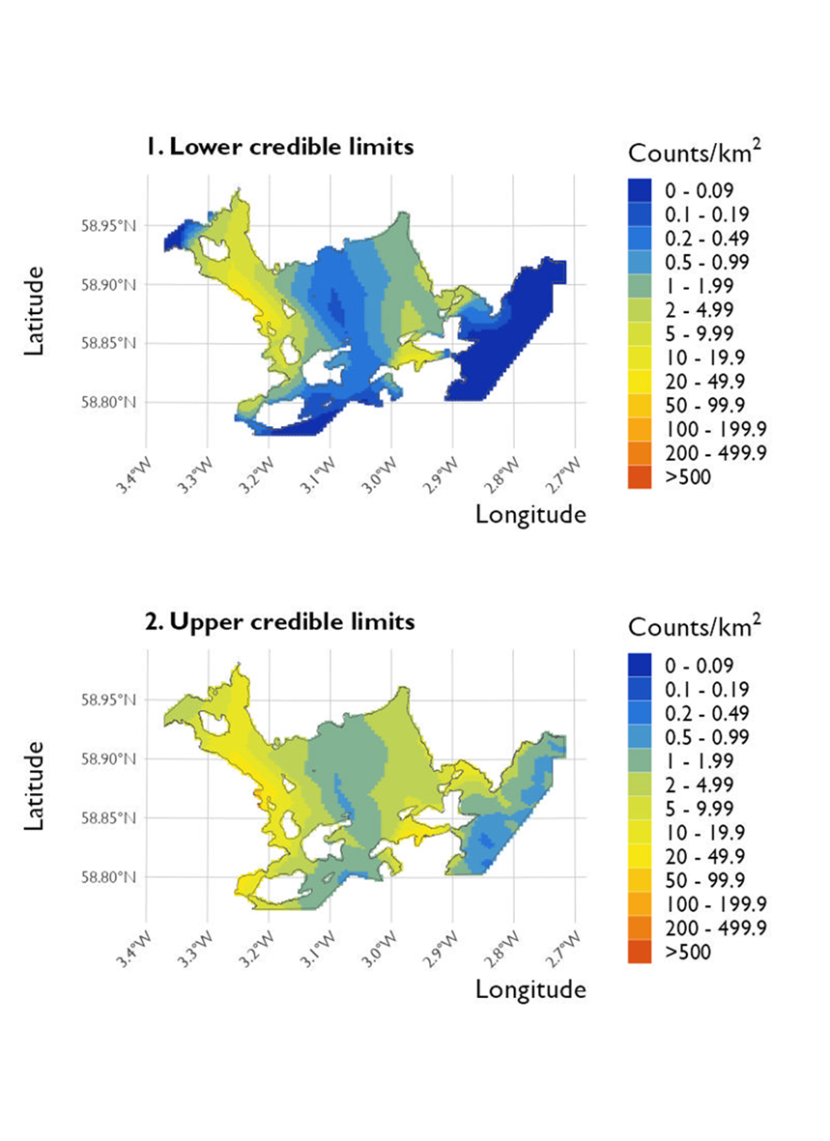
Figure 50. Two maps showing (1) the lower credible limits of density estimates for common eider at the Scapa Flow SPA and (2) the upper credible limits of these estimates across the SPA from the surveys conducted on 20 January 2023.
Click for a full description
Two maps of the Scapa Flow Special Protected Area organised vertically. The map 1 shows the lower credible limits of predicted densities generated using Inlabru. The map shows a variety of densities, ranging from 0 – 49.9 counts/km2. The areas of highest density are located in the west and just east of the centre of the map. These areas have density ranging from 1 – 49.9 counts/km2. The areas with the lowest density of 0 – 0.09 counts/km2 are found in the far east, north-eastern corner and the southernmost border of the site.
Map 2 shows the upper credible limits of density estimates, with the centre and far eastern side of the site having the lowest density, which ranges between 0 – 0.09 counts/km2. There are several areas of higher density, mostly to the west and just east of the centre. These areas have density ranging from 1 - 99.9 counts/km2. The most significant area of high density occurs along the western border, with predictions reaching 50 - 99.9 counts/km2.
Common eider were present in all monthly shore-based surveys throughout both the winter 2021/22 and winter 2022/23 surveys, with the highest numbers occurring in January for both seasons (2022: 100 birds; 2023:107 birds). Total counts and mean percentage per sector are presented in Table 34 and Table 35 respectively. As with other species, birds were observed in all sectors except sector 37 across the winter 2021/22 surveys, and only one bird was observed in this sector across the winter 2022/23 surveys. In both winter periods, most observations (calculated as mean percentage occurrence) occurred in sector 12 (Bay of Sandoyne; 2022: ~31 %; 2023 ~30 %) and sector 38 (St. Mary’s Bay; 2022: ~26 %; 2023: ~38 %), in addition to sector 9 (inner Scapa Bay; 2022: ~33 %), during the winter 2021/22 surveys.
The distribution of common eider across sectors 9 – 12 and 37 – 38 is presented in Figure 51 and Figure 52 respectively for the winter 2021/22 and winter 2022/23 surveys. Birds were present in varying flock sizes generally along the shallowest inshore waters during the winter 2021/22 surveys, compared with slightly further offshore during the winter 2022/23 surveys.
| Sector | Nov ‘21 | Dec ‘21 | Jan ‘22 | Feb ‘22 | Mar ‘22 | Mean % |
|---|---|---|---|---|---|---|
| 9 | 23 | 22 | 17 | 8 | 27 | 32.73 % |
| 10 | 4 | 0 | 1 | 0 | 0 | 1.51 % |
| 11 | 5 | 0 | 26 | 3 | 0 | 8.98 % |
| 12 | 23 | 19 | 30 | 9 | 14 | 30.64 % |
| 37 | 0 | 0 | 0 | 0 | 0 | 0.00 % |
| 38 | 6 | 24 | 26 | 8 | 17 | 26.13 % |
| Total | 61 | 65 | 100 | 28 | 58 | 100.00 % |
| Sector | Nov ‘22 | Dec ‘22 | Jan ‘23 (survey 1) | Jan ’23 (survey 2) | Feb ‘23 | Mar ‘23 | Mean % |
|---|---|---|---|---|---|---|---|
| 9 | 2 | 10 | 5 | 5 | 4 | 9 | 13.35 % |
| 10 | 18 | 0 | 40 | 5 | 0 | 1 | 17.44 % |
| 11 | 0 | 0 | 0 | 2 | 0 | 0 | 1.39 % |
| 12 | 6 | 10 | 48 | 3 | 1 | 56 | 29.95 % |
| 37 | 0 | 0 | 0 | - | 0 | 1 | 0.29 % |
| 38 | 14 | 24 | 14 | 9 | 24 | 2 | 37.63 % |
| Total | 40 | 44 | 107 | 24 | 29 | 69 | 100.00 % |
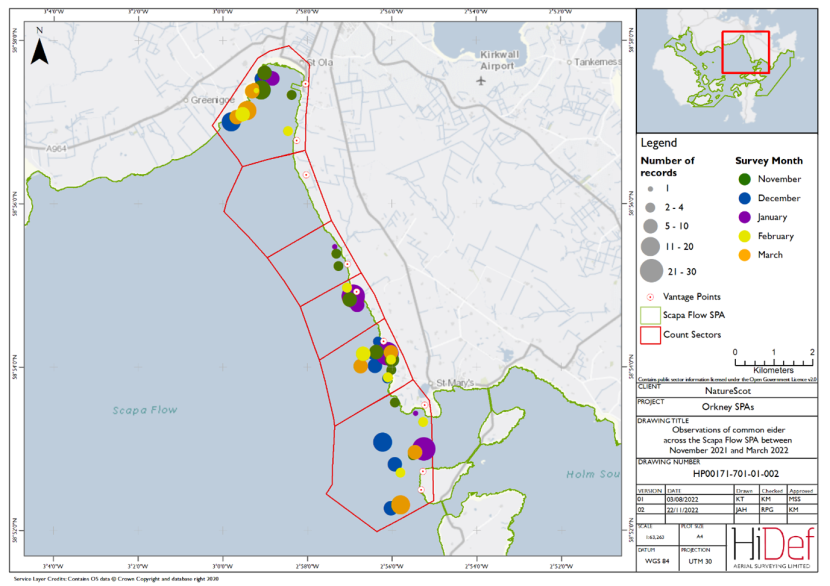
Figure 51. Shore-based observations of common eider within the Scapa Flow SPA sectors between November 2021 and March 2022.
Click for a full description
Map of shore-based observations of common eider in survey sectors at the Scapa Flow Special Protection Area during the winter 2021/22 shore-based surveys. Observations are represented by circles of increasing size relating to the number of birds seen, while colours are used to differentiate months. Birds are present in varying flock sizes, up to 30 birds in size, and throughout the winter months in all but one sector.
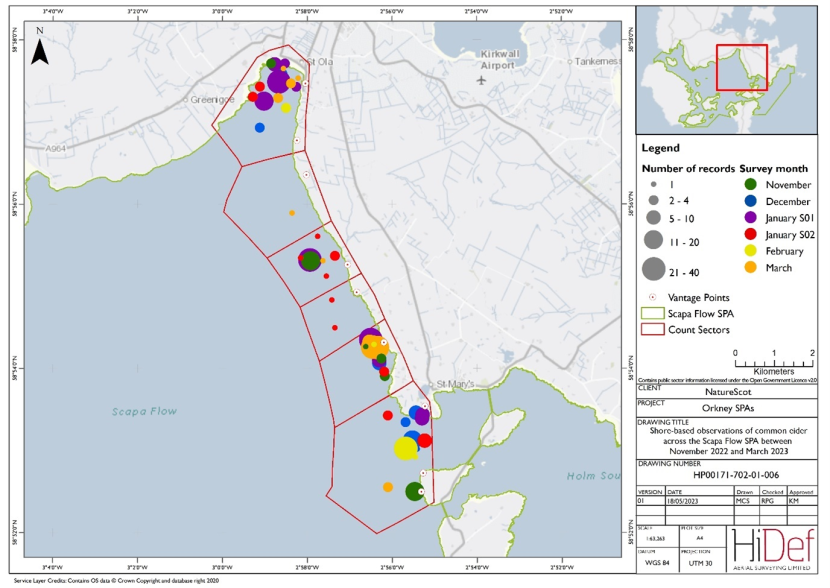
Figure 52. Shore-based observations of common eider within the Scapa Flow SPA sectors between November 2022 and March 2023
Click for a full description
Map of shore-based observations of common eider in survey sectors at the Scapa Flow Special Protected Area during the winter 2022/23 shore-based surveys. Observations are represented by circles of increasing size relating to the number of birds seen, while colours are used to differentiate months. The survey in sector 37 on 20 January 2023 was not completed due to difficulties with access. Birds were present in varying numbers with the highest number of birds recorded on 20 January 2023. The largest flock was recorded in March 2023 with 56 birds present. Birds were recorded in the highest densities in the Scapa Bay, and the inshore waters in the southernmost sectors.
European shag
Many more European shag were observed in the January 2023 DAS (198 birds) compared with February 2022 (40 birds) (Table 5 and Table 6). The distribution of European shag is illustrated in Figure 53 and Figure 54 respectively for the February 2022 and January 2023 surveys. Birds were widely distributed along the coastlines primarily in the east, south and west of the Scapa Flow SPA, with birds avoiding the north and central Scapa Flow in both surveys.
Design-based strip transect analysis of the aerial survey data estimated the Scapa Flow SPA population at 130 birds (95 %CI 58 - 227) at the time of the February 2022 survey, compared with 764 birds (95 %CI 253 – 1,416) during the January 2023 survey (Table 9), equating to densities of 0.41 birds/km2 and 2.31 birds/km2 respectively. Model-based Bayesian point processing resulted in similar estimates during the February 2022 survey (134 birds; 95 % credible limits 88 - 193), and slightly higher estimates during the January 2023 survey (872 birds; 95 % credible limits 597 – 1,560), as presented in Table 21. It should be noted that observations were trimmed to the marine SPA boundary to derive both the design-based and model-based population estimates. European shags frequently roost and wing-dry onshore or on skerries and tidally exposed rocks. As such, roosting birds that fall beyond this SPA boundary (i.e. above MLWS) are not included in such estimates.

Figure 53. DAS observations of European shag within the Scapa Flow SPA on 21 February 2022.
Click for a full description
Map of Scapa Flow Special Protection Area with circles marking the locations of European shag that were observed during the aerial survey of 21 February 2022. There are 40 observations marked, and they are widely distributed along the coastlines in the east, south and west of the Scapa Flow Special Protection Area, with birds avoiding the north and central Scapa Flow.
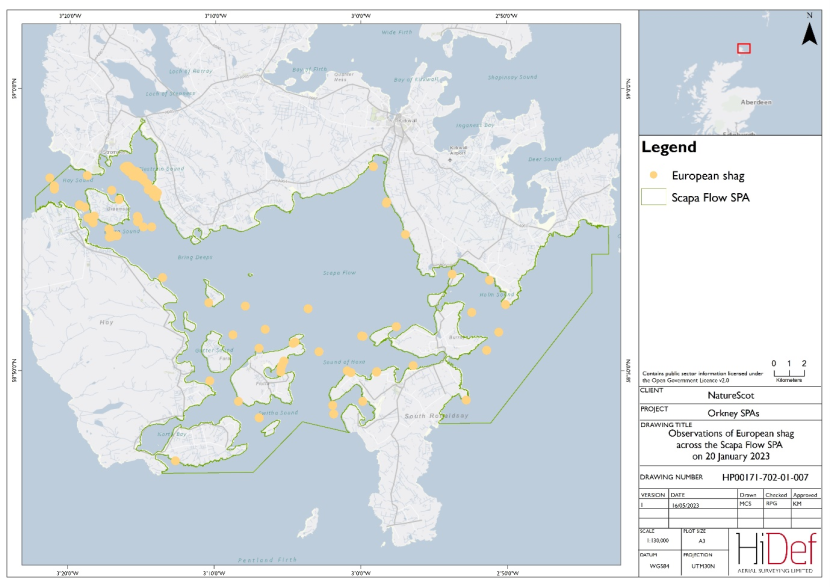
Figure 54. DAS observations of European shag within the Scapa Flow SPA on 20 January 2023.
Click for a full description
Map of Scapa Flow Special Protected Area with circles marking the locations of European shag that were observed during the 20 January 2023 DAS. There are 184 observations marked, distributed throughout the nearshore waters of the Scapa Flow Species Protected Area with high numbers recorded within the Burra and Clestrain Sound.
The predicted mean density of European shag, alongside the CV, across the Scapa Flow SPA generated through Bayesian point processing is presented in Figure 55 and Figure 57 respectively for the February 2022 and January 2023 surveys. Bayesian analysis estimated birds at a uniform mean density of 0.2 – 0.99 birds/km2 across much of the SPA in the February 2022 survey. Much higher densities of up to 20 – 49.9 birds/km2 were observed around the edges of Scapa Flow and nearshore waters in January 2023 most notably around Graemsay and between Burray and South Ronaldsay. The lower and upper credible limits are mapped in Figure 56 and Figure 58 respectively for the February 2022 and January 2023 surveys.
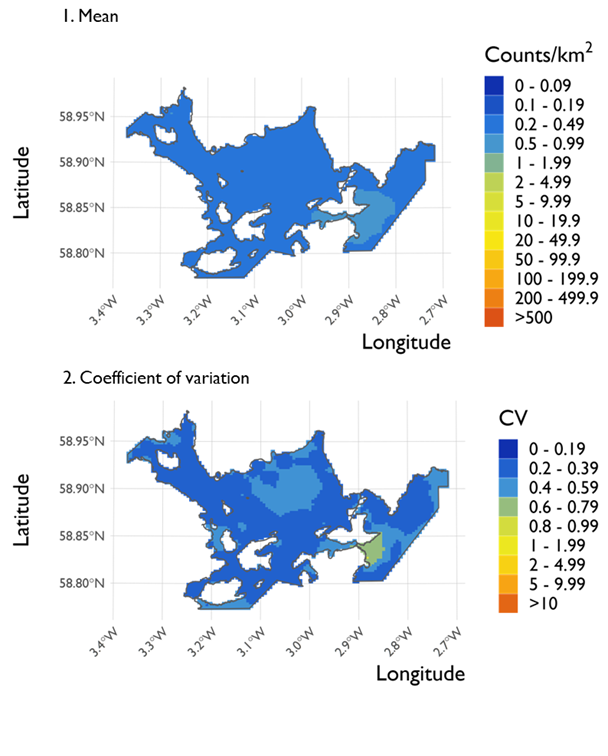
Figure 55. Two maps showing (1) the predicted density of European shag in the Scapa Flow SPA and (2) the coefficient of variation in (CV) these estimates across the SPA from the surveys conducted on 21 February 2022.
Click for a full description
Two maps of the Scapa Flow Special Protection Area organised vertically. Map 1 shows the predicted densities generated using Inlabru. The gradient used to indicate density estimates across the area goes from blue to green to yellow to red as values increase. The majority of the Special Protection Area has a mean European shag density of 0.2 – 0.49 counts/km3. There is on area of higher density to the south-east of the site with densities of 0.5 -0.99 counts/km3.
The coefficient of variation associated with the mean densities is shown in Map 2. The majority of the site shows variation of 0.2 – 0.39. There are patches with values of 0.4 -0.59 across the site, with the largest occurring to the north of the site. The largest variance occurs in the south-east of the Special Protection Area with values of 0.6 – 0.79.
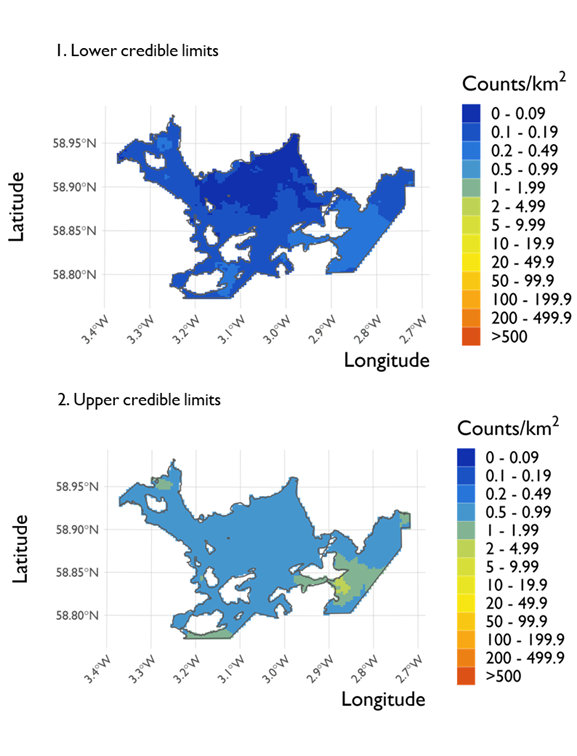
Figure 56. Two maps showing (1) the lower credible limits of density estimates for European shag at the Scapa Flow SPA and (2) the upper credible limits of these estimates across the SPA from the surveys conducted on 21 February 2022.
Click for a full description
Two maps of the Scapa Flow Special Protection Area organised vertically. The map 1 shows the lower credible limits of predicted densities generated using Inlabru. The densities across the site vary from 0 – 0.99 counts/km3. The highest densities of 0.5 -0.99 counts/km3 are reported in the south-east of the site, as well as in smaller patches in the south and north-west of the Special Protection Area.
Map 2 shows the upper credible limits of density estimates. The majority of the site records densities of 0.5 -0.99 counts/km2. The highest densities of 2 – 4.99 counts/km2 recorded occur in the south-east with other high-density areas of 1 – 1.99 counts/km2 occurring in the north-east, south and north-west of the site.
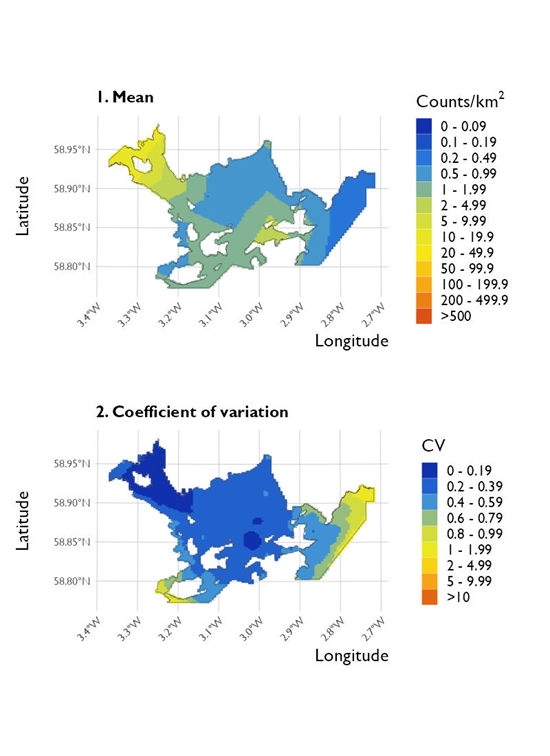
Figure 57. Two maps showing (1) the predicted density of European shag in the Scapa Flow SPA and (2) the coefficient of variation in these estimates across the SPA from the surveys conducted on 20 January 2023.
Click for a full description
Two maps of the Scapa Flow Special Protected Area organised vertically. Map 1 shows the predicted densities generated using Inlabru. The north and east have the lowest density predictions of around 0.2 – 0.99 counts/km2. The south of the site shows densities between 1 – 4.99 counts/km2, whereas the north-west have the highest estimates in the range 10 – 49.9 counts/km2.
Map 2 shows the coefficient of variation associated with the mean densities shown in map 1. The north-west has the lowest variation of 0 – 0.19, which corresponds to the highest density in map 1. The centre of the map also has low variation between 0.2 – 0.39. The highest variation is found in the east and south of the site, where it reaches values in the range 0.8 – 1.99.
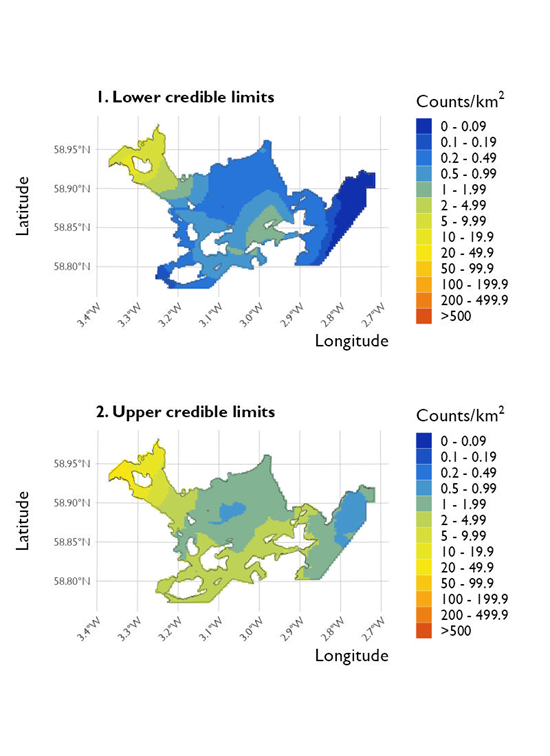
Figure 58. Two maps showing (1) the lower credible limits of density estimates for European shag at the Scapa Flow SPA and (2) the upper credible limits of these estimates across the SPA from the surveys conducted on 20 January 2023.
Click for a full description
Two maps of the Scapa Flow Special Protected Area organised vertically. Map 1 shows the predicted densities generated using Inlabru. The north and east have the lowest density predictions of around 0.2 – 0.99 counts/km2. The south of the site shows densities between 1 – 4.99 counts/km2, whereas the north-west have the highest estimates in the range 10 – 49.9 counts/km2.
Map 2 shows the coefficient of variation associated with the mean densities shown in map 1. The north-west has the lowest variation of 0 – 0.19 counts/km2, which corresponds to the highest density in map 1. The centre of the map also has low variation between 0.2 – 0.39 counts/km2. The highest variation is found in the east and south of the site, where it reaches values in the range 0.8 – 1.99 counts/km2.
European shag were present in all shore-based counts throughout winter 2021/22 and winter 2022/23 surveys. During the winter 2021/22 surveys, relatively consistent numbers were observed, ranging between 31 - 53 birds, whereas between five (March) and 57 (February) birds were observed during the winter 2022/23 surveys. Total counts and mean percentage per sector are presented in Table 36 and Table 37 respectively for the winter 2021/22 and 2022/23 surveys. Birds were found in all sectors, with relatively even mean occurrence during the winter 2021/22 surveys, whilst more variation was observed between in the winter 2022/23 surveys. Sector 38 (St. Mary’s Bay) had the highest mean percentage occurrence for both surveys, with ~24 % and ~53 % in the winter 2021/22 and 2022/23 surveys, respectively.
The distribution of European shag across sectors 9 – 12 and 37 – 38 is presented in Figure 59 and Figure 60 respectively for the winter 2021/22 and winter 2022/23 surveys. More birds were observed along the shallowest inshore waters during the winter 2021/22 surveys, compared with slightly further offshore during the winter 2022/23 surveys.
| Sector | Nov ‘21 | Dec ‘21 | Jan ‘22 | Feb ‘22 | Mar ‘22 | Mean % |
|---|---|---|---|---|---|---|
| 9 | 5 | 17 | 0 | 5 | 7 | 15.37 % |
| 10 | 4 | 7 | 3 | 3 | 5 | 10.02 % |
| 11 | 2 | 5 | 24 | 2 | 8 | 17.62 % |
| 12 | 15 | 7 | 10 | 5 | 7 | 19.60 % |
| 37 | 3 | 8 | 2 | 6 | 8 | 13.11 % |
| 38 | 20 | 9 | 12 | 10 | 3 | 24.30 % |
| Total | 49 | 53 | 51 | 31 | 38 | 100.00 % |
| Sector | Nov ‘22 | Dec ‘22 | Jan ‘23 (survey 1) | Jan ’23 (survey 2) | Feb ‘23 | Mar ‘23 | Mean % |
|---|---|---|---|---|---|---|---|
| 9 | 1 | 4 | 0 | 19 | 1 | 0 | 14.80 % |
| 10 | 0 | 3 | 0 | 6 | 0 | 0 | 6.07 % |
| 11 | 4 | 0 | 0 | 2 | 3 | 1 | 8.03 % |
| 12 | 14 | 3 | 0 | 0 | 1 | 1 | 16.29 % |
| 37 | 0 | 2 | 0 | - | 0 | 0 | 2.35 % |
| 38 | 5 | 5 | 19 | 5 | 52 | 3 | 52.85 % |
| Total | 24 | 17 | 19 | 32 | 57 | 5 | 100.00 % |
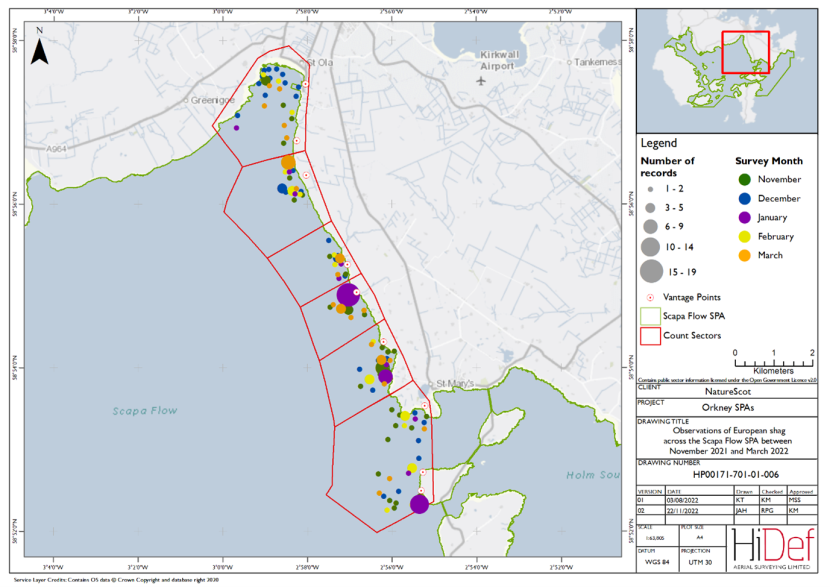
Figure 59. Shore-based observations of European shag within the Scapa Flow SPA sectors between November 2021 and March 2022.
Click for a full description
Map of shore-based observations of European shag in survey sectors at the Scapa Flow Special Protection Area during the winter 2021/22 shore-based surveys. Observations are represented by circles of increasing size relating to the number of birds seen, while colours are used to differentiate months. Birds are present in all sectors and in varying flock sizes, up to 19 birds in size. In comparison to the other bird species surveyed there are more single or pairs of European shag.
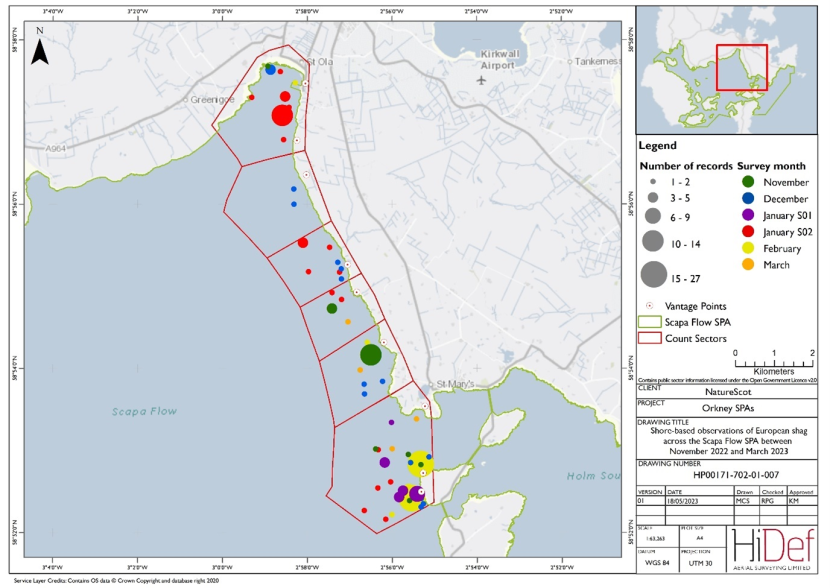
Figure 60. Shore-based observations of European shag within the Scapa Flow SPA sectors between November 2022 and March 2023.
Click for a full description
Map of shore-based observations of European shag in survey sectors at the Scapa Flow Special Protected Area in the winter 2022/23 shore-based surveys. Observations are represented by circles of increasing size relating to the number of birds seen, while colours are used to differentiate months. The survey in sector 37 on 20 January 2023 was not completed due to difficulties with access. Birds were present in all sectors and in varying flock sizes, with the largest flock of 52 birds recorded in February 2023 on the north and east coast of Glimps Holm in the most southern sector.
Non-target species
A number of non-target species were recorded in the DAS of Scapa Flow SPA (Table 5; Table 6), the distributions of which are presented in Figure 61 for the February 2022 survey, and Figure 62 for the January 2023 survey.
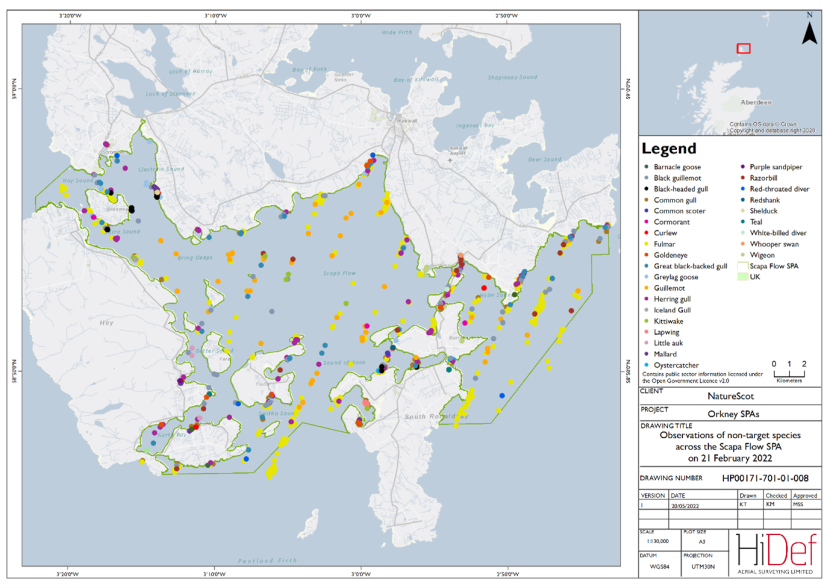
Figure 61. DAS observations of non-target species within the Scapa Flow SPA on 21 February 2022.
Click for a full description
Map of the Scapa Flow Special Protection Area with coloured points marking the location of non-target species observed from footage of the aerial survey taken on 21 February 2022. The non-target species observed are:
- Barnacle goose
- Black guillemot
- Black-headed gull
- Common gull
- Common scoter
- Cormorant
- Curlew
- Fulmar
- Goldeneye
- Great black-backed gull
- Greylag goose
- Guillemot
- Herring gull
- Iceland gull
- Kittiwake
- Lapwing
- Little auk
- Mallard
- Oystercatcher
- Purple sandpiper
- Razorbill
- Red-throated diver
- Redshank
- Shelduck
- Teal
- White-billed diver
- Whooper swan
- Wigeon
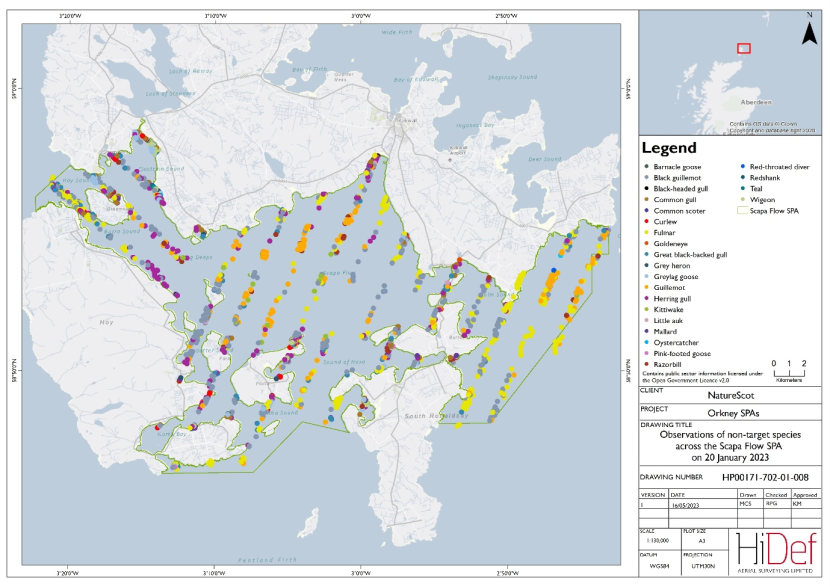
Figure 62. DAS observations of non-target species within the Scapa Flow SPA on 20 January 2023
Click for a full description
Map of the Scapa Flow Special Protected Area with coloured points marking the location of non-target species observed from footage of the aerial survey taken on 20 January 2023. The non-target species observed are:
- Barnacle goose
- Black guillemot
- Black-headed gull
- Common gull
- Common scoter
- Curlew
- Fulmar
- Goldeneye
- Great black-backed gull
- Grey heron
- Greylag goose
- Guillemot
- Herring gull
- Kittiwake
- Little auk
- Mallard
- Oystercatcher
- Pink-footed goose
- Razorbill
- Red-throated diver
- Redshank
- Teal
- Wigeon
North Orkney SPA
Great northern diver
A total of 28 great northern diver were recorded in the February 2022 DAS, compared with 45 birds in the January 2023 survey (Table 5 and Table 6). An additional seven birds were identified as ‘diver sp.’ but could not be identified to species level in each survey. The distribution of great-northern diver is illustrated in Figure 63 and Figure 64 respectively for the February 2022 and January 2023 surveys. Birds were predominantly distributed on the northeast and southeast of North Orkney SPA during the February 2022 survey and were distributed across the SPA during the January 2023 survey.
Design-based strip transect analysis of the February 2022 aerial survey data estimated the North Orkney SPA population at 79 birds (95 %CI 30 – 140) at the time of survey (Table 15), equating to a density of 0.37 birds/km2. A higher abundance of 191 birds (95 %CI 105 – 300; Table 15) was estimated during the January 2023 survey, equating to a density of 0.84 birds/km2. This compares to similar estimates from Bayesian point processing of 76 birds (95 % credible limits 43 – 122) during the February 2022 survey, and 208 birds (95 % credible interval 145 – 282) during the January 2023 survey (Table 22).
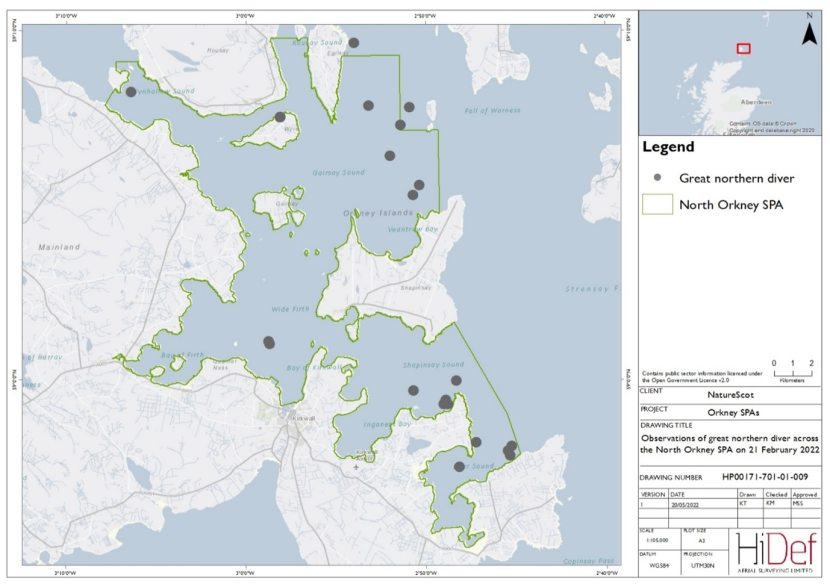
Figure 63. DAS observations of great northern diver within the North Orkney SPA on 21 February 2022.
Click for a full description
Map North Orkney Special Protection Area with circles marking the locations of great northern divers that were observed during the aerial survey of 21 February 2022. There are 28 observations marked, predominantly distributed in the northeast and southeast of North Orkney Special Protection Area.
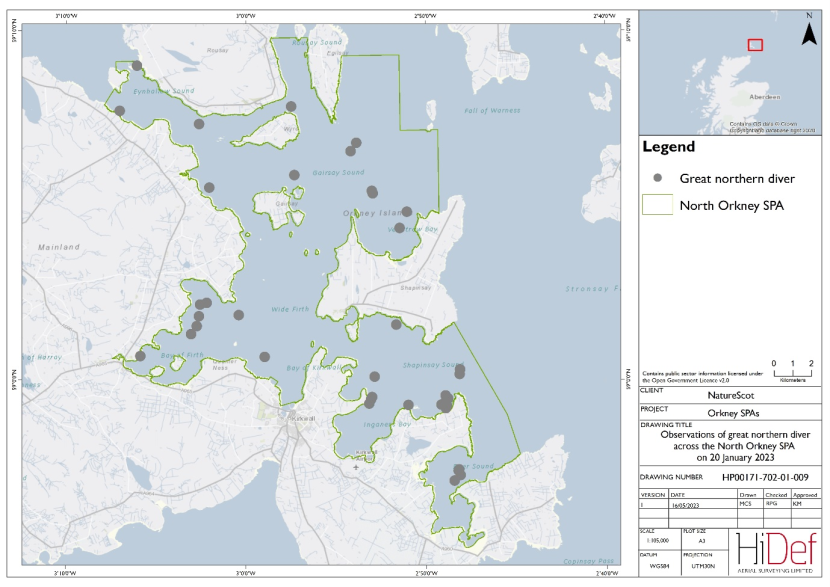
Figure 64. DAS observations of great northern diver within the North Orkney SPA on 20 January 2023.
Click for a full description
Map North Orkney Special Protected Area with circles marking the locations of great northern divers that were observed during the aerial survey of 20 January 2023. There are 45 observations marked, predominantly distributed on the southeast of North Orkney Special Protected Area.
The predicted mean density of great northern diver alongside the CV in these estimates, generated through model-based Bayesian point processing, is presented in Figure 65 for the February 2022 survey and in Figure 67 for the January 2023 survey. The highest densities (1 - 1.99 birds/km2 in February 2022; 10 – 19.9 in January 2023) were recorded around Rerwick Head, in the southeast of the SPA in both surveys, in addition to around the Bay of Firth in the January 2023 survey. The rest of the SPA is predominantly estimated to have had low densities of birds of 0.1 - 0.49 birds/km2 in the February 2022 survey and 0.5 – 0.99 birds/km2 during the January 2023 survey. Slightly higher densities of 1 – 1.99 birds/km2 were also estimated in the deeper waters in the north of the SPA in the January 2023 survey, which were not observed in the February 2022 surveys. The lower and upper credible limits are mapped in Figure 66 for the February 2022 survey and Figure 68 for the January 2023 survey.
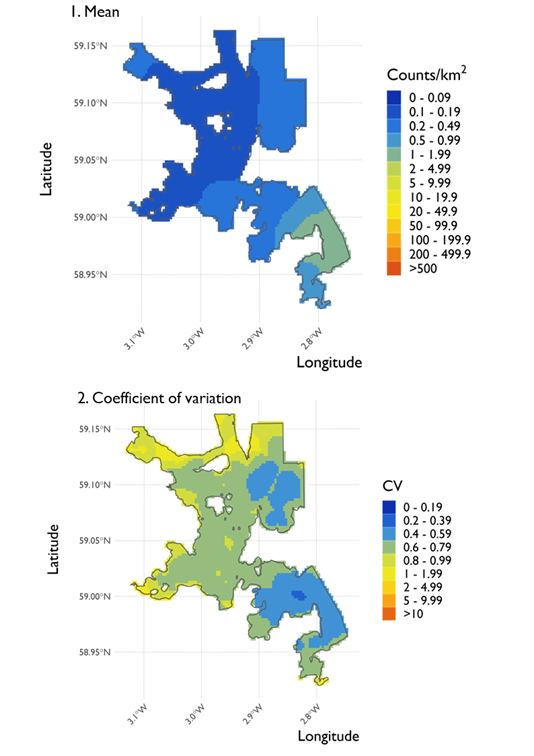
Figure 65. Two maps showing (1) the predicted density of great northern diver at the North Orkney SPA and (2) the coefficient of variation (CV) in these estimates across the SPA from the surveys conducted on 21 February 2022.
Click for a full description
Two maps of the North Orkney Special Protection Area organised vertically. Map 1 shows the predicted densities generated using Inlabru. The gradient used to indicate density estimates across the area goes from blue to green to yellow to red as values increase. The highest densities can be found in the south-east of the Special Protection Area recording values of 1 -1.99 counts/km2. The areas directly surrounding the area has slightly lower densities of 0.5 -0.99 counts/km2, before decreasing further to 0.2 – 0.49 counts/km2. Densities of 0.2 – 0.49 counts/km2 also occur in the north-east and north-west of the site. The lowest densities of 0 – 0.09 counts/km2 occur along the centre of the site.
Map 2 shows the coefficient of variation associated with the mean densities in Map 1. The majority of the site shows variance ranging from 0.6 – 1.99. However, there are areas of lower variance (0.4 – 0.59) in the north-east and south-east of the site.
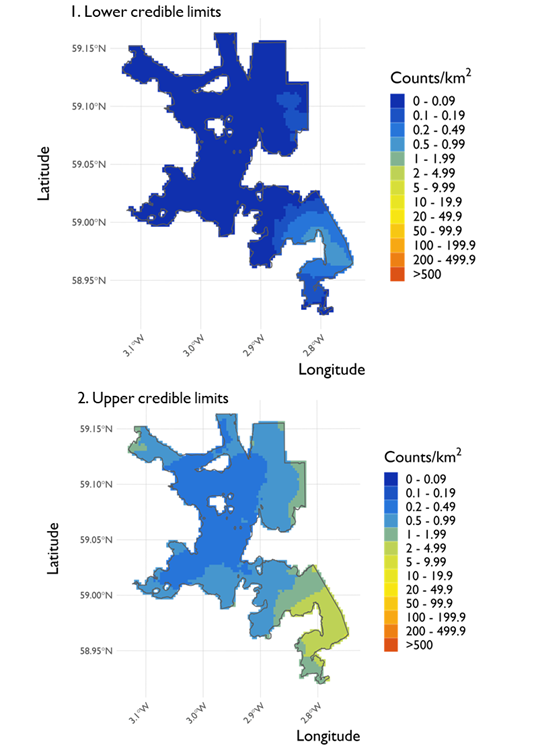
Figure 66. Two maps showing (1) the lower credible limits of density estimates for great northern diver at the North Orkney SPA and (2) the upper credible limits of these estimates across the SPA from the surveys conducted on 21 February 2022.
Click for a full description
Two maps of the North Orkney Special Protection Area organised vertically. The map 1 shows the lower credible limits of predicted densities generated using Inlabru. The majority of the site has lower credible limits of 0 – 0.09 counts/km2. Higher densities are found in the south-east peaking at 0.5 - 0.99 counts/km2, with the surrounding areas decreasing to 0.2 – 0.49 and further to 0.1 -0.19 counts/km2 to the north of the hotspot. Another area of higher density occurs in the north-east, recording densities of 0.1 – 0.19 counts/km2.
The second map shows the upper credible limits of the density estimates. The centre of the Special Protection Area records the lowest densities of 0.2 – 0.49 counts/km2. This then increase to 0.5 -0.99 counts/km2 in the surrounding areas before increasing further to 1 – 1.99 in the north-east and north-west of the site. In the south-east, densities increase further peaking at 2 – 4.99 counts/km2.
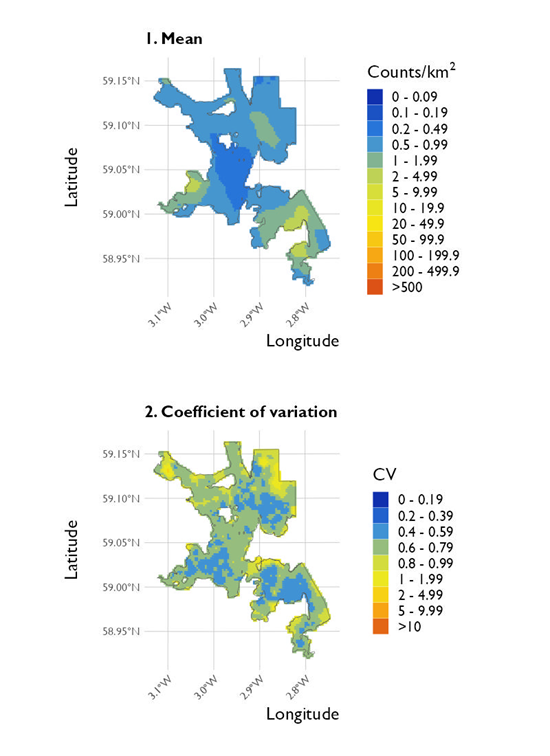
Figure 67. Two maps showing (1) the predicted density of great northern diver at the North Orkney SPA and (2) the coefficient of variation in these estimates across the SPA from the surveys conducted on 20 January 2023.
Click for a full description
Two maps of the North Orkney Special Protected Area organised vertically. Map 1 shows the predicted densities generated using Inlabru. The centre of the map has the lowest density estimates of around 0.2 – 0.49 counts/km2. The north mostly has estimates in the range 0.5 – 0.99 counts/km2, but part of the north-east has predictions around 1 – 1.99 counts/km2. The highest densities are in the south-west and south-east, where predictions reach 10 – 19.9 counts/km2.
Map 2 shows the coefficient of variation associated with the mean densities shown in map 1. Results are varied across the map, with variation ranging from 0.4 – 1.99 counts/km2. The north-west and north-east have the highest variation in the range 1 – 1.99 counts/km2. The central and southern parts of the map have variation in the range 0.4 – 0.79 counts/km2, with some small hotspots of variation in the range 1 – 1.99 counts/km2.
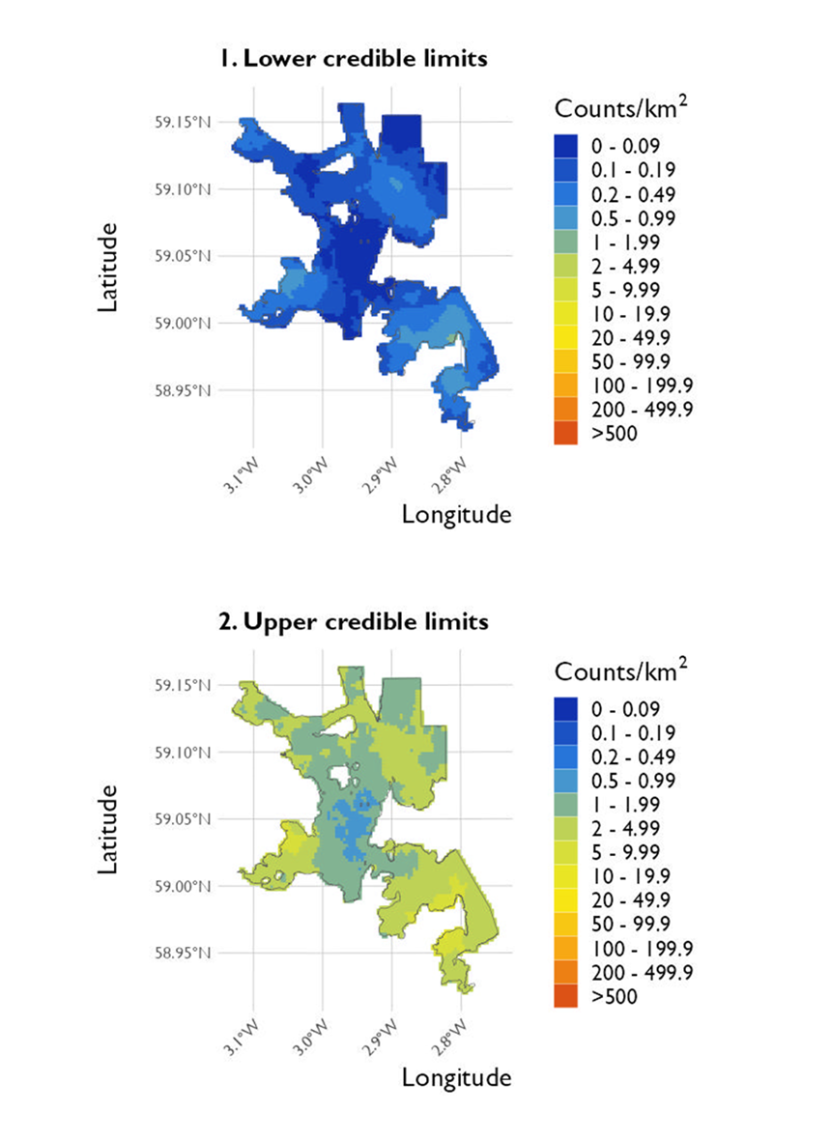
Figure 68. Two maps showing (1) the lower credible limits of density estimates for great northern diver at the North Orkney SPA and (2) the upper credible limits of these estimates across the SPA from the surveys conducted on 20 January 2023.
Click for a full description
Two maps of the North Orkney Special Protected Area organised vertically. Map 1 shows the lower credible limits of predicted densities generated using Inlabru. There are low densities across the map, with the overall range 0 – 1.99 counts/km2. The centre and parts of the north have the lowest predictions in the range 0 – 0.09 counts/km2, whilst the south-west, south-east and north-east have the highest densities. These areas have density predictions in the range 0.2 – 0.99 counts/km2. There is one tiny area in the south-east that have predictions in the range 1 – 1.99 counts/km2.
Map 2 shows the upper credible limits of density estimates. The lowest predictions are found in the central area of the map, where densities are in the range 0.5 – 0.99 counts/km2. The highest predictions are in the south-east and south-west, where estimates are in the range 2 – 19.9 counts/km2. The north mostly has densities between 1 – 1.99 counts/km2, with some parts having higher predictions in the range 2 – 4.99 counts/km2.
Great northern diver were observed in all months during the winter 2021/22 shore-based counts, and in all months except March in the 2022/23 shore-based counts. The total monthly counts for the single sector 14 are presented in Table 38 and Table 39 respectively for the winter 2021/22 and 2022/23 surveys. The highest counts of great northern divers occurred in January 2022 (18 birds) during the winter 2021/22 surveys and February 2023 (20 birds) during the winter 2022/23 surveys. Low numbers of great northern divers (3 - 7 birds) were recorded in the other months surveyed across both winters.
The distribution of great northern diver across sector 14 during the shore-based counts is presented in Figure 69 and Figure 70 respectively for the winter 2021/22 and winter 2022/23 surveys, with most birds recorded at the mouth of the Bay of Kirkwall across both surveys. The majority of birds were recorded as individuals, except for two small groups of four birds during the winter 2021/22 surveys, and a flock of 18 during the February 2023 survey.
| Sector | Nov ‘21 | Dec ‘21 | Jan ‘22 | Feb ‘22 | Mar ‘22 |
|---|---|---|---|---|---|
| 14 | 6 | 4 | 18 | 3 | 3 |
| Sector | Nov ‘22 | Dec ‘22 | Jan ‘23 (survey 1) | Jan ’23 (survey 2) | Feb ‘23 | Mar ‘23 |
|---|---|---|---|---|---|---|
| 14 | 4 | 4 | 7 | 4 | 20 | 0 |
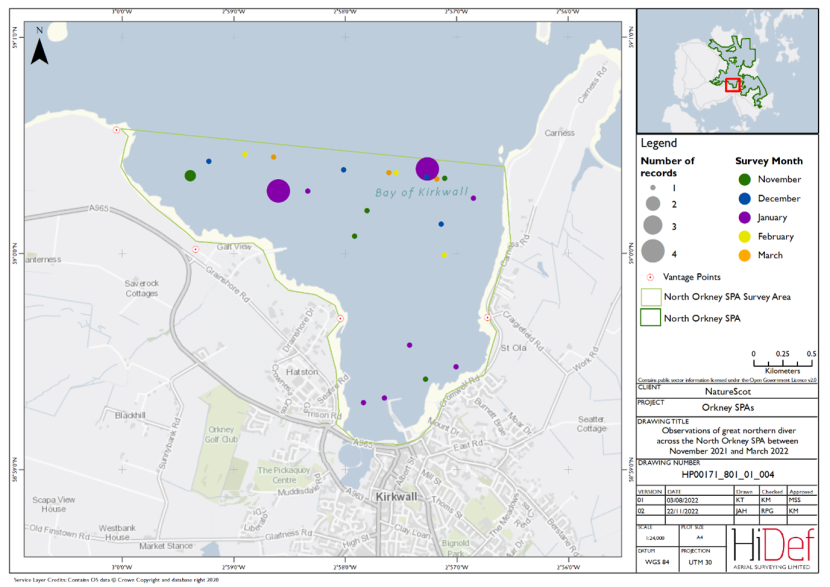
Figure 69. Shore-based observations of great northern diver within the North Orkney SPA sector between November 2021 and March 2022.
Click for a full description
Map of shore-based observations of great northern diver at Bay of Kirkwall in the North Orkney Special Protection Area during the winter 2021/22 shore-based surveys. Observations are represented by circles of increasing size relating to the number of birds seen, while colours are used to differentiate months. Most birds are recorded at the mouth of the Bay of Kirkwall. The majority of birds were recorded as individuals, except for two small groups of four birds.
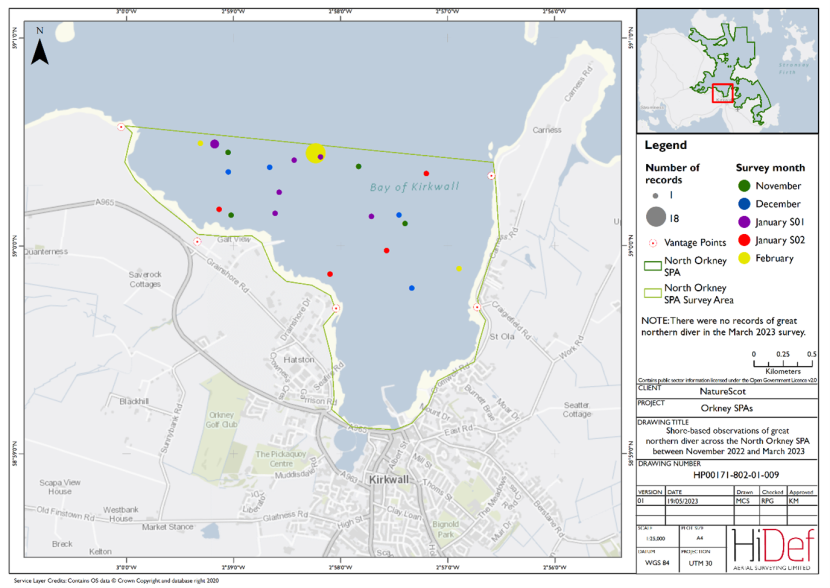
Figure 70. Shore-based observations of great northern diver within the North Orkney SPA sector between November 2022 and March 2023.
Click for a full description
Map of shore-based observations of great northern diver at Bay of Kirkwall in the North Orkney Special Protected Area during the winter 2022/23 shore-based surveys. Observations are represented by circles of increasing size relating to the number of birds seen, while colours are used to differentiate months. Most birds are recorded towards the mouth of the Bay of Kirkwall with the highest number of birds recorded in February 2023
Black-throated diver
Black-throated diver is not a qualifying feature of the North Orkney SPA.
A single bird was recorded in the February 2022 DAS (Figure 71). Strip transect analysis of the aerial survey data estimated the North Orkney SPA population at 5 birds (95 %CI 0 – 13) at the time of survey (Table 15), equating to a density of 0.02 birds/km2. No black-throated diver were observed during the January 2023 DAS.
Density surface mapping was not undertaken for black-throated diver, as fewer than 10 observations were recorded.
No black-throated diver were recorded within sector 14 during any of the shore-based counts conducted over the winter of 2021/22 or 2022/23.

Figure 71. DAS observations of black-throated diver within the North Orkney SPA on 21 February 2022.
Click for a full description
Map of North Orkney Special Protection Area with circle marking the location of the single black-throated diver that were observed during the aerial survey of 21 February 2022 at the eastern entrance to Inganess Bay.
Slavonian grebe
A total of nine Slavonian grebe were recorded in the February 2022 DAS, compared with 22 in the January 2023 survey (Table 5 and Table 6). The distribution of Slavonian grebe is illustrated in Figure 72 and Figure 73 respectively for the February 2022 and January 2023 surveys. Slavonian grebe are a coastal species, and this is evident here, with individuals predominantly found close to shore across both surveys.
Design-based strip transect analysis of the aerial survey data estimated the North Orkney SPA population at 38 birds (95 %CI 13 – 66) during the February 2022 survey, compared with 94 birds (95 %CI 24 – 206) during the January 2023 survey (Table 15), equating to a density of 0.18 birds/km2 and 0.41 birds/km2, respectively. Model-based Bayesian point processing was only possible for the January 2023 data, generating an estimated 103 birds (95 % credible interval 61 – 163; Table 22).
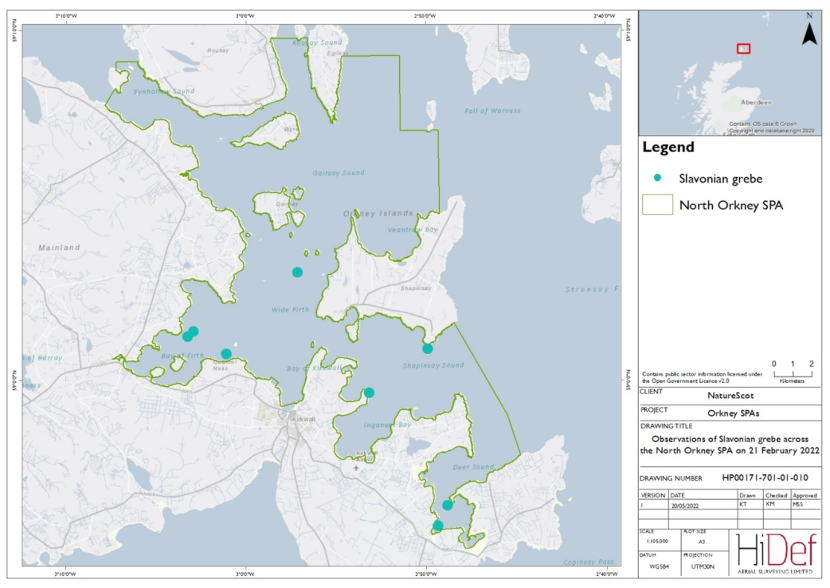
Figure 72. DAS observations of Slavonian grebe within the North Orkney SPA on 21 February 2022.
Click for a full description
Map of North Orkney Special Protection Area with circles marking the locations of Slavonian grebe that were observed during the aerial survey of 21 February 2022. There are nine observations marked, with individuals found close to shore across the southern half of the North Orkney SPA.
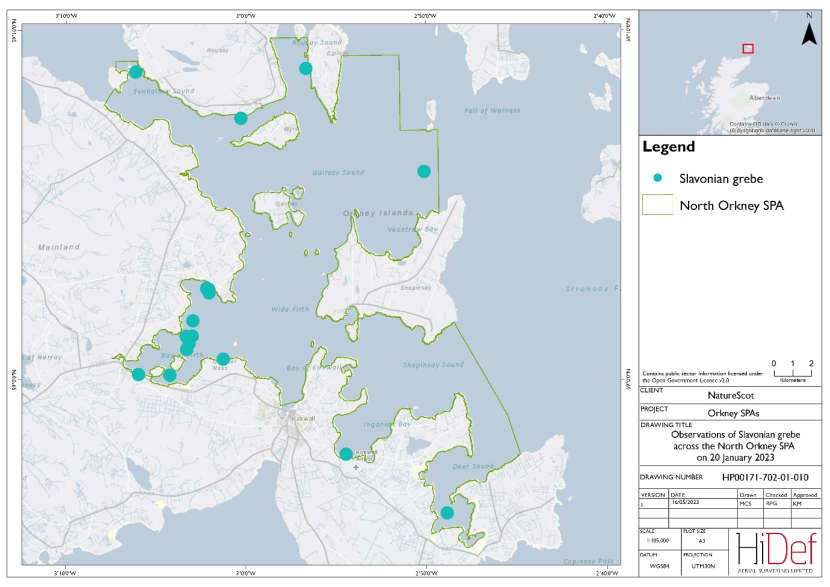
Figure 73. DAS observations of Slavonian grebe within the North Orkney SPA on 20 January 2023.
Click for a full description
Map of North Orkney Special Protected Area with circles marking the locations of Slavonian grebe that were observed during the aerial survey of 20 January 2023. There are 22 observations marked, with individuals found close to shore across the North Orkney SPA, with a cluster of birds in the Bay of Firth.
The predicted mean density of Slavonian grebe across the North Orkney SPA in the January 2023 survey is presented in Figure 74, alongside the CV in these estimates. Low densities (up to 0.2 – 0.49 birds/km2) were estimated across the majority of North Orkney SPA, with higher densities (up to 5 – 19.9 birds/km2) in some shallower waters in the west and northwest of the SPA (Figure 74). The lower and upper credible intervals are mapped in Figure 75.
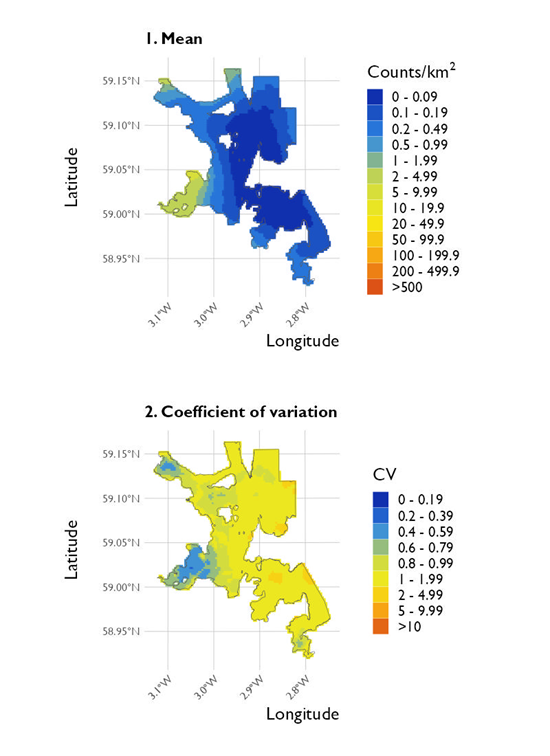
Figure 74. Two maps showing (1) the predicted density of Slavonian grebe at the North Orkney SPA and (2) the coefficient of variation in these estimates across the SPA from the surveys conducted on 20 January 2023.
Click for a full description
Two maps of the North Orkney Special Protected Area organised vertically. Map 1 shows the predicted densities generated using Inlabru. Most of the map shows low density estimates, in the range 0 – 0.49 counts/km2. There are a few areas on higher predictions in the south-west, north-west and northern border. These areas all have predictions in the range 2 – 19.9 counts/km2.
Map 2 shows the coefficient of variation associated with the mean densities shown in map 1. Most of the map has variation in the range 1- 4.999 counts/km2, with small areas in the north-west and south-west having lower variation. These areas have variation between 0.4 – 0.799 counts/km2. There are a few small areas with high variation found along the east side of the map, with variation in the range 5 – 9.999 counts/km2.
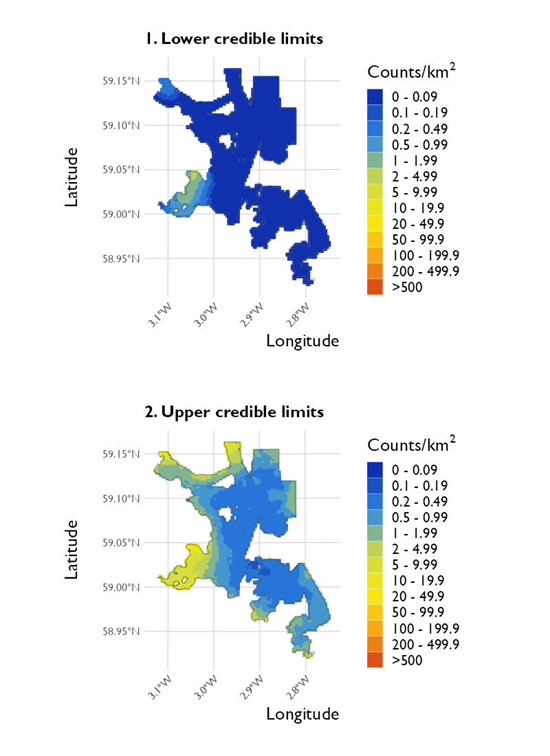
Figure 75. Two maps showing (1) the lower credible limits of density estimates for Slavonian grebe at the North Orkney SPA and (2) the upper credible limits of these estimates across the SPA from the surveys conducted on 20 January 2023.
Click for a full description
Two maps of the North Orkney Special Protected Area organised vertically. Map 1 shows the lower credible limits of predicted densities generated using Inlabru. Almost all of the map has low density estimates between 0 – 0.09 counts/km2. The area with the highest density is in the south-west, where predictions are between 0.5 – 9.99 counts/km2. There is another area in the north-west with slightly higher predictions than the rest of the map, and this area has densities in the range 0.2 – 0.99 counts/km2.
Map 2 shows the upper credible limits of density estimates. The centre of the map has densities in the range 0.2 – 0.99 counts/km2, which is the lowest across the map. The north-east and south-east borders have slightly higher predictions in the range 1 – 1.99 counts/km2, whereas the north-west and south-west have the highest predictions. These predictions are between 2 – 49.9 counts/km2, where the highest densities are closer to the border of the map.
Slavonian grebes were only observed in November 2021 (one bird) and January 2022 (five birds) during the winter 2021/22 shore-based counts. Whilst birds were observed in all survey months except November 2022 during the 2022/23 surveys, in both seasons they were present in relatively low numbers, peaking at 8 birds in the first survey in January 2023. The total monthly counts for sector 14 are presented in Table 40 and Table 41 respectively for the winter 2021/22 and 2022/23 surveys.
The distribution of Slavonian grebe across sector 14 is presented in Figure 76 and Figure 77 respectively for the winter 2021/22 and winter 2022/23 surveys. Individual birds and small flocks (up to three birds) were recorded across the Bay of Kirkwall.
| Sector | Nov ‘21 | Dec ‘21 | Jan ‘22 | Feb ‘22 | Mar ‘22 |
|---|---|---|---|---|---|
| 14 | 1 | 0 | 5 | 0 | 0 |
| Sector | Nov ‘22 | Dec ‘22 | Jan ‘23 (survey 1) | Jan ’23 (survey 2) | Feb ‘23 | Mar ‘23 |
|---|---|---|---|---|---|---|
| 14 | 0 | 3 | 8 | 1 | 6 | 2 |
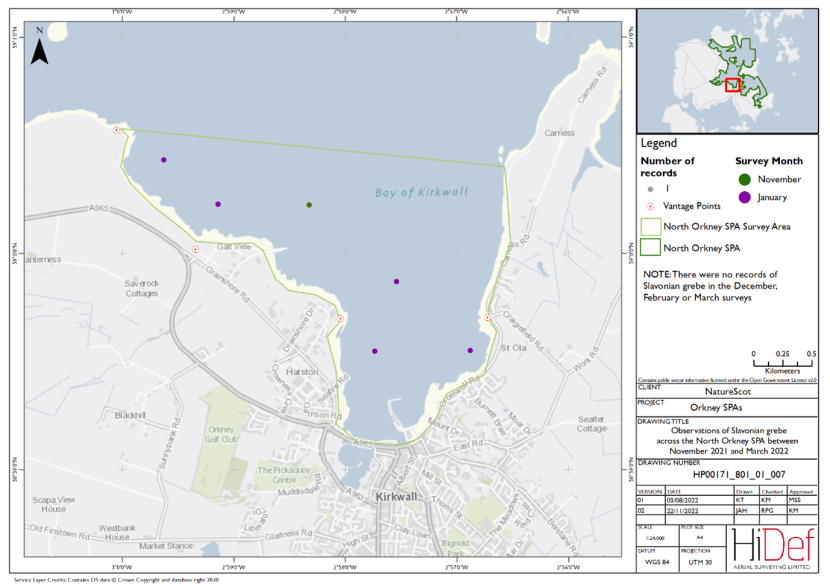
Figure 76. Shore-based observations of Slavonian grebe within the North Orkney SPA sector between November 2021 and March 2022.
Click for a full description
Map of shore-based observations of Slavonian grebe at Bay of Kirkwall in the North Orkney Special Protection Area during the winter 2021/22 shore-based surveys. Observations are represented by circles of increasing size relating to the number of birds seen, while colours are used to differentiate months. Birds were observed as individuals in November and January at locations across the survey sector.
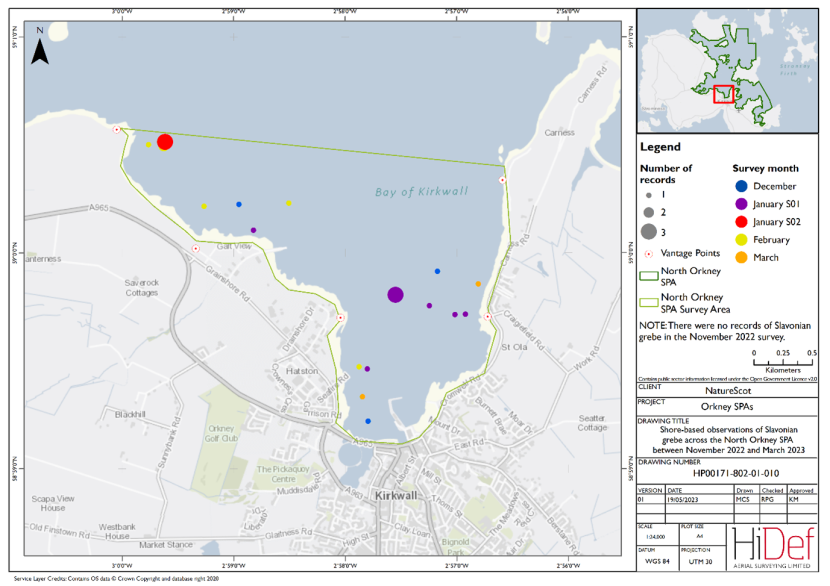
Figure 77. Shore-based observations of Slavonian grebe within the North Orkney SPA sector between November 2022 and March 2023.
Click for a full description
Map of shore-based observations of Slavonian grebe at Bay of Kirkwall in the North Orkney Special Protected Area during the winter 2022/23 shore-based surveys. Observations are represented by circles of increasing size relating to the number of birds seen, while colours are used to differentiate months. Birds were recorded across the survey area as individuals and in small groups of up to three birds.
Red-breasted merganser
Red-breasted merganser is not a qualifying feature of the North Orkney SPA.
A similar number of red breasted merganser were observed in the February 2022 and January 2023 DAS, with 65 and 78 birds, respectively (Table 5 and Table 6). However, the January 2023 surveys recorded a higher number of birds (89) than in February 2022 (18) which could only be identified as 'duck sp.' and were not identified to species level. The distribution of red-breasted merganser is illustrated in Figure 78 for the February 2022 survey and Figure 79 for the January 2023 survey. Birds were recorded close to shore, or in shallow near-shore waters and are distributed across the North Orkney SPA in both surveys.
Design-based strip transect analysis of the aerial survey data estimated the North Orkney SPA population at 214 birds (95 %CI 37 – 506) during the February 2022 survey and 284 birds (95CI 68 – 663) during the January 2023 survey (Table 15), equating to a densities of 1.01 birds/km2 and 1.25 birds/km2 respectively. Bayesian point processing generated estimates of 214 birds (95 % credible limits 135 – 305) for February 2022 and 331 birds (95 % credible interval 236 – 521) for January 2023 (Table 22).
Figure 78
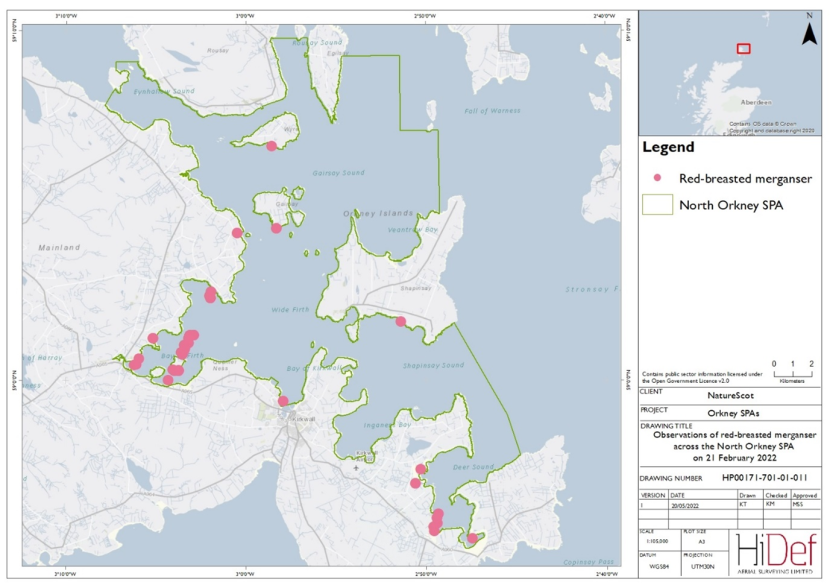
Figure 78. DAS observations of red-breasted merganser within the North Orkney SPA on 21 February 2022.
Click for a full description
Map of North Orkney Special Protection Area with circles marking the locations of red-breasted merganser that were observed during the aerial survey of 21 February 2022. There are 65 observations marked, all close to shore, or in shallow near-shore waters and are distributed across the North Orkney Special Protection Area.
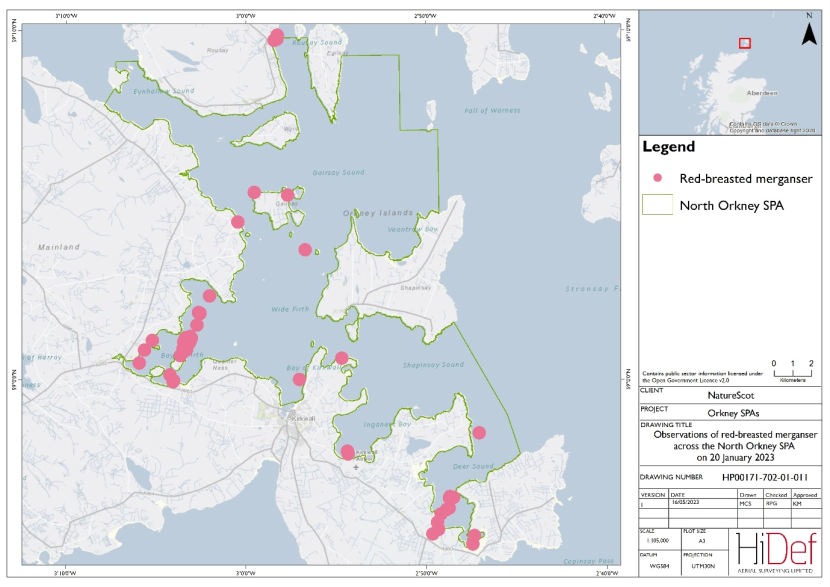
Figure 79. DAS observations of red-breasted merganser within the North Orkney SPA on 20 January 2023
Click for a full description
Map of North Orkney Special Protected Area with circles marking the locations of red-breasted merganser that were observed during the aerial survey of 20 January 2023. There are 67 observations marked, all close to shore, or in shallow near-shore waters and are distributed across the North Orkney Special Protected Area
The predicted mean density of red-breasted merganser across the North Orkney SPA generated through Bayesian point processing is presented in Figure 80 for the February 2022 survey and Figure 82 for the January 2023 survey, alongside the CV. The distribution of birds was similar between the 2022 and 2023 surveys. The highest densities of 20 - 49.9 birds/km2 were recorded in the shallow coastal waters at the Bay of Firth, in the west of the SPA during both surveys, in addition to a few small areas at the Bay of Suckquoy, Inganess Bay and Rousay Sound in the January 2023 survey. The rest of North Orkney SPA had relatively low estimated densities, from 0 - 0.99 birds/km2 in both surveys. The lower and upper credible limits are mapped in Figure 81 and Figure 83 respectively for the February 2022 and January 2023 surveys.
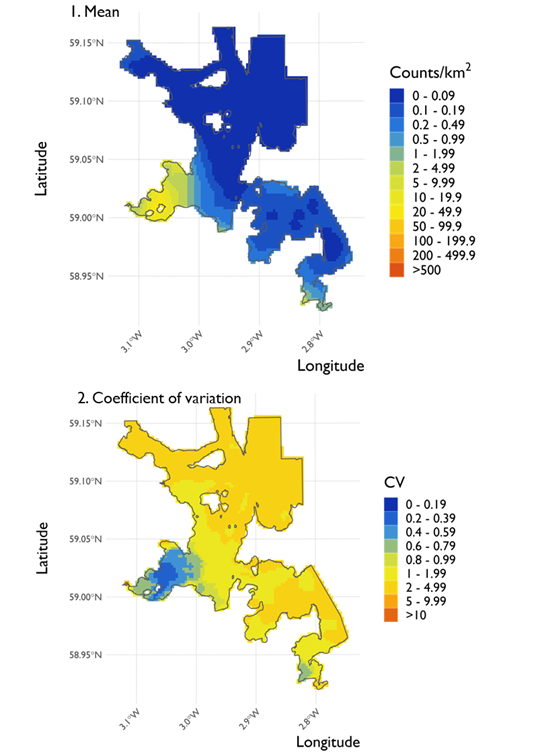
Figure 80. Two maps showing (1) the predicted density of red-breasted merganser at the North Orkney SPA and (2) the coefficient of variation (CV) in these estimates across the SPA from the surveys conducted on 21 February 2022.
Click for a full description
Two maps of the North Orkney Special Protection Area organised vertically. Map 1 shows the predicted densities generated using Inlabru. The gradient used to indicate density estimates across the area goes from blue to green to yellow to red as values increase. The majority of the site has low densities ranging from 0 – 0.49 counts/km2. However, there are areas with higher densities in the south-west which peaks at 20 – 49.9 counts/km2 and a small area towards the extreme south-east of the SPA.
Map 2 shows the coefficient of variation associated with the mean densities reported in map 1. The majority of the map shows variation ranging between 1 – 4.99. However, the areas with higher densities are shown to have lower coefficients of variation, with variance ranging between 0 – 0.79 in the south-west and at the south-east edge of the Special Protection Area.
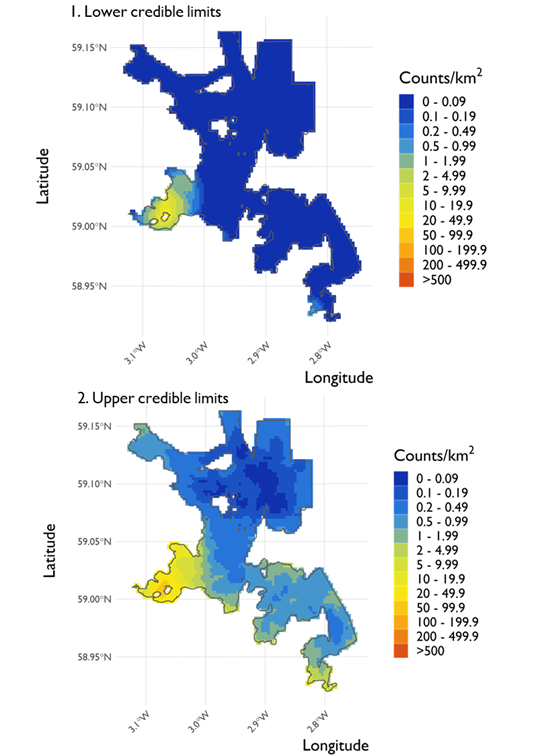
Figure 81. Two maps showing (1) the lower credible limits of density estimates for red-breasted merganser at the North Orkney SPA and (2) the upper credible limits of these estimates across the SPA from the surveys conducted on 21 February 2022.
Click for a full description
Two maps of the North Orkney Special Protection Area organised vertically. The map 1 shows the lower credible limits of predicted densities generated using Inlabru. The lower credible limits for the majority of the site range between 0 – 0.09 counts/km2, with higher densities occurring in the south-west peaking at 20- 49.99 counts/km2 and the south-east extremity of the site peaking at 0.5 – 0.99 counts/km2.
Map 2 shows the upper credible limits of the red-breasted merganser density estimates. The majority of the site has upper credible limits ranging between 0 – 0.99 counts/km2. There are areas with higher densities in the south, peaking at 50 – 99.9 counts/km2 in the south-west.
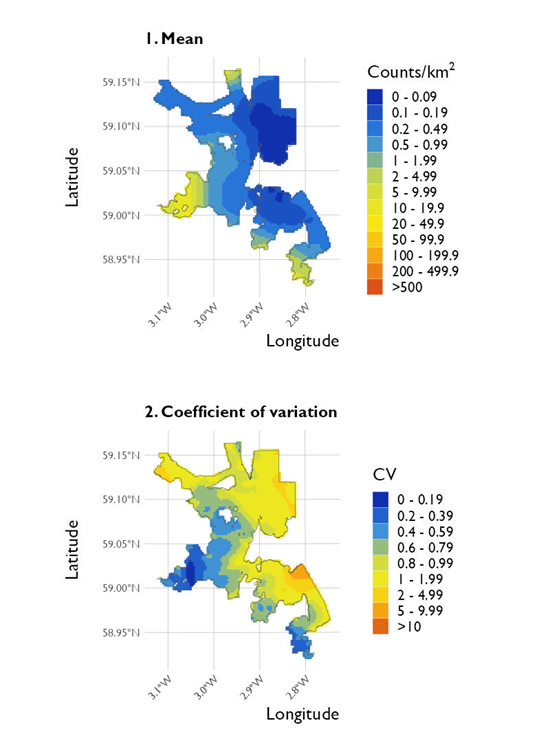
Figure 82. Two maps showing (1) the predicted density of red-breasted merganser at the North Orkney SPA and (2) the coefficient of variation in these estimates across the SPA from the surveys conducted on 20 January 2023.
Click for a full description
Two maps of the North Orkney Special Protected Area organised vertically. Map 1 shows the predicted densities generated using Inlabru. The density predictions mostly increase from east to west, starting from 0 – 0.09 counts/km2 in the north-east and reaching 20 – 49.9 counts/km2 in the south-west. The south-east has predictions mostly in the range 0 – 0.49 counts/km2, but there are two areas on the southern border that have higher predictions of 2 – 9.99 counts/km2. A small area on the northern border has predictions in the same range of 2 – 9.99 counts/km2, whilst the rest of the north has predictions in the range 0.2 – 0.49 counts/km2.
Map 2 shows the coefficient of variation associated with the mean densities shown in map 1. The areas with higher variation mostly correspond to the areas with low density in map 1, and the areas with lower variation correspond to the areas with high density in map 1. The north-east, south-east and north-west areas have high variation in the range 0.8 – 9.99 counts/km2. There is one small area in the south-east with higher predictions in the range 5 – 9.99 counts/km2. The south-west and southernmost tip of the map have low variation in the range 0 – 0.59 counts/km2.
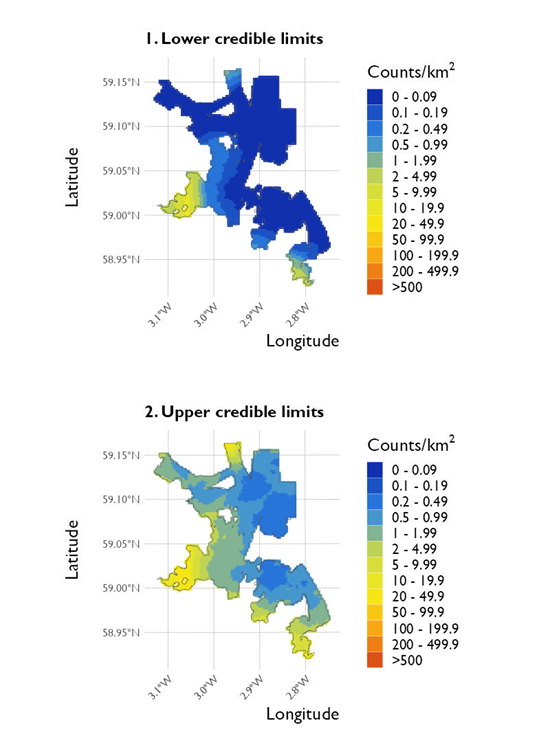
Figure 83. Two maps showing (1) the lower credible limits of density estimates for red-breasted merganser at the North Orkney SPA and (2) the upper credible limits of these estimates across the SPA from the surveys conducted on 20 January 2023.
Click for a full description
Two maps of the North Orkney Special Protected Area organised vertically. Map 1 shows the lower credible limits of predicted densities generated using Inlabru. Most of the map shows density estimates in the range 0 – 0.09 counts/km2, with parts of the north, south-east and south-west having higher predictions in the range 0.1 – 9.99 counts/km2. The south-west and south-east have the highest estimates in the range 5 – 9.99 counts/km2.
Map 2 shows the upper credible limits of density estimates. The lowest predictions are found in the north-east and just south of the centre of the map. These predictions are in the range 0.2 – 0.99 counts/km2. The south and north-west have higher predictions in the range 1 – 49.9 counts/km2, with the south-west having the highest predictions in the range 20 – 49.9 counts/km2.
Red-breasted merganser were observed in all months during both the winter 2021/22 and winter 2022/23 shore-based counts. The total monthly counts for sector 14 are presented in Table 42 and Table 43 respectively for the winter 2021/22 and 2022/23 surveys. Higher counts occurred in January in both seasons; January 2022 (41 birds) and January (survey 1) 2023 survey (39 birds), although the peak from the winter 2022/23 surveys was in November 2022 (44 birds). Lower numbers of red-breasted merganser (2022: 3 - 14 birds; 2023: 2 – 22 birds) were recorded in the other months surveyed.
The distribution of red-breasted merganser across sector 14 is presented in Figure 84 and Figure 85 respectively for the winter 2021/22 and winter 2022/23 surveys. As expected, birds were mostly recorded close to shore, preferring sheltered coastlines across both winter seasons.
| Sector | Nov ‘21 | Dec ‘21 | Jan ‘22 | Feb ‘22 | Mar ‘22 |
|---|---|---|---|---|---|
| 14 | 6 | 14 | 41 | 3 | 6 |
| Sector | Nov ‘22 | Dec ‘22 | Jan ‘23 (survey 1) | Jan ’23 (survey 2) | Feb ‘23 | Mar ‘23 |
|---|---|---|---|---|---|---|
| 14 | 44 | 22 | 39 | 2 | 10 | 8 |
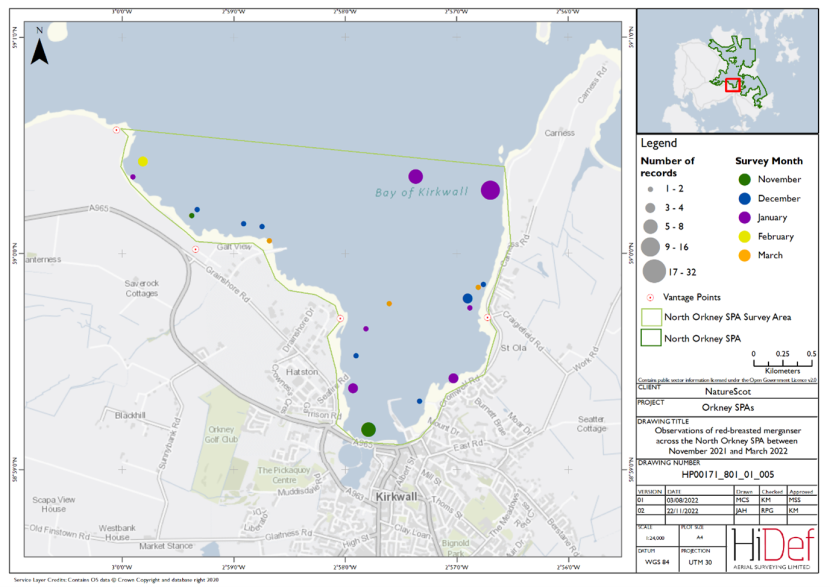
Figure 84. Shore-based observations of red-breasted merganser within the North Orkney SPA sector 14 between November 2021 and March 2022
Click for a full description
Map of shore-based observations of red-breasted merganser at Bay of Kirkwall in the North Orkney Special Protection Area during the winter 2021/22 shore-based surveys. Observations are represented by circles of increasing size relating to the number of birds seen, while colours are used to differentiate months. Birds were mostly recorded close to shore, except for one flock in January located near the entrance of the bay.
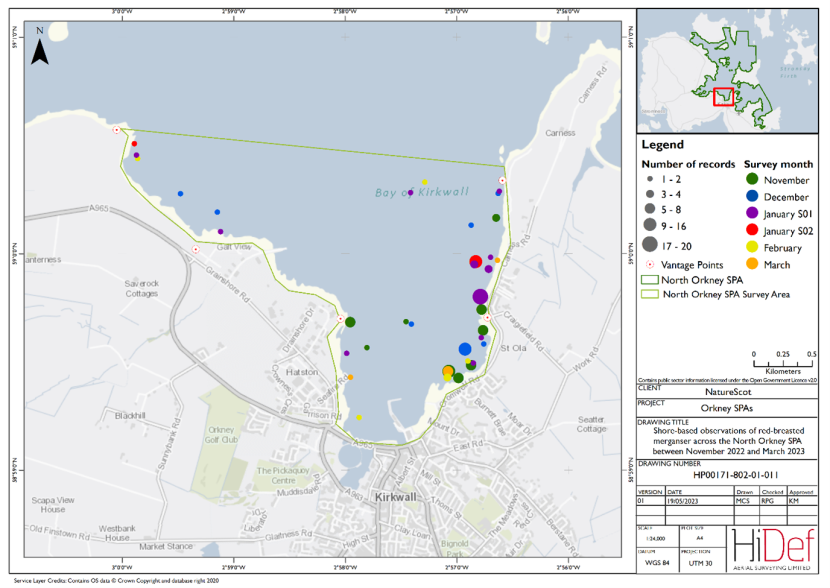
Figure 85. Shore-based observations of red-breasted merganser within the North Orkney SPA sector between November 2022 and March 2023.
Click for a full description
Map of shore-based observations of red-breasted merganser at Bay of Kirkwall in the North Orkney Special Protected Area during the winter 2022/23 shore-based surveys. Observations are represented by circles of increasing size relating to the number of birds seen, while colours are used to differentiate months. Birds were mostly recorded on the eastern shore of the survey area with the highest number of birds recorded in November 2022.
Velvet scoter
No velvet scoter were recorded within the North Orkney SPA during either of the DAS in February 2022 and January 2023, nor within sector 14 during any of the shore-based counts conducted over the winter of 2021/22. In the winter 2022/23 shore-based counts, ten birds were observed in December 2022 and 19 birds in January 2023 (survey 1) at the mouth of the Bay of Kirkwall (Table 44; Figure 86).
| Sector | Nov ‘22 | Dec ‘22 | Jan ‘23 (survey 1) | Jan ’23 (survey 2) | Feb ‘23 | Mar ‘23 |
|---|---|---|---|---|---|---|
| 14 | 0 | 10 | 19 | 0 | 0 | 0 |
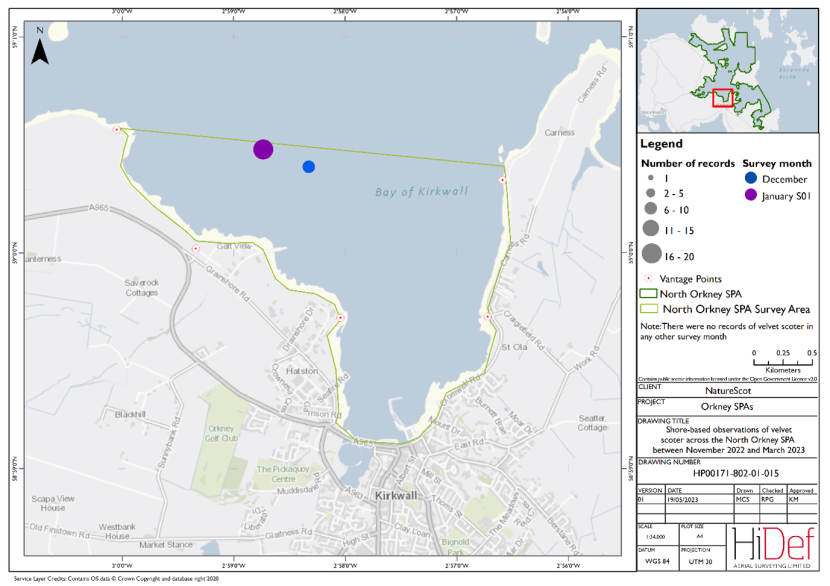
Figure 86. Shore-based observations of velvet scoter within the North Orkney SPA sector between November 2022 and March 2023.
Click for a full description
Map of shore-based observations of velvet scoter at Bay of Kirkwall in the North Orkney Special Protected Area during the winter 2022/23 shore-based surveys. Observations are represented by circles of increasing size relating to the number of birds seen, while colours are used to differentiate months. Velvet scoter were only recorded in December 2022 on the eastern shore of the survey area and January Survey 01 2023 at the entrance of the bay.
Long-tailed duck
Long-tailed duck is not a qualifying feature of the North Orkney SPA.
A total of 377 long-tailed duck were recorded in the February 2022 DAS, compared with 590 recorded in the January 2023 survey (Table 5 and Table 6). An additional 18 birds in February 2022, and 89 in January 2023 were identified as 'duck sp.' but could not be identified to species level. The distribution of long-tailed duck is illustrated in Figure 87 and Figure 88 respectively for the February 2022 and January 2023 surveys. Birds were widely distributed across the North Orkney SPA during both surveys.
Design-based strip transect analysis of the aerial survey data estimated the North Orkney SPA population at 1,570 birds (95 %CI 554 – 3,170) during the February 2022 survey, compared with 2,190 birds (95 %CI 1,051 – 3,331) during the January 2023 survey (Table 15), equating to densities of 7.41 birds/km2 and 9.62 birds/km2 respectively. Model-based Bayesian point processing generated somewhat higher estimates of 1,915 birds (95 % credible limits 1,668 – 2,734) from in the February 2022 survey, and 2,428 birds (95 % credible interval 2,199 – 2,654) in the January 2023 survey (Table 22).
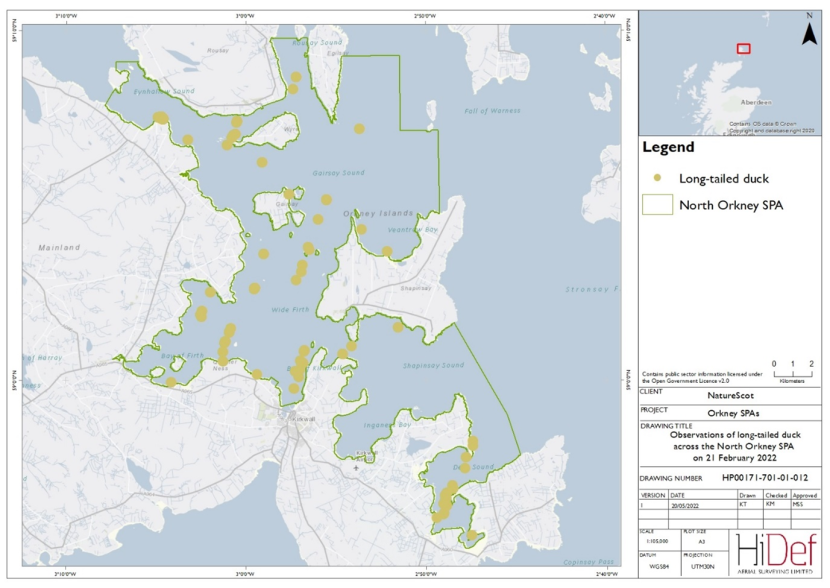
Figure 87. DAS observations of long-tailed duck within the North Orkney SPA on 21 February 2022.
Click for a full description
Map of North Orkney Special Protection Area with circles marking the locations of long-tailed duck that were observed during the aerial survey of 21 February 2022. There are 377 observations marked, widely distributed across the North Orkney Special Protection Area.
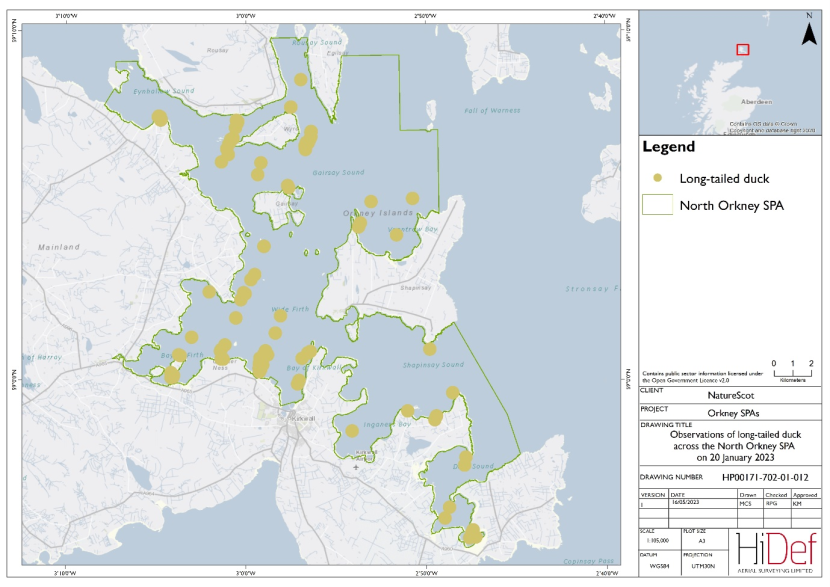
Figure 88. DAS observations of long-tailed duck within the North Orkney SPA on 20 January 2023.
Click for a full description
Map of North Orkney Special Protected Area with circles marking the locations of long-tailed duck that were observed during the aerial survey of 20 January 2023. There are 517 observations marked, widely distributed across the North Orkney Special Protected Area.
The predicted mean density of long-tailed duck across the North Orkney SPA generated through Bayesian point processing is presented in Figure 89 for the February 2022 survey and Figure 91 for the January 2023 survey, alongside the CV in these estimates. The highest estimated densities in both surveys (200 - 499.9 birds/km2 in February 2022 and 100 - 199 birds/km2 in the January 2023 survey) were recorded at the headland west of the Sands of Evie, off the north coast of Orkney Mainland, in addition to west of the Bay of Kirkwall in the January 2023 survey. During the February 2022 surveys, high densities (50 - 99.9 birds/km2) were also estimated off the east coast of Gairsay Island, in the centre of North Orkney SPA. Relatively high densities up to 20 - 49.99 birds/km2 were estimated across the remainder of the SPA, with low densities in the northeast of the site and in Shapinsay Sound during both surveys. The lower and upper credible limits are mapped in Figure 90 and Figure 92 respectively for the February 2022 and January 2023 surveys.
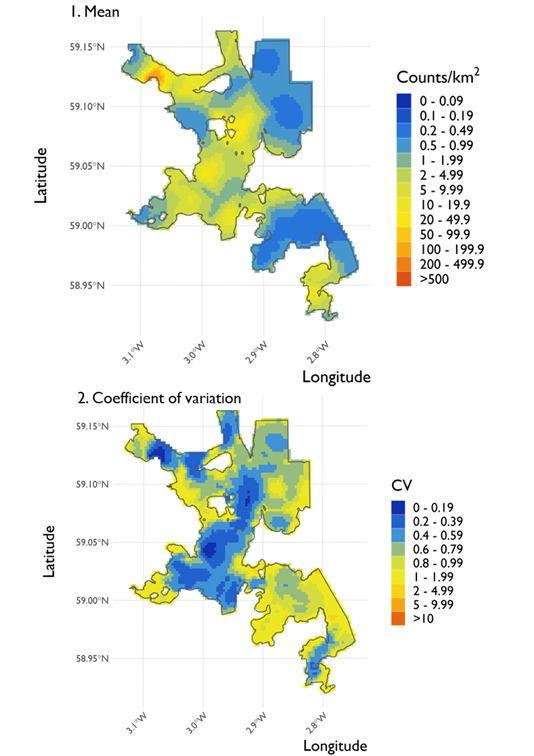
Figure 89. Two maps showing (1) the predicted density of long-tailed duck at the North Orkney SPA and (2) the coefficient of variation (CV) in these estimates across the SPA from the surveys conducted on 21 February 2022.
Click for a full description
Two maps of the North Orkney Special Protection Area organised vertically. Map 1 shows the predicted densities generated using Inlabru. The centre of the site shows densities ranging from 1 – 49.99 counts/km2. Lower densities are recorded in the north-east and towards the south-east of the site, ranging between 0 – 0.99 counts/km2. The most south-east area of North Orkney then returns to densities of 1 – 19.99 counts/km2. The peak densities of the site are recorded in the north-west, peaking at 200 – 499.9 counts/km2.
Map 2 shows the coefficient of variation associated with the means reported in map 1. Low levels of variation (0 – 0.59) are found in the centre of the site, as well as in smaller areas in the north, west, south-east and north-west. The highest levels of variation occur along the western border of the site ranging from 0.6 – 1.99, and in the south-east of the site where variation peaks at 2 – 4.99.
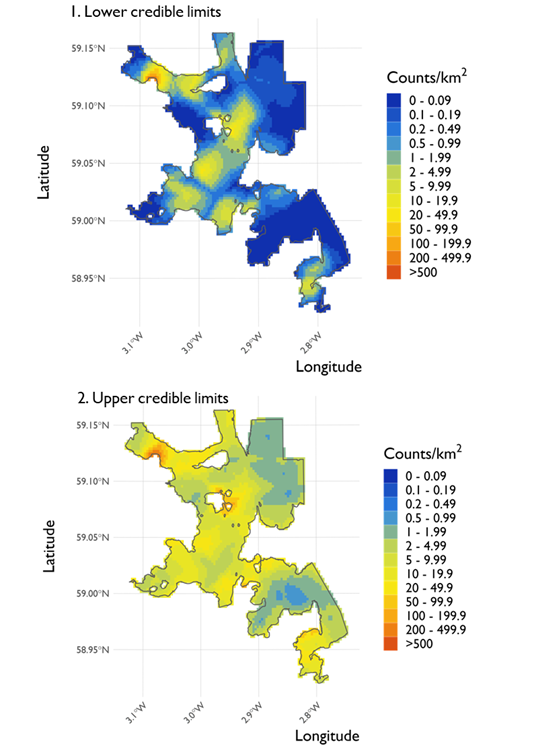
Figure 90. Two maps showing (1) the lower credible limits of density estimates for long-tailed duck at the North Orkney SPA and (2) the upper credible limits of these estimates across the SPA from the surveys conducted on 21 February 2022.
Click for a full description
Two maps of the North Orkney Special Protection Area organised vertically. The map 1 shows the lower credible limits of predicted densities generated using Inlabru. The majority of the map shows a lower credible limits of 0 – 0.49 counts/km2. However, there are multiple areas with densities as ranging between 5 – 19.9 counts/km2 across the site, with the largest of these occurring in the centre. The peak density occurs in the north-west of the site reaching 50 – 99.9 counts/km2.
Map 2 shows the shows the upper credible limits of predicted densities. The majority of the map shows densities ranging from 2 – 19.9 counts/km2, with two significant areas of low density occurring in the north-east and south-east of the site recording densities of 0.5 – 1.99 counts/km2. Peak densities occur in two small areas in the north-west and to the north of the centre of the site reporting densities of 50 – 99.9 counts/km2.
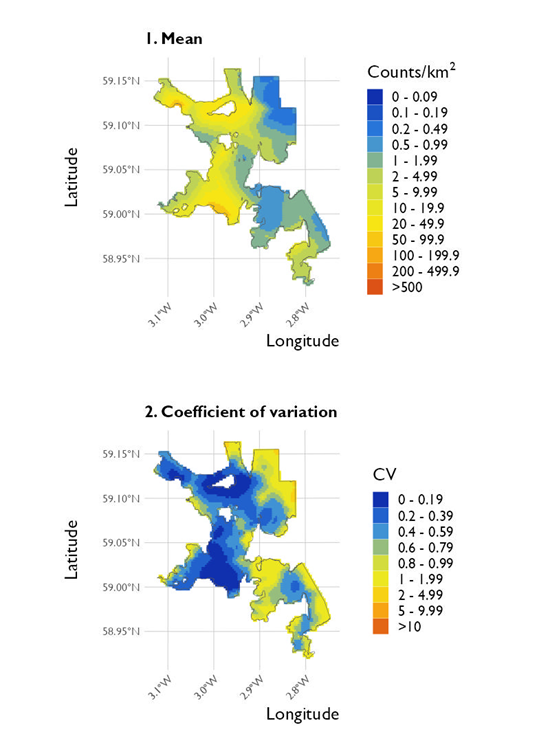
Figure 91. Two maps showing (1) the predicted density of long-tailed duck at the North Orkney SPA and (2) the coefficient of variation in these estimates across the SPA from the surveys conducted on 20 January 2023.
Click for a full description
Two maps of the North Orkney Special Protected Area organised vertically. Map 1 shows the predicted densities generated using Inlabru. The east side of the map has lower predictions than the west. The north-east and parts of the south have densities in the range 0.2 – 0.99 counts/km2, and the south-east has densities in the range 1 – 9.99 counts/km2. The west side has the highest predictions, especially in the north-west and south-west, where densities are in the range 20 – 199.9 counts/km2.
Map 2 shows the coefficient of variation associated with the mean densities shown in map 1. The west of the map has the lowest variation in the range 0 – 0.59 counts/km2, and this corresponds to the areas with the highest density in map 1. The majority of the east side has higher variation in the range 1 – 4.99 counts/km2. There are small parts of the south-east with lower variation in the range 0.2 – 0.59 counts/km2.
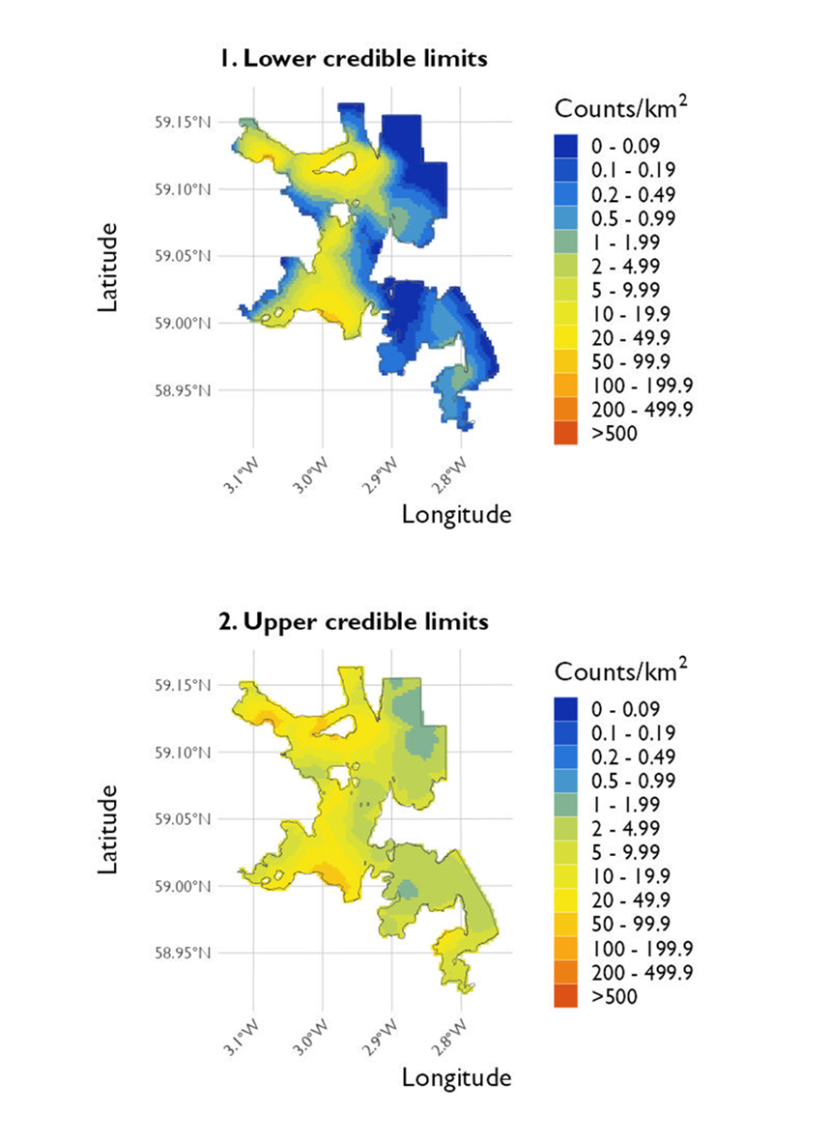
Figure 92. Two maps showing (1) the lower credible limits of density estimates for long-tailed duck at the North Orkney SPA and (2) the upper credible limits of these estimates across the SPA from the surveys conducted on 20 January 2023.
Click for a full description
Two maps of the North Orkney Special Protected Area organised vertically. Map 1 shows the lower credible limits of predicted densities generated using Inlabru. The east of the map shows densities between 0 – 4.99 counts/km2, and the south-east have slightly higher densities in the range 0.5 – 4.99 counts/km2. The west has higher densities in the range 10 – 99.9 counts/km2. The north-west and south-west have small areas of high density in the range 50 – 99.9 counts/km2.
Map 2 shows the upper credible limits of density estimates. The majority of the site has density predictions in the range 5 – 49.9 counts/km2, but there are some areas with lower estimates. The east side of the map has the lowest densities, in the range 1 – 4.99 counts/km2. The north-west and south-west have higher estimates in the range 20 – 99.9 counts/km2, and there are a few hotspots in these areas in the range 50 – 99.9 counts/km2.
Long-tailed duck were observed in all months during both the winter 2021/22 and winter 2022/23 shore-based counts, with many more birds observed over the winter 2022/23 surveys, as shown in Tables 45 and 46. In the winter 2021/22 surveys, the highest count of long-tailed duck occurred in January 2022 (72 birds), compared with a much higher peak in the first January 2023 survey (471 birds) during the winter 2022/23 surveys. Low numbers of long-tailed duck (1 - 10 birds) were recorded in the other months surveyed during winter 2021/22, whereas during the winter 2022/23 surveys relatively high numbers were also recorded in December 2022 (145 birds), February 2023 (379 birds), and March 2023 (185 birds).
The distribution of long-tailed duck across sector 14 is presented in Figure 93 and Figure 94 respectively for the winter 2021/22 and winter 2022/23 surveys. Birds were present across the Bay of Kirkwall. In 2021/22 the largest flock of up to 18 individuals was recorded in January 2022, but much larger numbers and flocks of birds were recorded across the Bay of Kirkwall during the winter 2022/23 surveys.
| Sector | Nov ‘21 | Dec ‘21 | Jan ‘22 | Feb ‘22 | Mar ‘22 |
|---|---|---|---|---|---|
| 14 | 2 | 8 | 72 | 10 | 1 |
| Sector | Nov ‘22 | Dec ‘22 | Jan ‘23 (survey 1) | Jan ’23 (survey 2) | Feb ‘23 | Mar ‘23 |
|---|---|---|---|---|---|---|
| 14 | 15 | 145 | 471 | 9 | 379 | 185 |
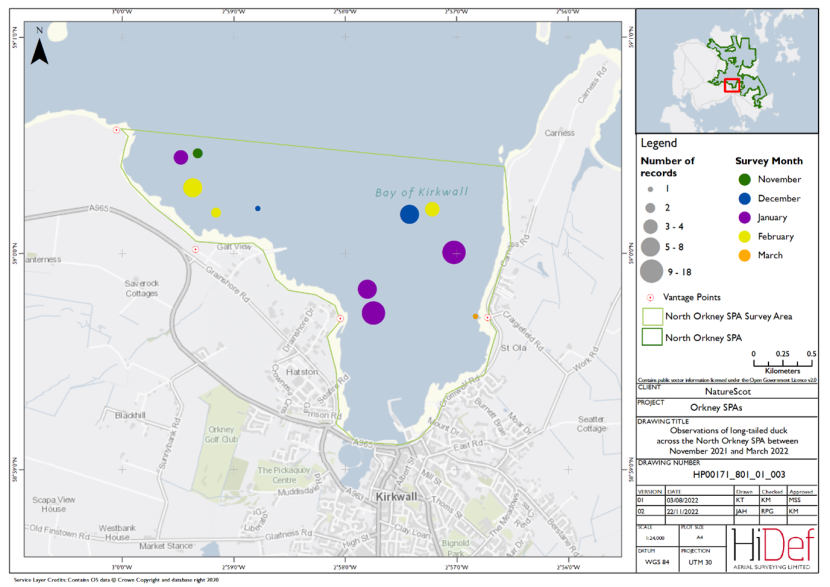
Figure 93. Shore-based observations of long-tailed duck within the North Orkney SPA sector between November 2021 and March 2022.
Click for a full description
Map of shore-based observations of long-tailed duck at Bay of Kirkwall in the North Orkney Special Protection Area during the winter 2021/22 shore-based surveys. Observations are represented by circles of increasing size relating to the number of birds seen, while colours are used to differentiate months. Birds were present across the Bay of Kirkwall, with the largest flocks of up to 18 individuals recorded in January.
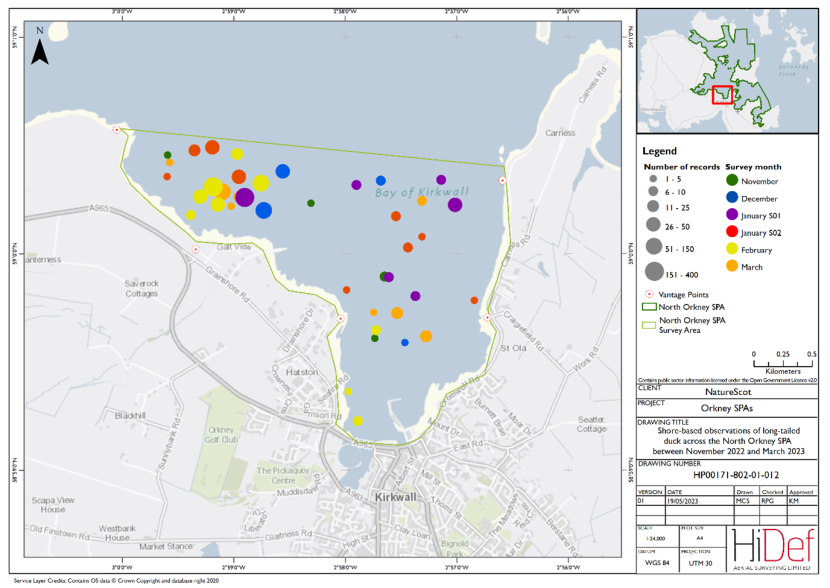
Figure 94. Shore-based observations of long-tailed duck within the North Orkney SPA sector between November 2022 and March 2023.
Click for a full description
Map of shore-based observations of long-tailed duck at Bay of Kirkwall in the North Orkney Special Protected Area during the winter 2022/23 shore-based surveys. Observations are represented by circles of increasing size relating to the number of birds seen, while colours are used to differentiate months. Birds were present across the Bay of Kirkwall, with the largest flocks of up to 471 individuals recorded in the 10 January 2023 survey.
Common eider
Common eider is not a qualifying feature of the North Orkney SPA.
A total of 224 common eider were recorded in the February 2022 DAS, and more than twice as many (556 birds) in the January 2023 survey (Table 5 and Table 6). An additional 18 birds during the February 2022 survey, and 89 birds during the January 2023 survey were identified as 'duck sp.' but could not be identified to species level. The distribution of common eider is illustrated in Figure 95 for the February 2022 survey and Figure 96 for the January 2023 survey. Birds were widely distributed across the North Orkney SPA, except for the deepest waters in Gairsay and Shapinsay Sounds.
Design-based strip transect analysis of the February 2022 aerial survey data estimated the North Orkney SPA population at 840 birds (95 %CI 328 – 1,535) at the time of survey, equating to a density of 3.96 birds/km2, compared with an estimated population of 2,266 birds (95 %CI 285 – 5,842) in January 2023, equating to a density of 9.95 birds/km2 (Table 15). This compares to an estimated 905 birds (95 % credible limits 759 – 1,580) and 2,134 birds (95 % credible interval 1,887 – 2,421) from model-based Bayesian point processing for the February 2022 and January 2023 surveys respectively (Table 22).
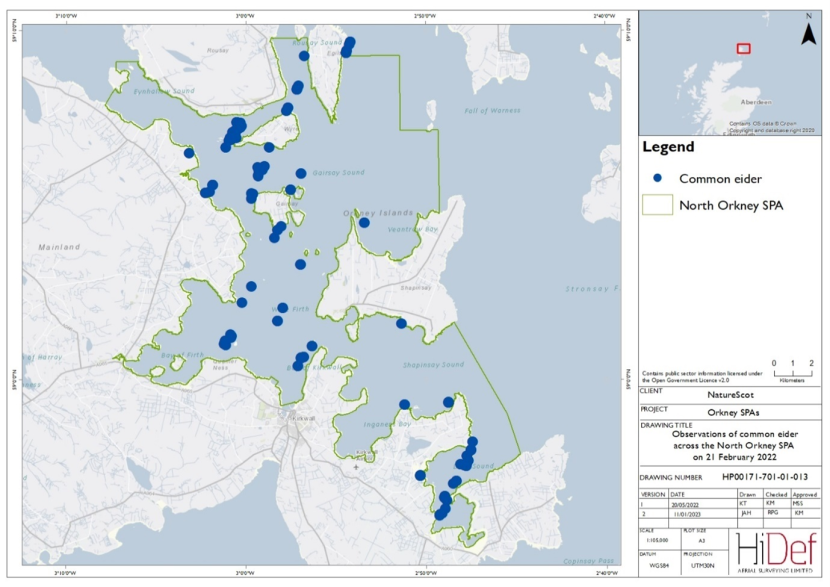
Figure 95. DAS observations of common eider within the North Orkney SPA on 21 February 2022.
Click for a full description
Map of North Orkney Special Protection Area with circles marking the locations of common eider that were observed during the aerial survey of 21 February 2022. There are 224 observations marked, widely distributed across the North Orkney Special Protection Area, except for the deepest waters in Gairsay and Shapinsay Sounds.
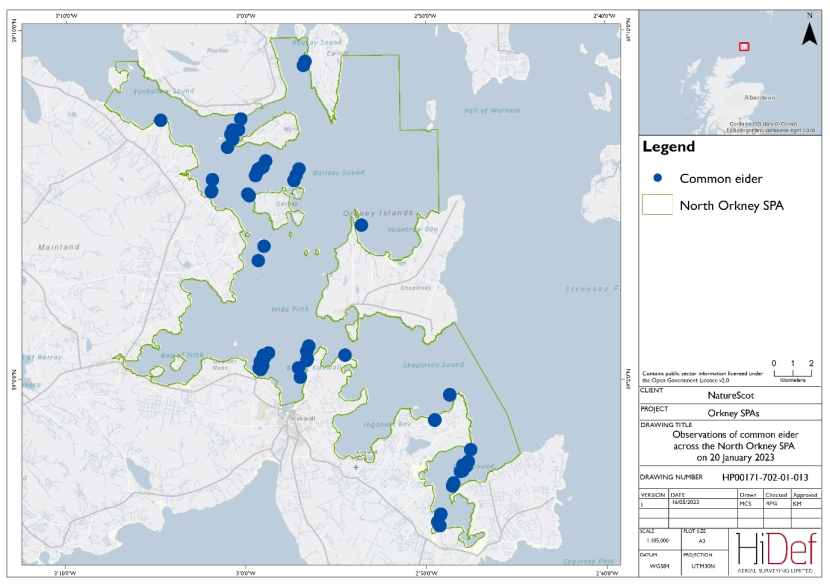
Figure 96. DAS observations of common eider within the North Orkney SPA on 20 January 2023.
Click for a full description
Map of North Orkney Special Protected Area with circles marking the locations of common eider that were observed during the aerial survey of 20 January 2023. Birds were widely distributed across Kirkwall Bay, except for the deepest waters in Gairsay and Shapinsay Sounds.
The predicted mean density of common eider, alongside the CV in these estimates, across the North Orkney SPA generated through Bayesian point processing is presented in Figure 97 and Figure 99 respectively for the February 2022 and January 2023 surveys. The highest densities (100 - 199.9 birds/km2) were recorded in Deer Sound during the February 2022 survey. Relatively high densities were also estimated at the mouth of Wyre Sound, south of Rousay. Wide Firth, in the centre of North Orkney SPA had an estimated density of 2 - 9.99 birds/km2. Highest densities in the January 2023 surveys were observed to the west of the Bay of Kirkwall with peak of 100 – 499.9 birds/km2. In both surveys, the lowest densities were in Shapinsay Sound, and in the north-east of the SPA, with 0.5 - 0.99 birds/km2 estimated in the February 2022 survey and 0 – 0.09 birds/km2 in the January 2023 survey. The distribution of birds was more even across the SPA in the February 2022 survey compared with the January 2023 survey. The lower and upper credible limits are mapped in Figure 98 and Figure 100 respectively for the February 2022 and January 2023 surveys.
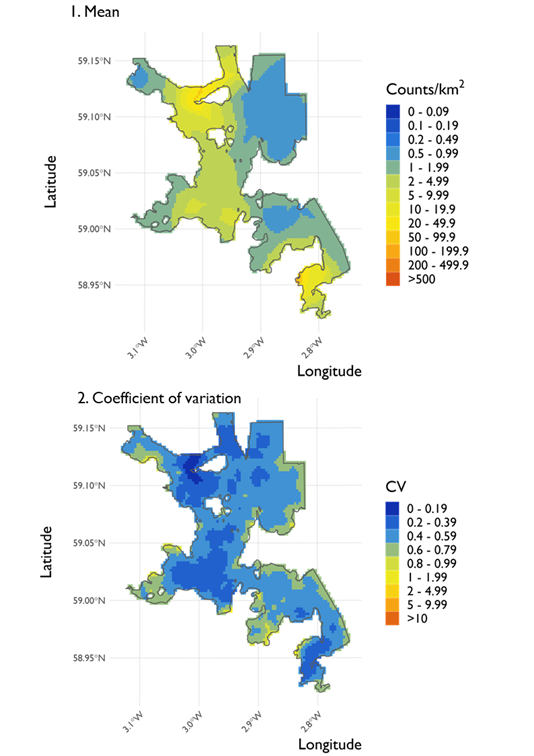
Figure 97. Two maps showing (1) the predicted density of common eider at the North Orkney SPA and (2) the coefficient of variation (CV) in these estimates across the SPA from the surveys conducted on 21 February 2022.
Click for a full description
Two maps of the North Orkney Special Protection Area organised vertically. Map 1 shows the predicted densities generated using Inlabru. The lowest densities of 0.5 – 0.99 counts/km2 occur in the north-east, south-east and north-west of the site. The north-eastern patch of low density is the largest. All these low-density areas are surround by areas with slightly higher densities of 1 – 1.99 counts/km2. Densities in the south-east then increase to a peak of 100 – 199.9 counts/km2. The centre of the site has a density of 2 – 9.99 counts/km2, with the same densities reported to the north and south of the centre. In the north of the site, densities increase further to peak at 50 – 99.9 counts/km2 along the northern border.
Map 2 shows the coefficient of variation associated with the mean densities shown in map 1. The majority of the shows low variance with values between 0.2 – 0.59. The lowest variance can be found in an area corresponding to the northern hotspot shown in map 1, with a variance of 0 – 0.19. The highest level of variance occurs at various points along the border of the site, with values of 0.6 – 1.99 recorded.
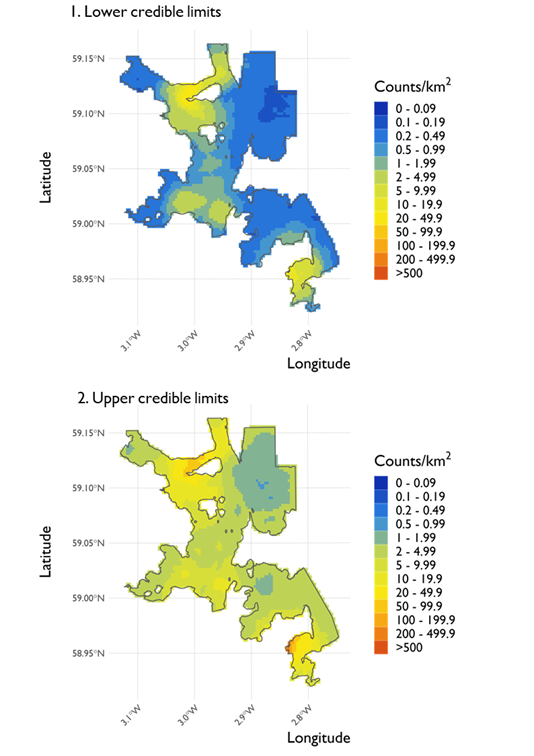
Figure 98. Two maps showing (1) the lower credible limits of density estimates for common eider at the North Orkney SPA and (2) the upper credible limits of these estimates across the SPA from the surveys conducted on 21 February 2022.
Click for a full description
Two maps of the North Orkney Special Protection Area organised vertically. The map 1 shows the lower credible limits of predicted densities generated using Inlabru. The majority of the map shows lower credible limits of 0 – 0.19 counts/km2. There are areas of higher densities with one patch to the south of the centre reaching values of 2 – 4.99 counts/km2. The highest densities are reported in the north and south-east of the site with densities of 20 – 49.9 counts/km2.
Map 2 shows the upper credible limits of density estimates, with the majority of the site ranging between 2 – 9.99 counts/km2. The most significant area of low density occurs in the north-east with values of 1 – 1.99 counts/km2, with small sections dropping further to 0.5 – 0.99 counts/km2. Other smaller areas of low density occur in the south-east and north-west of the site. The highest densities are recorded in the south-east and north of the site. In the north densities peak at 50 – 99.9 counts/km2, whereas in the south-east these values reach 100 – 199.9 counts/km2.
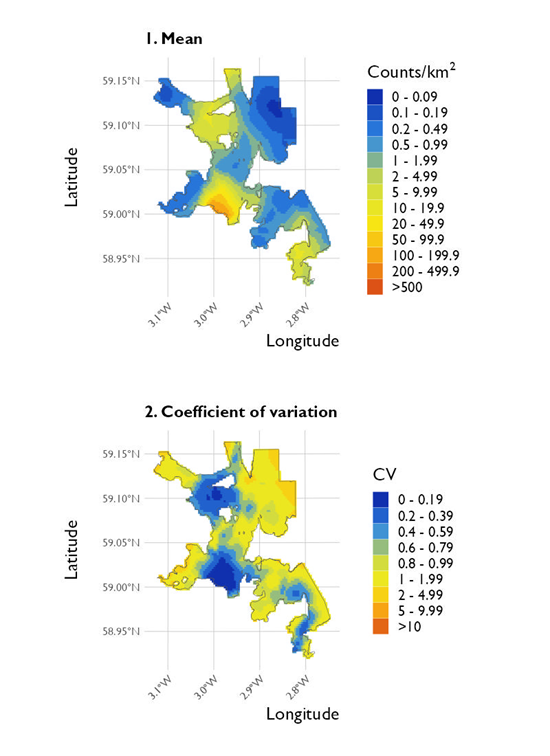
Figure 99. Two maps showing (1) the predicted density of common eider at the North Orkney SPA and (2) the coefficient of variation in these estimates across the SPA from the surveys conducted on 20 January 2023.
Click for a full description
Two maps of the North Orkney Special Protected Area organised vertically. Map 1 shows the predicted densities generated using Inlabru. The areas with the lowest densities are found in the north-east, north-west, south-west and in the centre of the map. These areas all have density predictions between 0 – 0.99 counts/km2. There are two areas with slightly higher predictions in the north and south-east, with densities in the range 5- 19.9 counts/km2. There is one hotspot with significantly higher density predictions just south of the centre, where predictions are as high as 100 – 499.9 counts/km2.
Map 2 shows the coefficient of variation associated with the mean densities shown in map 1. The areas with highest variation correspond to the areas with lowest density in map 1, and these areas are in the north-east, north-west, south-west and the centre. These areas have variation between 1 – 4.99 counts/km2. The areas with lowest variation correspond to the areas with highest density in map 1 – where the variation is between 0 – 0.59 counts/km2. These are the areas in the north, south-east, and just south of the centre.
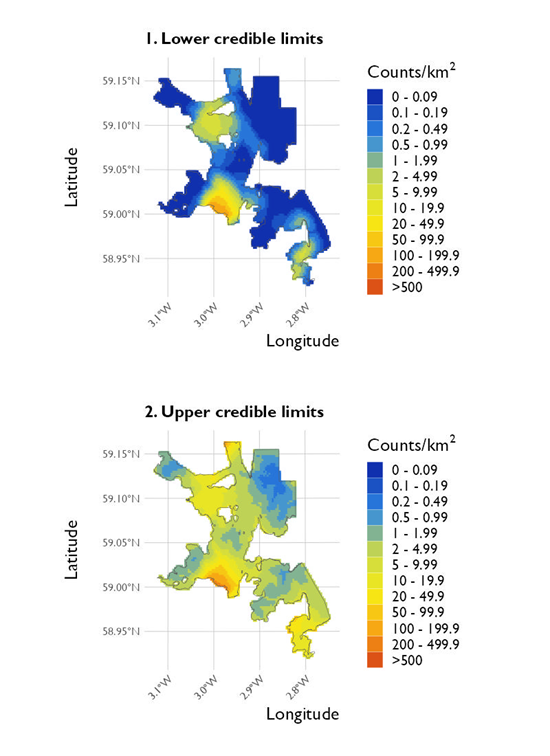
Figure 100. Two maps showing (1) the lower credible limits of density estimates for common eider at the North Orkney SPA and (2) the upper credible limits of these estimates across the SPA from the surveys conducted on 20 January 2023.
Click for a full description
Two maps of the North Orkney Special Protected Area organised vertically. Map 1 shows the lower credible limits of predicted densities generated using Inlabru. The north-east, north-west, south-west, south-east and the centre of the map all have low density in the range 0 – 0.09 counts/km2. These are the lowest predictions throughout the map. The areas with highest density predictions are found in the north, south, and just south of the centre. These predictions range from 5 – 499.9 counts/km2.
Map 2 shows the upper credible limits of density estimates. The majority of the map have predictions between 2 – 9.99 counts/km2, although there are areas with higher and lower densities. The north-east has the lowest predictions in the range 0.2 – 0.99 counts/km2, whilst the south has the highest densities, with a small area exceeding 500 counts/km2.
Common eider were observed in all months during the both the winter 2021/22 and winter 2022/23 shore-based counts, with significantly higher numbers of birds observed during winter 2022/23. The total monthly counts for sector 14 are presented in Table 47 and Table 48 respectively for the winter 2021/22 and 2022/23 surveys. The highest count of common eider during the winter 2021/22 surveys occurred in January 2022 (44 birds), followed by 23 birds observed in March 2022, with lower numbers of birds (11 - 18 birds) recorded in the other months surveyed. During the winter 2022/23 surveys, much higher counts of birds were observed with the peak in February 2023 (1,155 birds).
The distribution of common eider across sector 14 is presented in Figure 101 and Figure 102 respectively for the winter 2021/22 and winter 2022/23 surveys. Birds were most abundant in the west of the Bay of Kirkwall but were distributed across the sector during both the winter 2021/22 and 2022/23 surveys.
| Sector | Nov ‘21 | Dec ‘21 | Jan ‘22 | Feb ‘22 | Mar ‘22 |
|---|---|---|---|---|---|
| 14 | 12 | 18 | 44 | 11 | 23 |
| Sector | Nov ‘22 | Dec ‘22 | Jan ‘23 (survey 1) | Jan ’23 (survey 2) | Feb ‘23 | Mar ‘23 |
|---|---|---|---|---|---|---|
| 14 | 19 | 295 | 774 | 7 | 1155 | 539 |
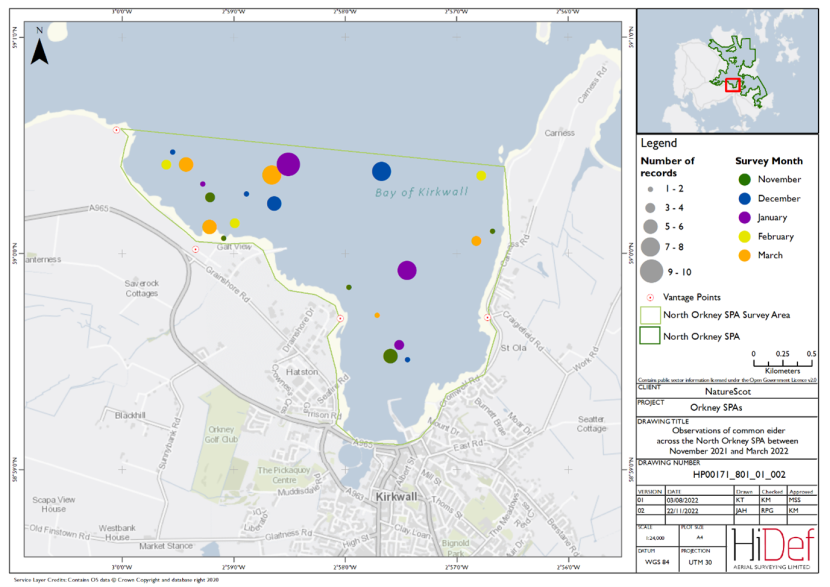
Figure 101. Shore-based observations of common eider within the North Orkney SPA sector between November 2021 and March 2022
Click for a full description
Orkney Special Protection Area during the winter 2021/22 shore-based surveys. Observations are represented by circles of increasing size relating to the number of birds seen, while colours are used to differentiate months. Observations occurred in all the winter months, most abundant in the west of the Bay of Kirkwall but they are also distributed across the sector.
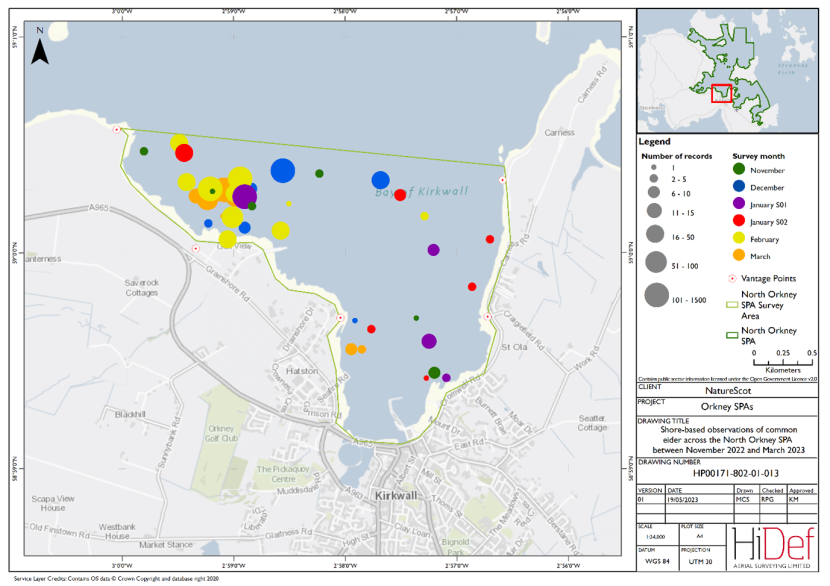
Figure 102. Shore-based observations of common eider within the North Orkney SPA sector between November 2022 and March 2023
Click for a full description
Map of shore-based observations of common eider at Bay of Kirkwall in the North Orkney Special Protected Area during the winter 2022/23 shore-based surveys. Observations are represented by circles of increasing size relating to the number of birds seen, while colours are used to differentiate months. Abundance of common eider was higher in the west of the bay with large flocks recorded in most months, peaking in February 2023 at 1155 birds recorded.
European shag
European shag is not a qualifying feature of the North Orkney SPA.
A total of 43 European shag were recorded in the February 2022 DAS (Table 5), and were widely distributed across the North Orkney SPA, as shown in Figure 103. More European shag were recorded in the January 2023 survey (Table 6), with 318 birds, the majority being observed on the northwest of the North Orkney SPA, and to the south-east, notably in Deer Sound (Figure 104).
Design-based strip transect analysis of the aerial survey data estimated the North Orkney SPA population at 150 birds (95 %CI 79 – 239) equating to a density of 0.71 birds/km2 during the February 2022 survey, compared with 1,345 birds (95 %CI 432 – 2,562) during the January 2023 survey, equating to a density of 5.91birds/km2 (Table 15). This compares to a similar estimate of 161 birds (95 % credible limits 109 – 218) from Bayesian point processing during the February 2022 survey, and a higher estimate of 1,667 birds (95 % credible interval 1,356 – 2,189) during the January 2023 survey (Table 22). It should be noted that observations were trimmed to the marine SPA boundary to derive both the design-based strip transect and model-based Bayesian population estimates. European shags frequently roost and wing-dry onshore or on skerries and tidally exposed rocks. As such, roosting birds that fall beyond this SPA boundary (i.e. above MLWS) were not included in such estimates.

Figure 103. DAS observations of European shag within the North Orkney SPA on 21 February 2022.
Click for a full description
Map of North Orkney Special Protection Area with circles marking the locations of European shag that were observed during the aerial survey of 21 February 2022. There are 43 observations marked, widely distributed across the North Orkney Special Protection Area.
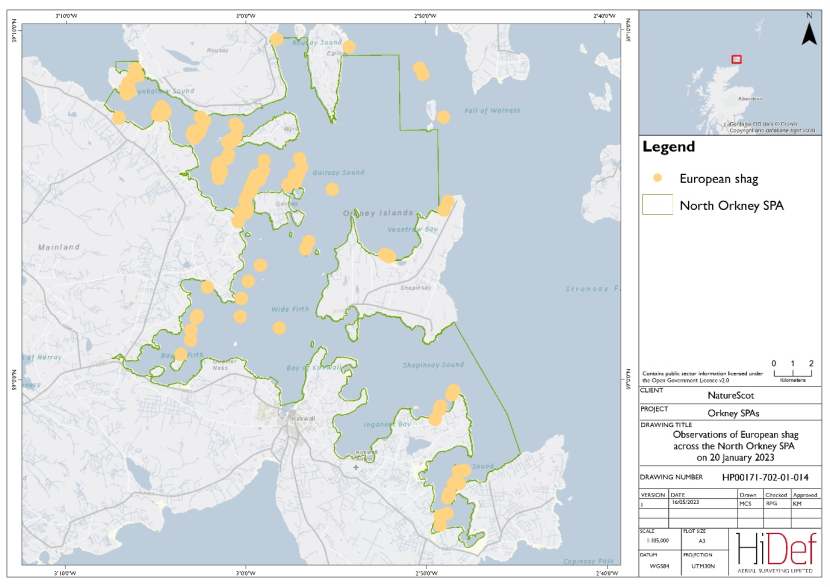
Figure 104. DAS observations of European shag within the North Orkney SPA on 20 January 2023.
Click for a full description
Map of North Orkney Special Protected Area with circles marking the locations of European shag that were observed during the aerial survey of 20 January 2023. Birds were distributed throughout the survey area with 318 birds recorded in total.
The predicted mean density of European shag, alongside the CV in these estimates, across the North Orkney SPA generated through model-based Bayesian point processing is presented in Figure 105 for the February 2022 survey and Figure 107 for the January 2023 survey. In the February 2022 survey, the estimated density of European shag across the site was mostly uniform at 0.5 - 0.99 birds/km2 but with areas of slightly higher estimated density (1 - 1.99 birds/km2) in Deer Sound, at the western end of Eynhallow Sound, and south of Gairsay Island. During the January 2023 survey, the number of birds recorded was much greater, with high densities occurring along the Orkney Mainland east coast and Deer Sound and highest densities (100 – 199.9 birds/km2) in Eynhallow Sound off the coast at Evie. Low densities were recorded in the deeper waters in the Shapinsay Sound and in the northeast of the SPA. The lower and upper credible limits are mapped in Figure 106 and Figure 108 respectively for the February 2022 and January 2023 surveys.
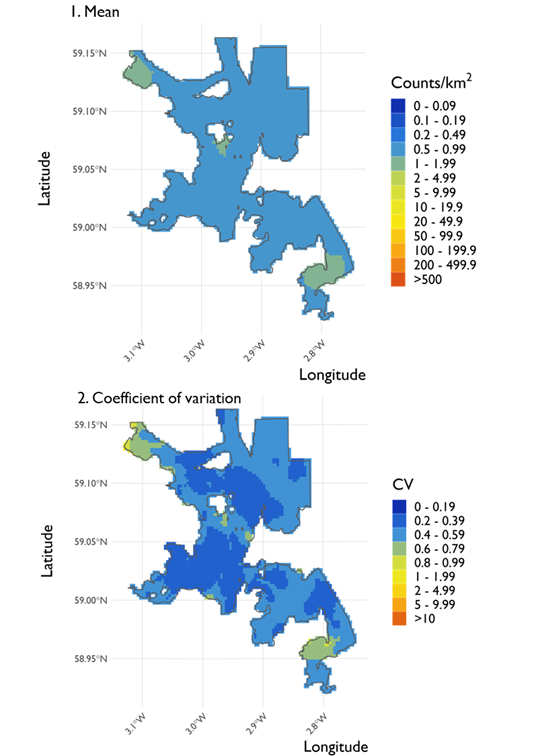
Figure 105. Two maps showing (1) the predicted density of European shag at the North Orkney SPA and (2) the coefficient of variation (CV) in these estimates across the SPA from the surveys conducted on 21 February 2022.
Click for a full description
Two maps of the North Orkney Special Protection Area organised vertically. Map 1 shows the predicted densities generated using Inlabru. The majority of the Special Protection Area shows densities of 0.5 – 0.99 counts/km2. However, there are three areas showing densities of 1 – 1.99 counts/km2, with the largest occurring in the south-east of the site, followed by the north-west and the smallest occurring in the centre.
Map 2 shows the coefficient of variation associated with the mean densities shown in Map 1. Values across most of the site ranger from 0 to 0.59. There are areas of higher variance with values of 0.6 – 0.79 being reported in the south-east and north-east of the site, as well as in smaller areas across the centre of the site. In the south-east and north-east areas there are also small areas peaking at 1 – 1.99.
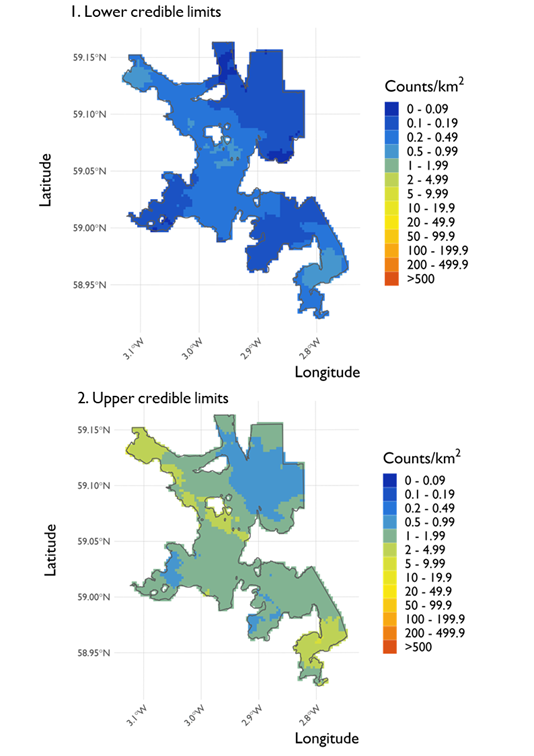
Figure 106. Two maps showing (1) the lower credible limits of density estimates for European shag at the North Orkney SPA and (2) the upper credible limits of these estimates across the SPA from the surveys conducted on 21 February 2022.
Click for a full description
Two maps of the North Orkney Special Protection Area organised vertically. The map 1 shows the lower credible limits of predicted densities generated using Inlabru. The lower credible limits throughout the site varies between 0 – 0.99 counts/km2. Areas of higher densities occur in the south-east, north-east and in small patches occurring in the centre of the site 0.5 -0.99 counts/km2. The lowest densities of 0 – 0.09 counts/km2 occur in the north, north-east and west along the borders of the site.
Map 2 shows the upper credible limits of density estimates, with the majority of the site ranging between 0.5 – 1.99 counts/km2. Higher densities of 2 – 4.99 are recorded in the south-east and in small areas in the northwest and centre of the site, with densities peaking at 5 – 9.99 in small patches in the northwest and south east of the site.
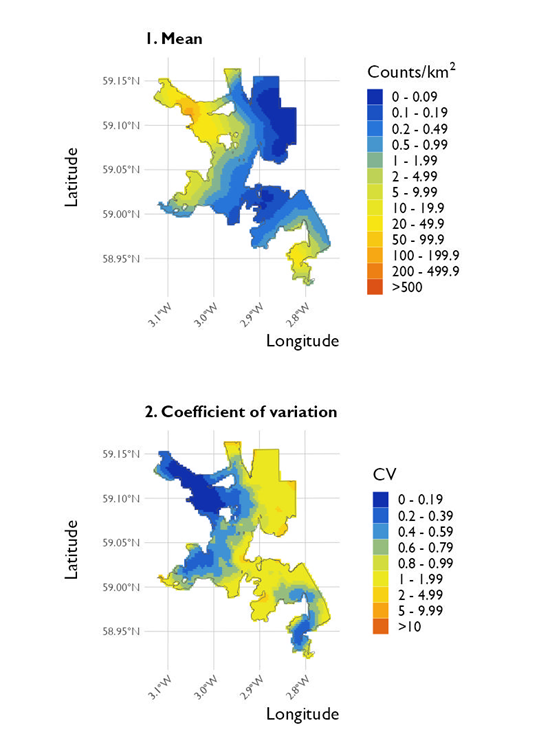
Figure 107. Two maps showing (1) the predicted density of European shag at the North Orkney SPA and (2) the coefficient of variation in these estimates across the SPA from the surveys conducted on 20 January 2023.
Click for a full description
Two maps of the North Orkney Special Protected Area organised vertically. Map 1 shows the predicted densities generated using Inlabru. The north-east and centre have low predictions in the range 0 – 0.19 counts/km2. The highest predictions are located in the north-west, where densities are in the range 20 – 199.9 counts/km2. There are two more areas with high estimates in the south-west and south-east, where predictions are in the range 20 – 49.9 counts/km2.
Map 2 shows the coefficient of variation associated with the mean densities shown in map 1. The areas with low variation correspond to the areas with high density in map 1, and these areas are in the north-west, south-west and south-east. The variation in these areas is in the range 0 – 0.59 counts/km2. The parts of the map with high variation correspond to the areas with low density in map 1. These areas are in the north-east and just south of the centre and have variation in the range 1 – 4.99 counts/km2.
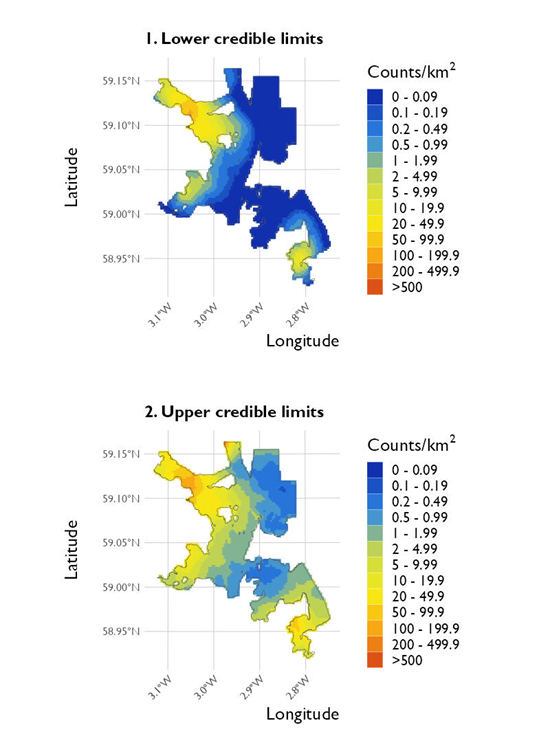
Figure 108. Two maps showing (1) the lower credible limits of density estimates for European shag at the North Orkney SPA and (2) the upper credible limits of these estimates across the SPA from the surveys conducted on 20 January 2023.
Click for a full description
Two maps of the North Orkney Special Protected Area organised vertically. Map 1 shows the lower credible limits of predicted densities generated using Inlabru. Most of the map shows low densities in the range 0 – 0.09 counts/km2. However, there is one large area in the north-west with high predictions between 20 – 199.9 counts/km2. Also, the south-west and south-east both have higher predictions in the range 10 – 49.9 counts/km2.
Map 2 shows the upper credible limits of density estimates. The highest estimates are in the north-west, where densities are between 20 – 199.9 counts/km2. The south-west and south-east also have high predictions in the range 20 – 99.9 counts/km2. The lowest predictions are in the north-east and just south of the centre. These predictions are in the range 0.1 – 0.99 counts/km2.
European shag were observed in all months during the winter 2021/22 and winter 2022/23 shore-based counts (Table 49 and Table 50 respectively). The highest count of European shag occurred in November during both the 2021/22 (24 birds) and 2022/23 (38 birds) surveys, followed by 17 birds observed in March 2022 and 22 birds in December 2022. Low numbers of European shag (7 - 14 birds) were recorded in the other months surveyed across both surveys.
The distribution of European shag across sector 14 is presented in Figure 109 and Figure 110 respectively for the winter 2021/22 and winter 2022/23 surveys. Birds were recorded across the sector in all months during the winter 2021/22 surveys, with one larger flock (10 individuals) observed in the middle of the Bay of Kirkwall in January 2022. During the winter 2022/23 surveys, birds were primarily distributed along the coast to the eastern side of the Bay of Kirkwall.
| Sector | Nov ‘21 | Dec ‘21 | Jan ‘22 | Feb ‘22 | Mar ‘22 |
|---|---|---|---|---|---|
| 14 | 24 | 14 | 14 | 7 | 17 |
| Sector | Nov ‘22 | Dec ‘22 | Jan ‘23 (survey 1) | Jan ’23 (survey 2) | Feb ‘23 | Mar ‘23 |
|---|---|---|---|---|---|---|
| 14 | 38 | 22 | 12 | 9 | 8 | 9 |
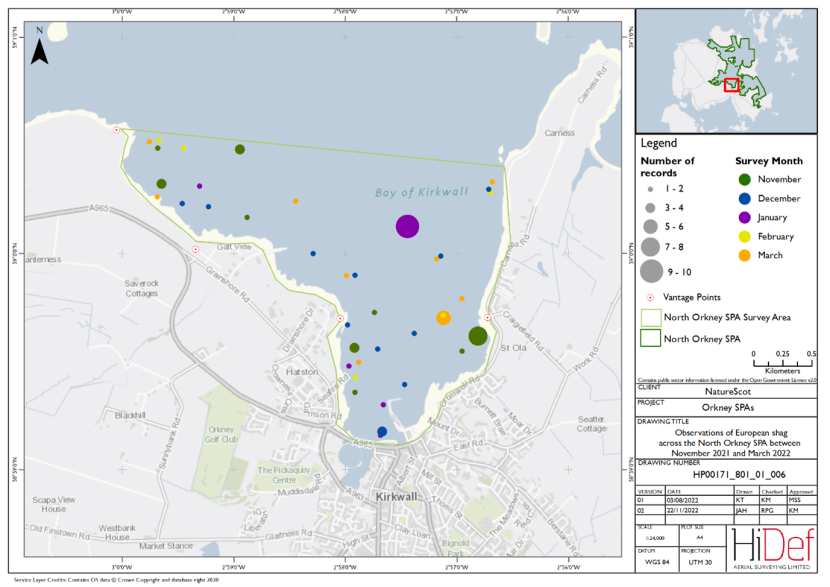
Figure 109. Shore-based observations of European shag within the North Orkney SPA sector between November 2021 and March 2022
Click for a full description
Map of shore-based observations of European shag at Bay of Kirkwall in the North Orkney Special Protection Area during the winter 2021/22 shore-based surveys. Observations are represented by circles of increasing size relating to the number of birds seen, while colours are used to differentiate months. Birds were recorded in all months across the sector in all months, with one larger flock of 10 individuals observed in the middle of the Bay of Kirkwall in January.
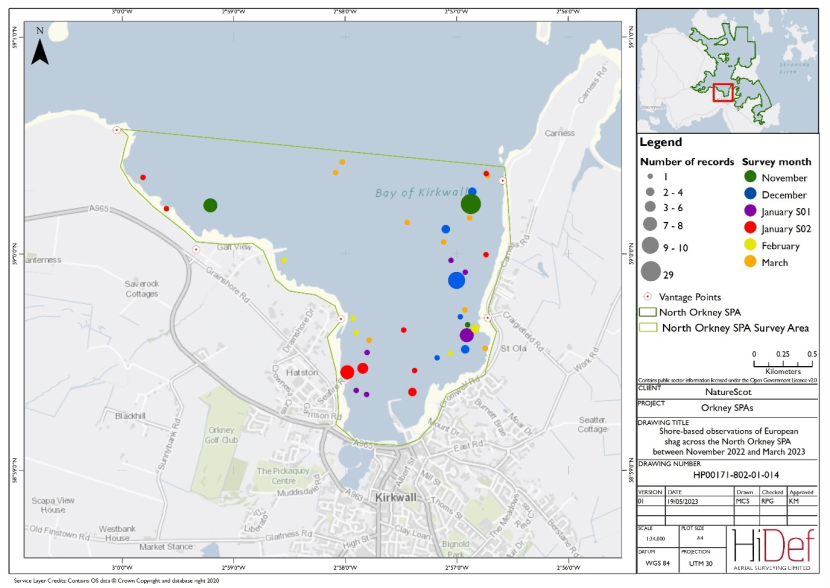
Figure 110. Shore-based observations of European shag within the North Orkney SPA sector between November 2022 and March 2023.
Click for a full description
Map of shore-based observations of European shag at Bay of Kirkwall in the North Orkney Special Protected Area during the winter 2022/23 shore-based surveys. Observations are represented by circles of increasing size relating to the number of birds seen, while colours are used to differentiate months. Birds were recorded in all months across the sector in all months, with one larger flock of 38 individuals observed in November 2022 in the northeast of the survey area.
Non-target species
A number of non-target species were recorded in the DAS of North Orkney SPA (Table 5; Table 6), the distributions of which are presented in Figure 111 for the February 2022 survey, and Figure 112 for the January 2023 survey.
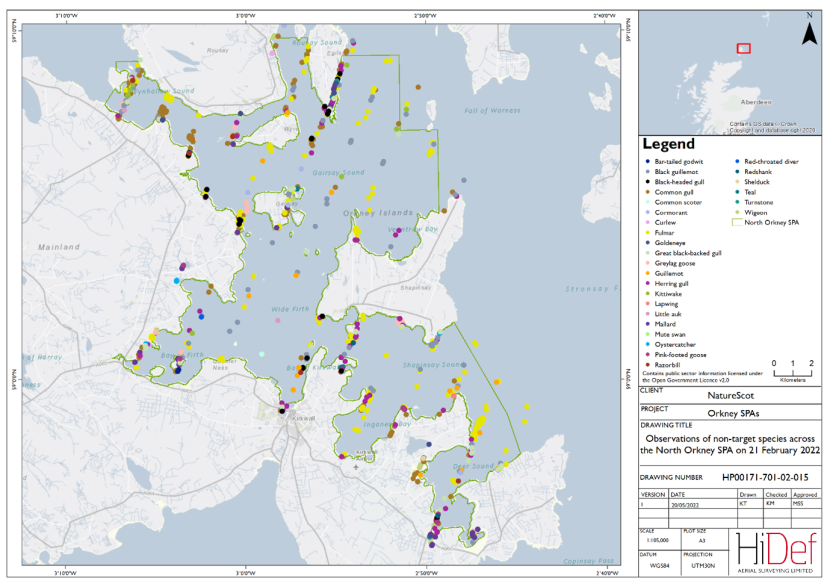
Figure 111. DAS observations of non-target wintering waterfowl species within the North Orkney SPA on 21 February 2022.
Click for a full description
Map of the North Orkney Special Protection Area with coloured points marking the location of non-target wintering waterfowl species observed from footage of the aerial survey taken on 21 February 2022. The non-target species observed are:
- Bar-tailed godwit
- Black guillemot
- Black-headed gull
- Common gull
- Common scoter
- Cormorant
- Curlew
- Fulmar
- Goldeneye
- Great black-backed gull
- Greylag goose
- Guillemot
- Herring gull
- Kittiwake
- Lapwing
- Little auk
- Mallard
- Mute swan
- Oystercatcher
- Pink-footed goose
- Razorbill
- Red-throated diver
- Redshank
- Shelduck
- Teal
- Turnstone
- Wigeon
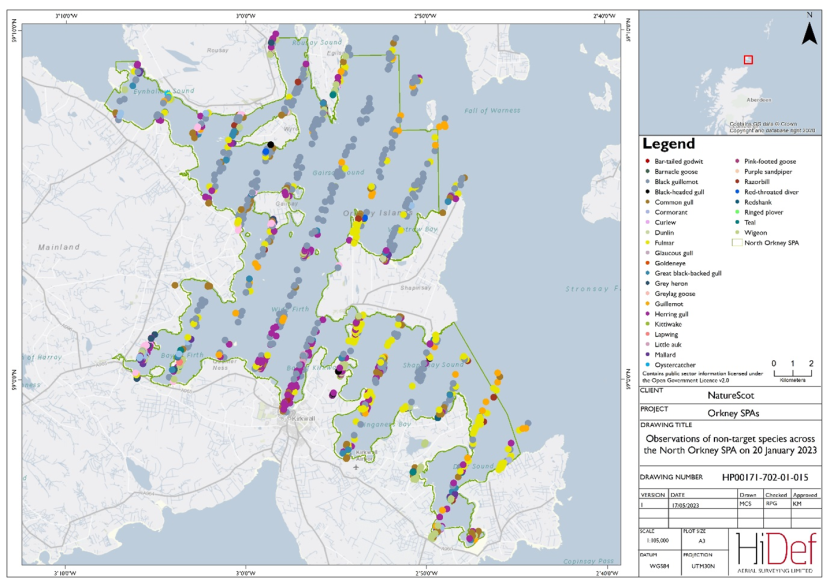
Figure 112. DAS observations of non-target wintering waterfowl species within the North Orkney SPA on 20 January 2023.
Click for a full description
Map of the North Orkney Special Protected Area with coloured points marking the location of non-target wintering waterfowl species observed from footage of the aerial survey taken on 20 January 2023. The non-target species observed are:
- Bar-tailed godwit
- Barnacle goose
- Black guillemot
- Black-headed gull
- Common gull
- Cormorant
- Curlew
- Dunlin
- Fulmar
- Glaucous gull
- Goldeneye
- Great black-backed gull
- Grey heron
- Greylag goose
- Guillemot
- Herring gull
- Kittiwake
- Lapwing
- Little auk
- Mallard
- Oystercatcher
- Pink-footed goose
- Purple sandpiper
- Razorbill
- Red-throated diver
- Redshank
- Ringed plover
- Teal
- Wigeon
Comparison of the results of DAS and shore-based surveys
On the 20 January 2023, DAS were undertaken on the same day as the shore-based counts in order to compare the results of the two survey methods. For Scapa Flow, DAS transects which crossed the shore-based count sectors were flown between approximately 11:30 and 12:07, whilst the shore-based counts were conducted between approximately 12:00 and 16:35 (Table 51). There was a direct temporal overlap in the surveys in sector 9, where the shore-based survey was conducted between 12:00 and 12:25, and the DAS transect across this sector was flown at 12.07. All other shore-based counts surveys within the Scapa Flow count sectors were conducted within approximately 4.5 hours of the DAS. At sector 14, within North Orkney SPA, the shore-based survey was conducted between 12:30 and 13:20 and the DAS transect at approximately 12:06.
| Sector | DAS approximate timing | Shore-based survey timing |
|---|---|---|
| 9 | 12:07 | 12:00 – 12:25 |
| 10 | 11:52 | 14:00 – 14:30 |
| 11 | 11:43 | 15:40 – 16:00 |
| 12 | 11:44 | 16:20 – 16:35 |
| 14 | 12:06 | 12:30 – 13:20 |
| 37 | 11:53 | N/A |
| 38 | 11:30 | 16:00 – 16:20 |
Scapa Flow Comparison
Figure 113 shows the DAS and shore-based counts recorded across the Scapa Flow shore-based count sectors. All birds from the DAS that were observed within the shore-based count sectors were identified to species level. For great northern diver two birds were observed in sector 9 (inner Scapa Bay) during the DAS, but not during the shore-based surveys. In sectors 11 and 38, a similar number of birds were observed by both survey methods in approximately the same location.
Similarly for red-breasted merganser, four birds were observed during the DAS in sector 9, whilst no birds were observed near this location in the shore-based counts. However, in the southernmost sector 38, two red-breasted merganser were observed by the DAS which may have been part of the adjacent flock of 12 birds observed during the associated shore-based count.
There were no Slavonian grebe observed during the DAS, whilst three observations within the DAS transect area were observed in sector 9 during the shore-based counts. However, it should also be noted that the mapped swathe does not show the gaps between cameras (~25 m), which could mean birds were missed during the DAS within this area. Slavonian grebe were also detected in two other sectors by the shore-based counts, including a flock of 28 birds in sector 38.
For common eider, there were more birds observed in sector 9 in the DAS compared with the shore-based counts. In sector 11, lower numbers of birds were observed within the DAS swathe during the shore-based counts; however, several groups of birds were observed nearby and in sector 10 during the shore-based counts which could represent the same individuals recorded several hours later in the day.
Large numbers of long-tailed duck were observed in sector 11 during the DAS, whereas many fewer were recorded during the shore-based counts in the same area. In sector 9, the DAS recorded a similar number of individuals to shore-based counts within the DAS swathe, but birds were recorded further offshore in the DAS. Similar observations for this species between the two survey methods were also observed in sector 38.
In sector 9, the DAS recorded slightly more European shag in the same camera swathe area than recorded during the shore-based counts, but the shore-based counts recorded a greater number of European shag overall. In sector 38 there were birds recorded during the shore-based counts where there were no observations during the DAS.
For black-throated diver, there were no observations in the DAS, and only one individual was recorded during the shore-based survey, which was observed outside of the DAS camera swathe in sector 12. Therefore, this species has not been mapped.
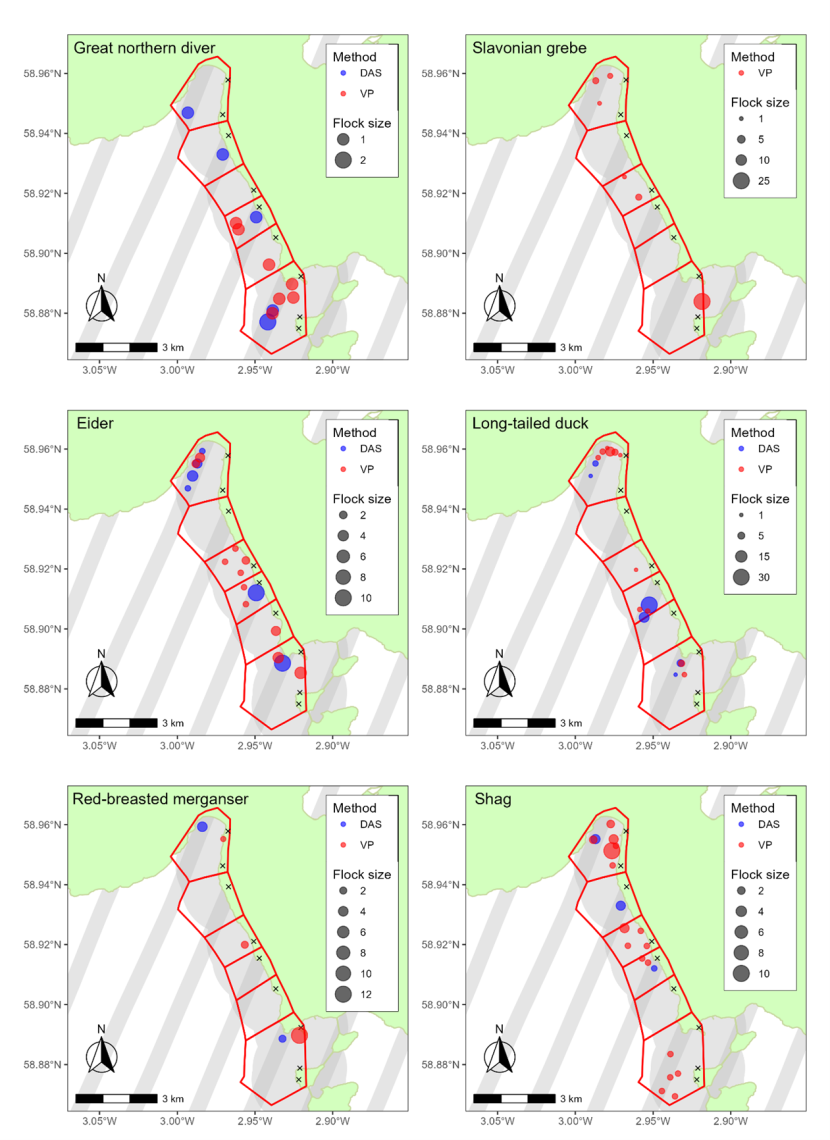
Figure 113. Comparison of observations of key species between simultaneous DAS & VP(shore-based) surveys on 20 Jan 2023 within the Scapa Flow SPA. The count sectors (red line) from north to south are S9,S37,S10,S11,S12 and S38. 1.75km buffer zone (grey)
Click for a full description
A map showing a comparison of DAS and shore-based observations of key species within count sectors (outlined in red) at the Scapa Flow Special Protected Area on 20 January 2023. Observations are represented by circles of increasing size relating to the number of birds seen. The circle markers are also coloured by survey method. The grey buffer marks 1.75km from shore, which is where shore-based detection is known to deteriorate (Webb and Reid, 2004). Overlap of records between the two methods was clearest for common eider in sector 9 and long-tailed duck in sector 11 while no Slavonian grebe were recorded in the DAS. A single black-throated diver was recorded in the shore-based surveys however, no birds were recorded in the DAS. The survey in sector 37 on 20 January 2023 was not completed due to difficulties with access.
North Orkney Comparison
Figure 114 shows the DAS and shore-based counts recorded across the North Orkney shore-based count sectors. All birds from the DAS that were observed within the shore-based count sectors were identified to species level. No great northern diver or Slavonian grebe were recorded in sector 14 during the DAS surveys. However, few birds of either species were observed during the shore-based counts; with only a single great northern diver overlapping the DAS transects.
For common eider, a large flock of birds was observed in the DAS in the northwest of sector 14, whilst far fewer birds were recorded during the shore-based counts in the same location. Large numbers of long-tailed duck were also observed in the northwest of sector 14, with similar distributions observed in the shore-based counts. For both species, several observations were also made in similar locations in the east of the sector.
For red-breasted merganser, a single bird was observed in the east of the sector during the shore-based counts. The individuals recorded during the DAS may represent some of the individuals recorded during the shore-based counts.
During the shore-based counts, 21 European shag were recorded, whilst there were no observations made of this species in sector 14 during the DAS. For black-throated diver, no birds were observed in either the DAS or shore-based counts.
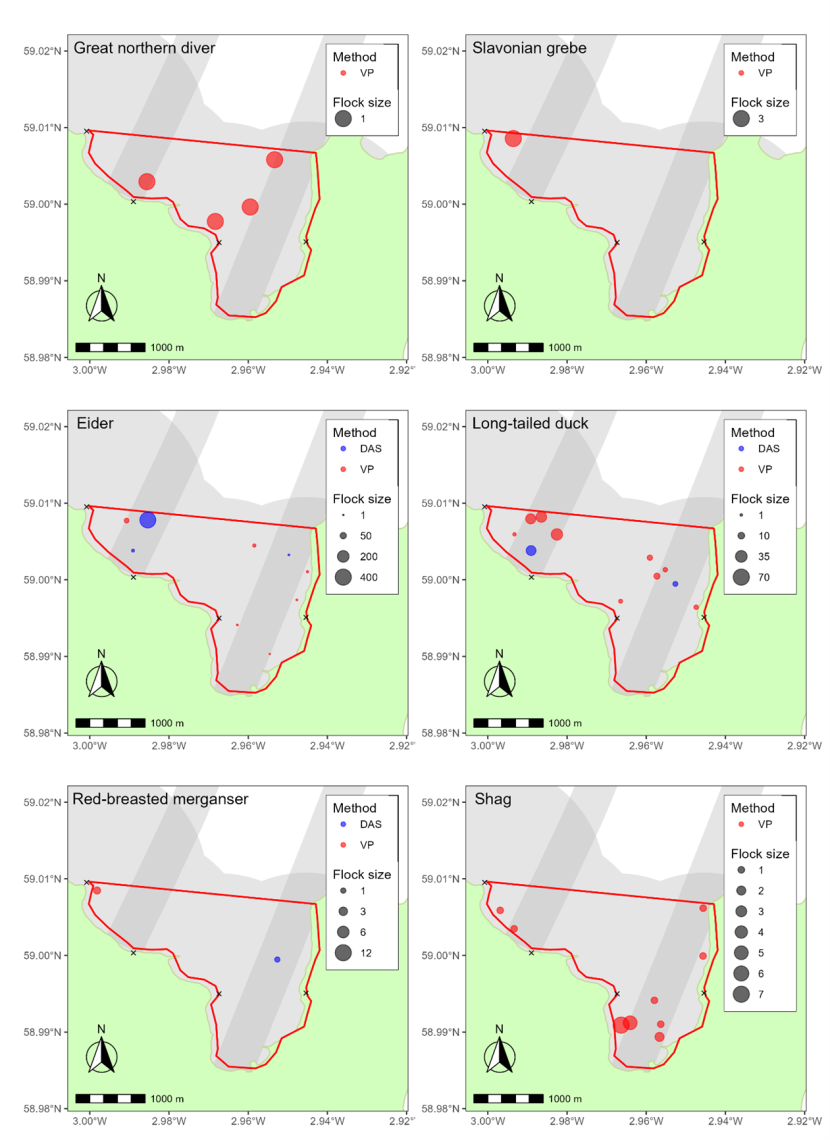
Figure 114. Comparison of observations of key species between simultaneous DAS and VP (shore-based) surveys on 20 January 2023 within the North Orkney SPA. 1.75km buffer zone (grey shading) is overlaid with count sector (red outline).
Click for a full description
A map showing a comparison of DAS and shore-based observations of key species within a count sector (outlined in red) at the North Orkney Special Protected Area on 20 January 2023. Observations are represented by circles of increasing size relating to the number of birds seen. The circle markers are also coloured by survey method. The grey buffer marks 1.75km from shore, which is where shore-based detection is known to deteriorate (Webb and Reid, 2004). No great northern diver, Slavonian grebe or European shag were recorded in the DAS however, there was some overlap for common eider and long-tailed ducks. No black-throated diver were recorded in the DAS or shore-based surveys on 20 January 2023.
Discussion
Target species estimates
Estimates of target species within the SPAs from the DAS are discussed alongside previous survey estimates of the region for comparison. This includes the original ‘Areas of Search’ that underpinned the pSPA site selection using a mixture of VAS and land-based counts (Lawson et al., 2015) and the 2017/18 surveys of the pSPA boundaries which utilised both land-based and boat-based counts (Jackson, 2018 and Upton et al., 2018). It is important to note that previous surveys covered larger areas than that of the current SPA boundaries (Figure 1) and so population estimates are not directly comparable. In particular, waters around South Ronaldsay included in the Scapa Flow pSPA are not included in the site as classified. In addition, the results reported previously were derived from multiple surveys within a single winter season (Jackson, 2018 and Upton et al, 2018) or across several winter seasons (Lawson et al, 2015) and as such are not directly comparable with snapshot DAS, as reported here. The various surveys also differed in their methodology as stated above.
Great northern diver
In Scotland, wintering great northern diver populations are generally located around the west and north coasts, with the highest winter population estimates being recorded in Orkney and Shetland (Booth et al., 1984; Williams, 2000; Lawson et al., 2015). The Orkney population is recognised as internationally important, since it comprises over 1 % of the biogeographic population; Scapa Flow was identified as supporting the third largest population in Scotland (Lawson et al., 2015).
The SPA population estimates generated from the DAS are compared with counts from previous surveys of the region in Table 52. The Bayesian model-based population estimate of great northern diver within the Scapa Flow SPA estimated from the 2022 DAS data (262 birds (95 %CI 197 - 343)) was comparable to the VAS estimate presented in Lawson et al. (2015) for a larger Area of Search (236 birds). The DAS estimates from the February 2022 survey were however lower than land-based counts presented in the same report (506 birds and 317 birds for Scapa Flow and North Orkney, respectively) and substantially lower than counts from the 2017/18 land and boat-based surveys (Jackson 2018, Upton et al 2018). In addition, there are apparent differences in distributions, with fewer birds detected in the central Scapa Flow and closer to shore in the north and east of the Scapa Flow than in the 2017/18 surveys. It should however, be noted that sea conditions were rougher during the 2022 survey, potentially affected detectability of great northern diver.
In comparison, the Bayesian model-based population estimate of great northern diver within the Scapa Flow SPA estimated from the January 2023 DAS survey (1,072 birds (95 % CI 884 – 1,232) was akin to the upper count of the original pSPA boundary from land and boat-based surveys in 2017/18 (Jackson, 2018) and higher than the Lawson et al. (2015) estimates. As with the 2022 survey, estimates in the North Orkney SPA from the 2023 DAS survey were lower than both previous reports.
Great northern divers are large birds and unlikely to have been missed along aerial transects if present at the sea surface. Whilst the species is known to be susceptible to flushing and/or diving in the presence of overhead aircraft, the high flight altitude of the DAS (550 m ASL) is beyond that known to flush birds or cause disturbance (Thaxter and Burton, 2009), so this is considered unlikely to have been a factor in the low population estimates recorded in the 2022 DAS survey. In addition, no signs of flushing of other species were noted during the survey.
In the case of North Orkney SPA, a proportionally high number of birds in the February 2022 survey were located just beyond the perimeter of the marine SPA boundary, potentially related to the higher sea-states observed across the SPA during this survey. The trimming of records to the marine SPA boundary resulted in a 32 % reduction in estimated numbers, partially accounting for the lower-than-expected population estimate.
In addition, some of this variation may be partially attributed to availability bias, where in shore-based and boat-based surveys, observers have a longer duration to survey a given area compared with DAS, increasing the likelihood that diving birds would return to the surface and be captured in these surveys. This applies particularly in the central Scapa Flow where deeper waters may mean birds are submerged for longer durations. The DAS estimates within this study have not been adjusted for availability bias.
Divers are visual predators, with increased dive duration strongly correlated with increased water clarity (Thompson and Price, 2006). A higher sea state is likely to increase water turbidity. However, when comparing the distribution of birds recorded in the February 2022 DAS with sea state, the highest densities were recorded between Cava and Fara, where sea state was ‘moderate’ (4) and birds were also recorded to the southwest of Burray and between Hoy and Graemsay, where sea state reached ‘rough’ (5). However, there were areas of calm water where birds were not recorded. It could be that birds were more likely to be recorded in these areas of higher sea state, due to them taking shorter foraging dives than in calmer areas.
Weather, and its associated sea state, was better in the January 2023 DAS and likely affected the natural variation in abundance and distribution of birds, which in turn may contribute to the substantial difference in the great northern diver population estimates between the two years. However, as reported in Jackson (2018), bird numbers can range greatly between different counts.
Typically, shore-based detection of birds begins to deteriorate ~1.75 km offshore (Webb and Reid, 2004). However, the relatively close proximity of surveyors to birds in land-based surveys under 2 km means more individuals are likely to be identified to species level compared to aerial surveys, which is particularly important for species groups with similar plumage (e.g. divers). In February 2022, the respective number of unidentified diver records from the DAS was 4.5 % of the number of great northern diver recorded in Scapa Flow and 25 % of the number recorded in North Orkney. This was 3.2 % and 15.6 % respectively in January 2023. Therefore, identification rate is unlikely to be a measurable factor in the low estimates for Scapa Flow SPA and does not account for the full difference in the North Orkney estimates.
The lowest numbers of great northern diver recorded in the 2021/22 shore-based counts occurred in February (6 birds compared to between 14 - 74 in Scapa Flow in other months, and 3 birds compared to between 3 – 18 in North Orkney). This corroborates the low abundances recorded in the February 2022 DAS, when not a single diver was recorded in the inshore sector areas. It may be that bird abundance was truly low in that month, supported by suggestion that from February onward birds start to move to other sites (Jackson, 2018).
| Survey | Method | Scapa Flow | North Orkney |
|---|---|---|---|
| Original Areas of Search (Lawson et al., 2015) | Mixture of visual aerial and land-based counts over multiple seasons and months | LBC - 506 Aerial - 236 WeBS -0 | LBC - 317 WeBS - 8 |
| pSPAs boundaries (Jackson, 2018; Upton et al., 2018) | Mixture of land-based and boat-based counts at roughly monthly intervals in 2017/18 | 571 – 1,016 | 441 - 777 |
| Final SPA boundaries from the current study | DAS single survey Feb 2022 – Strip transect analysis | 263 (95 %CI 174 - 369) | 79 (95 %CI 30 - 140) |
| Final SPA boundaries from the current study | DAS single survey Feb 2022 – Bayesian point processing | 262 (95 %CL 197 - 343) | 76 (95 %CL 42 - 122) |
| Final SPA boundaries from the current study | DAS single survey Jan 2023 – Strip transect analysis | 919 (95 %CI 572 – 1,310) | 191 (95 %CI 105 - 300) |
| Final SPA boundaries from the current study | DAS single survey Jan 2023 – Bayesian point processing | 1,072 (95 %CL 884 – 1,232) | 208 (95 %CL 145 - 282) |
Black-throated diver
During the winter non-breeding period, black-throated divers are generally located in a few key areas in Scotland, such as Scapa Flow (Williams, 2000), Caithness and the Moray Firth (Evans, 1998). At wintering sites, birds often congregate in small groups away from coast during which time they undergo a full moult (Forrester et al., 2012), making it difficult to accurately identify to species level regardless of the survey methodology utilised.
Single snapshot surveys, such as large-scale DAS, may result in few detections of relatively scarce species; consequently, Bayesian model-based analysis of the February 2022 and January 2023 DAS data could not be undertaken for this species due to the low number of birds detected. However, design-based population estimates for black-throated diver in Scapa Flow both DAS exceed the 1 % threshold of the GB population.
The Scapa Flow population estimated from the February 2022 DAS data using design-based methods (13 birds, 95 %CI 3 – 32) was within the range of birds recorded during different shore-based count rounds by Jackson (2018) (9 - 39 birds). The estimate from the January 2023 DAS (30 birds (95 % CI 0 – 84)) was closer to the higher estimates from the 2017/18 survey counts (Table 53). This is despite the difference in survey area, as no black-throated diver were observed in the additional area included in the pSPA surveyed by Jackson (2018).
In addition, the North Orkney population estimated from the February 2022 DAS data using design-based methods (5 birds, 95 %CI 0 - 13) is consistent with the number reported from shore-based counts by Upton et al. (2018) (4 birds).
The species is highly mobile, making it difficult to prevent double counting using traditional shore-based surveying methods (Williams, 1999). The relatively high flight speed (~120KN) of DAS surveys alleviates this problem, although distinguishing black-throated divers from other diver species can prove more challenging. This is evident in the present study, where a total of 11 black-throated diver were observed across both SPAs and both years, but a further 24 divers were recorded which could not be identified to species level (Table 5; Table 7). However, this number is likely to include great northern divers or even red-throated divers.
Shore-based counts in the present study recorded multiple small flocks, indicative of the wintering groups as described in Forrester et al. (2012). Such flocks may be missed by DAS if outside survey swathe. However, the use of aerial survey methods to monitor black-throated divers is also potentially beneficial since it can capture birds outwith the ~1.75 km detection range of shore-based surveys (Webb and Reid, 2004) and individuals are often located between 1 – 3 km offshore (Jackson, 2018). This is evident in the detections of birds during both DAS surveys (Figure 16; Figure 17).
Black-throated diver were only recorded in January 2022 during the winter 2021/22 shore-based counts while birds were recorded in all months apart from February 2023 in the winter 2022/23 shore-based counts.
| Survey | Method | Scapa Flow | North Orkney |
|---|---|---|---|
| Original Areas of Search (Lawson et al., 2015) | Mixture of visual aerial and land-based counts over multiple seasons and months | LBC - 57 Aerial - 0 WeBS -1 | LBC - 4 Aerial - 0 WeBS - 0 |
| pSPAs boundaries (Jackson, 2018; Upton et al., 2018) | Mixture of land-based and boat-based counts at roughly monthly intervals in 2017/18 | 9 - 39 | LBC - 4 |
| Final SPA boundaries from the current study | DAS single survey Feb 2022 – Strip transect analysis | 13 (95 %CI 0 - 32) | 5 (95 %CI 0 - 13) |
| Final SPA boundaries from the current study | DAS single survey Feb 2022 – Bayesian point processing | - | - |
| Final SPA boundaries from the current study | DAS single survey Jan 2023 – Strip transect analysis | 30 (95 %CI 0 - 84) | - |
| Final SPA boundaries from the current study | DAS single survey Jan 2023 – Bayesian point processing | - | - |
Slavonian grebe
Slavonian grebe are distributed throughout Scotland during the breeding season, primarily concentrated around inland freshwater lochs, after which they move towards shallow, coastal areas (Forrester et al., 2012). Although the breeding population of Scotland was estimated at around 50 birds in the 1990s, wintering populations were calculated at 339 – 499 birds, indicating the presence of birds migrating from other areas such as Iceland and north Norway (Forrester et al., 2012). Relatively high numbers of the species are known to overwinter at Scapa Flow and Orkney (Evans, 2000), with Scapa Flow considered to be the most important site in Scotland for the species (Scottish Natural Heritage, 2016a).
VAS of Scapa Flow in 2006/07 by Lewis (2008) did not record any Slavonian grebe despite there being a known population in the region (Pollitt et al., 2003). In contrast, the February 2022 DAS in the present study did detect Slavonian grebe and generated population estimates of 70 birds (95 %CI 40 - 123) in Scapa Flow SPA through Bayesian analysis and 38 birds (95 %CI 13 - 66) for North Orkney SPA, through design-based strip transect analysis (Bayesian could not be undertaken due to low counts). Surveys in 2023 detected higher numbers with population estimates of 114 birds (95 % CI 69 – 175) in Scapa Flow and 103 birds (95 % CI 61-163) in the North Orkney SPA through Bayesian analysis. This likely indicates reduced disturbance through increased flight speed and altitude for DAS as compared to VAS, which may be beneficial when recording this species.
However, population estimates from shore and boat-based surveys in winter 2017/18 were higher, comprising 27.5 % and 14.6 % of the GB population in Scapa Flow pSPA (peak count: 161 birds) and North Orkney pSPA (peak count: 303 birds), respectively (Jackson, 2018; Upton et al., 2018) (Table 54). This is despite the difference in survey area, as Slavonian grebe were not observed in the additional areas within the Scapa Flow and North Orkney pSPAs as surveyed by Jackson (2018) and Upton et al. (2018), respectively. DAS may not fully capture Slavonian grebe populations due to their small size and preference for sheltered areas which means shore-based counts are likely to be more reliable. This is also supported by the relatively high number of birds recorded from the shore-based VP surveys in the present study. Weather and associated sea state may also have affected the DAS results, whether by natural variation in abundance and distribution of birds, or by a reduced ability to detect grebe in higher sea states, with markedly higher estimates in both SPAs in the 2023 DAS when sea state was calmer.
However, the mean population estimate generated from the February 2022 DAS fell within the individual count range for Scapa Flow pSPA using shore and boat-based surveys (67 – 161 birds; as reported by Jackson, 2018). Slavonian grebe numbers may simply have been low during the February 2022 DAS. Only 3 birds were recorded in the inshore sectors in that month (with numbers ranging between 2 and 21 birds in other months). Population estimates generated from the January 2023 DAS were higher, particularly in the North Orkney SPA, and the highest shore-based counts were recorded in January in both years, suggesting there may be an increase of birds in this area at this time of year.
| Survey | Method | Scapa Flow | North Orkney |
|---|---|---|---|
| Original Areas of Search (Lawson et al., 2015) | Mixture of visual aerial and land-based counts over multiple seasons and months | LBC - 135 Aerial - 0 WeBS - 11 | LBC - 120 Aerial - 0 WeBS - 1 |
| pSPAs boundaries (Jackson, 2018; Upton et al., 2018) | Mixture of land-based and boat-based counts at roughly monthly intervals in 2017/18 | 67 - 161 | 200 - 303 |
| Final SPA boundaries from the current study | DAS single survey Feb 2022 – Strip transect analysis | 73 (95 %CI 29 - 132) | 38 (95 %CI 13 - 66) |
| Final SPA boundaries from the current study | DAS single survey Feb 2022 – Bayesian point processing | 70 (95 %CL 40 - 123) | - |
| Final SPA boundaries from the current study | DAS single survey Jan 2023 – Strip transect analysis | 100 (95 %CI 50 - 159) | 94 (95 %CI 24 - 206) |
| Final SPA boundaries from the current study | DAS single survey Jan 2023 – Bayesian point processing | 114 (95 %CL 69 - 175) | 103 (95 %CL 61 - 163) |
Red-breasted merganser
Red-breasted merganser are found year-round along the Scottish coast, typically breeding in sea lochs and estuaries and remaining around coastal areas during the winter non-breeding period (Forrester et al., 2012; Scottish Natural Heritage, 2016b). The wintering population is likely to be boosted by migrant birds from northern latitudes, such as those from Iceland and Fennoscandia (Forrester et al., 2012).
Shore-based counts presented in Lawson et al. (2015) indicated populations of 539 birds and 279 birds in the Scapa Flow and North Orkney Areas of Search, respectively (Table 55). Peak counts for Scapa Flow and North Orkney pSPAs in 2017/18, generated through shore and boat-based surveys, suggest the two areas may support approximately 4.4 % and 8.5 % of the GB population, respectively (equivalent to 370 and 717 birds; Jackson, 2018; Upton et al., 2018). However, the February 2022 DAS generated lower model-based population estimates of 102 birds (95 %CI 56 - 200) in Scapa Flow SPA and 214 birds (95 %CI 135 – 305) in North Orkney SPA. The January 2023 DAS generated higher estimates; 338 birds (95 % CI 255 – 435) in Scapa Flow SPA, similar to the peak count made by Jackson (2018). However, the estimated 331 birds (95 % CI 236 – 521) in North Orkney SPA were below the range recorded by Upton et al. (2018). Fewer than 10 red-breasted mergansers were observed in the additional pSPA area surveyed in Jackson (2018) and Upton et al. (2018), so the difference in counts in the 2022 DAS cannot be attributed to the reduced survey area in the DAS.
Despite this, the population size for North Orkney estimated by both DAS exceeded the 1 % threshold of the GB population (84 birds). The distribution of birds seen across the SPAs also match hotspots presented in Jackson (2018) and Upton et al. (2018); however, no birds were found near Stromness and Stenness in 2021/22, nor in some of the most northern Orkney bays such as Veantrow in both years.
Lower population sizes from DAS may be partly attributed to the ability of DAS to effectively distinguish species plumage from others such as goosander (as suggested by the relatively high number of ‘duck sp.’ recorded), due to overlap in distribution and habitat preference. Whilst red-breasted merganser are known to be sensitive to disturbance from boats and aircraft, with particularly high sensitivity to noise (Jarrett et al., 2018), and have been observed to flush from survey sites when surveyed from low flying aircraft or boat, the DAS surveys were flown well beyond the minimum height recommended and so are considered unlikely to have caused disturbance (Thaxter and Burton, 2009).
Sample snapshot surveys, as used within DAS, may not result in sufficient detections of relatively scarce species. Shore-based methods are likely to be more effective to monitor sparsely populated species typically found in inshore coastal areas, and more easily allow detection of birds located on intertidal rocks or land. Red-breasted merganser typically occur close inshore, in small groups or pairs, almost exclusively in the most sheltered coastlines, as is evident from the DAS (Figure 28 and Figure 29) and shore-based surveys (Figure 34 and Figure 35) in the present study. The species is known to roost on land, with birds recorded on brackish lochans during the 2017/18 shore-based counts. The production of the SPA estimates included records within the marine SPA boundary only and so some additional roosting birds may have been omitted from the estimates. For both SPAs, a proportionally high number of birds were located just beyond the perimeter of the marine SPA boundaries, with the trimming of records to the marine SPAs resulting in a 34.48 % and 21.54 % reduction for Scapa Flow and North Orkney during the winter 2021/22 surveys, respectively, partially accounting for some of the lower-than-expected population estimates. This had a lower proportional effect during the winter 2022/23 surveys, with the trimming of records resulting in only 6.98 % and 14.10 % reductions respectively for each SPA. Rougher sea conditions during the February 2022 DAS may also have impacted the detectability of the species.
There is also the possibility that bird abundance was truly low in February 2022. The lowest numbers of birds recorded in the 2021/22 shore-based VP surveys occurred in February; with 3 birds observed in the North Orkney inshore sector (compared to between 6 – 41 in other months) and 11 observed in the Scapa Flow inshore sector (compared to between 13 – 24 in other months). This was also the case in the 2022/23 shore-based suveys in Scapa Flow, where the lowest number of birds was recorded in February 2023 (2 birds compared with between 3 and 15 in other months). Observations of red-breasted merganser were higher in the North Orkney SPA with the lowest number of birds recorded in the second January 2023 survey, the same month as the January 2023 DAS (2 birds compared with between 8 and 44 in other months).
One of the disadvantages to sample-snapshot surveys, such as DAS, is that they may coincide with periods of low bird abundance, as is expected with natural variation. Undertaking repeated surveys can counteract this but may be less cost effective than other methods.
| Survey | Method | Scapa Flow | North Orkney |
|---|---|---|---|
| Original Areas of Search (Lawson et al., 2015) | Mixture of visual aerial and land-based counts over multiple seasons and months | LBC - 539 Aerial - 101 WeBS - 0 | LBC - 279 WeBS - 35 |
| pSPAs boundaries (Jackson, 2018; Upton et al., 2018) | Mixture of land-based and boat-based counts at roughly monthly intervals in 2017/18 | 200 - 370 | 546 - 717 |
| Final SPA boundaries from the current study | DAS single survey Feb 2022 – Strip transect analysis | 79 (95 %CI 25 - 157) | 214 (95 %CI 37 - 506) |
| Final SPA boundaries from the current study | DAS single survey Feb 2022 – Bayesian point processing | 102 (95 %CL 56 - 200) | 214 (95 %CL 135 - 305) |
| Final SPA boundaries from the current study | DAS single survey Jan 2023 – Strip transect analysis | 330 (95 %CI 417 - 569) | 284 (95 %CI 68 - 663) |
| Final SPA boundaries from the current study | DAS single survey Jan 2023 – Bayesian point processing | 338 (95 %CL 255 - 435) | 331 (95 %CL 236 - 521) |
Velvet scoter
During the winter period, velvet scoters are typically found in coastal waters, generally distributed along the east coast and north coast around Orkney and Caithness (Forrester et al., 2012).
No velvet scoters were recorded during either DAS surveys of Scapa Flow or North Orkney, nor in the original VAS conducted by Lawson et al. (2015) (Table 56).
No birds were recorded in shore-based surveys in North Orkney SPA during winter 2021/22; however, a total of 29 birds were recorded in December 2022 and the first January 2023 survey in winter 2022/23. This is despite the shore-based surveys being conducted in sectors in which no velvet scoter were recorded in previous counts (Upton et al., 2018). Existing evidence suggests North Orkney supports between approximately 6-10 % of the GB population (Scottish Natural Heritage, 2016a; Upton et al., 2018), however this was not supported by the present study.
A small flock of seven birds was recorded in the shore-based surveys of Scapa Flow in January 2022, however, no velvet scoter were recorded in any other survey during the winter 2021/22 or winter 2022/23 shore-based surveys. In Jackson (2018), no velvet scoter were recorded in this area across the surveys, and peak counts summed across the wider pSPA area equated to eight birds.
Velvet scoter are relatively obvious birds to identify at close range and can form substantial flocks. However, these flocks often occur beyond 2 km offshore and as mixed-species flocks which can make identification challenging. Sitting birds can be mistaken for common scoter in both aerial and shore-based surveys, particularly if the characteristic white wing bar is concealed which is more likely to occur when looking from above. HiDef cameras are angled to avoid this problem somewhat and size and shape are still useful indicators to determine species. However, few common scoter were observed during both the DAS and shore-based surveys, making misidentification an unlikely cause of the low estimates.
Typically, aerial surveys are not recommended for the species, with shore-based surveys generally yielding higher detection rates. Population estimates from strip transect survey designs, as used in DAS, may underestimate true population sizes if large flocks happen to fall outside of transects. However, shore-based methods may also be insufficient for this species, as flocks often occur further than ~1.75 km offshore, which may account for low counts or absence of velvet scoter during the shore-based counts.
Fluctuations in estimated populations have been attributed to the challenges in accurately surveying the species and have been suggested to not accurately reflect true population change (Forrester et al., 2012).
| Survey | Method | Scapa Flow | North Orkney |
|---|---|---|---|
| Original Areas of Search (Lawson et al., 2015) | Mixture of visual aerial and land-based counts over multiple seasons and months | LBC - 13 Aerial - 0 WeBS - 0 | LBC - 147 Aerial - 0 WeBS - 2 |
| pSPAs boundaries (Jackson, 2018; Upton et al., 2018) | Mixture of land-based and boat-based counts at roughly monthly intervals in 2017/18 | 8 | 131 - 244 |
| Final SPA boundaries from the current study | DAS single survey Feb 2022 – Strip transect analysis | - | - |
| Final SPA boundaries from the current study | DAS single survey Feb 2022 – Bayesian point processing | - | - |
| Final SPA boundaries from the current study | DAS single survey Jan 2023 – Strip transect analysis | - | - |
| Final SPA boundaries from the current study | DAS single survey Jan 2023 – Bayesian point processing | - | - |
Long-tailed duck
Wintering populations of long-tailed duck in Scotland are primarily located in sheltered, coastal areas, although birds have been observed offshore during this period (Forrester et al., 2012). They typically have high site fidelity, possibly due to habitat requirements, with wintering hotspots located in the Moray Firth, Shetland and Orkney (Forrester et al., 2012).
Long-tailed duck was the most abundant species recorded in both DAS surveys of Scapa Flow; abundance was also relatively high in North Orkney. Model-based estimates from Bayesian point processing varied slightly to those from design-based but were inside the 95 % CIs. Model-based population estimates from the 2021/22 DAS across Scapa Flow and North Orkney SPA were calculated at 1,502 birds (95 % CI 1,279 – 1,792) and 1,915 birds (95 % CI 1,668 – 2,734), respectively. This is compared to the 2022/23 DAS survey where 3,678 birds (95 % CI 3,321 – 4,343) and 2,428 birds (95 % CI 3,199 – 2,654) were estimated in Scapa Flow and North Orkney SPA, respectively.
The 2022 DAS estimates were higher than both VAS and land-based counts undertaken by Lawson et al. (2015) but lower than the 2017/18 peak counts for the pSPA areas acquired through shore and boat-based surveys (Table 57). However, these figures were still well within the individual count ranges from the 2017/18 surveys; with between 893 and 1,996 birds recorded in the Scapa Flow pSPA and 1,271 - 2,651 birds recorded in the North Orkney pSPA (Jackson,2018; Upton et al., 2018). This is despite the difference in survey area, as very few long-tailed ducks were observed in the additional pSPA areas surveyed by Jackson (2018) and Upton et al. (2018), such as the southern sectors around South Ronaldsay. In contrast, the 2023 DAS estimate for Scapa Flow was 84 % higher than the highest count by Jackson (2018), whilst the North Orkney estimate was similar to the highest count from Upton et al. (2018).
As with other species, timing of the snapshot DAS may be relevant. February had relatively low numbers of long-tailed duck recorded in the 2021/22 shore-based surveys compared to other months. Shore-based counts in the present study recorded 34 birds in the Scapa Flow inshore sectors (compared to between 90 and 168 in other months) and 10 birds in the North Orkney inshore sector (compared to between 1 and 72 in other months). It was a similar case in the January 2023 DAS where shore-based counts in this month had the lowest number of long-tailed ducks recorded (31 birds compared to between 108 and 265 in other months and 9 birds compared to between 15 and 471 in other months in Scapa Flow and North Orkney, respectively). This may be indicative of lower abundances of long-tailed duck during February 2022 and second January 2023 shore-based surveys and shows the inter-monthly variability of populations over the winter period.
As with any diving species, snapshot surveys such as aerial surveys may miss birds diving at the time of survey leading to underestimated population size, and no correction factor was applied to the DAS estimates to account for this. In shore-based counts observers have a longer period of time to count a given area increasing the likelihood that diving birds would return to the surface and be captured in the shore-based surveys.
For transect surveys, flocks of birds present between transects can be missed if they are beyond the range of sampled area. Long-tailed duck exploit a variety of prey species and can dive up to 60 m, therefore shore-based counts may not be as effective at capturing true population size if individuals are distributed in deeper, offshore waters. Numbers of long-tailed duck were markedly higher in the 2023 DAS, so it may be that the 2022 DAS was a reflection of the poorer weather and sea state at that time. Again, this may suggest a reduction in the ability to detect long-tailed duck in high sea states, or truly reflect a lower abundance of birds in the area at this time.
The distribution of long -tailed duck in Scapa Flow is likely to be influenced by attraction to fish farms, such as those located along the east coast of Hoy, the north coast of South Ronaldsay and within sector 12 of the Scapa Flow inshore sectors; which had the highest mean percentage use of any sector in the present study (48.13 % in February 2022; 56.51 % in January 2023).
| Survey | Method | Scapa Flow | North Orkney |
|---|---|---|---|
| Original Areas of Search (Lawson et al., 2015) | Mixture of visual aerial and land-based counts over multiple seasons and months | LBC – 1393 Aerial - 631 WeBS - 0 | Aerial – 952 WeBS - 81 |
| pSPAs boundaries (Jackson, 2018; Upton et al., 2018) | Mixture of land-based and boat-based counts at roughly monthly intervals in 2017/18 | 893 – 1,996 | 1,274 – 2,651 |
| Final SPA boundaries from the current study | DAS – Strip transect analysis | 1,381 (95 %CI 719 – 2,160) | 1,570 (95 %CI 554 – 3,170) |
| Final SPA boundaries from the current study | DAS – Bayesian point processing | 1,502 (95 %CL 1,279 – 1,792) | 1,915 (95 %CL 1,668 – 2,734) |
| Final SPA boundaries from the current study | DAS single survey Jan 2023 – Strip transect analysis | 3,149 (95 %CI 625 – 7,559) | 2,190 (95 %CI 1,051 – 3,331) |
Final SPA boundaries from the current study | DAS single survey Jan 2023 – Bayesian point processing | 3,678 (95 %CL 3,321 – 4,343) | 2,428 (95 %CL 2,199 – 2,654) |
Common eider
Common eider are widely distributed across the UK but are predominantly found in northern England and Scotland. They are a qualifying feature of Scapa Flow only, which supports the 4th largest population in Scotland.
In 2017/18, a peak of 2,324 birds were recorded in Scapa Flow pSPA (3.9 % of the GB wintering population; Jackson, 2018) and 3,806 birds were recorded in North Orkney pSPA (6.3 % of the GB wintering population; Upton et al., 2018), in shore-based surveys, with additional boat-based surveys of the central Scapa Flow (Table 58). The model-based population estimates derived from the February 2022 DAS were considerably lower, with 676 birds (95 % CI 534 - 824) and 905 birds (95 % CI 759 – 1,580) estimated for Scapa Flow SPA and North Orkney SPA respectively. Estimates from the January 2023 DAS (Scapa Flow: 1,504 birds (95 % CI 1,322 – 1,706); North Orkney: 2,134 birds (95 % CI 1,887 – 2,421)) were much higher and similar to the lowest respective counts from the 2017/18 surveys (Jackson, 2018; Upton et al., 2018). However, estimates from the February 2022 DAS do overlap with previous VAS for North Orkney (Lawson et al., 2015). Despite common eider being a qualifying feature of the Scapa Flow SPA only, higher population estimates were estimated for North Orkney in both the February 2022 DAS and the 2017/18 pSPA surveys.
Common eiders are a relatively large (50-60cm), conspicuous bird with contrasting plumage, making them relatively easy to detect in DAS surveys. However, as a flocking species, there is potential for eider in dense aggregations to be underestimated during both aerial and shore-based surveys. February produced the lowest counts in the 2021/22 shore-based surveys for both the Scapa Flow inshore sectors (28 birds compared to between 58 – 100 in other months) and the North Orkney inshore sector (11 birds compared to between 12 and 44 in other months). The same was true for the 2022/23 shore-based surveys where the month with both the DAS and shore-based counts (January Survey 02 2023) produced the lowest counts (2 birds compared to between 29 and 109 in Scapa Flow sectors and 7 birds compared to between 19 – 1,155 in North Orkney). As such, the DAS population estimates may be a reflection of natural variation and low bird abundance in those months.
During the February 2022 DAS, a proportionally high number of birds were located just beyond the perimeter of the marine SPA boundaries, with the trimming of records to the marine SPAs resulting in a 27.60 % and 10.27 % reduction for Scapa Flow and North Orkney respectively. This may be due to birds taking refuge following the poor weather conditions observed prior to this survey and may partially account for some of the lower-than-expected population estimates. The percentage difference in the January 2023 survey was much lower (Scapa Flow: 0.85 %; North Orkney: 2.34 %)
Common eider predominantly occurred around the coasts and shallow inshore waters around the SPAs. The eastern part of the central Scapa Flow is generally too deep for foraging, as common eider dive to the seabed for their prey. The distribution of birds in Scapa Flow is also likely influenced by attraction to fish farms, such as those located along the east coast of Hoy, the north coast of South Ronaldsay and within sector 12 of the Scapa Flow inshore sectors; which had a relatively high mean percentage use compared to other sectors in the present study (30.64 % and 29.95 % during the 2021/22 and 2022/23 surveys, respectively). Birds did not appear to use sector 37 in either year (with the exception of one observation in March 2023), which was consistent with findings presented in Jackson (2018). This may be a result of the seabed dropping off quickly in this part of the coastline such that this area is not optimal for foraging.
| Survey | Method | Scapa Flow | North Orkney |
|---|---|---|---|
| Original Areas of Search (Lawson et al., 2015) | Mixture of visual aerial and land-based counts over multiple seasons and months | LBC – 1,994 Aerial – 1,850 WeBS - 0 | Aerial – 1,471 WeBS - 49 |
| pSPAs boundaries (Jackson, 2018; Upton et al., 2018) | Mixture of land-based and boat-based counts at roughly monthly intervals in 2017/18 | 1,696 – 2,324 | 2,102 – 3,806 |
| Final SPA boundaries from the current study | DAS single survey Feb 2022 – Strip transect analysis | 581 (95 %CI 263 - 961) | 840 (95 %CI 328 – 1,535) |
| Final SPA boundaries from the current study | DAS single survey Feb 2022 – Bayesian point processing | 676 (95 %CL 534 - 824) | 905 (95 %CL 759 – 1,580) |
| Final SPA boundaries from the current study | DAS single survey Jan 2023 – Strip transect analysis | 1,456 (95 %CI 454 – 2,938) | 2,266 (95 %CI 285 – 5,842) |
| Final SPA boundaries from the current study | DAS single survey Jan 2023 – Bayesian point processing | 1,504 (95 %CL 1,322 – 1,706) | 2,134 (95 %CL 1,887 – 2,421) |
European shag
European shag is a common and widespread resident of coastal regions throughout Scotland. They are partially migratory, with some individuals remaining at the breeding colonies in Scotland throughout the year, and others migrating south into England in winter (Forrester et al., 2012). Scapa Flow SPA supports the largest concentration of wintering European shag in Great Britain, and North Orkney is one of only three areas of Scotland where non-breeding aggregations of European shag have been identified (Scottish Natural Heritage, 2016a; 2016b).
In 2017/18, a peak count of 3,726 birds was recorded in shore and boat-based surveys of Scapa Flow (3.4 % of the GB wintering population; Jackson, 2018) and 2,968 birds in shore-based surveys of North Orkney (2.7 % of the GB wintering population; Upton et al., 2018). European shag were consistently recorded throughout the 2021/22 shore-based counts for both sites. Despite a marked increase in the January 2023 DAS, the Bayesian model-based population estimates derived from both the February 2022 and January 2023 DAS in this report were considerably lower than the 2017/18 peak estimates, at 134 birds (95 % CI 88 - 193) and 161 birds (95 % CI 109 - 218) in February 2022 and 872 birds (95 % CI 597 – 1,560) and 1,667 birds (95 % CI 1,356 – 2,189) in January 2023 for Scapa Flow SPA and North Orkney SPA respectively (Table 59).
Whilst there were European shag observed throughout the pSPA areas surveyed by Jackson (2018) that were not subsequently within the final SPA boundaries, the vast majority of observations were within the Scapa Flow SPA as surveyed by DAS in the present study. For North Orkney SPA in 2017/18 (Upton et al., 2018), 294 and 59 individuals respectively were observed in sectors 1 and 5, which were not surveyed in the present study. However, the reduction in survey area to match the SPA boundary does not fully account for the lower DAS estimates.
An additional number of factors are likely to explain the differences between the 2017/18 and 2021/22 and 2022/23 population estimates.
The appearance and behaviour of European shag can elicit challenges for multiple survey methods. European shag can be missed from the shore during VP surveys because of their dark plumage, especially in rough seas or at a distance of more than 1 km from shore. Whilst the densest aggregations occur close inshore, European shags also favour exposed coastlines where sea states are frequently between 3 and 5. Birds are often present on the outer limits of shore-based visibility, and even occur in the central Scapa Flow, despite much of this area being too deep for foraging.
As with shore-based surveys, the dark plumage of European shags can make detection hard during DAS, due to a lack of contrast against the sea surface, especially if the sea state is high. Birds also roost on land, generally within 100 m of the mean low water springs (MLWS) boundary, making concurrent land-based counts a necessity.
The number of detections of European shags was markedly lower in the 2022 DAS and one factor could be that weather and sea state were not optimal for their detection. Mean sea state recorded from the 2022 DAS footage (Figure 7) can be compared with the distributions and detections of European shag. In Scapa Flow, birds were recorded within sea state 0 ‘Calm (glassy)’ to sea state 5 ‘Rough’. In North Orkney, birds were recorded in sea state 0 ‘Calm (glassy)’ to sea state 4 ‘Moderate’; however, no birds were detected in the few sections of sea state 5.
Whilst the species is known to be susceptible to flushing and/or diving in the presence of overhead aircraft, the high flight altitude undertaken during the DAS (550 m ASL) is beyond that known to flush birds or cause disturbance (Thaxter and Burton, 2009), so this is considered unlikely to have been a factor influencing detection. However, European shags do spend a significant proportion of time diving, with mean dive durations of 85 - 97 seconds recorded (Watanuki et al., 2005; De Rijcke, 2015). As such, snapshot surveys such as DAS are likely to underestimate their numbers compared with shore-based and boat-based surveys where observations are made over a longer duration, during which birds may return to the surface. Population estimates within this report have not been corrected for availability bias of diving birds and this is likely to account for a large proportion of the discrepancy between population estimates.
In addition, the species is known to regularly occur on land, roosting and wing-drying along the shoreline, on skerries and on tidally exposed rocks. Identification of birds within the DAS was only undertaken to the high-tide mark, and so will not have recorded any potential birds occurring on rocks above this. Population estimates were also generated to the marine SPA boundary specifically, meaning any observations of birds beyond the SPA shapefile, above MLWS, would have been cropped out. For both SPAs within the February 2022 DAS, a relatively high number of birds were located just beyond the perimeter of the marine SPA boundaries, with the trimming of records to the marine SPA boundaries resulting in a 20.00 % and 16.28 % reduction for Scapa Flow and North Orkney respectively. Trimming of records from the January 2023 DAS to the marine SPA boundaries resulted in only a 7.07 % and 3.34 % reduction for Scapa Flow and North Orkney respectively; suggesting that perhaps the rougher sea state prior to the 2022 DAS led to more birds taking refuge onshore.
Lastly, there is always an element of seasonal variation in bird abundance. Counts recorded in the winter 2021/22 shore-based surveys were lowest in February (although not considerably), suggesting that fewer birds may have been present in the region in this month when the DAS was flown. A total of 31 birds were recorded in the Scapa Flow inshore sectors (compared to between 38 and 53 in other months) and only 7 birds were recorded in the North Orkney inshore sector (compared to between 14 and 24 in other months). High variability in shore-based counts was also observed during the winter 2022/23 surveys, with between five (March 2023) and 57 (February 2023) birds recorded across the sectors.
| Survey | Method | Scapa Flow | North Orkney |
|---|---|---|---|
| Original Areas of Search (Lawson et al., 2015) | Mixture of visual aerial and land-based counts over multiple seasons and months | LBC – 2.929 Aerial - 0 WeBS - 190 | LBC – 1,742 Aerial – 0 WeBS - 23 |
| pSPAs boundaries (Jackson, 2018; Upton et al., 2018) | Mixture of land-based and boat-based counts at roughly monthly intervals in 2017/18 | 582 – 3,726 | 1,758 – 2,968 |
| Final SPA boundaries from the current study | DAS single survey Feb 2022 – Strip transect analysis | 130 (95 %CI 58 - 227) | 150 (95 %CI 79 - 239) |
| Final SPA boundaries from the current study | DAS single survey Feb 2022 – Bayesian point processing | 134 (95 %CL 88 - 193) | 161 (95 %CL109 - 218) |
| Final SPA boundaries from the current study | DAS single survey Jan 2023 – Strip transect analysis | 764 (95 %CI 253 – 1,416) | 1,345 (95 %CI 432 – 2,562) |
| Final SPA boundaries from the current study | DAS single survey Jan 2023 – Bayesian point processing | 872 (95 %CL 597 – 1,560) | 1,667 (95 %CL 1,356 – 2,189) |
Comparison of DAS and shore-based surveys
On 20 January 2023, an additional shore-based count was undertaken on the same day as the DAS in order to compare the abundance and densities of birds recorded using these two methods. However, direct comparisons were only feasible in one sector, given timing of counts. The results were visually compared by plotting the observations of birds from these methods against each other. Across the species, there was no consistent pattern in the comparison of the results from the two methods.
In the Scapa Flow SPA surveys, great northern diver, red-breasted merganser, eider and long-tailed duck were observed within the DAS swathe areas compared with the shore-based surveys, whilst more Slavonian grebe and European shag were recorded in the shore-based surveys. In the North Orkney surveys, substantially more common eider and long-tailed duck were detected during the DAS compared with the shore-based surveys. However, these surveys were conducted approximately 24 minutes apart, during which time the birds detected during the DAS could have moved from the area. As in the Scapa Flow SPA survey, a large number of European shag were detected during the shore-based surveys, where no birds were detected during the DAS.
Great northern diver are large, conspicuous birds which are relatively easy to detect during DAS. The higher number of birds recorded during the Scapa Flow SPA DAS compared with the shore-based counts, particularly in sector 9, where there was a direct temporal overlap in the DAS and shore-based counts, suggests that DAS may be the preferred method for this species. In the North Orkney SPA surveys, birds were observed just inside the DAS swathe area during the shore-based surveys, whereas no birds were detected during the DAS, although these birds may have moved outside of the DAS swathe between surveys.
Across both the Scapa Flow SPA and North Orkney SPA shore-based surveys, fewer common eider and long-tailed duck were recorded within the DAS swathe area compared with numbers detected by the DAS, despite these being large and conspicuous birds and being observed less than 1 km offshore. However, these comparisons are constrained by the temporal mismatch between the surveys. More red-breasted merganser were also observed during the Scapa Flow SPA DAS compared with shore-based counts. However, where species are generally rare or sparsely distributed, such as red-breasted merganser, and the area of interest is primarily inshore waters, the species may still benefit from the increased survey coverage usually obtained with shore-based counts. Alternatively, DAS may be supplemented by shore-based counts for this species.
Due to their dark plumage, it can be challenging to detect European shag especially during higher sea states, such as those along exposed coastlines which these species tends to favour. Similarly, Slavonian grebe are small in size, and prefer sheltered inshore areas which can make it more challenging to detect these birds during DAS. Given that more European shag and grebe were recorded during the shore-based counts compared with the DAS, the current study suggests that it might be advantageous to supplement DAS with shore-based surveys for these species.
There were insufficient observations in either/both the DAS and shore-based surveys to allow a comparison of methods for black-throated diver and velvet scoter.
Survey limitations
As touched upon in the previous sections, there are a number of factors, additional to the reduced extent of the SPAs from the previous pSPAs and Areas of Search, which may contribute to the lower population estimates produced for some species in the 2021/22 and 2022/23 DAS in comparison to previous surveys.
Weather conditions may have had an influence on the presence of birds within the survey area, especially during the 2021/ 2022 winter DAS. Feedback from the shore-based observer on the day of the February 2022 DAS reported that the number of birds present was far lower than what would normally be expected, and that this was almost certainly due to the very stormy weather that occurred prior to the survey date (Higson, P., pers. comm., 21 February and 25 November 2022). These low abundances were also reflected in the 2021/22 shore-based counts, where February was consistently the month with the lowest number of records for all target species. The higher number of birds recorded in the January 2023 DAS (19,740 birds in total compared to 10,504 birds in the February 2022 DAS) supports this theory. There is natural variation in the distributions of marine bird species, which may not be captured in snapshot surveys, as the survey may fall on a period of natural low abundance.
Additionally, weather conditions may have resulted in sub-optimal conditions for bird detection and identification, particularly during the February 2022 DAS when weather conditions were poorer. Dark birds, such as European shags, can be particularly hard to detect in rocks and crags in aerial footage and detection may be further challenged offshore in higher sea states, where there is little contrast between their plumage and the surrounding darkened waters. However, both DAS were flown within suitable weather windows with varied sea states across the SPA survey areas, ranging between sea state 0 ‘Calm (Glassy)’ and 5 ‘Rough’ (Figure 7). These sea states are deemed viable for detection and identification by digital video aerial standards, which captures multiple frames per detection for scrutiny.
Some of the target species are known to frequently roost on land, including European shag and red-breasted merganser. In this DAS study, birds were identified up to the high tide mark. Therefore, there is the possibility that birds may have been roosting beyond this point and therefore not included. Additionally, in poorer weather conditions, such as those observed prior to the February 2022 DAS, birds may take refuge on the coast, where they may be missed above the high tide mark. This cut off point could be re-evaluated in future DAS, to include more birds found onshore but which will forage within the SPA boundaries.
Whilst there are many advantages to aerial survey methods, transect designs are not always suitable for species which form large, unevenly distributed flocks. In these instances, if large flocks fall between surveyed transects then analysis can lead to an underestimated population size. In contrast, if large flocks fall within transects it may lead to an overestimation. This is especially true for single surveys, and repeated surveys across the winter period would enable more robust estimates of abundance.
In addition, all of the target species spend a measurably amount of time under the water surface diving to forage. Whilst the height of the plane in the present study is not considered likely to be a factor in increasing disturbance or diving behaviour (Thaxter & Burton, 2009), estimates were not corrected for the availability of birds at the sea surface. As such, they are likely to be measurably lower than shore or boat-based counts where observers have a longer duration to witness any birds returning to the sea surface after diving.
The survey was designed with a minimum target of 24.3 % site coverage, as this was deemed sufficient to ensure precise abundance estimation of target species. The CV is a measure of the precision of the population and density estimates. Whilst this coverage was achieved, the CV of the some of the target species population estimates generated through design-based strip transect analysis were relatively high, ranging between 0.20 and 0.97 in Scapa Flow and 0.26 and 0.98 in North Orkney across the two surveys. The CV was highest for red-breasted merganser in Scapa Flow and black-throated diver in North Orkney, whilst the CV was lowest for great northern diver and long-tailed duck in both SPAs across the two surveys. However, the relationship between survey coverage and resultant CVs is not straightforward and increasing coverage will not necessarily result in increased precision of estimates.
In terms of comparing the results of the simultaneous DAS and shore-based surveys, it is challenging to make a direct comparison between survey methodologies. This is for a variety of reasons such as variation in survey coverage, temporal mismatch and observer bias. It is possible that in the time between surveys, birds could have been disturbed or moved to other areas which would result in a discrepancy between the survey results. The location of birds from the shore-based surveys is also visually estimated, which makes it difficult to accurately compare the locations of birds between the two methods. Additionally, the comparisons do not take into consideration the 20 m gap between the cameras of the HiDef four-camera system (shown in Figure 5), between which birds may have been missed. A gapless rig may be more suitable for future comparison studies.
Additionally, shore-based counts take considerably longer to conduct than DAS, due to logistical constraints with moving between VP locations, as well as the time taken to conduct the survey itself. In the 20 January 2023 survey, the shore-based counts at sectors 12 and 38 were conducted in suboptimal lighting conditions due to challenges in conducting all shore-based surveys on the same day in order to coincide with the DAS, meaning that surveys were conducted around sunset. Reduced visibility due to the low sun and fading light may have affected the observations of birds in these sectors.
Due to the low number of transects which cross the shore-based count sectors, it was also not possible to estimate the absolute abundance of birds within these areas for comparison with the shore-based counts, which had 100 % coverage. This meant that the study was limited to a qualitative comparison of the locations of birds observed between the two methods. However, this reflects the advantages and limitations of the two survey methods in general, whereby shore-based counts may be more suitable for small, inshore areas, whilst DAS may be more suitable for larger-scale and offshore surveys, thus making it difficult to compare results from the two methods.
Data analysis
In order to generate population estimates for the marine SPAs within this study, records of birds were trimmed directly to the SPA boundary at MLWS. As a result, any records of roosting or other birds that fell beyond this perimeter would not have contributed to the final population estimates. This would need consideration in future analysis if it was deemed appropriate that these birds are included in the SPA estimates.
Due to a lack of readily accessible environmental covariates at an appropriate resolution, the model-based estimates generated through Bayesian point processing were run using only the spatial process. This inherently leads to more uncertainty in areas where no observations are recorded as evidenced by figures of the spatial distribution of the coefficient of variation. The reasoning for this is that although we are certain of observations, in areas where there are no observations, we are not completely certain that no birds would ever occur there (e.g. pseudo absence). Environmental covariates could help explain some of this variation, but would not be expected to affect the overall population estimate. This is because the sample population (i.e. the number of observations) would be the same no matter which environmental covariates are used, and those observations are extrapolated through the boundary area based on the relationships between the environmental variables where animals were detected. Spatial patterns and spatial coefficient of variation could be affected as there would be additional certainty associated with areas where no observations were recorded. An assessment of predicted versus observed densities demonstrated this further as higher R2 values were associated with species that had more observations. This coefficient of determination (R2) is the proportion of variance in the response variable that is explained by the predictor variables, ranging between 0 and 1 (see Table 3 for definitions of statistical terms used).
Conclusion
Orkney supports multiple inshore wintering waterfowl species, occurring in internationally important numbers. In particular, divers, grebes, sea ducks and shag are relatively common compared to other parts of the UK. In 2022, Scapa Flow SPA and North Orkney SPA were classified under the Birds Directive (2009/147/EC2) to protect waterfowl species during the non-breeding period.
The seas are also of great interest for current and future developments and successful implementation and management of these will require monitoring, especially considering the potential for impact on species protected by SPAs. Robust data is required in order to meet these objectives. To quantify wintering waterfowl and shag populations around Orkney a variety of survey methods have previously been adopted, collecting information using shore, boat and visual aerial-based methodologies. However, prior to the winter 2021/22 and 2022/23 DAS surveys reported here, no data have been collected solely within and outwith the final SPA boundaries. Additional shore-based VP counts of nearshore areas were also undertaken.
The most abundant target species recorded in Scapa Flow and North Orkney SPAs were long-tailed duck and common eider during the winter 2022/23 surveys. Population estimates derived from DAS data for some additional waterfowl species, including great northern diver, red-breasted merganser, black-throated diver and Slavonian grebe, also surpassed the 1 % threshold of GB or biogeographic populations for either or both Scapa Flow SPA and North Orkney SPA. However, this was not the case for species such as European shag and velvet scoter, where population estimates from DAS data were considerably lower than previous estimates for the two SPAs (produced using data collected via different survey methods).
In North Orkney SPA, the DAS surveys indicated Slavonian grebe and red-breasted merganser were generally distributed to the south and west, compared to European shag, common eider and long-tailed duck which were distributed throughout the SPA. At Scapa Flow SPA, most species had a widespread distribution throughout the site although few birds were seen in the centre, where water is generally deeper and the seabed may be too deep for profitable foraging compared with elsewhere in the SPA.
The Bayesian point process models were able to generate predicted distribution maps using only the spatial process, where sample numbers were sufficient (>10 birds). The uncertainty in the spatial distribution increased with fewer observations, however this did not greatly affect the population estimates that are calculated, as point process modelling can give estimates with robust confidence limits.
Population estimates for waterfowl species derived from DAS and shore-based survey data may be affected by suitability of some species to different survey techniques. For example, larger numbers of great northern diver, eider and long-tailed duck were detected during the DAS compared with the shore-based counts within the DAS swathe, suggesting that DAS may be a more suitable survey method for these species. This is likely due to the increased flight altitude and speed offered by DAS as compared with previous VAS methods through decreased disturbance, reduced flushing from areas and larger area coverage in shorter timescales. In addition, DAS data can be easily audited and stored for future use. Conversely, Slavonian grebe and European shag had higher detections during the shore-based counts, which may be attributed to their small size and/or dark plumage making detection more difficult during DAS. However, these results may be constrained by the temporal and spatial mismatch between the surveys, and additionally shore-based counts and DAS methods may also have different advantages and disadvantages depending on the size and location of the area to be surveyed.
Naturally occurring variation in marine bird populations is difficult to capture with snapshot surveys, evidenced by the count differences in 2022 and 2023 DAS as well as monthly shore-based surveys of smaller areas. Further, sub-optimal weather conditions may hamper detection and identification of certain species, particularly those with darker plumage or those taking refuge above the high tide mark.
However, while there are limitations to DAS for some species, relying on population estimates only derived from shore-based counts for these species would not be sufficient, since flocks of birds sitting on the water surface may be present beyond the visual detection range of shore-based surveyors. This can be overcome by using boat-based surveys, as utilised by Jackson (2018) in the central Scapa Flow, however this method is also known to increase disturbance.
Ultimately, it is likely that different methods will be selected depending on the target species and the characteristics of the area (i.e. small, nearshore vs large, deep water) to be surveyed. Therefore, when monitoring multiple waterfowl species, a combination of survey techniques is likely to be beneficial.
References
Bachl, F.E., Lindgren, F., Borchers, D.L. and Illian, J.B. 2019. inlabru: an R package for Bayesian spatial modelling from ecological survey data. Methods in Ecology and Evolution, 10, 760-766pp.
Baddeley, A., Rubak, E. and Turner, R. 2015. Spatial Point Patterns: Methodology and Applications in R. Chapman and Hall/CRC, New York, 828pp.
Black, J., Dean B.J., Webb A., Lewis, M., Okill D. and Reid J.B. 2015. Identification of important marine areas in the UK for red-throated divers (Gavia stellata) during the breeding season. JNCC Report No 541. JNCC, Peterborough.
Booth, C., Cuthbert, M. and Reynolds, P. 1984. The Birds of Orkney. The Orkney Press, Kirkwall.
Brooks, S., Gelman, A., Jones, G. and Meng, X-L. 2011. Handbook of Markov Chain Monte Carlo. Chapman and Hall/CRC, New York, 619pp.
Buckland, S.T., Anderson, D.R., Burnham, K.P., Laake, J.L., Borchers, D.L. and Thomas, L. (2001). Introduction to Distance Sampling: Estimating Abundance of Biological Populations. Oxford University Press, 432pp.
De Rijcke, S. 2015. Foraging behaviour of the European shag during early chick-rearing period; do they follow the marginal value theorem? Norwegian University of Science and Technology.
Diggle P.J. 2014. Statistical analysis of spatial and spatio-temporal point patterns. Chapman and Hall/CRC, New York, 300pp.
Evans, R.J. 1998. Numbers of wintering seaducks, divers and grebes in the Moray Firth, 1977 – 1995. Scottish Birds, 19, 206-222pp.
Evans, R.J. 2000. Wintering Slavonian Grebes in coastal waters of Britain and Ireland. British Birds 93, 218-226.
Forrester, R., Andrews, I., McInerny, C., Murray, R., McGowan, B., Zonfrillo, B., Betts, M., Jardine, D. and Grundy, D. 2012. The Birds of Scotland. The Scottish Ornithologists’ Club.
HiDef Aerial Surveying Ltd, 2023. Unpublished internal document, reference HP00171-001.
Illian, J.B., Sørbye, S.H., and Rue, H. 2012. A toolbox for fitting complex spatial point process models using integrated nested Laplace approximation (INLA). The Annals of Applied Statistics, 6(4), 1499-1530pp.
Jackson, D. 2018. Scapa Flow proposed Special Protection Area (pSPA) – inshore wintering waterfowl survey 2017/18. Scottish Natural Heritage Research Report No. 1075.
Jarrett, D., Cook, A. S. C. P., Woodward, I., Ross, K., Horswill, C., Dadam, D. and Humphreys, E. M. (2018). Short-Term Behavioural Responses of Wintering Waterbirds to Marine Activity, Scottish Marine and Freshwater Science Vol 9 No 7.
Lawson, J., Kober, K., Win, I., Bingham, C., Buxton, N.E., Mudge, G., Webb, A., Reid, J.B., Black, J., Way, L. & O’Brien, S. 2015. An assessment of numbers of wintering divers, seaduck and grebes in inshore marine areas of Scotland, (Revised 2018). JNCC Report 567, ISSN 0963-8091.
Lewis, M., 2008. Surveillance of winter and spring aggregations of seaducks, divers and grebes in UK inshore areas: Aerial surveys and shore-based counts 2006/07. JNCC, Peterborough.
Møller, J., Syversveen, A.R. and Waagepetersen, R.P. 1998. Log Gaussian Cox Processes. Scandinavian Journal of Statistics, 25, 451-482pp.
Orkney Islands Council. 2022. Orkney Harbours Masterplan – Phase 1.
Pollitt, M.S., Hall, C., Holloway, S.J., Hearn, R.D., Marshall, P.E., Musgrove, A.J., Robinson, J.A. and Cranswick, P.A. 2003. The Wetland Bird Survey 2000-01: Wildfowl and wader counts. BTO/WWT/RSPB/JNCC, Slimbridge.
Robert, C.P. and Casella, G. 2004. Monte Carlo Statistical Methods – Second Edition. Springer, 679pp.
Rue, H. and Held, L. 2005. Gaussian Markov Random Fields: Theory and Applications. Chapman and Hall/CRC, New York, 280pp.
Scottish Natural Heritage. 2016a. Scapa Flow Proposed Special Protection Area (pSPA) NO. UK9020321 SPA Site Selection Document: Summary of the scientific case for site selection.
Scottish Natural Heritage. 2016b. North Orkney Proposed Special Protection Area (pSPA) NO. UK9020314 SPA Site Selection Document: Summary of the scientific case for site selection.
Simpson, D., Illian, J.B., Lindgren, F., Sørbye, S.H. and Rue, H. 2016. Going off grid: computationally efficient inference for log-Gaussian Cox processes. Biometrika, 103, 49-70pp.
Stockwell, D.R.B. and Peterson, A.T. 2002. Effects of sample size on accuracy of species distribution models. Ecological Modelling, 148, 1-13pp.
Thaxter, C.B. and Burton, N.H.K. 2009. High definition imagery for surveying seabirds and marine mammals: a review of recent trials and development of protocols. British Trust for Ornithology Report Commissioned by Cowrie Ltd.
Thaxter, C.B., Ross-Smith, V.H. and Cook, A.S.C.P. 2015. How high do birds fly? A review of current datasets and an appraisal of current methodologies for collecting flight height data: Literature review. BTO Research Report No.666. British Trust for Ornithology, Thetford, UK. 66 pp.
Thompson, S.A. and Price, J.J. 2006. Water Clarity and Diving Behavior in Wintering Common Loons. Waterbirds 29(2): pp. 169-175.
Upton, A.G., Williams, S.J. and Williams, E.J. 2018. North Orkney proposed Special Protection Area (pSPA) – inshore wintering waterfowl survey 2017/18. Scottish Natural Heritage Research Report No. 1074.
Watanuki, Y., Takahashi, A., Daunt, F., Wanless, S., Harris, M., Sato, K. and Naito, Y. 2005. Regulation of stroke and glide in a foot-propelled avian diver. Journal of Experimental Biology, 208, 2207-2216pp.
Webb, A. and Reid, J.B. 2004. Guidelines for the selection of marine SPAs for aggregations of inshore non-breeding waterbirds. Unpublished consultation paper, JNCC, Peterborough, UK.
Williams, E.J. 1999. Wintering Seafowl in Scapa Flow 1998-1999. RSPB Report to SNH.
Williams, E.J. 2000. Wintering seafowl in Scapa Flow, Orkney, October 1998 to March 1999. Scottish Birds, 21, 15-26pp.