NatureScot Research Report 1297 - Developing tools for monitoring lichens & other sessile organisms
Year of publication: 2023
Authors: Bhatti, N. R., Cornulier, T., Mitchell, R. J., Potts, J. M., Britton, A. J., Woodin, S. J. & Genney, D. R.
Cite as: Bhatti, N. R., Cornulier, T., Mitchell, R. J., Potts, J. M., Britton, A. J., Woodin, S. J. & Genney, D. R. 2023. Developing tools for monitoring lichens & other sessile organisms. NatureScot Research Report 1297.
Keywords
lichen surveys; sessile organisms; surveyor variability; occupancy models; detectability
Background
Obtaining accurate estimates of species presence or numbers helps inform their conservation. It allows us to assign conservation priorities and detect trends, such as how the distribution of their presence/absence or numbers respond to changes in pressures and habitat management. However, accurate estimates are challenging to obtain because, even for the same number of organisms in the same area, different surveyors can get different results. An excellent example is provided by lichens, as the variability between surveyors can be of the same magnitude or larger than the trends the surveys seek to detect. Taking lichens as a case study, this report summarises survey approaches developed in a PhD research project that are based on a method called occupancy modelling.
Differences between surveyor detection skills, within and between years, is one of the greatest sources of variation in population estimates, and needs to be accounted for. Occupancy models use repeat surveys of the same locations to account for this variability by estimating the proportion of sampling units where the target organism was present but not detected, for example, in a lichen survey, how many trees were searched by the surveyor where the lichen was growing but not found? Occupancy models have, however, rarely been used for sessile species such as lichens. This is because they are susceptible to two main sources of inaccuracy: first, by surveyors remembering their previous survey results, and secondly, by detection heterogeneity, which is the variability caused when the surveyed organisms are easier to find at some locations than others. Using lichens as an example organism, this research shows ways that occupancy models can be adapted to overcome these challenges and improve estimate accuracy. The adaptations can also be relevant and applicable to many other organisms, including plants, fungi, and animals.
Main findings
- Occupancy models can be used to provide accurate estimates of lichen numbers.
- The technique is more accurate with larger sample sizes and when surveys are repeated more often.
- Variability, where it is easier to find lichens in some locations than others (i.e., detection heterogeneity), causes numbers to be underestimated but this can be corrected for with statistical techniques.
- A minimum of three surveys is required in the presence of detection heterogeneity, which has implications for the cost of surveys.
- Surveyors remembering previous survey results also cause the numbers to be underestimated, but this too can be effectively corrected, thus allowing the same surveyor to repeat the surveys.
Acknowledgements
This research was funded by NatureScot, The James Hutton Institute, Biomathematics and Statistics Scotland and the University of Aberdeen. RJM, AJB and JMP were supported by Scottish Government’s Rural and Environment Research and Analysis Directorate 2016–2021 strategic research programme. The authors wish to thank the surveyors who volunteered to participate in this study, without whom the data could not have been collected. Approval for their participation was granted by The James Hutton Institute Research Ethics Committee. Thanks also to Forest Enterprise for permission to run the experiment in Culbin Forest, and to The James Hutton Institute and University of Aberdeen for permission to use their grounds.
1. Introduction
1.1 Survey results can be inaccurate
Detecting species population changes over time can be an important tool to inform their conservation, but this requires accurate and repeatable surveys. Most organisms are subject to imperfect detection, leading to a portion being overlooked by surveyors. The portion of individuals missed may vary considerably depending on many factors, including the species, sex, phase of their life cycle, weather, habitat, or the observer’s abilities. This makes survey results inaccurate and most importantly, difficult to compare with each other. However, if we can estimate the proportion of individuals that were not found, then more accurate and consistent survey results will be obtained.
Many species of conservation or management interest are cryptic, challenging to identify at a distance, and form part of complex communities, so not every individual is conspicuous. As a result, they are imperfectly detected during a survey, and false negatives can occur because some individuals are missed. False negatives can be accounted for by estimating a detection probability, which is the proportion of individuals observed compared to the true number of individuals present (Yoccoz, Nichols et al. 2001, MacKenzie, Nichols et al. 2002). There may also be false positives, when extra individuals are counted that were not present due to identification mistakes or counting errors (Elphick 2008).
Several issues can arise if the detection probability is not estimated and just the count data used, even with trained, experienced surveyors and with standardised monitoring methods. First, the extent of the species occurrence will be underestimated (Kéry and Schaub 2011). Secondly, due to the influence of locations where the species was unobserved but truly present, estimates of the effect of environmental variables predicting its occurrence will be biased toward zero (Tyre, Tenhumberg et al. 2003, Kéry and Schaub 2011). Thirdly, ecological factors affecting occurrence may also be masked by factors affecting the observation process of detection—it may be easier to find a species in some locations than others, for example open woodland versus thick forest, but the species might not be more common in the open woodland (Kéry and Schaub 2011).
1.2 Occupancy models improve accuracy
Rather than directly estimating how many individuals there are in a population, their occupancy can be investigated. Occupancy can be described as the proportion of sampling units (points, plots, transects, etc.) where the species of interest is present. To estimate the occupancy, the sampling units are surveyed multiple times for the target organism. The surveys are completed within a monitoring session, which is the time-period for which an estimate of the proportion of occupied sites is required. The detection probability can then be estimated and hence also the number of sampling units where the target organism was present but not found (MacKenzie, Nichols et al. 2002). Occupancy models can also provide an index of the population size by adding up the proportion of sites where the species was seen and the estimated proportion of sites where the species was present but not seen, alongside a confidence interval reflecting the range of values that are compatible with the field observations (MacKenzie, Nichols et al. 2002, Kéry and Schaub 2011). For more detail, see Box 1.
The basic occupancy model makes several assumptions: (1) occupancy of a sampling unit doesn’t change between the repeat surveys (i.e. the population is said to be “closed” within the monitoring session—which for sessile organisms means there is no turnover of individuals through new colonisations and extinctions, and for mobile organisms no births, deaths, immigration or emigration), (2) there is an equal probability of occupancy across all sampling units, (3) there is constant probability of detection across all sampling units, (4) the detections are independent between surveys, (5) the detections are independent between sampling units, and (6) there are no false positives (i.e. all identifications are correct) (MacKenzie, Nichols et al. 2002, MacKenzie, Nichols et al. 2018). Assumptions (1) and (2) relate to the ecological processes determining the presence or absence of the target species, whereas assumptions (4), (5) and (6) to the observation process by the surveyor. Assumption (3) can relate to either the ecological processes if the organism is mobile and can move between sampling units during the survey, or to the observation process, particularly for sessile organisms, if the surveyor’s search image is improved and reinforced during the survey (i.e. they “get their eye in”). However, these assumptions are not always met, so various extensions to the basic model have been developed to address the assumption violations. For example, any of the assumptions can be relaxed by using covariates that account for potential differences in the occupancy or detection probabilities between sampling units and surveys (MacKenzie, Nichols et al. 2018). A covariate is data correlated with the one of the variables of interest, in this case occupancy or detection, or both. However, suitable covariates may not always be available.
The occupancy model consists of two parts: an ecological process that determines whether the target organism is present at a sampling unit, and an observation process for whether the target was found on a survey given it was present at a sampling unit.
The ecological process for the true state of occupancy is given as the presence or absence of the target organism at sampling unit, for example a lichen on a tree. The true occupancy of a sampling unit can be modelled as a probability of occupancy (ψ) if present, or if absent with a probability of not being occupied (1- ψ
The observation process on a survey can similarly be described with a probability of detection (p), or probability of not being detected (1-p).
If the target organism is recorded on a survey at a sampling unit (assuming no false positives), then it would be detected (with probability p), which would indicate that the sampling unit is occupied (with probability ψ). If, however, the target organism is not recorded, then this could be because the target was either not present at the sampling unit (with probability 1-ψ) or was present but not found (with probability ψ(1-p)).
A key advantage of occupancy surveys and models is they allow comparison between results from different surveys, undertaken at different time periods, and by different surveyors. Differences in detection probabilities between surveyors or survey occasions can be accounted for using models with a coefficient that is estimated for each observer or survey (MacKenzie, Nichols et al. 2002). A further development, addressing assumption (1), incorporates temporal variations in detection along with turnover, i.e. extinctions & colonisations, in a multi-season framework (MacKenzie, Nichols et al. 2003). Therefore, short term temporal changes between the repeat surveys can be allowed for, such as those caused by random variability. The multi-season model can also account for missing observations and environmental variation (weather patterns, habitat type, etc.), but it assumes that detection is constant during a survey and that it doesn’t vary spatially (MacKenzie, Nichols et al. 2003).
1.3 Occupancy models can still be inaccurate—estimate biases
It may often be much easier to find the target species at some locations than others. This means the detection probability will vary spatially and not be uniform across all sampling units (cf. assumption 3). The variability in the detection probabilities between different sampling units is described as detection heterogeneity (see Box 2). Detection heterogeneity has been well-studied in capture-recapture studies and is known to negatively bias (i.e. underestimate) the population size estimates (Seber 1982). The size of the underestimate is larger if detection probabilities are low or there is greater variability between them (Royle and Nichols 2003). The underestimate is also larger when only a few surveys or sampling units are used (MacKenzie, Nichols et al. 2018).
Negative bias can be prevented by modelling the detection heterogeneity with suitable detection covariates (Gimenez, Cam et al. 2018). Suitable detection covariates for lichens growing on trees may include their size, height on the tree, contrast with the background, number of individual lichens (if more than one), their spatial arrangement, the tree species on which it is growing, the roughness of its bark, etc. However, it can be difficult to ensure that all the covariates are completely measured, and the heterogeneity fully accounted for. An alternative approach describes the distribution of the detection probabilities across the sampling units, and hence the heterogeneity, with a probability distribution (e.g. Normal distribution) (Royle and Nichols 2003). Assumptions about the heterogeneity distribution have rarely been tested using data from human observations during field experiments, as the true population is usually unknown and can only be estimated.
Detection heterogeneity occurs when the target is easier to find at some sampling units than others. For example, for lichens on trees, it may be more difficult to spot the target lichen if there is a lot of moss or other lichen species present on the tree, or if it is very small, or high up.
Example survey data for an occupancy model are shown in the table below. This shows five sampling units and three surveys: 1 = target detected in sampling unit, 0 = target not detected. Note that both at sampling units B and D, nothing was found, but at D the target was present but remained undetected on every survey. The apparent detection probability shows the variability (i.e. heterogeneity) in the detection probabilities.
|
Sampling unit (e.g. quadrat) |
Survey 1 |
Survey 2 |
Survey 3 |
Apparent detection probability |
True occupancy |
|---|---|---|---|---|---|
|
A |
1 |
0 |
1 |
0.66 |
1 |
|
B |
0 |
0 |
0 |
0.00 |
0 |
|
C |
0 |
0 |
1 |
0.33 |
1 |
|
D |
0 |
0 |
0 |
0.00 |
1 |
|
E |
1 |
1 |
1 |
1.00 |
1 |
Alternatively, a probability distribution (e.g. usually a Normal distribution) can be used to predict the different detection probabilities across the different sampling units. This is included as a random effect in the occupancy model and helps identify sampling units that had no detections but were truly occupied.
1.4 Challenges with sessile organisms
Occupancy models have rarely been applied to surveys of sessile organisms. In some ways it is easier to apply occupancy models to these organisms and in other ways it is more difficult. The assumption that populations don’t change between surveys (assumption 1) will be more readily met by sessile organisms. Therefore, it may be possible to use surveys that are separated by longer time intervals without needing multi-season occupancy models to account for colonisations and extinctions (MacKenzie, Nichols et al. 2003, MacKenzie, Nichols et al. 2018). In contrast, the assumption that detections are independent between surveys (assumption 4) relates to the observation process (MacKenzie, Nichols et al. 2018), and may be challenging to meet if the same surveyor repeats the survey and remembers the location of targets previously detected. While most species may be subject to non-independence between surveys, through surveyor memory, few will be as strongly affected as sessile species like lichens.
If different observers undertake each repeat survey without knowledge of what others found, the assumption of independence will not be violated (MacKenzie, Nichols et al. 2018). Different surveyors may have different detection abilities, but this can be accounted for with an observer effect in the detection probability part of the occupancy model (MacKenzie, Nichols et al. 2005). However, it may not always be practical to use multiple observers over a short period of time, so unless the bias caused by the same observer repeating the surveys can be estimated, the accuracy of model estimates will be unknown.
1.5 Aims of this report
Methods for monitoring occurrence and population changes need to be capable of producing accurate and comparable estimates, for example by quantifying bias due to surveyor differences both within and between years. The occupancy survey method was therefore chosen as a candidate approach to address these issues. It relies on a set of independence and homogeneity assumptions that are usually assumed to be valid for many taxa (such as birds or mammals). However, these are rarely verified in practice, and may be severely challenged in some contexts, for example when dealing with sessile species such as lichens. The accuracy of occupancy models is also rarely validated in the field because the true population size is typically unknown.
The aim of this work was to provide recommendations relevant to the design of robust population monitoring programs, by reporting on recent tests and developments of occupancy survey methodology. Using a known population of artificial epiphytic lichens as a test organism, three research questions were investigated:
- What variables affect occupancy estimate accuracy?
The accuracy of occupancy models may be affected by a number of different variables, such as the number of sampling units, number of surveys, detection heterogeneity, and surveyor ability. This question explores the effect of these variables on the occupancy estimate.
- Can occupancy estimates be improved by modelling the heterogeneity in detection probability?
Predictors of detection probability at a given sampling unit are not always available or sufficiently informative. Sessile organisms, such as lichens, can show significant and unpredictable heterogeneity in the detection probabilities. This question examines conditions under which the detection heterogeneity is identifiable and can be modelled effectively.
- Can occupancy estimates be improved by modelling surveyor memory?
If a surveyor undertakes more than one survey, their memory of previous survey results can affect subsequent survey results and bias the occupancy estimates. This question will investigate the effect of a surveyor remembering if a lichen was found on previous surveys, and whether this effect can be modelled.
2. Methods and results
The following section briefly summarises the methods and results and focuses on the practical applications of the main findings. For more details see Bhatti (2021).
2.1 What variables affect occupancy estimate accuracy
Multiple surveyors surveyed a set of trees with known populations of artificial lichens. Since an experimental population of artificial lichens was used, knowledge of the true occupancy allowed the accuracy of the model to be assessed. Each surveyor was unaware of the true occupancy and only completed one survey, so the number of surveyors was equivalent to the number of surveys used in the model. For sessile species, using a different surveyor for each survey helps ensure the assumption that detections are independent is met, since they won’t remember what was found on previous surveys. Sixteen surveyors each surveyed 180 trees for three types of artificial lichen (Figure 1), and although the following results will focus on the grey lichens, similar results were obtained for other lichen types.

Data for different numbers of trees (sampling units) and repeat surveys (surveyors) were obtained by subsampling. This allowed the effect of using different numbers of surveys or trees to be investigated in relation to the accuracy of the occupancy estimate. As more surveys were repeated, the size of the negative bias (i.e. underestimate) in the occupancy estimate decreased (Figure 2).
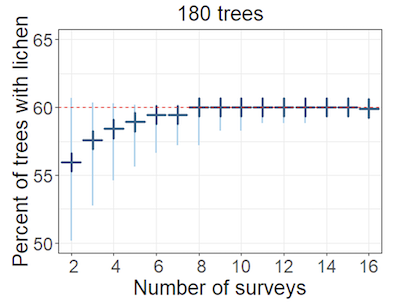
X axis shows percent of trees with lichen. Y axis shows number of surveys. Dark blue cross is most likely value (mode), height of pale blue area is estimate range. Red line is proportion of trees with the lichen (i.e. true occupancy = 60%).
As more trees were sampled, the range of the occupancy estimates converged onto the most likely value, and thus its precision improved (Figure 3). With two surveys of only ten trees, the results were very inaccurate and estimated that 30% to 100% of the trees had the lichen, but as the number of trees approached 180, the estimates increased greatly in precision although the negative bias persisted. If, however, sixteen surveys were undertaken, the bias was almost non-existent, even for a small number of trees sampled, and sample sizes in excess of 100 produced fairly accurate estimates.
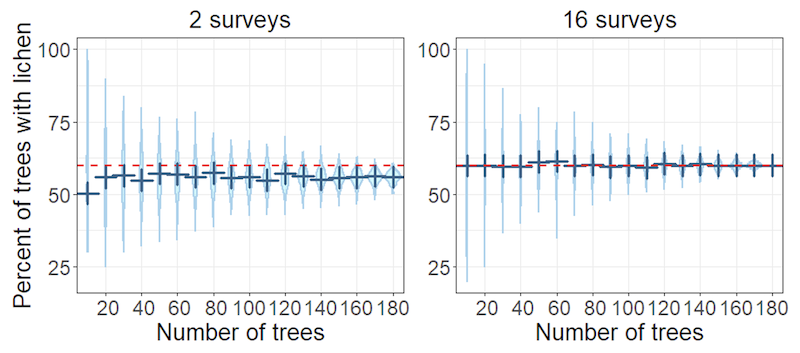
X axis shows percent of trees with lichen. Y axis shows number of trees. Left hand plot is for two surveys, right hand plot for sixteen surveys. Dark blue cross is most likely value (mode), height of pale blue area is estimate range, width of pale blue area is estimate density (i.e. estimate is more likely where width is wider). Red line is proportion of trees with the lichen (i.e. true occupancy = 60%).
A multivariate analysis was used to investigate which factors had the greatest impact on the accuracy of the occupancy estimate. The list of factors investigated included the numbers of surveys, numbers of trees sampled, surveyor ability, and the degree of heterogeneity in detection probabilities between trees. This found that the number of surveys had the most influence on the accuracy of the occupancy estimate and that the ability of surveyors to find the lichens and detection heterogeneity were also important factors. Less heterogeneity was associated with less negative bias in the occupancy estimate.
2.2 Can occupancy estimates be improved by modelling the heterogeneity in detection probability?
The detection heterogeneity was modelled by allowing the probability of detection to vary randomly among trees, following different types of statistical distributions. The tree is therefore described as being modelled as a random effect, which allows us to examine if the heterogeneity can be described in an occupancy model without using covariates. Data from the same experiment as above were used, i.e. multiple surveyors each of whom surveyed a set of trees once for the artificial lichens. Therefore, as before, the true occupancy was known and the number of surveyors equivalent to the number of surveys used in the model.
Results indicated that a minimum of three surveys was required to successfully model the detection heterogeneity (Figure 4). In other words, when the probability of detection varied between sampling units (here, trees), at least three surveys per tree were required to estimate the overall occupancy. If only two surveys were used, the model showed that anywhere between approximately 45–100% of the trees could have the lichen on them, which is not very accurate or useful monitoring information.
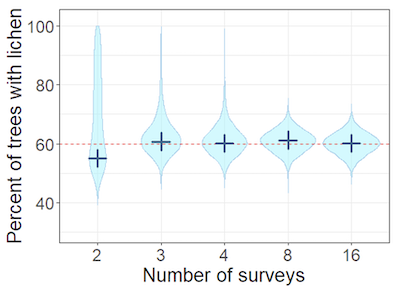
X axis shows percent of trees with lichen. Y axis shows number of surveys. Dark blue cross is most likely value (mode), height of pale blue area is estimate range, width of pale blue area is estimate density (i.e. estimate is more likely where width is wider). Red line is proportion of trees with the lichen (i.e. true occupancy = 60%).
2.3 Can occupancy estimates be improved by modelling surveyor memory?
To examine the effect of remembering previous survey results, another field study using artificial lichens on trees was set up. This time, however, each volunteer repeated a survey two to four times, and at intervals between the surveys varying from 3–30 days. The detection probability was separated into a discovery process and memory process (see Box 3).
The detection probability (p) may be enhanced by remembering the results of previous surveys and can be separated into a discovery probability (d) and a subsequent memory probability (m). To simplify this process, it was assumed that (i) outcomes depend on only the immediately preceding survey and not earlier surveys, and (ii) memory operates independently and prior to discovery.
During the first survey, there is no memory of previous detections, so at a given tree the detection probability is the same as the discovery probability (p=d). On subsequent surveys, there are three processes by which a lichen can be detected: (1) it was detected on the previous survey and remembered, (2) it was detected on the previous survey and not remembered but rediscovered, or (3) it was not detected on the previous survey but discovered in the present survey.
The results suggested that surveyors were not better at remembering the results of the previous survey if less time had elapsed, since no evidence of memory decay was found between the surveys. Neither was any reinforcement effect found that improved memory if the lichen had been found on multiple previous surveys. It was also interesting to find that lichens that were easier to discover were also easier to remember, whereas those that were harder to discover were more difficult to remember. This may indicate that the memory and discovery processes are not dependent only the immediately preceding survey, or are not entirely independent from each other and interact in some way.
A simulation study was also undertaken, which showed that when the memory was modelled, the occupancy was accurately estimated. However, if memory of previous survey results was not accounted for, the occupancy was underestimated (i.e. negatively biased) (Figure 5).
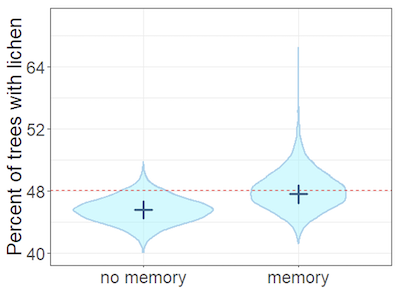
Heterogeneity is included in both. X axis shows percent of trees with lichen. Y axis shows number of surveys. Dark blue cross is most likely value (mode), height of pale blue area is estimate range, width of pale blue area is estimate density (i.e. estimate is more likely where width is wider). Red line is proportion of trees with the lichen (i.e. true occupancy = 48%).
3. Recommendations for monitoring and analysis
Recommendations are given below with the associated research questions, followed by general recommendations:
3.1 What variables affect occupancy estimate accuracy
- More accurate estimates are obtained with more repeat surveys, larger sample sizes, better detection rates, and less heterogeneity.
- It is recommended that these variables are considered when undertaking surveys using occupancy models.
- Survey design should typically aim for no less than one hundred sampling units. This will ensure both reasonable power for estimating occupancy model parameters precisely, and also represent the surveyed area well. Actual sample size will need to be adjusted to the precision required for the estimated trends, to the complexity (heterogeneity) of the surveyed area, and to the expected probability of detection of the organism per survey occasion, and per sampling unit where the organism is present.
- Where heterogeneity between sampling units is considered negligible (such as acoustic surveys), a minimum of two surveys per monitoring session (i.e. one repeated survey) may be sufficient.
3.2 Can occupancy estimates be improved by modelling the heterogeneity in detection probability?
- Heterogeneity in detection is expected to be the norm rather than the exception. For example, even relatively uniform commercial tree plantations can show significant heterogeneity in lichen detectability across trees.
- Modelling the detection heterogeneity, when present or unknown, is recommended as it improves the accuracy of occupancy estimates.
- However, a minimum of three surveys is recommended to model the heterogeneity effectively. Accuracy improves if more repeat surveys are undertaken.
3.3 Can occupancy estimates be improved by modelling surveyor memory?
- Modelling surveyor memory improves the accuracy of occupancy estimates. This can be done by separating the detection probability into two components, a discovery probability and memory probability.
- Bias from previous detections upon subsequent detections can therefore be accounted for, so multiple surveys can be undertaken by the same surveyor. This may have resource benefits, particularly if there is only a limited pool of competent surveyors available (such as for lichenologists).
- A corollary, however, of the ability to work with non-independent data in this way is that a large sample size is likely to be required to achieve the same precision in occupancy estimates.
3.4 Additional design considerations
- Occupancy models are commonly used for monitoring all kinds of mobile species, terrestrial or aquatic, directly or indirectly (e.g. using signs) in the presence of imperfect detection. Here they have been shown to be effective tools for surveys of sessile organisms as well, such as lichens.
- The definition of sampling units should be considered carefully so that occupancy of a unit is both meaningful and useful with respect to the specific monitoring objectives.
- Occupancy survey methodology does not require separate calibration of observers against each other, as the occupancy model itself will perform the calibration using the information contained in the repeat survey data.
- For a monitoring session at a given location, cost-effectiveness might be improved by re-surveying only the number of sampling units that are necessary for estimating the probability of detection and its heterogeneity accurately.
- Basic occupancy surveys are straightforward to analyse by numerate ecologists using ready-to-use statistical software, like the Unmarked package in R.
- The correction of biases due to the presence of memory or detection heterogeneity requires more advanced models, a user-friendly version of which is not as yet available. A statistical ecologist should therefore be employed to help analyse the survey data. They should be familiar with the analysis of occupancy models in a multilevel (Bayesian) framework, using appropriate informative prior distributions. Details can be found in Bhatti (2021).
3.5 Further work
- For further work, experiments could be set up where a subset of sampling units are intensely surveyed in a time-to-detection framework. This could allow the detection heterogeneity and memory to be estimated with a more efficient use of resources, as well as the use of plots as sampling units (i.e. for lichens, areas that may contain more than one host tree).
- Occupancy modelling is relevant in eDNA applications, for estimating the probability of false negatives arising from multiple sources, including sampling error and laboratory procedures.
- The spatial dimension of survey design could be explored, particularly with the view of optimising efficiency for rare and/or clustered species.
- An interactive tool could be developed to aid practitioners develop monitoring designs, by simulating the accuracy of occupancy estimates expected under different scenarios of sample size, proportion of samples repeated, number of repeats, expected probability of detection, heterogeneity, memory…
- Software, such as an R package could be developed to make occupancy models with heterogeneity or memory accessible to non-experts, together with diagnostic tools for checking the validity of the analyses.
4. Conclusions
A single survey is highly unlikely to provide repeatable estimates of a species population size, but instead, occupancy models can provide an effective tool for accurately monitoring species. Occupancy models account for imperfect detection and help ensure that survey results are comparable (e.g., between different years, surveyors, or locations). They can be readily applied to mobile or sessile organisms, such as lichens.
Inaccuracies and biases are caused by surveyors remembering what was found on previous surveys, or when there are different detection probabilities between survey locations. However, these inaccuracies can be accounted for by adapting the occupancy models. Nevertheless, within a monitoring session, at least three surveys are needed to produce good estimates at a location.
By accounting for the biases caused by remembering previous detections, the same surveyor can repeat survey events to detect changes. This may make it more efficient and cost-effective for logistical reasons, as well as easier if there are very few expert surveyors available, such as lichen specialists.
In the same way that surveys should be undertaken by competent surveyors, the data should be analysed by competent statistical ecologists, who should be involved in developing the design of the survey before it is commissioned.
5. Glossary
Covariate
- Data associated with the variable of interest. It may be environmental data, such as tree species, tree age, time of year, weather conditions, or it may be data associated with the surveyor, such as their expertise, or height (important for lichens growing higher up on a tree!).
Detection heterogeneity
- The variability in detection probabilities caused when the target organism is easier to find at some locations than others, e.g., if it is easier to find the lichen of interest on some trees than others.
Detection probability
- The probability of finding the target organism at a sampling unit during a survey. The detection probability can be calculated from the number observed / true number.
Discovery probability
- The probability of finding the target organism at a sampling unit during a survey without it being remembered. This could occur in two ways, (i) it was not found on a previous survey, or (ii) the surveyor has forgotten finding it.
Epiphyte (/epiphytic lichen)
- An organism (/lichen) that grows on the surface of a plant and is only reliant on its host for physical support, for example, lichens growing on trees.
False negative
- A false negative occurs during a survey, when the target organism is recorded as absent when it is really present but not found.
False positive
- A false positive occurs during a survey, when the target organism is recorded as present when it is really absent.
Memory probability
- The probability of remembering the target organism at a sampling unit during a survey when it was found previously.
Mode
- The value which is most likely or appears most often.
Monitoring session
- The time period during which an estimate of the proportion of occupied sites is sought (within which repeat surveys are undertaken and the population is assumed to be closed to movement, recruitment or mortality)
Negative bias
- This occurs when the true value is consistently underestimated.
Occupancy & occupancy probability
- The proportion of sampling units where the species of interest is present, i.e., the probability of the species of interest being present in the sampling unit.
Occupancy model
- A model that estimates the probability the target organism is truly present at a sampling unit by accounting for imperfect detection and false negatives.
Random effect
- A term used in a statistical model where the parameter is based on a random variable (i.e. can vary randomly—often this is taken from a probability distribution, such as a Normal distribution).
Sampling unit
- A discrete unit of space within which the survey is carried out: may be a point or a transect, but is often areal, such as a quadrat, tree, pond or field etc.
Sessile organism
- An organism that cannot move itself from one place to another e.g., plant, fungi, moss, lichen.
6. References
Bhatti, N.R., 2021. Developing statistical monitoring tools for data-deficient lichen species (PhD Thesis). University of Aberdeen. Aberdeen.
Elphick, C.S., 2008. How you count counts: the importance of methods research in applied ecology. Journal of Applied Ecology, 45(5), 1313-1320.
Gimenez, O., Cam, E. & Gaillard, J.M. 2018. Individual heterogeneity and capture-recapture models: what, why and how? Oikos, 127(5), 664-686.
Kéry, M. & Schaub, M. 2011. Bayesian Population Analysis using WinBUGS: A Hierarchical Perspective. Elsevier Academic Press.
MacKenzie, D.I., Nichols, J.D., Hines, J.E., Knutson, M.G. & Franklin, A.B. 2003. Estimating site occupancy, colonization, and local extinction when a species is detected imperfectly. Ecology, 84(8), 2200-2207.
MacKenzie, D.I., Nichols, J.D., Lachman, G.B., Droege, S., Royle, J.A. & Langtimm, C.A. 2002. Estimating site occupancy rates when detection probabilities are less than one. Ecology, 83(8), 2248-2255.
MacKenzie, D.I., Nichols, J.D., Royle, J.A., Pollock, K.H., Bailey, L.L. & Hines, J.E. 2018. Occupancy Estimation and Modeling: Inferring Patterns and Dynamics of Species Occurrence. 2nd ed. Elsevier Academic Press.
MacKenzie, D.I., Nichols, J.D., Sutton, N., Kawanishi, K. & Bailey, L.L. 2005. Improving inferences in population studies of rare species that are detected imperfectly. Ecology, 86(5), 1101-1113.
Royle, J.A. & Nichols, J.D. 2003. Estimating abundance from repeated presence-absence data or point counts. Ecology, 84(3), 777-790.
Seber, G.A.F. 1982. The estimation of animal abundance and related parameters. 2nd ed. London and High Wycombe, Charles Griffin & Company Ltd.
Tyre, A.J., Tenhumberg, B., Field, S.A., Nieljalke, D. & Possingham, H.P. 2003. Improving precision and reducing bias in biological surveys: estimating false-negative error rates. Ecological Applications, 13(6), 1790-1801.
Yoccoz, N.G., Nichols, J.D. & Boulinier T. 2001. Monitoring of biological diversity in space and time. Trends in Ecology & Evolution, 16(8), 446-453.


