NatureScot Research Report 1294 - Development of the Mountain Hare National Monitoring Scheme - trialling a citizen science approach
Year of publication: 2022
Authors: Wetherhill, A.S.1, Coomber, F.G.2,3, Darvill, B.1, Hesford, N.4, Le Marquand, C.2, Macleod, R.4, Mathews, F.2,3, Newey, S.5, Raynor, R.6, Willis, S.1, and Wilson, M.W.1
1 British Trust for Ornithology, 2 Mammal Society, 3 University of Sussex, 4 Game & Wildlife Conservation Trust, 5 James Hutton Institute, 6 NatureScot
Cite as: Wetherhill, A.S., Coomber, F.G., Darvill, B., Hesford, N., Le Marquand, C., Macleod, R., Mathews, F., Newey, S., Raynor, R., Willis, S., and Wilson, M.W. Development of the Mountain Hare National Monitoring Scheme - trialling a citizen science approach. NatureScot Research Report No. 1294.
Keywords
Mountain hare; Lepus timidus; citizen science; upland monitoring; Volunteer Mountain Hare Survey; mobile app recording; validation comparisons; night-time survey; breeding birds survey
Background
The aim of this project was to develop and trial surveys of mountain hares (Lepus timidus) that are suitable for participation by a diverse range of volunteers, across the whole extent of the species’ range in Scotland.
The mountain hare is listed as Near Threatened on the UK Red List of Mammal Species (Mathews and Harrower 2020), as well as in Annex V of EC Directive 92/43/EEC on the Conservation of Natural Habitats and of Wild Fauna and Flora (the EC Habitats Directive), and was given full protection in Scotland by addition to Schedule 5 of the Wildlife & Countryside Act 1981 (as amended) on 1 March 2021. The most recent (2019) assessment of the species’ conservation status under Article 17 of the EC Habitats Directive, concluded that it was unfavourable (inadequate) due mainly to inconclusive information on population trend, but with some evidence of decline. In Scotland, the mountain hare is a priority species for conservation action under the UK Biodiversity Action Plan (JNCC & DEFRA, 2012) and is also included on the Scottish Biodiversity List. The Scottish Government is obliged to ensure that the conservation status of this species is maintained or improved, that its populations are managed sustainably, and that adequate monitoring is in place to regularly evaluate trends in distribution and abundance of the species. The need for better surveillance and monitoring of mountain hare has been highlighted for some years, resulting in the development of an improved counting method. This research project builds on previous work detailed in NatureScot (Scottish Natural Heritage) Research Reports 1022 and 1076 (Newey et al., 2018; Newey et al., 2020), which made a variety of recommendations for the monitoring of mountain hares, including the establishment of a National Monitoring Scheme (NMS) for this species.
A key recommendation from Report 1022 (Newey et al., 2018) was that night-time counts of hares, with the aid of a spotlight, could provide repeatable indices of mountain hare density. Report 1022 also described the development of a method for estimating population size on heather moorland and open habitats, and Report 1076 (Newey et al., 2020) considered and reported on recommendations for regional and national monitoring schemes which included the use of night-time counts. Following publication of Report 1022, estate-led night-time counts commenced in 2018, chiefly on managed moorland in the Central Highlands. The current project addresses the requirement to extend surveys to more remote and rugged areas where night-time counting is less practical and where effective monitoring is, therefore, more likely to rely on support from citizen scientist recording.
A key element of the current research project has therefore been the testing of methods to promote the recruitment and involvement of citizen scientists in collecting information on the distribution and occurrence of mountain hares. In addition to existing BTO and Mammal Society volunteers, the project engaged with organisations such as Mountaineering Scotland, The Ramblers (Scotland), and other relevant groups. The resulting scheme was named the ‘Volunteer Mountain Hare Survey’ (VMHS) and utilised the Mammal Society’s Mammal Mapper mobile phone app, developed by Natural Apptitude Ltd.
Although the approaches trialled in this project, which were broadly based on transect surveys, are primarily focused on alternatives to night-time surveys, we also undertook comparison surveys on areas amenable to both daytime and night-time counts. Additionally, trials included bird recording in some VMHS surveys. This was intended not only to make the most of available opportunities to collect information on data-deficient upland species, but to increase available survey effort for mountain hares by facilitating the involvement of volunteers whose primary interests were ornithological.
This project is a partnership between British Trust for Ornithology (BTO), Game & Wildlife Conservation Trust (GWCT), The James Hutton Institute (JHI), Mammal Society (MS) and NatureScot.
Main findings
- The pilot year of the VMHS confirmed that a citizen science approach can contribute to a more robust understanding of mountain hare conservation status by improving monitoring efficiency and coverage.
- Sightings data from the VMHS and comparisons with known distributions of mountain hare re-affirm that the geographic range of this species is largely correct. However, mountain hares were also recorded outwith their known distribution, near Loch Ewe in the North West Highlands.
- During the project period, 66 people carried out and submitted a total of 1,464.6 km of surveys using the Mammal Mapper app.
- Several issues were highlighted by the survey in terms of coverage, participation and the use of mobile technology that should be addressed in any future rollout of a volunteer-based monitoring programme.
- A system of priority squares was used to promote surveys in areas where few VMHS surveys had been undertaken. Nevertheless, gaps in survey coverage remained in key parts of the mountain hare’s range. Moreover, coverage in remote areas away from areas of high human population density relied on very few volunteers travelling relatively long distances. Future iterations of the VMHS should seek to improve engagement with, and volunteer recruitment from, local communities to build local surveyor capacity.
- Survey sign-up is recommended to move to an account-based system, enabling better communication with volunteers and troubleshooting should they have any problems doing the survey. This would also allow capture of better feedback to inform improvements to the survey experience.
- The Mammal Mapper app was used successfully by many volunteers in the VMHS but had mixed reviews from survey participants. Several improvements were identified which, if they were to be realised, could improve the quality of data collected, recruitment and retention of volunteers, and the number of surveys carried out, particularly in remote areas. Reducing the time required to enter data and ensuring app stability are among the suggestions made by participants. It will also be worth considering the feasibility of alternative approaches for capturing survey data, for participants and situations that cannot currently be accommodated by the app.
- Careful consideration should be given to whether a mountain hare survey scheme carried out by volunteer surveyors should be allowed or encouraged at any time, or whether it would be better to target seasonal windows or times of day. Although the findings of this pilot work suggest that encounter rates for this species can be high during daylight hours, it is likely that time of day and season will influence hare detectability. In addition, season may influence the number of hares present in a survey area, and the potential for hare surveys to detract from volunteer effort for other wildlife surveys (and for those surveys to impact negatively on participation in hare surveys).
- Better use should be made of the records of mountain hare ‘signs’, particularly hare dung, the locations of which are collected by volunteers during surveys. Such records may, particularly in the context of daylight surveys, have the potential to generate more useful information than live hare sightings, particularly in remote areas with low hare densities. However, a greater reliance on dung records is likely to require the provision of further training and guidance. The development of survey protocols that are suitable for volunteers collecting these records in a variety of habitats and hare densities, is necessary to ensure that data they collect are reliable and robust.
Acknowledgements
The authors are grateful to the many volunteers who ventured out and collected data on mountain hares and upland birds for the survey, and to estate managers and staff who facilitated and carried out daylight and nocturnal surveys. We also thank Scottish Land and Estates, Scottish Gamekeepers Association and representatives of hillwalking organisations; Dave Windle (North East Mountain Trust), Davie Black (Mountaineering Scotland) and Danny Carden (The Ramblers, Scotland) for assistance in promoting the survey. We thank Dr Luke Blazejewski Film and Photography for putting the mountain hare survey promotional film together, with footage received form Mat Larkin of Scotland: The Big Picture and Andy Howard Photography. From BTO we would like to thank Sarah Harris for providing data from the Breeding Bird Survey to enable comparison with that collected for the VMHS, as well as Matt Baxter and Steve Pritchard for their work on the Hare Square sign up system and selection map, and Chris Wernham and Stuart Newson for helpful discussions and advice. Thanks also go to Hugh Tooby, who provided valuable feedback on the Mammal Mapper app. Thanks to Natural Apptitude, especially Dave Kilbey and Joe Woodhouse, for their work in developing the Mammal Mapper app to incorporate the VMHS survey methods and their persistence in rectifying identified issues during development. Mammal Society would like to thank Talia Reed for her help checking and preparing the received survey data and Sophie Webb for her help in promoting the survey across the Mammal Society’s social media channels. From GWCT we would also like to thank Kathy Fletcher, Marlies Nicolai, Hugo Straker, Amy Cooke, Jude Dingham-Price and Gemma Morgan for their assistance with conducting the lamping surveys. The modifications to the Mammal Mapper app to facilitate the VMHS were funded through this project by NatureScot. Scott Newey’s contribution to this study was part-funded by the Scottish Government’s Rural and Environment Science and Analytical Services (RESAS).
Abbreviations
British Trust for Ornithology (BTO)
BTO/JNCC/RSPB Breeding Bird Survey (BBS)
Game & Wildlife Conservation Trust (GWCT)
General Data Protection Regulation (GDPR)
Global Positioning System (GPS)
Joint Nature Conservation Committee (JNCC)
National Biodiversity Network (NBN)
National Monitoring Scheme (NMS)
Ordnance Survey (OS)
Royal Society for the Protection of Birds (RSPB)
The James Hutton Institute (JHI)
Volunteer Mountain Hare Survey (VMHS)
Introduction
A history of the work leading to the development of monitoring systems for mountain hare in Scotland and the project described in this report can be found in NatureScot Research Report 1076 (Newey et al., 2020). Mountain hares in Scotland are most abundant in upland areas managed for driven grouse shooting (Hesford et al., 2019), but also occur in parts of the Scottish Lowlands, as well as on islands and in upland woodland, conifer plantations and agricultural habitats (Figure 1) (Patton et al., 2010; Mathews et al., 2018; Hesford et al., 2020).
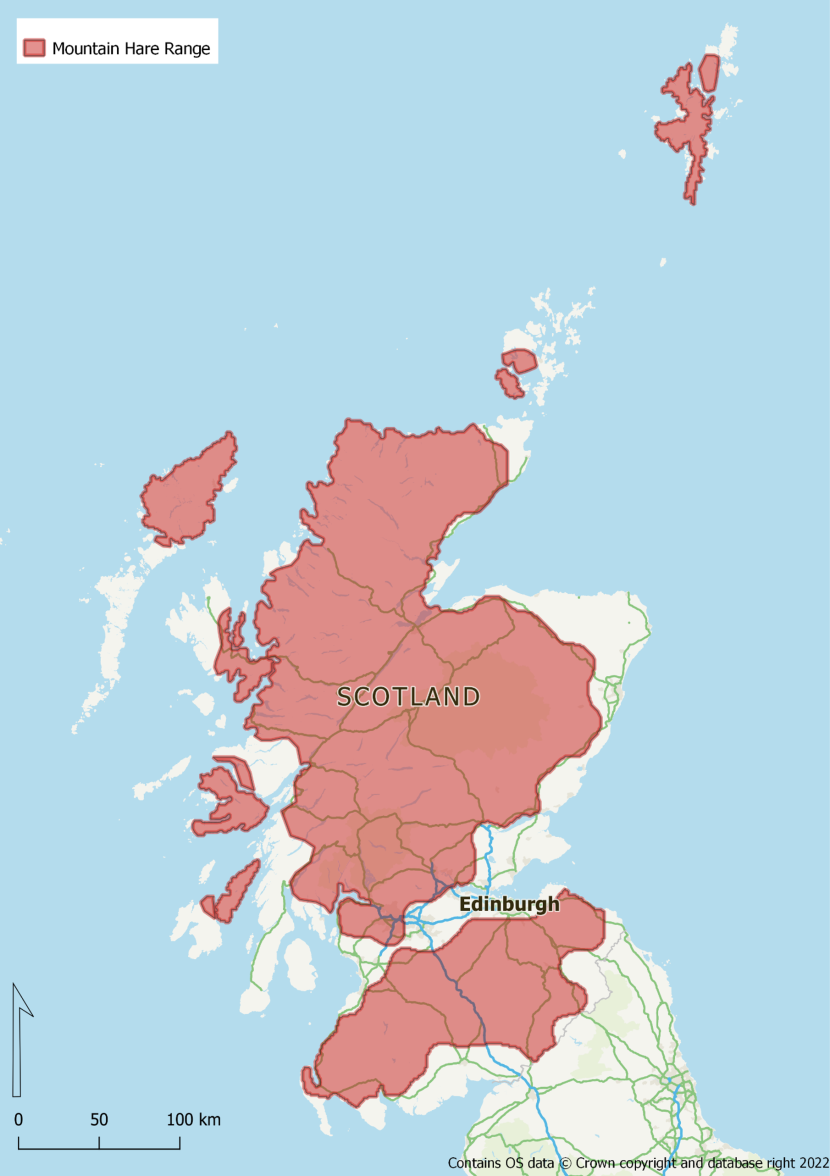
Figure 1. Known range of mountain hare in Scotland adapted from Patton et al., 2010; Mathews et al., 2018; and Hesford et al., 2020
Click for a full description
The range of mountain hare in Scotland covers much of the upland areas of mainland Scotland, including the Southern Uplands, as well as islands including Lewis and Harris, eastern Skye, Raasay, Mull, Jura and parts of Islay, parts of Orkney and parts of Shetland.
Previous mountain hare monitoring reports developed a system of night-time counts in core moorland habitat parts of the species’ range (Newey et al., 2018). However, a gap remained with respect to survey methods suitable for non-moorland habitats, or areas where night-time lamping surveys would be impractical (Newey et al., 2018). Options for survey approaches on non-managed moorland were identified in Newey et al., (2020), which recommended the further development of existing volunteer-based surveys of mountain hares to improve coverage in these areas. The importance of developing such survey methods was further underscored by the recent report of the Grouse Moor Management Group (Werritty, 2019), where recommendation 18 stated that survey methods for mountain hares should be suitable for counting the species across all parts of their Scottish range.
This project therefore aims to complement existing monitoring by extending surveys to areas that are more remote, or with steeper or more rugged terrain, where night-time counting is less practical, and effective monitoring is more likely to rely on support from citizen scientist recording.
This project had four objectives:
- To trial and assess the suitability of citizen science-based approaches for collecting data on mountain hares in a wide range of habitats (i.e., not restricted to managed moorland);
- To replicate, where possible, these approaches at a sample of locations where validation hare counts will be undertaken according to the standard night-time transect method;
- To set in place an overall programme of monitoring based on these approaches (or the most promising one);
- To evaluate, as far as is possible within the limited period and number of the trials, the relative merits of each of the three approaches (‘rambling’, ‘square’ and ‘night-time’ surveys) to potentially contribute to a National Monitoring Scheme if taken forward.
Methods
Survey methods
The Volunteer Mountain Hare Survey (VMHS) is a monitoring initiative covering two main types of survey, described below. The survey work undertaken for this project was carried out from April to December of 2021. Planning, preparations, engagement and some supplementary professional surveys were supported by two years of funding, on a trial basis, by NatureScot. The work was implemented by representatives of the following partner organisations: British Trust for Ornithology (BTO); Game and Wildlife Conservation Trust (GWCT); the James Hutton Institute (JHI); NatureScot; and Mammal Society. The project team aimed to trial two approaches to engaging volunteers in surveying mountain hares, both in terms of the effectiveness of engagement across diverse groups of potential participants, and in terms of the information these volunteers collected over the course of the project’s pilot year. Surveys were carried out across the whole of Scotland, but with survey effort largely concentrated within the known range of mountain hare as described by Patton et al. (2010) – see Figure 1.
The survey approaches being trialled here should be considered complementary to night-time surveys and are aimed primarily at gathering information in parts of the mountain hare’s range where night-time surveying may not be practical either due to remoteness, terrain or availability of expertise required. As well as collecting information about mountain hares, the project team sought to collect information on other under-recorded upland species, providing additional data that could help to improve our understanding of the conservation status of these species. In addition to other mammal species, the project also included a suite of 23 upland bird species (Table 1). These were included in the survey because, although they are widespread in the upland habitats occupied by mountain hares in Scotland, survey data for these species are limited (either across the whole of Scotland or for the upland component of their populations). The inclusion of these birds makes participation in the surveys more attractive to some potential volunteers; particularly those already participating in surveys such as the BTO/JNCC/RSPB Breeding Bird Survey (BBS), with which VMHS Hare Square survey methodology (see below) shares much in common. Some upland bird species were excluded on the basis that VMHS methods were not well-suited to recording these species, or because they were already well covered by other monitoring schemes. The project sought volunteer participation in two different types of survey: opportunistic ‘Hare Rambles’, and more structured ‘Hare Square’ surveys. A further two categories ('Hare Only’ survey and ‘Hare Other’ survey) are used to classify records collected in ways that diverge from these two main survey approaches. All these survey types followed the same format, with participants carrying out survey transects, using Mammal Society’s Mammal Mapper app to record animals encountered.
Table 1. List of bird species included in the VMHS, with conservation status and BTO code of each species shown (key below).
| Common Name | Scientific Name | Conservation status | BTO Code |
|---|---|---|---|
| Carrion crow | Corvus corone | Green | C. |
| Common sandpiper | Actitis hypoleucos | Amber | CS |
| Cuckoo | Cuculus canorus | Red; SBL | CK |
| Curlew | Numenius arquata | NT; Red; SBL | CU |
| Dipper | Cinclus cinclus | Amber | DI |
| Dotterel | Charadrius morinellus | Red; Sch1.1; SBL; Ann1; RBBP | DO |
| Dunlin | Calidris alpina | Red; SBL | DN |
| Golden plover | Pluvialis apricaria | Green; SBL; Ann1 | GP |
| Greenshank | Tringa nebularia | Amber; Sch1.1; RBBP | GK |
| Grey wagtail | Motacilla cinerea | Amber | GL |
| Hooded crow | Corvus cornix | Green; SBL | HC |
| Jackdaw | Coloeus monedula | Green | JD |
| Meadow pipit | Anthus pratensis | NT; Amber | MP |
| Ptarmigan | Lagopus muta | Red | PM |
| Raven | Corvus corax | Green | RN |
| Red grouse | Lagopus scotica | Amber; SBL | RG |
| Ring ouzel | Turdus torquatus | Red; SBL | RZ |
| Skylark | Alauda arvensis | Red; SBL | S. |
| Snipe | Gallinago gallinago | Amber | SN |
| Snow bunting | Plectrophenax nivalis | Amber; Sch1.1; SBL; RBBP | SB |
| Stonechat | Saxicola rubicola | Green | SC |
| Wheatear | Oenanthe oenanthe | Amber | W. |
| Whinchat | Saxicola rubetra | Red | WC |
Key
EX/CR/EN/VU/NT
Red/Amber/Green
Red, Amber or Green listed on the Birds of Conservation Concern 5 List (Stanbury et al., 2021)
Sch1.1
Schedule 1 part 1 of the Wildlife and Countryside Act 1981 (as amended)
SBL
Scottish Biodiversity List species
Ann1
Listed on Annex I of The Birds Directive
RBBP
Listed as one of the species that the UK Rare Breeding Bird Panel reports on
Hare Rambles
Hare Rambles were intended to capitalise on the outdoor activities of a wide cross-section of outdoor users, including hillwalkers, bird watchers, mammal enthusiasts and other groups interested in wildlife and the countryside. As such, they allowed individuals to survey birds and mammals on any route of their choosing. Due to the intention that volunteers would be drawn from a diverse cross-section of recreational outdoor users, including people whose primary aim might not be to survey wildlife, participants were instructed to ensure that periods of recording (with the Mammal Mapper app switched on) were limited to times when they were actively looking for animals to record. It was emphasised in the survey guidance and promotional material that if participants did not want to survey mountain hares and other animals for the whole walk, they could and should limit the period of recording to one or more sections of their journey for which they were happy to be actively searching.
Square Surveys
By contrast, Hare Square surveys were aimed primarily at more experienced or dedicated wildlife surveyors, such as participants in the BTO/JNCC/RSPB Breeding Bird Survey (BBS). Surveys were carried out within one-kilometre Ordnance Survey (OS) grid squares, with participants being asked to record mammals and, optionally, birds along two 1 km transects in each square they surveyed. In this way, survey methods were similar to those used in the BBS. As well as facilitating participation by existing BBS volunteers, this made it easier to compare and combine these two datasets. Hare Square participants carried out their surveys along two roughly parallel transects within (or mostly within) the focal square.
As for the other surveys carried out for this project, recording was done in Mammal Mapper, enabling recording of tracks, signs and carcasses, as well as live animals. Participants registered on an online system administered by BTO, similar to those developed for regional bat surveys such as the Norfolk Bat Survey and Southern Scotland Bat Survey (Newson et al., 2014). As well as capturing contact details, the system prompted users to indicate which of the 23 bird species listed in Table 1 they were sufficiently confident of their identification skills (on a level of 1 to 3) to include in their surveys, and also allowed them to select the squares they intended to survey.
Volunteers were able to survey any 1 km square of their choosing in Scotland. However, randomly selected ‘priority squares’ were highlighted to potential volunteers to encourage a representative geographic sample of surveys and ensure overlap with lamping surveys (Figure 2). Between one and three priority squares were drawn from each sampled hectad, with each being a minimum of 1 km from the next nearest priority square, and having a maximum of 25% urban cover, and a maximum of 50% combined cover of urban, forest and open water habitats, according to the CEH land cover dataset (Morton et al., 2020). In order to, allow for the possibility that mountain hares might be found outside of their known range, the sampled area combined the mountain hare’s known Scottish range with those (relatively small) areas outside this range that are within the ‘true upland’ zones described by Carey et al., (2008), most of which are dominated by landscapes and habitats that appear suitable for mountain hare (Newey et al., 2020). This format, particularly when combined with the sign-up system, helped to distribute available survey effort more evenly within the landscape.
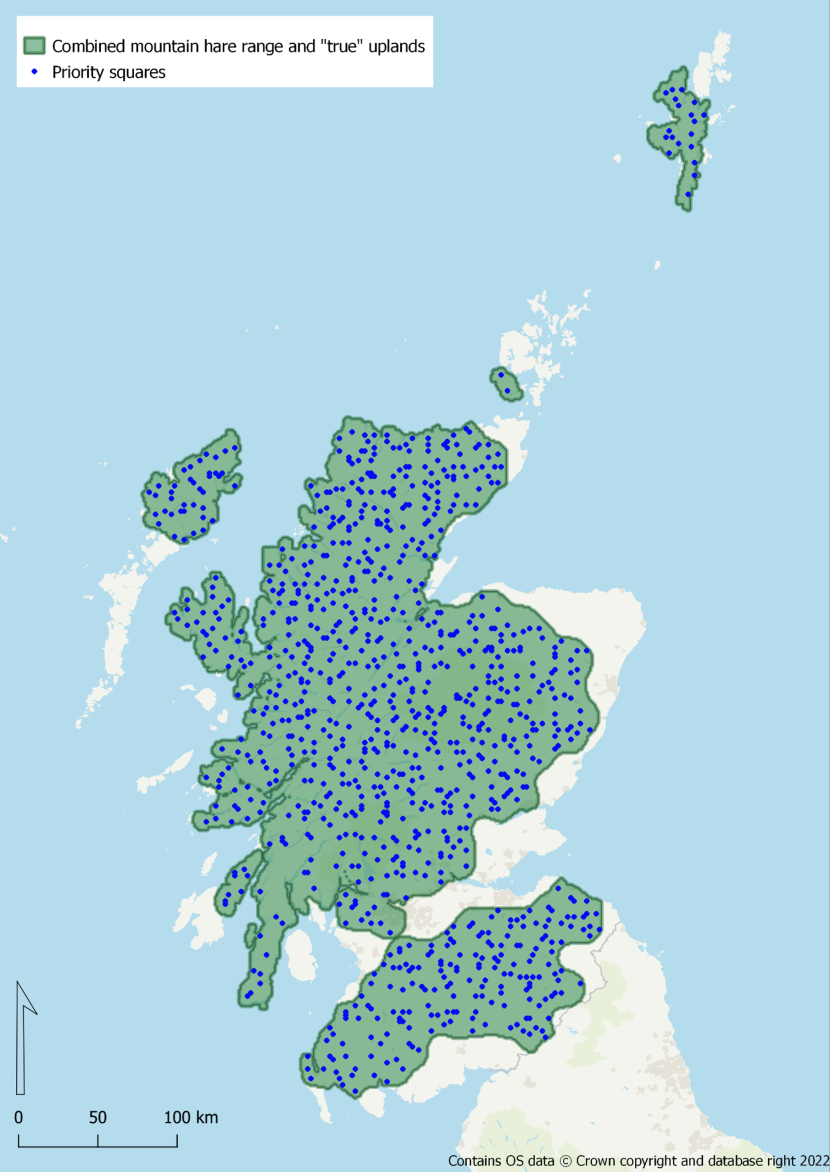
Figure 2. Distribution of hare squares marked as “priority” within the Mammal Mapper volunteer surveyor sign-up system
Click for a full description
The distribution of priority hare squares in Scotland. Within the area indicated (an amalgam of the known range of mountain hare and the true upland zones identified by Carey et al., 2008), Between one and three priority squares were randomly selected from each hectad, with the constraint that all priority squares were separated from surrounding priority squares by a minimum of 1 km, and had a maximum of 25% urban cover, and 50% combined cover of urban areas, forests and open water.
Other volunteer surveys
Volunteers in either type of survey could select to record only mountain hares and not other species during their transects (‘Hare Only’ surveys). This type of survey is distinguished from Hare Rambles only in order to aid interpretation of absence data on species other than mountain hares. Information from other surveys carried out using the Mammal Mapper app in Scotland is included in summaries and comparisons below under the classification ‘Hare Other’.
Mammal Mapper app development
The Mammal Mapper app was originally released in 2018. This free smartphone app was designed to fill the significant data gaps for (a) the areas of occupancy and (b) densities of many British mammals that were identified in the Review of the Population and Conservation Status of British Mammals (Mathews et al., 2018), by enabling effort-based surveys to be undertaken easily by volunteers. The route taken by surveyors is automatically logged using the Global Positioning System (GPS) capability of their smartphone, meaning that the total amount of survey effort is recorded. The app includes a short field guide to each species, including photographs to highlight key identification features, and information to assist with the recognition of potential confusion species. Users are asked to indicate their level of experience with mammal recording when the app is first installed, and they must register an email address so that records can be uploaded, and they can be contacted in the case of queries. Appropriate information is given on the use that will be made of data under General Data Protection Regulation (GDPR), and data are stored in compliance with GDPR.
To ensure that mammal sightings are recorded in a systematic way, the user is guided through a sequence of intuitive pages and drop-down menus whenever they select to record an observation. This ensures that key metadata are collected, including the mode of transport of the observer (foot, bicycle, vehicle); type of record (animal itself or a set of field signs), animal status (alive/dead/roadkill), numbers of individuals, distance and orientation of the observation relative to the observer; and photographs. The time, date and location for each observation is also recorded, and the user interface shows a map with the transect route and the locations of sightings, so that any errors can readily be identified. The resultant uploaded GPS tracks are screened, and if necessary, cleaned by Mammal Society staff. Records data enter the usual pathway of verification by regional biological recorders. Data are shared with the Biological Records Centre, the National Biodiversity Network (NBN) and with local records centres; and records for sensitive species (which include mountain and brown hares) are aggregated to a tetrad (2 km) resolution before being made available via the NBN Atlas.
A number of revisions and additions were made to the app to make it more suitable for use in the VMHS. These included the following:
- The option to choose from the alternative types of hare surveys (the appropriate category from Hare Ramble, Hare Square and Hare Only can be chosen from a drop-down list of available projects and surveys by the participant at the start of each survey – see Figure 3);
- A compulsory question at the start of the transect to record whether observers were accompanied by a dog (a feature which could have a major impact on hare detectability);
- Additional photographs and textual information to help users distinguish mountain hare and brown hare;
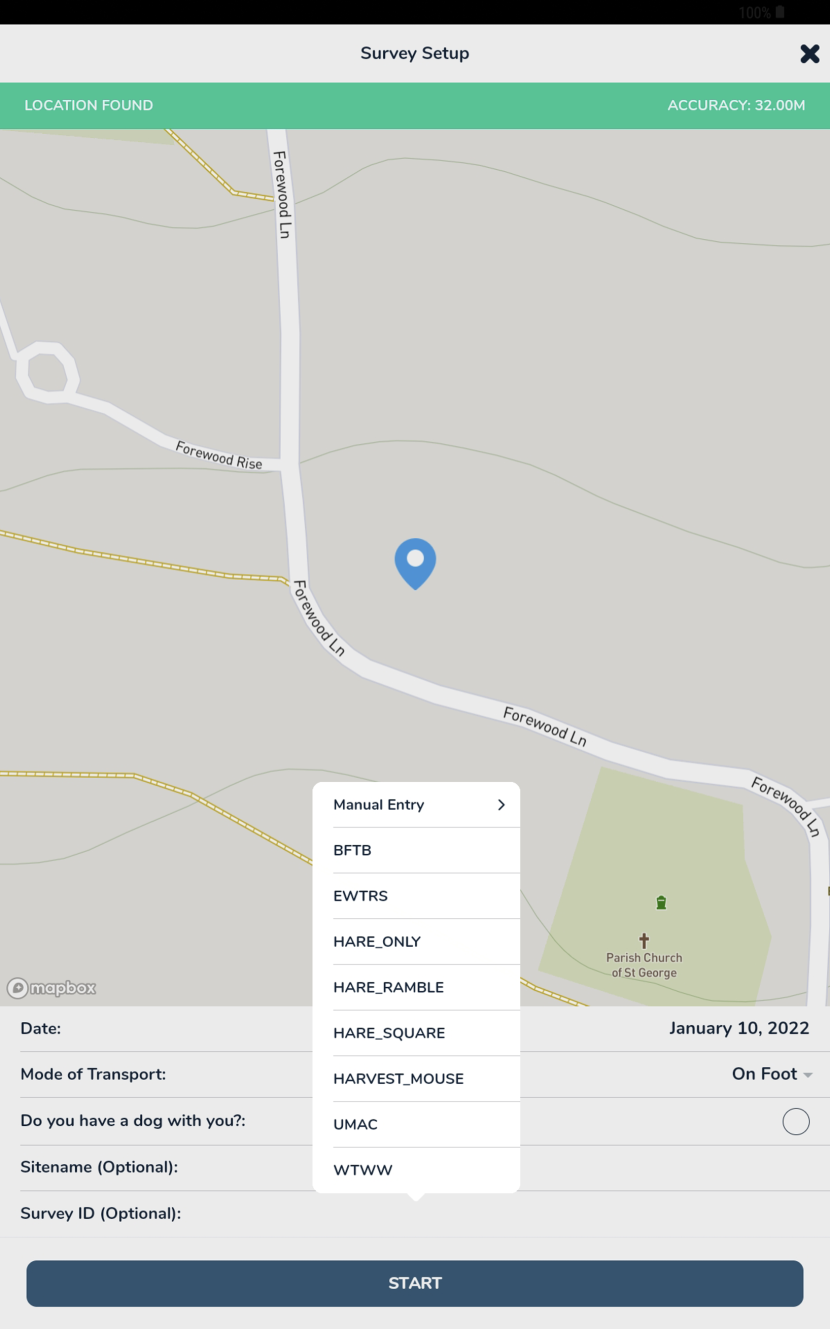
Figure 3. Screenshot of the Mammal Mapper app survey setup showing the options for surveying
Click for a full description
A screenshot of the Mammal Mapper app survey setup, with a map in the background and selection of survey types
In addition, there was the provision of an option to enable the app to be used for recording upland birds as well as mammals. This modification was necessary so that BTO volunteers could use a single recording interface and represented a major addition. On selecting this option, users are asked to indicate their level of experience with bird surveys and are taken to a new page that describes the project. This page describes the alternative types of surveys and includes a link to more detailed information provided by the partnership on the project (including a short video demonstrating how to do the surveys). Having toggled on the mountain hare survey option, 23 upland bird species are available for selection via a dropdown menu (identified by a bird icon) that sits alongside the menu for mammals (indicated by a hare icon). As for mammals, users are taken through a series of intuitive pages that permit the systematic recording of metadata including type of record (visual or auditory), status of bird (alive/dead/roadkill), number, distance and orientation from the observer. Photographs can also be uploaded. Textual information, photographs and maps are provided for each species as a short identification guide. Figure 4 shows a montage of screenshots from the Mammal Mapper app to illustrate some of the steps described above. The new additions to the app required a complete re-build to be undertaken, and this also accounted for changes in smartphone operating systems that occurred during 2021 (notably, a major change to the Apple operating system). Extensive testing was undertaken by the Mammal Society and BTO staff, other project partners and approximately six volunteers, in order that the app could be trialled on a variety of phone makes, models and operating systems. This testing process identified the following issues which were then resolved:
- conflicts between Mammal Mapper and other apps using GPS capability;
- recording freezing when the phone was using battery optimisation or standby mode;
- transects not recording where the phone had no mobile data (an essential requirement for use in remote regions);
- incorrect measurement of transect distance;
- erroneous GPS locations, (a normal occurrence with any GPS device), being automatically screened out based on distance from the last survey points, rather than being displayed on the transect map.
A troubleshooting guide was also provided on the Mammal Society’s website.
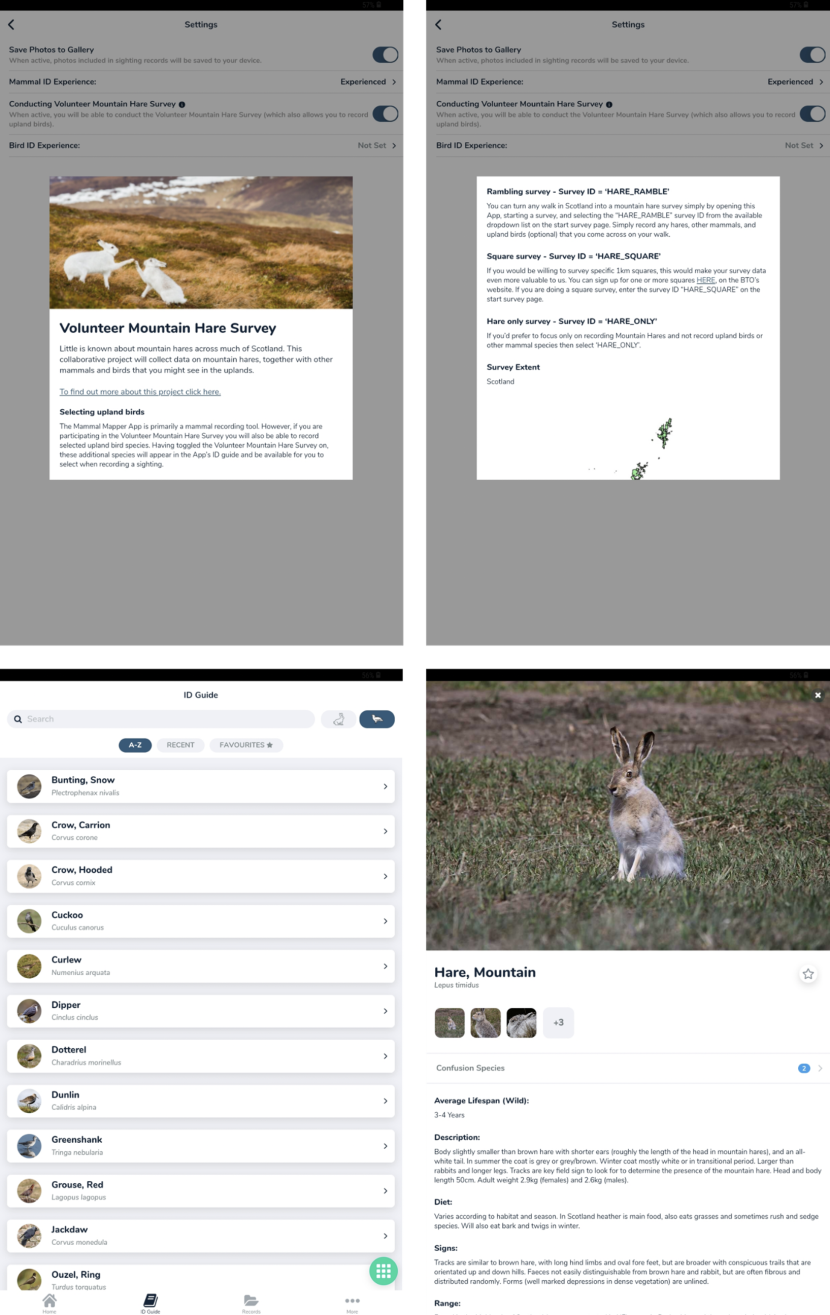
Figure 4. A montage of screenshots from the Mammal Mapper app to show some of the pages that users encounter when setting up a survey
Click for a full description
Montage of screenshots from the Mammal Mapper app, showing introductory pages, survey and bird selection pages and mountain hare information page. Top left: introductory page for the VMHS; top right: survey type selection; bottom left: bird selection page; bottom right; mountain hare description page.
It was not possible to provide a base map for surveyors in the absence of mobile data. Such a facility would have required users to cache maps in advance of their walk, and discussion with testers revealed that most experienced walkers would have maps in paper format or cached within another walking or hill-running application. Therefore, to avoid drawing unnecessarily on memory and storage space (which would affect all users), plus the additional complication of advising users of the requirement to download information in advance, it was decided not to pursue this option.
Testing with volunteers also identified the need to add the ‘hare-only’ options for participants who wanted to focus their contribution on hares and were not interested in recording other species. The option for recording the accuracy of the transect was also altered, following consultation with users, to a checkbox to indicate cases where a transect had failed to record accurately (rather than the reverse). In addition, at the outset of the surveys a ‘pause’ button was included in the app to facilitate BTO Hare Square volunteers recording each of their transects consecutively. However, the pause button frequently caused problems for users (sometimes inadvertently being left switched on, preventing further recording), and it was therefore decided to remove this option from the app. BTO volunteers were instead issued with revised instructions, requesting them to record each of their transects as a fresh survey in the app. These transects were later combined digitally on the basis of their dates, times and locations.
Engagement
The VMHS was promoted by each partner organisation and their professional networks through their respective websites, as well as through blogs, a newspaper article, social media platforms, members’ magazines, e-bulletins and through meetings and training events. It is estimated that at least 85,000 individuals were reached through these means. Some experienced and established volunteers were targeted through direct communication and asked to contribute as testers for the Mammal Mapper app. Additionally, non-partner organisations including Scottish Land and Estates, Scottish Gamekeepers’ Association, Mountaineering Scotland, The Ramblers (Scotland) and the North East Mountain Trust were asked to promote the study through their membership.
Particularly early on in the project period, the Mammal Mapper app underwent extensive development, partly to implement changes that had been agreed before the launch of the project, and partly to address bugs and other issues identified during pre- and post- launch testing. Although the improvements to app functionality and reliability were warmly welcomed by app users, this development work had a negative impact on engagement and promotion work. This was due to considerable periods when engagement staff were asked not to promote the app while bugs were being fixed and during testing, which continued throughout the run of the project into December 2021.
A launch tweet from BTO on Twitter received nearly 18,000 ‘impressions’ (times where the tweet was viewed on a screen), but was only engaged with by 202 Twitter users, 29 of which actually clicked the link to the project webpage. Other partners promoted the project on their respective social media platforms.
Hare Rambles were promoted mainly, but not exclusively, amongst the mountaineering and hill-walking communities and were anticipated to focus primarily on the larger hills and mountains, principally the Corbetts and Munros. Participants were able to choose where and when to carry out transects, and the duration of their walk. The Mammal Mapper app enabled participants to record selected upland bird and mammal species in addition to mountain hares, if they wished. No BTO webpage sign-up was needed for this survey type.
Night-time surveys
The main aim of the rambling and square survey models was to improve the availability of data in parts of the mountain hare’s range unlikely to be well represented by night-time lamping data (e.g., the North and Western Highlands). However, these approaches were also undertaken alongside night-time lamping surveys at a sub-sample of sites across the Central Highlands. The purpose of this was to enable validation of the Hare Square survey findings with the established night-time survey methodology for surveying mountain hares, which is known to work well in managed moorland habitats (Newey et al., 2018; Newey et al., 2020).
Night-time surveys result in considerably higher detectability than daylight surveys, partly because mountain hares are more active at night than during the day, and partly because hare eye reflections caught in lamplight at night are easier to detect at a distance than inactive and concealed hares in daylight. To evaluate how the number of hares recorded by volunteers during square surveys compared with those recorded during night-time monitoring, daylight surveys were carried out in ten of the 2 x 2 km tetrads. All tetrad squares were located on open moorland habitat and comprised primarily of ericaceous dwarf shrub communities, dominated by heather (Calluna vulgaris). Only existing sites (i.e., tetrad squares that were already being monitored as part of an estate led night-time counting initiative) were considered for inclusion, with those sites considered most accessible to the volunteers selected. Lamping surveys were carried out by experienced members of the project team, aided by trained land managers who have been conducting these surveys since their inception in 2018. In the same areas, daylight Hare Square surveys were either carried out by volunteers or, where volunteer participation was low, by members of the project team. All of these surveys (tetrad night-time counts and daylight Hare Squares) were carried out between September and early December.
A total of 15 tetrad squares were surveyed following the methods outlined in Newey et al. (2018) where each tetrad count comprised four parallel survey transect lines of 2 km each, spaced approx. 500 m apart. Lamping surveys started at least one hour after sunset. An observer walked along each transect at a steady pace shining a high-power spotlight from side to side as they traversed the transect line. The transects at each tetrad site were surveyed concurrently by four individual observers to avoid double counting due to the displacement of mountain hares from one adjacent transect into the next. Due to costs and weather conditions, and in contrast to Newey et al. (2018), each tetrad square was only surveyed once.
Data analysis
Survey records
Information on the data collected and presented in this report relates to all Mammal Mapper data from Scotland collected between 22 March 2021 and 16 December 2021.
Very few previous Mammal Mapper transect records in Scotland were associated with a dedicated survey on as comparable a scale or level of organisation as this project. To assess the scale of data collection achieved via the VMHS compared with baseline survey effort before and during the VMHS, we compared records submitted during a three-year period before the launch of the VMHS (28/03/18 to 22/03/21) and with those submitted during the VMHS (22/03/21 to 16/12/21). To ensure comparability, only transects conducted on foot were included, and records associated with other dedicated surveys for which survey methods were not comparable, such as the National Harvest Mouse Survey, were excluded. The spatial distribution and number of sightings together with survey effort (length in kilometres) were then compared. A comparison of the number and spatial distribution of records was also made between mountain hare data deriving from VMHS and those collected by BBS surveyors in the same year (2021).
Where the survey type assigned by the surveyor was clearly incorrect for some, or all of a transect, appropriate transect sections were reclassified. These included situations where no transect code had been selected but transect lengths and bird records indicated that a Hare Square survey had been performed. The most common situation, which is illustrated in Figure 5, involved Hare Square surveys where surveyors did not pause their recording or switch to a Hare Ramble survey while walking to their square, or between their two parallel survey transects.
Hare Rambles where participants omitted to select any of the available ‘Hare’ survey types before starting their survey were not easily distinguished from non-project surveys. To ensure that all data collected by participants were included in these outputs, and to maximise our use of all mountain hare data collected via Mammal Mapper, we classified all transects submitted via the app that could not clearly be identified as part of the VMHS project (based on the descriptions above) as ‘Hare Other’. When evaluating the impact of the project on the volume of data collected via Mammal Mapper, the likelihood that the ‘Hare Other’ category applies both to information collected by project participants and data from other surveys not associated with the project should be borne in mind.
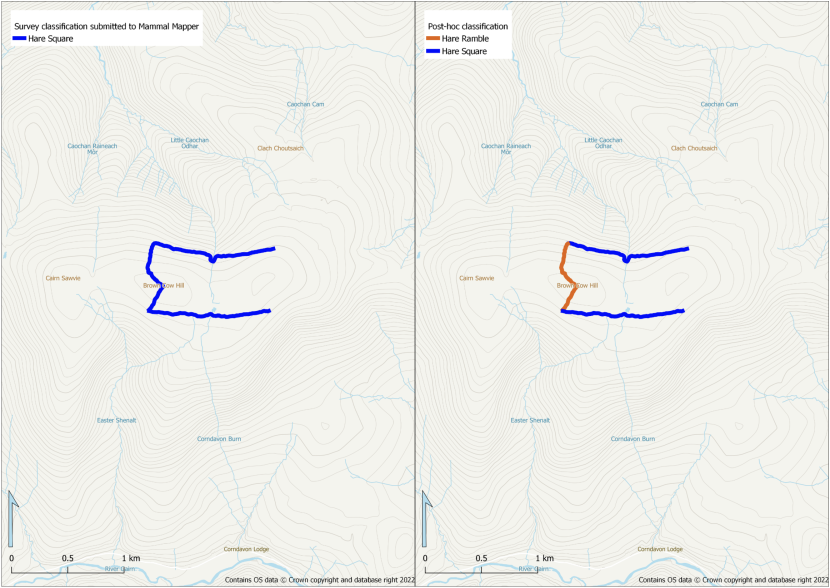
Figure 5. An example of transect survey type re-classification
Click for a full description
Maps showing the transect classifications before and after a post hoc update. In some cases, as illustrated here, surveyors would assign one survey type to a transect where more than one type of survey had clearly been carried out. As shown, this was edited post-survey.
The image on the left shows transect routes submitted to Mammal Mapper. The image on the right represents the transects with updated classifications for sections of Hare Ramble survey (orange) and Hare Square survey (blue).
Detection distances
During many animal surveys, a considerable proportion of target animals in surveyed areas go undetected and, therefore, unrecorded (Einoder et al., 2018). Counts of observed individuals only may still be useful for comparisons between different places or times where it is reasonable to assume that detectability is similar. However, to estimate the actual number of animals present, or compare survey findings between situations where the proportion of animals detected may vary (e.g., different habitats, or different species), the effect of detectability on the number of animals detected and recorded must be considered. With data from transect surveys, this may be done using distance analysis (Buckland et al., 1993), whereby the number of animals, or groups, recorded at different distances from the transect line is used to estimate the effect of this distance on the probability that an individual animal will be detected. The resulting ‘detection function’ can, with specific assumptions, be used to estimate the proportion of animals that were not detected in each survey, and so convert the number of animals recorded into estimates of absolute abundance.
The distance and direction of an animal from an observer could be recorded directly within the app at the time of each sighting (see app method section). Although it is possible to record distances to the nearest metre in Mammal Mapper, recording in the app defaults to a discontinuous sliding scale with distance values of 0 m, 5 m, 25 m, 50 m, 100 m, 250 m, 500 m and 1,000 m. This information can be used directly to calculate the perpendicular distance of an animal to a straight line transect. However, it is likely that many transects, especially non-Hare Squares, will not be perfectly straight. The use of non-straight transects is unlikely to pose any issues with distance sampling as long as a substantial proportion of sightings occur within the radius of the curvature of the track (Hiby and Krishna, 2001). To account for this an additional distance metric was also calculated post hoc by reporting the closest geometric distance of an animal relative to the recorded transect. Calculations were conducted using PostGIS (Strobl, 2008).
Variation in the distance from the transect of live animals recorded during surveys was assessed using histograms showing the frequency of observations in different distance bands. The histograms grouped the observations into distance bands of 25 m width. It should be noted that, for all observations other than those perpendicular to the observer’s direction of travel when recorded, distance from the transect is less than that recorded in the field by the observer. This means that, even where observers used the discontinuous sliding scale in the Mammal Mapper to record distance (rather than entering a more precise, estimated value), derived distances from the transect could be any value up to the maximum of 1000 m.
Separate histograms were drawn for each combination of species and survey type for which the number of live observations was greater than 25. We excluded species-surveys with fewer than 25 detections as there is likely too little information to reliably estimate the detection function (Buckland et al., 1993). These histograms were used to visually compare the relationship between detectability and distance between species and survey types. They were also used to assess whether the shape of these relationships suggested that the distances estimated by observers might allow distance analysis to be applied to VMHS data, to generate absolute density estimates and standardise measurements of abundance for comparison between different species and habitats.
As outlined in Newey et al. (2018), detection distances were not recorded on night-time surveys. Instead, encounter rates (number of hares recorded divided by the length of transects surveyed), were used to provide an index of animal abundance. When calibrated against density estimates obtained from other methods, these encounter rates can also provide an estimate of density without the need for more complex distance analysis. This approach is considered to be more reasonable by land managers, particularly if counting of hares along transects might be combined with other management activities.
Mapping and statistical software
Maps were created and formatted using QGIS version 3.10 (QGIS Development Team, 2019). Data summaries and analyses were carried out in the statistical software package R version 3.6.3 (R Core Team 2021), implemented in R Studio version 1.2.5033 (RStudio Team, 2020).
Results
Data collected
During the VMHS project, a total of 456 unique transects were submitted under the Hare Square, Hare Ramble and Hare Only categories in Scotland using the Mammal Mapper app. These transects have 3,182 associated bird and mammal sightings and represent a total distance of 1,817 km of pedestrian survey effort. There were 84 Hare Square surveys completed during the timeframe of the survey. Of the mammal records, 435 were for mountain hare (Table 2), of which 215 were sightings of one or more live animals (but not necessarily different individuals). Fifty-seven records were of prints and trails, and 157 were of droppings (Figure 6). Five records related to possible ‘forms’ (characteristic ‘shelters’), and a single record had no details of the encounter type.
Table 2. Number and total length of transects carried out in each of the four different survey types, and the number of mountain hare records according to record type (the categories used in the Mammal Mapper app) and survey type.
| Survey type | Hare Only | Hare Other | Hare Ramble | Hare Square |
|---|---|---|---|---|
| Number of transects | 34 | 78 | 216 | 246 |
| Total length (km) | 370.6 | 350.6 | 842.1 | 251.9 |
| Mountain hare records | - | - | - | - |
| Alive | 55 | 24 | 71 | 57 |
| Dead | 1 | 2 | 8 | 6 |
| Prints and Trails | 11 | 0 | 26 | 26 |
| Droppings | 39 | 0 | 45 | 78 |
| Den/Burrow | 0 | 0 | 3 | 2 |
| Unknown | 0 | 0 | 1 | 0 |
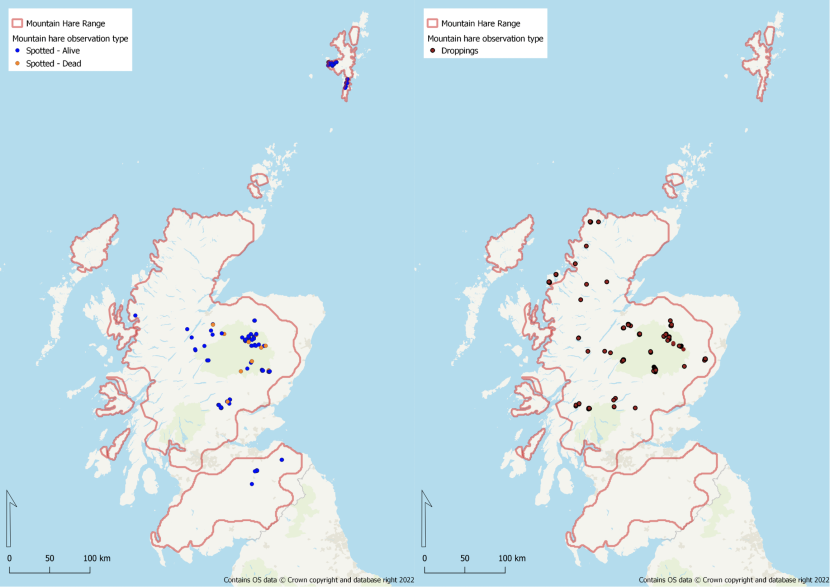
Figure 6. Map showing the distribution of mountain hare records by sighting type (hare spotted either alive or dead, and droppings)
Click for a full description
Two maps showing the distribution of mountain hare records by sighting type, with sightings of both live and dead hares in the map to the left, and records of mountain hare droppings to the right.
By way of comparison, a preliminary (unchecked) extract of BBS data suggests that, in 2021, BBS surveyors in Scotland recorded 63 records of a total of 132 live mountain hares from a total of 43 1km squares. In the north-west Highlands, more mountain hare records were contributed by the VMHS than by BBS. Conversely, BBS contributed more mountain hare records in the Southern Uplands (Figure 7).
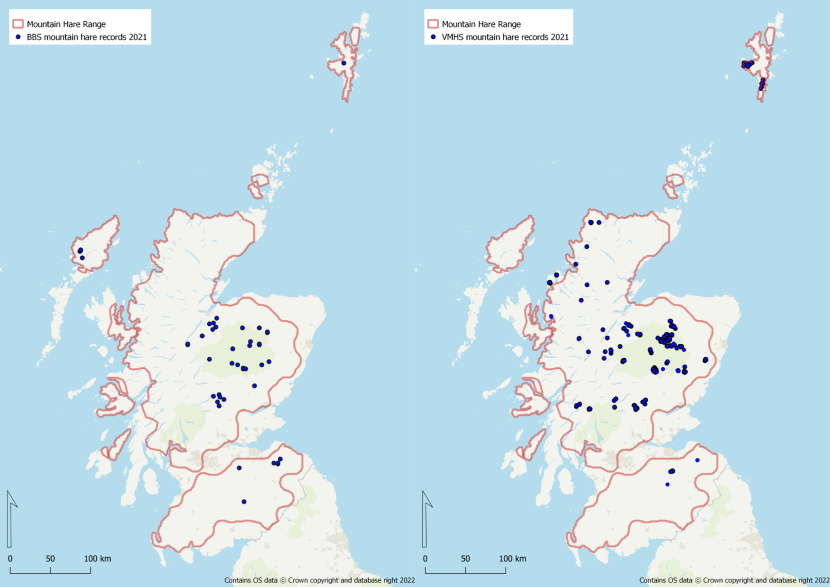
Figure 7. Mountain hare records generated in 2021 from the VMHS (left) and mountain hare records generated from BBS in 2021
Click for a full description
Each dot in the map to the left represents a mountain hare recorded during the VMHS in 2021, with the mountain hare’s range outlined in red. Similarly, the map to the right shows mountain hare records generated during Breeding Bird Surveys.
Of the bird records collected, there were a total of 2,016 individual records, of which 1,481 were sight records and 535 were recorded by sound only. By far the most frequently recorded bird species was meadow pipit (Anthus pratensis), which was also the most abundant bird seen and heard in terms of number of individual birds recorded. This was followed by curlew (Numenius arquatus), skylark (Alauda arvensis) and red grouse (Lagopus lagopus). In total, 19 of the 23 species of birds added to the Mammal Mapper app were recorded in the VMHS. There were no records of dotterel (Charadrius morinellus), dunlin (Calidris alpina), greenshank (Tringa nebulosa) or snow bunting (Plectrophenax nivalis). By comparison, a preliminary extract of BBS data suggests that, for the same 23 species, BBS surveyors in 2021 collected 12,746 records of 28,952 individuals (Table 3a and b). The disparity in the number of individuals recorded by these two surveys was greatest for species that are more widespread and abundant in lowland areas than in the uplands, such as carrion crow and jackdaw. Recorded numbers of both these species were more than 50 times greater in the BBS dataset. For at least some species that are more strongly associated with the uplands, such as red grouse, curlew and raven, this difference between surveys was much less pronounced, the number recorded in BBS surveys being only 2-3 times greater than that recorded in the VMHS.
Table 3a. The total number and length of transect surveys (with each 1 km transect of a BBS square or Hare Square counted as a separate transect) in which at least one individual of these species was recorded.
| - | VMHS | BBS |
|---|---|---|
| Number of surveys | 342 | 1110 |
| Length of surveys | 1094.0 | 2114.0 |
Table 3b. Numbers of bird records and total bird counts from the VMHS (all records from Hare Squares, Hare Rambles and Hare Only surveys) and from BBS transects in 2021.
| - | VMHS Records | VHMS Individuals | BBS Records | BBS Individuals |
|---|---|---|---|---|
| Bunting, snow | 0 | 0 | 18 | 24 |
| Crow, carrion | 42 | 93 | 2202 | 5127 |
| Crow, hooded | 64 | 93 | 175 | 291 |
| Cuckoo | 30 | 30 | 390 | 438 |
| Curlew | 207 | 389 | 481 | 711 |
| Dipper | 5 | 6 | 36 | 41 |
| Dotterel | 0 | 0 | 6 | 10 |
| Dunlin | 0 | 0 | 54 | 177 |
| Greenshank | 0 | 0 | 32 | 42 |
| Grouse, red | 165 | 258 | 364 | 589 |
| Jackdaw | 17 | 62 | 946 | 3544 |
| Ouzel, ring | 11 | 13 | 21 | 27 |
| Pipit, meadow | 898 | 1337 | 3745 | 10294 |
| Plover, golden | 38 | 55 | 176 | 521 |
| Ptarmigan | 2 | 3 | 20 | 24 |
| Raven | 76 | 120 | 236 | 366 |
| Sandpiper, common | 7 | 8 | 128 | 179 |
| Skylark | 293 | 331 | 2719 | 5179 |
| Snipe | 39 | 42 | 299 | 385 |
| Stonechat | 33 | 48 | 170 | 233 |
| Wagtail, grey | 6 | 9 | 64 | 79 |
| Wheatear | 82 | 107 | 376 | 556 |
| Whinchat | 1 | 1 | 88 | 115 |
There is a Mammal Society system in place for verifying records, but the process is dependent on volunteers and not all records would have been assessed by the time of report writing. The records and analyses presented here are, therefore, unverified. The information collected during the Beta testing phases of the app, when a restricted set of volunteers was tasked with exploring the app’s functionality and reporting back any issues, includes records of species that are not known to occur in the survey area, e.g., edible dormouse (Glis glis). Such records were probably intended to be clearly recognised as spurious, to make it easier to remove them, but this relies on there being a suitable system for record verification in place.
Survey Coverage
For the Hare Square surveys (n = 104), there was a good geographical spread of surveys across the whole of the mountain hare’s range in mainland Scotland (Figure 8). Survey coverage was better across the Central Highlands and Southern Uplands, but there were very few surveys completed in the North-West Highlands which were confined to the west and parts of Sutherland. There were also notable gaps in coverage in western Argyll, Skye, Lewis and Orkney. A few surveys were undertaken outwith the known mountain hare’s range, in the Scottish Borders and in Fife. There was a dense cluster of surveys undertaken in the eastern Cairngorms, but this was likely where surveys overlapped with night-time tetrad squares, as each tetrad square corresponded to at least four 1 km Hare Squares.
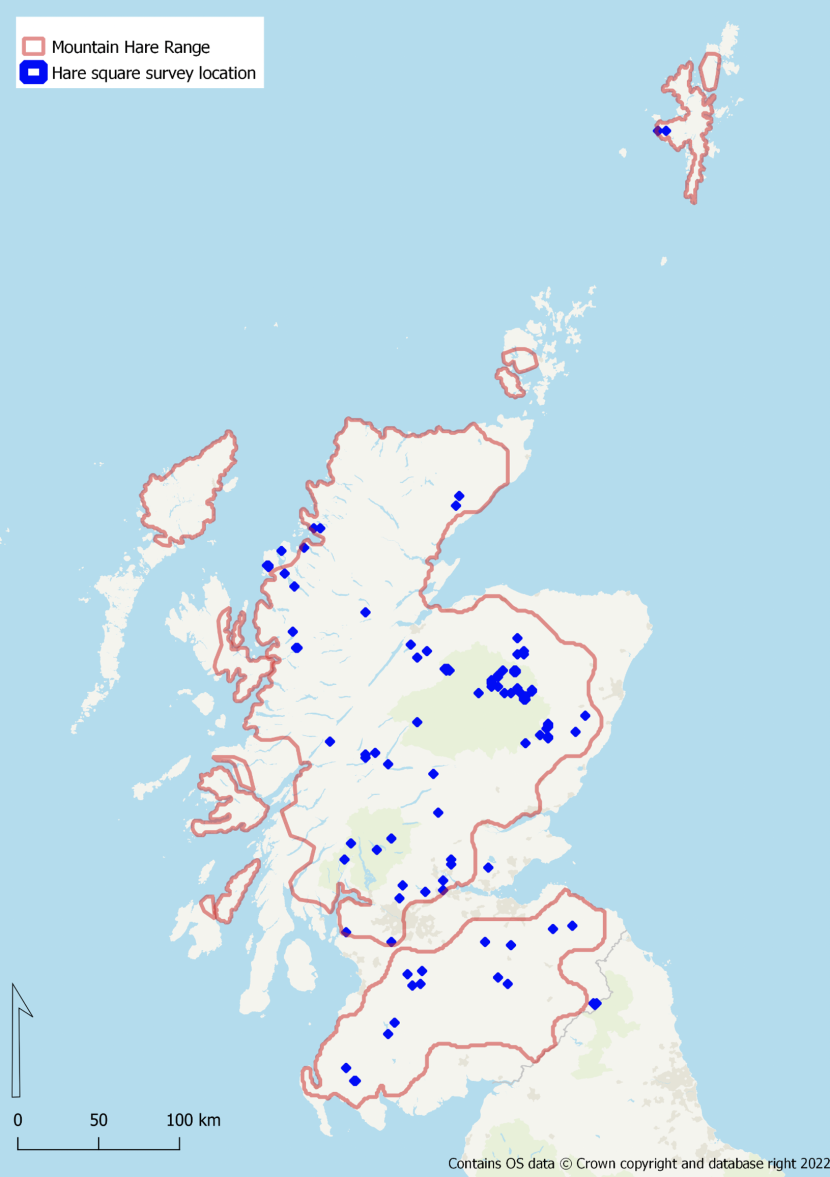
Figure 8. Mountain Hare Squares for which surveys were submitted via Mammal Mapper
Click for a full description
Map showing the distribution of Hare Square surveys submitted via the Mammal Mapper app in 2021.
There was slightly wider coverage from Hare Rambles and other unstructured survey types (n = 328), but with the Northwest still poorly covered and notable gaps existed within Caithness, Kintyre, the Western Isles and Orkney. The coverage by Hare Rambles complimented the Hare Square surveys and increased survey effort and coverage in southern parts of the Northwest and Central regions. Surveys were also undertaken outwith the boundary of the hares’ range, including in England. (Figure 9).
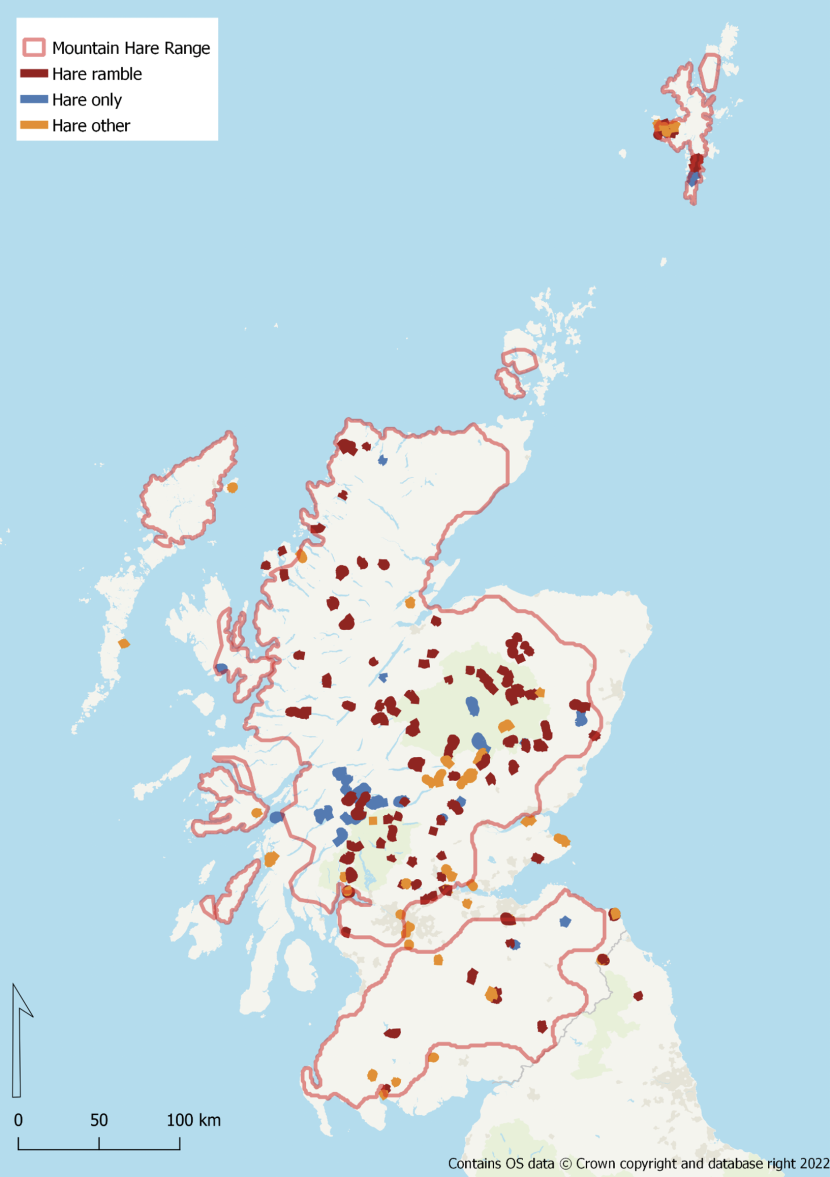
Figure 9. Mountain Hare Rambles and other unstructured surveys submitted via Mammal Mapper
Click for a full description
Map showing the distribution of Hare Ramble, Hare Only and Hare Other surveys submitted via the Mammal Mapper app in 2021.
Comparing the spatial distribution of Mammal Mapper survey effort in Scotland before and after the launch of the VMHS indicates that the project had a markedly positive effect on spatial coverage of surveys carried out using the app. Most survey data collected using Mammal Mapper during the three years before the VMHS are concentrated in areas near the central belt of Scotland, an area of low altitude and high human population density that divides the Highlands in the north from the Southern Uplands in the south (Figure 10). Over this period, Mammal Mapper survey transects were carried out in 145 hectads (10 km x 10 km square). Over a much shorter timeframe, Mammal Mapper data collected as part of the VMHS came from 199 hectads. Only 41 of the previously surveyed hectads were covered in both periods, indicating coverage of an additional 158 hectads. Much of this additional coverage came from the north and west of Scotland, from where coverage during the preceding period was very limited. Considering the dominant land cover (as defined by Morton et al., 2020) within the 1,278 1km OS grid squares that intersected with survey transects, coverage was much greater in categories typical of open, upland landscapes (2.3% of intersected squares were dominated by Semi-natural Grassland and Mountain, Heath & Bog) than in categories typical of lowland and wooded landscapes (0.7% of intersected squares were dominated by other land cover categories).
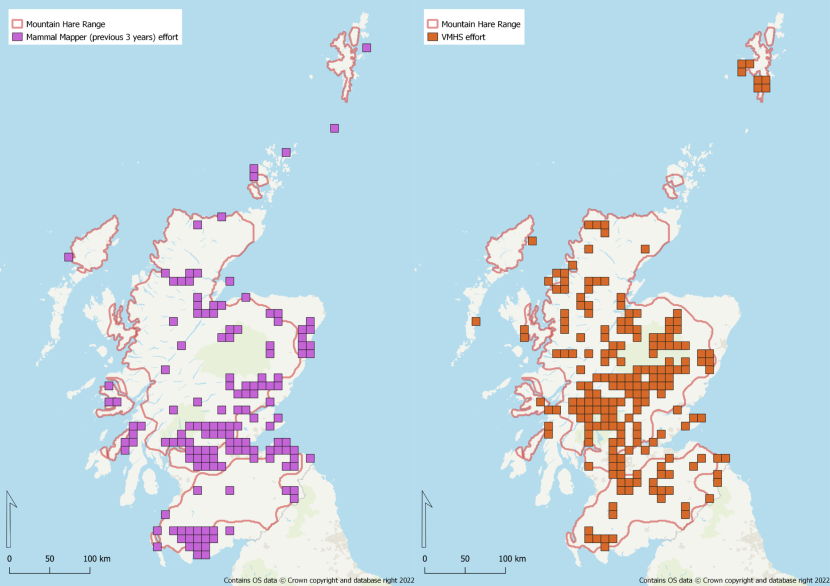
Figure 10. The spatial distribution of effort from Mammal Mapper for the three years before the VMHS (left) and during the VMHS (right), displayed as effort presence within hectads
Click for a full description
The two maps show the spatial distribution of mountain hare records submitted before and during the VMHS. The map to the left shows hectads for which records of mountain hare were returned via the Mammal Mapper app in the three years before 2021. The map to the right shows the hectads that returned mountain hare records via the Mammal Mapper app in 2021.
Sightings data from the VMHS and comparisons with known distributions of mountain hare re-affirm that the assumed geographic range of this species is largely correct (Figure 11). However, mountain hares were also recorded outwith their known distribution, near Loch Ewe in north-west Scotland. This could indicate deficiencies in the known distribution of mountain hare, particularly as the habitat in the area from which the new records are drawn is not markedly different from adjacent, nearby habitat within the species’ known range. This would not be surprising given the under-recording of this species, particularly from remote parts of Scotland, such as the area around Loch Ewe. However, it is also possible that one or more of these records involved a misidentification. A robust process for verifying such records, as well as any others that are deemed improbable or particularly significant exists and could be applied in the future. This could be like the model operated by the National Biodiversity Network, which flags records of any species recorded outside of its known range so they can be scrutinised. Areas where the VMHS recorded few or no mountain hares include Dumfries & Galloway, Ayrshire, the North-East Highlands, and some of the offshore islands e.g., Lewis.
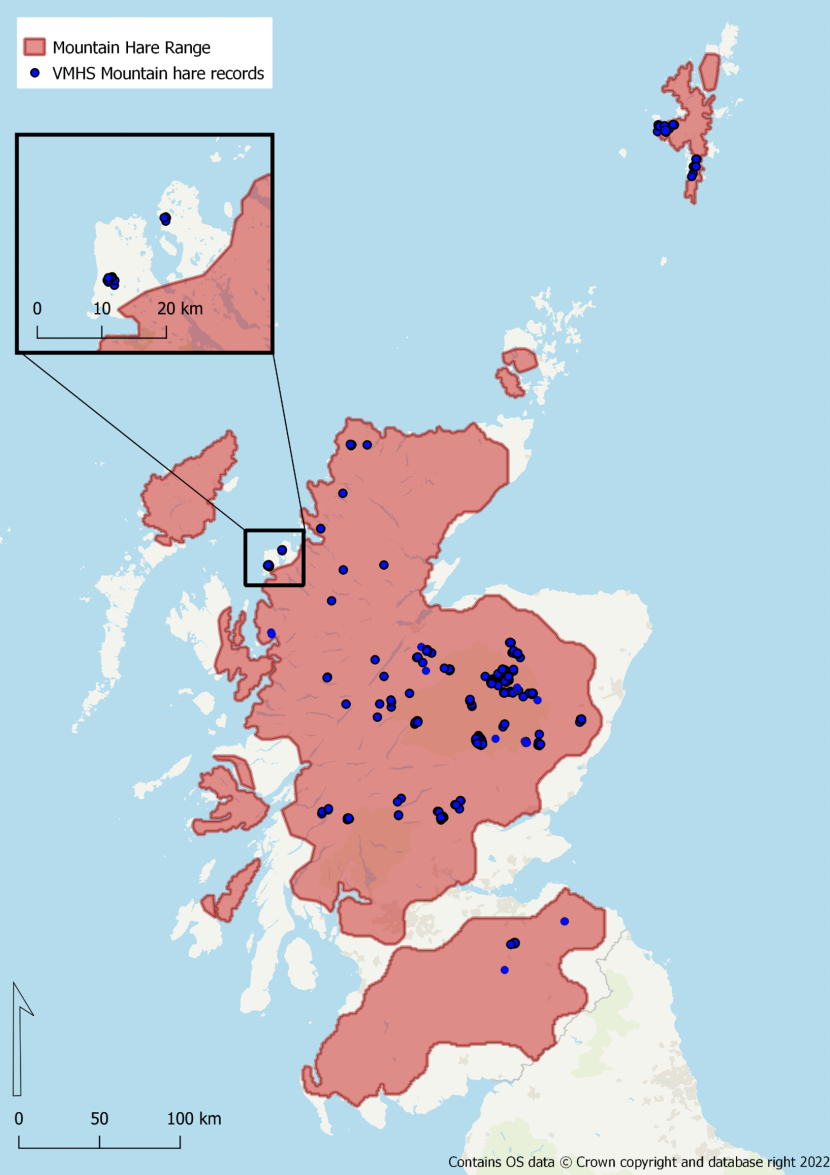
Figure 11. The distribution of hare sightings compared with the known distribution of this species in Scotland. The inset map shows extralimital records near Loch Ewe, Wester Ross
Click for a full description
The distribution of hare sightings compared with the known distribution of this species in Scotland. The red area relates to the mammal population review (Mathews et al., 2018). The inset image indicates there are 17 mountain hare recorded presences beyond that of the known distribution of the species.
Participation
During the project period, 66 people carried out and submitted a total of 1,464.6 km in Hare Only, Hare Ramble and Hare Square surveys using the Mammal Mapper app. The maximum number of surveys submitted by an individual surveyor was 50, and the maximum total length of transects surveyed by a single observer was 208.8 km. The mean (± S.E.) number of transects submitted by each participant was 5.9 ± 1.0. Nine members of the project partner organisations (mostly GWCT staff) carried out a total of 30 transects within lamping validation survey tetrads, totalling 51.1 km. Seven members of the project partner organisations carried out and submitted a total of 50 additional surveys in a voluntary capacity outside of these validation squares, covering 310.8 km between them.
Thirty-eight users took part in and submitted a total of 216 Hare Ramble surveys via the app, while a further nine users carried out 34 Hare Only surveys (Figure 7). Twenty-one Mammal Mapper users submitted a total of 78 non-VMHS surveys for Scotland during the survey period. A total of 75 individuals submitted opportunistic sightings of hares during the survey.
Seventy-one individual volunteers registered for Hare Squares in BTO’s online system. These volunteers used a total of 77 email addresses when registering squares. Twenty-nine of these emails were also registered in Mammal Mapper. About half (54%) of volunteers stated that they could confidently identify all 23 bird species included in the VMHS. Among the remaining volunteers, the proportion of birds they claimed to be able to identify confidently varied from 5% to 95%, with an average among all participants of 84%. The species that the highest proportion (100%) of participants were confident in identifying was red grouse, while the species for which the lowest proportion expressed confidence in identifying (63%) was whinchat.
Hare Square surveys were carried out by 33 participants in an estimated 104 1-km squares (Figure 5). This number is an estimate because it was occasionally unclear, from the transect lines, which square(s) a surveyor had intended to include in their Hare Square survey (this uncertainty was compounded by the fact that the survey types selected by surveyors within the Mammal Mapper app were sometimes incorrect). Most surveyed squares were located within the estimated range of the mountain hare in Scotland, though four of these were just outside it (within 5 km of the edge of the range). Three of these were just across the England-Scotland border. In total, 171 squares were booked in BTO’s online Hare Square registration system, of which 102 (60%) were priority squares. Of all booked squares, 81 (47%) were surveyed, of which 49 (60%) were priority squares. Of the 81 booked squares that were surveyed, completion dates were submitted in the online system for 56. A further 23 non-booked squares were surveyed, only one of which was a priority square. A relatively high proportion (39%) of these squares had just one transect carried out in them, contrasting with the much lower proportion of booked squares represented by just one transect (11%). This suggests that at least some of these un-booked 1km squares may have been misclassified Hare Rambles.
Volunteer feedback
Although many volunteers successfully carried out surveys and submitted their data, several people who signed up for the Hare Squares did not subsequently provide data from the squares they had volunteered to survey. Feedback from these users indicates that reasons for not carrying out the survey include problems associated with use and functionality of the Mammal Mapper app, and time constraints. However, in interpreting this feedback, it is important to bear in mind that the information we have under-represents this group, as many people who did not participate may not have notified us or provided an explanation. Several volunteers who progressed to carrying out the survey experienced issues, some major, with the Mammal Mapper app. The most serious of these included the app crashing during surveys, sometimes resulting in unsaved data being lost. Some practical issues reported by users include difficulty in using the touch screen in cold conditions, impacts on battery usage of the mobile device used for recording, and the time taken to enter individual records, particularly in areas where there were numerous observations to record. Some users reported frustration at the lack of any option to resume a survey following a crash, or an option to edit individual sightings. The title of the survey not showing in the uploaded list was highlighted as an issue, rendering volunteers unable to identify or distinguish between separate survey uploads.
The issue of battery charge is an important one and volunteers were advised to carry a separate charging pack where they thought battery life could be a problem. Some users carried phones primarily for use in an emergency and/or navigation and were reluctant to risk depleting their phone’s battery by running Mammal Mapper in case they needed their phone in an emergency.
Alternative and traditional means of recording data were suggested by some volunteers. There were three instances where volunteers contacted the project team to say that they were willing to carry out surveys but had decided not to use the app. These volunteers agreed to provide GPX tracks gathered in a GPS device or from another mobile phone tracking system, along with their mammal and bird records. These records, from 22 surveys, required manual GIS input and were therefore more labour-intensive to process than those gathered via the app. This option was not publicised due to the limited capacity to accommodate this model of participation, and in order to maximise use of the app by those participating in the survey.
Other suggestions from volunteers include an edit function to allow for the later addition of photos, or to update the numbers of individual hares or birds seen, and an accompanying website where volunteers could review and edit post-survey (like the BirdTrack website interface). It was highlighted that volunteers need to feel confident that the data they are submitting as part of a citizen science initiative are robust and accurate. If participants are aware of problems with the data they have entered, but are unable to edit or review them, they may be less confident in or willing to carry out more surveys.
Snow was reported by some participants as being a particular hindrance for accessing survey sites within project timelines, particularly in the latter part of the year and after the Storm Arwen weather event in late November 2021. However, weather-dependent access to study sites is a common issue. Snow cover can, however, also provide an opportunity for recording tracks and signs that are valuable for determining hare presence in marginal habitats and in the west, where hare densities tend to be low.
Detection distance
Histograms of the distribution of mountain hare sightings between different distance bands (Figure 12) suggest that, across all survey types, the probability of mountain hares being detected declines steeply with distance from the transect line. In Hare Squares, 46% of mountain hares were detected within 25 m of the transect line, while in Hare Rambles the percentage rises to 59%. In the latter survey, mountain hares were detected up to 1 km from the transect line, but across all surveys, 95% of detections were between 0 and 250 m. This pattern of detection is consistent with previous studies (Shewry, Buckland and Shaw, 2002; Newey et al., 2003; Newey et al., 2018) and suggests that the data may be suitable for distance analysis to estimate densities from encounter rates. The fact that encounter rates for mountain hare differ markedly between some of these survey types (see below), raises the possibility that overall detection efficiency may differ systematically between survey types. Detections in Hare Squares, where a relatively small proportion of the time would have been spent on paths, are likely to comprise a higher proportion of flushed hares than those on Hare Rambles. However, some of this variation in encounter rates between survey types (for other species, as well as mountain hares) is likely due to differences in abundance between the areas covered by each survey type.
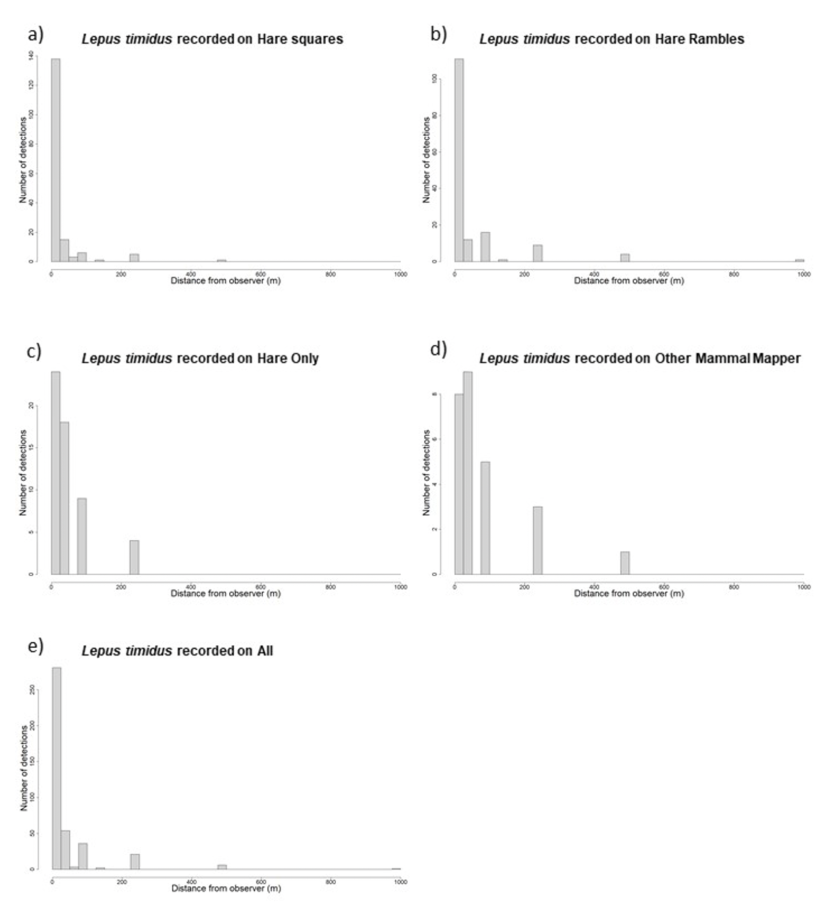
Figure 12. Number of mountain hare sightings within 25 m distance
Click for a full description
Number of mountain hare sightings within 25 m distance bands (from the transect line) recorded in: a) Mountain Hare Square surveys; b) Hare Rambles; c) Hare Only surveys; d) other Mammal Mapper surveys and e) all surveys together
Histograms showing the distribution of sightings for other species are provided in Annex 1 - Distance distributions of other species. These indicate that the distributions of distances at which other species were sighted follow a similar pattern to those described above for mountain hare. In Hare Rambles, a relatively high proportion of red deer (Cervus elaphas) (79%) and roe deer (Capreolus capreolus) (66%) were detected at distances of more than 25 m. For most other species, the proportion of individuals detected at distances of more than 50 m was much smaller. For example, in Hare Squares, the proportion of detections over 25 m for the two most frequently detected bird species, meadow pipit and skylark, was 15% and 14%, respectively. For comparison, between 1994 and 2019, the proportion of detections recorded in BBS at more than 25 m for these species was 64% for meadow pipit and 78% for skylark.
Encounter rates
Encounter rates varied between different species and, to a lesser extent, between different survey types (Table 4a and b). Mountain hare and rabbit (Oryctolagus cuniculus) were the only species recorded on surveys in all four categories (Hare Only surveys, Hare Rambles, Hare Square surveys and other Mammal Mapper surveys conducted in Scotland over the same period). Encounter rates ± S.E. for mountain hares were highest in Hare Square surveys (n/L = 0.27 ± 0.09), followed by Hare Only surveys (0.20 ± 0.09) and Hare Rambles (0.10 ± 0.02), with the lowest encounter rates in other (0.07 ± 0.05) Mammal Mapper surveys. This is not surprising, as the majority of these latter surveys were probably done without any intention to survey mountain hares and may have included areas outside the species’ range, or areas of unsuitable habitat, which would have been excluded from most other survey types. Among other frequently encountered species, encounter rates for feral goat (Capra aegagrus hircus), red deer, cuckoo (Cuculus canorus), meadow pipit, red grouse and skylark were highest in Hare Square surveys; while encounter rates for rabbit, sheep (Ovis aries) and curlew were highest in Hare Rambles.
Table 4a. Encounter rates (number of individuals recorded per km) ± SE for all mammal species recorded in Mammal Mapper for the three Voluntary Mountain Hare Survey types (Only = ‘Hare Only’; Ramble = ‘Hare Ramble’ and Square = ‘Hare Square’) as well for all other transects on which mountain hares were recorded (Other).
| Common name | Scientific name | Only | Other | Ramble | Square |
|---|---|---|---|---|---|
| Badger | Meles meles | - | - | 0.06 ± 0.06 | - |
| Bat sp. | Chiroptera | - | 0.01 ± 0.00 | 0.06 ± 0.06 | - |
| Cat, domestic | Felis catus | - | 0.00 ± 0.00 | 0.01 ± 0.00 | 0.00 ± 0.00 |
| Deer, fallow | Dama dama | - | 0.10 ± 0.05 | 0.01 ± 0.01 | - |
| Deer, red | Cervus elaphus | - | 0.22 ± 0.11 | 0.34 ± 0.10 | 0.37 ± 0.11 |
| Deer, roe | Capreolus capreolus | - | 0.06 ± 0.02 | 0.07 ± 0.02 | 0.07 ± 0.03 |
| Deer, Sika | Cervus nippon | - | - | 0.01 ± 0.01 | 0.01 ± 0.01 |
| Goat | Capra aegagrus hircus | - | 0.01 ± 0.01 | 0.02 ± 0.02 | 0.08 ± 0.08 |
| Hare, brown | Lepus europaeus | - | 0.01 ± 0.01 | 0.02 ± 0.01 | 0.01 ± 0.01 |
| Hare, mountain | Lepus timidus | 0.20 ± 0.09 | 0.07 ± 0.05 | 0.10 ± 0.02 | 0.27 ± 0.09 |
| Hedgehog | Erinaceus europaeus | - | 0.01 ± 0.01 | - | - |
| Otter | Lutra lutra | - | 0.03 ± 0.01 | 0.00 ± 0.00 | - |
| Rabbit | Oryctolagus cuniculus | 0.04 ± 0.03 | 0.07 ± 0.03 | 0.31 ± 0.06 | 0.03 ± 0.01 |
| Seal, grey | Halichoerus grypus | - | 0.02 ± 0.02 | 0.00 ± 0.00 | - |
| Sheep | Ovis aries | - | - | 0.12 ± 0.12 | 0.01 ± 0.01 |
| Squirrel, grey | Sciurus carolinensis | - | 0.02 ± 0.02 | 0.00 ± 0.00 | - |
Table 4b. Encounter rates (number of individuals recorded per km) ± SE for all bird species recorded in Mammal Mapper for the three Voluntary Mountain Hare Survey types (Only = ‘Hare Only’; Ramble = ‘Hare Ramble’ and Square = ‘Hare Square’) as well for all other transects on which mountain hares were recorded (Other).
| Common name | Scientific name | Only | Other | Ramble | Square |
|---|---|---|---|---|---|
| Crow, carrion | Corvus corone | - | 0.00 ± 0.00 | 0.08 ± 0.03 | 0.10 ± 0.04 |
| Crow, hooded | Corvus cornix | - | 0.00 ± 0.00 | 0.10 ± 0.02 | 0.02 ± 0.01 |
| Cuckoo | Cuculus canorus | - | - | - | 0.01 ± 0.01 |
| Curlew | Numenius arquata | - | - | 0.38 ± 0.07 | 0.02 ± 0.01 |
| Grouse, red | Lagopus lagopus | - | 0.03 ± 0.01 | 0.12 ± 0.02 | 0.50 ± 0.19 |
| Jackdaw | Corvus monedula | - | - | 0.07 ± 0.04 | - |
| Ouzel, ring | Turdus torquatus | - | - | 0.01 ± 0.00 | 0.01 ± 0.01 |
| Pipit, meadow | Anthus pratensis | - | 0.00 ± 0.00 | 0.65 ± 0.08 | 2.29 ± 0.38 |
| Plover, golden | Pluvialis apricaria | - | - | 0.04 ± 0.01 | 0.04 ± 0.02 |
| Raven | Corvus corax | - | 0.03 ± 0.03 | 0.09 ± 0.03 | 0.09 ± 0.03 |
| Sandpiper, common | Actitis hypoleucos | - | - | 0.01 ± 0.00 | 0.01 ± 0.01 |
| Skylark | Alauda arvensis | - | - | 0.03 ± 0.01 | 0.49 ± 0.12 |
| Snipe | Gallinago gallinago | - | 0.00 ± 0.00 | 0.02 ± 0.01 | 0.04 ± 0.01 |
| Stonechat | Saxicola rubicola | - | - | 0.04 ± 0.01 | 0.04 ± 0.02 |
| Wagtail, grey | Motacilla cinerea | - | 0.01 ± 0.01 | 0.00 ± 0.00 | 0.02 ± 0.01 |
| Wheatear | Oenanthe oenanthe | - | 0.01 ± 0.01 | 0.10 ± 0.02 | 0.07 ± 0.02 |
Night-time lamping counts in the validation tetrads started c. 1 hour after sunset. Other recent studies (Pettigrew, 2020; Pettigrew et al., 2021) have suggested that the best times at which to count mountain hares are around dawn and dusk, and Newey et al. (2018) also recommend that night-time surveys should be started between 1 and 2 hours after sunset in order to coincide with period when mountain hares are most active. Start times of daylight surveys (all survey types combined) varied from 03:06hrs to 22:10hrs, but most surveys were started between 0800 and 1400hrs (Figure 13). Recorded encounter rates for mountain hare varied markedly between different times of day, being highest for surveys started between 1000hrs and 1600hrs. However, effects of time of day on encounter rate are confounded with those of location (Figure 14), with a relatively high proportion of the surveys in the Cairngorms and mainland Shetland (5) starting between 1000hrs and 1600hrs.
Seasonally, the rate at which surveys were carried out peaked at the start of the project in early April, and declined until the end of October, when there was another, smaller peak in survey activity (Figure 15). These peaks coincided with periods of concentrated engagement and, in the autumn, surveys carried out by project partner staff as well as by volunteers (see Engagement section). Hare encounter rates were highest during these peaks. Similarly, the relationship between encounter rate and time of year is confounded with location (Figure 16). A relatively high proportion of the surveys carried out in the Cairngorms and mainland Shetland (Figure 6) were done during these peaks – particularly the one towards the end of the year.
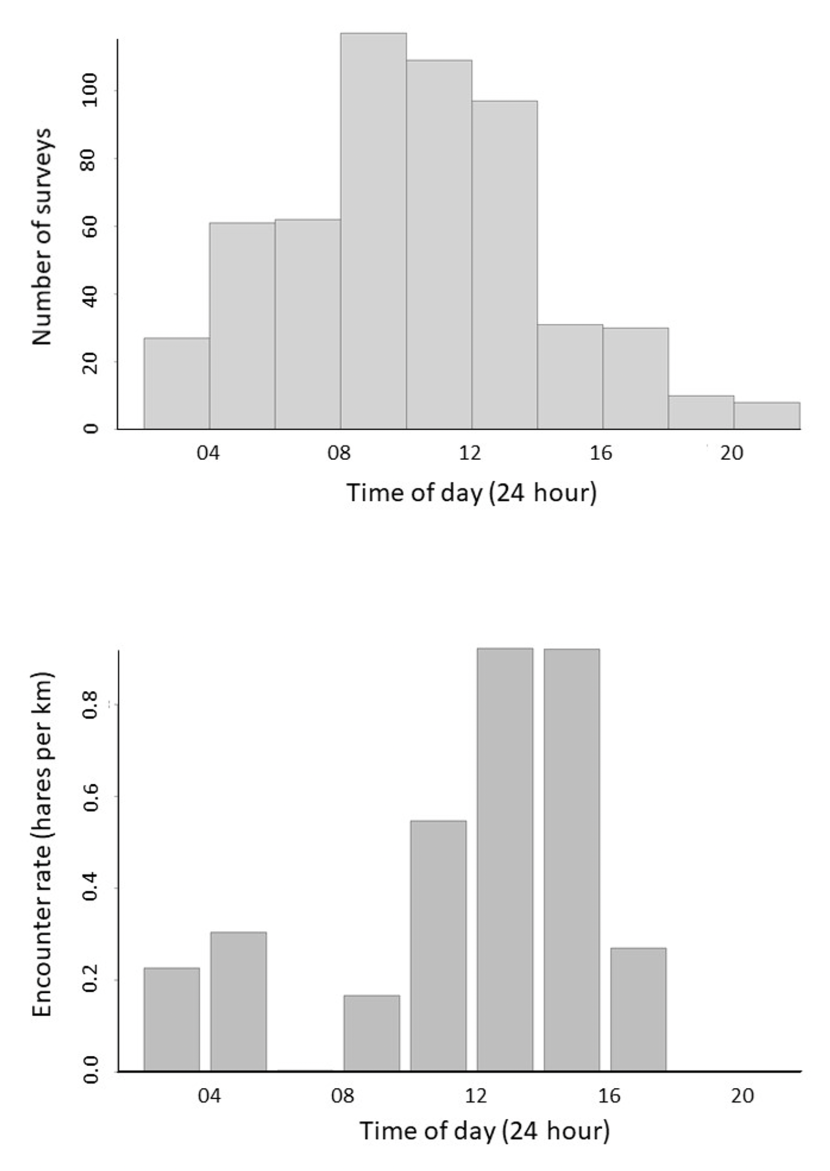
Figure 13. Variation over survey start times
Click for a full description
Variation over survey start times in a) number of surveys carried out; and b) mean hare encounter rate on these surveys. All survey types including lamping surveys.
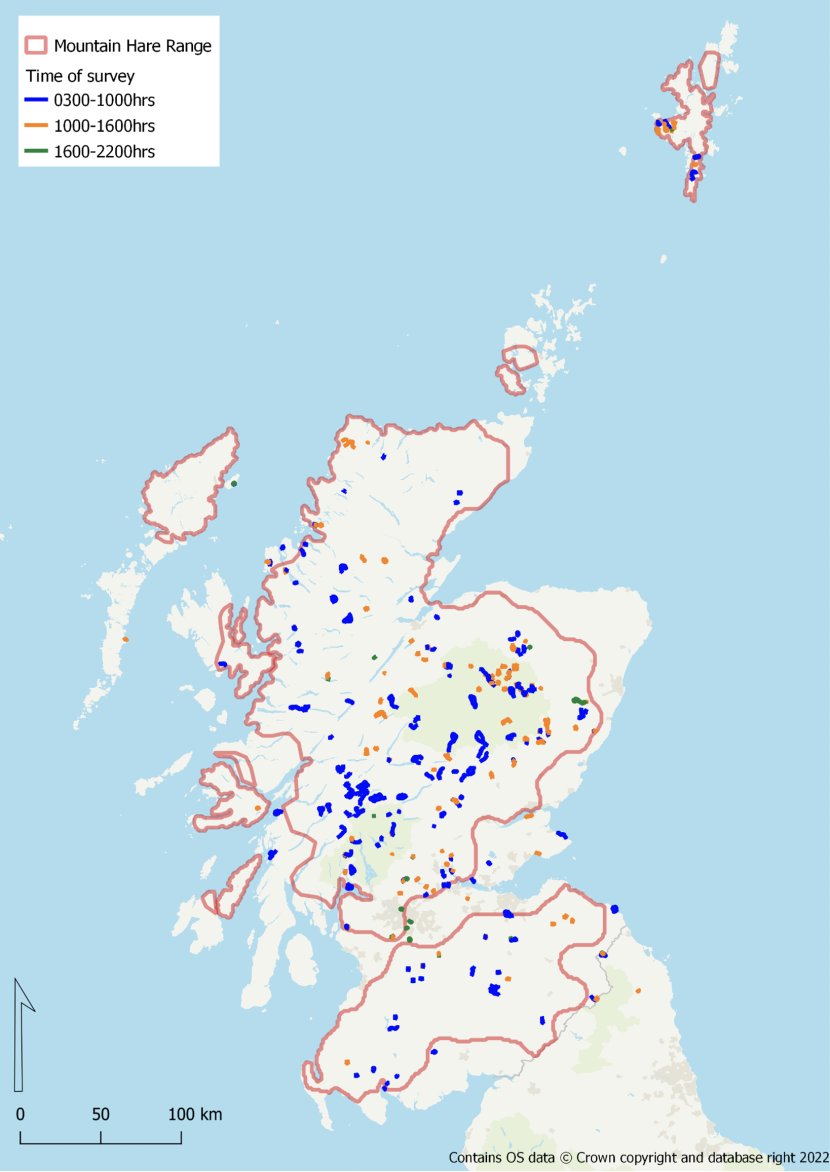
Figure 14. Survey transects routes coloured according to time of day
Click for a full description
Map showing transect routes by time of day, with blue being morning transects, orange being midday and green being afternoon. All survey types including lamping surveys.
blue = 0300 – 1000hrs; orange = 1000hrs – 1600hrs; green = 1600hrs – 2200hrs
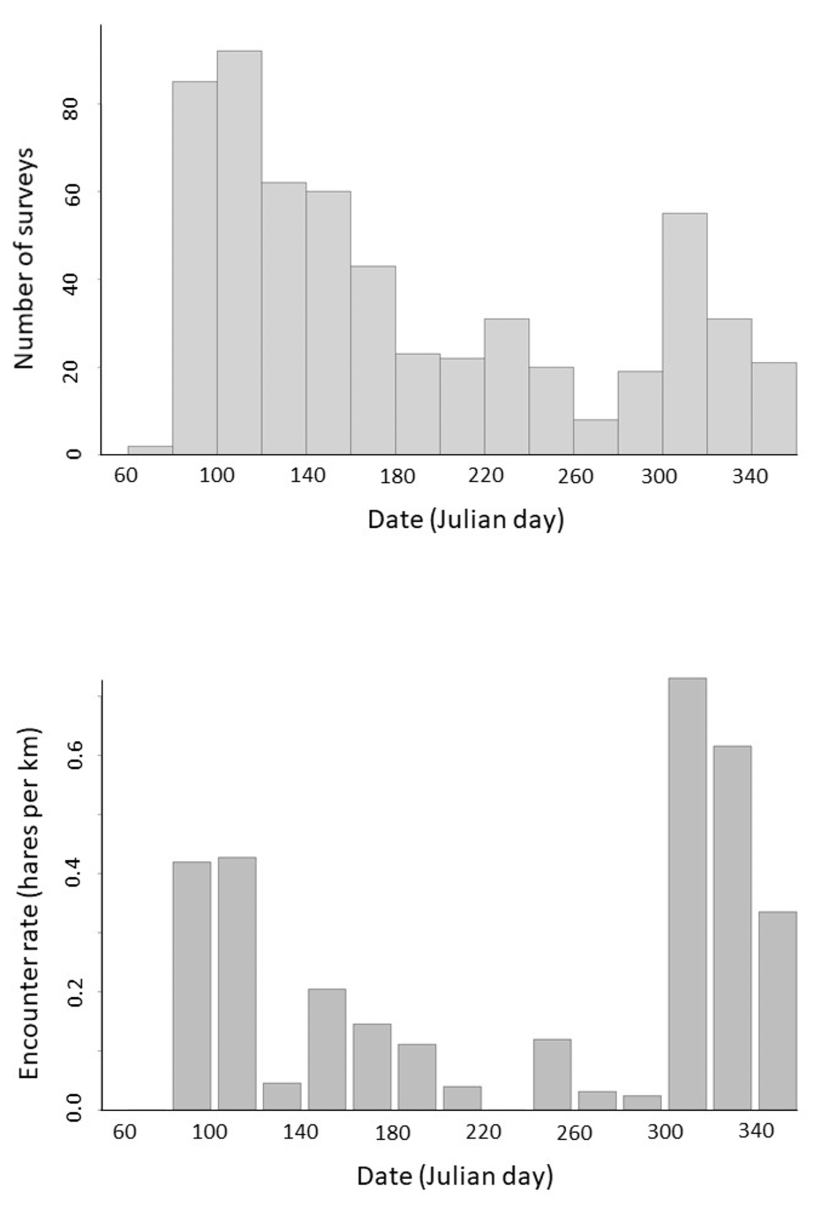
Figure 15. Variation over the reporting period, from mid-March to mid-December 2021
Click for a full description
Variation over the reporting period, from mid-March to mid-December 2021, in a) number of surveys carried out (all survey types) and b) mean hare encounter rate on these surveys. All survey types including lamping surveys.
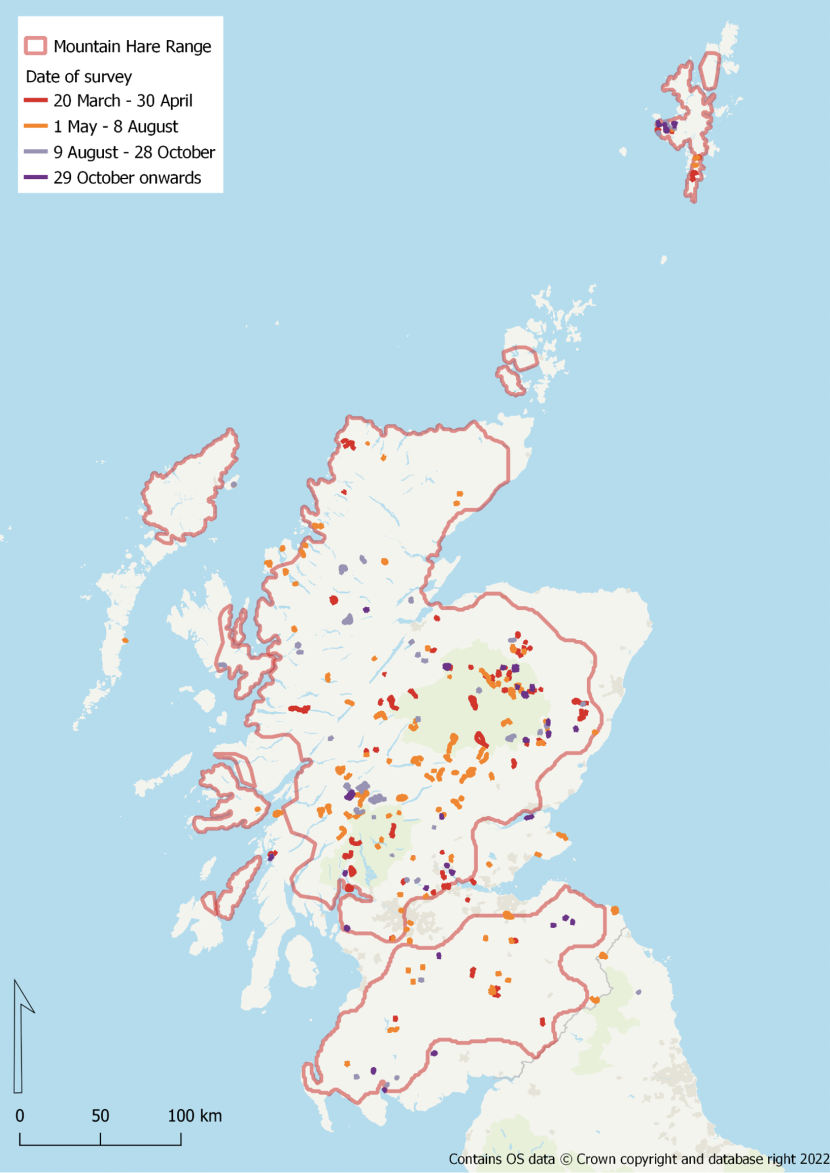
Figure 16. Survey transects routes coloured according to time of year
Click for a full description
Map showing transect routes by time of year, with red being up to April, orange being May to August, mauve being August to November and purple being the rest of the year. All survey types including lamping surveys.
red = Julian days 79 – 120 (up to 30th April); orange = Julian days 121 - 220 (1st May to 8th August); mauve = Julian days 221 – 300 (9th August to 28th October); and purple = Julian days 301 – 348 (29th October onwards)
Night-time validation surveys
Validation lamping surveys were carried out on 15 tetrads. Ten of these validation tetrads also had daylight Hare Square surveys carried out within them. Night-time survey effort amounted to 8 km of transect surveyed in each tetrad. The total length of daylight survey transects carried out in each tetrad varied from 1.2 km to 13.7 km (mean ± S.E. = 6.0 ± 1.22 km), with the number of transect surveys carried out varying from one to eight (mean = 3). The rate at which mountain hares were encountered during night-time surveys varied from 0.25 hares per km to 7.88 hares per km (the mean encounter rate ± S.E. over all tetrads was 2.15 ± 0.76 hares per km). The rate at which mountain hares were encountered during daylight surveys was substantially lower and varied from 0 hares per km (in four tetrads) to 3.25 hares per km (the mean ± S.E. over all tetrads was 0.56 ± 0.32 hares per km). Encounter rates in the two survey types (natural log transformed to reduce the influence of outlying values) were significantly positively related (Figure 17; t = 4.29, d.f. = 9, P = 0.0027).
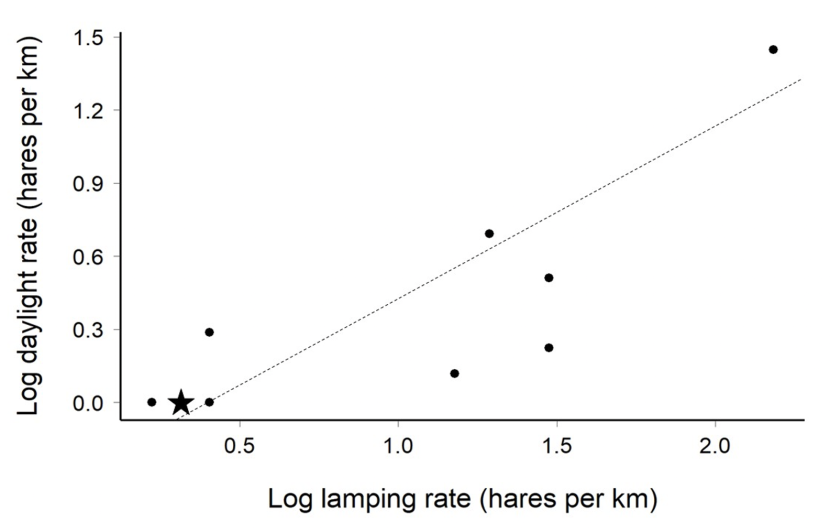
Figure 17. Log encounter rate
Click for a full description
Log encounter rate (number of hares recorded per km of transect) during Hare Square surveys in ten validation tetrads plotted against log encounter rate during night-time surveys in the same squares. The star (at position X=0, Y=0.3) represents two overlapping data points. The relationship between the slope of these two variables (daylight rate = 0.566 night-time rate - 0.196) is represented by the dashed line.
Further data
Since the data cut-off point for this report (16th December 2021) and the time of writing (14th January 2022), a further 12 transects associated with the VMHS have been submitted. These include a further four each of Hare Squares, Hare Rambles and other transect surveys carried out in Scotland and involves a further 46 km of survey effort and 23 associated sightings, six of which were of mountain hares. In addition, a further 18 opportunistic sightings of mountain hare been reported from Scotland.
Discussion
Data collected
During the VMHS surveys carried out during the pilot year of this project 435 mountain hare records (including signs) were generated, just under half of which (215) were records of live hares. To put this into context, the number of (live) mountain hares recorded in Scotland during 2021 on BBS surveys was 63.
Data were collected for 19 species of bird, including for some species for which there is a deficiency in data nationally, such as ptarmigan (Lagopus muta) (Calladine & Wernham, 2009), or they are of high conservation concern (Stanbury et al., 2021). Volunteers were asked about their confidence in identifying bird species by sight and sound when they signed up for the survey in the app, so some volunteers will not have recorded birds at all. It was commented by some volunteers that the large number of meadow pipits seen made recording via the app very time consuming, particularly as each record entry required around 19 ‘screen taps’ to enter. In future iterations of the survey, it may be worth excluding meadow pipit, based on the experiences of volunteers. However, despite the large number recorded on these surveys, it is an ‘Amber’ listed species (Stanbury et al., 2021), for which data (particularly from upland areas) are still valuable (Darvill et al., 2020). More generally, it could be argued that including birds in the survey may have put some people who are not so confident of bird identification off the survey, however this was always presented as an optional extra to volunteers, with the focus being mountain hares.
The BBS shares several features in common with the VMHS, including the fact that surveyors record both birds and mammals, and that, as for the Hare Square surveys, effort is standardised by surveying 1 km grid squares. In terms of bird data collected by the VMHS, the number of records is modest compared to BBS. In recent years (not counting 2020, for which survey effort was affected by Covid restrictions), BBS surveyors cover just over 500 1km squares in Scotland (Harris et. al., 2020), equating to around 2000 km of transects (two 1 km transects per square, each surveyed twice per year). This is around twice the total length of transects surveyed by volunteers carrying out Hare Square surveys and Hare Rambles but includes BBS squares that were undertaken in lowland areas outside the mountain hare’s range. By comparison, the number of birds recorded by BBS surveyors in 2021 was, depending on the species, between 2 and 50 times the equivalent number for VMHS participants. Reasons for this include the fact that BBS surveys are carried out in spring, and between 06:00 and 09:00, when most bird species are at their most detectable. VMHS data were not restricted to a particular time of day or year, and many surveys would have been carried out when birds were less detectable than during typical BBS surveys. In addition, there was some variation among VMHS participants in their bird knowledge and surveying abilities, whereas many BBS participants are experienced bird surveyors who would be able to reliably identify all the 23 species listed in the VMHS.
Survey coverage
The distribution of survey effort in both space and time is likely to exert a strong influence on the quality and utility of data collected. This is particularly the case for mountain hares because their numbers vary cyclically (Newey et al., 2007). This makes it likely that annual surveys will be extremely useful, for monitoring longer term changes and detecting trends promptly and reliably enough to enable decision-makers to respond appropriately. Although coverage was focused on areas with land cover consistent with mountain hare habitat, coverage in the north and west of Scotland was still relatively sparse. Increasing the number and spread of surveys carried out in this region would be useful, and survey information will be easier to interpret if it is collected from randomly selected (and therefore representative) 1 km squares. To this end, increasing the take-up of priority Hare Squares would be desirable. For long term monitoring, it would also help if, as is the case for BBS and various other sampling strategies (e.g. electrofishing sampling of salmonids), a suite of these randomly determined squares is visited each year. If there is no inter-annual continuity in the set of squares surveyed, it makes it more difficult to distinguish the effects of changes in hare numbers over time from the influence of the characteristics of the squares surveyed each year. Casual records of hares can be obtained relatively easily (as evidenced by the volume of such records submitted via Mammal Mapper during this project, despite no active promotion of this recording method) and can be of some value in confirming and improving understanding of hare distribution. However, presence-only records, for which there is no accompanying information on survey effort from areas where no mountain hares are detected, are unlikely to be useful in the context of analysing change over time, unless sample sizes are much greater than are ever likely to be achieved in remote parts of Scotland.
Survey coverage for Hare Squares and Hare Rambles was sparse in some parts of the mountain hare range, particularly away from the core areas of the Cairngorms and Southern Uplands, where there are good transport links with the areas of high human population density. Increasing levels of survey coverage in remote parts of Scotland like Argyll, the Western Isles, Orkney, Shetland and the North-West Highlands is challenging, because these areas not only have relatively small numbers of local residents, but also because they are difficult for people to travel to from the Central Belt and other more densely populated parts of Scotland. Future iterations of the mountain hare survey would benefit from finding more effective ways to actively engage potential volunteers in the local communities in these under-surveyed areas (for example by engaging with local natural history and wildlife trust communities), rather than relying heavily on travelling volunteers. If efforts to encourage voluntary surveying (whether by local or travelling participants) are not sufficiently successful, it may be possible to employ professional surveyors to fill in the gaps in the less accessible parts of the mountain hare range, to supplement the data gathered by volunteers and ensure a representative geographical spread of transects. However, this would obviously require substantial funding. The distribution of ‘priority squares’ was random across the mountain hare range in this project, but a possibility for the future would be to give greater emphasis (either through higher levels of priority or by allocating more priority squares) to areas where volunteer coverage has been, or is predicted to be, relatively low. However, although increased availability of randomly selected squares in remote areas could increase the number of squares surveyed, it might also result in biased uptake (Darvill et al., 2020).
While trying to identify ways in which to increase levels of participation in areas distant from major settlements, we should also consider alternative ways of increasing the quantity and value of information collected, particularly from areas of low hare density. Possibilities include encouraging surveys with dogs (this is likely to increase encounter rates and is already accommodated as an option in Mammal Mapper), targeting particular times of day or year, ‘piggy-backing’ on surveys being carried out primarily for other reasons (e.g. surveys of pre-existing montane routes for which a mix of volunteer and professional survey effort may be mobilised periodically in the future, Darvill et al., 2016) and finding ways of making information from signs (particularly dung) more robust. The last two of these points are discussed in more detail below.
Participation
During the project, the Mammal Mapper app was used by 66 people to carry out and submit surveys; most of these were volunteers recruited through engagement by the project partners. A small proportion (14% by number and 23% by total length of transect surveyed), of surveys, were carried out by members of the project partner organisations. Considering the difficulties in engagement described earlier, now that the necessary Mammal Mapper functionality is in place, we would expect that this level of recruitment, and the resultant data, could be improved upon in the future – particularly if some of the difficulties identified by the volunteers can be addressed or overcome.
The fact that many more volunteers signed up for Hare Squares than actually submitted survey returns for these squares in Mammal Mapper, is not unusual for this kind of survey. In part, this may be down to confusion caused by there being two separate sign-up systems. Nevertheless, many participants managed to navigate these systems successfully, and the high proportion of squares surveyed that were classed as ‘priority’ squares (one third of all squares surveyed, and more than half of all squares booked in the online booking system), suggests that the square booking system and the interactive map in which priority squares were displayed succeeded in making the distribution of surveys more representative than it would otherwise have been.
One potential improvement that could be made to the online booking system would be to require users to set up accounts on registering for the survey. This would make it easier to match up users between systems and to communicate with users during the survey, though it could also act as a disincentive to participation by some people.
Feedback from participants
Many participants successfully submitted data via the Mammal Mapper app. Indeed, in the short period since data were finalised for this report in mid-December, transects have continued to be carried out and submitted, demonstrating that the system set up for this project continues to function. However, many participants reported problems or difficulties with using the app, of varying severity, particularly at the outset of the project. Among the biggest obstacles to using the app reported by users was the app crashing during surveys, and some very highly motivated survey participants reported reluctance to carry out more surveys after experiencing this.
The fact that distances could not be recorded for species detected acoustically was also noted by some observers. For some species, the resulting detection functions (based entirely on records of birds detected by sight) are markedly different from those derived from data collected in other surveys with which VMHS bird data will probably be used, such as BBS. Such differences are likely to limit the value of bird data collected via this app.
More fundamentally, among those people who might be persuaded to carry out surveys in remote parts of Scotland, not everyone has a suitable device for reliably operating the Mammal Mapper survey, as the app may not function reliably on some older mobile phones. Among those who do, a considerable proportion do not want to use mobile phones when out in the hills, preferring to keep their usage of such devices to a minimum, or to conserve the battery to ensure they retain enough charge for navigation and in case of emergencies. Of course, these issues are not unique to remote upland areas. However, their ramifications for coverage in such areas may be far greater than in densely populated areas where high levels of coverage can be achieved by accommodating only volunteers that are highly motivated, have suitable devices and are happy to use them.
Promotion and engagement work should benefit in future years from the fact that the app is now ready for use, and the majority of reported issues concerning functionality have been fixed. Future work to improve the app should make changes to test versions and beta versions which are only released to the wider public after sufficient testing to confirm the app’s stability. This is similar to the process followed throughout the project’s first year, but with the important difference that users should always have access to a relatively stable and fully functioning build while new versions are in development. This means that there should be no reason to avoid publicising the survey or encouraging volunteers to participate in it due to the app being fixed, developed or tested.
Recording
Encounter rates during this project were highest between noon and 1600hrs. This appears to run counter to the findings of other studies that suggest that the periods of greatest mountain hare activity (and, therefore detectability) are around dawn and dusk (Pettigrew, 2020), though with substantial seasonal variation in the degree to which hares are active during the rest of the day and night (Pettigrew et al., 2021). However, effects of temporal variation are confounded with effects of location, as surveys in recognised ‘hotspots’ of mountain hare populations were concentrated within particular times of day (Figure 12) and season (Figure 14).
The concentration of field signs-only information from some areas where no mountain hares were sighted highlights the importance of ensuring that mountain hare signs are identified reliably. Droppings, in particular, may be confused with those of other species such as brown hare or deer. For signs to be confidently incorporated into analyses of distribution, it is likely that better guidance and/or training on the separation of mountain hare droppings from those of potential confusion species would have to be provided to participants. This could be supplemented by a system that allows records of hare droppings to be supported by photographs or samples. The Mammal Mapper app currently enables photographs to be attached to individual records. The records of mammals and their signs collected through Mammal Mapper are automatically passed to Mammal Society appointed verifiers on iRecord, where user input species identifications are assessed to be classified as "Correct”, “Considered correct", "Plausible", "Unable to verify" or "Incorrect". The verifiers can also suggest a species reclassification if deemed appropriate. Photographs taken using the app help verifiers to discern if the species identification is correct, though it is noted that photos taken on a phone camera may not be of high enough quality to allow identification of animals at a distance, but are adequate for field signs, especially when using an object for scale. This information, and the verifier’s assessment, can then be reincorporated into the data collected as part of this project. However, this process is dependent on volunteers and, at the time of writing, it is likely that many records await verification. Also, separation of mountain and brown hare droppings, in areas where both species could be present, may not be possible in the field (nor, clearly, from photographs). However, sign surveys are likely to prove valuable in assessing mountain hare distribution in areas where they occur at low density and in habitats where direct sightings are difficult (e.g., woodland).
Complementarity of survey approaches
As mentioned at the outset of this report, the intention of the VMHS was to trial survey approaches that could complement those of existing methodologies, particularly night-time counts, which are now carried out annually on some estates. The development of complementary surveys could improve monitoring across the mountain hare’s range and comparison work between approaches offers insight into their effective deployment. Although based on a small sample the positive relationship between the encounter rates recorded on night-time lamping surveys and day-time Hare Square surveys indicates that the methods trialled in this project have the potential to supplement and support results from existing models of mountain hare survey; particularly in areas where these more intensive methods are impractical.
Since the publication of NatureScot (SNH) Research Report 1022 in 2018, GWCT (Scotland) has carried out night-time survey training programmes to encourage mountain hare counts on managed moorland. Between 30 and 40 night-time counts per winter have been returned each year to GWCT between winter 2018/19 and winter 2020/21. The counts provide insight into local abundance, and, prior to the full protection of mountain hares in March 2021, the basis for the development of mountain hare management plans. The GWCT has continued to promote the importance of counting in these areas for interpretation of conservation status, demonstration of best practice, future research and as evidence in support of future licence applications. Implementation of mobile app survey forms developed by GWCT, enables upland managers to record species and management for a best practice evidence base. These app forms include the facility to collate night-time counts of mountain hares.
Recommendations
Data collected
Overall, the findings of this report suggest that the methods trialled by the VMHS could be used to generate information that will improve our ability to monitor mountain hare populations in Scotland. In the survey’s first year, participants recorded more mountain hares, with a wider geographical spread, than those recorded by BBS surveyors in the same year. However, the extent to which these methods will be able to complement established survey techniques such as night-time lamping, particularly to improve our understanding of populations in remote areas, will depend on several factors which are currently uncertain. These include the degree to which these methods provide reliable and comparable data across the range of habitats that mountain hares occupy in Scotland (the comparisons in the validation tetrads described above derive exclusively from open moorland). Some possibilities for addressing these questions are considered below.
Survey coverage
In considering how we can improve survey coverage, one obvious focus is the role of priority squares in guiding volunteers towards areas with less coverage. Display of high priority squares, particularly at low resolution of the sign-up map, is currently just a binary function – showing whether squares are high priority or not. Squares in regions, habitats or landscapes that have been identified as under-sampled could be presented as being a higher priority for surveys than other randomly selected priority squares.
The two formats of survey tested during this project were Hare Squares, with highly standardised survey effort, and Hare Rambles, which involve survey transects that follow a route of the participant’s choosing. A third possibility, which was not explored in this project but was mentioned in the earlier report by Newey et al. (2020), would be to use the transect survey method that is the basis of both Hare Squares and Hare Rambles to carry out repeat surveys of pre-defined routes. There are several such routes in remote montane areas, which already have previous datasets associated with them, sometimes going back two decades or more. These previous surveys provide a baseline with which to compare the findings of contemporary surveys. Ideally, the surveys in these areas should be carried out by sufficiently skilled observers to include the full range of birds and mammals (including field signs) recorded in previous years.
Another format of survey that may be worth considering, in terms of what it might be able to add to our understanding of mountain hare distribution and even population trends, is the collection of ‘casual’, presence-only records. This method of species recording is already accommodated in Mammal Mapper. However, it was not pushed as part of the VMHS, due to the primary objective being to collect effort-based data. Presence-only species data are known to be affected by various biases caused by a lack of structured sampling protocols (Isaac & Pocock, 2015). Because of this, no information, or results relating to presence-only records were presented as part of this report. However, during the project period it is worth noting there were 2,385 presence-only records submitted via Mammal Mapper in Scotland. This has included an additional 209 sighting records (382 animals) of mountain hares, along with records from 35 other mammal species (identified to species level) and records from 13 of the 23 bird species.
Recent advances in statistical analyses allow for robust trends in species distributions to be estimated from presence-only records (e.g., Coomber et al., 2021), by incorporating the biases associated with presence-only data (Isaac et al., 2014). Relating specifically to this project, casual records could be used to complement the more structured survey data from transects. The work of Johnston et al. (2020) on BTO’s BirdTrack dataset demonstrates the potential for casual records to improve understanding of population change, particularly when combined with data from effort-based recording.
Mountain hares are known to occur in woodland and scrub, as well as in the open habitats they are more traditionally associated with (Crawley et al., 2020). The current model of survey is unlikely to be an effective means of detecting and recording live hares in woodland, scrub and other habitats with ‘cluttered’ or very tall vegetation. However, surveys making efficient use of field signs (see below) could be an effective means of detecting hare presence in such situations. Information on signs (particularly dung, and possibly incorporating an eDNA approach) could contribute to assessments of distribution or habitat-specific occupancy. If signs are sampled and recorded systematically, such data could even contribute to assessments of relative abundance (Newey et al., 2018; Newey et al., 2003).
Participation
Action to improve participation offers one route to improving the quantity and quality of survey coverage in remote areas. As mentioned above, it may be possible to steer volunteers more effectively towards such areas through the use of priority square assignment and display in the Hare Square booking map. Much of the VMHS coverage in remote areas relied on a few volunteers travelling long distances. We should seek to improve engagement with, uptake by and subsequent retention of, existing and potential volunteer recorders living in and near remote areas with low coverage through sustained engagement and training activities over the lifetime of any subsequent recording project.
Another step that would benefit participation would be to make the existing BTO Hare Square sign up system account based. New participants would be required to set up accounts, but participants in other BTO surveys would do this through their existing accounts. This would enable information about participation in other surveys to be accessed, which could make it possible to deliver more targeted promotion and communication, encouraging volunteers to consider taking on priority Hare Squares in areas where they are known to have been actively involved in other surveys. It would also allow more effective communication with volunteers, particularly with regard to encouraging them to carry out their surveys and resolving any issues that might be preventing them from taking on priority squares. This would capture more and better feedback from them to allow a clearer assessment of problems and potential improvements.
Mammal Mapper
The app was used successfully by many participants to record and submit data on mountain hares and several other bird and mammal species, both in standardised surveys of 1 km squares, and during less structured ‘rambling’ surveys. However, discussions among members of the project team before and during the survey, and feedback from survey participants, has identified where further development and refinement of app functionality could make the app easier and more enjoyable to use, which in turn could improve recruitment, retention and participation rates. These areas include:
App stability
The most important improvement to make to the app would be to make sure it is sufficiently stable that it can be relied upon not to crash in the field. Several dedicated users reported this happening, with accompanying loss of data. It is possible that such issues are wholly or partly due to incompatibility of the app with some older models of mobile phone and/or older versions of mobile device operating systems (though for others this issue was intermittent). We suggest it would be helpful to clearly indicate minimum system requirements on download/installation, or even, ideally, to automatically warn participants when their devices may not be reliably compatible with the app. Feedback received from some volunteers indicates clearly that experiencing app crashes and loss of data in the field, particularly when an effort has been made to carry out a survey in a remote area, can deter participants from taking part again.
Streamlining record entry
Entry of a new record during a survey currently requires an estimated minimum of 18-20 separate screen presses. This can be a significant barrier to recording in areas where encounter rates with animals are very high (sign recording already requires a reduced number of screen taps). In the Scottish uplands, this can be the case with bird species such as meadow pipit or skylark and even, in some areas, with the focal species of this project, mountain hare, particularly in the context of presence or absence of pellets. By reorganising the order and content of recording screens, the same information could be collected with a reduced number of screen presses (10 or fewer), which would greatly help. Another approach that could help would be to improve processes and guidance for reduced effort recording in areas where the relevant species or signs being recorded are at very high density. For example, Hare Ramble participants were allowed to reduce the frequency with which they recorded meadow pipits if this became too time-consuming, but no equivalent provision was made for Hare Square surveyors. Allowing surveyors to optionally drop recording of distance and angle in situations where recording these was problematic (on the basis that densities could be derived from global detection functions) could be helpful to many app users encountering animals or signs at high rates.
Distance recording for birds detected by song and call
Allowing distance recording for birds detected by song or call is critical for enabling useful distance analysis of bird observations, and also for making bird data from VMHS suitable for comparison and combination with BBS data for the relevant species. It should be quite simple to achieve. Records of birds detected by song and call only should be treated similarly to birds detected by sight, with surveyors prompted to estimate the angle and distance to these detections, enabling distance from the transect to be estimated. Comparability between VMHS bird records and BBS would be further enhanced by the addition of a ‘Flying over’ category, which would function very much as the ‘Birds heard’ category does currently. A considerable proportion of the participants in the mountain hare survey were from bird-oriented audiences who want to, and are experienced at, bird recording, and this is likely to continue in further iterations of the survey.
Ability to review and edit completed surveys
It is currently not possible to reopen surveys for editing when surveyors realise that they have made a mistake. In addition, the lack of information displayed on completed surveys can make it difficult for users to discriminate between them – particularly for people carrying out lots of surveys. While this might not be a particularly important issue in terms of the volume of data affected (mistakes by volunteers that they realise subsequently, are probably relatively uncommon), being faced with the choice of submitting inaccurate data or deleting a survey can be very demotivating for volunteers. The functionality to enable this improvement is already available to system administrators but would require further development for it to be made available to users.
Restricted species mode
The option of a reduced species mode could be extended beyond the existing Hare Only survey type. This could either be by restricting the suite of species made available for recording in the app, or by reordering the list of available species so that those being focused on are encountered first. Even for surveyors that are recording all species they encounter, recording time could be reduced if the app automatically defaults to a list of ‘favourites’. Currently, although favourites can be defined, the app does not display these by default, and they must be selected each time a record is entered. Other restricted modes for recording that could help with streamlining include options to turn off recording of signs and/or dead animals, or to opt out of inputting distance data. The similarity in the detection curves generated by different survey types for most species suggests that if a subset of surveyors collected only encounter rates, global detection functions could be applied to these to generate robust density estimates.
Visualisation of survey squares and/or routes
Where participants intend to survey a particular area or route, it would be helpful to them to be able to visualise this on the survey map. This would enable them to easily navigate to the start of their survey route and then make sure they kept to their intended routes or area, without having to divide their attention between multiple apps (also placing a greater drain on their device’s battery) or between their mobile device and a paper map.
Placement of observations
One way in which data entry could be made quicker, easier and (in many situations) more accurate, would be by allowing users to place animal observations directly in the correct location, rather than having to enter deconstructed locations (i.e., angle and distance from users). This option would particularly make sense if data were entered onto a useful, pre-uploaded background map or aerial photo (see below).
Background mapping
Having access to good quality maps (showing helpful information for navigation in the uplands) or, especially, aerial photos, would make it easier for volunteers to determine the location of animals in the field, making it theoretically possible to place these observations directly if the app allowed, or allowing better estimation of observation distance, otherwise. Such background maps could also make Mammal Mapper a much more attractive app to use during walks – particularly for participants whose surveys were carried out during recreational walks. This could make a substantial difference with engagement of and participation by hikers and other recreational users of the uplands. The poor availability of internet signal in much of the Scottish uplands would make it desirable to allow such maps to be to be uploaded for an area in advance of a survey being carried there, so that they could be accessed when the user was ‘offline’.
Further development of the Mammal Mapper app to carry out some of these improvements would probably be very well received by the volunteer community and could be emphasised during promotion and engagement. Depending on which improvements are made, it is possible that some volunteers who tried the app and decided not to use it might be persuaded to try it again. It is highly unlikely, however, that all the above improvements can be made to Mammal Mapper in the immediate future. App development work is expensive, and the multi-functional nature of Mammal Mapper and the platform it is based on is likely to heavily constrain the nature of modifications that it is feasible to resource. Before any decisions are made on further changes to the app, careful consideration should be given to the anticipated effects on data quality and quantity, and volunteer experience and motivation; as well as the feasibility and cost of their implementation.
Alternative approaches
There may be some situations in which volunteers cannot, or do not want to use a mobile app such as Mammal Mapper to collect survey information that they might be willing to collect via alternative means. One possibility is to allow volunteers to use hand-held or wearable GPS devices to collect route information (via GPX files), and to record their survey findings using pencil and downloadable paper field recording forms. For volunteers who did not already have a GPS device, this option would entail an initial outlay (the cheapest Etrex device is around £70) but it represents a reliable data collection method that is familiar to most existing wildlife surveyors and hillwalkers and could be used as an alternative or potential addition to mobile device collection of route information. Entering data and uploading GPX route files would entail costs to survey organisers, either to enter and collate data sent into the project on paper, or else to set up a system suitable for capturing data entered digitally by participants.
For Hare Squares, a compelling argument could be made for relaxing the requirement to capture transect routes (though they are certainly desirable to have when this works), because both survey effort and survey location are very well defined and can easily be communicated by volunteers if they report to the survey coordinator which 1 km square they were surveying. Interpretation of this information would actually be easier than for some Hare Square Mammal Mapper returns because volunteers sometimes forgot to stop and start the survey in order to capture observations noted between transects (or en route from car to square or vice versa) as Rambles. Provided that the survey coordinator (as many surveys do), has a means for volunteers to report their mammal and bird records along with their survey effort after they returned home, along with the distance of observations from the transect and information on survey effort (which, as described above, is already known for Hare Square surveys), the data provided by these volunteers would be of comparable value and utility to that collected by Mammal Mapper users.
Survey timing
Deciding whether to restrict mountain hare surveys to particular times of year and/or time, is not simply a question of identifying the times at which hare counts will be most informative. As well as an understanding of effects of both time of day and season on counting efficiency, we also need to balance the benefits of limiting sampling to the best or most comparable times with the need to accommodate as many opportunities for participation as possible.
Initial findings indicate that, at least in some circumstances, mountain hares may be encountered at sufficiently high rates during full daylight to discern differences in density. This is reassuring, as it is unrealistic to expect that many participants in volunteer surveys of the types trialled in this project would be willing to concentrate their surveying efforts around dawn and dusk. However, as the effects of temporal variation on encounter rate we observed were confounded with effects of location and survey type, caution is needed before decisions are made about what guidance might be most appropriate to give to participants about the timing of their surveys. The potential effects of season as well as time of day on mountain hare activity suggest that variation in timing could introduce noise or even systematic biases into a survey dataset if not properly accounted for. If any future scheme for mountain hare monitoring promotes year-round surveys it will be necessary to get a better understanding of the effect of timing (day and year) on both detectability and the number of hares available to count (due to seasonal patterns in behaviour, survival and reproduction).
The influence of weather can also exert a strong influence on local movements of this species (Hewson, 1962). Bearing in mind that restricting the periods and conditions in which surveys are permitted is likely to reduce levels of participation, surveys at any time of day or year could be accommodated, though this might require subsequent correction for influences of time or conditions, which would be challenging. An alternative (and more feasible) approach would be to promote well-defined seasonal windows and times of day (or night) for more standardised survey approaches such as Hare Square surveys (as is already done for night-time lamping). This accepts that less structured surveys would be carried over a broader range of times. Another issue to consider when making decisions about permitted or promoted seasonal survey timings is the degree to which this survey has the potential to ‘compete’ for available volunteer effort with other wildlife surveys. Targeting mountain hare surveys during the spring and summer, when many volunteers are engaged in surveys for existing monitoring schemes such as the BBS, could impact negatively on uptake and retention of both the VMHS and these other surveys.
Recording signs
The prevalence of dung-based mountain hare records from this survey, particularly in parts of their range where hare densities are low, suggests that making the most of such records is likely to be important in determining the effectiveness and success of any Scotland-wide voluntary hare monitoring initiative, though recognising that recording dung may not appeal to all volunteers. To this end, it would be useful to provide guidance and training to established volunteers to increase the number of people who can reliably identify and report mountain hare dung. There is some existing expertise within the volunteer community, which could be used either, to help deliver training or produce guidance, or to take part in surveys to trial approaches to dung monitoring that could be suitable for rolling out to the wider volunteer community. Meanwhile, any volunteers recording mountain hare dung during surveys should be encouraged to take photographs, wherever possible including an object of known size such as a coin for reference.
If sampled with sufficient rigour, hare dung records could be used to generate estimates of relative abundance, though it is unlikely that this rigour is achievable in a voluntary system. One possibility would be to record the distance of pellets from the transect, to enable distance analysis to be carried out (Marques et al., 2001). However, it is likely that the wide range of hare densities encountered by observers would make it challenging to collect detailed and comparable information on dung (especially if also recording distance of dung from transect) from all areas. In areas of high density, recording all observations of dung together with distance from the transect is likely to be time consuming – particularly as, in these areas, observers are likely to be seeing and recording lots of hares. The high effort (and low speed) that accurate recording would require in such circumstances could be demotivating, and lead to under-recording of dung or reduction of overall survey effort. Conversely, in areas of low hare density, where live encounter rates are low, it may be much easier to accurately record all sightings of dung. To ensure that information on dung is comparable between all areas, while minimising the effects of observer fatigue, volunteers could carry out short, dedicated assessments of dung presence or quantity at regular intervals on their surveys, rather than looking for and recording dung continuously. It should be noted that, when using information on dung to infer densities, variation in decomposition rates can confound comparisons of dung density or occurrence between different areas or times of year, but such difficulties can (with effort) be circumvented (Laing et al., 2003; Marques et al., 2001; Newey et al., 2018).
References
Buckland, S.T., Anderson, D.R., Burnham, K.P. and Laake, J.L. 1993. Distance Sampling: Estimating Abundance of Biological Populations. Chapman and Hall, London.
Calladine, J. and Wernham, C. 2009. Extensive monitoring of rock ptarmigan Lagopus muta in Scotland: a pilot to test the efficacy of using volunteer surveyors for monitoring arctic-alpine birdsAvocetta, 33: 217-224.
Carey, P.D., Wallis, S., Chamberlain, P.M., Cooper, A., Emmett, B.A., Maskell, L.C., McCann, T., Murphy, J., Norton, L.R., Reynolds, B. Scott, W.A., Simpson, I.C., Smart, S.M. and Ullyett, J.M. 2008. Countryside survey: UK results from 2007. Centre for Ecology & Hydrology.
Coomber, F.G., Smith, B.R., August, T.A., Harrower, C.A., Powney, G.D. & Mathews, F. 2021. Using biological records to infer long-term occupancy trends of mammals in the UK. Biological Conservation, 264: 109362.
Crawley, D., Coomber, F. G., Kubasiewicz, L. M., Harrower, C., Evans, P. G. H., Waggitt, J., Smith, B. and Mathews, F. 2020. Atlas of the mammals of Great Britain and Northern Ireland. Exeter, Pelagic Publishing.
Darvill, B., Harris, S.J., Martay, B., Wilson, M. and Gillings, S. 2020. Delivering robust population trends for Scotland's widespread breeding birds. Scottish Birds, 40: 297-304.
Darvill, B., Oldershaw, L.E. and Wernham, C.V. 2016. What's Up? Monitoring change in Scotland's upland birds. Final project report. BTO Scotland, Stirling.
Einoder, L.D., Southwell, D.M., Lahoz-Monfort, J.J., Gillespie, G.R., Fisher, A. and Wintle, B. A., 2018. Occupancy and detectability modelling of vertebrates in northern Australia using multiple sampling methods. PLoS One 13: e0203304.
Harris, S.J., Massimino, D., Balmer, D.E., Eaton, M.A., Noble, D.G., Pearce-Higgins, J.W., Woodcock, P. and Gillings, S. 2020. The Breeding Bird Survey 2019. Research Report no. 726. British Trust for Ornithology, Thetford.
Hesford, N., Baines, D., Smith, A.A. and Ewald, J.A. 2020. Distribution of mountain hares Lepus timidus in Scotland in 2016/2017 and changes relative to earlier surveys in 1995/1996 and 2006/2007Wildlife Biology, 2020(2).
Hesford, N., Fletcher, K., Howarth, D., Smith, A., Aebischer, N. and Baines, D. 2019. Spatial and temporal variation in mountain hare (Lepus timidus) abundance in relation to red grouse (Lagopus scotica) management in ScotlandEuropean Journal of Wildlife Research, 65: 33.
Hewson, R. 1962. Food and feeding habits of the mountain hare. Proceedings of the Zoological Society of London, 139: 515-526.
Hiby, L. and Krishna, M. B. 2001. Line transect sampling from a curving path. Biometrics 57: 727-731.
Isaac, N.J.B. and Pocock, M.J.O. 2015. Bias and information in biological records. Biological Journal of the Linnean Society 115: 522-531.
Isaac, N.J.B., Van Strien, A.J., August, T.A., De Zeeuw, M.P., Roy, D.B. and Anderson, B. 2014. Statistics for citizen science: extracting signals of change from noisy ecological data. Methods in Ecology and Evolution 5: 1052-1060.
JNCC and DEFRA, 2012. UK Post-2010 Biodiversity Framework. Report by JNCC and Defra (on behalf of the Four Countries’ Biodiversity Group), July 2012.
Johnston, A., Moran, N., Musgrove, A., Fink, D. and Stephen R. Baillie, S.R. 2020. Estimating species distributions from spatially biased citizen science data. Ecological Modelling, 422: 108927.
Laing, S.E., Buckland, S.T., Burn, R.W., Lambie, D. and Amphlett, A., 2003. Dung and nest surveys: estimating decay rates. J. Appl. Ecol., 40, 1102–1111.
Marques, F.F.C., Buckland, S.T., Goffin, D., Dixon, C.E., Borchers, D.L., Mayle, B.A. and Peace, A.J., 2001. Estimating deer abundance from line transect surveys of dung: sika deer in southern Scotland. J. Appl. Ecol., 38, 349–363.
Mathews, F. and Harrower, C. 2020. IUCN compliant Red List for Britain’s Terrestrial Mammals: Assessment by the Mammal Society under contract to Natural England, Natural Resources Wales and NatureScot. Natural England, Peterborough.
Mathews, F., Kubasiewicz, L.M., Gurnell, J., Harrower, C.A., McDonald, R.A. and Shore, R.F. 2018. A review of the population and conservation status of British mammals. A report by the Mammal Society under contract to Natural England, Natural Resources Wales and Scottish Natural Heritage. Natural England, Peterborough.
Morton, R.D., Marston, C.G., O’Neil, A.W. and Rowland, C.S. 2020. Land Cover Map 2019 (25 m rasterised land parcels, GB). NERC Environmental Information Data Centre.
Newey, S., Bell, M., Enthoven, S. and Thirgood, S., 2003. Can distance sampling and dung plots be used to assess the density of mountain hares Lepus timidus?Wildlife Biology 9, 185–192.
Newey, S., Fletcher, K., Potts, J. and Iason, G. 2018. Developing a counting methodology for mountain hares (Lepus timidus) in Scotland. Scottish Natural Heritage Research Report No. 1022.
Newey, S., Potts, J., Aebischer, N.J., Wilson, M.W. and Newson, S.E. 2020. Designing a monitoring scheme for mountain hare (Lepus timidus) in Scotland. Scottish Natural Heritage Research Report No. 1076.
Newey, S., Willebrand, T., Haydon, D.T., Dahl, F., Aebischer, N.J., Smith, A.A. and Thirgood, S.J., 2007. Do mountain hare populations cycle? Oikos, 116, 1547–1557.
Newson, S., Ross-Smith, V., Evans, I., Harold, R., Miller, R. and Barlow, K. 2014, Bat-monitoring: a novel approach. British Wildlife 25: 264-269
Patton, V., Ewald, J.A., Smith, A.A., Newey, S., Iason, G.R., Thirgood, S.J. and Raynor, R. 2010. Distribution of mountain hares Lepus timidus in Scotland: results from a questionnaire. Mammal Review, 40: 313–326.
Pettigrew, G.W., 2020. When to count? Indices of population size for mountain hares of the north-west Lammermuir Hills, Scotland. The Glasgow Naturalist, 27: 6-13.
Pettigrew, G.W., Di Vita, V., Pettigrew, M. and Gilchrist, J.S. 2021. The diel activity pattern of mountain hare (Lepus timidus) on managed heather moorland in ScotlandEcology and Evolution, 11: 7106– 7113.
QGIS Development Team, 2019. QGIS Geographic Information System. Open-Source Geospatial Foundation Project.
R Core Team, 2021. R: A language and environment for statistical computing. R Foundation for Statistical Computing, Vienna, Austria.
RStudio Team, 2020. RStudio: Integrated Development for R. RStudio, PBC, Boston, MA URL.
Shewry, M.C., Buckland, S.T. and Shaw, P. 2002. Distance sampling and its application to monitoring selected species. SNH Commissioned Report, RSM Report. Scottish Natural Heritage, Battleby.
Stanbury, A., Eaton, M.A., Aebischer, N.J., Balmer, D., Brown, A.F., Douse, A., Lindley, P., McCulloch, N., Noble, D.G. and Win, I. 2021. The status of our bird populations: the fifth Birds of Conservation Concern in the United Kingdom, Channel Islands and Isle of Man and the second IUCN Red List assessment of extinction risk for Great BritainBritish Birds, 114(12), 723-747.
Strobl, C. 2008. PostGIS. In: Shekar, S. and Xiong, H. (eds.) Encyclopedia of GIS. Boston, MA: Springer US.
Werritty, A., 2019. Grouse Moor Management Review Group: Report to the Scottish Government. Grouse Moor Management Group
Annex 1 - Distance distributions of other species
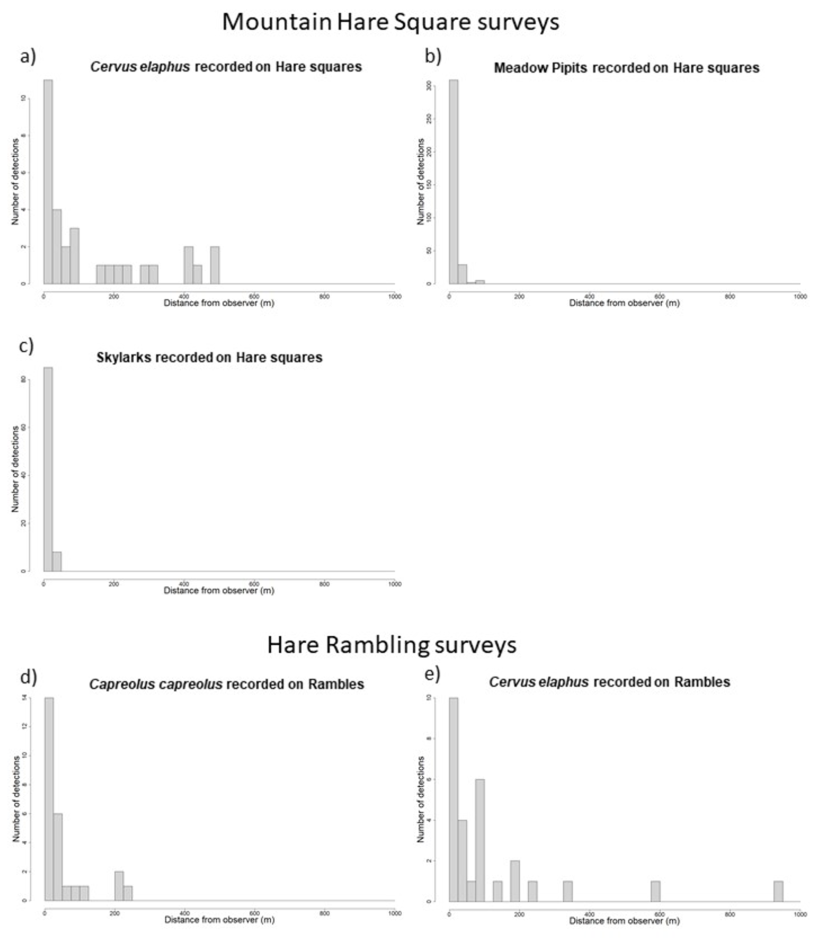
Number of sightings within 25 m distance bands (from the transect line) recorded in: Mountain Hare Square surveys for a) red deer, b) meadow pipits and c) skylarks; in Hare Rambles for d) roe deer and e) red deer. Continued on following figure…
Click for a full description
The number of sightings within 25 metre distance bands recorded in Hare Squares for red deer, meadow pipit and skylark, and in Hare Rambles for roe deer. This is continued in the following figure.
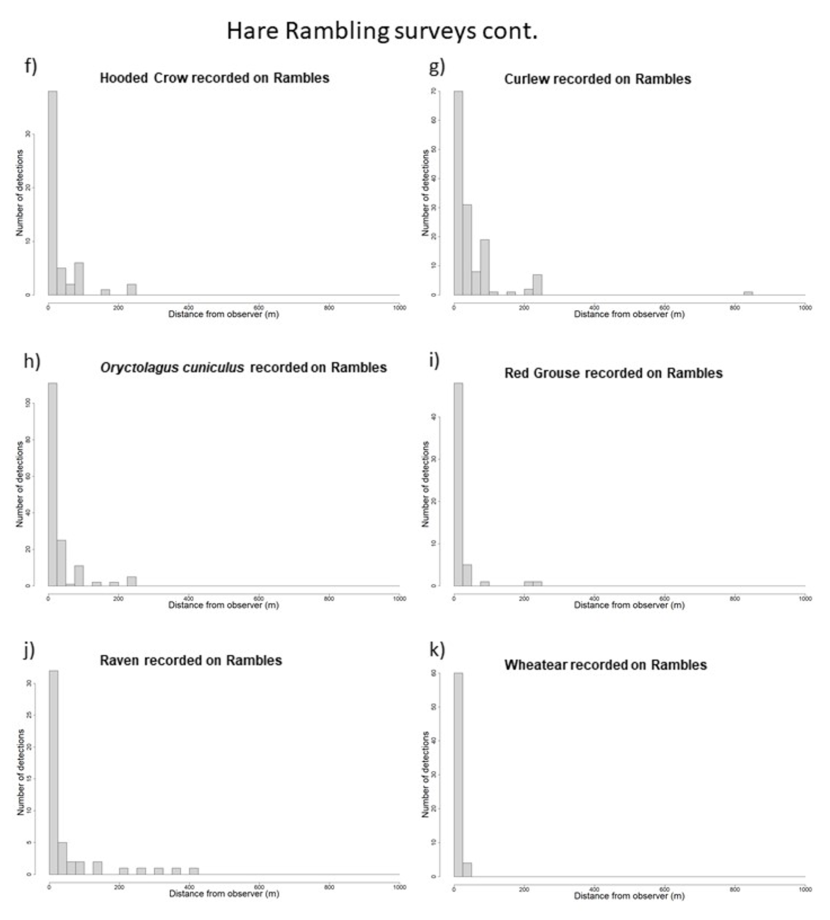
Number of sightings within 25 m distance bands (from the transect line) recorded in Hare Rambles for f) hooded crow, g) curlew, h) rabbit, i) meadow pipit, j) raven and k) wheatear. Continued on following figure…
Click for a full description
Continued from the preceding figure. Graphs showing the number of sightings within 25 metres from the transect line recorded in Hare Rambles for hooded crow, curlew, rabbit, meadow pipit, raven and wheatear. Continued in the following figure.
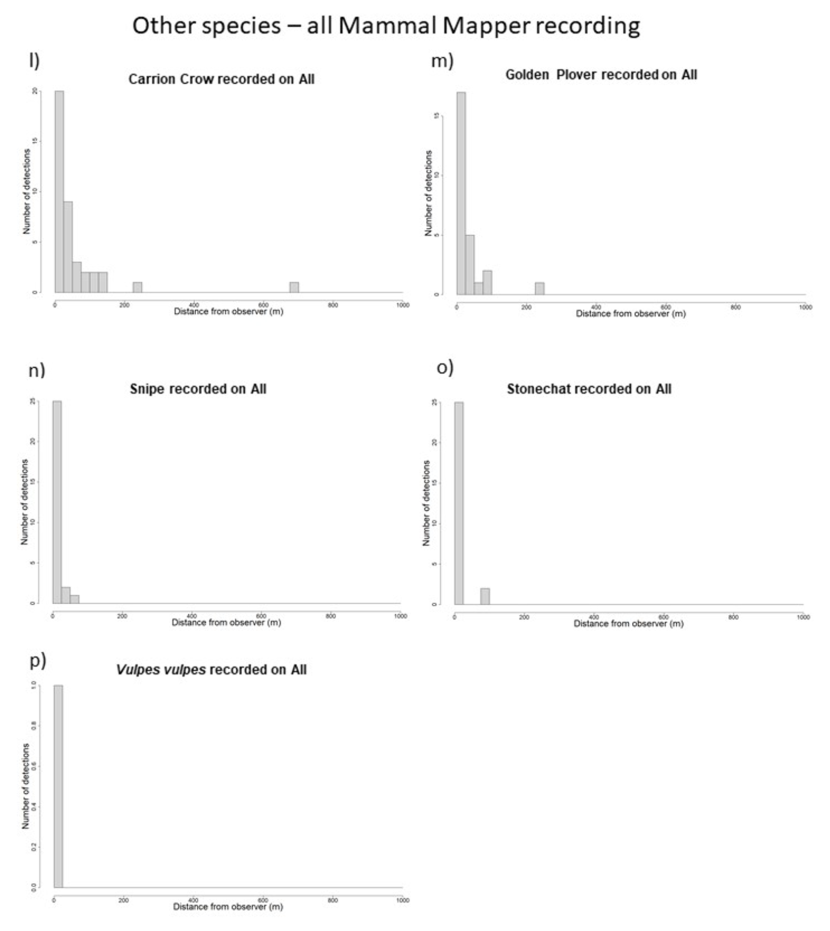
Number of sightings within 25 m distance bands (from the transect line) recorded in all Mammal Mapper surveys for l) carrion crow, m) golden plover, n) snipe, o) stonechat and p) red fox.
Click for a full description
Continued from the preceding figure, Number of sightings within 25 metres distance bands from the transect line in all Mammal Mapper surveys for carrion crow, golden plover, snipe, stonechat and red fox.
Disclaimer: Scottish Natural Heritage (SNH) has changed its name to NatureScot as of the 24th August 2020.
At the time of publishing, this document may still refer to Scottish Natural Heritage (SNH) and include the original branding. It may also contain broken links to the old domain.
If you have any issues accessing this document please contact us via our feedback form.