NatureScot Research Report 1284 - Facilitating Local Natural Capital Investment - Scottish Borders Area Characterisation
Year of publication: 2021
Authors: Dickie, I. and Royle, D.
Cite as: Dickie, I. and Royle, D. 2021. Facilitating Local Natural Capital Investment – Scottish Borders Area Characterisation. NatureScot Research Report 1284.
Keywords
natural capital; investment; sustainable finance; Scotland; nature-based solutions; ecosystem services; conservation finance; opportunities
Background
NatureScot and its partners are exploring approaches to secure more varied and sustained investment in nature through the Facilitating Local Natural Capital Investment Initiative. The programme aims to identify the business cases, financing structures and mechanisms and supporting tools required to deliver significant investment in the natural environment at a local level and have the potential to be scaled up and replicated across Scotland.
The Scottish Borders Council area has been selected as the pilot area for this project. The objective of this characterisation report is to develop an overall understanding of state of natural capital in the Scottish Borders and identify key opportunities and priorities for investment in the region. These outputs will inform the broader Facilitating Local Natural Capital Investment Initiative and any future initiatives seeking to support investment into Scotland’s natural capital.
Main findings
The Scottish Borders is geographically characterised by the catchment of the River Tweed, with its many tributaries extending into almost every corner of the Borders. The main land use is agriculture and forestry, and the major proportions of land cover are:
- Arable farmland (16% mainly in the lowland plain) and grazing land (41% and widely distributed),
- Woodland (20%) comprising mostly conifer plantations in the uplands and only 3% land cover for broadleaf/mixed woodland which is fragmented and widely dispersed,
- Heath/moor and bog (20%), located in the uplands with a high proportion of bog and peat
In terms of condition and benefits provided by these land types:
- Arable productivity depends upon soil quality, the land in the central belt being of higher quality and hence most productive. Soil carbon is in the range 1.5-3.0% and provides an opportunity to sequester carbon overtime. Management of soils also plays a key role for water quality in the wider environment.
- Grasslands are varied, ranging from improved grassland to rough grazing in the uplands, supporting mostly sheep farming but some beef and dairy production too. Low income from poorer grazing land provides opportunities for land use change.
- Nearly a quarter of moorland/bog has been identified as peat soil. Whilst a detailed survey of condition is not available, it is likely to be emitting significant quantities of carbon (if similar to national trend), presenting a major opportunity to abate carbon emissions. Re-wetting peat bogs also improves water storage and provides flood mitigation benefits.
- Woodland is mainly conifer plantation (17% land cover), and whilst productive for timber output this land is low in biodiversity and recreational value. Only 1.4% of the land cover is semi-natural woodland.
- Water quality is reasonably good in the catchment (measured by WFD status, 58% of surface water bodies are in good or better condition). The catchment management plan details planned improvements, (such as fish passes and measures to address diffuse pollution), although some waterbodies used for public water supply are heavily modified and cannot achieve good status without disproportionate expenditure on water supply infrastructure. A significant proportion water from the catchment supplies the city of Edinburgh.
- 57% of SSSI features are in favourable condition, but 37% are unfavourable declining, favourable declining or unfavourable no change. Half of these features are wetlands or woodlands, with the most common negative pressures being invasive species, over or under grazing and water management issues.
- The area has good provision of green space and opportunities for recreation and tourism, with walking, cycling (especially maintain biking), water sports and recreational fishing on the Tweed as major attractions.
In the Scottish Borders, the main opportunities for investment in natural capital include:
- Woodland creation. A target of up to 25% woodland cover is feasible for the Scottish Borders (from the current level of 20%) and supports the national aim of 21% woodland cover by 2032 declared in the latest update to the Climate Change Plan (Scottish Government, 2021). In the Scottish Borders, 25% woodland cover represents 24,000 ha of new woodland creation and could include a wide variety of woodland types (for example native recreational woods, wet woodland, riparian woodland as well as additional commercial plantations). Depending upon the woodland design, type and location, this would realise benefits of: carbon sequestration, timber production, recreation and well-being, enhanced biodiversity, water quality improvements and flood risk mitigation. Furthermore, growth of the timber industry is an important economic development theme in the Borderlands Growth Deal strategy. Preferred locations for new woodland planting have been identified by the pilot Land Use Strategy mapping exercise carried out in the local area in 2014, and will be supplemented by current projects, such as Riverwoods.
- Peatland Restoration. There are around 22,000 ha of peatland in the Scottish Borders local authority area, and whilst there is no comprehensive survey of condition in the local area, it is possible that around 12,000 ha may be in drained or eroding condition and producing 150,000 tCO2e of greenhouse gas emissions per year. At this scale restoration costs may be in the range £25 to £45 million but save over £600 million of emissions over 60 years. In addition, restoration projects also provide the opportunity to improve water flow and quality and enhance upland biodiversity.
- Habitat Creation and Biodiversity Improvement. There are many opportunities for the enhancement of an ecological habitat network, especially for highly fragmented or endangered habitats (such as herb-rich grasslands, native woodlands and wetlands). The River Tweed also provides an important connectivity opportunity for biodiversity. Both the Local Biodiversity Action Plan and the local planning guidance for biodiversity recognise priority habitats. Scottish planning frameworks are developing approaches for ensuring positive effects from development on biodiversity and examples of compensation approaches have already been implemented in the area.
- Natural Flood Risk Management Opportunities. Relevant spatially targeted measures are reflected in the local land use strategy pilot, which mapped opportunities for retaining water including: re-wetting peat bogs in the uplands, tree planting in areas that slow the flow of water, wetland creation near streams and on flood plains and measures to improve infiltration (mainly on grazing land). Ongoing projects in the area (notably the Eddleston project) are helping to monitor the effectiveness of natural flood risk management measures and should help to more effectively target investment.
- Recreation and Tourism. There are several tourist and recreational activities that have strong linkages to natural capital (including wildlife watching, water based recreation and fishing). The local tourist economy could benefit from a broad range of potential investments in natural capital, including: freshwaters and water quality to benefit the recreational fishing sector; provision of new access arrangements to improve connectivity and variety of walking, horse riding and cycling opportunities; enhancement of key sites of wildlife interest; enhancement of urban parks; and creation of new habitats for recreational users (e.g. woodland for walkers).
- Farmland management. Farmland represents a significant opportunity to improve natural capital in the Scottish Borders, whilst recognising the constraints linked to ongoing land use for food production. Opportunities for improvement in natural capital include: Soil carbon sequestration, maintenance of soils (avoiding erosion, compaction and run-off), biodiversity improvements (improved diversity of grasslands, planting hedgerows, trees, creation of field margins, wetlands, water quality improvements (reducing diffuse pollution), and flood risk management, (improving infiltration, targeted tree planting).
- Water Quality Investment depends on Scottish Water, for whom other catchments are higher priority for investment than the Tweed. Opportunities to improve water quality are diverse and many of the investment opportunities above could deliver substantial water quality benefits. It is recommended that the potential for improvement in water quality is pursued as a target benefit from these other investment themes as well as an investment theme in its own right.
Acknowledgements
This Characterisation report was prepared by Economics for the Environment Consultancy Ltd (eftec) in association with Environmental Finance Ltd, and Countryscape for NatureScot.
Tweed Forum is the local partner for the project and enabled access to a large amount of existing data and data sources.
Tweed Forum, SBC and Environment Systems Ltd, who have kindly granted permission for the regional land use maps to be reproduced in this report.
Thanks also to members of Scottish Borders Council, SEPA, Scottish Forestry, Peatland Action, Go Tweed, Scottish Water and NatureScot who have contributed information in support of the production of this report.
Introduction
“Natural capital” refers to the stock of renewable and non-renewable resources (biodiversity, air, water, soils, minerals) that combine to yield a flow of benefits to people (United Nations, 2020). The state of natural capital plays a vital role in providing benefits which support the economic, social, and individual well-being of society.
The objective of this characterisation report is to develop an overall understanding of state of natural capital in the Scottish Borders and identify key opportunities and priorities for investment in the region. These outputs will inform the broader Facilitating Local Natural Capital Investment Initiative and any future initiatives seeking to support investment into Scotland’s natural capital.
This characterisation review provides:
- A local natural capital asset register – outlining the current condition and potential capability of assets to provide ecosystem services, highlighting potential areas for improvement and investment.
- A summary of ecosystem service demand – highlighting the scale and distribution of the benefits these provide in physical terms.
- A value creation assessment – identifying the value of enhanced ecosystems services, given the supply capability in (1) and the demand identified in (2) including the distribution of demand across key beneficiaries of these services and over time.
- A prioritised list of interventions requiring investment – weighted in terms of identified stakeholder demand, project feasibility and suitability for investment, and overall contribution to the condition of natural assets. This will be used to prioritise investment opportunities and assess suitable financial structures.
Methodology
The natural capital approach was determined by the terms of the project brief, and the team discussed with the project partner (Tweed Forum) the most appropriate sources of information to satisfy the natural capital data requirements, by considering the relevance, accuracy, and accessibility of potential information sources. For example, in discussions with Tweed Forum it was agreed that the Phase 1 land cover map provided the most accessible and accurate mapping of land cover.
Many of the sources of information had been compiled already for a regional land use pilot project conducted for the Scottish Borders area in 2014 (Scottish Borders Council, 2014). This pilot project used an ecosystem services approach, including extensive and intensive stakeholder engagement to produce the following information and maps:
- Maps showing the relative importance of the delivery of 17 ecosystem services, such as agricultural production, timber production, storage of carbon in soils, the enhancing of water quality.
- Maps indicating the most likely areas in which seven of these services might expand,
These maps and their supporting information were produced by the Tweed Forum, SBC and Environment Systems Ltd, who have kindly granted permission for the maps to be reproduced in this report.
In discussions with the local partner, other important sources of information and background knowledge where identified, including:
- Tweed Catchment Management Plan (2015-21)
- Local Biodiversity Action Plan (2018-28)
- Eddleston project and Ale catchment project
- Scottish Borders Woodland Strategy
- Scottish Borders Growth Deal
- Scottish Borders Local Development Plan
Further elements of the data where sourced as required, (such as national data sets for designated site, water framework directive and bathing water status), and discussions with local stakeholders (such as Scottish Water for water abstraction information, and the Local Scottish Borders Council Peatland officer and Peatland Action Project for inputs on peat condition).
In general provisioning services are based on market prices, whereas regulating and cultural services typically require modelling to estimate values. The methods for valuing the benefits are accepted methods used by the Office for National Statistics and other government bodies across the UK. They are described in Annex 2 – Detail of Valuation Methods.
Structure of this Report
- Section 2 describes the local natural capital register.
- Section 3 provides a quantification of the benefits provided by natural capital in physical output terms.
- Section 4 values these benefits in monetary terms (where possible), provides an indication of the scale of potential changes in value, and considers the distribution of current and potential values across beneficiaries.
- Section 5 provides a prioritisation of potential investments in local natural capital
- Section 6 summarises the main findings and intended use of this report
Natural Capital Asset Register
The scope for this area characterisation report is the administrative area of Scottish Borders Council (SBC). This area covers a large proportion of the catchment of the River Tweed, with its many tributaries extending into almost every corner of the Borders.
Many sources used in this report have been provided by Tweed Forum and include some studies that utilise the Tweed catchment as the geographical boundary. In most cases it has been possible to isolate the Scottish Borders element of data, or to assume that information is representative of the Scottish Borders overall. All information presented here relates to the SBC area unless explicitly stated otherwise.
Land cover
The land cover of the Scottish Borders by habitat type is shown in Table 2.1 and Figure 2.1, (Original source: The Wildlife Information Centre & Scottish Border Council based on Borders Phase 1 Habitats, 2021, shapefile. Data last modified: 30/03/2020, which includes recent updates for woodland creation and some pond creation, information supplied by Tweed Forum). The region has significant areas of woodland, improved grassland, arable farmland, other grassland, upland heath and bog.
Table 2.1. Land cover in the Scottish Borders
|
Land cover |
Area (ha) |
|---|---|
|
Improved grassland |
116,466 |
|
Coniferous woodland |
79,166 |
|
Arable |
76,469 |
|
Other grassland |
74,474 |
|
Heath, bracken and shrub |
66,367 |
|
Bog |
29,317 |
|
Broadleaf/mixed woodland |
16,212 |
|
Urban and other* |
11,779 |
|
Freshwaters |
3,371 |
|
Intertidal, saltmarsh and coastal |
664 |
|
Total |
474,283 |
Note* ‘Other’ includes bare ground, scree and quarries as well as urban land types.
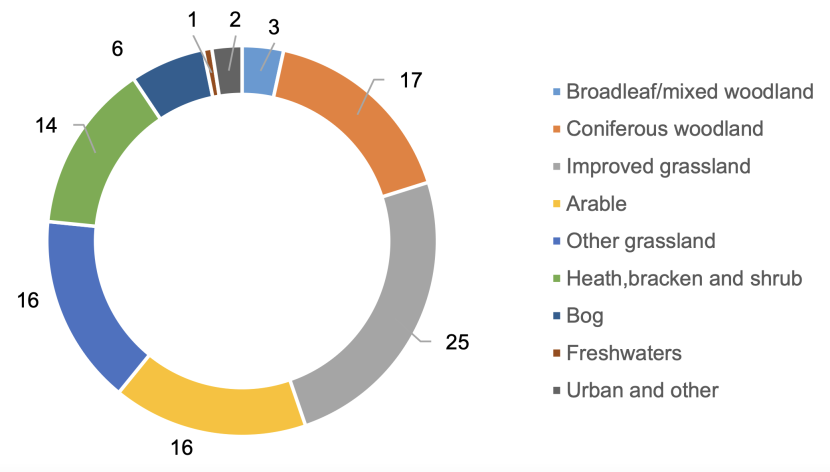
This chart shows the percentage of land cover by type for the Scottish Borders.
Visual representation of table 2.1. Land cover in the Scottish Borders
The area is characterised by heath, bracken, shrub, together with bog (20% combined) and coniferous woodland plantation (17%), mainly in the uplands. Grassland (41% including improved, semi-natural and other grassland) is the main feature at mid-altitude, and arable land cover (16%) is concentrated in the lowlands (Figure 2.2).
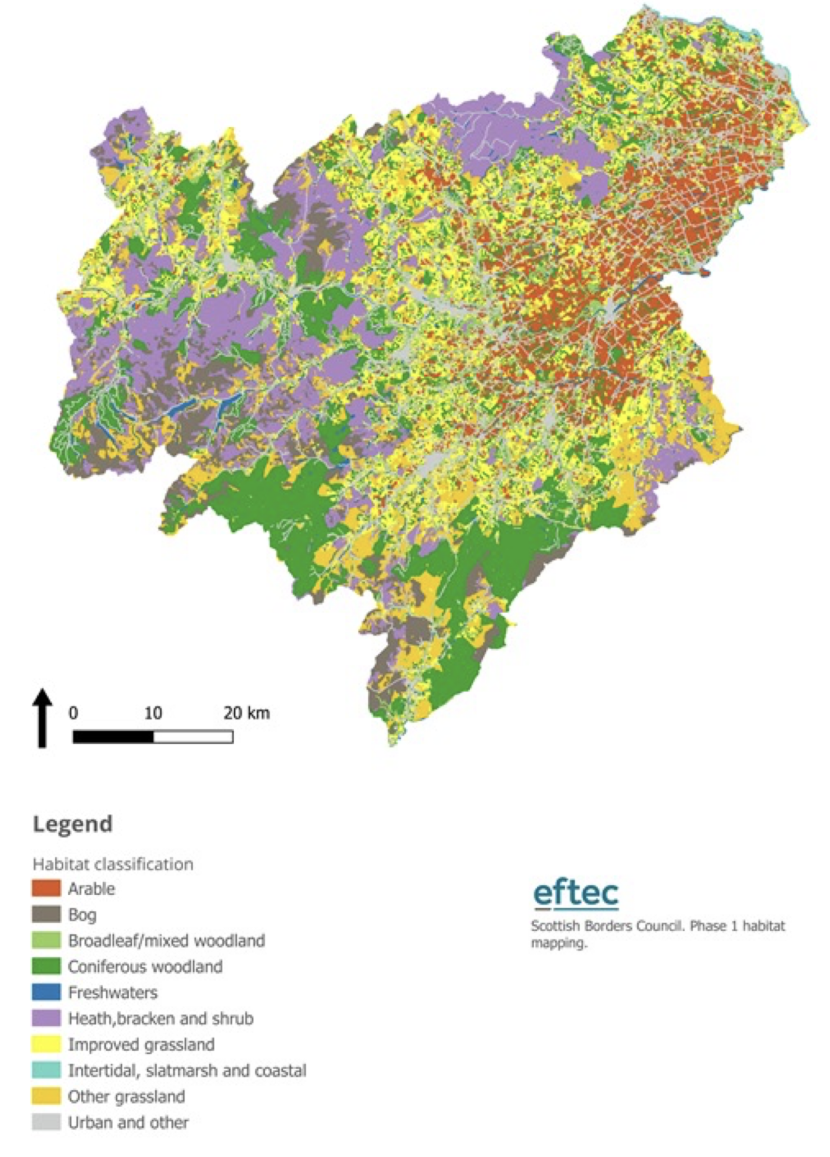
This spatial map shows the various habitat types within the Scottish Borders.
Agriculture is the main land use, comprising 346,000 ha (73% of land cover), which includes arable land and 275,000 ha of all types of grazing, including improved grassland and rough grazing (Scottish Government, 2020). In 2019, there were 2,535 holdings (Scottish Government, 2020) in the Scottish Borders Council area, and the distribution of holdings by area is shown in Table 2.2. This shows that 93% of farmland is managed by 835 holdings over 100 ha. Note this table includes woodland and land uses other than agriculture.
Table 2.2. Distribution of holdings by area
|
Size of holding |
Number of holdings |
Total area (ha) |
Area % |
|---|---|---|---|
|
Less than 10 ha |
1,077 |
3,794 |
1% |
|
10 to 100 ha |
623 |
24,459 |
6% |
|
100-200 ha |
262 |
39,557 |
10% |
|
More than 200 ha |
573 |
314,843 |
83% |
|
Total |
2,535 |
382,653 |
100% |
In the Scottish Borders current woodland cover is 20%, of which 3% is broadleaf or mixed woodland. However only 1.4% is native (ancient or semi-natural) woodland (Forestry Commission Scotland, 2013).
Measures of natural capital condition
Indicators of asset condition provide insight into the health and capacity of the natural capital in the region to sustain levels of benefit to all beneficiaries (public and private) and to support the local economy. This includes measures of the condition of key assets that underpin each of the benefits (such as soil condition, water quality and measures of important features of biodiversity). This section outlines the condition of natural capital in the area based on currently available data.
Soil carbon
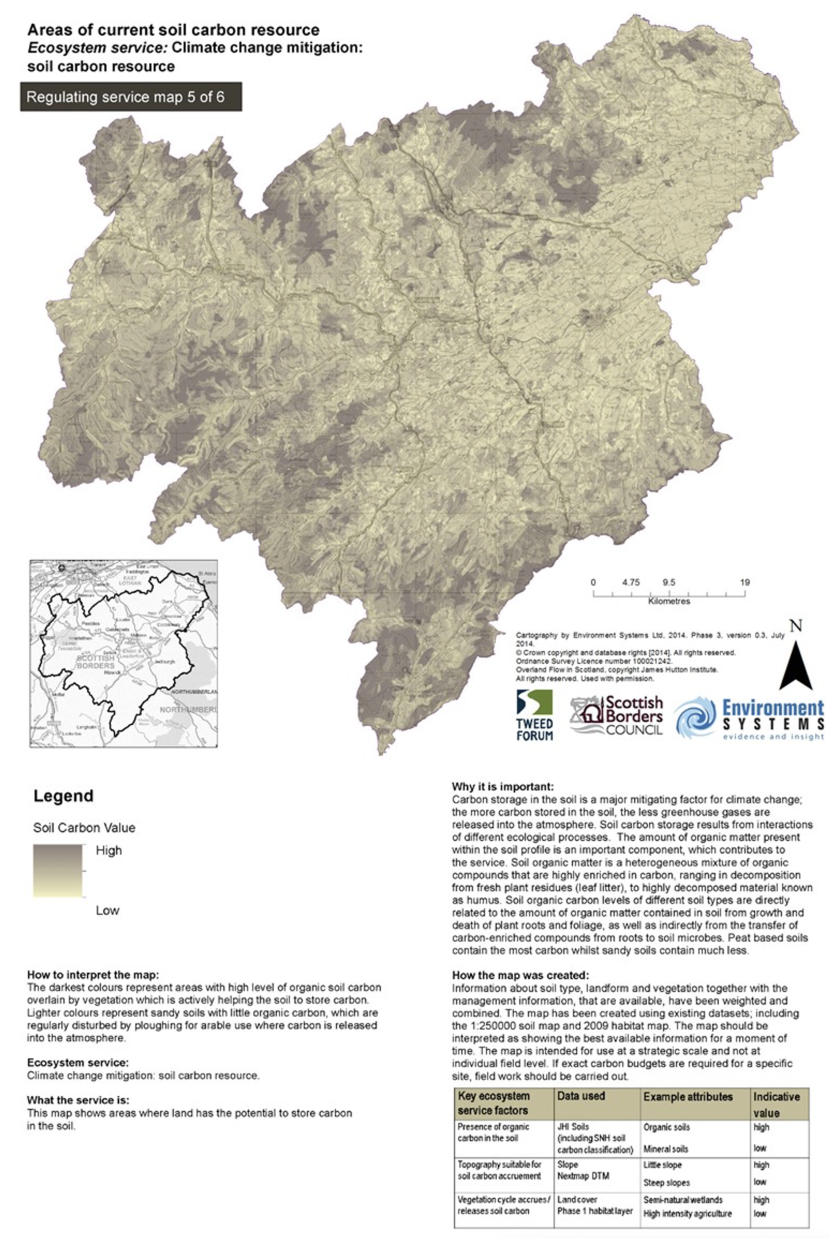
Large quantities of peat are stored in deep peat and organic soils located in the uplands (see Figure 2.3, in which dark brown areas signify higher soil carbon storage), with many areas at over 35% carbon concentration. The lowland areas are mainly arable, with soil in this area having a carbon concentration in range 1.5% -3.0% (Source Soils of Scotland). There is potential to improve carbon storage, with concentrations in the range of 5-7% being high (source: Agriculture and Horticulture Development Board & British Beet Research Organisation, AHDB-BBRO. 2019).
Peat condition/depth
22,000 ha of peatland has been identified in the Scottish Borders (extract from: JHI Peatland map), and most peatland is located in the uplands (shown in dark brown in Figure 2.3). A thorough survey of peatland condition has yet to be completed for the Borders, however an estimate of condition can be assessed from a sample of data from Scottish peatlands collected for the Peatland Action project (data was kindly provided by the Peatland Action project ), and categorised by the Peatland Code condition categories (Table 2.3). The survey data for peat sites across Scotland shows that a substantial proportion of peatland area is either actively eroding or drained (56% in total). These two categories of peatland are significant emitters of greenhouse gases, and so provide a considerable opportunity for greenhouse gas abatement through restoration. This is analysed further in Carbon Sequestration and Emissions section.
Table 2.3. Estimate of Scottish Borders Peatland Condition [Survey from Peatland Action Project]
|
Peatland condition category |
Area (%) |
Estimated Area (ha) |
|---|---|---|
|
Actively eroding |
22% |
4,843 |
|
Drained |
34% |
7,484 |
|
Modified |
22% |
4,843 |
|
Near Natural |
3% |
660 |
|
Forested/previously forested |
18% |
4,182 |
|
Total |
100% |
22,012 |
Assuming that these survey results are representative of peat condition in the Scottish Borders is a simplistic assumption, however, expert opinion from the local area suggest this provides an indication of potential emissions and hence the scope for emission reduction through peatland restoration. From these assumed proportions, the peatland in the Scottish Borders could be emitting around 160,000 tCO2e per year.
Given the level of uncertainty around peat condition, it is recommended that better estimates of peat condition in the local area are undertaken as a major priority.
Water quality
Although the Water Framework Directive (WFD) measures the ‘ecological status’ of water bodies, (of which water quality is one component), for this type of desktop study the use of WFD status provides a useful starting point for assessing water quality. There are limitations with this approach, firstly it does not include all water bodies (such as small tributaries and ponds), and secondly the WFD includes the morphology within the definition of ecological status of water bodies, including the legacy of historical engineering. The first point cannot be addressed within the timescales of this project, hence small water features are excluded from this analysis. That said, the coverage of the WFD system is extensive and includes all major water bodies. The second point about morphology has been allowed for, as described in the remainder of this section.
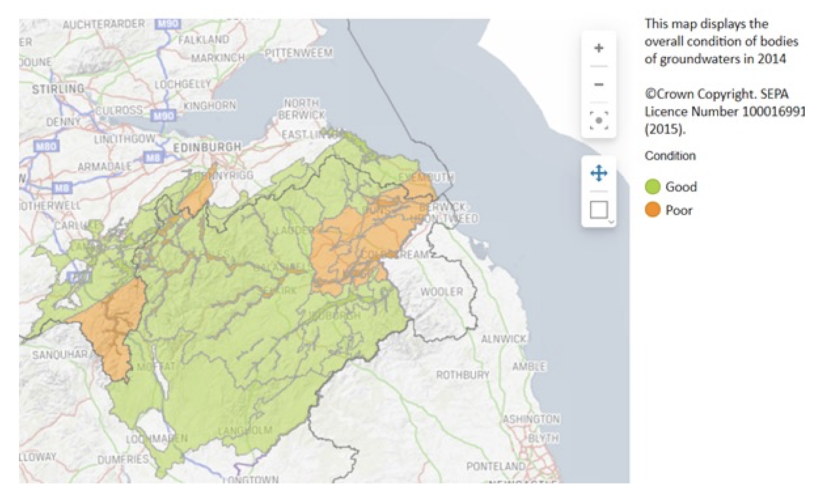
Both surface water (located on top of the Earth's surface, such as rivers and wetlands), and ground water (present beneath the Earth's surface), are important natural resources in the local area. Surface water and groundwater condition can be assessed from (WFD) status measures (based on condition data at 2014: SEPA, 2020). Table 2.4 presents overall surface water body status, which illustrates that 58% of waterbodies are at good status or above, with 18% at poor or less. Most (96%) of these waterbodies are rivers, the remainder being reservoirs and lakes.
Table 2.4. Surface water body status
|
WFD Status |
Count |
% |
|---|---|---|
|
High |
8 |
4% |
|
Good |
114 |
54% |
|
Moderate |
51 |
24% |
|
Poor |
38 |
18% |
|
Bad |
1 |
<1% |
|
Total |
212 |
100% |
The main reasons for not achieving good status are due to the following pressures (with number of water bodies affected in brackets):
- Man made barriers to fish migration (25 – mainly a morphology issue)
- Modifications to physical condition (15 – mainly a morphology issue)
- Rural diffuse pollution (14)
- Agricultural irrigation (8)
- Public water supply (6 – often a morphology issue)
Water quality in the area is mainly good, and the local catchment management plan (Tweed Forum, 2015) aims to address most of these pressures. Many barriers to fish migration are being addressed through fish passes; and whilst not a direct water quality issue, this can have important benefits for aquatic wildlife. Although the WFD framework is in place to monitor improvements, there are some water bodies that are heavily modified (especially for the provision of public water supply) and cannot achieve good status without disproportionate expenditure on water supply infrastructure; the WFD requires these water bodies to reach Good Ecological Potential.
Diffuse pollution is a more direct pressure on water quality and has been a significant issue in the Eye Catchment (Scottish Borders Council, 2014) and is on the SEPA list of the first cycle of priority catchments for addressing diffuse pollution. Actions have been ongoing to reduce pollution since 2009, making some progress but further action is still required. A second cycle of planning led to the identification of further water bodies in the middle Tweed under the rural diffuse pollution plan for Scotland (2015-2021).
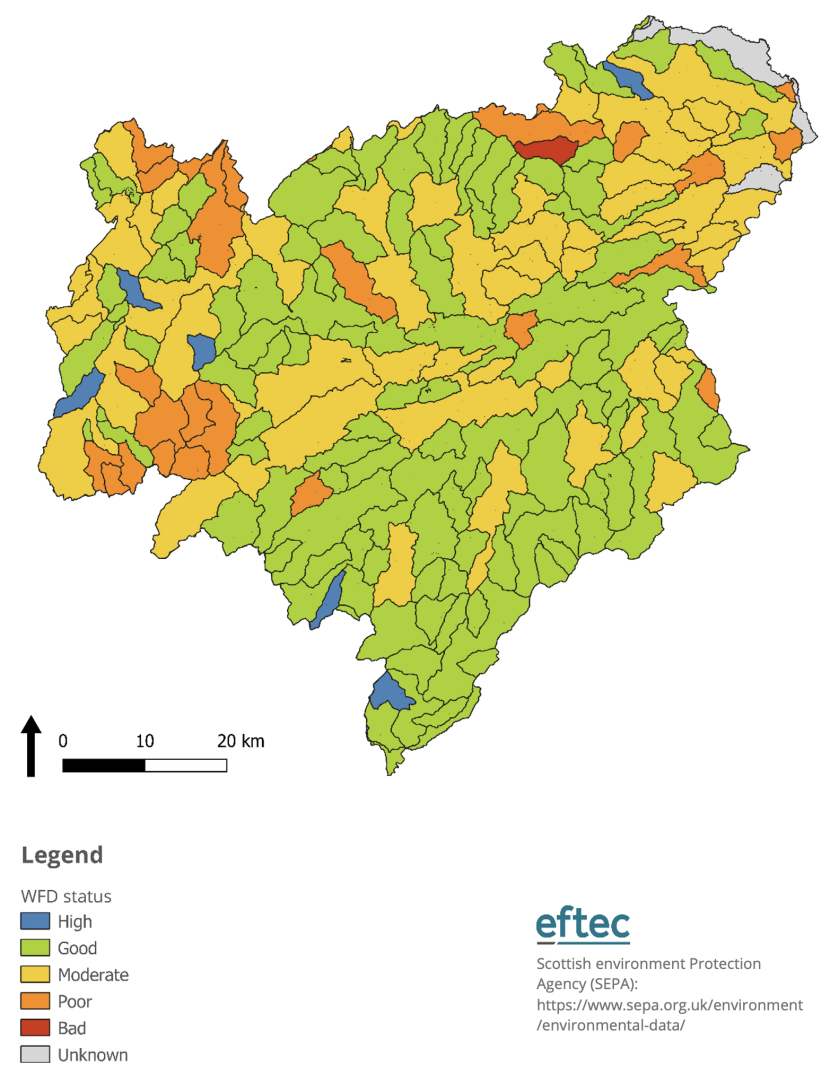
This map shows the condition status of surface water bodies in the Scottish Borders. Condition status is shown as high, good, moderate, poor, bad or unknown. The data for each water body status can be found in table 2.4.
For groundwater, overall status condition measures (in 2018) were; 30 rated as good and 5 as poor. The five with poor ratings (Figure 2.5) were: Chirnside, Penicuik, Fogo, Leadhills, and Whiteadder sand & gravel aquifer, mostly for poor chemical status including nitrates, and in the case of Leadhills for heavy metals (lead and cadmium).
Bathing waters
The condition of the bathing waters for the three SEPA monitored sites is shown in Table 2.5 (Sepa, n.d.). These condition indicators test for the bacteria E Coli and intestinal enterococci. The bathing water in Eyemouth has been historically poor, as a result of failing these tests due to diffuse agricultural pollution, but there have been improvements made in recent years through measures to prevent livestock poaching of water courses.
Table 2.5. Scottish Borders Bathing water status
|
Bathing Water |
Condition (2020) |
Historical record |
|---|---|---|
|
Pease Bay |
Excellent |
Consistently excellent |
|
Coldingham |
Excellent |
Consistently good |
|
Eyemouth |
Sufficient |
Frequently poor |
Biodiversity - Designated site status
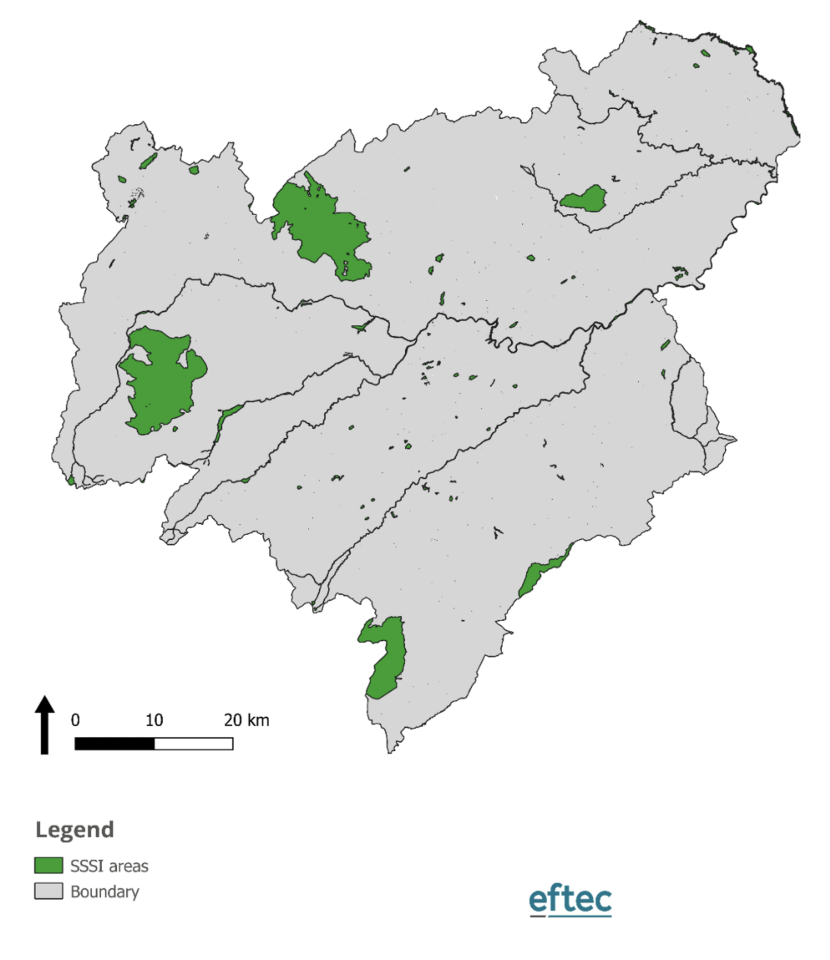
There are 89 SSSIs in the Scottish Borders covering nearly 25,000 ha (5% of the local area) and 155 features. Their condition statistics are shown in Table 2.6 and Figure 2.7. The proportion of features that are “favourable maintained”, “favourable recovering” or “unfavourable recovering” is 62%, which is well below the Scottish average of 79%. Conversely, 34% of features are either “unfavourable no change” or “unfavourable declining”, which is worse than the Scottish average of 20%.
One disadvantage of SSSI condition assessments is that the periods between assessments are typically many years, hence assessments can be out of date and not reflect the latest condition of a particular feature. In the absence of any other data, this report has to use the latest condition assessments as the best available indicator of condition.
Table 2.6. Scottish Borders SSSI Features by condition 2020
|
Condition |
Number of features |
% |
|---|---|---|
|
Favourable Maintained |
77 |
50% |
|
Favourable Declining |
5 |
3% |
|
Favourable Recovering |
6 |
4% |
|
Unfavourable Recovering |
12 |
8% |
|
Unfavourable no change |
29 |
19% |
|
Unfavourable Declining |
24 |
15% |
|
Not assessed |
2 |
1% |
|
Total |
155 |
100% |
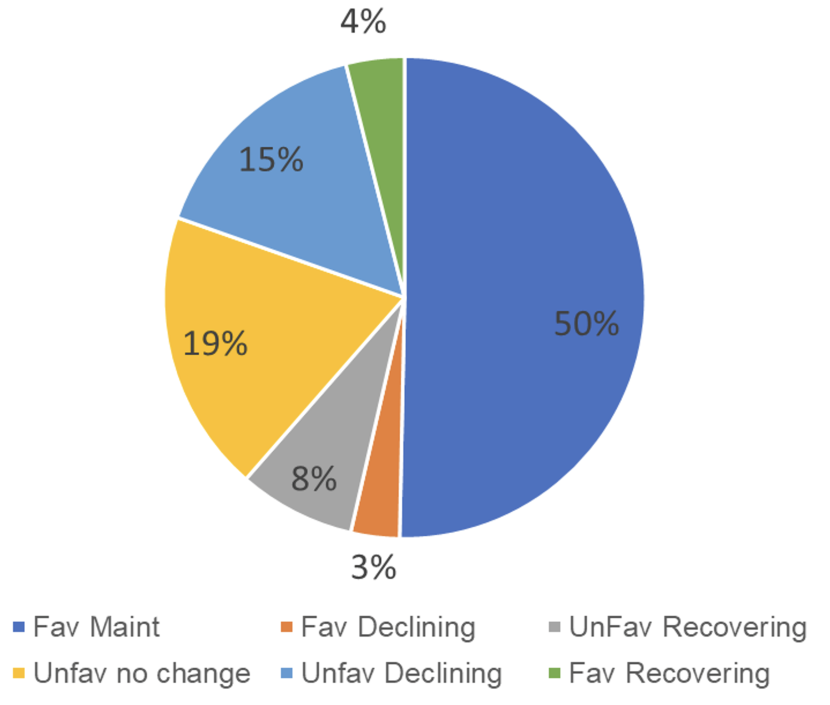
Of the 58 features that are in “unfavourable no change”, “unfavourable declining” of “favourable declining” condition, the most common are, wetlands (14), woodlands (10), birds (7) and invertebrates (6). The most common negative pressures cited as invasive species (29 cases), over or under-grazing (28 cases total) and water management/quality (18 cases total).
Significantly, the River Tweed SSSI is listed for 9 features. Most, (5), are in “favourable maintained” condition, two “unfavourable recovering” but the Sea Lamprey as “unfavourable declining” and the trophic river assessed as “unfavourable no change”. The latter two being subject to negative pressures from invasive species and overall water management.
There is limited information on the status of habitats outwith designated sites: covering a much larger proportion of land, these habitats are very important for biodiversity in the Scottish Borders. Pollination services provided by field margins are an example of the role that farmland and grassland can play in support a broader network of wildlife. Opportunities to improve pollination services are considered in Key Investment Themes section.
Open access and green space
In the Scottish Borders Council area, 77% of the adult population can walk from home to access local greenspace within a five minute walk or less (Source: Scottish Household Survey, based on average of responses over the years 2013-18). This is above the Scottish average of 67%. The same survey also reported that 76% of respondents feel very or fairly satisfied with local greenspace, the same as the average for Scotland.
According to the Green Space Strategy for the Scottish Borders (Scottish Borders Council, undated), there are 500 green spaces covering 950 ha across ten settlements and rural areas. These areas included, public parks and gardens, local amenity green spaces, allotments & community gardens, play space and sports grounds. The survey which supported the strategy assessed the quantity of green space in the area as high, but the following have been noted in the strategy as areas for improvement:
- Better countryside access – despite the abundant countryside surrounding all settlements, it is not always deemed accessible;
- Teenagers lack facilities within the Borders with more youth workers required and skate/BMX facilities in particular;
- Signage is very poor within green spaces
The strategy concluded that less than 30 sites (out of 500 audited) across the Borders were currently classed as low quality and of low value. There was no specific pattern to location or typology of these sites, but included sites in Hawick, Earlston, Eyemouth and Peebles and included allotments, play facilities as well as amenity green space. Specific improvement priorities for each location are detailed in the strategy document. The Green Space Strategy aims to:
- seek funding opportunities to sustainably manage and enhance publicly accessible green spaces in the interests of the whole community,
- encourage multifunctional use of green space to provide a balanced provision for play, sports, recreation and biodiversity, which will promote the health, enjoyment and well being of the Borders’ local communities.
- protect and enhance the Borders’ biodiversity within its open spaces.
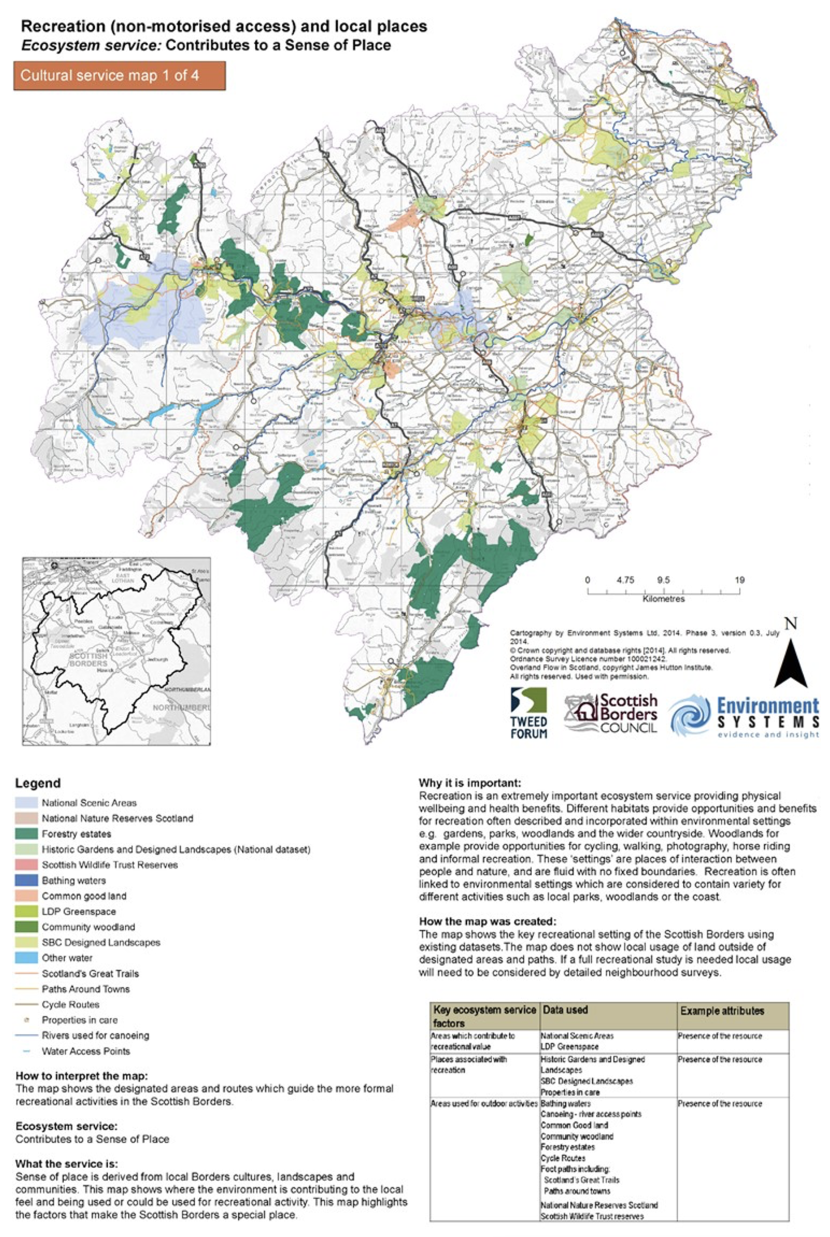
The Scottish Borders is a highly rural place, characterised as, “a series of small towns surrounded by countryside” (Source: Scottish Borders Council, undated), with a variety of natural landscapes to support a wide range of outdoor recreation including, walking, cycling, fishing, shooting, canoeing and bathing. Figure 2.8 highlights key assets that support this range of recreational activity, such as national scenic areas, nature reserves, forest estates, footpaths, national trails, cycle routes and recreational waters.
Current Ecosystem Services Supply
This section describes the current level of ecosystem benefits provided by natural capital in the Scottish Borders.
Ecosystem Services in the Scottish Borders
The current level of benefits from ecosystem services provided by natural capital in the Scottish Borders is summarised in Table 3.1. The methods used to estimate benefit levels are described in the subsequent sub-sections. The Table summarises measured benefits – potentially material benefits that cannot be measured (such as for mental health) are not shown.
Table 3.1. Summary of Measured Natural Capital Benefits – Physical Outputs
|
Benefit |
Annual Output |
|---|---|
|
Food production |
538,000 tonnes of crops 1.26 million livestock |
|
Timber production |
818,000 m3 |
|
Renewable energy |
1,494 MWh |
|
Water quality & quantity |
Public water supply 80 million cubic metres (76 million m3 from surface waters, 4 million m3 from groundwater) Non-public water supply (up to 4 million m3 per year) |
|
Carbon sequestration |
+560,000 tCO2e |
|
GHG emissions (Peatland) |
-160,000 tCO2e |
|
Recreation & Physical health |
5 million local recreational visits of which 2.5 million are physically active visits |
|
Tourism |
3.3 million visits per year |
|
Air Quality |
494 t PM2.5 removed from air |
Food Production
In Scotland, land classes or assessed on a scale of 1-7. Classes 1,2 are most productive and versatile land, whilst class 7 is of very limited value. 73% of the land in the Borders is agricultural land, with large areas of soil being of lower productivity (classes 4,5 and 6), used mainly for livestock grazing, especially by sheep in the uplands. Crop production for food and drink, and for feed for livestock, is concentrated on more productive soils in the lowland areas, whilst livestock production is concentrated around the main grazing areas on upland slopes and higher ground.
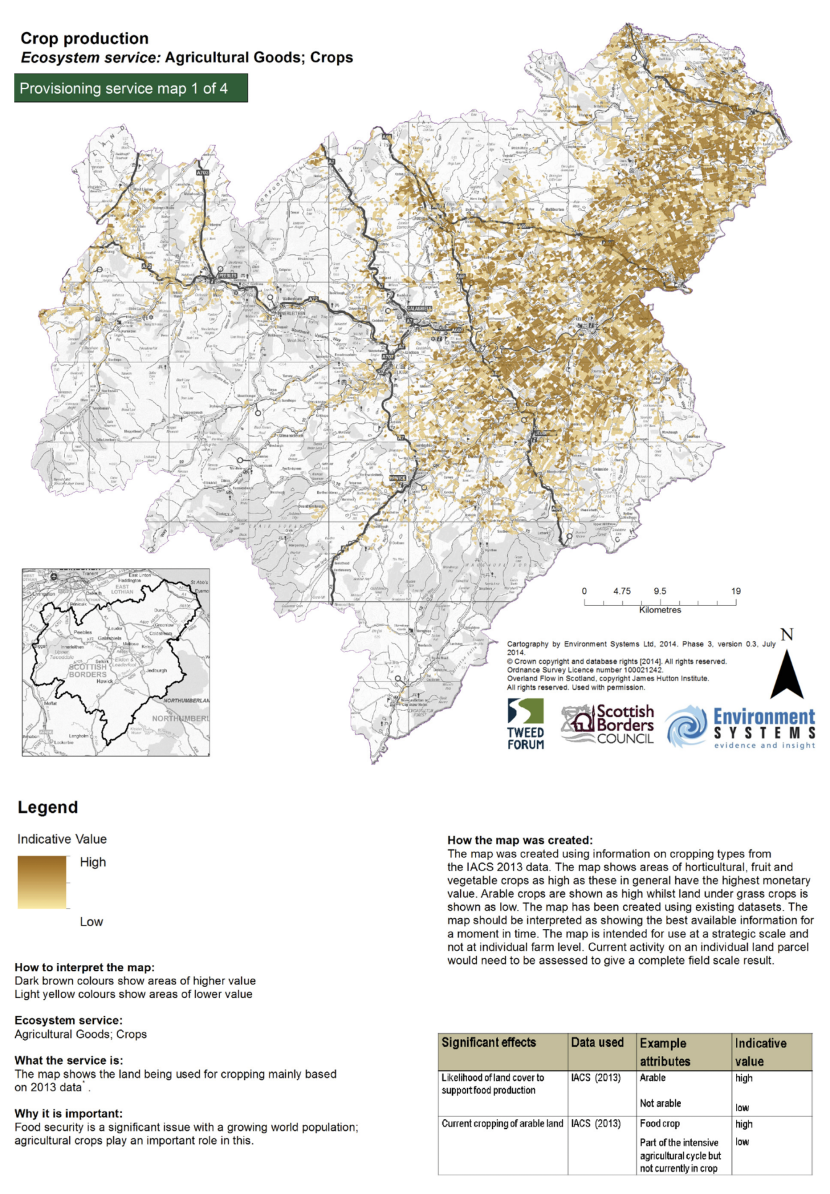
Arable output has been estimated from local land use area statistics by crop (Scottish Government, 2020), multiplied by average UK yields (Redman, 2018) for each crop type (Table 3.2). This tables excludes over 5,000 ha for minor crop types and 1,500 ha of fallow land. The concentration of arable food production is in the lowland plains (Figure 3.1), and given the productivity of these soils, the main land use is likely to remain arable crop production for food.
Table 3.2. Arable Food Output
|
Crop |
Area (ha) |
Output (tonnes) |
|---|---|---|
|
Wheat |
23,423 |
201,436 |
|
Barley |
23,119 |
144,572 |
|
Oats, triticale and mixed grain |
6,338 |
39,929 |
|
Rape for oilseed and linseed |
6,951 |
24,329 |
|
Potatoes |
2,197 |
98,843 |
|
Vegetables for human consumption |
2,428 |
29,134 |
|
Total |
64,453 |
538,243 |
Livestock statistics for the Scottish Borders (Scottish Government. 2020) are shown in Table 3.3. This includes all cattle and sheep in the study area (on the assumption that they mainly forage on grassland although they may spend some time indoors). It excludes pigs and poultry, as these are mainly reared indoors, utilising mainly manufactured capital and not on grassland (natural capital).
Table 3.3. Livestock heads
|
Livestock |
Heads |
|---|---|
|
Dairy |
10,200 |
|
Beef |
126,800 |
|
Sheep |
1,122,700 |
|
Total |
1,260,000 |
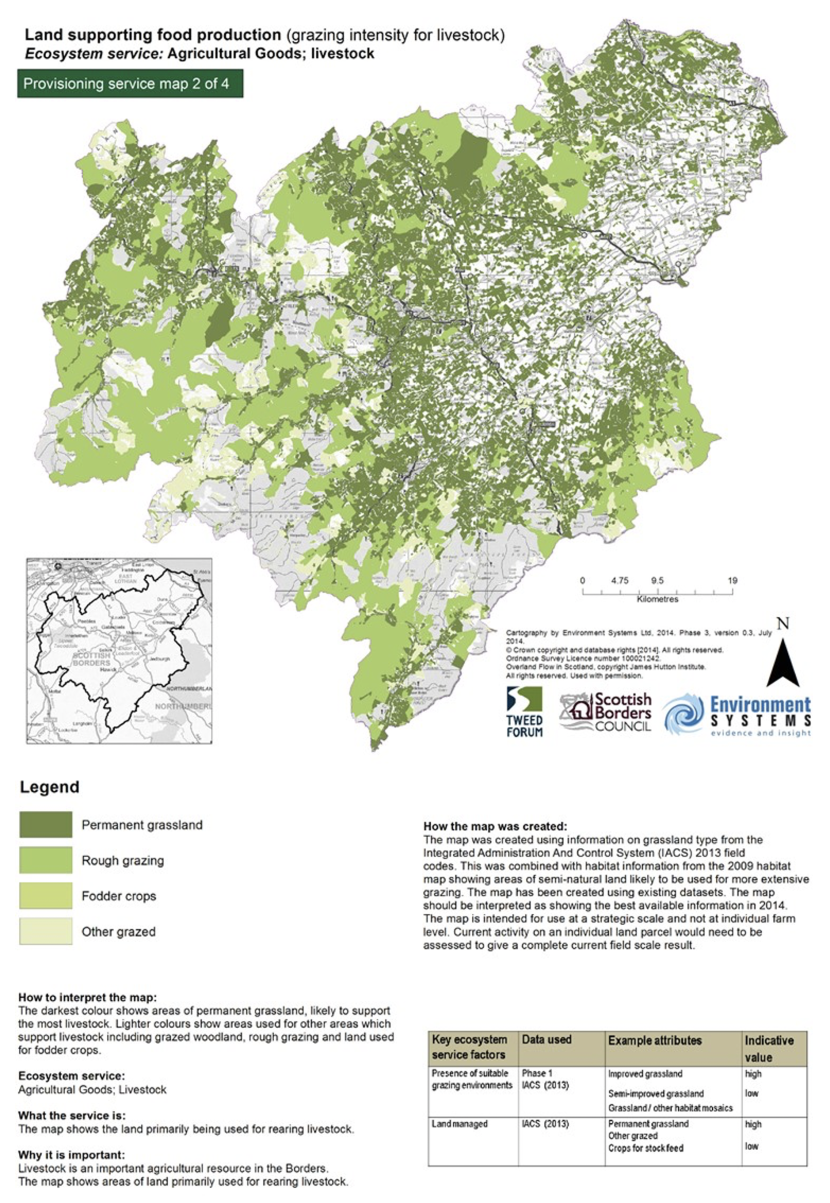
Livestock production is supported by land types as shown in Figure 3.2, with rough grazing (mid green) in the uplands, permanent grassland (dark green) at mid-altitude and fodder crops (light green) on lower altitude farm land. There may be some overlap between land used for fodder crops and the crop map area in Figure 3.1. This arises as crop land is often in rotation and attributing crops to final crop use is difficult. The area of fodder crops in Figure 3.2 is small so any overlap with Figure 3.1 is likely to be small too.
There may be opportunities to increase food yields with improved agricultural methods. Overall production will also be determined by future land use change, and trade-offs between food production and other benefits will need to be considered. However, some of the less productive land may be better utilised in delivering other benefits (such as carbon and water quality benefits from restored peatlands or new woodland creation).
Timber Production
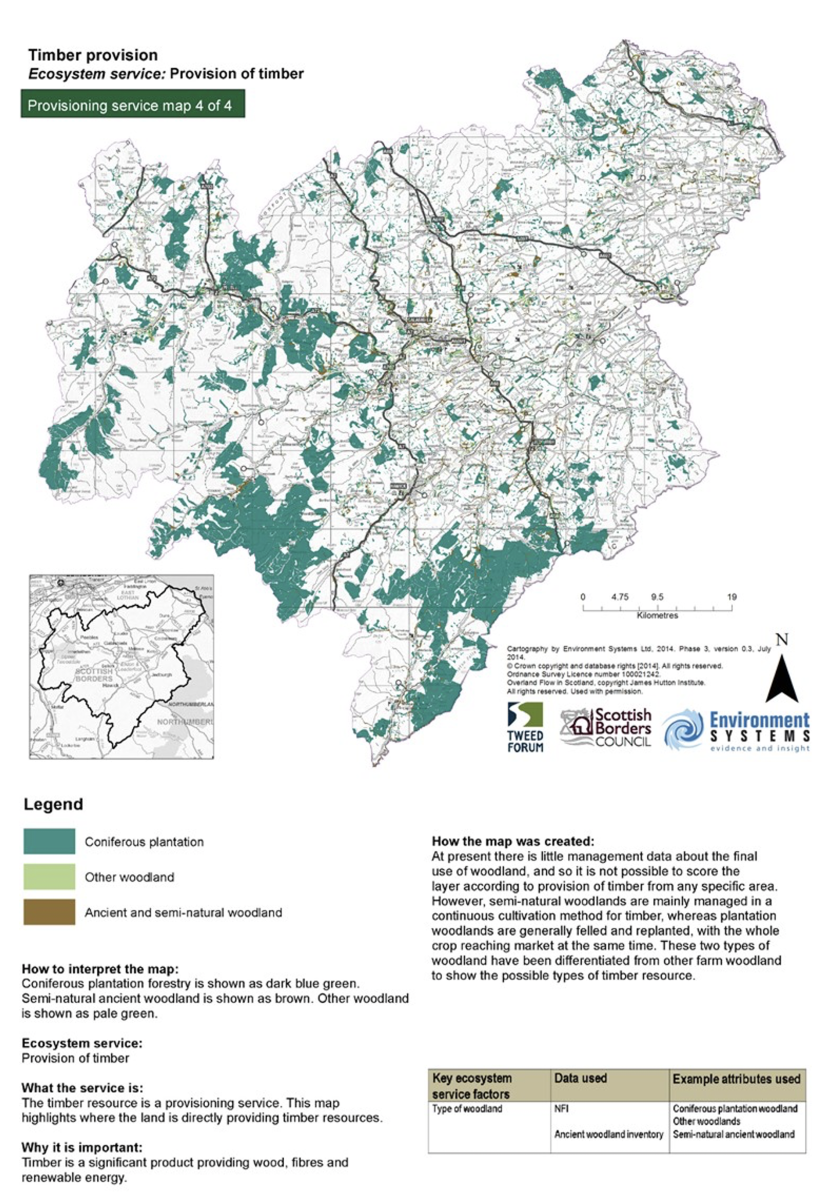
Around 20% of the Borders is wooded, with the majority of the cover being coniferous plantations for timber production and concentrated in the uplands (see Figure 3.3). Timber production has been derived from 50 year (2017-66) timber forecasts from Forestry Commission (Forestry Commission. 2018b). There is some expected variation in output over the 50 year forecast period (mainly due to substantial planting in the 1970s and 1980s coming to maturity in the 2020-36 timeframe). The 50 year average conifer production is estimated at 759,000 m3 per year. Broadleaf woodland production has been estimated on a similar basis per unit area of woodland (7.8% of productive woodland) and a value of 59,000 m3 per year.
There is scope to increase the area of woodland in the local area and this is discussed in more detail in Woodland Creation section.
Renewable Energy
99% of current renewable energy generation (excluding solar) in the Scottish Borders is from on-shore wind turbines (see Table 3.4, source: BEIS, 2019b). Solar has been excluded as this is frequently located on buildings and is not generally attributable to use of natural landscape. The data suggests no utility scale solar capacity in the local area. Wind energy generation is predominantly through multiple installation of wind turbines (over 640 MW of installed capacity) sited in the uplands to maximise generation due to higher wind speeds.
Table 3.4. Scottish Borders Renewable Energy Generation (2018)
|
Source |
Generation (MWh) |
% |
|---|---|---|
|
Wind |
1,483,119 |
99% |
|
Anaerobic digestion |
7,481 |
<1% |
|
Hydro |
2,038 |
<1% |
|
Plant Biomass |
1,799 |
<1% |
|
Total |
1,494,437 |
100% |
Future expansion of wind power generation capacity will need to be carefully planned. The planning system has considerable experience in assessing and making decisions on proposed schemes. This is discussed further in Renewable Energy section.
Water Provision
Around 76 million cubic metres of water per year is abstracted from the Tweed catchment via impounding reservoirs (and a small amount from rivers) for public water supply (Source: Scottish Water private communication). A significant amount of water from the catchment (through the Talla, and Megget reservoirs) supplies the city of Edinburgh hence a substantial quantity of surface water is diverted from the catchment.
In addition, groundwater is also used to provide public water supplies, with nearly 4 million cubic metres abstracted, the majority from the Howden and Innerleithen boreholes (Source: Scottish Water private communication). At the base of the Tweed lies the aquifer in the Fellstone formation, from which Northumbrian Water abstract for supplying Berwick-upon-Tweed. Private water supply is also significant (the main use being for agriculture) with up to 4 million m3 per year licensed for all uses (Source: SEPA freedom of information request).
As explained in Water quality section water quality in the area is generally good. Information from Scottish Water indicates that the costs of water treatment are in the range of 2 to 12 pence/m3, and that from a public water supply perspective, the higher priorities for addressing water quality lie elsewhere in Scotland. The impact of this large extraction of water from the upper catchment on downstream habitats, particularly in periods of lower water availability which may increase with climate change, is not known.
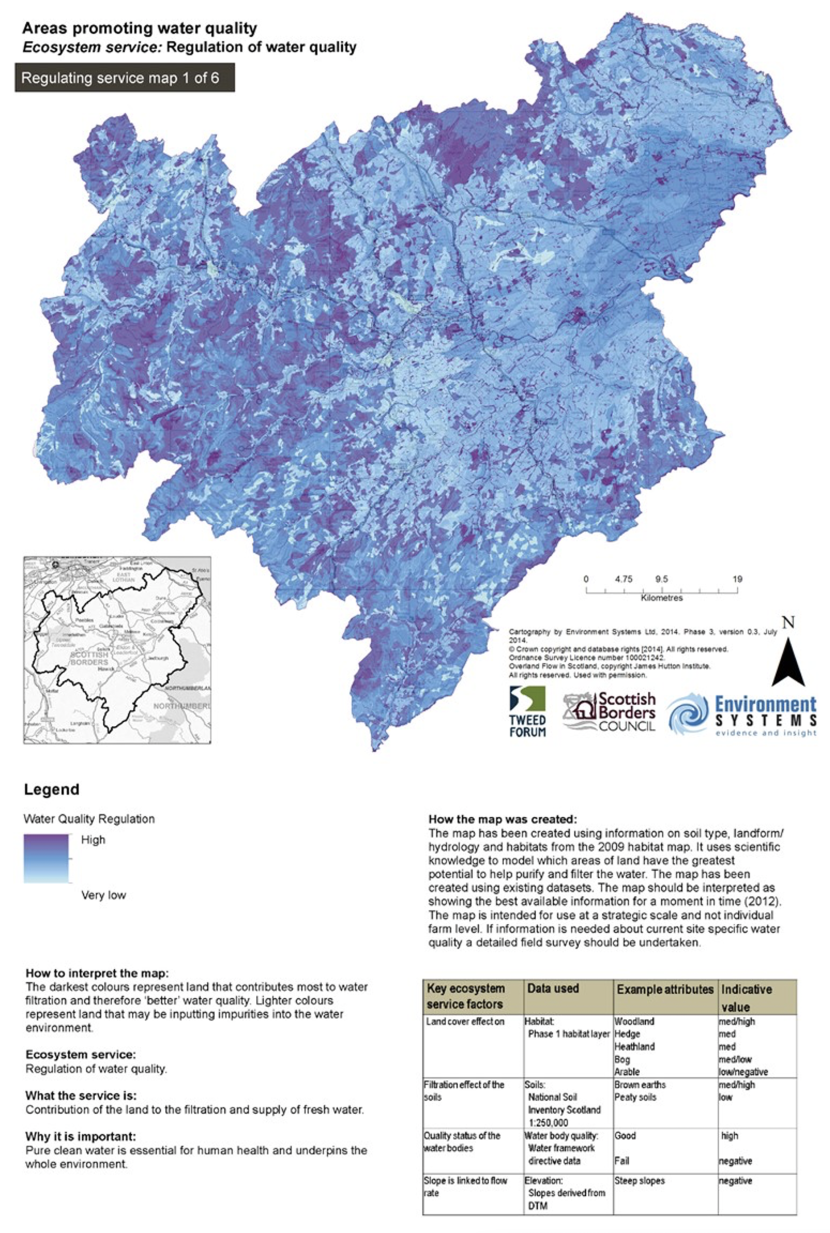
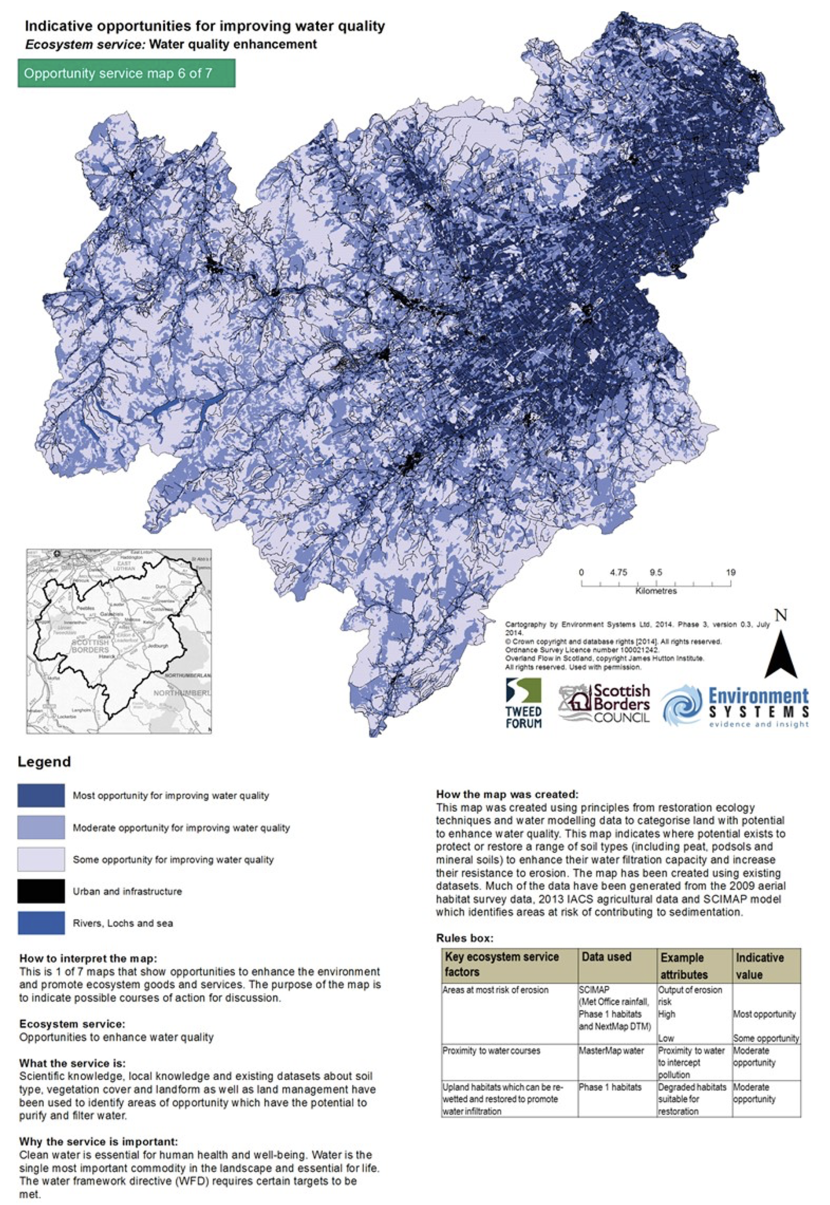
The mapping exercise which supported the Regional Land Use Strategy pilot, mapped those parts of the catchment which contributed most to overall water quality (see Figure 3.4). This demonstrates that uplands areas have the greatest contribution to water quality. However, the project did not conduct any assessment of water availability.
Carbon Sequestration and Emissions
There are large volumes of carbon in the woodland and deep peat in the uplands of the Borders. Whilst these are extensive stores of carbon, the net flux of carbon and other greenhouse gases depends upon the use and land management practices adopted.
Woodland is mainly coniferous and used primarily for timber production. Typically, planted coniferous species sequester carbon relatively quickly, and if well managed can continue to sequester carbon at rates of up to 10 tCO2e/ha/year (Forestry Commission, 2018a). However, whether this carbon is stored permanently, depends on whether the trees remain in site or under continuous cover and/or the end use of the timber that is harvested. The net rates also depend on the previous land cover and whether soils are disturbed during management. To be prudent, the UK average rate (ONS, 2019) of 5.7 tCO2e/ha/year was used to estimate total sequestration in Table 3.1.
It is possible for the Scottish Borders is to reach 25% woodland cover (an increment of 5% land cover). This would represent an additional 24,000 ha of woodland, potentially sequestering around 136,000 tCO2e per year (depending upon species and woodland design).
Peat bog in pristine condition sequesters carbon slowly. However, if drained or actively eroding, carbon can be emitted through various mechanisms at a rate of up to 25 tCO2e/ha/year (IUCN Peatland Code, 2020). Based on the assumptions made in Peat condition/depth section, peatland could be emitting 160,000 tCO2e per year. The opportunity for restoration is to abate most of these emissions and is discussed further in Peatland restoration section.
Natural Flood Mitigation
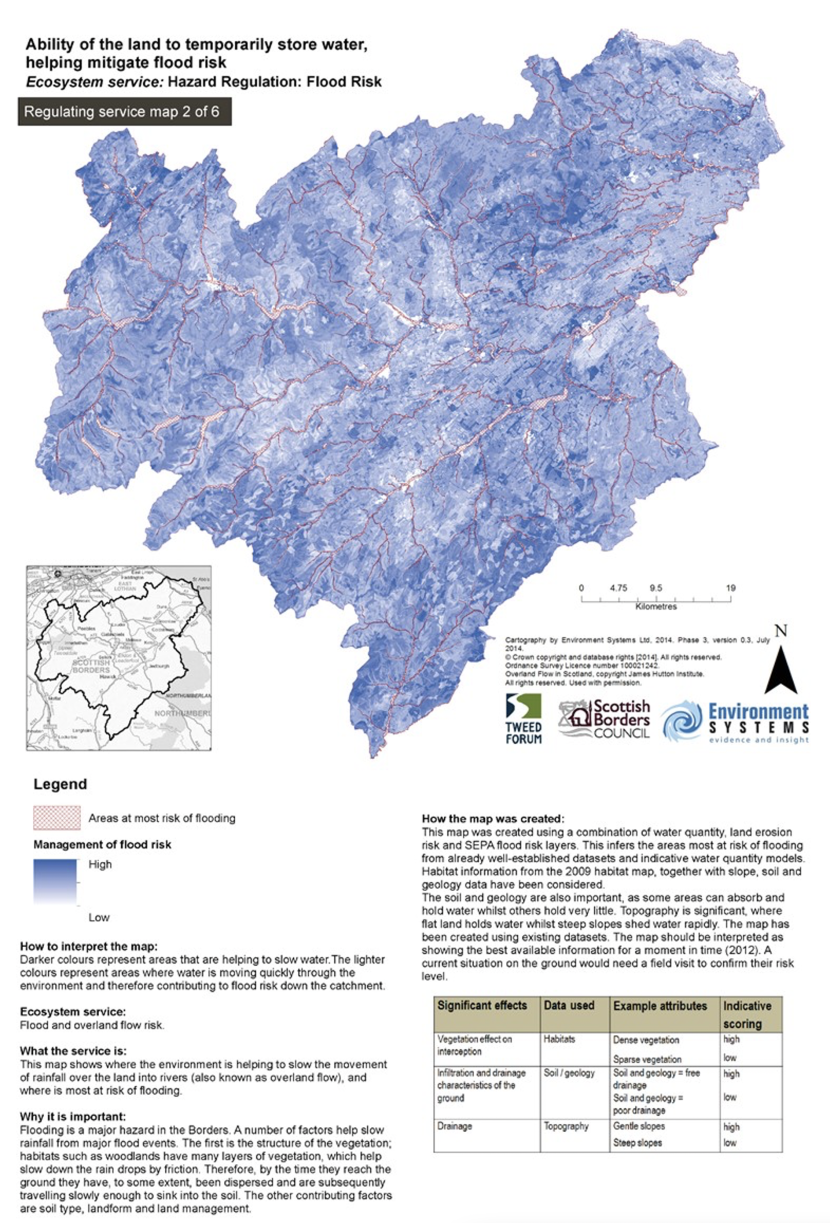
SEPA NFRA mapping identifies 6,700 properties at risk from flooding (roughly 11% of all households). Figure 3.5 shows that the main areas of flood risk lie along the Tweed and its tributaries. The map also indicates (in darker blue) that upland areas play an important role in slowing the flow of water and hence potentially a greater impact on reducing flood risk than many lowland areas, although some spatially targeted measures in lowland areas, such as temporary flood water storage areas and ponds can be effective too.
Recreation, Physical Health and Tourism
59% of adults residing in the Scottish Borders visit the outdoors for recreation at least once a week (Source: Scottish Household Survey – average for the years 2014-18). This provides an estimate of around 5 million recreational visits to green space made by local adults per year (Assuming adult population of 92,500, of which 61% visit the natural environment on average 1.7 times per week in line with MENE average visits per week in 2018). These visits can be valued for the welfare value derived by the visitors. In addition, a significant proportion (approximately half) of these visits will be active visits which will contribute to the physical health of the active visitor (Source: White et al., 2016, active visits defined as at least 30 minutes of vigorous exercise, and 51.5% of recreational visits were found to be active). The estimate for the number of active visits per year is 2.5 million.
Tourist statistics (Visit Scotland, 2019) highlight that around 3 million day visits are made to the Scottish Borders per year, plus around 1.2 million overnight stays per year. Whilst these visits cannot be wholly attributed to the natural landscape, the survey identifies that many of the recorded motivations for visiting can be related to natural assets (e.g. walking, adventure sports, wildlife watching, sightseeing in the countryside). Clearly the natural landscape plays an important role in attracting visitors to the area, and targeted improvements to specific natural capital could increase the number of visits (e.g. biodiversity for wildlife watching, water quality for fishing and aquatic sports, etc.).
The recreational fishing sector is worth £24 million per year in revenue and supports 500 jobs (source: SQW, 2015). Game fishing on the Tweed, (which has an international reputation for fly fishing) is focused on salmon (the main catch) and sea trout, but also some brown trout and grayling. There are around 80 beats on the Tweed which are distributed across all stretches of the river and its tributaries.
Air Quality
Nearly 500 tonnes of fine particulate matter (PM2.5) are estimated to be removed from air by woodland within the Scottish Borders (eftec and CEH, 2019). This provides a health benefit of over £1 million per year in reduced health service costs from respiratory diseases. This benefit represents the saving to the health service including avoided cases of respiratory hospital admissions, cardiovascular hospital admissions, and life years lost (reduced life expectancy as a result of long-term exposure) associated with changes in the concentration of PM2.5, but does not include the benefit of improved quality of life for individuals whose health is sustained by pollution removal. Given the rural character of the Scottish Borders, the air quality is generally good and hence the value of the benefit of pollution removal by woodland is not as high as the same woodland removing pollution in polluted urban areas.
Biodiversity
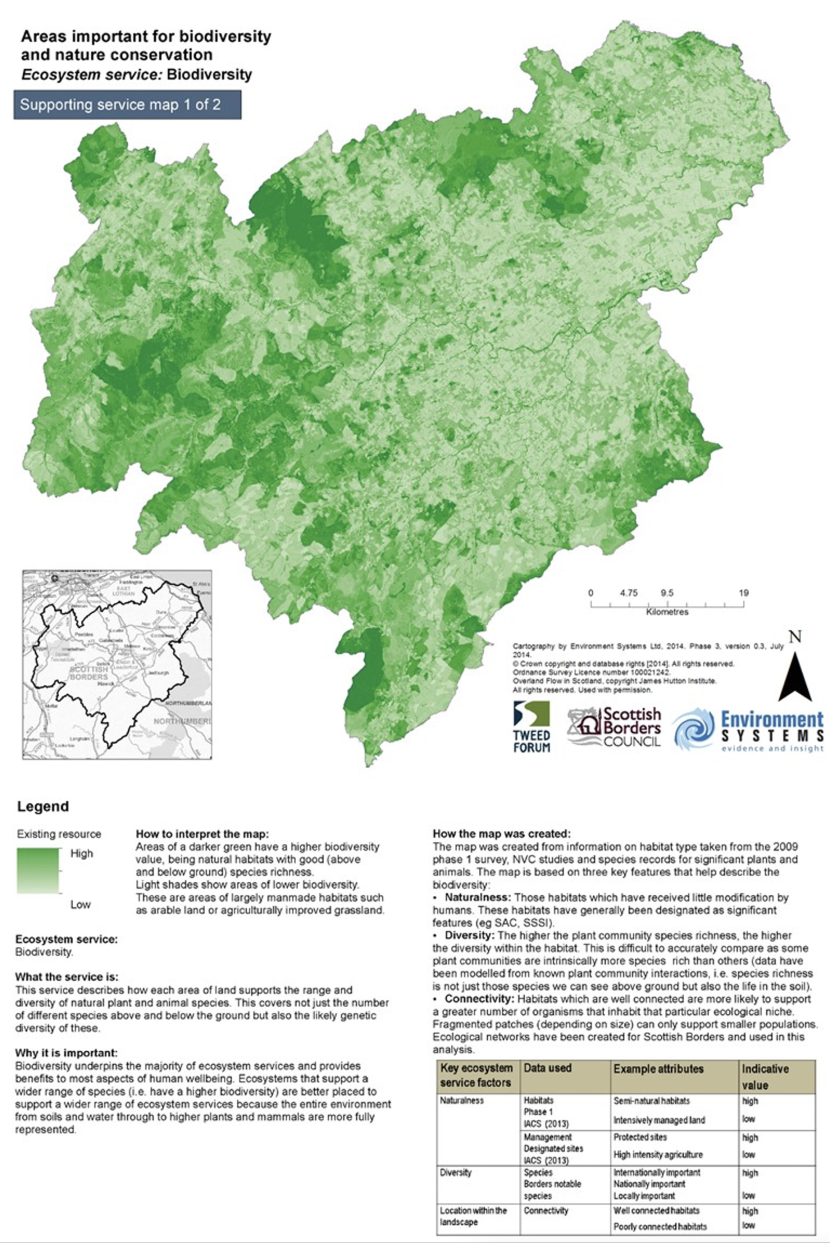
Biodiversity is difficult to capture in a single overall measure, and it is not realistic to expect this project to improve on existing biodiversity metrics. This project had to draw on existing environmental evidence, and the Land Use Strategy pilot in the Scottish Borders did produce a map (Figure 3.6) of the degree of naturalness of habitat and its biodiversity for the region which we believe is the best indicator available. (Naturalness was defined as those habitats receiving little modification, and generally being sites designated for significant features (SSSI etc). Diversity was assessed by the number of species present in a site. In contrast heavily modified areas, with low species diversity, are coloured in lighter shades of green.
The map shows that the areas of greatest diversity is in the uplands, although there are pockets of small sites of importance that are not visible at this scale, including the River Tweed which is an important SSSI and provides connectivity between areas of high biodiversity.
Ecosystem Service Value by Beneficiaries
Value of Ecosystem Services
Table 4.1 summarises the value of the main ecosystem service benefits provided by natural capital in the study area. Values have been assessed in various ways, including market based approaches (e.g. for provisioning benefits with established markets), avoided costs (e.g. for the carbon abatement benefits of carbon sequestration) and estimates of welfare value (e.g. recreational benefits for visits to the natural environment). Valuation methods are described in each of the subsequent sub-sections. The table includes estimates of the annual value of the current level of benefit provision, and a present value (PV) calculation based on an assumption of constant benefit delivery over 60 years (HM Treasury, 2013). The assumption of constant benefit provision needs to be treated with caution, as many benefits are vulnerable to the state of natural capital and future pressures such as climate change or changing population.
Table 4.1. Value of Ecosystem Service Benefits in the Scottish Borders
|
Benefit |
Annual Value (£ million) |
60 Year Present Value (£ million) |
|---|---|---|
|
Food production - crops |
47 |
1,230 |
|
Food production - livestock |
50 |
1,310 |
|
Timber production |
26 |
674 |
|
Renewable energy |
10 |
277 |
|
Water provision |
34 |
880 |
|
Carbon sequestration |
39 |
2,473 |
|
Peatland emissions |
(11) |
(718) |
|
Recreation & Physical health |
20 local recreation 9 physical health |
535 local recreation 347physical health |
|
Natural Flood risk mitigation |
Up to 0.3 annual average damaged avoided |
4 to 6.5 |
|
Tourism |
78 (spend to local economy) |
2,050 |
|
Air Quality |
1.2 |
31 |
The methods for evaluating these benefits are described in Annex 2 – Detail of Valuation Methods.
Beneficiaries
In considering who needs to be involved in decision-making about natural capital, and also who may be motivated to invest, it is helpful to consider the beneficiaries from particular ecosystem services and the potential beneficiaries from any future interventions.
Many different beneficiary groups derive value from natural capital. There are private benefits that flow directly to the owners of the natural capital (e.g. farm owners), and public benefits that are enjoyed by groups within or all of society (e.g. recreation in natural landscapes). Furthermore, some benefits can be directly related to natural capital (e.g. natural flood mitigation measures that protect homes in a flood risk area), and some are indirect (e.g. local employers benefiting from the productivity of a workforce with higher levels of health and well-being). The distribution of benefits is also important: some benefit mainly local people (e.g. natural flood mitigation) whilst others benefit people beyond the Scottish Borders (e.g. carbon sequestration).
Table 4.2 summarises the main beneficiary groups by benefit type. The benefit types are broadly grouped into provisioning, regulating and cultural services. In general provisioning services are easier to value based on market prices, whereas regulating and cultural services typically require modelling to estimate values. Beneficiary groups are split between those that derive a direct benefit from the service provided, and those that derive a secondary (or indirect) benefit from the service.
Table 4.2. Main Beneficiary Groups by Benefit
|
Benefit |
Direct Beneficiary Groups |
Indirect Beneficiary Groups |
|---|---|---|
|
Provisioning Services - Food production (crops & livestock) |
Local farmers |
Food & drink sector Local population via local economic impact, cultural identity |
|
Provisioning Services - Timber production |
Local landowners |
Scottish timber industry |
|
Provisioning Services - Renewable energy |
Landowners |
Energy companies Energy utility customers Any local community funds |
|
Provisioning Services - Water quality & quantity* |
Scottish Water, and direct water abstraction users Fisheries Water based recreation/tourism |
Water customers Wider society from water environment |
|
Regulating Services - Carbon sequestration |
Recipients of carbon credits |
Buyers of carbon credits Global society from equable climate Scottish Govt in progress to net zero |
|
Regulating Services - Air Quality |
Local population through health |
Heath service through lower treatment costs Local economy through workforce productivity & well-being |
|
Regulating Services - Natural Flood risk mitigation |
Households at risk Businesses at risk SEPA and Scottish Government |
Insurance industry Local population and economy through infrastructure resilience |
|
Cultural Services - Recreation, tourism and Physical health |
Local population Local tourist economy – outdoor activity providers, fishing and shooting |
Local economy through tourist spend Heath service through lower treatment costs Local economy through workforce productivity & well-being |
|
Cultural Services - Biodiversity** |
Visitors to natural environment Conservation NGOs Developers with offset requirements Educational groups (students & researchers) |
Tourist industry Wider society form indirect effects and existence value |
* Involves both a provisioning service (water quantity) and regulating service (water quality). As the beneficiary groups depend upon both, the two aspects are included in one item here.
** Biodiversity plays a vital role in providing the other benefits listed above. The benefit here refers to the benefit derived from direct and indirect enjoyment of biodiversity.
The above beneficiary groups can be represented by a wide variety of organisations in the local area, and an analysis of the most important players has been carried out by Tweed Forum as part of their Stakeholder Engagement Strategy (see Annex 3 – Stakeholder Groups Identified in The Tweed Forum LUS Stakeholder Action Plan). From this list the following beneficiaries have been recognised in Table 4.2, (farmers, foresters, government agencies, the Scottish government, NGOs, private businesses, and tourism organisations). The roles that have not been included are those that play roles in advising or representing interest groups (i.e. land management advisors, public and community groups, and elected representatives). These mediating roles perform important functions in consultation and decision making processes, and so must be considered in the development of investment options.
Beneficiaries will have varying degrees of interest in investing in local natural capital. Reasons for investing could be:
- To preserve and maintain natural capital assets and the benefits they deliver, in particular where these benefits may be subject to threats and pressures (e.g. climate change, habitat loss or land use change).
- To enhance natural capital benefits, where there is a clear case for improving benefit levels and/or sharing investment costs with co-beneficiaries (e.g. water users interested in water quality improvements, companies looking to offset emissions, developers seeking biodiversity improvements).
In the context of the Scottish Borders, the most likely scope for beneficiaries to consider investment is summarised in Table 4.3. The scale of the opportunities is developed further in Table 5.1.
Table 4.3. Beneficiary Interest in Natural Capital Benefits
|
Benefit |
Beneficiary groups |
Potential interest in natural capital investment |
|---|---|---|
|
Food production |
Local farmers Food & drink sector Local consumers |
Productivity of soil (preserve/enhance soil carbon, protect soil function and nutrient status, reduce erosion, compaction and run-off) Resilience to future climate change (drought and floods) Adapt output to new markets (land use change, but within the limits of local soils and climate) |
|
Timber production |
Local landowners Timber industry |
Productivity of woodlands Resilience to climate change (fire and pathogens) |
|
Renewable energy |
Landowners Energy companies |
Expansion of wind energy, whilst reducing conflict on location |
|
Water quality & quantity |
Scottish Water Water customers Fishing (recreational) |
Reducing diffuse pollution from agriculture Targeted woodland planting and management Improving fisheries |
|
Carbon sequestration |
Recipients of carbon credits Buyers of carbon credits |
Expansion of woodland Enhanced woodland management Restoration of degraded peatland Increased soil sequestration in farmland |
|
Natural Flood risk mitigation |
Households at risk Businesses at risk Insurance industry Local government |
Spatially targeted riparian woodland creation Increased infiltration of farmland soils Wetland creation and bog restoration River channel restoration to slow the flow |
|
Recreation, tourism and Physical health |
Local population Local tourist economy Heath service Local authorities |
Improved biodiversity and landscape Improved river environment Enhanced greenspace and access provision |
|
Air Quality |
Local population Heath service |
Spatially targeted woodland creation and tree planting (e.g. urban or close to pollution sources) |
|
Biodiversity |
Visitors to natural environment Conservation NGOs Developers (for offsets) Local authority (BD plans) |
Restore/create habitats of high biodiversity value Increase connectivity at landscape scale – e.g. Riverwoods along the River Tweed |
Key Investment Themes
Investment in natural capital assets can deliver a wide range of benefits, and the prospects for investment are enhanced where multiple benefits can be realised for any given investment. This section highlights the most significant areas for potential investment in the Scottish Borders.
The approach taken was to consider a broad range of interventions for the most significant natural capital assets and then group them into a manageable number of major opportunity categories (either by asset type or by main benefit type) for further analysis. Some items were not taken further forward (such as marine assets), whilst being important in specific areas these were relatively niche or small in the context of the study area. Major opportunity areas were then assessed by major benefit type taking the following factors into consideration:
- The level of stakeholder demand for each benefit, assessing both the current and potential level of demand locally, nationally and globally. This included the distribution of opportunities and demand across beneficiaries and over time, recognising that some benefits may take time to be delivered, and may have trade-offs with other benefits. (In this project we considered trade-offs within the study boundary. Where major export of negative externalities is a risk, then we flag that to policy makers).
- The feasibility of intervention, taking into account the science, technology, management tools and governance structures available to implement the change. The feasibility rating is a composite rating based on an assessment of the extent to which benefits can be predicted, achieved, measured and managed through practical governance processes.
- The scale and level of benefit that can be achieved across the Scottish Borders through natural capital improvement.
Investment Themes Summary
Investment themes can be focused on particular natural capital assets (Table 5.1) or on specific benefits (Table 5.2). These tables summarise the most significant investment themes in the Scottish Borders, and each is discussed in more detail in the subsequent sections. Note, the table refers to biodiversity offsets which are conservation actions intended to compensate for the residual, unavoidable impact on biodiversity caused by projects, to ensure at least a no net loss of biodiversity and, where possible, a net gain. Scottish policy in this area and the mechanisms for measuring and monitoring biodiversity are still under development but is for “positive effects for biodiversity from development” ref NPF4 position statement December 2020.
Table 5.1. Major Asset-Based Investment Themes
|
Opportunity Area |
Benefits |
Principle Demand |
Project Feasibility |
Potential Scale |
Potential Benefit |
|---|---|---|---|---|---|
|
Woodland creation |
Carbon credits
|
Net Zero: businesses - voluntary offsetting market Scottish Government Policy (net zero target) |
High: supported by Woodland carbon code
|
24,000 ha (5% of land cover) |
Circa 138,000 tCO2e sequestered per year (up to £600m PV over 60 years) |
|
Woodland creation |
Timber provision (for commercial woodland) |
Manufacturing sector, biofuel. |
High: Woodland grant scheme |
24,000 ha (5% of land cover) |
Timber (c.£33m PV harvesting 40-60 years) |
|
Woodland creation |
Woodland targeted for specific purposes (e.g. Riverwoods for biodiversity offsets, woodland & water quality. |
Water: See below Biodiversity offsets: Developers (e.g. infrastructure, wind) |
Medium: water quality is very context dependent. Biodiversity net gain policy under development - offsets supported by national & local planning policies |
24,000 ha (5% of land cover) |
Dependent upon specific intervention |
|
Peat restoration |
Carbon credits |
See Net Zero above Environmental NGOs |
Medium: Supported by Peatland Action grants Peatland code |
12,000 ha (subject to survey) |
150,000 tCO2e abatement per year (up to £660m PV over 60 years) |
|
Peat restoration |
Natural Flood Management (NFM) |
Local authorities, property owners/ occupiers, businesses |
Medium: highly spatially specific. |
12,000 ha (subject to survey) |
Dependent upon intervention |
|
Habitat creation & enhancement |
Enhanced /offset biodiversity Tourism (see below) |
Developers Environmental NGOs |
Medium to high: Current initiatives (e.g. Riverwoods, etc.). See Biodiversity Offset above |
Diverse opportunities (Riverwoods c 1,000ha) |
Dependent upon policy development and type of intervention. |
|
Farmland Management |
Food production |
Food & drink sector |
Low to Medium: Benefits low at holding level, requires reform of incentives to land management |
190,000 ha, 2,500 holdings |
Depends on land use change (above). |
|
Farmland Management |
Carbon sequestration (soil) |
Scottish Government Policy (net zero target) |
Low to Medium: Benefits low at holding level, requires reform of incentives to land management |
190,000 ha, 2,500 holdings |
Soil carbon significant if done at scale. |
|
Farmland Management |
Water quality |
Scottish Water, fisheries. |
Low to Medium: Benefits low at holding level, requires reform of incentives to land management |
190,000 ha, 2,500 holdings |
Dependent upon intervention |
|
Farmland Management |
Flood Risk Management |
See below |
Low to Medium: Benefits low at holding level, requires reform of incentives to land management |
190,000 ha, 2,500 holdings |
Dependent upon intervention |
|
Farmland Management |
Biodiversity |
See Biodiversity Offset above, Environmental NGOs |
See Biodiversity Offset above |
190,000 ha, 2,500 holdings |
Dependent upon intervention |
Woodland creation
The Scottish Government has a target to increase national woodland cover from 18% to 21% by 2032 (Scottish Government, 2021). In the Scottish Borders current woodland cover is 20%, but only a small proportion is native woodland (section 2.1). A target of 25% woodland cover is feasible for the Scottish Borders (equivalent to 24,000 ha of woodland creation). Furthermore, growth of the timber industry is an important economic development theme in the Borderlands Growth Deal strategy.
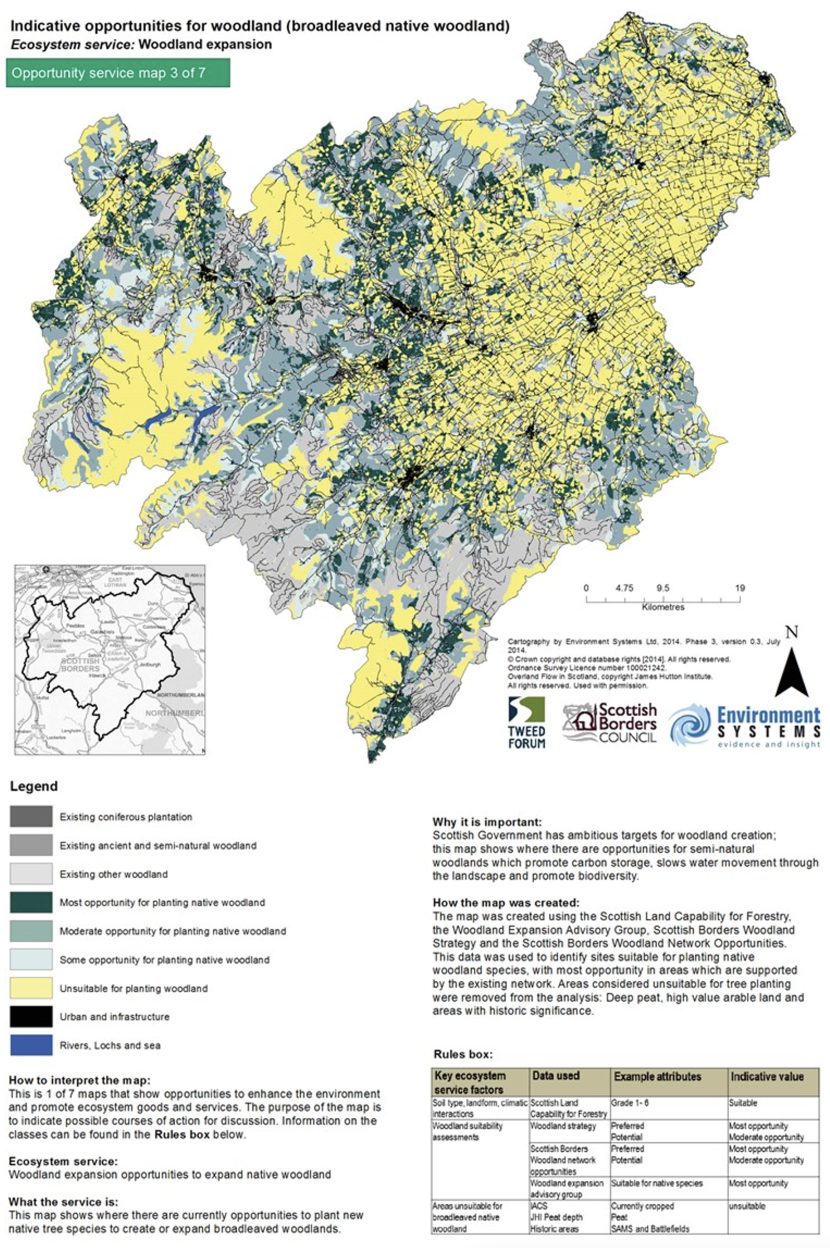
Key aspects of woodland creation decisions will be the type of woodland, location, use and benefits foregone from land use change. The land use strategy pilot identified the most suitable locations for planting coniferous woodland and broadleaf native woodland (Figure 5.1), avoiding sensitive sites (such as peatland) and areas of prime agricultural productivity.
Figure 5.1 illustrates the main areas for planting, with dark green areas being the most suitable. Areas in yellow are unsuitable for woodland planting, for a variety of reasons, such as avoiding planting on peat soils (in the uplands) and avoiding loss of prime arable land (in the lowland plain).
In addition to the provision of timber, woodland creation can be used to target the following benefits:
- Carbon sequestration
- Biodiversity
- Recreation
- Natural flood risk management
- Water quality
Carbon sequestration is a benefit provided by all woodland types and planting 24,000 ha can capture around 138,000 tCO2e per year (assuming UK average rate of woodland sequestration. (ONS, 2019) the actual quantity of sequestration will depend upon the species mix, yield and management regime of the woodland). Using the BEIS non-traded value of carbon (BEIS, 2018) abatement this benefit could be worth up to £600 million over 60 years, although the benefit depends crucially on the price of carbon sequestered.
Benefits associated with biodiversity, recreation, natural flood risk mitigation and water quality can be delivered by woodlands and are key aims within the Scottish Borders Woodland Strategy. These benefits are highly dependent on new woodland location, design and use and hence are difficult to estimate at a Scottish Borders scale. The Riverwoods initiative (pilot draft scoping paper provided privately by Tweed Forum) aims to deliver many of these benefits, with priority areas likely to include, the Upper Tweed, Ettrick and Yarrow, Teviot, Bowmont and Leader/Gala as they are either Priority Catchments for diffuse pollution, provide flood protection and/or build on the Borders Forest Trust core Wildwood area. The initial scoping exercise identifies around 200 km of riparian woodland planting covering and area of around 1,000 ha. Riparian woodland also provides some resilience to climate change, providing shade so reducing water temperature, and thus impacts of climate change on fish which could be particularly significant for the Tweed. There is growing evidence of the benefits of targeting upland streams with riparian tree planting to create temperature refuges for fish.
Woodland creation projects are well established in the local area and are supported by national grants, local planning policy and several local strategies (mentioned above). The voluntary market in carbon credits is supported by the Woodland Carbon Code (Forestry Commission, 2018a) which codifies the quantification and verification processes for carbon sequestration benefits from woodland creation projects. Consequently, this type of intervention is highly feasible in the local area.
The potential to attract further investment in new woodland through selectively and spatially increasing woodland grant levels with a locational premium could be very effective, supported by growing evidence of additional benefits from targeted planting.
Peatland restoration
Peatland restoration is mainly about stemming large emissions of carbon through rewetting and restoration, although this can deliver other benefits for biodiversity, regulating water flow and water quality.
There are around 22,000 ha of peatland in the Scottish Borders local authority. There is no comprehensive survey of condition in the local area, but assuming national level sample data (national sample data provided by Peatland Action project) is representative of the local area, then around 12,000 ha may be in drained or eroding condition and hence a priority for restoration, saving around 150,000 tCO2e of emissions per year. At this scale restoration costs may be in the range £25-45 million (source: estimate from NatureScot project team member J Uttley). Using the BEIS non-traded central value of carbon (BEIS, 2018) abatement this benefit could be worth an estimated £660 million over 60 years. Note that the non-traded carbon price is used emissions because emissions from land use, land use change, and forestry (LULUCF) falls outside the scope of the EU Emissions Trading Scheme.
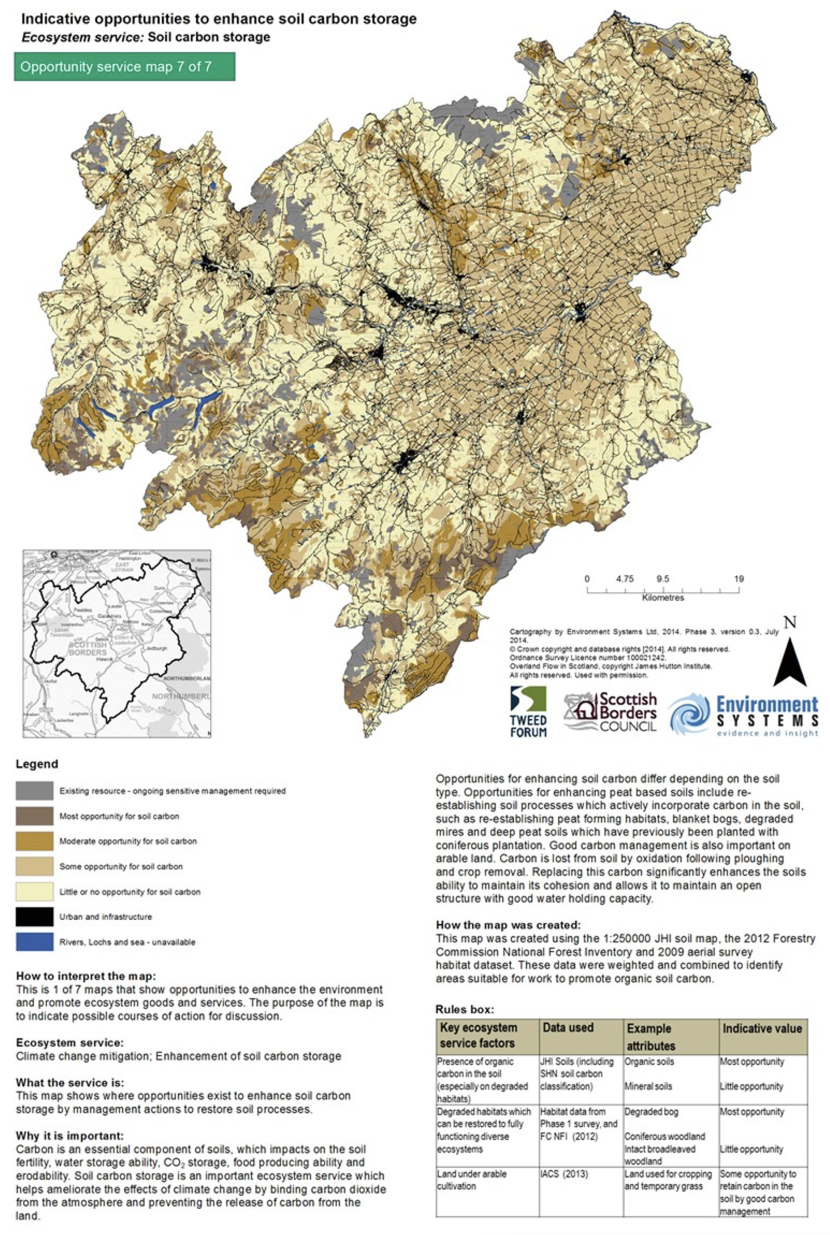
The location of opportunities to enhance soil carbon are shown in Figure 5.2. Existing high carbon stores are shown in grey and are mainly deep peat sites in the uplands. Areas with most opportunity to increase soil carbon are shown in dark brown, and these are mainly upland peat sites that would benefit from re-establishing peat form processes and restoring bog mires.
Restoration of peatland is supported by Peatland Action grants, and is a high priority for the Scottish Government. The voluntary market for carbon is supported by the Peatland Code (IUCN The Peatland Code, 2020) and the first project to use the Peatland Code was launched in the Scottish Borders. However, the Peatland Code is not yet as well established as the Woodland Carbon Code and requires survey work on the condition of peatland to be restored. Consequently, this type of intervention is rated here as medium in terms of feasibility but may become more important as governments prioritise peatland restoration as an important element of meeting net zero targets.
Biodiversity, Habitat Creation and Enhancement
Both local planning guidance (Scottish Borders Council, 2016) and the Scottish Borders Local Biodiversity Action Plan, highlight the need for integrated action to ensure the enhancement of an ecological habitat network, especially for highly fragmented or endangered habitats such as herb-rich grasslands and native woodlands. The River Tweed SSSI is also an important part of this network. 28 UKBAP priority habitat types are found within the Scottish Borders (Scottish Borders Council, 2016), and key habitats identified include:
- Woodlands – native woodland, wood pasture and parkland, upland cleuch and scrub woodland, coniferous woodland
- Wetlands – rivers and burns, lowland raised bogs, standing water, fens, marsh, swamp and reedbed,
- Upland – upland heath, blanket bog and montane
- Enclosed farmland and lowland grassland – calcareous and acid grasslands, rush pasture and boundary features such as hedgerows and arable margins
- Coastal – maritime cliff and slope
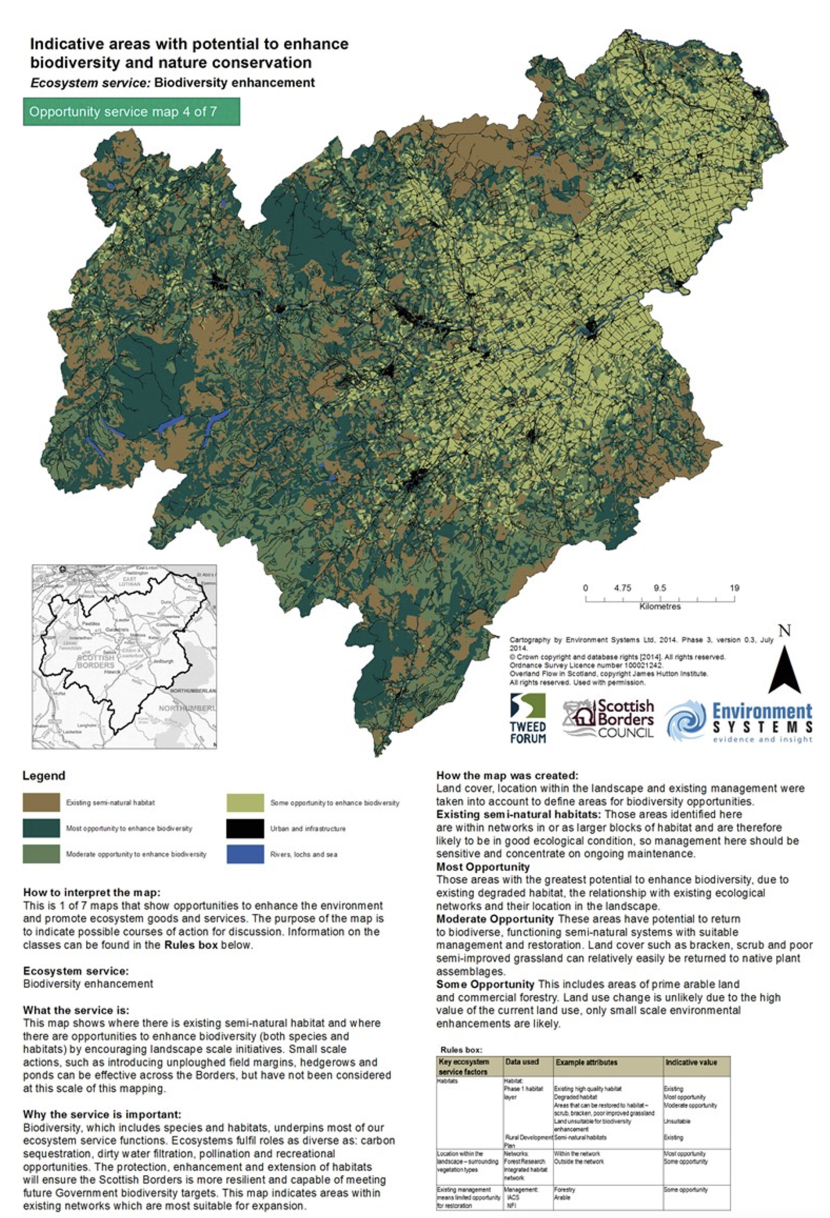
Figure 5.2 highlights those areas of greatest potential to enhance habitat and species diversity. Existing semi-natural habitat is shown in brown, and locations with greatest potential are shown in dark green. These areas offer the greatest potential for improvement by virtue of their connectivity to existing high quality biodiversity sites, and/or as an opportunity to improve existing degraded landscapes. Moderate opportunities for improvement are shown in mid-green, and areas of some opportunity in light green, the latter being areas of prime agricultural land or forestry that are unlikely to change land use, so are limited in the biodiversity enhancements possible.
This assessment of biodiversity enhancement potential aligns to the principles underlying biodiversity metrics used to measure the units traded in biodiversity offset markets, such as the Biodiversity Metric 2.0 in England. However, the exact market potential will depend on metrics/ rules adopted in Scotland.
Compensation payments provided by property and infrastructure (including renewable energy) developers to offset biodiversity losses arising out of new developments could present an important market opportunity. Local planning policy (the Scottish Borders Local Development Plan) requires that developers provide compensation for loss of biodiversity and several projects have been implemented since the policy was adopted. Biodiversity compensation schemes have the potential to accelerate investment in habitat creation and restoration through the formation of “Habitat Banks”, ecological restoration projects that generate biodiversity gains before developments impact on biodiversity, and can thus provide “off-the-shelf” options for developers looking to offset the environmental impacts of their projects. Over £1.7 million in development contributions from 8 schemes have been made to date (Private communication from SBC). Given that several schemes have been successfully completed in the local area, the feasibility of this type of intervention is rated as medium to high.
Farmland Management
Given that over 40% of the local area is used for arable food production or grazing on improved grassland (excluding other land used for rough grazing), farmland represents a significant opportunity to improve natural capital in the Scottish Borders. Food production depends upon the maintenance of the condition of soils and building resilience to future pressures such as climate change. Regenerative farming approaches also provide opportunities for improvement in the natural capital of farmland such as:
- Increasing soil carbon sequestration
- Maintenance of soils – avoiding erosion, compaction and run-off, which not only improves food production but improves resilience to climate change, avoids carbon emissions and impacts from sediment on water courses, and improves the water cycle and biodiversity.
- Biodiversity improvements (improved diversity of grasslands, planting hedgerows, trees, creation of field margins, wetlands)
- Provision for pollinators, through buffer strips and more diversity of plant species.
- Water quality – reducing diffuse pollution, and improving the water cycle
- Flood risk management – improving infiltration, temporary flood storage areas, targeted tree planting
These interventions are many and diverse. They also provide improvements on a small scale at farm/holding level, but these can be significant if implemented and connected across many holdings at regional level. Many of these opportunities may be realised through reform to existing agri-environment schemes, however some may be of significant scale to justify a stand alone investment project. There are 573 holdings over 200 ha in the local area (Scottish Government, 2020), some of which may be sufficiently large to offer interventions that can be feasible investments on a stand alone basis, or in small collaborations (e.g., 3 to 5 land holdings).
Natural Flood Risk Mitigation
Several flood risk mitigation projects and studies have been carried out in the local area. Notably, the Eddleston Water Project is a national long term study which aims to test and monitor the effectiveness of different Natural Flood Management (NFM) measures. To date, interventions include 207 ha of woodland creation, 2.9 km of re-meandering of the river, 116 flow restrictions and 28 run-off attenuation features. This study conducted modelling (Mott McDonald, 2020) to forecast the likely reduction in flood damages from further measures which included woodland planting (to 25% of the catchment), a further 2.9 km of re-meandering, and a four fold increase in flow restrictors and run-off attenuation features. The modelling predicted a 3.4% reduction in expected annual damages arising from these natural interventions. Whilst this study contributes to a better understanding of the natural features that provide flood attenuation benefits and improves forecasting of avoided flood damage costs, it is still not possible to forecast the scale of potential savings at the Scottish Borders level without conducting in depth modelling across the Tweed catchment.
There are over 6,700 properties at medium risk (one in 200 chance) from flooding in the local area (source SEPA flood risk maps). Using national level assumptions gives an annual expected flood damage of around £4.9 million (or £129 million discounted over 60 years). Based on the modelling results from the Eddleston study, this suggest that flood damages could be reduced by approximately 3-5% through spatially targeted natural flood risk measures, so saving around £3.9 to £6.5 million in present value of damages over 60 years.
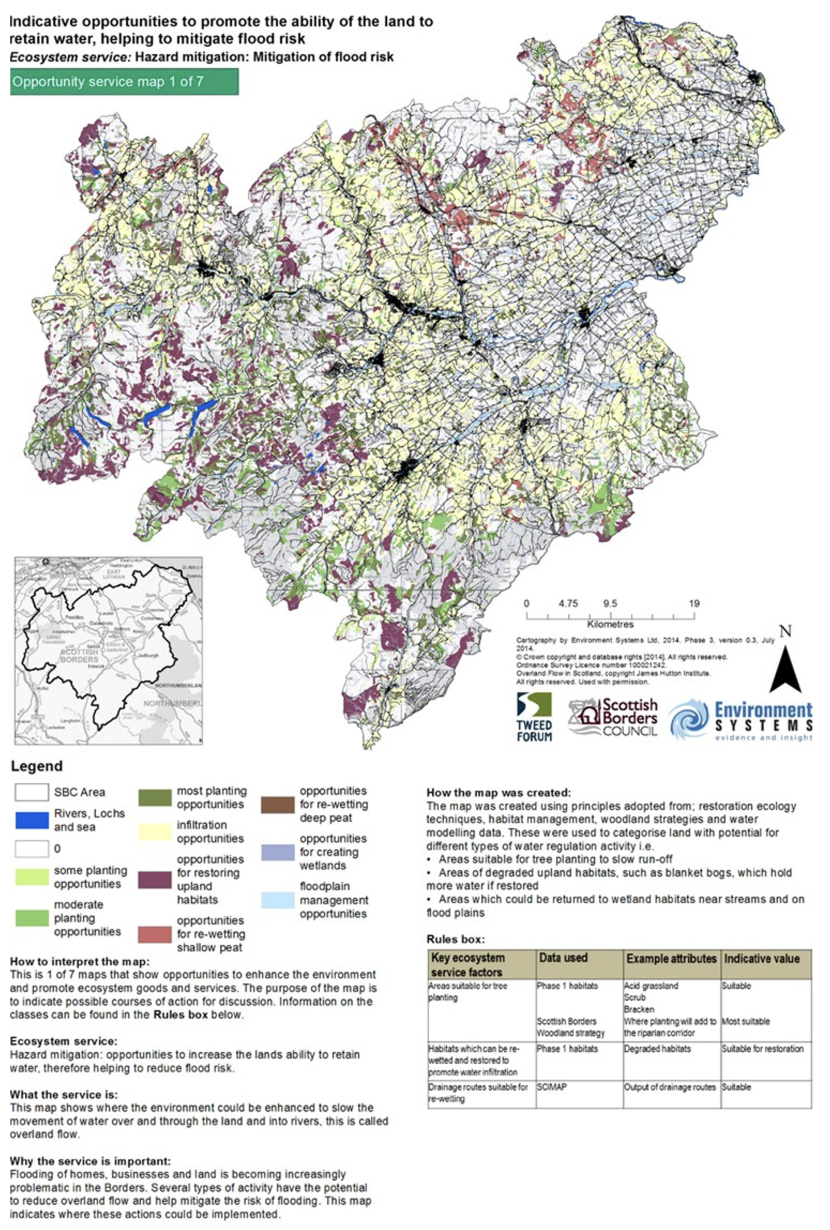
Relevant spatially targeted measures are reflected in the local land use strategy pilot, which mapped opportunities assessed for retaining water and so contributing to natural flood risk mitigation (Figure 5.4). These included:
- Re-wetting peat bogs in the uplands (coloured in brown)
- Tree planting in areas that slow the flow of water (coloured in shades of green, classified into most suitable as dark green, moderate in mid-green and some potential to slow run-off in light green)
- Areas which could be returned to wetlands near streams and on flood plains (in mauve)
- Areas where infiltration could be improved (mainly grazing land, coloured in yellow)
Water Quality
Opportunities to improve water quality are diverse and include:
- Maintenance and improvements to the management of agricultural soils avoiding; erosion, compaction and sources of diffuse pollution.
- Peatland restoration, avoiding discolouration and improving filtration
- New woodland planting, targeted at site that improve filtration and water quality
- Reducing pollution from point sources (such as wastewater treatment works) and urban run-off
The map in Figure 5.5. illustrates the extent to which the potential to improve water quality relates to the management of arable farmland (see overlap with the map Figure 3.1). However, given the broad range of interventions required to improve water quality, and that these investment opportunities are covered above (see Key Investment Themes section), it is recommended that the potential for improvement in water quality is pursued as a target benefit from these other investment themes rather than a major investment theme in its own right. Of course, sound investment cases that focus on water quality as the primary driver should still be encouraged and will improve the condition and benefits of natural capital in the area.
Tourism
Tourism statistics indicate that at least 2.1 million visits and £78 million of spending annually in the Scottish Borders is dependent on natural capital (see Annex 2: Tourism). There are particular tourist and recreational activities that have strong linkages to natural capital (including, wildlife watching, water based recreation, shooting and fishing). The recreational fishing sector is worth £24 million per year in revenue and supports 500 jobs (SQW, 2015). Game fishing on the Tweed, (which has an international reputation for fly fishing) is focused on salmon (the main catch) and sea trout, but also some brown trout and grayling. There are around 80 beats on the Tweed which are distributed across all stretches of the river and its tributaries. This sector depends crucially on the level and stability of catch levels over time, and there has been considerable variation in catch levels over the last 15 years. Fishing is inherently unpredictable, but salmon fishing is particularly so. Numbers of migratory fish entering the river system depend on complex mix of water quality, water quantity, riparian vegetation, stream morphology and lack of barriers to migration.
Shooting is also very important economically and significant money goes into managing the related habitats (mostly moorland and some woodland). Opportunities to link this spend to peatland restoration may support enhanced outcomes for biodiversity, water quality and flood risk mitigation as well as sports shooting.
The local area has a strong reputation for mountain biking. Glentress near Peebles is very popular and this outdoor activity is seen as a major recreational/tourist opportunity in the Borderlands Growth Deal. In addition, the local tourism sector can grow through investments in infrastructure to support walking (through creation of route such as that proposed by Destination Tweed), touring cycling (through improved cycle routes), and water sports (through improved access and mediation of conflicting uses).
The local tourism economy can benefit from a broad range of potential investments in natural capital. Notable asset opportunities include:
- Freshwaters and water quality to benefit the recreational fishing sector
- Provision of new footpaths to improve connectivity and variety of walking opportunities
- Enhancement of key sites of wildlife interest
- Enhancement of urban parks
- Creation of new habitats for recreational users (e.g. woodland for walkers)
Some local initiatives to develop these opportunities are already underway. The Destination Tweed project aims to create a 100-mile shared use trail from the source of the Tweed near Moffat, to Berwick upon Tweed. The project is forecast to cost £20 million to complete, and will help deliver multiple economic and environmental benefits to the local area.
The Go Tweed Valley Tourism Business Improvement District (TBID) has secured agreement to its business plan and is expected to launch in the coming year. The funding secured from the 120 tourism businesses within the scheme will be used to market the Tweed Valley as a tourist destination, promote local events and invest in local infrastructure.
The opportunities for growth in the tourism sector involve both growth in the number of visitors and through encouraging greater spend per visitor. Nature-based tourism is a growing business opportunity. Key strategic considerations will be identifying the capacity for growth in visits (i.e. recognising infrastructure limits and ensuring the rural character of the Tweed Valley is not compromised), and the sectors and activities to promote (e.g. fishing, walking, mountain biking, wildlife watching etc.). Growth in tourism business depends on a combination of many factors, such as quality of accommodation, travel infrastructure, quality of landscape etc, hence it is difficult to forecast growth arising from any particular investment. However, growth of 10% in turnover is a reasonable target for the area and assuming proportionate increases in economic activity would generate around £9m per year in GVA and could create 400 new jobs.
Renewable Energy
Twenty wind turbine schemes over 5 MW installed capacity are currently operational within the Scottish Borders Council area. The council has successfully implemented woodland and other habitat creation schemes to offset losses of habitat arising from impacts of these schemes. While there is further wind energy generation capacity in the area, it is difficult to forecast the potential for further large scale installations, as each application is dependent on securing the appropriate planning approvals, (analysis of SBC Windfarm Planning Application database form June 2020 indicates that 45% of applications (over 5 MW) have been refused or withdrawn). This is a complex process, and the location of installations will need to be carefully selected to avoid adverse outcomes (such as impacts on biodiversity) and potential objections (such as impairment to high value landscapes). Within the timescales of this study it is not feasible to identify the availability of suitable sites in the local area, the likelihood of securing approval and hence to forecast the likely potential for further onshore wind generation capacity.
It is worth noting that on-shore wind is a low cost renewable energy source and given government targets to meet net zero carbon targets, there will be considerable interest in this type of investment over the next 10-20 years. Also, given SBC experience in facilitating habitat offsets for such schemes, then the region is well placed to benefit from further development if sites can be sensitively located.
Conclusions
The intent of this report is that it will be used to help highlight the most significant opportunities for investment in natural capital in the Scottish Borders, both to preserve and enhance the benefits provided by that natural capital. This will be used in the next phase of the Facilitating Local Natural Capital Investment Initiative (and any future initiatives as required), seeking to support stakeholder engagement in identifying deliverable investment opportunities.
This characterisation report has highlighted the following as major features of the Scottish Borders area:
- The most significant land cover area as farmland and grassland (used for farming), woodland and moor, with the Tweed as a major feature of the local area.
- The condition of natural capital could be improved, including soil carbon, peatland condition, diversity of woodland (more native/broadleaf woodland), designated site status, enhanced biodiversity and water quality and water retention (quantity/flows/floods).
- The significant benefits provided by this natural capital include food production, timber production, water provision, flood regulation, tourism income, greenhouse gas regulation, renewable wind energy, recreation and physical health benefits.
- Local beneficiaries include farmers, landowners, the local economy from tourism, and the local population from reduced risk of flooding, the recreational and aesthetic benefits of the local landscape. Wider beneficiaries include buyers of carbon credits,
- The major opportunities for investment across a broad area include; woodland creation, peatland restoration, natural flood management, improved farmland management (such as regenerative approaches), and targeted biodiversity improvements. Other investments that are more specifically targeted include water quality improvements, and further wind generation.
References
AHDB-BBRO, 2019. Soil Biology and Soil Health Partnership.
BEIS, 2019. Green Book supplementary guidance: valuation of energy use and greenhouse gas emission for appraisal, Table 3.
BEIS, 2019a. Regional Renewable Statistics.
Committee on Climate Change. 2020. Land use: Policies for a Net Zero UK.
eftec, Environmental Finance Ltd and Countryscape, 2019. Greater Manchester Natural Capital Investment Plan, Eftec, SQW, CEH, ABPmer. Report to Oldham Council.
eftec and CEH, 2019. Pollution removal by vegetation.
eftec, 2019. UK Tourism and Outdoor Leisure account for Scotland, Eftec, SQW, CEH, ABPmer. The ecosystem contribution to tourism and outdoor leisure. Report to Defra, September 2019.
Entrade, 2020. Entrade.
Day, B.H. and Smith, G. 2018. Outdoor Recreation Valuation (ORVal) User Guide: Version 2.0. Land, Environment, Economics and Policy (LEEP) Institute, Business School, University of Exeter.
DEFRA, 2019. Biodiversity Net Gain and Local Nature Recovery Strategies.
Diffuse Pollution Management Advisory Group, 2017. Rural diffuse pollution plan for Scotland (2015-2021).
Evans, C., Artz, R., Moxley, J. et al., 2017. Implementation of an Emissions Inventory for UK Peatlands.
Forestry Commission, 2018a. Woodland Carbon Code.
Forestry Commission, 2018b. NFI provisional estimates for woodlands in the Borderlands.
Forestry Commission Scotland, 2013. Native Woodland Survey of Scotland. Scottish Borders Summary.
Forest Research. 2019. Timber Price Indices: Coniferous Standing Sales Price Index for Great Britain, Table 2.
Forest Research, 2020. NFI Woodland Ecological Condition in Scotland - Forest Research.
HM Treasury, 2013. Green Book.
IUCN The Peatland Code, 2020. The Peatland Code.
Mott McDonald, 2020. Integrating natural capital into flood risk management appraisal: Study Report.
NatureScot, 2019. Nature: the Proportion of Scotland's Protected Sites in Favourable Condition.
ONS, 2019. UK natural capital accounts: 2019.
ONS, 2020. Scottish Natural Capital Accounts: 2020.
Redman, G. 2018. The John Nix Pocketbook for Farm Management 2019. 49th Edition. Agro Business Consultants.
Scotland’s Soils, 2020. Peatland Restoration.
Scottish Borders Council, n.d. A Green Space Strategy for the Scottish Borders.
Scottish Borders Council, 2005. Scottish Borders Woodland Strategy.
Scottish Borders Council, 2014. Scottish Borders Pilot Regional Land Use Framework.
Scottish Borders Council, 2016. Local Development Plan, Volume 1 Policies.
Scottish Government, 2020. Climate Change.
Scottish Government, 2020. Scottish Agricultural Census: June 2019.
Scottish Government, 2020. Scottish agriculture tables - economic report: 2020 edition.
Scottish Government, 2021. Securing a green recovery on a path to net zero: climate change plan 2018–2032 – update.
Scottish Government, 2020. Scottish Biodiversity Strategy: Report to Parliament 2017 To 2019.
Sen,A., Harwood, A., Bateman, I., Munday, P., Crowe, A., Brander, L., Raychaudhuri, J., Lovett, A., Foden, J. and Provins, A. 2014. Economic assessment of the recreational value of ecosystems: Methodological development and national and local application. Environmental and Resource Economics, 58, 233-249.
Sepa, 2020. Water Classification Hub.
Sepa, n.d. Bathing Waters results for Scotland.
SQW, 2015. Economic impact from Angling on the Tweed river system.
Tweed Forum, 2015. Tweed Catchment Management Plan 2015-21.
United Nations, 2020. Natural Capital and Ecosystem Services FAQ.
Visit Inverness Loch Ness, 2020. Members Section.
Visit Scotland, 2019. Scottish Borders Factsheet 2018.
White, M., Elliott, L., Taylor, T., Wheeler, B., Spencer, A., Bone, A., Depledge, M. and Fleming, L. 2016. Recreational physical activity in natural environments and implications for health: A population based cross-sectional study in England. Preventive Medicine, 91, 383-388.
Annex 1 – Glossary
|
Term |
Definition |
|---|---|
|
BID |
Business Improvement District |
|
Biodiversity Offset |
Conservation actions intended to compensate for the residual, unavoidable impact on biodiversity caused by projects, to ensure at least a no net loss of biodiversity and, where possible, a net gain. |
|
Carbon trading |
Carbon trading and markets refer to the trading of carbon credits representing units (tonnes) of carbon dioxide. |
|
Ecosystem services |
The direct and indirect contributions of the natural environment to human wellbeing |
|
Green infrastructure |
Structures providing benefits from nature to people. Green infrastructure aims to enhance nature’s ability to deliver multiple valuable ecosystem goods and services, such as clean air or water, replacing or supplementing traditional infrastructure. |
|
GVA |
Gross Value Added, is the measure of the value of goods and services produced in an area, industry or sector of an economy. Defined by the value of output minus the value of intermediate consumption in producing that output. |
|
LENs |
Landscape Enterprise Network |
|
Natural Capital |
The earth’s stock of renewable and non-renewable resources including water, air and biodiversity. |
|
ORVal |
Outdoor Recreation Valuation Developed by the Land, Environment, Economics and Policy Institute (LEEP) at The University of Exeter. |
|
PM 2.5 |
Particulate matter with a diameter of 2.5 μm or less. |
|
Present Value (PV) |
The value of a future stream of benefits, discounted at an appropriate rate, to express the benefit stream as an equivalent sum in current date terms. |
|
Project developers |
Individuals, organisations, or businesses involved with designing and implementing projects to support woodland creation, and other ecological interventions |
|
SSSI |
Site of Special Scientific Interest. A conservation designation denoting a protected area in the United Kingdom. |
|
TBID |
Tourism Business Improvement District |
|
WFD |
Water Framework Directive. An EU directive which commits European Union member states to achieve good qualitative and quantitative status of all water bodies |
Annex 2 – Detail of Valuation Methods
Food Production
The arable production volumes estimated in Timber Production section were valued at the UK average gross margin per tonne of output (Redman, 2018). This margin represents gross sales value, less variable costs such as seeds, fertilisers, other inputs and harvesting costs. It does not include farm overheads or fixed labour.
Monetary value of livestock was estimated based on a UK average gross margin per cow for dairy and per breeding female for beef cattle and sheep (Redman, 2018). This margin represents gross sales value, less variable costs such as feed and veterinary costs. It does not include farm overheads or fixed labour.
Timber production
Timber output estimated in Timber Production section was valued at an average UK standing sales price of £31.40 per cubic metre (Forest Research, 2019). The standing sales price represents a margin to the owner which accounts for the contractors harvesting costs.
Renewable energy
Renewable energy generation was valued at the average UK resource rent of £7.08 per MWh used in the ONS Natural capital accounts (ONS, 2019). This value deducts costs of all resources used in generating energy such as a return on capital assets deployed.
Water Provision
Water provision is valued at the five year average (2014-18) UK resource rent of £0.40 per cubic metre used in the ONS Natural Capital accounts (ONS, 2019).
Carbon sequestration and emissions
All carbon flows (both sequestration and emissions) were evaluated at the central estimate of the BEIS non-traded cost of carbon abatement (BEIS, 2019). This schedule of values increases over time (from around £70/tCO2 in 2020 to £313/tCO2 by 2060), reflecting the rising costs of carbon abatement as efforts to mitigate reductions become more difficult and costly at higher levels of abatement. This schedule of cost abatement was developed in 2010 and is undergoing a major revision to reflect the latest UK targets (net zero by 2050) and to revise estimates of carbon abatement curves. An updated schedule is expected towards the end of 2020.
The key consideration for providers and buyers of carbon sequestration benefits is the level of payment that can be agreed for units of carbon sequestered. Current market prices are well below the non-traded abatement values, reflecting the early stages of the market. Issues of potential are discussed further in Woodland creation section.
Air Quality
Nearly 500 tonnes of fine particulate matter (PM2.5) are estimated to be removed from air by woodland within the Scottish Borders (eftec and CEH, 2019). This provides a health benefit of over £1 million per year in reduced health service costs from respiratory diseases (eftec and CEH, 2019). This benefit represents the saving to the health service but does not include the benefit of improved quality of life for individuals whose health is sustained by pollution removal. Given the rural character of the Scottish Borders, the air quality is generally good and hence the value of the benefit of pollution removal by woodland is not as high as the same woodland removing pollution in polluted urban areas.
Natural Flood Mitigation
To estimate annual average damage costs per property, the high and low damage cost estimates used in the HM Treasury Green Book guide (HM Treasury Green Book. Annex A2.22 p.66) were used as shown in Table A2.1. It was assumed that a less than 0.1m flooding event had a probability of 0.04 (one in 25 year return period) and a greater than 1.2m flooding event had a probability of 0.01 (one in one hundred year event). This produced an estimated annual average damage cost of £735 per property at risk per year.
Table A2.1. Estimated Average Annual Flood Damage Costs per Property
|
- |
Low (£) |
High (£) |
Average (£) |
Assumed Prob |
Annual average £ |
|---|---|---|---|---|---|
|
Typical damage per property, per flood event <0.1m |
7,000 |
10,000 |
8,500 |
0.04 |
340 |
|
Typical damage per property, per flood event >1.2m* |
37,000 |
42,000 |
39,500 |
0.01 |
395 |
|
Total |
- |
- |
- |
- |
735 |
The total annual average damage costs for the area was estimated as the product of the 6,700 properties at risk times the £735 average annual cost per property, giving £4.9 million per year. Over 60 years the present value of these damages would be £129 million.
These damages can be mitigated by a variety of solutions including engineering protection measures and natural flood reduction solutions. Selecting a mix of solutions to implement is a complex modelling task and is chiefly dependent upon specific characteristics of each location. However, modelling work from the Eddleston pilot and other studies suggest that NFM if properly targeted can mitigate around 3-5% of this damage cost. Therefore, the PV of potential damage costs avoided by NFM in the Tweed catchment could be in the order of £3.9 to £6.5 million over 60 years.
Note this estimate is for flood damages only and excludes evacuation and accommodation costs and mental health impacts.
Recreation and Physical Health
Around 5 million recreational visits are made by local adults to green space per year (see Recreation, Physical Health & Tourism section). These visits can be valued for the welfare value derived by the visitors and estimates of average welfare value per visit from ORVal (Day et al., 2018) and from studies such as (Sen et al., 2014) suggest £4 per visit as a reasonable estimate, giving an indicative welfare value of around £20 million per year.
Physical health benefits may be assessed by the avoidance of health treatment costs for diseases associated with inactivity (such as heart disease, diabetes and respiratory conditions). Studies of physical activity and avoided health costs indicate that 2.5 million active visits in the local area may save in the region of £8 million in health costs per year.
Tourism
Tourism statistics indicate 3.3 million visits to the Scottish Borders (including 1 million overnight stays) and spend of £124 million (Visit Scotland, 2019). This supported around 4,000 jobs and GVA of £92 million in the local tourism sector. A significant proportion of these visits and value is derived from natural assets (for example, the reported top three free attractions being Tweed Forest Park, St Abbs Head and Newcastleton Forest).
Table A2.2. Tourism Activity in the Scottish Borders
|
- |
Average Annual visits (2016-18) |
Average Annual Nights (2016-18) |
Average Annual Spend £ million (2016-18) |
|---|---|---|---|
|
Overnight tourists |
338,000 |
1,010,000 |
63 |
|
Day visits |
3,001,000 |
- |
61 |
|
Total |
3,339,000 |
1,010,000 |
124 |
eftec et al. (2019) estimated that for Scotland 63% of tourism spending was dependent on ecosystems, and the figure in the Scottish Borders and Tweed catchment (which are predominantly rural) is likely to be higher than this. This suggests that at least 2.1 million visits and £78 million of spending annually in the Scottish Borders is dependent on natural capital.
Annex 3 – Stakeholder Groups Identified in The Tweed Forum Lus Stakeholder Action Plan (Dated 2014)
The Stakeholder Groups:
- Farmers, including; land managers, land owners and tenants, as they produce food and manage the countryside. Representative organisations: National Farmers Union of Scotland, Scottish Land and Estates, Local Agricultural Discussion Societies and the Border Union Agricultural Society.
- Foresters, including private forestry companies as they produce timber products and fuel. Representative organisations: Confor, Forest Enterprise, Tilhill Economic, South Scotland Forestry Forum.
- Government (Statutory) agencies, as they have regulatory, planning and policy implementation roles. Representative organisations: Scottish Borders Council, Rural Payments and Inspections Directorate, Scottish Environment Protection Agency, Forestry Commission, Scottish Natural Heritage, Scottish Water, Historic Scotland.
- Environmental non-Government organisations, as they work in partnership with Government agencies. Representative organisations: Tweed Forum, Scotland’s Rural College, Game & Wildlife Conservation Trust, Scottish Gamekeepers Association, Royal Society for Protection of Birds, Southern Upland Partnership, Scottish Wildlife Trust, National Trust for Scotland, Borders Forest Trust, Woodland Trust Scotland, Tweed Foundation, Heather Trust, Bug Life, Bumblebee Conservation Trust, Plantlife, Soil Association, John Muir Trust, Butterfly Conservation Scotland, British Association of Shooting & Conservation.
- Land Management Advisors, consultants and land agents, as they provide advice to land managers. Representative bodies: Scotland’s Rural College, Edwin Thomson, Seed and Co, Farm & Business Records.
- Private businesses, as they contribute to the economic wellbeing of the area. Representative bodies: Federation of Small Businesses, Chambers of trade/commerce, Wind energy companies, Borders Machinery Ring, Scottish Renewables.
- Public and Community groups as they are the beneficiaries of many of the ecosystem service provisions Representative bodies: Community Councils, General Public (especially important at the case study level), Ettrick & Yarrow community, Area Forums, West Linton community initiative.
- Tourism Organisations, as money generated by tourists is highly significant to the local economy. Representative bodies: Visit Scotland, SBC (Economic Development Resources),
- Land Based Further Education Colleges & Research providers, as they educate and train the land managers of tomorrow Representative bodies: Scotland’s Rural College, Borders College.
Elected Representatives and Local Councillors, as they have the constitutional mandate to carry out the electorate’s wishes. Representative Bodies: MP’s & MSP’s, Scottish Borders Councillors, Area Forums.
Scottish Government – To be kept informed of progress.
