NatureScot Research Report 1274 - Survey of the Tayside Area Beaver Population 2020-2021
1. You can also read the 'Beaver Management Report 2020'
2. You can also read the latest Press Release
Year of publication: 2021
Authors: Campbell-Palmer, R., Puttock, A., Needham, R.N., Wilson, K., Graham, H. & Brazier, R.E.
Cite as: Campbell-Palmer, R., Puttock, A., Needham, R.N., Wilson, K., Graham, H. & Brazier, R.E. 2021. Survey of the Tayside Area Beaver Population 2020-2021. NatureScot Research Report 1274.
Keywords
Castor fiber, density models, Eurasian beaver, management, population estimates, population dynamics, Tayside distribution
Background
The Eurasian beaver (Castor fiber) has officially been accepted as reintroduced to parts of Scotland, and was made a European Protected Species in May 2019. Previous commissioned population survey work has demonstrated a growing population size and range (Campbell et al. 2012; Campbell-Palmer et al. 2018).
Beavers live in family groups, occupy water courses in a linear fashion, and defend resources within an active territory. Their distinctive field signs which can be mapped to determine presence, habitat use and population density. Accurate population counts are difficult to achieve, though mapping active territories is an effective measure of population change in range and size. Territory size varies greatly, with the average size recorded at ~3 km of water’s edge, with minimal overlap between territories (Herr & Rosell 2004; Mayer et la. 2020). In newly colonising populations, with poorer habitat quality, beaver territories are larger and more widely spaced. As beaver populations grow, infilling between the highest quality territories occurs and their highly adaptive habitat modification abilities see them utilise less favourable habitats. The size and number of beaver territories depends on several factors including the density of beaver populations, habitat quality, the number of family members and their settlement patterns (Campbell et al. 2005).
This study provides details of the latest survey carried out from late 2020 to early 2021. It describes the methodologies and results to determine the current distribution, territory number and associated population estimate. Evidence of a range of human land-use conflict issues were reported, along with evidence of increasing mitigation measures. Recommendations for future survey actions are made.
Main findings
- Beaver activity was recorded throughout large parts of Tayside, and to a lesser extent, Forth catchments. Colonisation of new catchments was not observed, despite sightings of individuals, although range has expanded.
- 251 active beaver territories were identified. This estimate is based on the mapping of field signs with territory boundaries determined through a combination of modelling and expert judgement. Given the close proximity and densities of some families in some river sections, it is possible that more than one family is present in some identified territories, leading to an underestimation of the number of beaver territories in those sections.
- The growth in territory number represents a 120 % (more than doubling) increase compared to the minimum of 114 territories reported in 2017/2018.
- A total of 118 dams, 178 lodges and 443 burrows were recorded
- Up to 20 % of a breeding beaver population can be comprised of singletons, which act as potentially large-distance dispersers. Such pioneer dispersers, especially those living on minor watercourses on the fringes and outside of the main surveyed area, may not be captured in these survey results as they can live relatively unobtrusively.
- Furthermore, some additional active territories are likely to exist within Tayside, especially on minor watercourses which were not covered in this survey given the considerable extent of such areas, many of which would not have held beavers.
- The beaver range had expanded from that recorded in the 2017-2018 survey although there was considerable variability in this in part due to some areas being abandoned, potentially due to licensed control.
Acknowledgements
Many thanks are due to the landowners and managers throughout the Tayside and Forth catchments for access and local information. We would like to thank Alicia Leow-Dyke, Coral Edgcumbe, Sam Wickens for their assistance in the field including many hours in the rain! A wide range of local interest groups also provided throughout the survey period, from bankside chats to providing site specific beaver records including but not limited to; NFUS and SLE members, reserve staff from RSPB, SWT, NatureScot, local fisheries, estate owners. We also thank RSPB and NatureScot staff at Loch Lomond National Park for assisting with access and the Mammal Society for providing additional beaver sighting records. Finally, we would like to thank Aileen Mill, who was the external reviewer, and NatureScot staff who provided constructive feedback that improved this report.
Introduction
Background
The Eurasian beaver, Castor fiber, was on the verge of extinction with about 1,200 individuals remaining in a scattering of isolated populations by the end of the 19th century (Nolet & Rosell 1998). Beavers have since recovered throughout much of their former range and are now thought to number >1.5 million, as a result of hunting regulation, protective legislation, permitting natural expansion and proactive translocations (Halley et al. 2020). One of the first known beaver translocations, from Norway to Sweden, occurred in 1922, and since then, there have been more than 205 recorded translocations which have returned beavers to 25 nations where they were formerly extinct (Halley et al. 2012). Such reintroductions have been a mix of official and/or unofficial/illegal releases, for example in Belgium (Verbeylen 2003).
Britain represents the very western extent of the Eurasian beaver range. The archaeological evidence of beavers, such as preserved gnawed timber and bones, carvings, fossil and historical references, testify to their former widespread occurrence throughout Britain (Conroy & Kitchener 1996; Kitchener & Conroy 1997; Coles 2006; Manning et al. 2014). While oral tradition suggests small numbers may have survived in and around the Loch Ness and Lochaber areas until the late 17th century, there is no further mention of their presence after this time (Coles 2006). The Eurasian beaver is therefore believed to have become extinct in Scotland, through over hunting, by the 16th century (Kitchener & Conroy 1997).
Beavers are highly territorial, living in family units which actively defend their territories largely through chemical communication and aggression. The active territory tends to represent the area a family will defend, whilst they can range over a larger area known as their home range. Beaver territories tend to be linear since the majority of beaver activities are mainly within 20-30 m of the shoreline (Donkor & Fryxell 1999; Haarberg & Rosell 2006) and range greatly from 0.2 km to >20 km (average 3 km) in shoreline length (Campbell et al. 2005; Mayer et al. 2020; see 2.3.1). In poorer quality habitat beaver territories are larger and more widely spaced. The size and numbers of beaver territories depends on a number of factors including the density of beaver populations, habitat quality, the number of family members and their settlement pattern (Campbell et al. 2005).
Both Eurasian and North American, C. canadensis, beavers tend to colonise suitable habitat in a linear manner (i.e. dispersal generally follows water courses), though they are capable of travelling over land between catchment basins (Halley et al. 2012; Simunková & Vorel 2015). Watershed divides can act as dispersal barriers, but this varies greatly on topography, and will depend on their ability, for example, to travel over land, via the sea or walking around waterfalls (Halley & Rosell, 2002; Halley et al. 2013). Dispersal distances for individuals can range from a few kilometres to tens of kilometres, depending on a range of factors including population density and habitat availability (Zurowski & Kasperczyk 1990; Fustec et al. 2001). It has been estimated that approximately 80% of dispersing beavers attempt to establish territories within 5 km of their natal territory (Nolet & Baveco, 1996), though much greater distances (80km+) have been recorded.
The case for reintroducing the Eurasian beaver to Scotland has been debated for over 20 years. Beavers and beaver reintroduction issues are summarised in the Scottish Natural Heritage (SNH) ‘Beavers in Scotland’ report to Scottish Government (Gaywood 2015). May 2009 saw four Norwegian beaver families released into the Knapdale Forest of Argyll, as part of the officially sanctioned Scottish Beaver Trial (SBT). The official beaver trial concluded in 2014, but by then beavers resulting from unauthorised releases and escapes in the east of Scotland far outnumbered the official release. After much controversy, debate and research the Scottish Government announced in 2016 they were minded to allow beavers to remain in Scotland, with the Knapdale and Tayside beaver populations later becoming formally protected as a European Protected Species (EPS) in May 2019. This was a historic turning point, the first formally accepted mammal reintroduction anywhere in the UK. Unauthorised releases or escapes from enclosures have seen small numbers of beavers present in other parts of Scotland, SW and SE of England, and more recently Wales, since the early 2000s. The wider restoration of this species and the positive ecological services its activities can create has generated much interest and excitement in the conservation and wider public community (Brazier et al. 2020a; Law et al. 2016, 2017; Stringer & Gaywood 2016). However, certain land management sectors and interest groups have strong concerns as beaver’s habitat modifying abilities and activities can be challenging, and their management can require resource investment in modern, heavily modified landscapes.
The SBT, Tayside Beaver Study Group, Beaver-Salmonid Working Groups all published their findings in 2015, and these were collated in the Beavers in Scotland report. These, along with ongoing data collection and research (with research projects running since 2015), landowner and interest group engagement through the Scottish Beaver Forum and the NatureScot Beaver Mitigation Scheme has generated a range of information and experience that has been used in the decision-making process regarding beaver presence and management in Scotland. The Scottish Government stated in 2019 that beaver populations in Knapdale, Argyll and the Tayside catchment (including the Earn, referred to as Tayside in this report) would be protected and allowed to extend their ranges naturally, but that further unauthorised releases would be an offence and not permitted at present. The NatureScot Beaver Mitigation Scheme was established to provide mitigation advice and support to various landowners and interest groups. A management framework has been developed in which a range of beaver mitigation tools and interventions can be provisioned including tree protection and dam management. Under specific circumstances certain landowners may apply for a licence for lethal control. In the first year of protection, 39 lethal control licences were issued provided specific criteria were met resulting in a reported 87 animals dispatched (NatureScot 2020). The Scottish Beaver project in Knapdale translocated an additional 21 animals to augment the population between 2017-2019, the majority of which were sourced from wild born beavers in the Tayside catchment (Dowse et al. 2020). Further animals have been translocated under license to official projects in England and Wales, for example River Otter Beaver Trial, Devon and Montgomeryshire Wildlife Trust, North Wales, from Scottish sites in which lethal control licensed were issued. While such projects exist, this have been generally accepted by landowners as a positive mitigation tool and an alternative to lethal control.
Both protection and lethal control measures will undoubtedly influence future beaver population dynamics. Since the population arose as a result of unauthorised releases, precise numbers of animals released, sex ratios and survival data remain unknown, along with any previous culling records. The Forth catchment appears to have been colonised from the Tay and Earn catchments naturally. Beavers colonising the Tayside and Forth catchments form the largest population currently in Britain.
Overall, the Tayside catchment landscape spans an area ca. 5,000 km², with extensive areas of prime agricultural land. Urban areas also lie in the lowlands and flood plain, with large areas of the riparian zone used as salmon fishing beats. Further up the catchment, land-use is a mosaic of mixed agriculture, deciduous and plantation forest. The extensive network of rivers and burns throughout the Tay catchment is vast by UK standards and have a total combined length of over 5,000 km. Several standing waters also dominate the landscape and range in size from small ponds to large lochs utilised for recreational purposes such as fishing, wildlife-watching, boating or shooting waterfowl (TLBAP 2016). Many freshwater areas are designated sites for natural heritage interests throughout the catchment, for example, Sites of Special Scientific Interest (SSSIs), Special Areas of Conservation (SACs) and Special Protection Areas (SPAs), thereby tending to offer favourable habitat for beavers, including wetlands, marshes and reed beds.
The Forth catchment is comparable, spanning ca. 3,600 km², with an estimated 2,880km of water course length, and the River Forth being the 7th longest river in Scotland (https://forthriverstrust.org). This area spans the central belt and was formerly very industrialised and polluted. The River Forth rises in the Trossachs, a major part of a wooded national park, meandering widely over the flat, intensively farmed floodplain around Stirling before draining into the North Sea. Arable farming dominates land use, followed by improved grassland and significant urban areas. Artificial water obstructions are fairly numerous throughout the catchment. This catchment has fewer large lochs outside the Loch Lomond and Trossachs area, with numerous tributaries mainly draining directly from the hill and mountain ranges, such as Uamb Bheag and the Gargunnock and Ochil Hills, into the Forth itself. Significant rivers, such as the Allan Water and River Devon lie closest to potential beaver dispersal routes from Tayside via the River Earn tributaries. There are additional potential links via Lochearnhead into the Trossachs.
The scope of this report is not to provide a comprehensive population estimate and distribution mapping for beavers across the whole of Scotland. The main aim of this report is to provide a detailed overview of beaver activity in the Tayside and Forth catchments as completely as possible, rather than to record every sign of beaver activity. it is rare for complete surveys of animal species populations (particularly when they are more widely dispersed) to be carried out - as such the approach applied here and in previous comparative Tayside surveys is intensive by most standards. Given the extent of the watercourses (in particular lower order burns and extensive artificial drainage systems) it was not physically possible to survey every freshwater section. The survey was as robust and comprehensive as possible, with optimal habitat and known beaver areas investigated. However, it should be noted that both this and the previous 2012 and 2017-2018 surveys may underestimate beaver territories given the extent of potential colonisable habitat, along with the existence of undetected dispersing individuals. Higher order water courses, areas of known or recently reported beaver activity and areas of suitable habitat were prioritised even though beavers may occupy minor and artificial water courses, especially in areas of higher population densities.
Active beaver territories were also recorded outside the original Tayside area of interest (both in the last 2017-2018 survey and since), thereby capturing their spread into the Forth sub basin and beyond and providing a contemporary overview of the range of beavers originating from the Tay. Areas surveyed outside Tayside were largely based on previous reports of beaver activities. However, as in 2017-2018, the report highlights that beavers are now expanding their range outside Tayside, namely on the Forth catchment.
An initial beaver population survey was undertaken in 2012, this estimated 38-39 active family groups were present in Tayside (Campbell et al. 2012). A second survey was undertaken in 2017-2018, in which a minimum of 114 active family groups and a conservatively estimated population of 433 individual beavers was reported (Campbell-Palmer et al., 2018, 2020). Ongoing beaver conflict concerns, primarily in agricultural areas of Tayside, together with an over-arching need to assess the current conservation status of beavers, led to the request for an updated population survey. This study provides details of a third survey carried out from October 2020 to March 2021. This report describes the methodologies and results of this resurvey to determine the current distribution, territory numbers and associated population estimate. Recommendations for future research and potential management strategies are made.
Objectives of the study
- To undertake a field survey (focusing on the Tay and Forth catchments) that will enable beaver field signs present in 2020-2021 to be recorded and mapped, the locations and numbers of likely occupied beaver territories to be established, and the spatial range of beavers to be estimated in the relevant catchments.
- To provide digital outputs that includes suitable georeferenced data compatible for GIS, and for future use in relevant national biological databases.
- To allow for a direct comparison of survey results from the current survey with the results from the 2012 survey and the 2017-2018 survey in particular noting changes in territory numbers (and therefore beaver numbers) and range etc.
Methods
Field Surveys
Survey Area
The survey area was based on all confirmed records of beaver activity from 2012 to 2021. It encompassed all the rivers and lochs within the Tay and Earn catchments with confirmed records, plus relevant riverine sections of the adjacent catchments which beavers were known to have recolonised from the Tay and Earn catchments – including riverine sections/water bodies in the Fife area, Forth catchment, Loch Lomond area etc.
This survey area included those areas surveyed previously in 2017-2018. The survey area was then expanded to include water courses with suitable habitat (based on hydrology and vegetation availability, and with reference to mapping resources including OS maps and NatureScot Potential Beaver Woodland and Potential Core Beaver Woodland datasets, Stringer et al. 2015) beyond the points beavers had been previously found, plus additional areas in which beavers have been reported since 2017-2018. This survey prioritised the coverage of the main Tay catchment rivers, namely the River Tay, River Earn and River Isla and their major tributaries as far as possible. This survey also sought to cover more of the agricultural ditch systems in areas often identified as having beaver conflicts, for example the Dean Water, Meigle Burn etc within the Tayside catchment. Additionally, areas beavers had been previously recorded outside of Tayside, namely the Forth and Fife area, were prioritised for survey of presence or absence, with survey areas increased in response to field sign presence. Additional survey effort was made to determine if beavers were present in the South Esk catchment, judged to be the next catchment most likely to be colonised.
Survey Methods
Beavers display quite distinct and obvious field signs, although at low densities and within more naturalised water courses these may be relatively inconspicuous and be missed or mistaken for other species. Mapping field signs can help to identify beaver distribution, allow an assessment of their habitat use and an estimation of the number of active territories present within an area.
Beaver activity was recorded by following the methods presented in Campbell-Palmer et al., 2018, 2020 (building upon those used in Campbell et al. (2012)) to allow direct comparison with the previous beaver distribution studies in Tayside.
Field surveys were conducted between October 2020 and March 2021. As far as possible, water courses were surveyed for field signs for at least 2 km from the last recorded beaver field signs (either upstream or downstream) or until suitable habitat ended, for example at steep waterfalls, open moorland or significant hydroelectric dams. Additionally, some sites were surveyed based on reports of beaver activity. Prolonged flooding and snow cover hampered survey efforts and restricted access to Tayside and Forth catchment areas during late January to mid-February 2021.
Field surveys involved surveying a water course from either canoe or on foot depending on water course suitability and accessibility. The majority of this survey was undertaken on foot. As noted in Campbell et al. (2012), canoe surveys are more likely to reveal more waterside activity with the potential for underreporting inland activity, whilst the opposite tends to be true for surveys on foot. However, this is highly dependent on the structure and size of the watercourse, and the extent of bankside vegetation growth.
For each survey point the following data were collected.
- Activity type (Sign)
- Ordnance Survey (OS) grid reference
- Photo No. (if appropriate)
- Estimated age (fresh, old or mixed)
- Dam dimensions
- River or waterbody name
- Land use (dominant along water course and surrounding area i.e., within 100m radius)
- Beaver activity effort (low, medium or high)
- Management impact (NA, low, medium or high)
- Any other comments
- Recorder initials
Beaver field signs (see Table 1 for type of signs recorded) were logged as point data using GPS equipped mobile phone devices (iOS and Android) using the Avenza Maps mapping app (Avenza Systems Inc. version 3.13.1). This allowed the same core data to be collected as in 2017/2018 allowing direct comparison with previous surveys but in a standardised format reducing the change of transcriber error or variation between different surveyors or devices. All data was collected in the mobile app before being transferred via email for backup and processing.
‘Beaver activity effort’ (an estimated measure of energy expended by beaver in creating a recorded feeding sign) was categorised as low, medium or high. New dams and lodges were classed as involving high levels of effort, new burrows ditches as medium effort, while effort expended on feeding varied (see Table 2). Other signs were classed a low effort.
‘Management impact’ was categorised subjectively based on the perceived impact at the time of survey as: ‘NA’ if impact was deemed imperceptible with no mitigation required; ‘low’ if affecting a small area and/or could have been easily mitigated without excessive costs or resources (e.g. small scale tree felling); ‘high’ if a large area was affected and/or mitigation was resource intensive (e.g. flood bank collapse, multiple collapsed burrows or flooding of large area of crops); with ‘medium’ ranging between these. Measuring this impact involves a level of subjectivity, so the perceived impact was recorded by surveyors as far as possible using a simple score of ‘NA’, ‘low’, ‘medium’, or ‘high’, without obtaining the views of the landowners/managers in question. It is also important to note these were signs that ‘could’ have management implications rather than where actual management implications had manifested themselves. As such, given the management focus within Tayside this survey expanded beyond the criteria stated in the 2017-2018 survey, in which only clearly obvious management issues were logged. In this survey (2020-2021), such occurrences were consistently logged as ‘high’, whilst ‘low’ management issues generally included low scale, non-crop tree impacts or circumstances that may lead to perceived or minor management issues if left unchecked.
The ‘sign’ types recorded were the commonly recorded field signs of beaver activity that can be robustly identified by an experienced survey team (see Table 1).
| Code | Sign | Description |
|---|---|---|
| C | Woody Feeding | Cutting or gnawing of woody vegetation (shrubs, saplings and trees) |
| H | Soft Feeding | Feeding on herbaceous vegetation |
| Ag | Crop Feeding | Feeding on agricultural crops. The affected was measured as m2 |
| D | Dam | Dams were classified as active/maintained or old/breached. Height and width were recorded in m. |
| Ca | Cache | Cut, stored woody vegetation |
| Di | Canal/Digging | Beaver digging into substrate or creation of canals leading inland to access more foraging grounds |
| Bu | Burrow | Entrances are usually below normal water levels and can extend inland forming complex underground systems |
| L | Lodge | Dwellings where the nest chamber protrudes from the surface and has been built up using sticks and mud |
| SM | Scent Mound | A pile of material (usually mud) scraped together by the beaver on which a distinctive scent (castoreum/ anal-gland secretion) is deposited |
| SS | Scent Site | A small area of concentrated multiple scent mounds |
| FS | Feeding Station | This is a location at the edge of the water to which a beaver repeatedly takes, for consumption, material obtained elsewhere |
| FT | Feeding Trail | Created by the frequent passing of a beaver from the water to a location inland |
| Effort category | Woody feeding | Soft/Crop feeding |
|---|---|---|
| Low | <20 cut stems all <7cm diameter or < 10 hands of bark stripping | <10 noticeably cut individual stems or <10 hands area of grazed vegetation |
| Medium | >20 cut stems any >7cm diameter or >10 hands of bark stripping | 10-20 noticeably cut individual stems or 10-20 hands area |
| High | >20 cut stems any > 20 diameter either felled or incised | >20 noticeably cut individual stems or >20hands |
Surveyed area
A total of over 1,760 km of connecting water course bank (river, burn, loch etc.) and 1,238 non-contiguous water course bank spot checks were surveyed over a period of over 220 person-days (Figure 1). Reports of beaver sightings from the Scottish Beaver Forum members (e.g. National Farmers Union Scotland, Scottish Land & Estates, Scottish Wildlife Trust and Scottish Wild Beaver Group), South Esk Fisheries, Loch Lomond & The Trossachs National Park, RSPB, and members of the public (largely via NatureScot Local Area Office record keeping and via the Mammal Society’s Mammal Mapper smartphone app and iRecord mammal sighting form), were also investigated as far as was feasible.
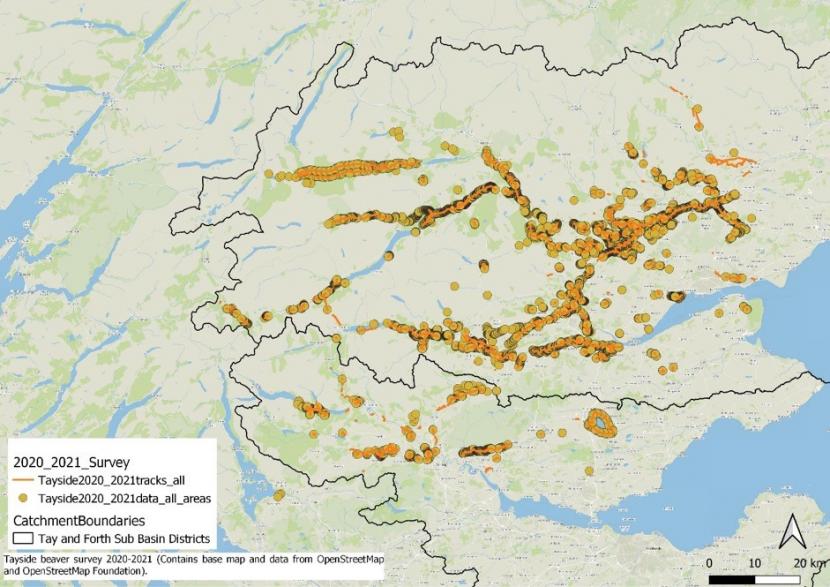
A map of Tayside survey area showing locations surveyed by team in 2020 and 2021. Basemap data © OpenStreetMap contributors with data available under the Open Database License.
Data processing
Field data collected as outlined in Section 2.1. were quality assured, processed and backed-up weekly. All subsequent mapping was undertaken in QGIS 3.16.4 (QGIS.org. 2021) and R 4.0.4 (R Core Team (2021). Figure 3 provides a workflow summary of the data processing and analysis. In addition to primary data collected as part of the field survey, previous survey data and associated datasets held by NatureScot were supplied for analysis under GIS Data Supply licence 83737. All backdrop mapping layers used OS data (Crown copyright and database right, 2020) or open access Open Street Map data (copyrighted OpenStreetMap contributors and available from https://www.openstreetmap.org) and Google satellite imagery: Open-Source Google imagery © OpenStreetmap (and) contributors CC-BY-SA.
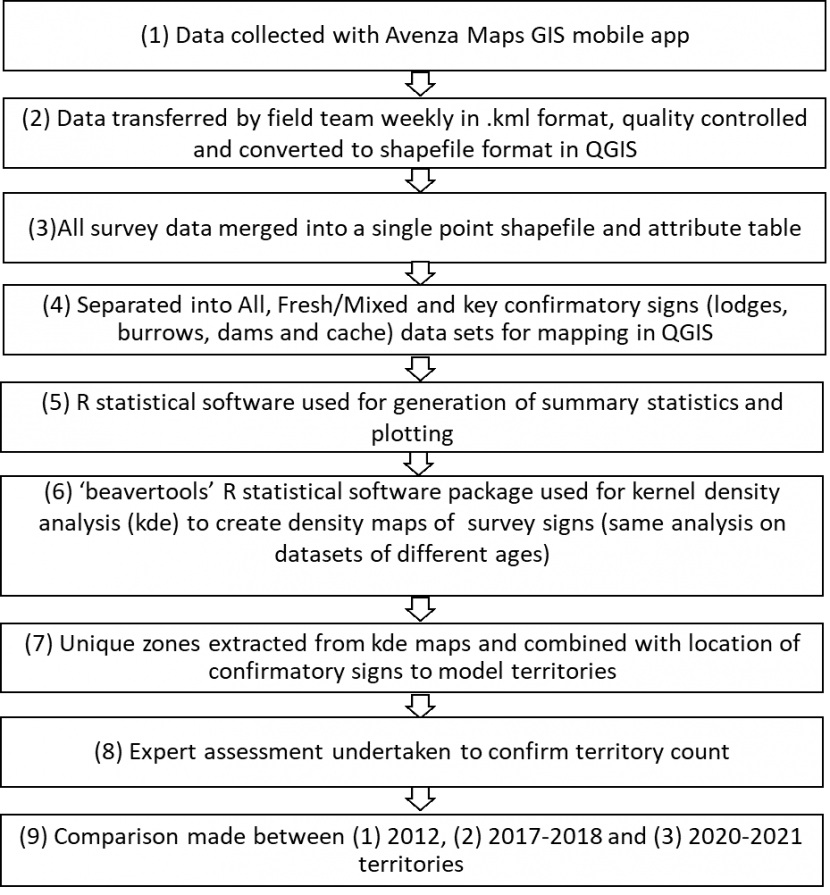
The methodology used in this survey is condensed into a flow chart comprising 9 key stages. (1) Data collected with Avenza Maps GIS mobile app (2) Data transferred by field team weekly in .kml format, quality controlled and converted to shapefile format in QGIS (3) All survey data merged into a single point shapefile and attribute table (4) Separated into All, Fresh/Mixed and key confirmatory signs (lodges, burrows, dams and cache) data sets for mapping in QGIS (5) R statistical software used for generation of summary statistics and plotting (6) ‘beavertools’ R statistical software package used for kernel density analysis (kde) to create density maps of survey signs (same analysis on datasets of different ages) (7) Unique zones extracted from kde maps and combined with location of confirmatory signs to model territories (8) Expert assessment undertaken to confirm territory count (9) Comparison made between (1) 2012, (2) 2017-2018 and (3) 2020-2021 territories
Territory estimation
Overview
Beavers are highly territorial and will actively defend an area comprising a food resource, shelter, overwintering and breeding sites (Rosell & Bjørkøyli 2002). Home ranges and territories can cover similar areas for beavers, particularly where individuals from other groups are living nearby, when territory borders are visited regularly (Rosell & Thomsen 2006). These tend to follow the shorelines of the particular river or loch inhabited. These may consist of one family in a pond, to several bordering linear home ranges along a river (Novak 1987; Wheatley 1997). Territory and group size vary greatly within beaver populations (Wilsson 1971; Nolet & Rosell 1994; Herr & Rosell 2004). For example, territory size ranged from 1.1 to 6.8 km of bank length (average 3.7±1.7 km) in Norway based on pair cohesion studies (McClanahan et al. 2020). Previous studies have recorded averages of ~3 km though this was highly variable with watercourse complexity and habitat quality (Herr & Rosell 2004; Campbell et al. 2005). Overlap between territories are minimal (0.5-2.2%), though up to 10% have been observed and typically influenced by population density, habitat type and resource availability (Bloomquist et al. 2012; Herr & Rosell 2004). Actual distances between adjacent territories have been proposed to be at least 150-200m (Novak 1987). Territory size is not necessarily correlated with beaver group size or reproductive rate (Campbell et al. 2005). At higher population densities areas of ‘no man’s land’ between territories are likely to decrease although it is rare to find two lodges from different family groups closer than 400 m. Therefore, at a landscape scale the distribution of beaver territories is often highly discontinuous (Parker et al. 2001; Schulte 1998).
Beaver territories have been defined previously using a number of methods: scent mound mapping as indicators of territory borders (Campbell et al. 2005); biologging individuals (GPS/RF tags e.g. Campbell et al. 2005; Graf et al. 2016); riverbank length with minimum convex polygons or kernel methods (Herr & Rosell 2004); or patterns of beaver field sign density (Fustec et al. 2001).
Early colonisation of new habitat/ areas is often slow and represented by low numbers of pioneer individuals. As mating opportunities increase, new territories become established and population density increases. In expanding beaver populations, active territories tend to be further apart as family units select the highest quality habitat (Nolet & Rosell 1994), but as population density increases infilling occurs, territories come closer together and territorial behaviours (including aggression and scent marking) increase (Hartman 1995; Rosell 2002). During spring, scent marking tends to increase in frequency, especially at higher population densities. This is also the time that sub-adults, after reaching sexual maturity (~20 months), disperse from their natal territories to seek territories and mating opportunities of their own (Hartman 1997). At higher population densities dispersal may be delayed with individuals as old as seven years remaining with their parental families to assist with kit rearing and natal territory defence as new territories become scarcer (Mayer et al. 2016). As beaver populations establish, population growth can increase more rapidly until carrying capacity is reached (Hartman 1994). At carrying capacity beaver population density will have a regulatory effect on numbers, especially on reproductive rates (only one pair will breed within each territory) and survival of dispersers (Campbell et al. 2005; Parker & Rosell 2012). At this stage in population development, territories tend to be smaller, and fecundity is reduced, although this can vary between sites and be influenced by other factors (Campbell et al. 2005; Campbell et al. 2017).
Estimation of territories from survey data
Between the 2012 and 2017-2018 surveys, there was a significant increase in the volume and distribution of beaver signs. To address the requirement to provide a quantitative and replicable analysis of estimated change in territory numbers and range since then, it was decided for the 2017-2018 survey that an automated classification approach, based upon density and location of recorded signs be used to model the spatial distribution and number of territories. Kernel density estimation analysis (KDE) was undertaken and then combined with expert knowledge of the survey area to reach a final estimate of territories. Kernel density analysis calculates the density of features in a neighbourhood around those features, thereby allowing the identification of spatially explicit clusters of beaver activity that are assumed to relate to estimated territories (Campbell-Palmer et al., 2018, 2020). So as to be able to look at change since previous survey periods only survey signs that were judged to be of ‘fresh’ or ‘mixed age’ were used for territory analysis.
The methodological workflow behind this territory modelling is outlined in Figure 4, illustrating how the outputs from kernel density analysis were converted to territories. The automated method for territory determination compares to that presented in Campbell-Palmer et al. (2018, 2020) and Campbell et al. (2012) but transfers the identical workflow into the R statistical software programme via the ‘beavertools’ package developed by Hugh Graham to increase replicability and ensure all methods are open access. All analysis was undertaken using R 4.0.4.
Full methodological details are provided via the GitHub link with examples also include in Annex 4. In summary survey sign points were used to create a kernel density raster for each survey season using the {spatialEco} R package (Evans 2021). Weights were applied to the points based on their effort category class; low medium and high classes had weights of 1, 1e+03 and 1e+06 respectively. A low threshold value of 1e-10 was used to remove areas of extremely low density, increasing the chance of distinguishing between coincident regions of high-density signs. This analysis results in a kernel density ‘heat map’ raster (step 6 of flow chart in Figure 2).
The sign density rasters (for each year) were then used to generate multi polygon regions of activity, which defined the boundary of the density raster (activity regions) and that defined all regions of density > 95th percentile (central places). These high-density foraging areas were considered to describe the central places of beaver activity as beavers feed in higher densities closer to their dwelling. If an activity region intersected a central place region, the activity region was classified as a possible territory. If an activity region intersected a confirmatory key sign (i.e. dam, dwelling, food cache etc) this was also flagged for use in expert interpretation (i.e. see full territory list in Annex 8). The exact process for creating the multi-part polygon (step 7 of flow chart in Figure 2) was as follows. The sign density rasters were converted to a numeric vector, from which the 95th percentile was calculated. Two unique multipolygon regions were created, the first where any cell value greater than the minimum threshold (>1e-10) was converted to a polygon using the rasterToPolygon function from the {raster} package. The second region was derived for any cell greater than the 95th percentile of the KDE raster. For each multipolygon region, the multipolygon was unionised, and then recast as polygon features using the {sf} package. This multipart polygon of automated territories was then exported as an ESRI shapefile for further analysis.
Additionally, the revised ‘beavertools’ territory estimation was run on the 2012 and 2017-2018 datasets with identical settings to provide a comparable quantitative estimation of increase. As in 2017-2018 it was recognised that some known territories were not accounted for using this approach for a range of reasons including: (1) difficulties in determining between continuous or high density areas of beaver activity; (2) the resolution required for landscape scale modelling may not pick up locally separate territories i.e. in neighbouring lochs/reaches; (3) occasionally it was not possible to carry out full surveys in all areas due to access constraints, resulting in low sign density; (4) the visibility of field signs during the survey period was limited by natural phenomena i.e. snow and flooding during the winter months and vegetation during the summer. The updated methods also again use key signs (lodges, food caches, active feeding stations, burrows, scent marking and dams, see Table 3) as confirmatory signs, adding an extra layer of information for subsequent expert interpretation to determine the final territory boundaries and number (step 8 of flow chart in Figure 2) as described in Campbell-Palmer et al., (2018). For example, active territories are more confidentially assigned when active food caches are present at lodges from autumn to early spring. Similarly, territorial boundaries are more confidentially assigned when scent marking is noticeable active. Using the updated methodology, the presence (or absence) of key signs in each automated territory is flagged giving an extra layer of information for subsequent expert interpretation.
Results
Field Signs
The following sections present summary statistics for field sign results along with comparison with the 2017-2018 survey. The distribution of confirmed beaver signs recorded are illustrated in Figure 3 and examples are provided in Annex 1.
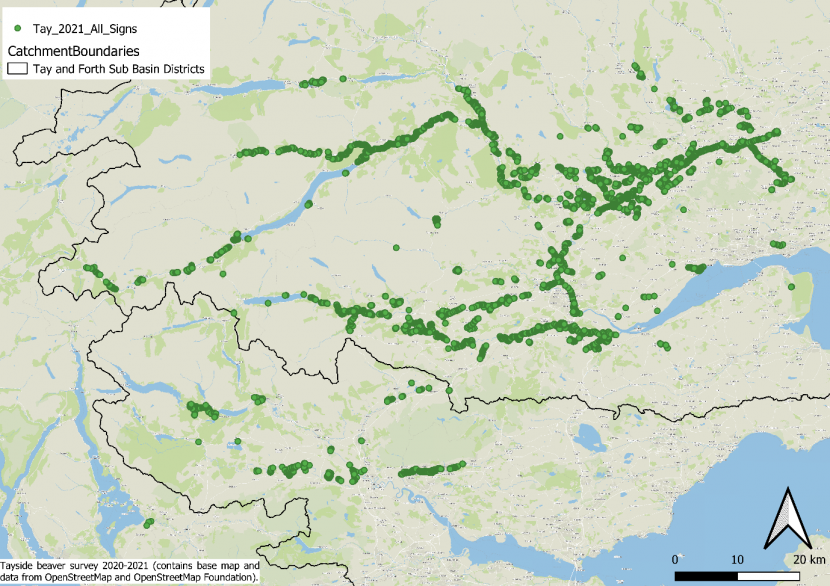
A map showing the locations of all survey signs recorded during the 2020-2021 survey as individual point data. Basemap data © OpenStreetMap contributors with data available under the Open Database License.
Types of field signs
Field surveys resulted in a total of 10,862 confirmed signs being recorded. This is lower than in 2017-2018 due to a methodological switch from a GPS device which recorded a continuous split survey line which was then split into regular sections (see Campbell-Palmer et al., 2018) to 100 % point data in this 2020-2021 survey. This meant fewer individual feeding signs were recorded in the 2020-2021 survey (10,246 woody signs, 59 soft feeding signs and 13 crop feeding signs) and should not be directly compared to the previous survey. All other signs (Table 3) were recorded using an identical point based approach in both surveys making the data directly comparable. However, the number recorded for all other signs was higher and reflects both an expanded beaver range and areas of infilling. Lodges and burrows (dwellings) and damming activity is discussed below. Table 3 shows comparisons of key non-feeding sign data between the 2017-2018 and 2020-2021 surveys, and demonstrate the increases observed. Note that there is uncertainty in these comparisons due to different signs being visible to varying degree under changing survey conditions (i.e. vegetation season and flow conditions) and the greater area covered in 2020-2021 due to population expansion.
| Sign Type | 2017-2018 | 2020-2021 | %Change |
|---|---|---|---|
| Dam | 86 | 118 | 37 |
| Cache | 1 | 3 | 3500 |
| Burrow | 339 | 547 | 61 |
| Lodge | 72 | 178 | 147 |
| Scent Mound | 20 | 51 | 155 |
| Feeding Station | 256 | 594 | 132 |
| Feeding Trail/Track | 266 | 732 | 175 |
| Canal/Digging/Haul Out | 50 | 314 | 528 |
Effort expended on field signs
A subjective measure of beaver activity was made by experienced surveyors, by estimating the amount of effort (low, medium or high) the beavers expended in producing the field signs recorded (see section 2.1.2). Results were comparable to the 2017-2018 survey with most beaver activity effort ranked as low (~ 72% as opposed to ~63% in 2017-2018), including field signs such as foraging on small diameter sapling and/or ‘soft feeding’ on herbacious species. Effort ranked as high was similar to 2017-2018 ~9% (2020-2021) (also 9 % in 2017-2018) consisting mainly of foraging on large diameter trees and fresh damming activity (Table 4). Medium effort signs showed a minor decrease from 28% to 18% since the previous survey.
| Effort Expended | Count |
|---|---|
| Low | 7864 |
| Medium | 1967 |
| High | 1031 |
Dwellings
A total of 178 beaver lodges were recorded during surveys, an 147 % increase from the 72 recorded in 2017-2018.. Beaver territories typically contained between one and four lodges. In addition, 36 active food caches were recorded outside dwellings indicating current occupation.
If the terrain is suitable, burrows are made with no over ground lodge structure. Beavers will reside in burrow systems dug into friable substrate instead of, or in addition to, a lodge. Therefore, the absence of a lodge does not mean beavers are not residing and breeding within a given area. A total of 443 beaver burrows were found, a 31 % increase since 2017-2018. A mapped overview of the distribution of lodges and burrows can be found in Figure 4 separated by age. 53 % of lodges were fresh, 24 % mixed and 22 % old. 29 % of burrows were fresh, 30 % mixed and 40 % old. It should be noted that burrows, in particular, can often be missed as entrances tend to be submerged. Therefore, these figures should not be considered as absolute, and the majority of burrows are likely to go unrecorded. For similar reasons, distribution and population censuses should not be based on lodge/burrow records, especially degree of food caching or not (i.e. territories can contain multiple lodges/burrows), but they can be used as strong confirmatory signs.
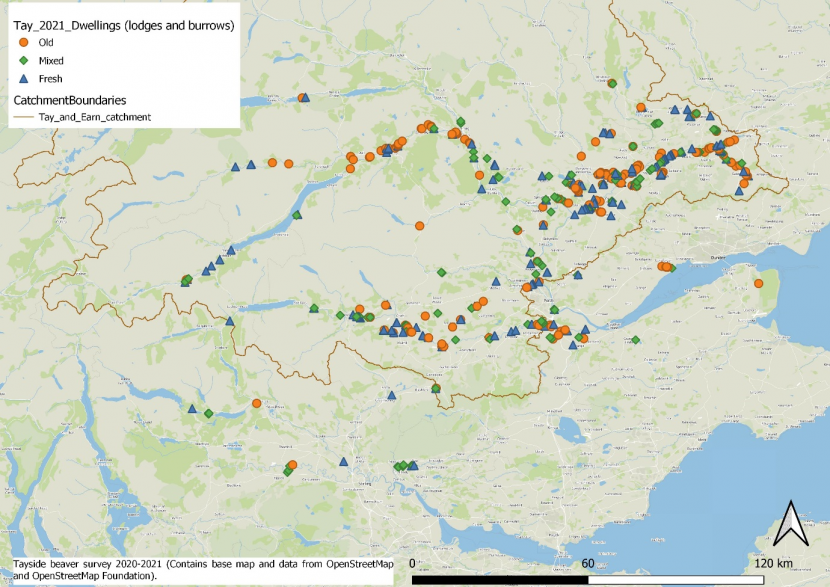
A map showing the location of all surveyed dwellings (beaver lodges and burrows) and their age (fresh, old or mixed) throughout the survey area. Basemap data © OpenStreetMap contributors with data available under the Open Database License.
Damming activity
A total of 118 beaver dams or recently removed dams were recorded, an increase of 37% from the 86 recorded in 2017-2018. Out of all the dams surveyed, 78 % were fresh/currently actively maintained, and the remainder were inactive or breached dams including breaching by both humans and natural causes (Figure 5).
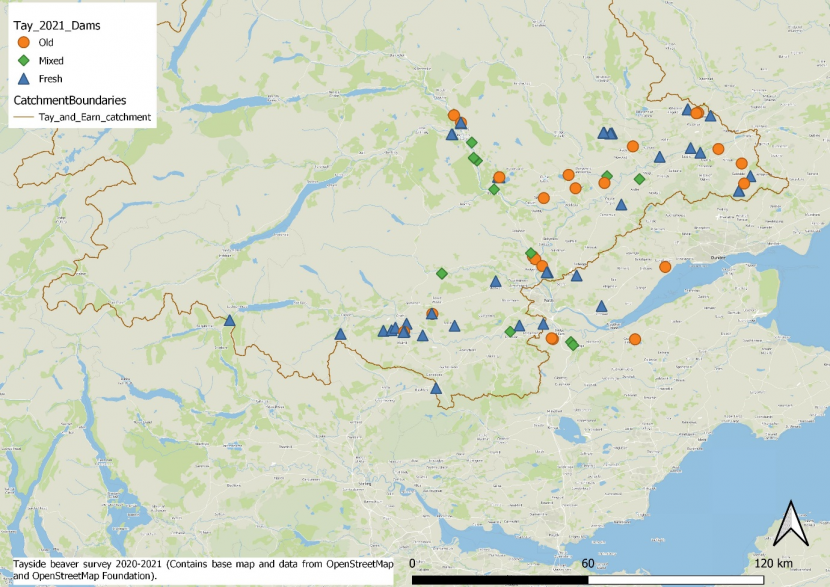
A map showing the location of all surveyed beaver dams and their age throughout the survey area (fresh, old or mixed where mixed indicates old dams that are still being maintained). Basemap data © OpenStreetMap contributors with data available under the Open Database License.
Age of field signs
Field signs at a site could vary in their age classification (old, fresh or a mixture of both). The largest proportion of signs of beaver activity (3984, 37 % as compared to 68 % in 2017-2018) consisted of a mixture of both new and old field signs. A total of 33 % (as opposed to 25 % in 2017-2018) of all activity was classed as old and the remaining 30 % (as opposed to 7 % in 2017-2018). Figure 6 details their distribution across the Tayside catchment representing their former and current distribution.
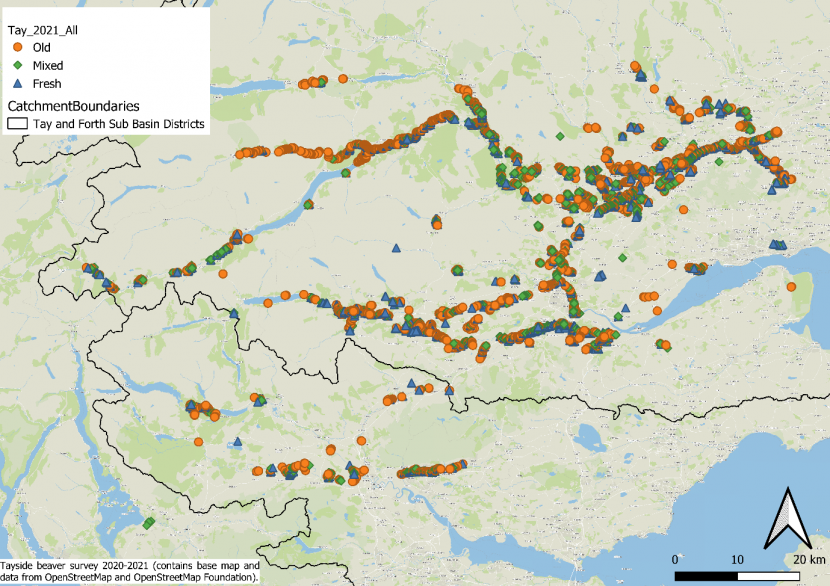
A map showing the location of all survey signs and their age throughout the survey area. Basemap data © OpenStreetMap contributors with data available under the Open Database License.
Land use
The majority (41 %) of records of land use with recorded beaver activity, measured by the number of field signs, occurred within areas with agriculture land uses. Riparian deciduous woodland was the second most common land use recorded (35 %). This is a slight switch from 2017-2018 when the majority of land cover was riparian deciduous woodland (55 %) with agriculture second (37 %). The remaining land uses recorded are shown in Table 5.
| Land use category | Count of beaver signs |
|---|---|
| Agricultural | 4447 |
| Conifer/Commercial | 256 |
| Deciduous | 3769 |
| Fishing/Recreation | 280 |
| Grassland | 195 |
| Nature Reserve | 254 |
| Residential | 372 |
| Road/Rail | 660 |
| Wet Marsh | 593 |
| Other | 168 |
Impact of potential management concern
The potential impact of beaver activity on land management varied across the Tayside catchment, from negligible to obvious. Measuring this impact involves a level of subjectivity, so the perceived impact was recorded by surveyors as far as possible using a simple score of ‘NA’, ‘low’, ‘medium’, or ‘high’, without obtaining the views of the landowners/managers in question. It is also critical to note these were signs that ‘could’ have management implications rather than where actual management implications had manifested themselves. As such this survey has expanded beyond the 2017-2018 where only clear management issues were logged which would be logged high by these surveys criteria.
A total of 200 potential high management issues were logged during surveys (out of 10,862 recorded signs, Table 6, Figure 7 and Annex 2). This compares to 159 in 2017-2018 (Campbell-Palmer et al. 2018). Thirty-five percent were on agricultural land use. The remaining issues were primarily recorded on deciduous or coniferous woodland (40 %), residential/urban/garden (9 %), fishing/recreation/amenity (4 %), road/rail infrastructure conflicts (5 %), wetlands (6 %) and other (1 %). Collapsed burrows or burrows deemed at risk of collapse, localised flooding from dams, problematic tree felling and raiding of agricultural crops dominated records of potential management concerns. See Annex 3 for examples of mitigation noted during the survey.
| Management concern category | Count of beaver signs |
|---|---|
| High | 200 |
| Medium | 779 |
| Low | 2497 |
| Negligible or none (NA) | 7386 |
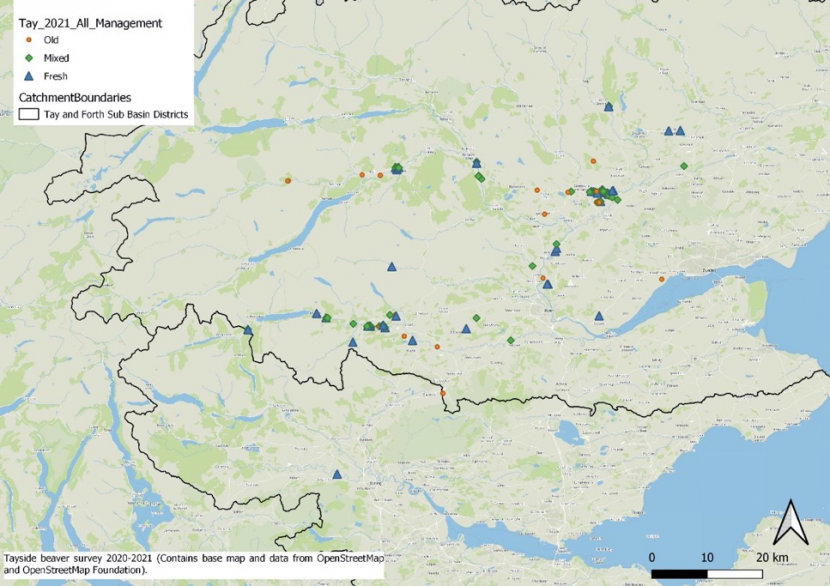
A map showing the location of all signs which were judged to be of potential management concern and their age. Basemap data © OpenStreetMap contributors with data available under the Open Database License.
Areas of impact and territory estimates
Estimated territories and areas of impact
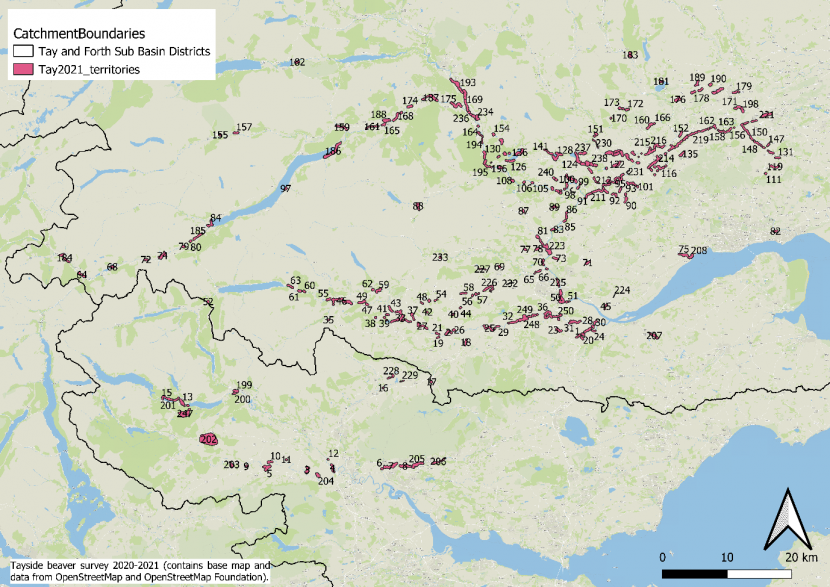
A map showing the location of all 251 territories for the 2020-2021 survey. Each territory is represented by a labelled polygon. Basemap data © OpenStreetMap contributors with data available under the Open Database License.
Change from previous surveys
The following sections present figures and statistics illustrating the change in spatial extent and territory numbers between the three survey periods (2012, 2017-2018, 2020-2021).
Change in range and density
Figure 9 illustrates identical KDE analysis undertaken across the three survey periods illustrating the change in range and density of signs recorded. Notable trends are an overall increase in density in central Tayside but also a visible migration in areas of activity both south into the Forth but also in a westerly direction. Along with a growing proportion of active territories living away from the main stems such as the River Tay and Isla.
Figure 10 visualises areas that have experienced either continuous occupation, new expansion or removal/abandonment between the 2017/2018 and 2020/2021 surveys. Yellow areas represent the 2020/2021 heatmap extent whilst blue represents the 2017/2018 heatmap extent and green/overlay is where they overlap. The dominance of yellow (2020/2021) supports the results presented thus far and signifies an overall increase in the extent and magnitude of beaver activity since the previous survey. However, blue areas show that there are areas where there was beaver activity in 2017/2018 but not in 2020/2021, with possible causes including removal by humans and natural abandonment of territories by beaver.
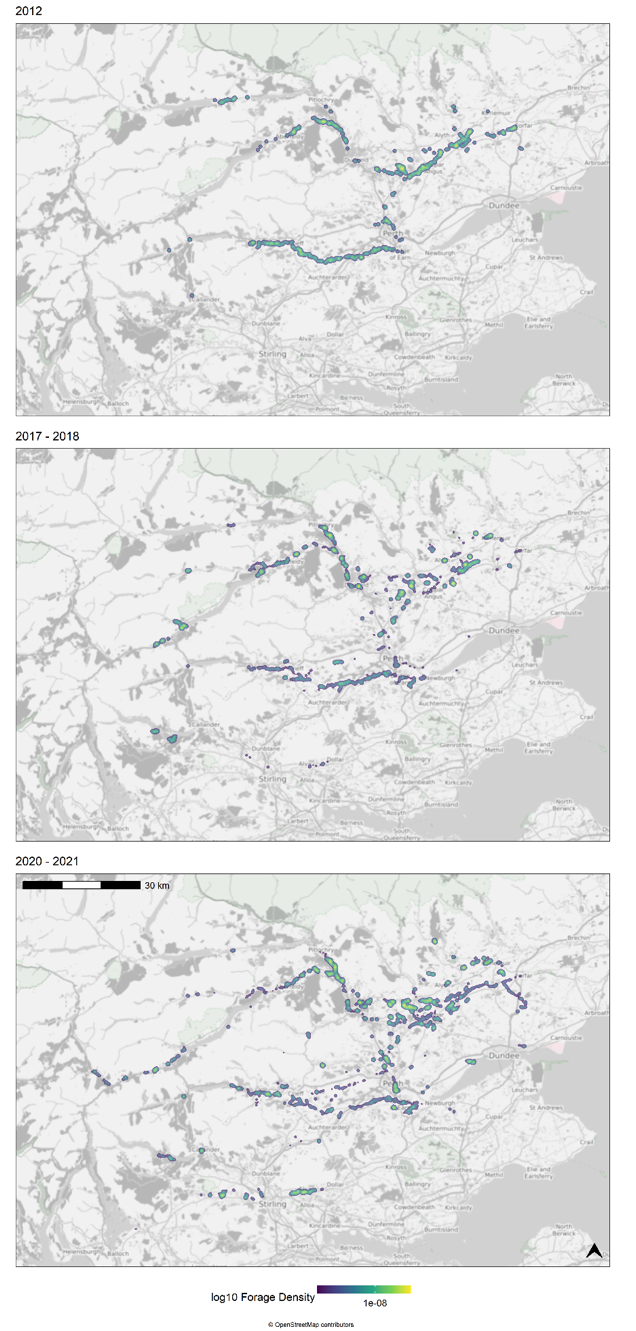
A three part figure showing the results of identical KDE analysis ran for each survey year (top figure is 2012, middle figure is 2017-2018, bottom figure is 2020-2021. Throughout the period in which surveys have been undertaken the overall trend is an increase in the range of signs recorded throughout the study area indicating increased beaver population and range). Basemap data © OpenStreetMap contributors with data available under the Open Database License.
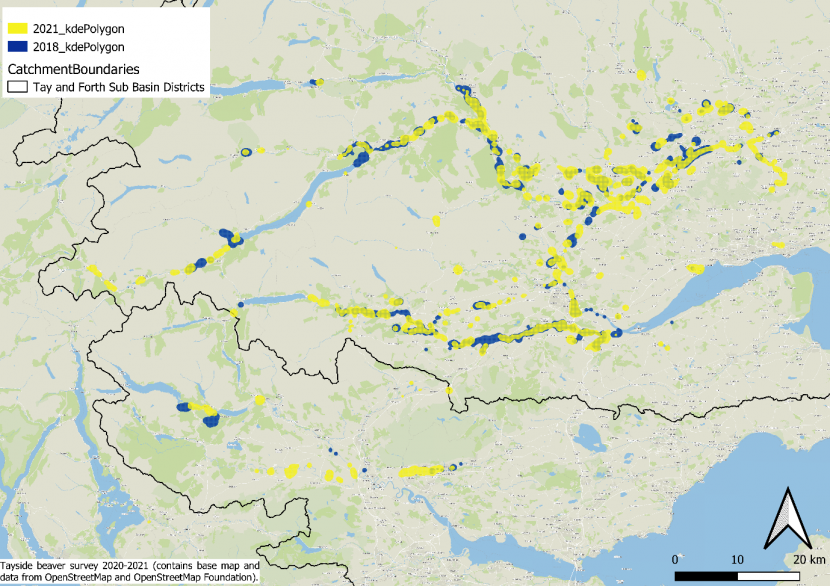
A map showing the overlay between KDE extent recorded in 2020-2021 compared with the 2017-2018 survey. Results mostly show an increase in beaver range throughout the study area since the previous survey. However, there are some areas where activity was recorded during 2017-2018 but not 2020-2021 suggesting beaver occupation has ceased for a variety of possible reasons. Basemap data © OpenStreetMap contributors with data available under the Open Database License.
Change in areas of activity using a fully automated analysis
Figure 11 illustrates identified areas of beaver activity for each survey period using an identical automated approach. Whilst it is certain that such an automated approach is not 100 % accurate it does provide a replicable standardised approach allowing comparison between years and comparable figures allowing the rate of expansion to be considered. Table 7 provides summary results indicating that between 2012 and 2017-2018 there was a 45 % increase in areas, noting gap of 5-6 years and slightly differing methods and area covered. Between 2017-2018 and 2020-2021 (3 year gap between survey) there was a 59 % increase in areas based on the automated classification. When the gap between survey periods is considered, this indicates a non-linear increase in population in line with population expansion models. For the five years between the 2012 and 2017 data collection this represents a ~8 % mean annual increase, compared to a ~17 % mean annual increase between the 2017 and 2020 data collection. Please note though these are areas of activity detected using an automated approach based upon kernel density analysis rather than expert interpretation of data to give territory estimates which is considered in the next section.
| Survey data | Number | Total % increase since previous survey (and mean annual increase in brackets) |
|---|---|---|
| 2012 | 85 | N/A |
| 2017-2018 | 123 | 45 (8) |
| 2020-2021 | 196 | 59 (17) |
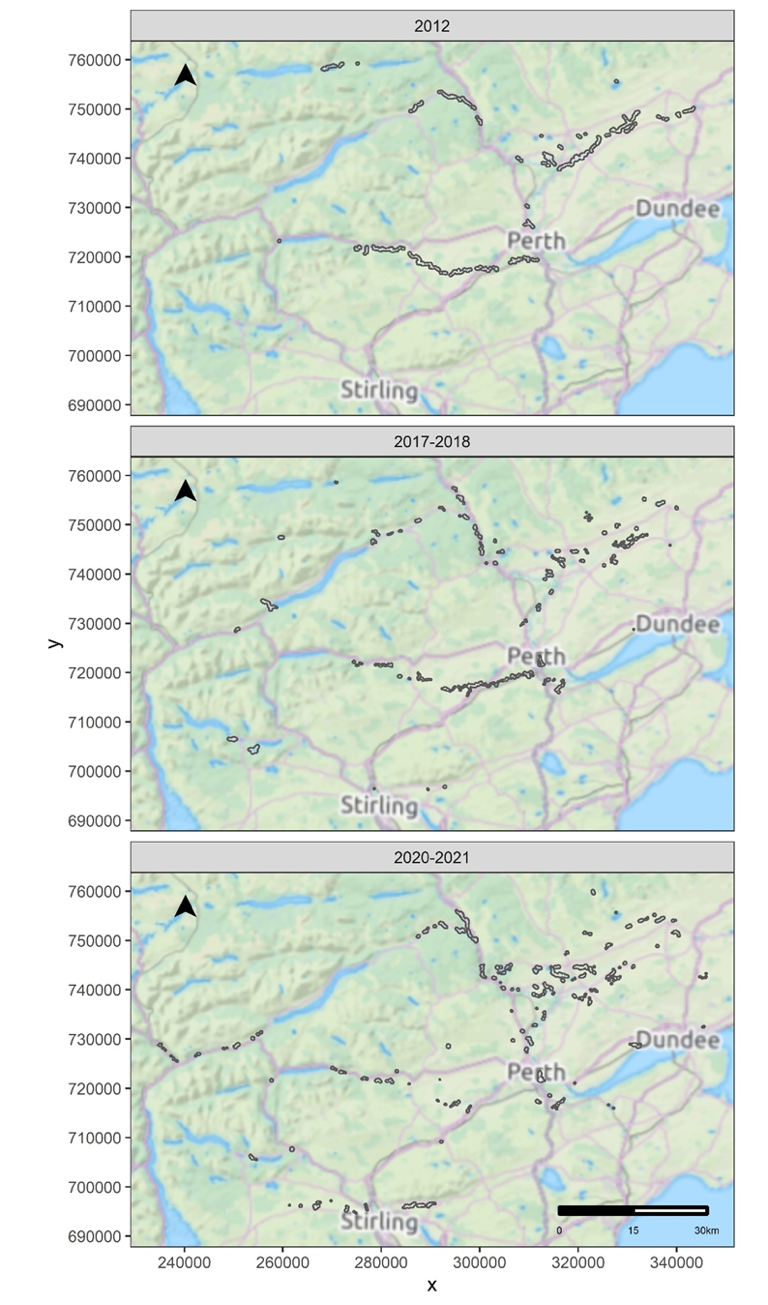
A three-part figure showing the results of identical automated territory estimation ran for each survey year (top figure is 2012, middle figure is 2017-2018, bottom figure is 2020-2021. Throughout the period in which surveys have been undertaken the overall trend is an increase in the range of territories in northerly, southerly and westerly directions. Basemap data © OpenStreetMap contributors with data available under the Open Database License.
Please note these are not final territory estimations but this approach allows a standardised comparison illustrating the change in spatial distribution.
Change in estimated territories between surveys
Table 8 shows the increase of final, expert-defined (building upon the automated approach) territories between the 2012, 2017-2018 (Campbell et al., 2012, Campbell-Palmer et al., 2018) and this survey. The overall trend is a rapidly increasing territory number. Whilst the total percentage increase recorded is greater between the first two surveys it should be noticed that the gap (five years so an average of 24 % increase per year) is longer than that between the latter two surveys (three years so an average of 30 % increase per year) suggesting the rate of population expansion is continuing to increase as beavers expand their territorial extent.
| Survey data | Number | Total % increase since previous survey (and mean annual % increase in brackets) |
|---|---|---|
| 2012 (Campbell et al., 2012) | 39 | 0 |
| 2017-2018 (Campbell-Palmer et al., 2018) | 114 | 192 (24) |
| 2020-2021 | 251 | 120 (30) |
Discussion
Range, territories and population estimates
The current beaver range has expanded (and infilled) most significantly to the west and south of that previously recorded in the 2017/2018 survey. This is highly representative of highly connected catchments, with a significant percentage of favourable habitat and few colonisation barriers. Interestingly there has been some limited spread north into more challenging terrain, including faster flowing water courses with predominantly rocky shorelines. Though significant barriers still exist (such as hydroelectric dams in Upper Tummel) and remain seemingly impassable to beavers to date, for example the River Tummel at Pitlochry. The field signs at Dunalastair Water are of mixed age and remain concentrated in a similar area since the 2017/2018 survey. Lodge observations undertaken (RCP and KW, pers obs) during the summer of 2020 suggest a single animal remaining and lack of expansion seems to confirm the suspicion that beaver presence here was most likely to due to a historic unofficial release that has not resulted in successful breeding and/or colonisation.
The Forth catchment show areas of continued colonisation and infilling, though habitat quality in the lower catchment is generally lower (Graham et al. In prep), than the rest of the catchment, beaver occupation is still evident. This catchment also contains highly suitable to preferred habitat, particularly associated with the Loch Lomond and Trossachs areas. These are likely to see significant expansion in future years. Note that many of the Trossachs lochs are large water bodies with variable tree cover and predominantly stony banks which offer less favourable habitat compared to some of the interconnecting rivers and wetland areas, for example Black Water feeding into Loch Venachar.
Beavers do not appear to have begun colonisation of the River South Esk with no signs observed, which is surprising given the proximity and connectivity to the Tayside catchment. Two logical crossing points are in close proximity to established breeding territories on the periphery. It seems highly likely this catchment jump will occur in the very near future.
There is limited presence of beaver in Fife and Kinross with notable beaver absence in high quality habitat areas such as Loch Leven and various nature reserves such as Morton Lochs. Given the proximity and beaver presence on both the River Earn and River Devon, and evidence of beavers dispersing with variable success in the Tay estuary, future colonisation seems likely. The Tay estuary is providing a dispersal route for colonisation of short burns flowing into this area, such as the Dighty and Huntly burn. Distressed individuals requiring veterinary care, along with cadavers recovered along this coast line, arising either from floating downstream but also through unsuccessful dispersal attempts in increasingly more saline water conditions. Equally there is evidence of individuals successfully dispersing via this route and then colonising fresh water burns draining into the estuary (e.g. Figure 10). This is likely to increase over time.
Beaver territories are increasing in range, with evidence of infilling between existing territories in some sections. Although specific areas of decreased activity and fresh field signs are evident on the mapping, it was rarer to find areas completely free of any field signs. More evident were areas of predominantly old field signs, at least over a year old, with a small percentage of more dispersed fresh field signs. This suggests beavers were being controlled to some degree including being subject to lethal control, with new dispersers recolonising formerly occupied territories. Overall, the trend is of a population and range increase compared to previous survey results. The overall density of 0.018 territories per km2 in Tayside and Forth represents an increase from 0.008 in 2017/2018. Whilst it is difficult to compare with different regions, with different habitat and management regime, this figure is significantly lower than has been reported in the literature for areas reported as being at carrying capacity; i.e. 0.12 territories per km2 Korablev et al., 2011 or 0.99-1.15 territories per km2 Petrosyan et al., 2016. In Sweden, for example, population growth declined 34 and 25 years after their reintroduction, with the population growth rates becoming negative at densities of 0.25 and 0.20 families /km2 respectively (Hartman 2003).
Embracing the “all models are wrong, but some are useful” philosophy (Box, 1976), it is recognised that landscape scale modelling involves spatial uncertainty. However, it is argued that this uncertainty will be significantly less than the change observed between surveys. To determine population size the most commonly used technique is to multiply the number of active families by the average number of beavers per family. Average family group size for Eurasian beavers varies, with different studies quoting a range of figures. Previously the average of 3.8 individuals (range 2.4 – 5.5) have been used based on a review of 13 studies (Rosell & Parker 1995). Long-term population studies in Norway have recorded 11 individuals in one family (Campbell et al. 2005) while maximum group sizes have been reported as 18 in Russia (Danilov & Kan'shiev 1983). Therefore, there is some controversy in providing estimated population sizes beyond number of active territories as different methods have all given very different results (Rosell and Parker, 1995). Although this figure (3.8) is said to take account of non-breeding territories and /or single territory holders, other studies have estimated at higher population densities up to 20% of the population may consist of singletons or ‘floaters’, adults/sub-adults searching or ready to take over territories if they become available or replacing a breeding individual if they die (Molini et al. 1980). Population density and habitat quality appear to be the key determinants influencing beaver family composition and size (Busher 2007). Therefore, populations in different growth phases e.g. establishing versus growing populations will have different average group sizes. Anecdotal trapping and lethal control evidence indicate beaver family sizes on Tayside larger than 3.8, and a initial observational report on family size in Tayside determined an average group size of 5.0 (SD±1.6) (Campbell-Palmer et al. 2015). Therefore this does not recommend 3.8 should be used as standard when trying to estimate population size. Beavers across the Tayside catchment are displaying successful breeding, good survival rates with expanding range and inflilling between territories indicating suitable habitat is still available. Trapped and dispatched individual are indicating good body condition with some evidence of territorial fighting but not present on every individual or to an excessive extent . Based on this survey, the 251 active territories defined, using an average group size of 3.8 would give a population estimate of approximately 954 individuals (range of 602 to 1381 individuals). More work to determine family group sizes in Scottish beaver families is needed to provide a more robust estimate of population size based on territory number is highly recommended.
Land use impacts and management
For the purpose of this survey any records of land use impacts and potential conflicts were measured in terms of field signs evident on the day of survey. There was no engagement with landowners or land managers who are likely to have varying opinions of what does and does not constitute a management impact at a particular site. NatureScot engages with landowners and land managers on beaver impacts through its Beaver Mitigation Scheme and lead role on the Scottish Beaver Forum. Therefore, this can be considered a somewhat subjective, snap point-in-time assessment, though the surveyors have a sound knowledge of beaver ecology, activities and behaviours to assess potential impacts. It should be noted that this methodology recorded negative impacts with potential management implications. Positive beaver benefits were also evident but are more difficult to quantify based on field sign survey. The recording of management impact also does not negate or dismiss the possibility that beaver activity in that area could have other benefits, i.e. a beaver dam, resulting in localised flooding on private land may be recorded as a high management impact. However, as shown in numerous studies (see Brazier et al. 2020 for a recent review) this same dam may bring significant biodiversity and hydrological benefits. Weighing up the costs vs. benefits of individual beaver impacts is important as beaver return to our landscapes but is beyond the scope of this study.
Tree felling and general foraging activities were not recorded as negative management issues here given these represent natural feeding behaviour of beavers and can have subjective impacts on landowners. The exception being when foraging activities were obviously impacting on high value trees (e.g. crop and/or conifer plantation); ornamental or amenity trees, especially mature specimens with little evidence of a naturally regenerating understorey. Again, the level of impact of tree feeling outside these categories could be more subjective and open to debate. This could be seen as dismissing the views of those troubled by tree felling (in both ornamental settings but also in mature woodland lining rivers) but accurately reflecting the views of individual landowners was not possible, with the focus of the survey on field sign survey mapping.
Land use impacts were evident mainly in areas of low gradient floodplain, often associated but not exclusive to, intensive agricultural areas. Evidence of some level of engagement with the NatureScot Beaver Mitigation Scheme was also observed. All of these impacts fell into known and established conflict categories, based around damming, burrowing and foraging activities.
During this survey an increased number of burrowing and damming impacts were recorded, along with mature tree felling and bank erosion associated with burrowing and around dams. Some infrastructure impacts on rail embankments were also recorded. Feeding on a range of crops was evident, both in observation of direct feeding signs at time of the survey and through evidence of feeding pre-survey e.g. worn forage trails into fields in which crops had since been removed, summer crop feeding. This does not appear to constitute an extensive area or thought to generate a significant economic loss, but was still an obvious conflict. Beaver flooding of crops through damming and/or burrowing into flood banks remains by far the more significant source of conflict with larger financial costs more likely to be occurred to a landowner. Impacts in agricultural areas remains the most significant, overall, management issue.
Dwelling and damming activity
Dwelling and damming activity increased significantly. This reflects the increased number of beaver territories and the increased survey effort on agricultural ditches. Dwellings in shallower water can be easier to observe especially during periods of low flow, additionally lodge structures on some main river stems and lochs where beavers have been present for many years, are now noticeably larger and more visible.
Food caches were only rarely recorded during previous surveys (Campbell et al. 2012; Campbell-Palmer et al. 2018) because those were conducted in spring and summer. During this survey, food caches were evident at <25% of lodges, with a range of 1-4 lodges per territory were recorded. Food caches confirm an active lodge and are a good indicator of likely natal dwelling the following breeding season. Crucially a lack of food cache cannot exclude occupation therefore purely counting food caches to determine number of active territories will lead to a significant underestimation. Food caches may be lost due to removal by humans, flooding and wave action. Presence of food caching significantly increases survival in harsh climates with construction influenced by temperature, though there should be a strong consideration if beavers are always food caching in Scotland. In areas lacking extreme seasonality, e.g. France, beavers do not typically always build food caches (Blanchet 1959; Brzyski & Schulte 2009). Variation in food caching or not may also be due to experience of living at the same site for many years and behavioural plasticity (Frank Rosell pers. communication). It should also be noted that not all food caches are visible, with beavers caching inside lodges and burrows. For example, a recent study in Norway recorded 25% of known families not building visible food caches (Frank Rosell pers. communication). The presence of a food cache is a valuable indicator when splitting territories in areas of high density active field signs, since one food cache per family group is presumed.
Similarly, the presence or lack of a lodge could not be used as a definitive feature of an active territory as beavers can reside in burrows. For example, 95% of beavers in the Rhônê Valley, France, live predominantly in burrows year-round rather than lodges (Richard 1985). Whereas 50% of beavers resided in lodges in northwest Russia (Danilov & Fyodorov 2015). Dispersers will often utilise burrows whilst they are in the process of finding a mate and territory of their own. Therefore, increased population will see increased evidence of burrows, whilst the presence of burrows does not define an active territory, but can represent range.
It is known that particular drainage systems remove, annually, multiple numbers of dams. Only dams over two weeks of age require a licence for removal, therefore numerous dams are removed without notification therefore the true extent of damming activity is unlikely to be fully captured. Range infilling also results in the selection of ‘sub optimal’ habitat, or more appropriately habitat requiring modification to encourage long-term utilisation by beavers. In the Tayside catchment this is particularly relevant to agricultural ditch systems. Therefore, damming and dam mitigation will be an ongoing feature of these landscapes. There is a question over whether the increased number of dams recorded outside prime agricultural areas could also be reflective of an increased tolerance of beavers in some systems.
Study limitations and recommendations for future monitoring
This survey represented the largest area surveyed to date in Scotland and the rest of the UK. Along with covering the main riverine and standing water bodies as per previous survey efforts, this survey focused on the smaller tributaries and extensive drainage ditch systems associated with agricultural areas within the Tayside catchment. This constitutes a large resource investment to cover the area completely therefore this can be considered a limitation to establishing the true population extent and upper population estimates. As the population increases, a larger proportion of beavers are likely to utilise these water courses and therefore some degree of underestimation is expected. However, these are also more likely to be conflict sites with beavers subject to lethal control. More rigorous data collection on dispatched individuals (including sex ratios, breeding status and age class) could enable further inferences on beaver population dynamics to be made. Thereby providing a more sensitive feedback mechanisms for ensuring the population remains in favourable conservation status, particular between any repeated survey findings.
A standardised system and approach to record range expansion are recommended. This includes combining data sets on individuals removed i.e. via lethal control and trapping efforts, particularly focussing on data describing location, age class and sex ratio. This will help estimate typical family group size, annual average breeding rates and survival rates of offspring (number of sub-adults). The annual mapping of these factors could enable population occupancy and growth figures to be determined in the core population areas. In addition to these data layers, additional survey effort (including new case reports collated through the NatureScot Beaver Mitigation Scheme) could focus on the new colonisation front and expansion zone, assuming a general core area approaching carrying capacity e.g. River Tay, Isla and Earn, that remains fairly static. Therefore, future mapping would focus on population expansion along the fringes of this agreed core area. This could have the additional benefit of concentrating mitigation effort to reduce potential future conflicts.
Alternatively, increasing the time interval between survey efforts to say every 5 years, could serve to concentrate resources, and therefore costs, whilst producing a detailed population range and estimated minimum active territories to ensure conservation status can be determined. Expanding beaver range may lead to the presumption of exponential survey costs and resources (for a full survey), that some may consider prohibitive. By presuming a core population area, as identified by the last three surveys, simple presence/absence survey could be undertaken as supposed to full survey mapping. This could work particularly well in standing water bodies, were presence of fresh signs would result in the assumption of an active territory, with family number largely irrelevant. Therefore, the protocol would focus on the first recording of a fresh sign would signal the end of the survey of that water body and the moving on to the next survey area. On linear systems this would require some pre-agreed spot checking interval, perhaps starting with known lodge locations. Full survey effort and mapping would therefore be concentrated on the area of most recent colonisation to determine not only range expansion but infilling, both of which could be used to infer a growing population. Whereas no expansion and/or infilling, especially where suitable habitat is present would require further survey effort to determine if population decline was evident. As a fairly newly restored species of European Protected Species (EPS) status and where mitigation options include licenced lethal control in permitted circumstances, it is vital that population survey efforts continue.
The authors acknowledge there is methodological uncertainty in the survey and that due to the now extensive study area it is likely that some beaver signs or territories were missed, especially those on minor water courses on the fringes and outside of the main surveyed area, may not have been captured in these survey results as they can live relatively unobtrusively. The authors also acknowledge analytical uncertainty due to the difficulty in separating territories where they are in close proximity and high densities on certain riverine sections. It is thus possible that on some sections of continuously occupied river where a single territory has been estimated it may be multiple territories. Due to these analytical and methodological sources of uncertainty it is the authors belief that the final territory number is likely an underestimation. It is also acknowledged that the inclusion of a qualitative step in the analysis in the form of expert judgement forms a non-quantifiable source of uncertainty (i.e. if a different expert reach the same conclusion). However, in the authors experience (Campbell-Palmer et al., 2020) it has been shown that the combined approach utilising the authors extensive on the ground experience provides the best means of capturing, both the change in overall trends and spatial patterns between surveys and simultaneously a level of detail that can be useful for applied management purposes.
These survey results provide a wealth of opportunities for more detailed research into beaver population dynamics (both spatial and temporal) across catchments, with widespread application for identifying potential release sites for restoration efforts. In addition to identifying risk and the management of conflicts, expanding beaver populations may provide opportunities for ecosystem service provision i.e., for water resources and biodiversity (Puttock et al., 2017; Puttock et al., 2018; Law et al., 2016; Law et al., 2017; Gaywood, 2017). Such survey methods can extend our understanding of beaver behaviour and population dynamics in densely populated and managed environments, informing management and modelling approaches to help mitigate conflict and maximise benefits (Brazier et al., 2020).
Future perspectives on beaver population growth in Scotland
Eurasian beaver populations continue to increase throughout the Tayside and Forth catchments, although areas of decrease are evident in some conflict areas. Some of this decrease may also be attributed to failed attempts by beavers to establish territories, and reflect natural patterns of occupation and abandonment. Management practices in areas where numbers have decreased and linked with lethal control are likely to see an ongoing need for such management. It is evident that beavers recolonise these areas within a fairly short time period. Longer term, more sustainable solutions are worth investigating to ensure these areas do not become population sinks. Monitoring of these areas in particular is recommended, including basic data on the animals removed such as age-class, reproductive status, timing between dispatch events.
Beavers are more rapidly colonising water bodies to the west and south of the Tayside catchment, as well as infilling between territories on main river stems such as the Earn and the Forth. Future colonisation of the South Esk is very likely but the River Clyde should also be highlighted at this stage. The spread north is likely to be slow as this represents a more challenging habitat for dispersal. Hydroelectric dams are proving significant barriers to beaver movement. It is also likely that the Tayside population could make the jump into the Loch Awe catchment to theoretically provide a genetic link to Knapdale population, as opposed to other way round. A recent survey undertaken on behalf of the Scottish Wildlife Trust by one author determined there was no evidence of any expansion from the Knapdale population. This is still likely to take several years as territory numbers are still low on the river Dochart with plenty of scope for infilling of habitat, there is also a slight geographical barrier (road and open land to transverse). Beaver population growth in east of Scotland appears to be in the rapid expansion phase. There is still significant suitable unoccupied habitat, with catchments in central Scotland laying close to each other and fairly accessible for future colonisation.
Conclusions
This survey represented the largest area examined for beaver occupancy in Britain to date. There was an increase in both beaver distribution and density compared to the 2017-2018 survey although spatial variability was evident, with areas of expansion and infilling, along with smaller areas of habitat abandonment potentially through culling. Fresh beaver activity was recorded throughout large parts of the Tayside catchment, and to a lesser extent into the Forth catchment. Their distribution now ranges from Glen Isla to Dundee and Stirling, Forfar to Crianlarich. A confirmed number of 251 active beaver territories was estimated in this study, representing a 120% increase on the minimum estimates with comparable survey methods in 2017/2018. There is always the caveat that not all active territories have been discovered and, especially on higher density riverine systems, the boundaries between individual territories are more difficult to define with absolute certainty. Therefore, such demarcations are somewhat arbitrary but serve to demonstrate occupation, infilling and a population approaching carrying capacity (noting any lethal control would serve to potentially maintain a constant pull of dispersing individuals from neighbouring territories). Some areas identified as active territories using these methods may in reality constitute additional families (where border identification was not possible), along with dispersing singletons living in close proximity and exhibiting continuous field signs making the clear identification of territorial borders less definite. Additional active territories are likely to exist both within Tayside, especially on minor watercourses, and outside the Tayside catchment which it was not feasible to cover during this survey.
A total of 118 dams, 178 lodges and 443 burrows were recorded. This increase is reflective not only of range expansion but significant infilling between established territories as beaver modify what is sometimes referred to as ‘sub-optimal’ habitats.
The survey method presented here is applicable both for established beaver territories and catchments where beavers are more recently colonising or have recently been reintroduced. The systematic deployment of a standardised survey at interval time periods will inform ongoing and future management decisions and forms a template by which expanding populations can be quantified. Given the significant potential for beavers to impact land use and modify habitats on a catchment scale, their presence and subsequent management requirements need due consideration. As beaver populations continue to expand across Scotland the ability to undertake replicable, geospatial analyses of beaver population dynamics has increasing value for scientific understanding and future decision-making.
Detailed field surveys of beaver signs, combined with geospatial analysis and expert evaluation, can allow estimates of active beaver spatial extent and territories. As populations of Eurasian beaver expand across Europe, such survey-based approaches can be used to increase understanding of their distribution, population dynamics and territorial behaviour. Additionally, as beaver engineering and feeding activities have increasingly recognised management implications (both positive and negative), results from surveys such as this can be used to design and implement management strategies at both the national and local level.
References
Blanchet, M.J.H. 1959. Was machen die ‘Taler-Biber’an der Versoix. Heimatschutz, 53, 119-123.
Bloomquist, C.K., Nielsen, C.K. & Shew, J.J. 2012. Spatial organization of unexploited beavers (Castor canadensis) in southern Illinois. American Midland Naturalist, 167, 188-198.
Box, E. 1978. Geographical dimensions of terrestrial net and gross primary productivity. Radiation and Environmental Biophysics, 15(4), 305-322.
Brazier, R., Puttock, A., Graham, H., Auster, R., Davies, K. and Brown, C. 2020a. Beaver: Nature's ecosystem engineers. Wiley Interdisciplinary Reviews: Water, 8(1), p.e1494.
Brazier, R. E., Elliott, M., Andison, E., Auster, R. E., Bridgewater, S., Burgess, P., Chant, J., Graham, H. A., Knott, E., Puttock, A. K., Sansum, P., and Vowles, A. 2020b. River Otter Beaver Trial: Science and Evidence Report. University of Exeter.
Brzyski, J. R. and Schulte, B. A. 2009. Beaver (Castor canadensis) impacts on herbaceous and woody vegetation in southeastern Georgia. American Midland Naturalist, 162, 74-86.
Busher, P. 2007. Social organization and monogamy in the beaver. In: J.O. Wolff and P.W. Sherman, eds. Rodent societies: an ecological and evolutionary perspective. Chicago: University of Chicago Press.
Campbell, R.D., Rosell, F., Nolet, B. and Dijkstra, V. 2005. Territory and group sizes in Eurasian beavers (Castor fiber): echoes of settlement and reproduction? Behavioural Ecology and Sociobiology, 58(6), 597-607.
Campbell, R.D., Rosell, F., Newman, C. and Macdonald, D.W. 2017. Age-related changes in somatic condition and reproduction in the Eurasian beaver: Resource history influences onset of reproductive senescence. PloS one, 12(12), e0187484
Campbell, R.D., Harrington, A., Ross, A. and Harrington, L. 2012. Distribution, population assessment and activities of beavers in Tayside. NatureScot Commissioned Report No. 540.
Campbell-Palmer, R., Dickinson, H., Wilson, K. and Rosell, F. 2015. Group size and reproductive rates within the Tayside beaver population, Perthshire. NatureScot Commissioned Report No. 802.
Campbell-Palmer, R., Puttock, A., Graham, H., Wilson, K., Schwab, G., Gaywood, M.J. and Brazier, R.E. 2018. Survey of the Tayside area beaver population 2017-2018 NatureScot Commissioned Report No. 1013.
Campbell‐Palmer, R., Puttock, A., Wilson, K. A., Leow‐Dyke, A., Graham, H. A., Gaywood, M.J. & Brazier, R.E. 2020. Using field sign surveys to estimate spatial distribution and territory dynamics following reintroduction of the Eurasian beaver to British river catchments. River Research and Applications, 37(3), pp.343-357.
Coles, B. 2006. Beavers in Britain's Past. Oxford: Oxbow Books.
Conroy, J. & Kitchener, A. 1996. The Eurasian beaver (Castor fiber) in Scotland; A review of the literature and historical evidence. NatureScot Review No. 49.
Danilov, P. I. and Kan'shiev, V. Y. 1983. State of populations and ecological characteristics of European (Castor fiber L.) and Canadian (Castor canadensis Kuhl.) beavers in the northwestern USSR. Acta Zoologica Fennica, 95-97.
Donkor, N. and Fryxell, J. 1999. Impact of beaver foraging on structure of lowland boreal forests of Algonquin Provincial Park, Ontario. Forest Ecology and Management, 118(1-3), 83-92.
Dowse, G., Taylor, H.R., Girling, S., Costanzi, J.M., Robinson, S. and Senn, H. 2020. Beavers in Knapdale: Final report from the Scottish Beavers Reinforcement Project. Published by Scottish Beavers, Edinburgh, UK.
Evans, J.S., 2021. R package version 1.3-6.
Fustec, J., Lode, T., Le Jacques, D. and Cormier, J. 2001. Colonization, riparian habitat selection and home range size in a reintroduced population of European beavers in the Loire. Freshwater Biology, 46(10), 1361-1371.
Graf, P., Mayer, M., Zedrosser, A., Hackländer, K. and Rosell, F. 2016. Territory size and age explain movement patterns in the Eurasian beaver. Mammalian Biology, 81(6), 587-594.
Graham, H., Puttock, A., Macfarlane, W., Wheaton, J., Gilbert, J., Campbell-Palmer, R., Elliott, M., Gaywood, M., Anderson, K. and Brazier, R. 2020. Modelling Eurasian beaver foraging habitat and dam suitability, for predicting the location and number of dams throughout catchments in Great Britain. European Journal of Wildlife Research, 66(3), 42.
Graham, H. A., Puttock, A., Campbell-Palmer, R. & Brazier, R.E. 2021. Beaver Forage Suitability and Dam Capacity across Scotland. In prep.Gaywood, M.J. (ed). 2015. Beavers in Scotland: A report to the Scottish Government. NatureScot, Inverness.
Gaywood, M., 2017. Reintroducing the Eurasian beaver Castor fiber to Scotland. Mammal Review, 48(1), 48-61.
Haarberg, O. and Rosell, F. 2006. Selective foraging on woody plant species by the Eurasian beaver (Castor fiber) in Telemark, Norway. Journal of Zoology, 270(2), 201-208.
Halley, D. and Rosell, F. 2002. The beaver's reconquest of Eurasia: status, population development and management of a conservation success. Mammal Review, 32(3), 153-178.
Halley, D., Rosell, F. and Saveljev, A. 2012. Population and distribution of Eurasian beavers (Castor fiber). Baltic Forestry, 18,168-175.
Halley, D., Teurlings, I., Welsh, H. and Taylor, C. 2013. Distribution and patterns of spread of recolonising Eurasian beavers (Castor fiber Linnaeus 1758) in fragmented habitat, Agdenes peninsula, Norway. Fauna Norvegica, 32(0).
Halley, D., Saveljev, A. and Rosell, F. 2020. Population and distribution of beavers Castor fiber and Castor canadensis in Eurasia. Mammal Review, 51(1), 1-24.
Hartman, G., 1995. Patterns of spread of a reintroduced beaver Castor fiber population in Sweden. Wildlife Biology, 1(1), 97-103.
Hartman, G., 1994. Long-Term Population Development of a Reintroduced Beaver (Castor fiber) Population in Sweden. Conservation Biology, 8(3), 713-717.
Hartman, G., 1997. Notes on age at dispersal of beaver (Castor fiber) in an expanding population. Canadian Journal of Zoology, 75(6), 959-962.
Hartman, G. 2003. Irruptive population development of European beaver (Castor fiber L.) in southwest Sweden. Lutra, 46, 103-108.
Herr, J. and Rosell, F. 2004. Use of space and movement patterns in monogamous adult Eurasian beavers (Castor fiber). Journal of Zoology, 262(3), 257-264.
Kitchener, A.C. and Conroy, J.W.H. 1997. The history of the Eurasian beaver Castor fiber in Scotland. Mammal Review, 27, 95-108.
Korablev, N., Puzachenko, Y., Zavyalov, N. and Zheltukhin, A. 2011. Long-term Dynamics and Morphological Peculiarities of Reintroduced Beaver Populations in the Upper Volga Basin. Baltic Forestry 17(1), 136-147.
Law, A., McLean, F. and Willby, N.J. 2016. Habitat engineering by beaver benefits aquatic biodiversity and ecosystem processes in agricultural streams. Freshwater Biology, 64(4) 486-499.
Law, A., Gaywood, M.J., Jones, K.C., Ramsay, P. and Willby N.J. 2017. Using ecosystem engineers as tools in habitat restoration and rewilding: beaver and wetlands. Science of the Total Environment, 605: 1021-1030.
Manning, A.D., Coles. B., Lunn, A.G., Halley, D., Ashmole, P. and Fallon, S.J. 2014. New evidence of late survival of beaver in Britain. The Holocene, 24(12), 1849–1855.
Mayer, M., Zedrosser, A. and Rosell, F. 2016. When to leave: the timing of natal dispersal in a large, monogamous mammal, the Eurasian beaver. Animal Behaviour, 123, 375-382.
Mayer, M., Frank, S.C., Zedrosser, A. and Rosell, F. 2020. Causes and consequences of inverse density-dependent territorial behaviour and aggression in a monogamous mammal. Journal of Animal Ecolology, 89, 577– 588.
McClanahan, K., Rosell, F. and Mayer, M. 2020. Minding your own business: Low pair cohesion in a territorial, monogamous mammal. Animal Behaviour, 166, 119-128.
Molini, J.J., Lancia, R.A., Bishir, J. and Hodgdon, H.E. 1980. A stochastic model of beaver population growth. Worldwide Furbearers Conference Proceedings, Frostburg. 1215-1245.
NatureScot. 2020. Beaver Licensing Statistics.
Nolet, B.A. and Baveco, J.M. 1996. Development and viability of a translocated beaver Castor fiber population in the Netherlands. Biological Conservation, 75,125-137.
Nolet, B.A. and Rosell, F. 1994. Territoriality and time budgets in beavers during sequential settlement. Canadian Journal of Zoology, 72, 1227-1237
Nolet, B.A. and Rosell, F. 1998. Comeback of the beaver Castor fiber: an overview of old and new conservation problems. Biological Conservation, 83: 165–173.
Novak, M. 1987. Beaver. In M. Novak, , J.A. Baker, M.E. Obbard, and B. Malloch, eds. Wild Furbearer Management and Conservation in North America. Ontario Ministry of Natural Resources, Toronto, and Ontario Trappers Association, North Bay, pp. 282–312.
Parker, H., Haugen, A., Kristensen, Ø., Myrum, E., Kolsing, R. and Rosell, F. 2001. Landscape use and economic value of Eurasian beaver (Castor fiber) on a large forest in southeast Norway. Proceedings of the First Euro-American Beaver Congress, 77-95.
Parker, H. and Rosell, R. 2012. Beaver Management in Norway – A review of recent literature and current problems. HiT Publication no. 4/2012. Telemark University College
Petrosyan, V.G., Golubkov, V.V., Zavyalov, N.A., Goryainova, Z.I., Dergunova, N. N., Omelchenko, A.V., Bessonov, S.A., Albov, S.A., Marchenko, N.F., and Khlyap, L.A. 2016. Patterns of population dynamics of Eurasian beaver (Castor fiber L.) after reintroduction into nature reserves of the European part of Russia. Russian Journal of Biological Invasions, 7(4), 355–373.
Puttock, A., Graham, H.A., Cunliffe, A.M., Elliott, M. and Brazier, R.E. 2017. Eurasian beaver activity increases water storage, attenuates flow and mitigates diffuse pollution from intensively managed grasslands. Science of The Total Environment, 576, 430–443.
Puttock, A., Graham, H.A., Carless, D. and Brazier, R.E. 2018. Sediment and Nutrient Storage in a Beaver Engineered Wetland. Earth Surface Processes and Landforms, 43(11), 2358-2370.
R Core Team (2021). R: A language and environment for statistical computing. R Foundation for Statistical Computing, Vienna, Austria.
Richard, P. B. 1985. Peculiarities on the ecology and management of the Rhodanian beaver (Castor fiber L.). Zeitschrift für Angewandte Zoologie, 72(1-2), 143-152.
Rosell, F. 2002. Do Eurasian beaver smear their pelage with castoreum and anal gland secretion? Journal of Chemical Ecology, 28, 1697–1701.
Rosell, F. and Bjørkøyli, T. 2002. A test of the dear enemy phenomenon in the Eurasian beaver. Animal Behaviour 63, 1073–1078.
Rosell, F. and Nolet, B.A. 1997. Factors affecting scent-marking behaviour in Eurasian beaver (Castor fiber). Journal of Chemical Ecology, 23, 673-689.
Rosell, F. and Parker, H. 1995. Beaver management: present practice and Norway’s future needs. Bø i Telemark, Norway: Telemark University College.
Rosell, F. and Thomsen, L. R. 2006. Sexual dimorphism in territorial scent marking by adult Eurasian beavers (Castor fiber). Journal of Chemical Ecology, 32(6), 1301-1315.
Schulte, B. A. 1998. Scent marking and responses to male castor fluid by beavers. Journal of Mammalogy, 79, 191-203
Simunková, K. and Vorel, A. 2015. Spatial and temporal circumstances affecting the population growth of beavers. Mammalian Biology, 80, 468-476.
Stringer, A.P., Blake, D. and Gaywood, M.J. 2015. A geospatial analysis of potential Eurasian beaver (Castor fiber) colonisation following reintroduction to Scotland. NatureScot Commissioned Report No. 875.
Stringer, A. and Gaywood, M. 2016. The impacts of beavers on biodiversity and the ecological basis for reintroduction to Scotland. Mammal Review, 46, 270-283.
Verbeylen, G. 2003. The unofficial return of the European beaver (Castor fiber) in Flanders (Belgium). Lutra, 46, 123-128.
Wheatley, M. 1997. A new surgical technique for implanting radio transmitters in beavers, Castor canadensis. Canadian Field-Naturalist 111, 601-606.
Wilsson, L. 1971. Observations and experiments on the ethology of the European beaver (Castor fiber L.). Vitrevy, 8, 115-266.
Zurowski, W. and Kasperczyk, B. 1990. Results of beaver reintroduction in some Carpathian mountain streams. Ochrona Przyrody, 47, 201-214.
QGIS.org, 2021. QGIS Geographic Information System. QGIS Association.
Annex
Annex 1: Field Signs
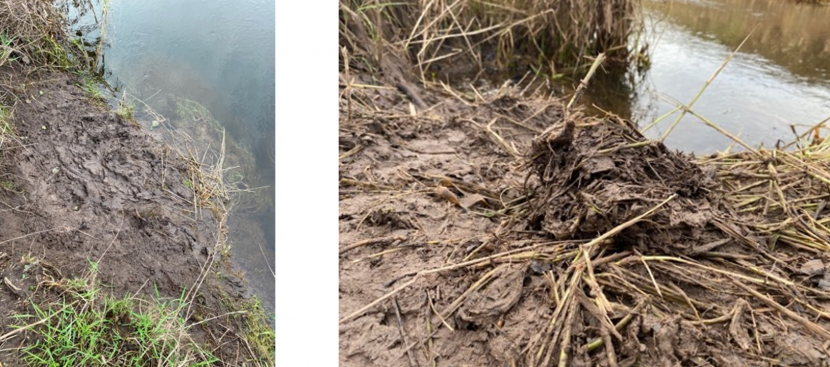
Photographs 1 and 2. Beaver scent mounds constructed from mud and vegetation along the shoreline of a water course
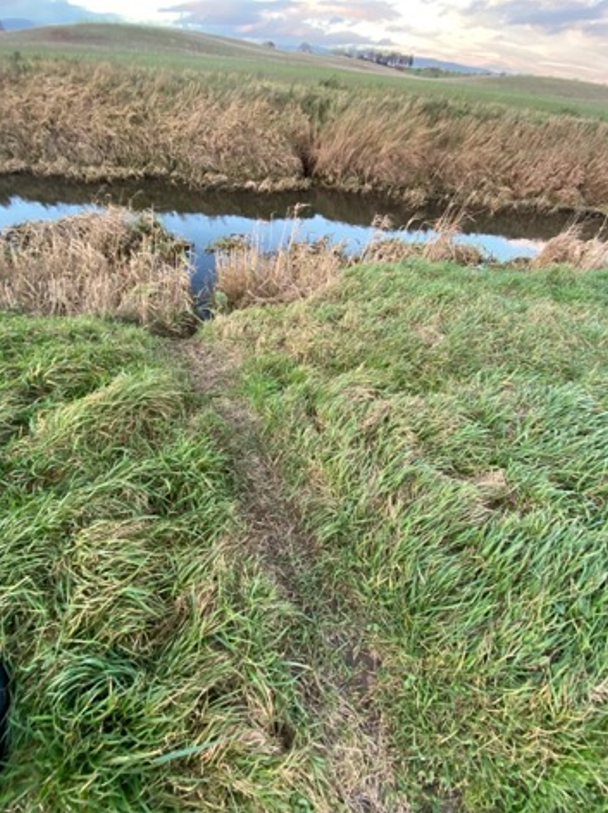
A worn beaver forage trial leading from a water course and into a field.
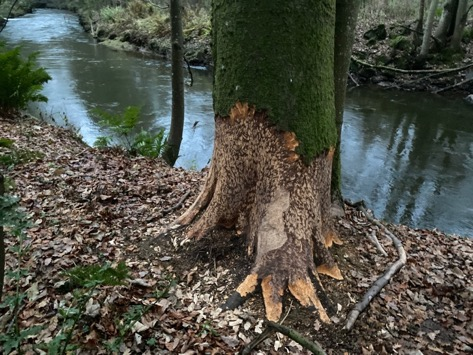
A mature tree next to a water course that beaver have ring-barked and removed bark from the trunk section.
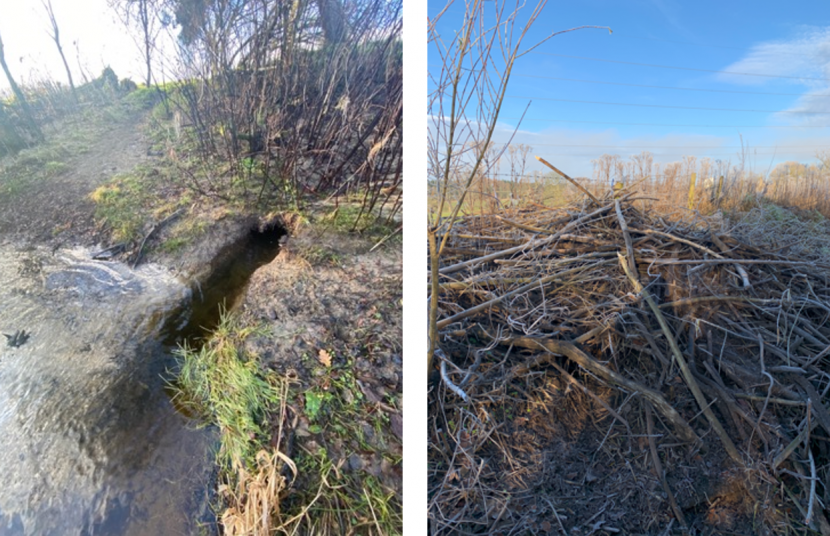
Both photographs show a beaver bank burrow exposed along a river bank at low water levels.
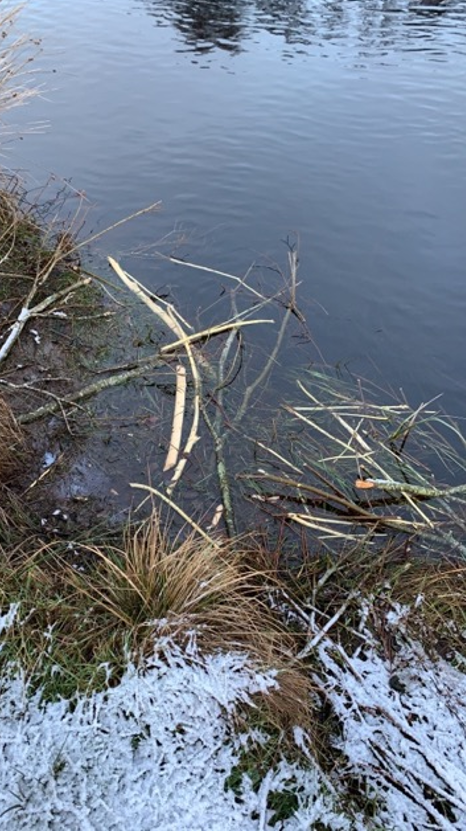
An active beaver feeding station showing freshly peeled sticks left in a pile along a river bank.
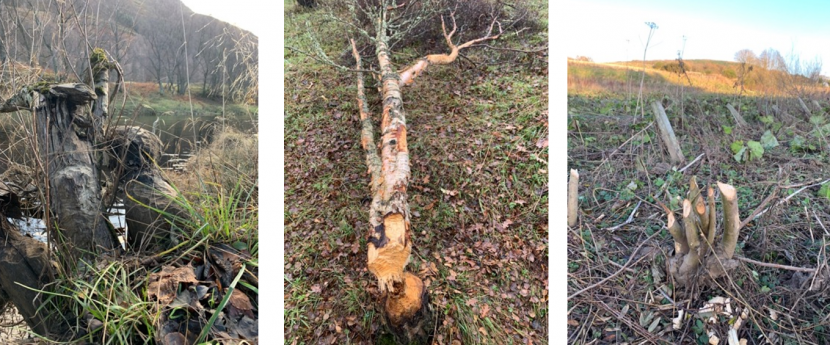
All photos show beaver felled trees of mixed age from old to freshly cut.
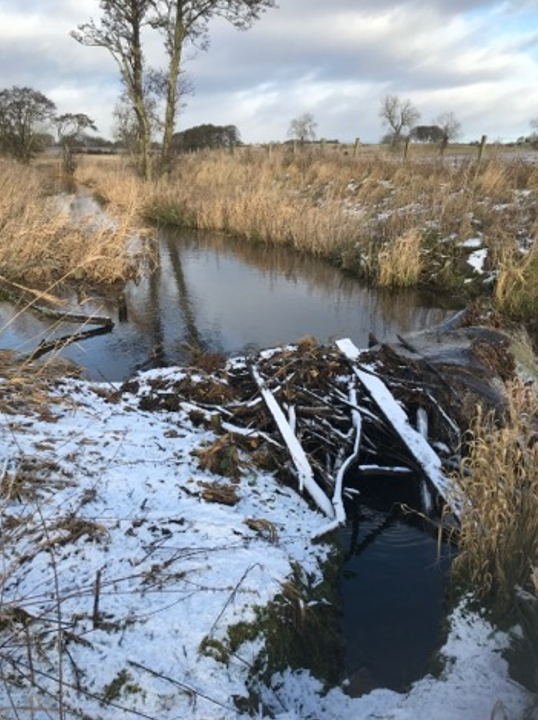
A beaver dam impounding water in a small stream.
Annex 2: Potential management conflicts
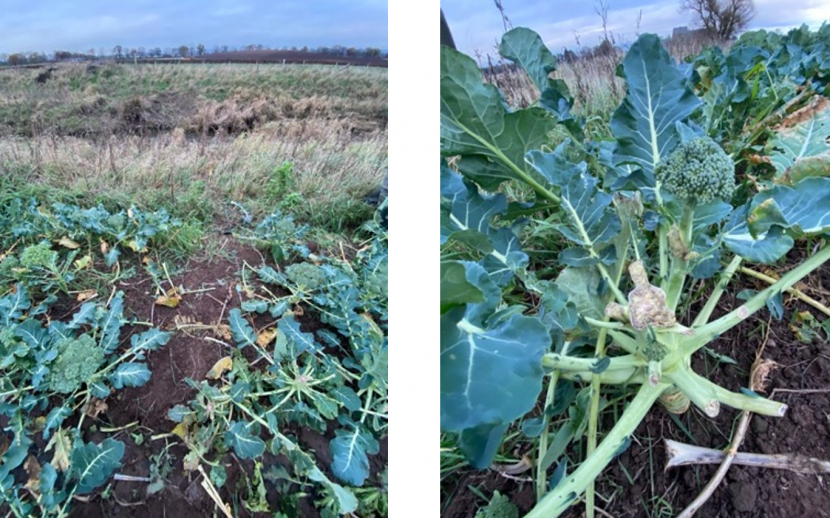
Both photos show beaver cut broccoli stems growing in a field.
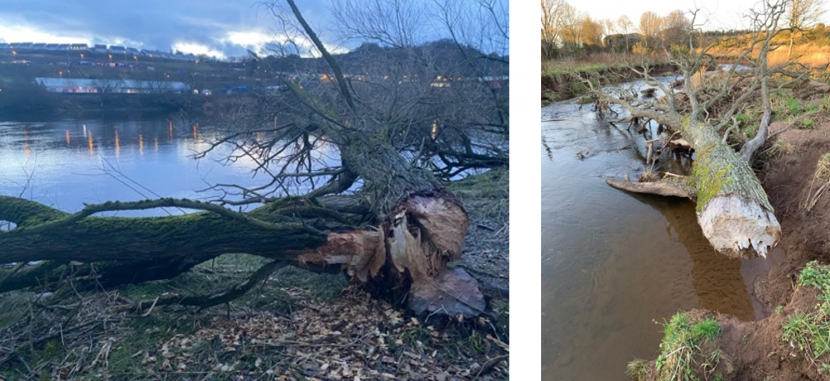
Both photos show large mature trees felled by beavers along a river bank
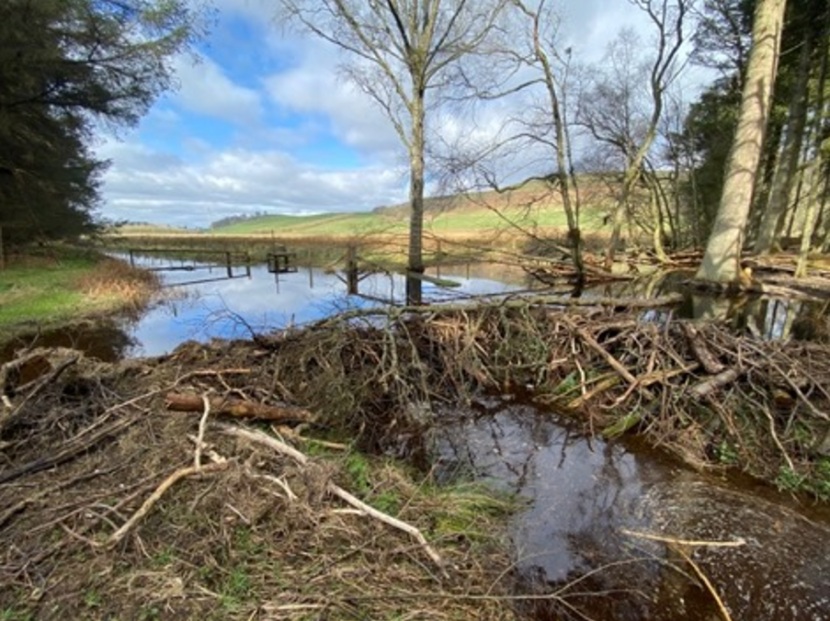
A curved beaver dam actively maintained and impounding water in a conifer plantation.
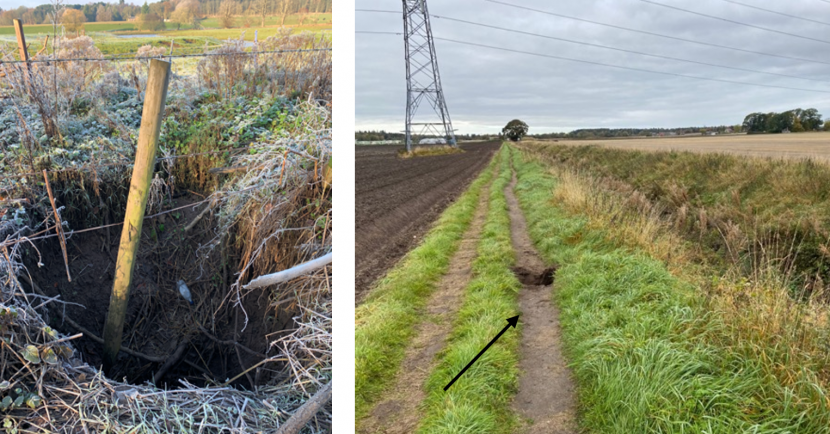
Both photos show collapsed sections of banking next to agricultural ditches caused by beaver burrowing underneath.
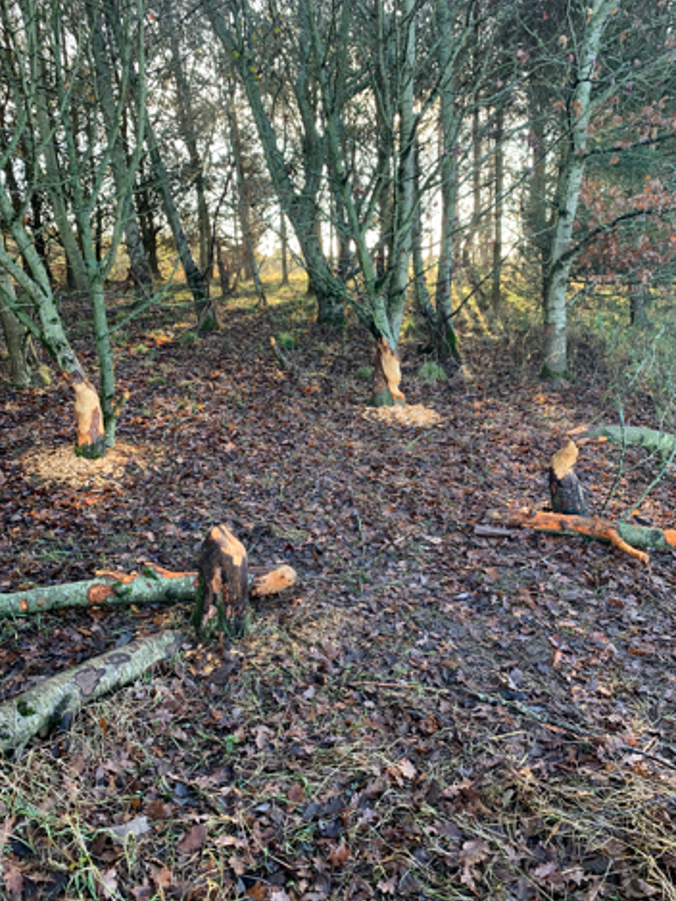
Several beaver felled trees in a hardwood plantation.
Annex 3: Mitigation
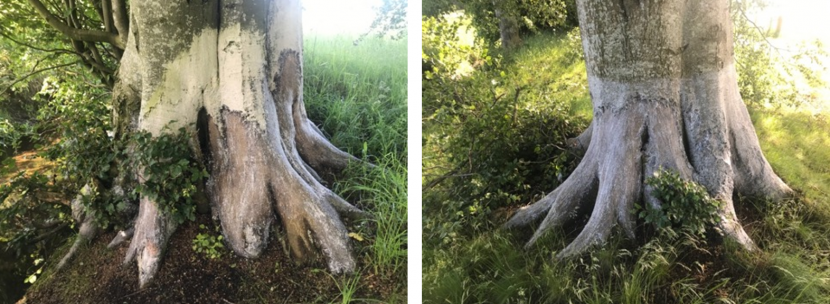
Both photos show lower section of mature trees previously protected with home-made sand paint mix which beavers then ring-barked, after which trees were further painted with ‘Wobra’ anti-game paint with no further beaver activity.
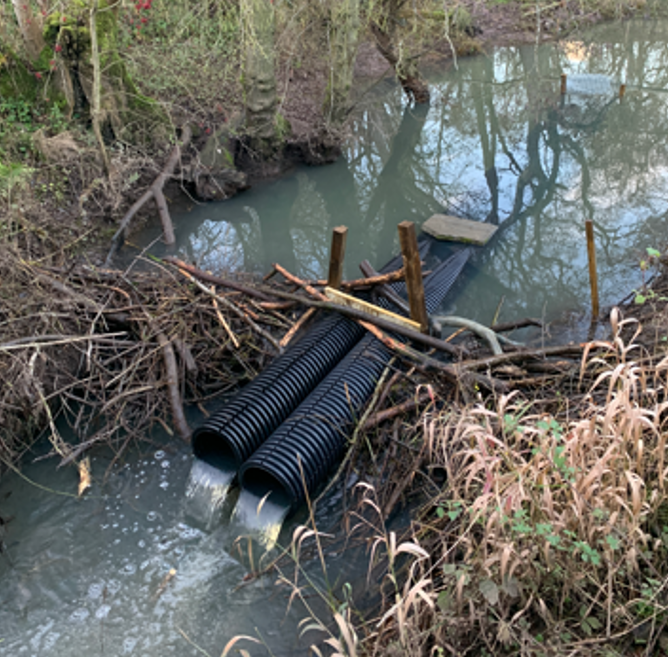
A flow device consisting of two land drainage pipes going through a beaver dam impounding water in small pond system.
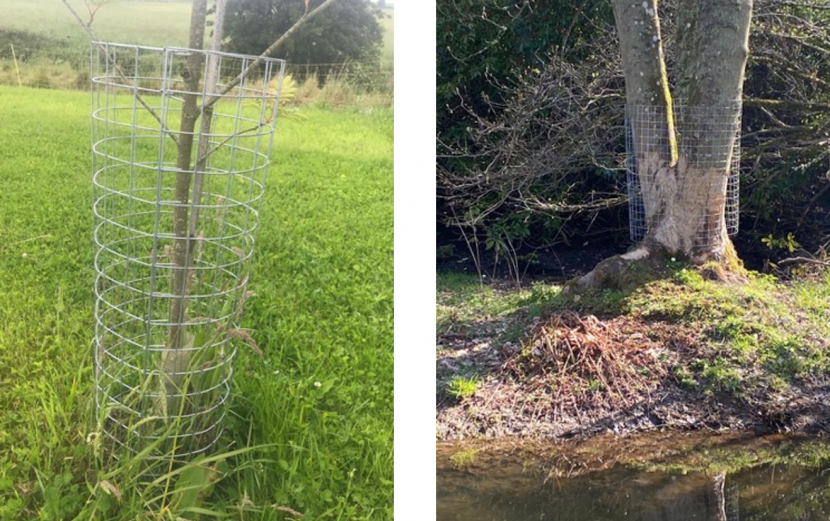
Metal mesh tree guards wrapped around the base of a tree - left image is an effectively protected tree, while the right image is an ineffective example.
Annex 4: Automated territory determination method
The combined field sign survey – automated identification of territories and expert review and refinement expert was developed in the 2017-2018 survey (Campbell-Palmer et al., 2018), the River Otter Beaver Trial (Brazier et al., 2020b), and also peer reviewed and published (Campbell-Palmer et al., 2020) so the reader is directed to those studies for full background. The major refinement in this study was switching the automated identification method from an ESRI ARCGIS based approach to an R-Stats based approach to increase replicability and ease of use. The methodology also allows a standard approach to be used for beaver surveys undertaken elsewhere. R-scripts used to estimate territories based upon feeding sign data and the workflow outlined in Figure 2 are included in this estimated territories R-scripts odt file (open in MS Word). Full scripts and example datasets for this territory determination approach are included online on GitHub Beaver tools.
Annex 5: Supplementary Results Figures
The following figures illustrate the process of territory determination to reach the final number and spatial extent reported. Annex 5. Figure 1 illustrates heat maps derived via KDE for all fresh and mixed signs recorded during the 2020/2021 field survey. This gives foundation areas of activity which were then cross-referenced with supplementary knowledge from third party sources (i.e. Mammal Society records and RSPB – Annex 5. Figure 2), key signs as listed in Table 2 and expert knowledge and interpretation by the authors to determine the final territories illustrated in Figure 8.
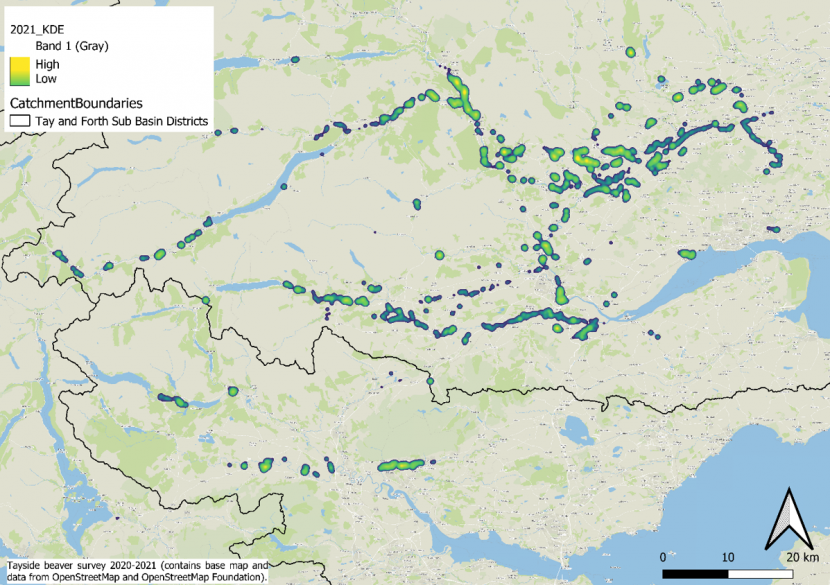
A map showing the output of kernel density estimate analysis for all survey signs from the 2020-2021 in the form of a heatmap. The spatial distribution of higher densities of signs will be used for territory estimation. Basemap data © OpenStreetMap contributors with data available under the Open Database License.
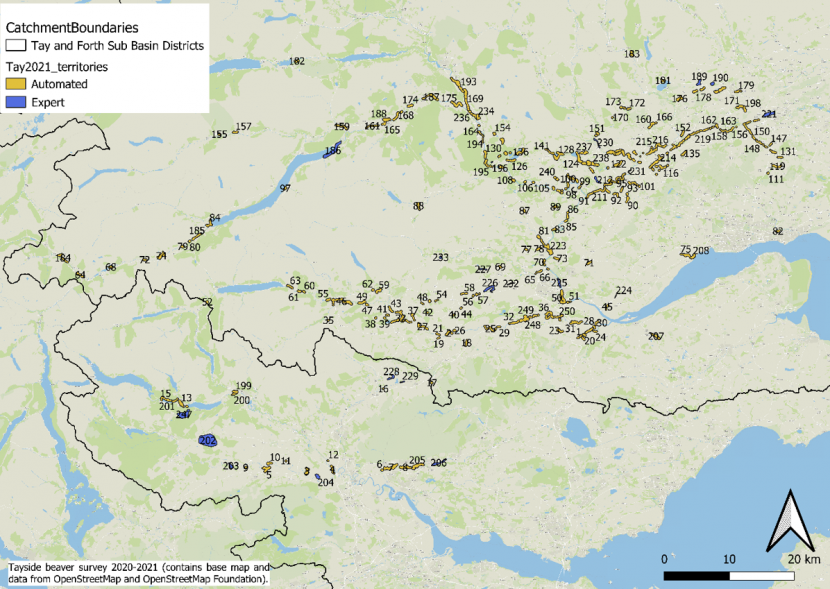
A map showing the location of all 251 territories for the 2020-2021 survey and the method by which they were determined i.e. expert or automated. Basemap data © OpenStreetMap contributors with data available under the Open Database License.
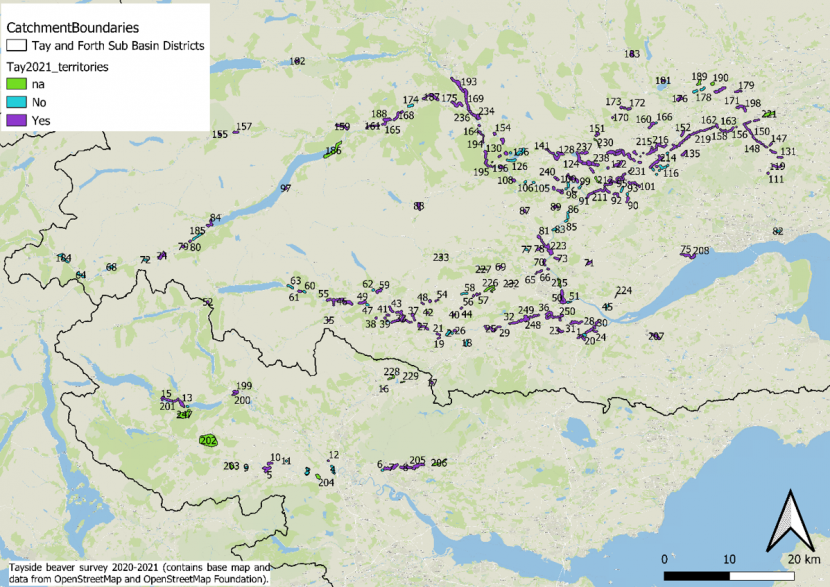
A map showing the location of all 251 territories for the 2020-2021 survey and whether they contained a key sign which added confidence to the automated process (i.e. dam, dwelling, food cache, scent mound). Purely expert defined territories are classed NA Basemap data © OpenStreetMap contributors with data available under the Open Database License.
Annex 6: Survey sign and territory example areas
To illustrate the data collected and the subsequent kernel density and territory analysis in more detail, examples from three areas in which beavers appear to be living at higher densities with bordering territories are shown in the following figures (Annex 6. Figures 1-6). For each area, the first figure shows all recorded signs separated by age and the resulting KDE heatmaps (noting that only fresh and mixed signs recorded were used in the generation of 2020/2021 KDE). The second figure then illustrates the location of key signs within the areas of interest and the final territory determination. The examples were chosen to illustrate how the methodology works with both isolated territories and areas of continuous intense beaver occupation along main rivers.
In addition, clusters of multiple territories, originally and partially separated through the KDE heatmaps, were subject to further analysis and expert opinions of field sign findings on the ground, any site specific local observations lethal control or trapping knowledge and in-depth understanding of beaver ecology and behaviours. This includes features such as presence of fresh scent marking indicative of borders between territories (Rosell & Nolet 1997). Also, the locations of active lodges are typically in the centre of territories as beavers are central place foragers, if territorial borders were hard to distinguish, the location of active lodge (often given time of year in combination with active food cache) was taken into consideration. Finally, at some sites known management including licenced lethal control and/or relocation had occurred so that specific knowledge was available.
All this comes with the caveat that the territorial boundaries depicted in Annex 6. Figures 1-6 may not precisely reflect the real-life situation. This could result in both over and underestimated territory numbers to some extent. However, at a landscape scale such methods are not presumed to drastically change final territory counts and, more importantly, have captured areas of current beaver activities (along with any potential conflicts).
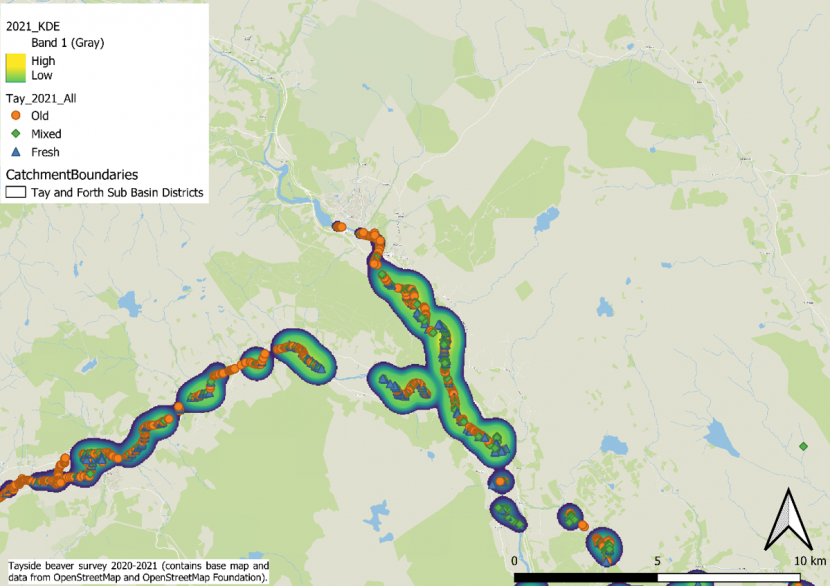
A zoomed example illustrating the location of all survey signs and the resulting KDE output in the area south of Pitlochry. This shows stretches of near continuous high-density mixed-aged signs. Basemap data © OpenStreetMap contributors with data available under the Open Database License.
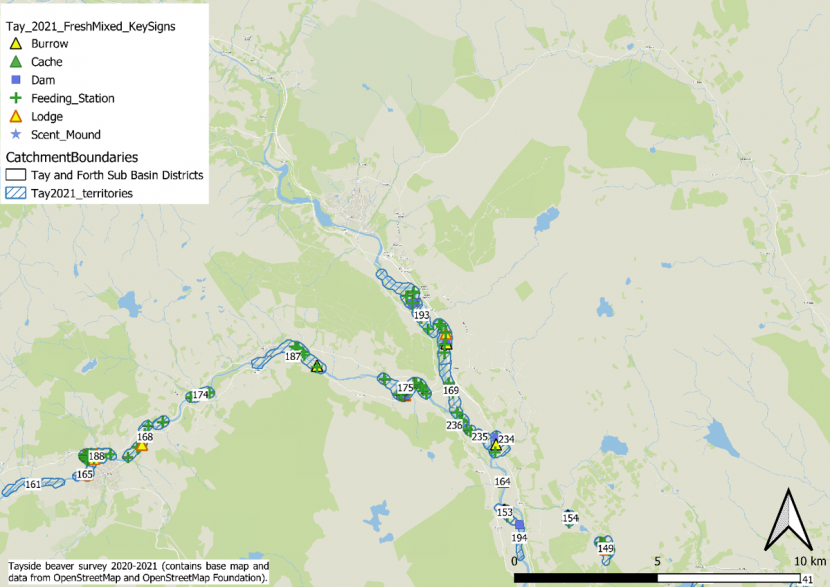
A zoomed example illustrating the location of key survey signs and associated territory estimates in the area south of Pitlochry. This figure also illustrates the impact of expert judgement and key signs upon territory determination, a long continuous stretch of activity was defined as two territories (territory 193) using the automated approach, but then further split into five different territories based upon expert judgement and local knowledge. Basemap data © OpenStreetMap contributors with data available under the Open Database License.
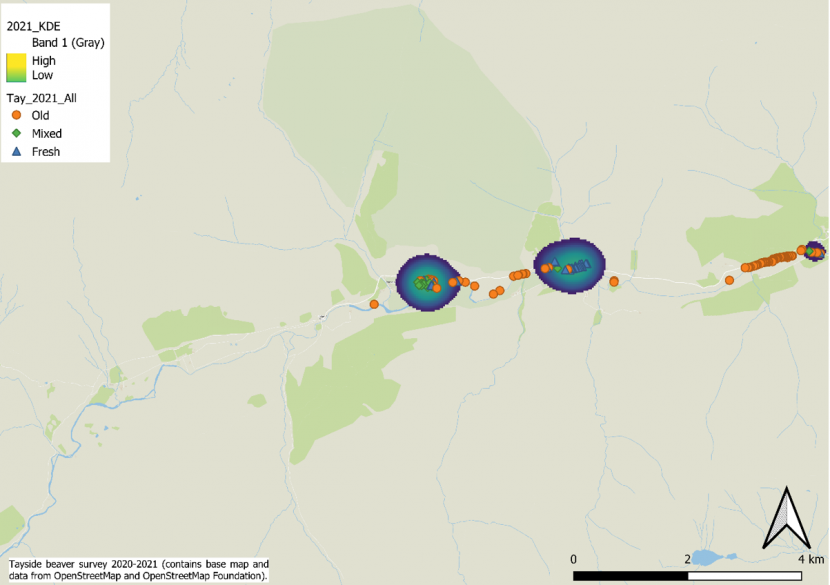
An example illustrating a situation near the Bridge of Balgie. The location of all survey signs shows two distinct clusters of fresh/mixed signs which are successfully detected via KDE analysis. Basemap data © OpenStreetMap contributors with data available under the Open Database License.
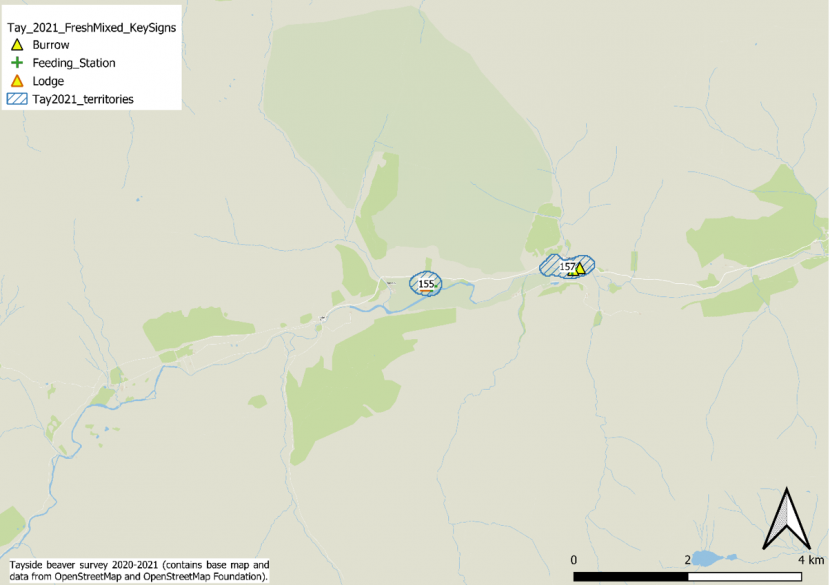
The territory and key sign locations near the Bridge of Balgie as an example of two distinct territories each containing multiple key signs (burrows, lodges and feeding stations). Both these territories were successfully detected using the automated approach alone and confirmed by expert judgement. Basemap data © OpenStreetMap contributors with data available under the Open Database License.
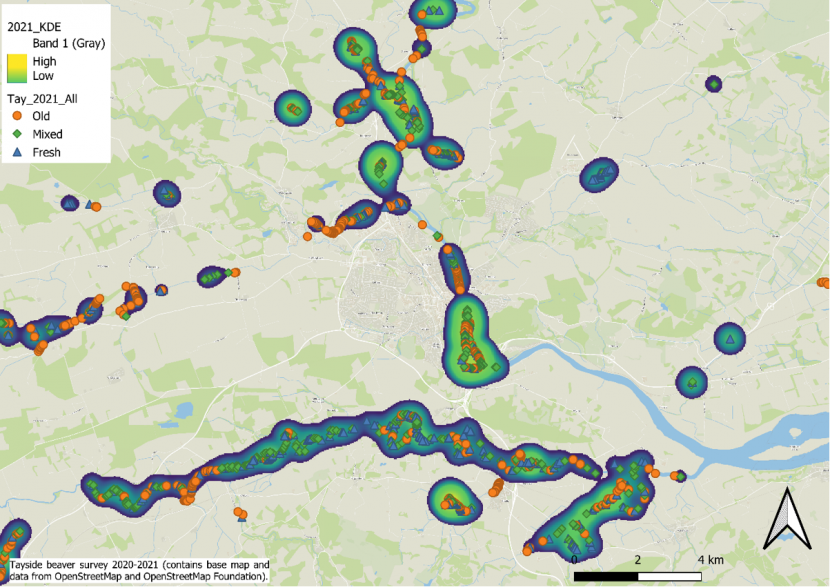
A third zoomed example illustrating the location of all survey signs and the resulting KDE output in the area surrounding Perth. Shows a highly complex situation of near continuous high density mixed-aged signs on main rivers and isolated outlying clusters on smaller water bodies. Basemap data © OpenStreetMap contributors with data available under the Open Database License.
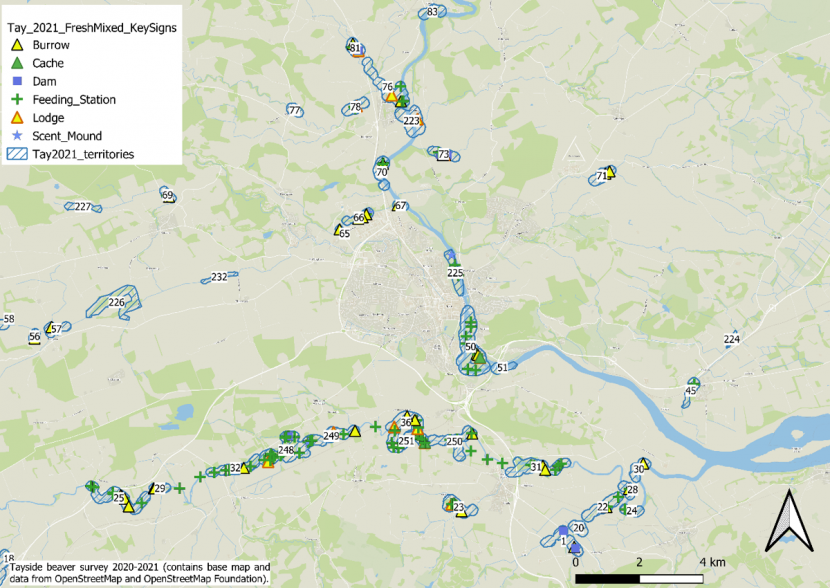
Territories and key signs for the third zoomed example illustrating the area surrounding Perth. To illustrate the impact of expert judgement and key signs upon territory determination, the complex section of activity containing territory 251 was defined as two territories using the automated approach, but then split into three different territories based upon expert judgement, location of key signs and local knowledge. It shows that despite the highly complex situation and near continuous beaver activity the combination of KDE analysis, key sign location and expert judgment can be used to estimate territory numbers. Basemap data © OpenStreetMap contributors with data available under the Open Database License
Annex 7: Area Of Interest
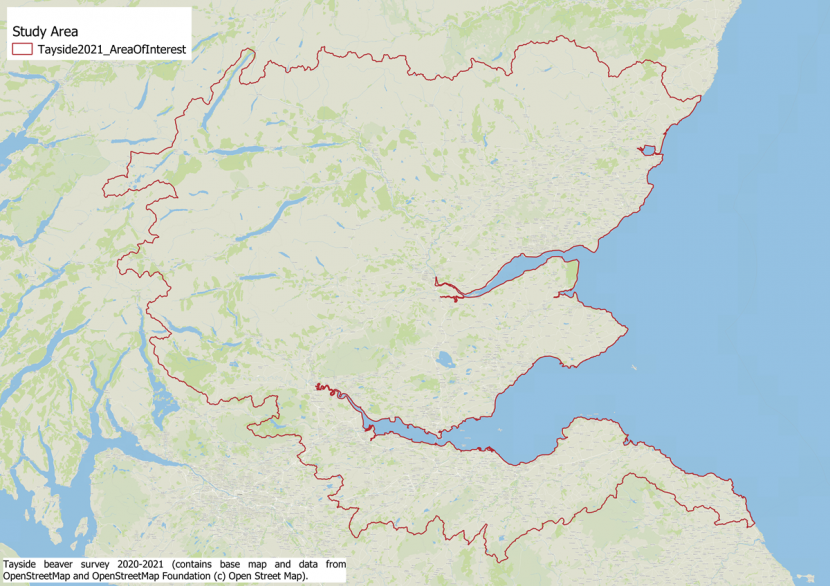
A map showing the area of interest used to calculate beaver density (the number of territories per km2). The area of interest covers river catchments that flow into the Firths of Tay and Forth. On the North Sea coast this ranges from Inverbervie in the north to Lamberton in the south.
Annex 8: Full Territory List
Table 1 provides a full list of all territories, the method by which they were determined, there area, mean sign density, if they contained a confirmatory sign and X and Y centre coordinates (British National Grid format) for each territory.
| Territory N | Confirm Sign | Mean Sign Density | Area_m2 | Method | X centre | Y centre |
|---|---|---|---|---|---|---|
| 1 | Yes | 4.5E-09 | 503513 | Automated | 315209 | 716164 |
| 2 | No | 5.03E-09 | 487456 | Automated | 294849 | 716863 |
| 3 | No | 8.68E-09 | 589037 | Automated | 273014 | 695604 |
| 4 | No | 3.78E-09 | 480205 | Automated | 276947 | 695865 |
| 5 | Yes | 2.72E-08 | 725462 | Automated | 266753 | 695973 |
| 6 | No | 8.05E-09 | 130862 | Automated | 284587 | 695785 |
| 7 | Yes | 2.3E-08 | 1060507 | Automated | 285936 | 696204 |
| 8 | Yes | 2.08E-08 | 775110 | Automated | 288138 | 696199 |
| 9 | No | 1.02E-08 | 162055 | Automated | 263596 | 696161 |
| 10 | Yes | 6.87E-09 | 330121 | Automated | 267247 | 696837 |
| 11 | No | 2.91E-09 | 90434 | Automated | 269792 | 697192 |
| 12 | Yes | 2.38E-09 | 88437 | Automated | 276252 | 697242 |
| 13 | Yes | 8.55E-09 | 582559 | Automated | 253672 | 706004 |
| 14 | No | 4.25E-09 | 124035 | Automated | 254562 | 705575 |
| 15 | Yes | 1.5E-09 | 687283 | Automated | 251270 | 706668 |
| 16 | Yes | 6.84E-10 | 75636 | Automated | 284741 | 708287 |
| 17 | Yes | 1.17E-08 | 130467 | Automated | 292203 | 709202 |
| 18 | No | 3.31E-09 | 341785 | Automated | 297545 | 715348 |
| 19 | Yes | 1.45E-09 | 144875 | Automated | 293258 | 716105 |
| 20 | No | 7.34E-09 | 222539 | Automated | 315684 | 716574 |
| 21 | Yes | 1.63E-09 | 208908 | Automated | 293179 | 716685 |
| 22 | Yes | 9.79E-09 | 495510 | Automated | 316440 | 717237 |
| 23 | Yes | 3.45E-08 | 450674 | Automated | 311912 | 717231 |
| 24 | Yes | 1.28E-09 | 204529 | Automated | 317353 | 717116 |
| 25 | Yes | 1.82E-09 | 792842 | Automated | 301229 | 717520 |
| 26 | Yes | 1.44E-08 | 178895 | Automated | 295708 | 717246 |
| 27 | Yes | 2.25E-09 | 687947 | Automated | 290769 | 717853 |
| 28 | Yes | 2.66E-09 | 198125 | Automated | 317214 | 717782 |
| 29 | Yes | 1.35E-09 | 175699 | Automated | 302521 | 717821 |
| 30 | Yes | 1.54E-09 | 273773 | Automated | 317578 | 718425 |
| 31 | Yes | 4.95E-09 | 777280 | Automated | 314351 | 718488 |
| 32 | Yes | 2.58E-09 | 526907 | Automated | 304888 | 718466 |
| 33 | Yes | 2.51E-09 | 1792072 | Automated | 287444 | 719131 |
| 34 | Yes | 1.2E-09 | 87241 | Automated | 285280 | 718780 |
| 35 | Yes | 1.19E-09 | 88037 | Automated | 276319 | 718809 |
| 36 | Yes | 3.04E-09 | 521744 | Automated | 310254 | 719888 |
| 37 | Yes | 1.59E-09 | 427813 | Automated | 289332 | 719386 |
| 38 | Yes | 2.55E-09 | 123657 | Automated | 283595 | 719176 |
| 39 | Yes | 3.85E-09 | 123258 | Automated | 284962 | 719164 |
| 40 | Yes | 1.37E-09 | 134071 | Automated | 295624 | 719664 |
| 41 | Yes | 1.72E-09 | 183287 | Automated | 285424 | 719630 |
| 42 | Yes | 2.91E-09 | 90446 | Automated | 291583 | 720011 |
| 43 | Yes | 4.1E-09 | 384984 | Automated | 285896 | 720489 |
| 44 | Yes | 2.24E-09 | 129269 | Automated | 296727 | 720702 |
| 45 | No | 5.89E-09 | 224323 | Automated | 319210 | 720888 |
| 46 | Yes | 1.32E-08 | 1531865 | Automated | 278332 | 721725 |
| 47 | No | 1.66E-08 | 187686 | Automated | 282258 | 721222 |
| 48 | Yes | 7E-10 | 147675 | Automated | 290750 | 721427 |
| 49 | Yes | 1.71E-08 | 478217 | Automated | 281491 | 721559 |
| 50 | Yes | 2.4E-08 | 1309197 | Automated | 312289 | 722272 |
| 51 | No | 3.92E-09 | 190229 | Automated | 313295 | 721617 |
| 52 | Yes | 2.47E-08 | 165650 | Automated | 257681 | 721647 |
| 53 | Yes | 1.33E-08 | 196901 | Automated | 291882 | 721780 |
| 54 | Yes | 1.3E-09 | 161283 | Automated | 292927 | 721873 |
| 55 | Yes | 6.71E-09 | 278918 | Automated | 276315 | 721983 |
| 56 | Yes | 2.91E-09 | 126469 | Automated | 298584 | 722599 |
| 57 | Yes | 1.02E-09 | 257341 | Automated | 299266 | 722829 |
| 58 | No | 2.41E-09 | 328177 | Automated | 297177 | 722929 |
| 59 | Yes | 2.5E-09 | 473822 | Automated | 284038 | 723347 |
| 60 | No | 3.66E-09 | 158063 | Automated | 272571 | 723217 |
| 61 | Yes | 2.38E-08 | 235693 | Automated | 271843 | 723294 |
| 62 | No | 1.46E-08 | 160474 | Automated | 283165 | 723490 |
| 63 | No | 5.48E-09 | 350935 | Automated | 270398 | 724005 |
| 64 | No | 3.19E-09 | 445269 | Automated | 238146 | 725781 |
| 65 | Yes | 5.14E-10 | 49229 | Automated | 308160 | 725966 |
| 66 | Yes | 1.69E-09 | 280166 | Automated | 308774 | 726331 |
| 67 | Yes | 1.26E-09 | 125275 | Automated | 310087 | 726709 |
| 68 | No | 6.65E-09 | 273252 | Automated | 242858 | 727000 |
| 69 | Yes | 1.8E-09 | 160491 | Automated | 302761 | 727038 |
| 70 | Yes | 2.32E-08 | 365418 | Automated | 309500 | 727755 |
| 71 | Yes | 2.75E-09 | 297386 | Automated | 316418 | 727644 |
| 72 | No | 2.96E-09 | 204847 | Automated | 248068 | 728115 |
| 73 | Yes | 3.89E-09 | 311388 | Automated | 311446 | 728322 |
| 74 | Yes | 1.91E-08 | 687772 | Automated | 250611 | 728744 |
| 75 | Yes | 1.54E-08 | 581423 | Automated | 331281 | 728850 |
| 76 | Yes | 1.71E-08 | 773803 | Automated | 309674 | 730438 |
| 77 | No | 9.49E-09 | 166497 | Automated | 306759 | 729700 |
| 78 | Yes | 3.97E-09 | 292173 | Automated | 308674 | 729808 |
| 79 | Yes | 1.06E-08 | 213659 | Automated | 253910 | 730165 |
| 80 | Yes | 8.98E-09 | 158445 | Automated | 254971 | 730977 |
| 81 | Yes | 1.71E-08 | 254551 | Automated | 308660 | 731653 |
| 82 | No | 3.89E-09 | 243777 | Automated | 345459 | 732526 |
| 83 | No | 8.69E-09 | 285372 | Automated | 311089 | 732793 |
| 84 | Yes | 2.41E-09 | 566572 | Automated | 258045 | 733679 |
| 85 | No | 6.08E-09 | 194919 | Automated | 312864 | 734126 |
| 86 | No | 6.47E-09 | 358219 | Automated | 313125 | 734977 |
| 87 | Yes | 3.38E-09 | 171300 | Automated | 306477 | 735653 |
| 88 | Yes | 4.17E-09 | 555479 | Automated | 290178 | 736422 |
| 89 | Yes | 2.59E-09 | 355014 | Automated | 311260 | 736265 |
| 90 | Yes | 1.58E-08 | 362635 | Automated | 322316 | 737402 |
| 91 | Yes | 5.81E-09 | 472596 | Automated | 316453 | 738096 |
| 92 | Yes | 6.12E-09 | 405060 | Automated | 320598 | 738152 |
| 93 | No | 6.06E-09 | 156502 | Automated | 322279 | 738228 |
| 94 | Yes | 3.96E-09 | 343473 | Automated | 311891 | 738745 |
| 95 | No | 3.44E-09 | 306598 | Automated | 321444 | 738962 |
| 96 | Yes | 1.61E-08 | 232940 | Automated | 310950 | 739120 |
| 97 | Yes | 3.38E-09 | 210080 | Automated | 269679 | 739103 |
| 98 | No | 5.23E-09 | 100862 | Automated | 312837 | 739046 |
| 99 | No | 2.91E-09 | 190118 | Automated | 314936 | 739265 |
| 100 | No | 5.41E-09 | 301785 | Automated | 313168 | 739634 |
| 101 | Yes | 2.74E-09 | 115276 | Automated | 324142 | 739414 |
| 102 | Yes | 1.61E-09 | 922849 | Automated | 319581 | 739985 |
| 103 | Yes | 7.65E-09 | 612800 | Automated | 323161 | 739879 |
| 104 | Yes | 9.44E-10 | 82851 | Automated | 315258 | 739826 |
| 105 | No | 6.58E-09 | 140083 | Automated | 307838 | 740038 |
| 106 | No | 5.89E-09 | 156491 | Automated | 306571 | 740105 |
| 107 | Yes | 1.02E-08 | 920166 | Automated | 313810 | 740648 |
| 108 | Yes | 9.12E-09 | 291768 | Automated | 304724 | 740367 |
| 109 | Yes | 2.47E-08 | 189365 | Automated | 311525 | 740493 |
| 110 | No | 4.99E-09 | 105670 | Automated | 326779 | 741255 |
| 111 | Yes | 6.23E-09 | 126891 | Automated | 343939 | 741447 |
| 112 | Yes | 9.12E-09 | 337812 | Automated | 316827 | 741895 |
| 113 | No | 2.93E-09 | 89660 | Automated | 327200 | 741883 |
| 114 | No | 4.48E-09 | 176117 | Automated | 326223 | 742031 |
| 115 | Yes | 4.42E-09 | 131284 | Automated | 319311 | 742256 |
| 116 | No | 1.59E-08 | 478320 | Automated | 327704 | 742369 |
| 117 | Yes | 1.63E-08 | 309775 | Automated | 302949 | 742385 |
| 118 | Yes | 1.5E-08 | 682052 | Automated | 326393 | 742866 |
| 119 | Yes | 2.97E-09 | 495959 | Automated | 345337 | 742519 |
| 120 | Yes | 3.65E-09 | 144096 | Automated | 326793 | 742471 |
| 121 | Yes | 5.93E-09 | 312270 | Automated | 300521 | 743203 |
| 122 | Yes | 2.16E-08 | 662427 | Automated | 320922 | 742840 |
| 123 | No | 2.89E-09 | 91261 | Automated | 328511 | 742627 |
| 124 | Yes | 3.99E-08 | 829168 | Automated | 314847 | 743781 |
| 125 | Yes | 2.33E-09 | 192126 | Automated | 324182 | 743115 |
| 126 | No | 1.07E-08 | 515095 | Automated | 304443 | 743419 |
| 127 | Yes | 6.98E-09 | 184921 | Automated | 323276 | 743441 |
| 128 | Yes | 3.13E-08 | 1056240 | Automated | 311651 | 744138 |
| 129 | Yes | 1.61E-08 | 494722 | Automated | 322557 | 744062 |
| 130 | Yes | 1.28E-08 | 477064 | Automated | 300446 | 744362 |
| 131 | Yes | 2.03E-09 | 259388 | Automated | 345785 | 743876 |
| 132 | Yes | 1.34E-09 | 156889 | Automated | 302612 | 744041 |
| 133 | Yes | 5.07E-10 | 50033 | Automated | 324297 | 744030 |
| 134 | Yes | 2.23E-08 | 397374 | Automated | 321658 | 744578 |
| 135 | Yes | 4.82E-09 | 393868 | Automated | 330990 | 744480 |
| 136 | No | 1.26E-08 | 667187 | Automated | 305887 | 744721 |
| 137 | Yes | 6.28E-08 | 279759 | Automated | 303601 | 744497 |
| 138 | Yes | 3.51E-09 | 292191 | Automated | 323440 | 744582 |
| 139 | Yes | 1.91E-09 | 825878 | Automated | 326090 | 744803 |
| 140 | No | 4.46E-09 | 130087 | Automated | 328427 | 744520 |
| 141 | Yes | 1.9E-09 | 456274 | Automated | 310350 | 744756 |
| 142 | No | 9.32E-09 | 113265 | Automated | 304291 | 744567 |
| 143 | Yes | 5.01E-10 | 51234 | Automated | 324748 | 744553 |
| 144 | Yes | 2.65E-09 | 357458 | Automated | 344727 | 744733 |
| 145 | Yes | 2.42E-09 | 502173 | Automated | 329396 | 745417 |
| 146 | Yes | 7.72E-10 | 134897 | Automated | 343637 | 745484 |
| 147 | Yes | 1.57E-09 | 184133 | Automated | 344333 | 745872 |
| 148 | Yes | 1.44E-09 | 454726 | Automated | 342682 | 746142 |
| 149 | Yes | 4.49E-09 | 428243 | Automated | 303079 | 746446 |
| 150 | Yes | 3.2E-09 | 246976 | Automated | 341727 | 746949 |
| 151 | Yes | 4.26E-09 | 321403 | Automated | 317641 | 747435 |
| 152 | Yes | 4.3E-09 | 355041 | Automated | 330800 | 747558 |
| 153 | Yes | 1.65E-09 | 245756 | Automated | 299555 | 747711 |
| 154 | Yes | 1.79E-09 | 205715 | Automated | 301844 | 747506 |
| 155 | Yes | 3.4E-09 | 185658 | Automated | 259528 | 747442 |
| 156 | Yes | 2.1E-09 | 697352 | Automated | 340782 | 748310 |
| 157 | Yes | 2.12E-09 | 297698 | Automated | 262007 | 747744 |
| 158 | Yes | 2.2E-09 | 790155 | Automated | 337687 | 748055 |
| 159 | Yes | 1.45E-09 | 617068 | Automated | 278356 | 748611 |
| 160 | Yes | 1.49E-08 | 500332 | Automated | 325992 | 748830 |
| 161 | Yes | 8.5E-10 | 563967 | Automated | 283054 | 748685 |
| 162 | Yes | 5.73E-09 | 275792 | Automated | 336056 | 748699 |
| 163 | Yes | 5.12E-10 | 50035 | Automated | 339086 | 748558 |
| 164 | Yes | 2.65E-09 | 109260 | Automated | 299471 | 748781 |
| 165 | Yes | 5.06E-09 | 264197 | Automated | 284861 | 749034 |
| 166 | No | 2.95E-09 | 89259 | Automated | 326716 | 749181 |
| 167 | Yes | 1.59E-09 | 264189 | Automated | 342150 | 749572 |
| 168 | Yes | 5.11E-09 | 747562 | Automated | 286965 | 750342 |
| 169 | Yes | 2.99E-08 | 691173 | Automated | 297673 | 751968 |
| 170 | Yes | 3.95E-09 | 93260 | Automated | 319992 | 750008 |
| 171 | Yes | 1.87E-08 | 452836 | Automated | 339603 | 751661 |
| 172 | Yes | 1.18E-08 | 235753 | Automated | 322540 | 751345 |
| 173 | Yes | 1.11E-08 | 172881 | Automated | 321345 | 751552 |
| 174 | No | 1.92E-08 | 353375 | Automated | 288908 | 751815 |
| 175 | Yes | 2.45E-08 | 931696 | Automated | 296075 | 752064 |
| 176 | Yes | 3.73E-08 | 485930 | Automated | 330325 | 752892 |
| 177 | Yes | 2.64E-08 | 291200 | Automated | 336003 | 753956 |
| 178 | No | 2.15E-08 | 295002 | Automated | 332726 | 754021 |
| 179 | Yes | 4.04E-09 | 351849 | Automated | 339315 | 754028 |
| 180 | No | 5.92E-09 | 293803 | Automated | 333883 | 754396 |
| 181 | Yes | 5.15E-09 | 260975 | Automated | 327783 | 755711 |
| 182 | Yes | 3.17E-09 | 324127 | Automated | 271456 | 758693 |
| 183 | Yes | 2.43E-08 | 412269 | Automated | 322980 | 759787 |
| 184 | No | 7.61E-09 | 701375 | Automated | 235465 | 728406 |
| 185 | No | 4.72E-09 | 555863 | Automated | 256085 | 731715 |
| 186 | na | - | 1626883 | Expert | 277007 | 744932 |
| 187 | Yes | 3.05E-08 | 1012646 | Automated | 292138 | 753155 |
| 188 | Yes | 5.06E-09 | 594610 | Automated | 285270 | 749668 |
| 189 | na | - | 412833 | Expert | 333340 | 755394 |
| 190 | na | - | 237476 | Expert | 335384 | 755199 |
| 191 | Yes | 2.64E-08 | 515363 | Automated | 336854 | 754377 |
| 192 | Yes | 1.11E-08 | 155731 | Automated | 321834 | 751470 |
| 193 | Yes | 2.99E-08 | 1982404 | Automated | 296644 | 754602 |
| 194 | Yes | 1.65E-09 | 316047 | Automated | 300062 | 746812 |
| 195 | Yes | 5.93E-09 | 349697 | Automated | 301007 | 742567 |
| 196 | na | - | 50670 | Expert | 301463 | 743134 |
| 197 | Yes | 3.99E-08 | 512698 | Automated | 316361 | 742994 |
| 198 | Yes | 1.87E-08 | 352935 | Automated | 340349 | 751286 |
| 199 | Yes | 1.57E-08 | 350881 | Automated | 262009 | 707826 |
| 200 | Yes | 1.57E-08 | 223197 | Automated | 261764 | 707456 |
| 201 | Yes | 1.5E-09 | 314696 | Automated | 252744 | 706507 |
| 202 | na | - | 4082794 | Expert | 257793 | 700341 |
| 203 | na | - | 280400 | Expert | 261339 | 696435 |
| 204 | na | - | 386793 | Expert | 274668 | 694803 |
| 205 | Yes | 2.08E-08 | 934390 | Automated | 289975 | 696413 |
| 206 | na | - | 604032 | Expert | 293287 | 696909 |
| 207 | Yes | 2.68E-09 | 567730 | Automated | 326696 | 716368 |
| 208 | Yes | 1.54E-08 | 428867 | Automated | 332393 | 728622 |
| 209 | Yes | 3.99E-08 | 322583 | Automated | 315644 | 742950 |
| 210 | Yes | 5.81E-09 | 756484 | Automated | 318115 | 738804 |
| 211 | Yes | 5.81E-09 | 313494 | Automated | 319267 | 738683 |
| 212 | na | - | 345513 | Expert | 317628 | 740392 |
| 213 | Yes | 1.61E-09 | 969967 | Automated | 321231 | 740662 |
| 214 | Yes | 1.5E-08 | 433491 | Automated | 327305 | 743814 |
| 215 | Yes | 1.91E-09 | 94023 | Automated | 326077 | 745400 |
| 216 | Yes | 1.91E-09 | 743206 | Automated | 327379 | 745673 |
| 217 | Yes | 2.42E-09 | 544638 | Automated | 330501 | 746039 |
| 218 | Yes | 2.42E-09 | 380492 | Automated | 331524 | 746937 |
| 219 | Yes | 2.42E-09 | 503710 | Automated | 332643 | 747592 |
| 220 | Yes | 2.42E-09 | 632739 | Automated | 334518 | 748196 |
| 221 | na | - | 733463 | Expert | 344112 | 750533 |
| 222 | Yes | 2.1E-09 | 240114 | Automated | 340910 | 749247 |
| 223 | Yes | 1.71E-08 | 599419 | Automated | 310430 | 729369 |
| 224 | na | - | 50824 | Expert | 320497 | 722505 |
| 225 | na | - | 390364 | Expert | 311803 | 724591 |
| 226 | na | - | 799147 | Expert | 301157 | 723665 |
| 227 | na | - | 190505 | Expert | 300098 | 726673 |
| 228 | na | - | 334219 | Expert | 286010 | 710018 |
| 229 | na | - | 107085 | Expert | 287680 | 709330 |
| 230 | na | - | 268712 | Expert | 317640 | 746166 |
| 231 | na | - | 113093 | Expert | 322642 | 741731 |
| 232 | na | - | 138653 | Expert | 304388 | 724462 |
| 233 | na | - | 160481 | Expert | 293595 | 728486 |
| 234 | Yes | 2.99E-08 | 410063 | Automated | 299332 | 750052 |
| 235 | Yes | 2.99E-08 | 423631 | Automated | 298676 | 750346 |
| 236 | Yes | 2.99E-08 | 163503 | Automated | 298072 | 750906 |
| 237 | Yes | 2.04E-08 | 511919 | Automated | 315643 | 744583 |
| 238 | Yes | 3.99E-08 | 296176 | Automated | 317013 | 742884 |
| 239 | Yes | 3.99E-08 | 252673 | Automated | 317621 | 742728 |
| 240 | Yes | 2.47E-08 | 151241 | Automated | 311181 | 740750 |
| 241 | na | - | 16916 | Expert | 312687 | 740160 |
| 242 | Yes | 3.96E-09 | 134818 | Automated | 312204 | 738430 |
| 243 | na | - | 132897 | Expert | 314012 | 738790 |
| 244 | Yes | 2.23E-08 | 327394 | Automated | 320880 | 744891 |
| 245 | Yes | 2.23E-08 | 672979 | Automated | 319810 | 744615 |
| 246 | Yes | 2.23E-08 | 435973 | Automated | 320886 | 744494 |
| 247 | na | - | 1369663 | Expert | 254086 | 704336 |
| 248 | Yes | 2.58E-09 | 939266 | Automated | 306486 | 719022 |
| 249 | Yes | 2.58E-09 | 547716 | Automated | 307909 | 719467 |
| 250 | Yes | 3.04E-09 | 618507 | Automated | 311782 | 719294 |
| 251 | Yes | 3.04E-09 | 548765 | Automated | 310273 | 719308 |
