Central Scotland Green Network (CSGN) - Habitat Connectivity Map Guides
We have developed a user guide and a promotional brochure which explain how to use and understand the map. We have also pulled together a list of frequently asked questions about the map which you may find useful.
Any questions which are not covered in the documents below, please contact Isla Williams.
User guide
The CSGN 2021 Habitat Connectivity Map identifies areas of habitat across central Scotland which should be protected and improved, and key sites for connecting these habitats so that species can move between them. It is intended to support planners, developers, land managers and communities to improve habitat connectivity, to support the Scottish Government's commitments to protect and restore biodiversity and to develop nature-based solutions to the climate emergency. Through working towards a landscape of well-connected and nature-rich habitats across central Scotland, we aim to help sustain the vital benefits that nature provides, including air and water quality, flood protection and access to green space for health and wellbeing.
1. Introduction
The Central Scotland Green Network area, which stretches from Ayrshire and Inverclyde to Fife and the Lothians, has the most heavily fragmented habitats in Scotland. This has led to a decline in the area’s wildlife and reduced resilience to the impacts of climate change. The 2021 Connectivity Map focuses on habitat connectivity, indicating particular hotspots between existing habitats where stepping stones or corridors would be best placed to connect them. This aims to contribute to wider efforts to create a coherent ecological network1 across central Scotland that will build resilience against climate change, improve biodiversity and sustain the support system that nature provides for people and places across central Scotland.
1 Ecological coherence is defined as “when the full range of a particular habitat is fully functioning, sufficiently connected and resilient to allow the movement of species across its range, and for breeding to occur.’ (EcoCoLIFE Project Summary 2014-2019)
The map was created using a new Geographical Information System (GIS) spatial model developed by Forest Research². Using newly defined metrics, the model identifies areas of land between existing habitat patches where habitat creation or enhancement is likely to deliver improvement to connectivity.
2 BioCoRe: an interactive/adaptable landscape ecology approach for targeting restoration. Forest Research
1.1 What is Connectivity?
Many animal species rely on dispersal over a large area for their survival, in order to:
- maintain a healthy breeding population and avoid inbreeding
- find sufficient food
- escape threats like storms and diseases in particular areas.
When habitats such as woodland and wetland are fragmented into small habitat patches, connectivity is limited. Functional habitat connectivity is the degree to which habitat patches are joined up into habitat networks, and therefore the degree to which animals are able to travel between them. This takes into account the land use between habitat patches. Shifts in the range of species in response to climate change makes movement between habitat patches even more crucial to reduce the risk of regional extinction.
Habitat connectivity is one part of a larger picture of ecological coherence. The 2010 Lawton Report places it third in a ‘hierarchy of benefits’ to maximise the value of conservation management:
- Improve the quality of current sites by better habitat management.
- Increase the size of current wildlife sites.
- Enhance connections between, or join up, sites, either through physical corridors, or through ‘stepping stones’.
- Create new sites.
This map is a tool for factoring the dimension of connectivity between patches into overall strategies for habitat restoration. Connectivity is crucial, but we must also ensure that existing sites have thriving populations by improving the quality of and expanding source habitats. Connectivity is also distinct from new habitat creation. If there are too few existing habitats to connect, connectivity opportunities will not appear, but this does not mean there are not opportunities for habitat creation in the area. On the contrary, a lack of connectivity opportunities indicates that habitat creation is needed.
2. Who is the Connectivity Map for?
The Connectivity Map particularly aims to support:
- Planners, developers and case officers in development management, to evaluate connectivity opportunities and needs at particular locations.
- Land managers and community groups, to account for habitat connectivity in work such as farm management, estate management and local community initiatives.
- The production of strategic documents such as Local Development Plans, when considered alongside other layers of data (see Section 4: Applying the Map).
3. Understanding the map
3.1 Habitat data used for the Connectivity Map
The map presents four broad habitat network types, as set out in the CSGN Delivery Plan 2025, as separate GIS layers:
| Habitat | Description of habitat | Colour represented |
|---|---|---|
| Woodland | Broadleaf, mixed and yew woodland | Green |
| Neutral grassland | Unimproved and species rich neutral grassland | Yellow |
| Wetland | Fen, marsh and swamp habitats | Blue |
| Bog and heath | Blanket, raised and modified bogs and heathland habitats | Purple |
Map which shows all four habitat types shown around Penwhapple Reservoir in South Ayrshire.
The map does not show acid or calcareous grassland habitats, nor does it show coastal, intertidal or marine habitats. Watercourses and open water are not included within the model, but can be identified from the base map or through other GIS layers used for analysis. Information on the current condition and future targets for rivers, lochs, coastal waters and groundwater can be found on the SEPA water environment hub.
The existing habitats shown on the Connectivity Map are limited to ‘natural’ or ‘semi-natural’ habitats. This means that they have not been significantly modified by humans; they have natural characteristics with a range of associated plant and animal species. Therefore, the existing habitats shown on the map do not include coniferous forest plantations or urban green spaces such as parkland.
Spatial digitised data has been gathered for the GIS model from:
- Habitat Map of Scotland (NatureScot³);
- National Forest Inventory (2017);
- Native Woodland Survey of Scotland (2012);
- Landcover Map of Scotland 88 (for upland areas only);
- Phase One habitat surveys (NatureScot) and
- Local Nature Conservation Sites, Local Biodiversity Sites and Sites of Importance for Nature Conservation (local authorities).
It was important to use publicly available data to ensure that the Connectivity Map is free to use by anyone. In addition, all of the habitat patches used for the model were allocated a ‘EUNIS’ classification4 to enable correlation with the Habitat Map of Scotland and other European data sets.
3 Habitat Map of Scotland.
4 Manual of terrestrial EUNIS habitats in Scotland
3.2 Understanding Dispersal Zones
The Connectivity Map identifies opportunity areas between existing habitat patches where habitat creation or expansion would be most effective for increasing connectivity. These are predicted based on:
1. Their dispersal distance from each habitat patch
Each type of habitat has a maximum dispersal distance, which is predicted based on the distance that a Generic Focal Species from that habitat can travel beyond a patch. Generic Focal Species are commonly used in habitat network modelling to take into account a range of species from each particular habitat. For this map, the following maximum dispersal distances were predicted for each habitat:
| Habitat type | Maximum dispersal distance (m) |
|---|---|
| Woodland | 500 |
| Neutral Grassland | 300 |
| Wetland | 150 |
| Bog and Heath | 500 |
This reflects the fact that woodland and bog/heath species are generally able to travel greater distances between habitat patches than wetland and neutral grassland species.
2. The permeability of the land
Some land types are harder for species to move across than others. For example, a woodland species may only be able to travel half as far through spruce plantation as through broadleaf woodland. A main road or intensive agriculture would block some species’ movement altogether. It is crucial to maintain permeable land between habitat patches: losing this to intensive land use or development would further fragment habitat networks and diminish the resilience of species. Different land cover types have been given different ‘cost values’ to reflect how permeable they are for species. If the land type surrounding a habitat patch has been scored as completely permeable (a cost value of 1), this means that a generic species can travel its maximum dispersal distance across the land. Species would only be expected to travel half the maximum distance across a land type with a cost value of 2.
Based on the dispersal distances for each habitat type in combination with the permeability scores for surrounding land, the model depicts dispersal zones around the habitat patches, which can be toggled on and off on the map.
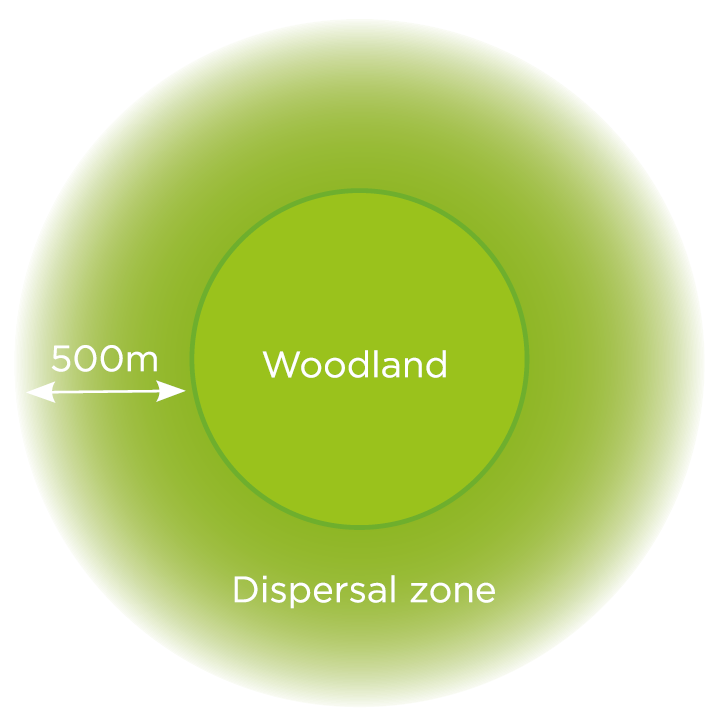
The graphic shows two green concentric circles. The inner circle is labelled 'woodland' and represents an existing habitat patch. The outer circle is the habitat patch's dispersal zone. It fades to a lighter green towards the edge and is labelled '500m'.
The dispersal zones around habitat patches are graded in lighter shades of each habitat patch colour. For example, Figure 2 shows purple bog and heath patches in Falkirk, while Figure 3 displays those surrounded by their dispersal zones, coloured lighter purple. The lightest purple outer ring is the maximum dispersal distance, while the slightly darker purple inner ring depicts the zone up to the quarter-point of the dispersal distance. The darker the colour, the more confidence there is in the area’s contribution to connectivity. The lighter the colour, the harder it is for species to disperse into that area.
Where the distance between two habitat patches falls within the maximum dispersal distance, the habitats can be described as ‘functionally’ connected, as there is potential for species to move between the patches. Functionally connected habitat patches create a habitat network. However, as dispersal distance is an average measurement, there will always be species from these habitats that cannot travel this far.
Map which shows bog and heath habitat patches near Falkirk.
Map which shows habitat patches with their quarter and maximum dispersal zones.
3.3 Understanding Opportunity Areas
There are two types of opportunity areas: Primary Opportunities and Secondary Opportunities. Primary Opportunities are coloured red on the map, while Secondary Opportunities are coloured orange. Both types of opportunity area may or may not already have small fragments of habitat within them.
Primary Opportunities appear within the maximum dispersal distance, where there is already some migration of species between habitat patches occurring. Primary Opportunities join together the halfway distances of dispersal zones for wetland and grassland, and the quarter distances of dispersal zones for woodland and bog/heath (which are marked in the same way by the darker inner ring of the dispersal zone). It is preferable to use quarter distances in order to support species with shorter ranges, however the dispersal distances for Wetland and Grassland are so short that a quarter of these would be too small for the model.
In general, Primary Opportunities are the quickest wins for achieving connectivity because they connect habitat patches that are closer together in terms of dispersal. This increases the chance of successful dispersal for species whose maximum range falls below the average dispersal distance for their habitat. Closer habitat allows for repeated movement into a new area, increasing species’ chance of success.
Map which shows primary opportunities for bog and heath near Falkirk.
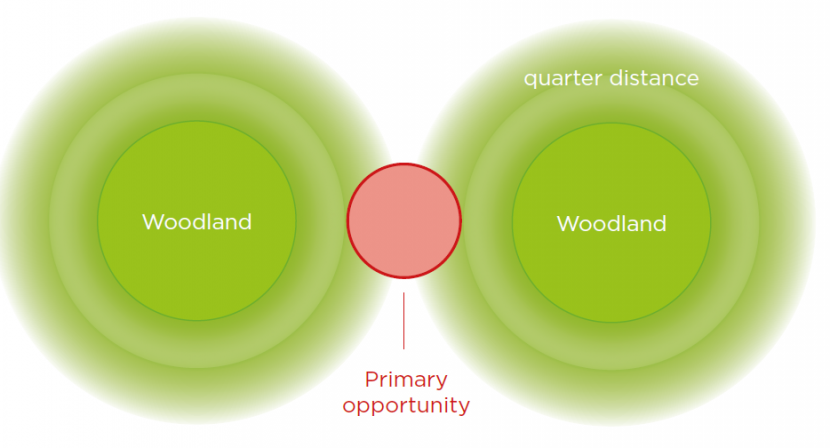
This graphic shows two green circles side by side and just touching. There are two smaller circles within each. For both, the inner circle represents a woodland habitat patch. This is surrounded by a circle labelled ‘quarter distance’. This in turn is surrounded by a larger circle which fades to a lighter green and represents the maximum dispersal distance. In between is a much smaller pink circle labelled ‘primary opportunity’. The edges of this join together both quarter distances.
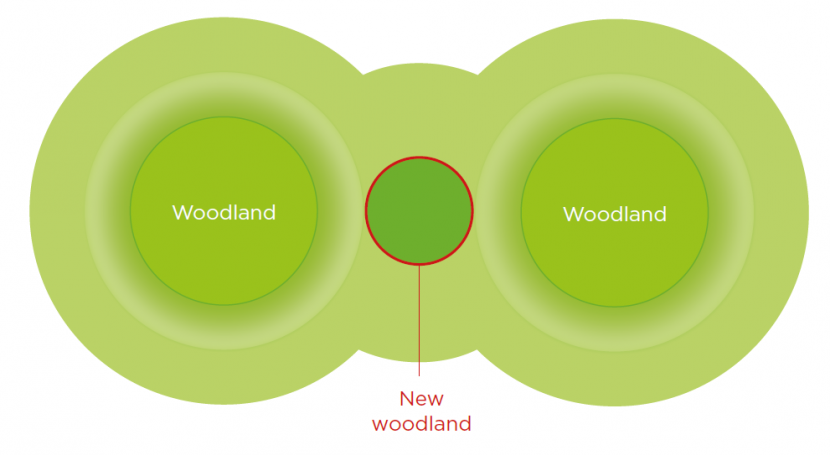
This graphic shows the same woodland patches surrounded by their quarter and maximum dispersal distances. However, in place of the pink primary opportunity is a darker green circle labelled ‘new woodland’. Around this ‘new woodland’ circle, there is now a dispersal zone. There is no line between this and the maximum dispersal zones of the two original patches, showing that the woodland patches are now functionally connected.
Secondary Opportunities connect the maximum dispersal distances of each patch. As can be seen from Figure 5, which shows secondary opportunities for bog/heath near Falkirk, these appear between rather than within the dispersal zones.
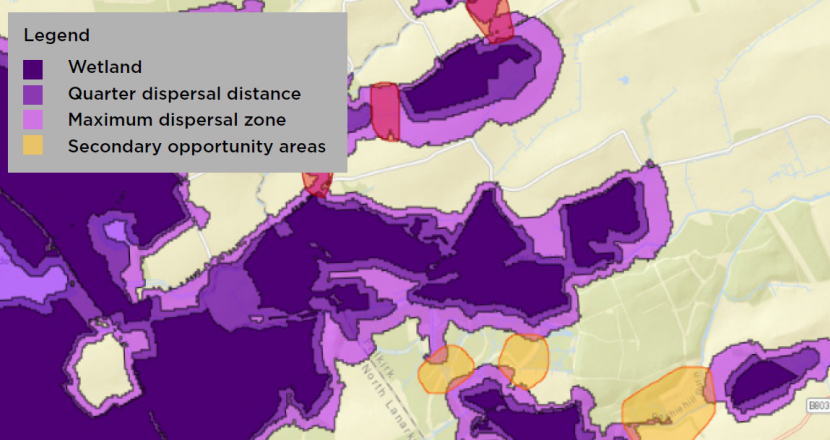
Map which shows primary opportunities and secondary opportunities near Falkirk.
Enhancing or creating habitats in either type of opportunity area will expand the range of species populations beyond current dispersal zones.
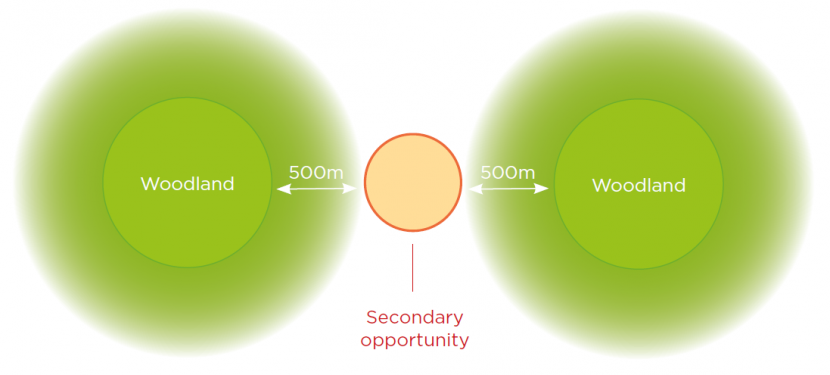
This graphics show two green woodland patches surrounded by their lighter green 500m dispersal zones. They are farther apart that in the previous graphics. In between the edges of the two dispersal zones is a small orange circle labelled ‘secondary opportunity’.
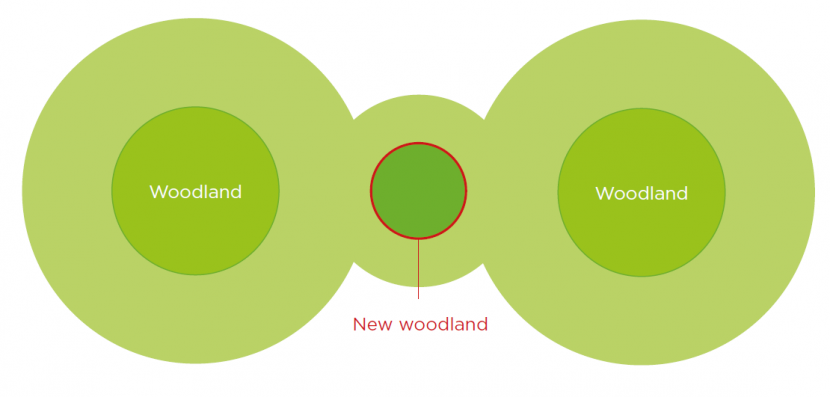
This graphic show the woodland patches with their dispersal zones, the same distance apart. The secondary opportunity has been replaced by a dark green circle labelled ‘new woodland’. It is surrounded by a dispersal zone that merges into the dispersal zones of the original patches, showing that they are now functionally connected.
3.4 Evaluating Opportunity Areas
It is recommended that each habitat type is initially viewed alongside the other habitat layers, to ensure that the full range of habitats in an area are included in the decision-making process. It is possible for two or more habitat networks to overlap (for example, a wooded wet area may naturally be part of a wetland habitat network) and therefore for opportunity areas to overlap with other habitat patches. The below screenshot illustrates this, showing several Primary Opportunities for connecting bog/heath habitats which fall across wetland habitat patches. When opportunity areas appear over other habitats, the needs and benefits of different habitat types must be evaluated.
Where opportunity areas for woodland or grassland have appeared over bog/heath habitat, these have been removed as part of the Quality Assurance process. This decision was taken due to the importance of bog/heath for carbon sequestration, which means that as a rule it should be prioritised over woodland and grassland. Where other opportunity areas and habitat patches overlap, these have been left, so that possibilities for integrating the needs of different habitat networks can be assessed according to specific contexts.
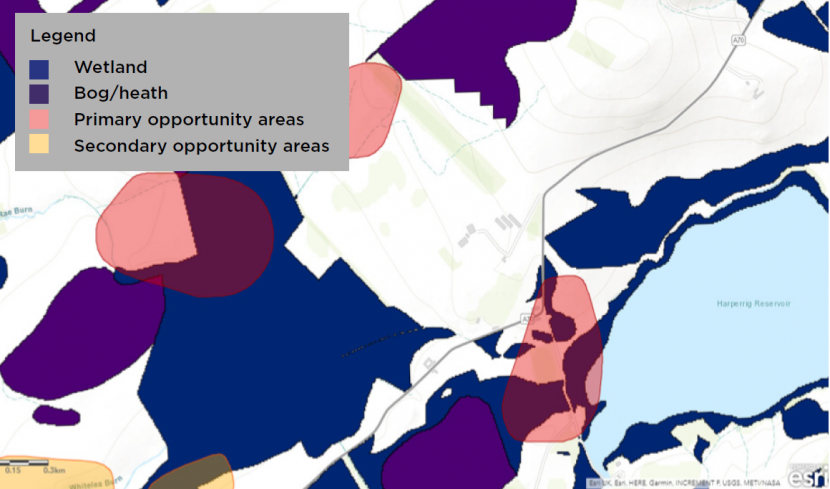
Map which shows bog/heath opportunity areas overlapping wetland near Harperrig Reservoir in West Lothian.
4. Applying the map
As the Connectivity Map focuses purely on where to connect existing habitats, the model should be looked at alongside other datasets, as a tool to factor connectivity into wider habitat management strategies.
Other data layers for consideration will depend on the particular project; but may include:
- JHI soils maps and peatland maps
- Buglife B-Lines
- IFF habitat network
- Scotland's Greenspace map
- RSPB and SWT Reserves
- Vacant & Derelict Land Data from Scottish Government's Spatial Hub
- Designated sites
- NatureScot carbon and peat data
When prioritising opportunity areas for connectivity, the quality of the habitat networks that the opportunities connect should also be considered. Generally, larger and wider habitat networks are more valuable than smaller and thinner networks.
The next stage for assessing the suitability of opportunity areas is to conduct appraisals on the ground. Collecting local information such as soil type, contamination, land ownership and management history will help to determine where, and in what form, habitat work would be best placed.
5. Background information
5.1 Links with the Integrated Habitat Network map
The Integrated Habitat Network map, produced in 2011, is still available to use on Scotland’s Environment website (www.environment.gov.scot) and via NatureScot’s website. Like the Connectivity Map, the IHN map shows habitat patches with dispersal zones around them. Feedback from users of the IHN map indicates that while it was useful to inform green networks for development plans, some found that more could be done to help the user interpret where to prioritise new habitat creation. As well as using newer and more consistent data, the Connectivity Map differs from the IHN in including opportunity areas.
5.2 Quality Assurance
A Quality Assurance process was required as part of the map’s production, as this was the first use of the new BioCore model at this scale. This involved simplifying the shapes of the opportunity areas and ensuring that opportunity areas align with the more up-to-date land cover data and aerial imagery available. Some judgement has therefore been made through the QA process to ensure that the final map is visually legible. Opportunities overlapping long-term built infrastructure such as road and houses have been removed, unless habitat creation might be possible around these.
As with all spatial digitised data, the map is a snapshot in time which relies on the accuracy of the field work and the digitisation of the field survey maps. Therefore, margins of error and changes of land cover are expected. The CSGN Delivery Plan will be reviewed every 5 years, and if there is a need for addition of more recent data, or other habitats layers within the model, this will be considered at the next review.
To request data files or for user support, please contact Isla Williams at [email protected]
Promotional brochure
We are currently seeing a crisis of biodiversity loss. One million species globally and 11% of all species in Scotland are threatened with extinction, largely due to habitat loss. Habitats in Scotland have become extremely fragmented, which limits species’ ability to move between different areas.
Species need to be able to move in order to maintain healthy populations in the face of threats like diseases and climate change. We depend on healthy biodiversity to support food production, air and water quality, our resilience to climate change effects such as flooding, and our health and wellbeing. Restoring and connecting habitats must therefore be a high priority.
The Central Scotland Green Network (CSGN) is the largest greenspace infrastructure programme in Europe. Its geographical area spans the central belt of Scotland, stretching from Ayrshire and Inverclyde in the west, to Fife and the Lothians in the east. It has 3.5 million residents: around two thirds of Scotland’s population.
Part of the Scottish Government’s National Planning Framework, the CSGN involves multiple agencies working together to connect green and blue spaces across Central Scotland. The CSGN aims to be delivered by 2050 and involves the restoration of at least 20% of degraded habitats in the area. This is key for protecting biodiversity, for mitigating and adapting to the climate emergency through nature-based solutions, and for enhancing Central Scotland’s landscape.
The 2021 Habitat Connectivity Map is a key part of this work. It uses the best available data to:
- Map existing woodland, wetland, neutral grassland, and bog and heath habitats in Central Scotland, which should be protected and enhanced.
- Predict opportunity areas where habitat corridors or stepping stones would be best placed to join up these habitats.
The 2021 habitat connectivity map was developed to guide decision-makers in targeting their resources to improve habitat connectivity. Habitat connectivity is the degree to which animals can move between habitat patches. If the distance is sufficiently small and the intervening land is sufficiently permeable, the patches are considered connected into a habitat network.
The map shows where existing habitat patches in Central Scotland currently form habitat networks. It also indicates 'opportunity areas' for improving connectivity, using data on the distance that species from different habitat types can travel through different land types. Opportunity areas are sites where habitat creation or enhancement would be best prioritised to reinforce and expand habitat networks.
Case Study:
Green Network Blueprint
The Habitat Connectivity Map is being used in the development of the Green Network Blueprint across the CSGN area. The Blueprint will be a framework for the creation of a network of habitats, public greenspace and active travel routes, and will be integrated into development proposals, grey infrastructure projects and public land management.
The Green Action Trust and Glasgow and Clyde Valley Green Network Partnership have been working with the Habitat Connectivity Map to incorporate its opportunity areas into the Blueprint, by analysing them against aerial photography and datasets such as vacant and derelict land, protected areas and local development plans. The next step will be to carry out further evaluation through site visits and talking to local contacts to determine specific issues such as land ownership and community needs.
Unconnected habitat patches: The top graphics show two green woodland patches surrounded by their lighter green 500m dispersal zones. They are farther apart that in the previous graphics. In between the edges of the two dispersal zones is a small orange circle labelled ‘secondary opportunity’.
Functionally connected patches - new habitat network: The bottom graphic show the woodland patches with their dispersal zones, the same distance apart. The secondary opportunity has been replaced by a dark green circle labelled ‘new woodland’. It is surrounded by a dispersal zone that merges into the dispersal zones of the original patches, showing that they are now functionally connected.
The 2021 Habitat Connectivity Map aims to help guide planning authorities, developers, and community groups. It can inform Local Development Plans, Open Space Strategies and new landscape scale initiatives. It also has potential for assisting farmers and land managers in improving habitat connectivity as part of agri-environment schemes, and guiding environmental assessments of new development proposals.
The Habitat Connectivity Map was developed by the CSGN Habitat Network workstream, a partnership between NatureScot, SEPA, Forestry and Land Scotland, Green Action Trust, Glasgow & Clyde Valley Green Network Partnership, RSPB, EcoCo Life, Scottish Wildlife Trust and Buglife. The work has been led by a project team within NatureScot.
Get in touch with the NatureScot project team at [email protected]
Frequently Asked Questions
Q. What are the licensing conditions of the map?
A. The data is available under the Open Government Licence.
Q. Has NatureScot published general User Guidance?
A. Yes, there is User Guidance available online.
Q. Will the base mapping and opportunity areas be monitored and updated over time?
A. Yes, the CSGN Habitat Monitoring Report is used to track progress against habitat objectives within the CSGN Delivery Plan. The map will be updated as required.
Q. The User Guide mentions permeability of land as a factor in modelling connectivity. Can you clarify what permeable land means?
A. If land is permeable, it means that it’s easy for species to travel across it. For example, broadleaf woodland would be very easy for a woodland species to move through, whereas coniferous woodland would be slightly more difficult, and a dual carriageway would be impermeable to species movement.
Q. Are active travel opportunities included within the map/guidance?
A. No, active travel is not included on this mapping but is incorporated into the work Glasgow & Clyde Valley Green Network Partnership and Green Action Trust are doing on the Green Network Blueprint.
Q. In terms of the planning process, how much consideration will be given to this type of identified area and opportunity given that they have no statutory or local protection?
A. The aim is for the Green Network Blueprint work delivered by the Glasgow & Clyde Valley Green Network Partnership and Green Action Trust and based on this connectivity map to be incorporated into Local Development Plans, Green Networks Supplementary Guide etc. It will be for Local Authorities to decide how they want to use the information available to support their objectives on green/blue infrastructure and nature networks.
Q. How do you go about identifying what habitat is priority e.g. grassland over woodland and what about where there is mosaic habitat?
A. We would recommend a site visit is always carried out to further explore the opportunities on the ground and this should take into consideration what habitat is already there, how this could be improved or where there is an opportunity to create some mosaic habitat.
Q. Can NatureScot provide some best practice examples on interventions to formulate fulfilment of primary and secondary opportunities, relative to each of the 4 core habitat types / Could you put together a document or some sort of story map detailing case studies?
A. This is an aim once projects which are using the map’s data have been completed. The new CSGN website shows some case studies of projects across the Central Scotland area, and these will be added to as more projects are delivered.
Q. Will be map be made interactive for user groups? For example, to determine the best areas to focus on new habitat/enhancement/how to prioritise?
A. The map will be available online so users without access to mapping software can view it, switch on and off the different habitat and opportunity layers and take prints of it.
Q. Are there any plans to monitor which opportunity areas have been improved and provide an up-to-date list of these?
A. Going forward, this is something we would like to do as part of the monitoring report. It will be difficult to do if relying only on data gathering by project, due to the number/scale of projects, so we are exploring the opportunities around using satellite imagery as this would provide more accurate detail as to what has or hasn’t been done on the ground.
Q. How small a scale are land types picked up at (e.g. gardens)?
A. The map picks up different areas of land cover at a scale of 10m2. If an area of land such as a garden is smaller than this, it will have been absorbed into the surrounding land cover type e.g. residential.
Q. Does the map contain any data on things to consider other than connectivity, such as carbon sequestration potential or land ownership?
A. No, the map is a GIS model of connectivity based on existing habitats and surrounding land types. Other important factors such as carbon sequestration and soil depth should to be cross-referenced with the map using other datasets. Local information such as current land ownership needs to be acquired through appraisals of the opportunity areas.
Q. I am aware of grassland habitat on the ground that has not been picked up by the map - why is this?
A. This may be due to the focus on Species Rich Neutral Grassland, which means other forms of grassland do not form part of the grassland layer. Neutral grassland was originally chosen due to its status as a priority habitat. Note that other types of grassland were captured as land cover types and their permeability to species has been included when modelling habitat networks.
In terms of neutral grassland, the current extent on the map was felt to be the best picture possible using the available datasets at the time. The spatial distribution of neutral grassland on the land cover map was also informed by local knowledge, with initial maps of the extent of all focal habitat types shared and reviewed with local landowners via a series of workshops held by Glasgow & Clyde Valley Green Network Partnership.
Q. Are there plans to incorporate the value of coniferous woodland?
A. Coniferous woodland has been separated from the broadleaf woodland layer because although broadleaved woodland species may utilise some small elements of pinewood, it is assumed they will find movement through these habitats more difficult. Consequently, for this network mapping, broadleaved and pinewood networks are considered to operate independently1. However, coniferous woodland was captured as a land cover type and its permeability to species has been included when modelling habitat networks.
Q. Do you have a list of the species that were used to identify dispersal distances for each habitat type?
A. Generic dispersal distances were not calculated as an average of species ranges; these were determined collectively by a panel of ecological experts2. The participants were asked to consider ‘moderately mobile’ species, as habitat networks are less applicable to the conservation of very sedentary or very mobile species.
1 Frequently Asked Questions about habitat networks.
2 This was done using the Delphi method of collecting the opinions of a range of experts through a series of questionnaires, due to the lack of one definitive scientific answer.
