Scottish Wildcat Action (SWA) Specialist Report - Genetics and Morphology
This report should be cited as: Kitchener, A.C, Senn H. (2023) Scottish Wildcat Action final report: Genetics and Morphology.
Authors and institutions: Dr Andrew C Kitchener, National Museums Scotland, Dr Helen Senn, Royal Zoological Society of Scotland.
Year of publication: 2023

Keywords
Wildcat, pelage, taxonomy, phenotype, hybridisation, genetic analysis, hybrids, introgression.
Background to SWA
The Scottish Wildcat Conservation Action Plan (SWCAP) was published in 2013 following the input of over 20 partner organisations. This led to the establishment of the Scottish Wildcat Action (SWA) project that ran from 2015-2020, funded by the Scottish Government, National Lottery Heritage Fund and others. SWA operated with a team of project staff managed by NatureScot, and associated work was carried out by various partner organisations. The overall work programme was steered by a group made up of ten of the partners. The International Union for Conservation of Nature (IUCN) Cat Specialist Group reviewed the work of the SWA, and other ongoing wildcat conservation work, and provided recommendations for future action (Breitenmoser et al., 2019). A wide range of topics relevant to wildcat conservation were covered during the SWA, and have now been published as a series of reports, of which this is one. These outputs will inform the next phase of wildcat conservation work in Scotland, including the SavingWildcats ‘SWAforLife’ project that runs from 2019-2026.
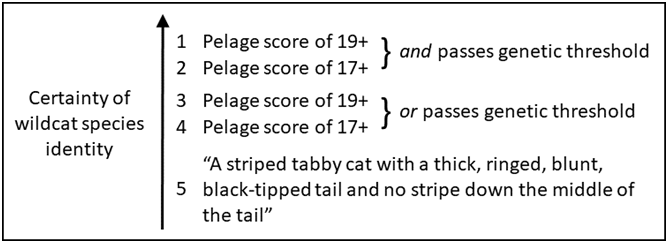
Wildcats hybridise with domestic cats and we use a combination of morphology and genetics to distinguish wildcats from domestic cats and their hybrids. The method applied is generally determined by the practicalities of management. For example, it is much easier to have high confidence in the pelage scores from a sedated cat, than from a camera-trap image taken at night. Genetic and pelage results can only be generated jointly in certain scenarios. Therefore, identifications under different situations have different levels of confidence associated with them. We therefore set different thresholds for identification of wildcats based on the ability to distinguish pelage and genetic characteristics in different situations. The confidence hierarchy, and the definitions used in this report, are given below.
Unless described otherwise, a wildcat in this report is defined as a cat with a 7PS pelage score of 19+ and/or that passes the genetic threshold for the genetic analyses. The consequences of applying different thresholds in different situations and management regimes are also examined.
Wildcat definition
Click for a full description
A graphic showing increasing certainty of wildcat identity over five levels as more information on pelage and genetic status are available.
It reads:
Unless described otherwise, a wildcat in this report is defined as a cat with a 7PS pelage score of 19+ and/or that passes the genetic threshold for the genetic analyses. The consequences of applying different thresholds in different situations and management regimes are also examined.
A ‘wildcat’ in this report is defined at level 4 by a cat with a pelage threshold of 17+. Genetic information is not available for all cats and so is not used in population size assessments.
Background
The Scottish Wildcat Conservation Action Plan (SWCAT) contained a number of project elements and actions and this report addresses the following, for which NatureScot was the partner lead:
Project 3.3: Improve our knowledge of wildcat genetics and taxonomy.
Action 3.3.1: Assess the correlation between genetic markers and other diagnostic characteristics.
Action 3.3.2: Assess levels of hybridisation (and disease) in wild populations.
National Lottery Heritage Fund approved purpose:
“To continue monitoring and surveying of wildcat populations in the six priority areas (Pas). Camera-trap images will be screened and analysed. Samples of genetic materials from wildcats and feral cats will be collected to increase knowledge of hybridisation and genetic diversity, as well as disease.”
Summary of work
- Various morphological and genetic methods have been proposed in the past, in order to distinguish wildcats, Felis silvestris, from domestic cats, F. catus, and their hybrids. However, there has often been poor correlation between different methods so that their reliability is uncertain. Here we use genetic and morphological analyses to understand datasets of contemporary and historical wildcats.
- From 2015 to 2019, 118 whole dead cats were collected or made available from a wide variety of sources, including SWA, NatureScot, zoos and members of the public. These were measured, weighed, prepared as skins and skeletons, and samples were taken for subsequent analyses.
- To identify both living and dead specimens of wild-living cats in Scotland, colouration and markings of the fur were used following an analysis of museum specimens by Kitchener et al., (2005), which identified seven key characters of the pelage (7PS score) that distinguish wildcats from domestic cats and hybrids. During morphological analyses, a 7PS of 19+ was used to distinguish wildcats from domestic cats and hybrids in this sample (N.B. a conservative 7PS of 17+ was used to distinguish wildcats in the field, owing to uncertainty in scoring pelage characters).
- Undamaged skulls were scored for five characters to give a total score, the Skull Character Total (SCT) for each cat, which ranged from five (domestic cat) to 15 (wildcat).
- 529 samples were made available for genetic testing, including historic museum skins (n=60), contemporary wild-living dead cats (n=153), captive cats (n=72) and samples from cats that were subject to the TNVR (trap, neuter, vaccinate, return) management scheme (n=1116).
- A genetic test was developed and published, involving the application of 35 Single Nucleotide Polymorphism (SNP) markers, followed by the assignment of a hybrid score called “Q”. Q is an estimate proportion of wildcat ancestry with 0=domestic cat and 1=wildcat. Q has a lower boundary and an upper boundary (LBQ and UBQ, 90% posterior credibility interval). From a genetic management standpoint, cats are considered to be wildcats if LBQ ≥ 0.75, i.e. “pass the genetic threshold”.
- For pelage, the median 7PS of wild-living cats is 10.00 (n=86, range 7-18). Following Kitchener et al., (2005) none of the cats was scored as a wildcat based on pelage (7PS=19+). There was a significant, but weak, correlation with SCT (r2 = 0.1539, p=0.018). Median 7PS is 14.00 (n=57) for the period 1960-1995 and four specimens have a 7PS of 19+. For 1960-1995 the correlation between SCT and 7PS is significant (p = 0.0001) and is much stronger (r2= 0.6456).
- Genetic results show that hybridisation between wild-living wildcats and domestic cats in Scotland is extensive, with all datasets of contemporary wild-living cats showing high numbers of hybrids and few or no cats that could be classed genetically as wildcat.
- Both morphological and genetic data show that the current population of wild-living cats in Scotland shows a high level of introgressive hybridisation, with a continuum between domestic cats and the highest scoring hybrids. Historical analyses confirm that hybridisation has been occurring throughout the twentieth century but has increased since around 1995.
- Future conservation management of the wildcat in Scotland relies on the successful release and establishment of captive-bred wildcats with high 7PS and LBQ scores, into areas where future hybridisation with domestic cats and hybrids can be minimised.
Acknowledgements
The SWA project was supported by the National Lottery Heritage Fund.
It was also funded by the Scottish Government, NatureScot and the Royal Zoological Society of Scotland. Support and resources for associated work was also provided by all the Steering Group members: Cairngorms National Park Authority, Forestry and Land Scotland, National Museums Scotland (NMS), Scottish Land & Estates, NatureScot, Scottish Wildlife Trust, The National Trust for Scotland, The Royal (Dick) School of Veterinary Studies, The Royal Zoological Society of Scotland, The Scottish Gamekeepers Association, The Scottish Government, Wildlife Conservation Research Unit (WildCRU). In addition, Jenny Bryce and Fiona Strachan helped develop the project while Eileen Stuart, Alan Bantick and Andrew Kitchener chaired the Steering Group.
Additional sponsors, funders and contributors to SWA work included Aigas Field Centre, Ailsa Black, British Association for Shooting and Conservation, Cairngorm Brewery Company, Chester Zoo, Roy Dennis Wildlife Foundation, John Muir Trust, Loch Lomond & The Trossachs National Park, Lukas Ruiter Production, MyPetOnline, NFU Scotland, petDetect, RSPB, Scotland The Big Picture, Swift Ecology and The Highland Council.
We are also very grateful to the many academics, landowners and managers, farmers, foresters, keepers, captive collection managers, veterinary specialists and others who contributed valuable time and effort, members of the public who contributed funds and support, and in particular the many volunteers who got involved in the project.
SWA project staff (David Barclay, Roo Campbell, Hebe Carus, Calum Hislop, Keri Langridge, Emma Rawling, Nicola Tallach and Matt Wilson) contributed to the collection of, and coordinated the collection of, many samples and specimens analysed in this report. In addition to this, samples and specimens were collected by contractors, vets and researchers including Kerry Kilshaw, Roisin Campbell-Palmer, Kelsey Wilson, Kirstin Mair, Rhian Evans, Alice Bacon, Aberlour Veterinary Centre, Dunnydeer Veterinary Group, Fraser & Fraser Vets, Seafield Veterinary Group, Strathbogie Veterinary Centre and Thrums Vet Group. The authors would also like to thank the many volunteers who handed roadkill wildcat samples to SWA project partners, including NMS, over the years. Without these repeated individual efforts, these types of studies would not be possible. We are extremely grateful for your assistance.
We are also extremely grateful for the assistance of the captive wildcat-holding community in the UK, for their dedicated participation in collecting samples. We thank Louise Tomsett of the Natural History Museum in London and Mark Evans of the New Walk Museum in Leicester for their assistance with accessing historical wildcat material. We thank Danielle Gunn‐Moore at the University of Edinburgh for access to domestic cat reference samples. Laboratory work was conducted by Jennifer Kaden, Muhammad Ghazali and Karen Keegan at the RZSS WildGenes lab, with analysis assistance from Alex Ball. Ben Harrower and Carl Allott are thanked for assistance with visualising/mapping various aspects of genetic data. We thank Phil Bacon for his patience with databasing. We are also extremely grateful to Prof. Ian Jackson of the Medical Research Council Human Genetics Unit for sequencing of the ASIP gene and his informative discussion of black cats.
SNP analysis was funded by the Scottish Government, RZSS and the National Lottery Heritage Fund via grant to NatureScot. Genomic (ddRAD) analysis was funded by RZSS and National Lottery Heritage Fund via grant to NatureScot. All authoring institutions contributed staff time, in kind, to this project.
Specimen measurements, sampling and preparation were carried out by Phil Howard, Georg Hantke and Stephen Rodgers. We are very grateful to the Negaunee Foundation for their continued generous support of Stephen Rodgers as the Negaunee Curatorial Preparator.
Our final thanks to Mark Beaumont and Nobuyuki Yamaguchi for undertaking a critical review of this report.
1. Introduction
Wildcats hybridise with domestic cats and therefore they can be difficult to distinguish. However, there are morphological and genetic methods that can assist with this:
Various morphological methods have been proposed in the past, in order to distinguish wildcats, Felis silvestris, from domestic cats, F. catus, and their hybrids. Suminski (1962) proposed a systematic approach to scoring skull characters, which gave a putative percentage purity of wildcats. Kratochvíl (1974) proposed a system based on skull characters and measurements. Schauenberg (1969; 1977) developed two indices for distinguishing wildcats from domestic cats; the cranial index (CI) is the ratio between greatest skull length and cranial volume, with wildcats having a CI of <2.75 and cranial volume >35 cm3, whereas the gut index (GI) is the ratio between intestinal length and head-and-body length, where wildcats have a GI of 2.8 or less. However, these indices did not include or recognise hybrids. Easterbee et al., (1988) developed a discriminant function based on a multivariate analysis of skull measurements to distinguish between wildcats, domestic cats and hybrids. The problem with these methods is that they can only be used for dead cats and hence are not applicable in conservation management with live animals.
Discriminatory methods using pelage characters have only been developed in recent years, even though many of the characters have been proposed by a variety of authors (e.g., Pocock, 1934, 1951; Tetley, 1941; Haltenorth, 1957; Piechocki, 1997). Ragni and Possenti (1996) used various pelage markings and colours to distinguish between F. silvestris, F. lybica and F. catus based mainly on cats from Italy. However, the method developed by Kitchener et al., (2005) was used for the identification of dead and living wild-living cats (including camera-trap images) during the project (Annex 1), because it was developed on historic wildcat specimens from Scotland, which differ in some morphological characteristics from those of some wildcat populations in continental Europe (e.g. Pocock, 1951, Haltenorth, 1957). This methodology has been successfully applied to wildcats from France (Devillard et al., 2014) and was tested against Ragni and Possenti’s (1996) method and found to provide a better discriminatory approach. Kitchener et al., (2005) also found that five skull characters and intestinal lengths were highly correlated with wildcat pelage characters. The problem with morphological characters is that errors can be made when recording them, especially in a field situation or from camera-trap images, where characters may be indistinct or unrecorded.
There have been several attempts to develop molecular methods to distinguish wildcats from domestic cats and their hybrids (Beaumont et al. 2001; Pierpaoli et al. 2003; O’Brien et al. 2009; Driscoll et al. 2011), but until recently their discriminatory power has not been very strong. In part this is because the wildcat population in Scotland, from which samples were available, has varying degrees of domestic cat ancestry, and in part many of the pelage characters for striped tabby colouration and markings are genetically dominant and hence recessive alleles for other coat colours and markings remain hidden in heterozygous individuals. As new molecular methods continue to be developed, so the possibility of a powerful discriminatory genetic test has become possible. The use of SNPs, which allows a vast array of genetic variants across the genome to be assessed, has allowed the development of a panel of genetic characters to be used to distinguish between wildcats and domestic cats and also to assess the degree of hybridity in hybrids. This was first developed by Nussberger et al., (2013) on a panel of 96 SNPs, and later refined to a rapid and cost-effective test, based on 35 SNPs, which gives sufficient discriminatory power (Senn and Ogden 2015; Senn et al. 2019).
During the course of the project, dead cats, mostly roadkill, were collected and sent to NMS for assessment, measurement, sampling and preservation. Post-mortem examinations were also carried out by the R(D)SVS on each cat and muscle samples were sent to the RZSS’s WildGenes Lab for genetic testing. In addition to this, genetic samples were sent from cats derived from a variety of TNVR and surveying activities for testing. Here we report on the morphological and genetic assessment of wild-living cats collected during the course of the project, 2015-2019, and place it into the context of already published outputs during the course of the project (Senn and Ogden 2015; Senn et al. 2019 Howard-McCombe et al 2021).
2. Materials and methods
We consider two separate datasets: morphological and genetic.
2.1 Morphological dataset
From 2015 to 2019, 118 dead cats were collected or made available from a wide variety of sources, including SWA, NatureScot, zoos and members of the public. Cats were processed in batches at NMS, following a protocol developed with the R(D)SVS, so that specimens could be preserved for hybridisation research and post-mortem examinations could be carried out to find causes of death and significant pathologies.
Most cats arrived deep frozen and so were thawed prior to examination. All cats were photographed following the Cat Photography Protocol developed by National Museums Scotland (Annex 1) to record key pelage characters. This was important because not all skins from cats were preserved owing to prior decay. Even so, if cats were very wet or too badly damaged, it was not possible to record all or even any of the characters. All cats were measured and weighed following the Measurement Protocol (Annex 2) developed by NMS.
During post-mortem examinations, standard body measurements were taken in mm:
Total length (ToL) – from tip of nose to tip of tail excluding fur
Tail length (TL) – from root of tail to tail tip excluding fur
Head-and-body length (HB) – ToL minus TL
Hind foot length (HF) – from ankle to tip of longest toe excluding claw
Ear length (E) – from notch at bottom of the inside of the ear to ear tip excluding fur
Gut length (GL) – from the pyloric sphincter at the base of the stomach to anal sphincter in a straight line
In general, skins were removed from all donated dead cat specimens and preserved where possible. Skinned carcasses were made available to the R(D)SVS for post-mortem examinations. After these were complete, the skeletons were prepared, where possible, for further research. All 118 cats collected during this period have been registered permanently in NMS’s collections to create a permanent legacy of research by SWA.
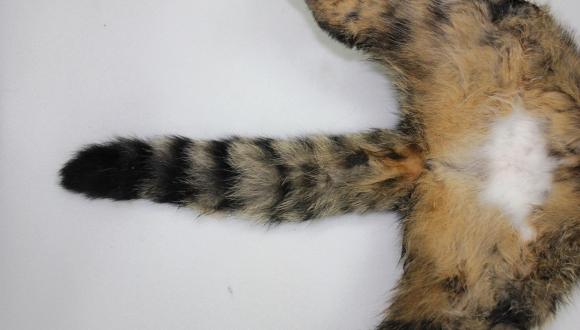
Skins or pelages were assessed directly or from photographs to score seven key pelage characters identified by Kitchener et al., (2005; modified slightly- see below) that distinguish wildcats from domestic cats and hybrids. Other characters were also recorded, e.g. white paws, white muzzle, which would indicate hybridisation.
The seven key pelage characters are:
- Shape of nape stripes
- Number of shoulder stripes
- Dorsal stripe ends at root of tail
- Broken stripes and spots on flanks (changed from ‘broken stripes on flanks and rump’)
- Broken stripes and spots on rump (changed from ‘spots on flanks and rump’)
- Completeness of tail bands
- Shape of tail tip
Skulls were assessed directly, and five skull characters were scored following Yamaguchi et al., (2004) (Figure 2)
- Shape of anterior nasal bones
- Presence of pit at posterior of nasal bones
- Length of nasal bones compared to maxillae
- Shape of interparietal suture
- Development of angular process on mandible
Scores of three were given to wildcat character states and scores of one for domestic cat character states. Intermediate character states were given a score of two. Where it was difficult to assign a character to a character state, an intermediate value was assigned, e.g. 2-3 or 1-2, and the average was taken.
Therefore, wildcats should have a seven-character pelage score (7PS) of 21 and a skull character total (SCT) of 15. In practice, there is some variation and 7PS may vary between 19 and 21 for wildcats and domestic cats may score up to 12. For the purposes of this report, wildcats are defined as having a 7PS of 19+ and domestic cats have a 7PS of <12.
Note that a lower conservative threshold of 7PS=17+ was used to score wild-living cats, in the field, because of the possibility of errors in scoring pelage characters in cats caught in live traps or camera-trap photographs. These errors are much less likely in cats examined during post-mortem examinations or as preserved specimens, so that the higher threshold is followed here from Kitchener et al., (2005). The hierarchy of confidence around different methods for scoring wildcats is given at the start of this report.
7PSs were recorded for 87 of the wild-living cats either directly from preserved skins or from photographs taken prior to processing. However, four could not be scored fully either because parts of bodies were missing, or the carcass was too decayed. SCTs were recorded for 74 skulls, but a further 15 could not be scored completely owing to damage in road traffic accidents. Captive cats were excluded from most of the analyses because they formed only a small proportion of the total and some were of European mainland origin. Statistical analyses were carried out using Past3.
Gut index was calculated as the ratio between gut (small + large intestine) length and head-and-body length (GL/HB), following Schauenberg (1977).
2.2 Genetic dataset
All genetic samples analysed during the project, and reported on here, were processed using the methods described in the protocol Senn and Ogden (2015). The relevance and robustness of these methods is examined in further detail in Senn et al., (2019). In brief, the genetic test involves the application of 35 SNP markers followed by the assignment of a hybrid score called “Q”. Q is an estimated proportion of wildcat ancestry with 0=domestic cat and 1=wildcat. Q has a lower boundary and an upper boundary (LBQ and UBQ, 90% posterior credibility interval). From a genetic management standpoint, cats are considered to be wildcats if LBQ ≥ 0.75. Further details of this test and an explanation of its power to detect hybridisation can be found in Senn and Ogden (2015) and Senn et al., (2019). The test performs well against measures using many more (thousands) markers as shown in (Senn et al. 2019; Howard-McCombe et al 2021).
In the production of this report, data were joined from three sources creating genetic records of 529 individual cats. All data was generated using the same genetic methodology and the results are therefore directly comparable. The three data sources are:
2.2.1 Source one
The published data in Senn et al., (2019) which, in turn, brings together historical and contemporary samples from the NMS, historical samples from NHM London and the New Walk Museum in Leicester, data from the SWA Priority Area Survey (Littlewood et al. 2014) and data from captive animals (see also Barclay and Senn, 2023) see SWA Conservation Breeding report. These datasets are already in the public domain and are described in some more detail in Senn et al., (2019).
2.2.2 Source two
Data collected during the project and logged in the SWA project wildcat database and provided to RZSS in extract SWA_DB_06_Snapshot_20190815 table “Aam_3_010_V_CatCapt_and_Genes_Full records ”. This contained 284 genetic records created by RZSS over the course of the project and matched to metadata generated by SWA field staff. A series of filters (Annex 3) was applied to achieve a rationalised dataset of 221 individual records for the purpose of this report.
2.2.3 Source three
Data from the 13 candidate cats reported on in the SWA Conservation Breeding report (Barclay and Senn, 2021). These data form the dataset 35https://osf.io/cj7zx/SNP_SWA_Candidate_BreedingProgCats.
Genetic testing of suspected wildcats has happened for many reasons over the course of wildcat research. Each sort of genetic sample may be associated with a particular type of collection bias. For this reason, effort has been made here to present each type of dataset individually, so that the potential for bias in each dataset can be more easily examined and understood. All datasets contained in the above three data sources are summarised in Table 1.
Please note that the datasets are referred to using a standard descriptor of the format of the type “35SNP_historical_cats”. This may seem cumbersome, but is done so as to remove any ambiguity when reporting the results. It would be useful if future analyses could adopt a similar approach, so that it is always clear which data are being described. The difficulty in aligning disparate wildcat datasets was commented on by Neaves and Hollingsworth (2013) in their review and due to the different recording styles and descriptors used by different projects over time, it is possible that some duplication exists, although every effort has been made to eliminate this.
| Source (See descript-tion above) | Dataset | N | Dates of sample collection (mean of known dates) | Sample locality summary | Wildcat (LBQ ≥ 0.75) | Hybrid (LBQ>0.25, UBQ<0.75) | Dom. (UBQ ≤ 0.25) | Collection bias |
|---|---|---|---|---|---|---|---|---|
| 1 | 35SNP_historical_cats | 60 | 1895–1987 (1937) | Scotland wide (N of Highland Boundary fault) | 54 | 5 | 1 | Shot cats given to and purchased by museums—possibly biased towards cats that look like wildcats |
| 1 | 35SNP_wildliving_dead_cats | 125 | 1989–2016 (2007) | Scotland-wide roadsides (mostly N of Highland Boundary Fault) | 21 | 87 | 17 | Predominantly roadkill—bias difficult to determine (see discussion of Senn et al., 2019) |
| 1 | 35SNP_wildliving_ survey_cats | 19 | 2013–2014 (2014) | SWA Priority Area Survey targeting wildcats | 0 | 19 | 0 | Survey of supposed wildcat areas—biased towards higher pelage score |
| 1 | 35SNP_captive_cats | 72 | 2017 | Living captive wildcats (see also the Conservation Breeding report) | 63 | 9 | 0 | Captive cats—founders biased towards higher pelage score cats |
| 1 | 35SNP_domestic_cats | 19 | 2014 | Edinburgh City Region | 0 | 0 | 19 | n/a |
| 2 | 35SNP_SWAScheme_TNVR
| 116
| - | Wildcat Priority Areas(mostly) | 0 | 93 | 23 | Part of a TNVR campaign [ in a Priority Area ]. Can include incidental captures of wildcats. See TNVR report. |
| 2 | 35SNP_SWAScheme_Survey
| 9 | - | Wildcat Priority Areas (mostly) | 1 | 8 | 0 | Hair (or saliva) resulting from a trail camera campaign [mainly in a Priority Area]. See Monitoring report. |
| 2 | 35SNP_SWAScheme_ WildcatTrap
| 13 | - | Wildcat Priority Areas (mostly) | 0 | 12 | 1 | A capture scheme specifically targeting (high quality) wildcat (hybrids) based on pelage; often for radio-collaring or genetic samples etc. |
| 2 | 35SNP_SWAScheme_RTA
| 28 | 2017-2019 | Scotland-wide roadsides | 0 | 25 | 3 | Road traffic accident. Usually an opportunistically found roadkill. |
| 2 | 35SNP_SWAScheme_Public | 55 | - | Scotland wide | 1 | 38 | 16 | Samples volunteered to SWA by others, e.g. Cats Protection, SSPCA, cat owners, vets etc. |
| 3 | 35SNP_SWA_ Candidate_ BreedingProgCats
| 13 | - | Scotland wide (outside Pas) | 0 | 13 | 0 | Cats trapped and tested as candidates for the conservation breeding programme, see the Conservation Breeding report. |
3. Results
3.1 Morphological results
Totals of 95 wild-living and 17 captive cats were available and preserved either completely or in part as skins and skeletons. Only data for wild-living cats are reported here. Tissue samples were archived in the NMS Biobank and sent to RZSS’s WildGenes Lab for genetic analysis.
The median 7PS of wild-living cats is 10.00 (n=86, range 7-18) [Figure 1] and the median SCT is 8.75 (n=48, range 5-15) [Figure 2]. Following Kitchener et al., (2005) none of the cats was scored as a wildcat based on pelage (7PS = 19+), but one cat had a SCT of 15. The frequency distributions for 7PS and SCT of wild-living cats show few high-scoring cats (Figs. 3 and 4). The correlation between 7PS and SCT (excluding captives) is significant (p=0.018), but weak (r2 = 0.1539) [Figure 3]. Median scores for each pelage character ranged from 1.00 (nape and shoulder stripes, tail bands and tip) to 1.50 (dorsal, flank and rump stripes), but did not reach an intermediate score of 2.00. Median scores for each skull character ranged from 1.00 (anterior and posterior nasals) to 3.00 (angular process), so that these spanned the intermediate score of 2.00. Classification of 99 cats, based on their pelage character scores, or pelage characteristics, identified 53 as domestic cats (7PS≤12) and 46 as hybrids (7PS = >12 & <19), giving a proportion of 46.46% hybrids of the total number (n=99) of cats. Excluding captive animals reduced the proportion to 41.18% hybrids (n=85).
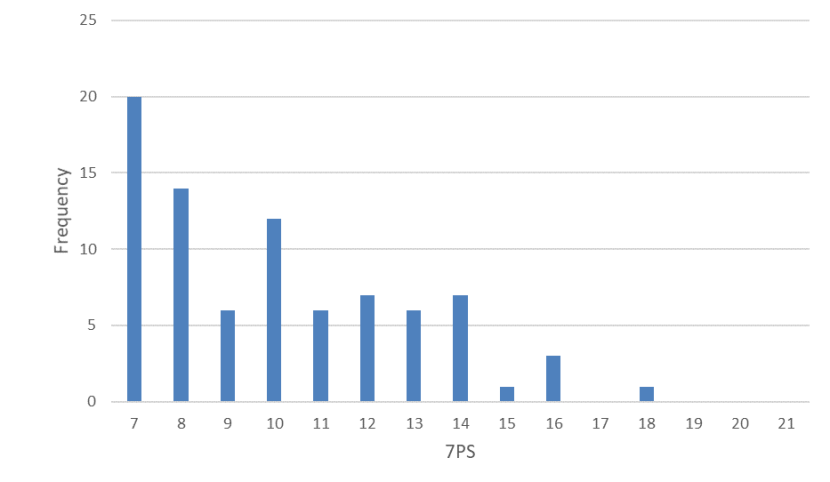
Figure 1: Frequency distribution of 7PSs of wild-living cats from Scotland 2015-2019
Click for a full description
Frequency distribution of 7PSs of wild-living cats from Scotland 2015-2019. The data show a general decline in frequency from 7PS=7 to 7PS=18 and no cats scoring above 18 and only one cat above 17.
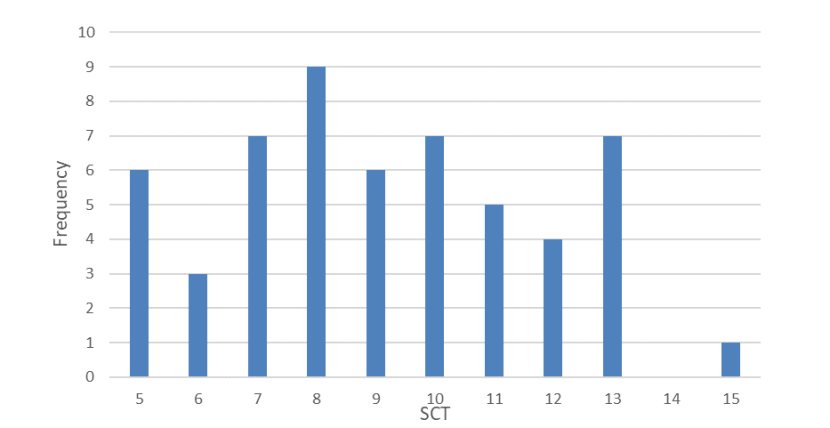
Figure 2: Frequency distribution of SCTs of wild-living cats from Scotland 2015-2019
Click for a full description
Frequency distribution of SCTs of wild-living cats from Scotland 2015-2019. The data show most cats scored between 5 and 13 with only one cat scoring higher at 15.
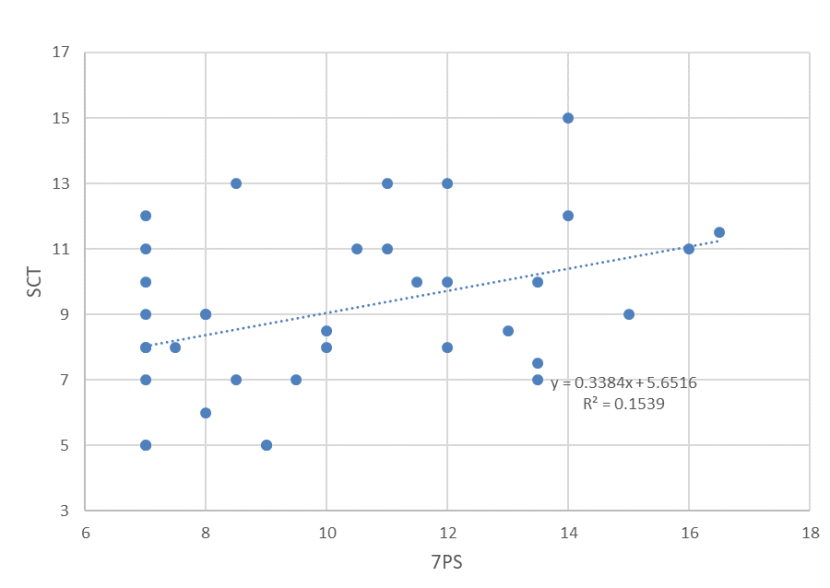
The relationship between SCT and 7PS for wild-living cats in Scotland from 2015 to 2019.
Click for a full description
The relationship between SCT and 7PS for wild-living cats in Scotland from 2015 to 2019 showing a weak significant positive correlation.
Mean gut length was 1541mm (n=80, s.e.= 43.283, range 497 - 2300mm) [Figure 4] and mean gut index was 3.395 (n=79, s.e.=0.085, range 1.431 - 5.075) [Figure 5]. Excluding kittens (with HB<300mm) [see Figure 6], mean gut length was 1595 mm (n=73, s.e.= 39.434, range 730-2300mm) and mean gut index was 3.293 (n=73, s.e.= 0.080, range 1.431-4.639). Few cats (n=11) had a gut length below 1200mm, which would be characteristic of wildcats (although wildcat gut length may extend to c.1500mm) and there was no evidence for biomodality in gut lengths as would be expected for two distinct species (Figure 4). Gut index also did not show a bimodal distribution (Figure 5) and only 14 animals had a GI of 2.8 or less, which Schauenberg (1977) used to discriminate wildcats from domestic cats. None of these was a wildcat based on 7PS or SCT. The correlation between gut length and head-and-body length (Figure 6; r2 = 0.3008) and between gut index and head-and-body length (Figure 7; r2 = 0.1059) were weak.
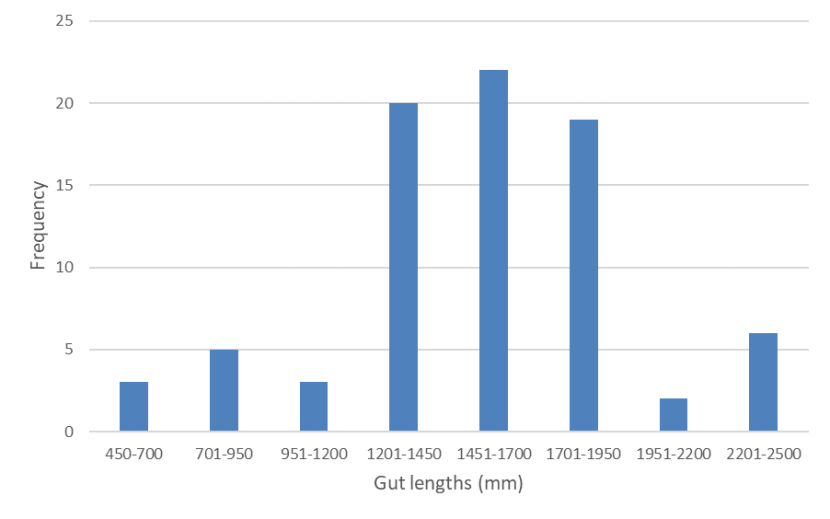
Figure 4: Frequency distribution of gut lengths of wild-living cats from Scotland 2015-2019.
Click for a full description
Frequency distribution of gut lengths of wild-living cats from Scotland 2015-2019 showing a unimodal distribution (most between 1201 and 1950mm) instead of the expected bimodal distribution were domestic cats and wildcats still distinct species.
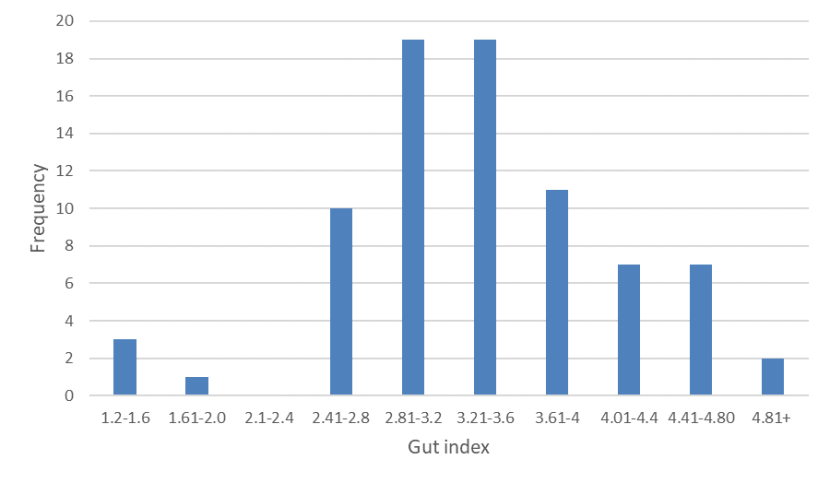
Figure 5: Frequency distribution of gut indices of wild-living cats from Scotland 2015-2019.
Click for a full description
Frequency distribution of gut indices of wild-living cats from Scotland 2015-2019.As with gut length, the data show a unimodal distribution instead of the expected bimodal distribution were domestic cats and wildcats still distinct species.
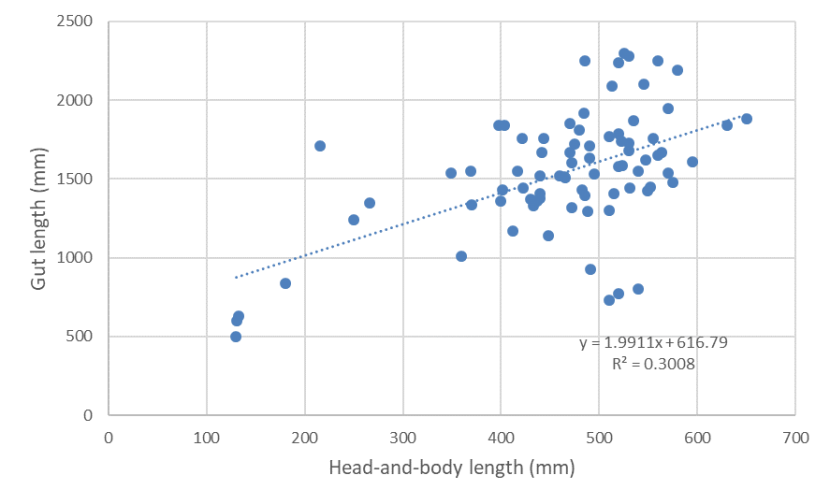
Figure 6: The relationship between gut length and head-and-body length of wild-living cats from Scotland 2015-2019.
Click for a full description
The relationship between gut length and head-and-body length of wild-living cats from Scotland 2015-2019 showing a weak positive relationship.
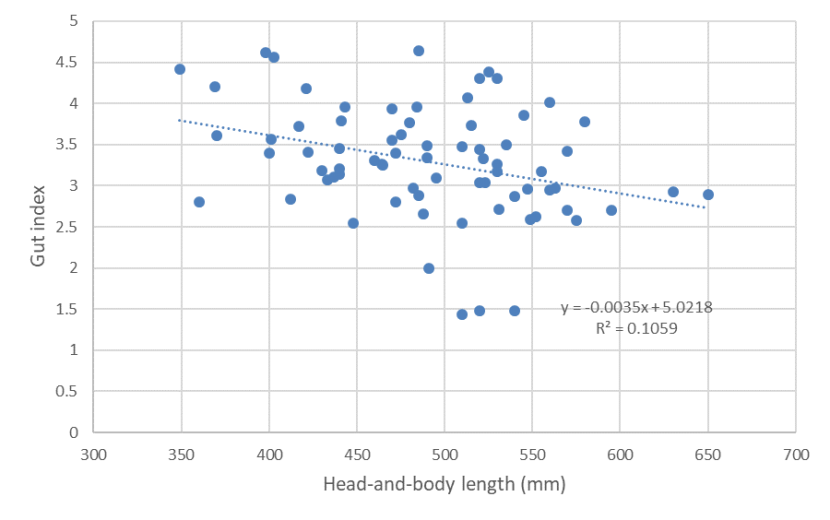
Figure 7: The relationship between gut index and head-and-body length of wild-living cats from Scotland 2015-2019.
Click for a full description
The relationship between gut index and head-and-body length of wild-living cats from Scotland 2015-2019 showing a weak negative relationship.
3.2 Genetic results
Results from all 529 samples are presented graphically in Figure 8 and are summarised in Table 1.
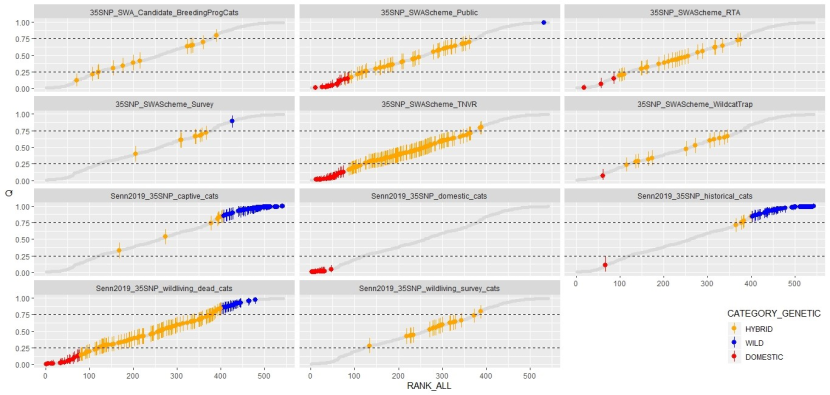
Figure 8: Genetic hybrid scores ‘Q’ obtained from the different datasets.
Click for a full description
Each point represents an individual cat. Each cat is given an estimated hybrid score ‘Q’ by the software STRUCTURE with the limits of the lowerand upper boundary of the 90% credibility interval marked with the vertical bars (Senn et al., 2019). The scores have been ranked according to their position in the global dataset of all 529 35 SNP‐typed cats (all records are given in each panel as the grey shadow) and are presented in separate windows for each dataset. Cats that meet the genetic threshold for wildcat (“Pass”, LBQ ≥ 0.75) are presented in blue, those classed as genetic hybrids are orange; this includes cats within the “uncertain” category in the matrix of Senn and Ogden (2015). Those with UBQ ≤ 0.25 are classed as “genetic domestic” and are presented in red. Details of each dataset can be found in Table 1. Those from Source 1 (Senn et al., 2019) are prefixed with “Senn2019” to more easily distinguish the previously published sources form those that have been added subsequently. Please also read the section below for the details of two cat records presented here that have a level of uncertainly around their score (WCQ0515 and WCQ0575).
Genetic hybrid scores ‘Q’ obtained from the different datasets. From top-left, candidate breeding programme cats were all classed as hybrids though one individual was near the threshold for wildcats and classed as ‘uncertain’ in the matrix of Senn and Ogden (2015); cats sampled outside the work of SWA all scored as domestic cat or hybrid except one individual that was classed as a wildcat; road casualty cats collected by SWA all scored as hybrid except three that were classed as domestic cats; cats sampled using hair or saliva during SWA surveys all scores as hybrid except one that was classed as a wildcat; cats sampled during the SWA TNVR scheme all scored as hybrid or domestic cat; cats sampled during wildcat trapping by SWA all scored as hybrid expect one that was classified as domestic cat; captive cats sampled by Senn et al. (2019) mostly scored as wildcat with a small number classed as hybrid; domestic cats sampled by Senn et al. (2019) all scored as domestic cats; historical cat specimens sampled by Senn et al. 2019) mostly scored as wildcat with a small number scoring as hybrid and one individual classed as domestic cat; wild-living dead cats (predominantly road casualties from 1989 to 2016) collected showed the full spectrum of scores from domestic cat to wildcat; cats sampled alive during SWA scoping work between 2013 and 2014 were all classified as hybrid.
Analysis of the genetic data revealed a continuum of hybrid scores ‘Q’ for cats sampled in the wild when judged against cats in captivity (35SNP_captive_cats) and historical cats (35SNP_historical_cats). Despite the different methodological approaches used to obtain samples (for example, the 35SNP_SWAScheme_RTA, 35SNP_SWAScheme_Public and 35SNP_SWAScheme_TNVR datasets), the distribution of Q scores is similar. All contain a wide range of hybridised cats.
There is a number of notable cats, which stand out in the dataset and merit being highlighted here.
- SWA965 (WCQ0515). This cat is a member of the 35SNP_SWAScheme_Public dataset. NMS.Z.2019.72.3. SWCAP 03/2015. Some of the descriptors given in the database include: (Location unknown/ Loch Ard Forest. Juvenile, starved to death.) This has a very high genetic score Q=0.966 (LBQ=0.992, UBQ=1) for a cat of this type. It is the highest of any wild-living cat sampled since 1990. Molecular genetic analysis was repeated for this individual using both 35SNP and ddRAD methodologies, confirming the score for this sample. Pedigree analysis revealed that this cat has a predicted sire/father within the dataset 35SNP_captive_cats. It is possible that this is a cat released/escaped from captivity or that a sample mix-up occurred during the processing of the carcass prior to the sample arriving in the lab (since multiple testing excludes subsequent mix-up). The skin (NMS.Z.2019.72.3) matched to the sample also has a low pelage score of 7PS=14. This cat is discounted from further consideration since its origin cannot be determined with any certainty.
- SWA258 (WCQ0575). This cat is a member of the dataset 35SNP_SWAScheme_Survey. Q=0.892 (LBQ=0.791, UBQ= 0.972). Location descriptor given in the database “Strathbogie WPA - Clashindarroch Forest”. The cat was given a pelage score of 17. This sample was a non-invasive hair sample and 20% of the genetic profile is missing. There is also another non-invasive sample from the same site (WCQ0576) with a similar score and 42% of the data missing, so it is excluded from the analysis (see Table 1 above, which describes how records were discounted from analysis). Further analysis of new material would be required to confirm these scores.
Below we examine a table of the cats for which the genetic scores were “uncertain” or “pass” (UBQ >0.75, Matrix 1, Senn and Ogden, [2015]) during the course of the study, with their predicted management outcome under the different management schemes operated during the project. Also provided is the actual outcome for that cat.
Table 2: A table of wild-living cats for which genetic scores were “uncertain” or “pass” (UBQ >0.75, Matrix 1, Senn and Ogden, [2015]), during the course of the SWA study. Other cats of Senn et al., (2019) are not examined since sampling was conducted outwith the SWA project. The genetic and pelage score is recorded for each cat. This is then presented with its predicted outcome, as if it had been handled via a management scheme operating during the project:
1. The TNVR management scheme that operated within the Priority Areas (see the TNVR Report)
2. The Captive Breeding Assessment Scheme operated outside of the Priority Areas (Senn and Ogden, [2015], Barclay and Senn, [2021]). The predicted outcome is applied to the samples for which UBQ >0.75 regardless of what dataset it came from. The actual management outcome is then given in the final column. The criteria for predicting the theoretical outcome of this management scheme can be found in “Matrix 1” and “Sub-matrix 2” of Senn and Ogden, [2015].
Table 2: A table of wild-living cats for which genetic scores were “uncertain” or “pass” (UBQ >0.75, Matrix 1, Senn and Ogden, [2015]), during the course of the SWA study. (Download the spreadsheet at the foot of this report)
*Later established same individual as SWA ID 0481 via re-examination of identification of camera trap footage. Roo Campbell pers. coms 07/04/2020. The match is supported by matching genetic profiles.
4. Discussion
4.1 Morphological
The morphological analysis of wild-living cats collected in Scotland by SWA from 2015-2019 showed that the sample is dominated by cats with low pelage scores (7PS) and none could be identified as a wildcat (7PS=19+), with few high-scoring cats (Figure 1).
These contemporary data were compared with two other earlier datasets for cats in museum collections, dating from 1885 to 1959, and from 1960 to 1995. Median 7PS is 14 (n=57) for the period 1960-1995 (Figure 9). Median scores for each pelage character ranged from 2.00 for most characters to 3.00 (nape stripes), so that they ranged across the intermediate score of 2.00. Median SCT is 13.00 (n=105) for the period 1960-1995 (Figure 10). Median scores for each skull character ranged from 2.50 (anterior nasals, nasal length and parietal suture) to 3.00 (angular process), so that all these scores exceeded the intermediate score of 2.00.
For the period 1960-1995 7PSs were spread roughly evenly across the range of scores and included four animals that were classified as wildcat (i.e. 7PS = 19+) [Figure 9]. However, SCTs appeared to fall into two main groups of higher scoring and lower scoring cats (Figure 10), although this could be a result of sampling error. The correlation between SCT and 7PS is significant (p = 0.0001) and is much stronger (r2= 0.6456) [Figure 11]. Therefore, there has been a deterioration in the correlation between pelage and skull characters between the two time periods, which reflects the loss of high-scoring cats and increased introgression within the hybrid swarm.
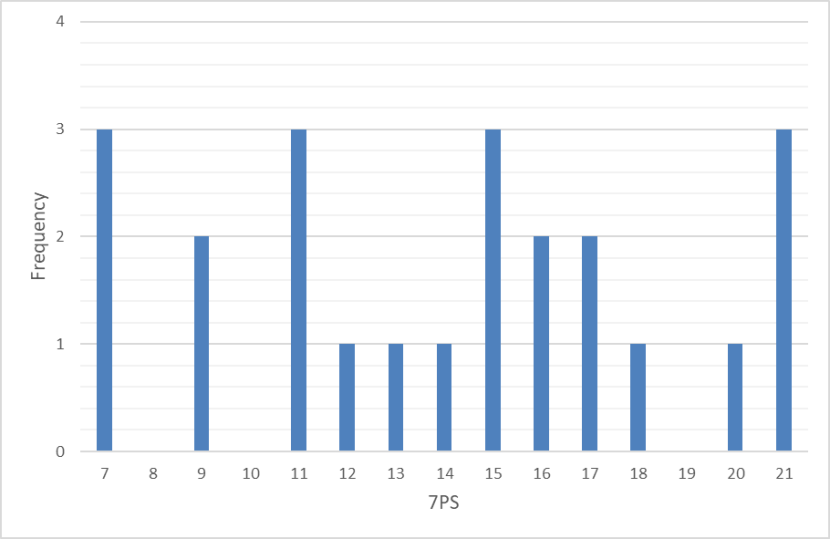
Figure 9: Frequency distribution of 7PSs of wild-living cats from Scotland 1960-1995
Click for a full description
Frequency distribution of 7PS pelage scores of wild-living cats from Scotland gathered between 1960 and 1995. The data show a broad distribution of pelage scores with four of 23 scoring 19 or higher.
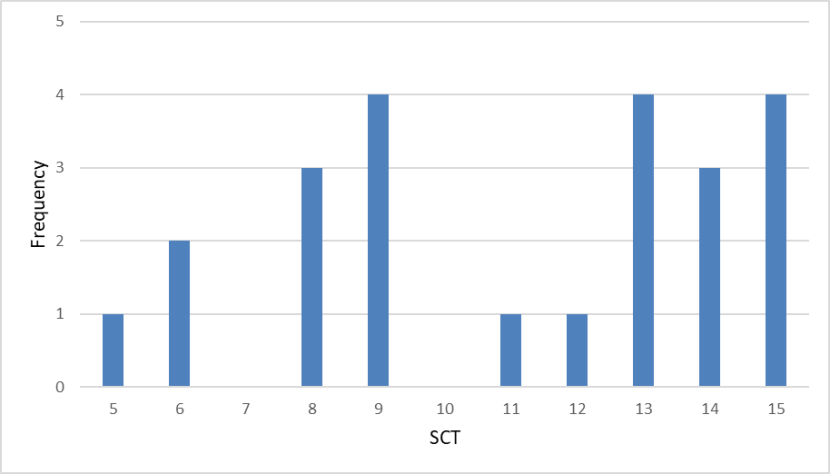
Figure 10: Frequency distribution of SCTs of wild-living cats from Scotland 1960-1995
Click for a full description
: Frequency distribution of SCTs of wild-living cats from Scotland 1960-1995 showing scores appearing to fall into two groups above and below a score of 10.
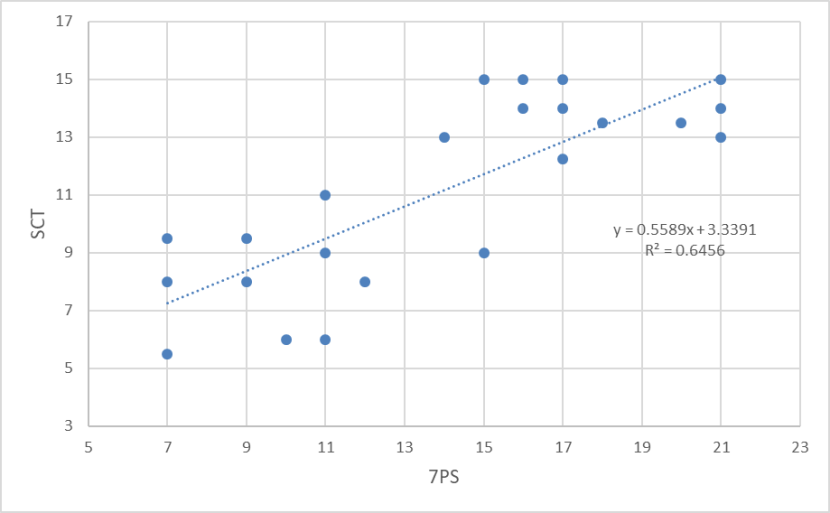
Figure 11: The relationship between SCT and 7PS for wild-living cats in Scotland from 1960-1995.
Click for a full description
The relationship between SCT and 7PS for wild-living cats in Scotland from 1960-1995 showing a strong significant positive correlation.
This is even clearer when a comparison is made with cats collected between 1885 and 1959 (Figures 12 and 13). Median 7PS is 21 (n=107) for the period 1885-1959 (Figure 12). Median scores for the seven pelage characters were all a maximum of 3.00. Median SCT is 14 (n=44) for the period 1885-1959 (Figure 13). Median scores for each skull character ranged from 2.50 (nasal length) to 3.00 (all others), so that all these scores exceeded the intermediate score of 2.00 and were much closer to a maximum wildcat character score of 3.00. The high number of high-scoring wildcats reflects a collecting bias, because domestic cats and obvious hybrids (if present) were not collected and hence are not represented. Even so, the presence of so many high-scoring cats (7PS = 19+) is significant, because so few were recorded in the subsequent time periods (Figs. 1 and 9).
Comparison of median scores for 7PS and SCT for the three time periods shows a dramatic decline (Figures 14 and 15). Although the earlier time period (1885-1959) is not strictly comparable (as it probably excludes hybrids and does exclude feral domestic cats), the other time periods are comparable, because all available cats were collected mainly as road casualties (Figure 16).
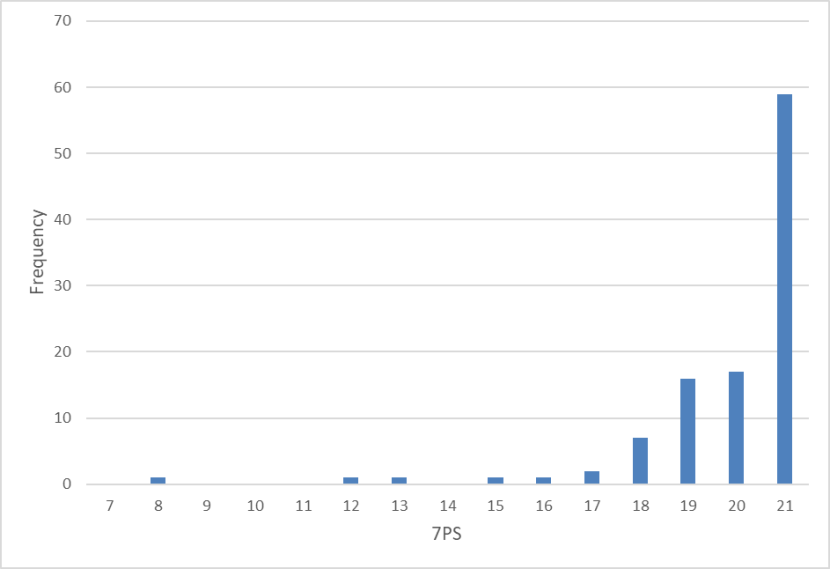
Figure 12: Frequency distribution of 7PSs of wild-living cats from Scotland 1885-1959.
Click for a full description
Frequency distribution of 7PSs of wild-living cats from Scotland 1885-1959 showing almost all cats collected in this period had a pelage score over 19 with the majority scoring the maximum 21.
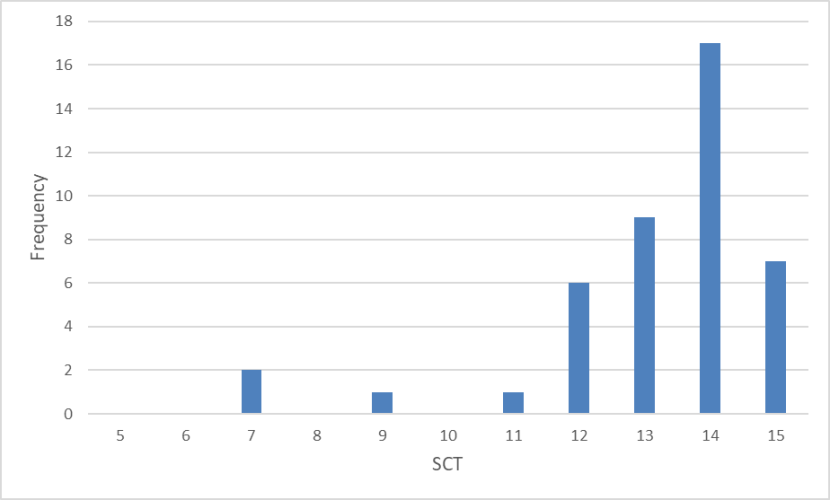
Figure 13: Frequency distribution of SCTs of wild-living cats from Scotland 1885-1959.
Click for a full description
Frequency distribution of SCTs of wild-living cats from Scotland 1885-1959 showing almost all cats scored above 11 with a score of 14 the most common.
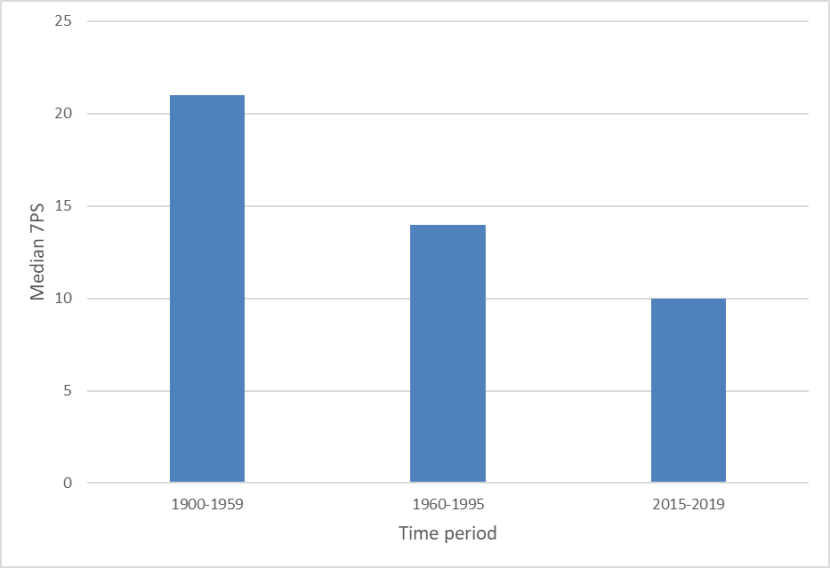
Figure 14: Median 7PSs of wild-living cats from Scotland in three time periods 1900-2019.
Click for a full description
Median 7PSs of wild-living cats from Scotland in three time periods 1900-2019, showing a decline in pelage score from the period 1900-1959 (median score of 21), though 1960-1995 (median 14), to 2015-2019 (median 10).
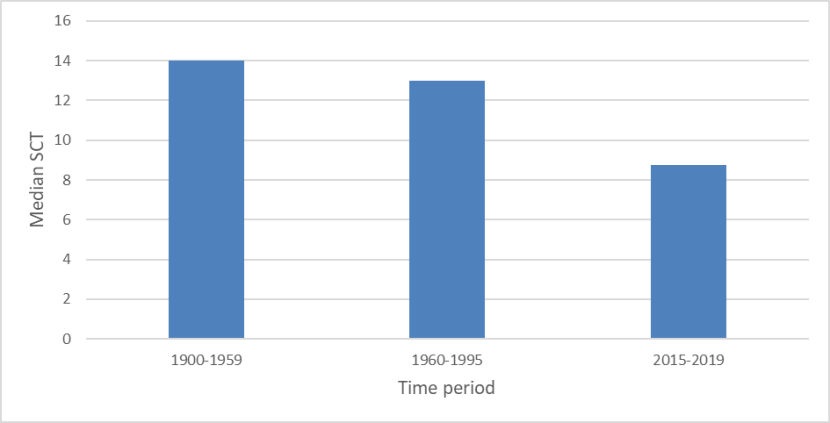
Figure 15: Median SCTs of wild-living cats from Scotland in three time periods 1900-2019.
Click for a full description
Median SCTs of wild-living cats from Scotland in three time periods 1900-2019, showing a decline in SCTs from the period 1900-1959 (median score of 14), though 1960-1995 (median 13), to 2015-2019 (median 8.75).
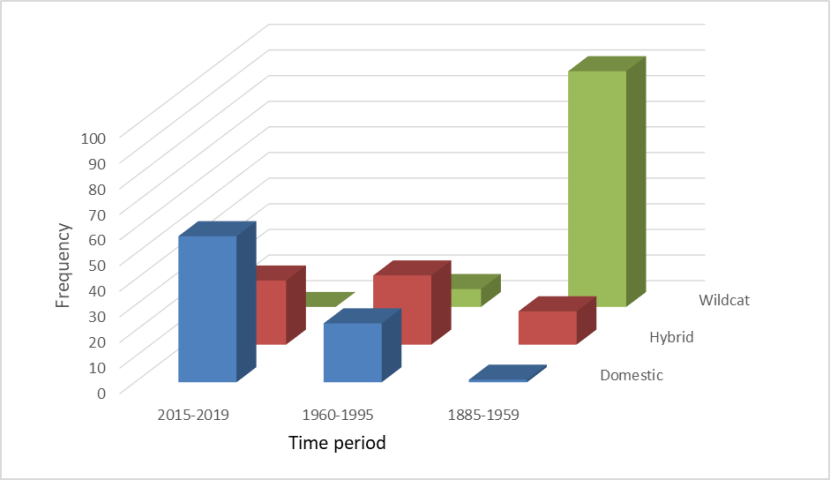
Figure 16: Frequency distributions of 7PSs of wild-living cats classified as wildcats, domestic cats and hybrids in three time periods 1885-2019.
Click for a full description
Frequency distributions of 7PSs of wild-living cats classified as wildcats, domestic cats and hybrids in three time periods 1885-2019, showing a decline in cats classed as wildcat over the three periods, an increase and then levelling off for cats classed as hybrid, and an increase in cats classed as domestic.
There was no relationship between gut index and 7PS (Figure 17), nor between SCT and gut index (Figure 18), which suggests that there has been a breakdown between the correlation between these two morphological measures in the hybrid swarm. Daniels et al., (1998) found biomodality in gut lengths in wild-living cats in Scotland from the 1990s, which correlated with biomodality in long-bone lengths and differences in pelage characteristics. The frequency distribution was unimodal for the 2015-2019 sample.
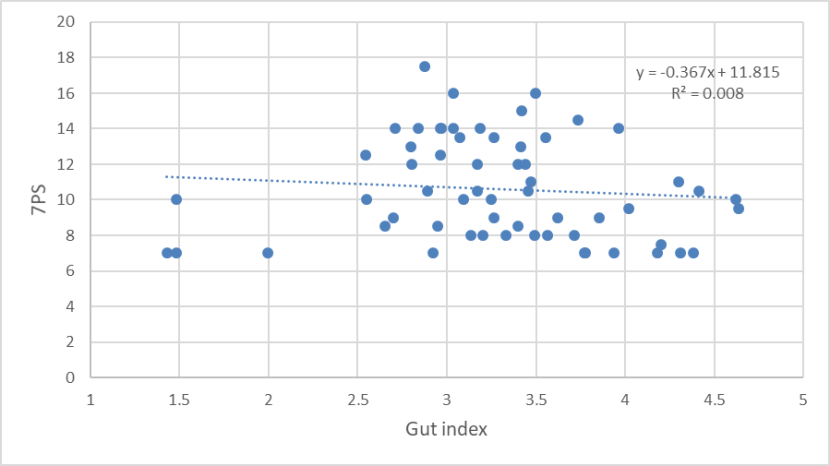
Figure 17: The relationship between 7PS and gut index of wild-living cats from Scotland 2015-2019.
Click for a full description
A scatter plot of 7PS and gut index of wild-living cats from Scotland 2015-2019, showing no relationship between the two variables.
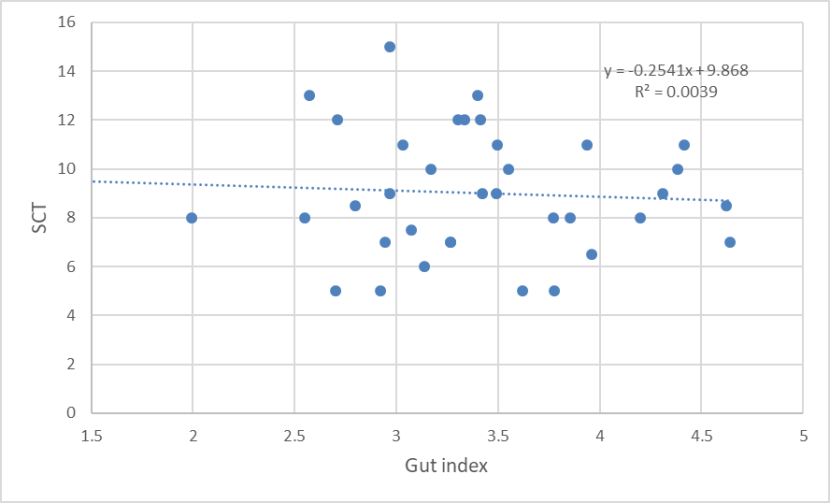
Figure 18: The relationship between SCT and gut index of wild-living cats from Scotland 2015-2019.
Click for a full description
A scatter plot of SCT and gut index of wild-living cats from Scotland 2015-2019, showing no relationship between the two variables.
A sample of 84 gut lengths from the 1990s has a mean of 1694mm (range 1200-2460mm, s.e. = 31) and mean gut index of 3.185 (range 2.210-5.020, s.e. = 0.070). Comparison of frequency distributions of wild-living cats from the 1990s and 2015-2019 shows that although the recent samples had more shorter guts, there is no significant difference between the frequency distributions (χ2 = 23.592, d.f. = 22, p =0.369).
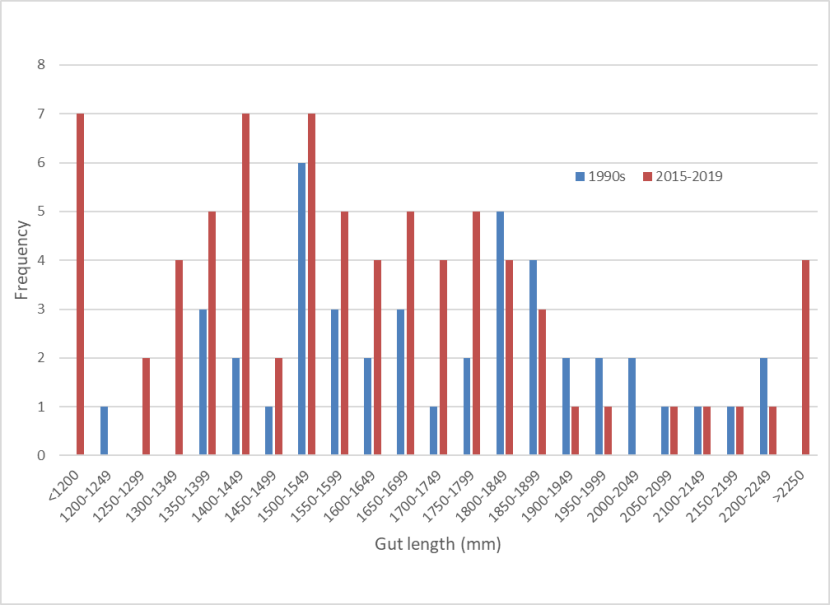
Figure 19: Frequency distributions of gut lengths for wild-living cats from the 1990s and 2015-2019.
Click for a full description
Frequency distributions of gut lengths for wild-living cats from the 1990s (blue) and 2015-2019 (red). The data show slight more cats with shorter guts in the most recent period but the difference is not significant.
4.2 Genetics
The data presented here confirms that hybridisation between wild‐living wildcats and domestic cats in Scotland is extensive (Figure 8). Using a 35‐locus SNP test, whose resultant hybrid scores correlate highly with those generated independently from over >3,000 unbiased loci obtained via ddRAD analysis, Senn et al., (2019) demonstrated that contemporary wild‐living cat populations within Scotland consisted of a genetic continuum between F. silvestris and F. catus and that this was not the historical situation. This is backed up by the addition of further contemporary samples from the period 2016-2019 presented in this report (Table 1).
Clearly, it is very hard to unpick the effects of sampling bias, since the motivations and methods for the collection of samples have varied over the years (Table 1). For example, the 35SNP_historical_cats are cats that were shot or trapped in deliberate attempts to target wildcats by gamekeepers, whereas 35SNP_wildliving_dead_cats and 35SNP_SWAScheme_RTA mostly represent road traffic accident victims. Perhaps, on crossing any given stretch of road, wildcats and domestic cats are equally likely to become a fatality, but cats with wildcat‐like tabby pelages may be more likely to be collected by the volunteers who hand the samples in (biasing the sample towards wildcats and hybrids). Conversely, more hybridised and domestic cats may be more likely to be found near busier urban roads, accentuating the bias in the opposite direction (note though that in the Scottish Highlands, many roads cross relatively uninhabited areas). The 35SNP_wildliving_survey_cats sample represents a contemporary sample of cats that was deliberately targeted for their presence in areas of supposed optimal wildcat habitat (Littlewood et al., 2014). This is also the case with the 35SNP_SWAScheme_WildcatTrap cats of this project, and therefore one presumes these might be subject to the same bias as the 35SNP_historical_cats dataset.
However, the 35SNP_historical_cat's dataset is drawn from a more restricted geographical range, with several cats being collected from the southern Highlands (see Figure 1 Senn et al., 2019), thus potentially introducing bias in an unknown direction, as there will undoubtedly be both a spatial and temporal component to hybridisation. The 35SNP_SWAScheme_TNVR dataset was focused on the elimination of threat from feral domestic cats and thus biased towards those cats with lower pelage scores (cats scoring 17+ were released without the opportunity to conduct blood sampling since this would have required veterinary support that was not immediately available).
With these issues in mind, the genetic data are nevertheless strongly indicative that there has been a recent acceleration in hybridisation. Hybridisation has presumably been occurring to some degree since domestic cats arrived on mainland Britain more than 2000 years ago (Macdonald et al., 2010; Kitchener and Daniels, 2010; O'Connor and Kitchener, 2010), although not in all areas at the same time. But these data appear to indicate that within the last decades it has become considerably more common. The basis for this observation rests on the fact that the historical sample set, which results from targeted sampling of wildcats between 1895 and 1985 (35SNP_historical_cats), consists predominantly (54/60) of cats that have an LBQ_35 ≥ 0.75. This is compared to the predominantly-hybrid contemporary sample sets of 1989-2016 (35SNP_wildliving_dead_cats and 35SNP_wildliving_survey_cats) and 2016-2019 (35SNP_SWAScheme_TNVR, 35SNP_SWAScheme_Public,35SNP_SWAScheme_RTA, 35SNP_SWAScheme_Survey, 35SNP_SWAScheme_WildcatTrap), where most cats are hybrids; 106/144 in 1989-2016, and 176/221 in 2014-2019. It is highly unlikely that the distribution of hybrid scores found in the wild in the early to mid‐20th century would have been anywhere close to the continuum seen in these data. Further exploration of the statistical significance of this can be found in Senn et al., (2019). Recent statistical modelling (using approximate Bayesian computation) of this SNP data supports the finding that hybridisation is recent (Howard-McCombe et al., 2021).
The 35SNP_wildliving_survey_cats dataset, whilst representing a targeted and recent sampling of animals from areas thought to contain wildcats in 2014 (Littlewood et al., 2014), has a distribution of Q_35 scores that is only marginally different to those found amongst the road traffic victims in 35SNP_wildliving_dead_cats (D = 0.34737, p‐value = 0.03736). Similar continuous distributions of hybrid scores are found in the datasets 35SNP_SWAScheme_TNVR, 35SNP_SWA_Scheme_Public, 35SNP_SWAScheme_RTA, 35SNP_SWAScheme_Survey and 35SNP_SWAScheme_WildcatTrap, although with the absence of many animals at the higher (wildcat) end of the score.
The low proportion of hybridisation in the captive population (see also Barclay and Senn, 2021) can also be taken as evidence to support the temporal trend apparent in the wild samples, as most of the potential founding animals (with known acquisition dates) to the studbook were taken into captivity in the 1960s and 1970s.
It is worth noting that of the 378 wild-living cats sampled since 1989 (i.e. excluding datasets 35SNP_historical_cats, 35SNP_domestic cats and 35SNP_captive_cats), only 23 cats have a genetic score placing them in the wildcat genetic category (LBQ ≥0.75). Of these, 21 were sampled between 1989 and 2016 and only two cats were sampled subsequently. One cat SWA965 (WCQ0515) has been discussed above and must unfortunately be discounted because of ambiguity over its origin. Another SWA258 (WCQ0575) showed very hopeful scores, although an incomplete profile due to the nature of the sample (hair) cast some uncertainty over them.
4.3 Morphological and genetics
Correlations between morphological and genetic scores were examined by Senn et al., (2019) in a dataset of 104 cats (Figure 20).
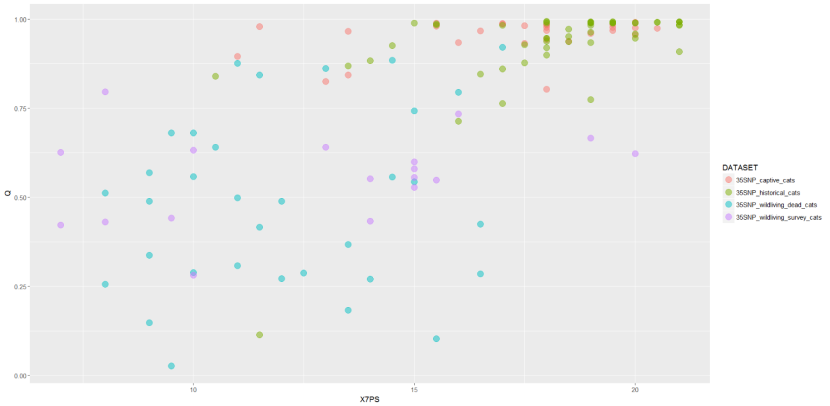
Figure 20: The relationship of Q to 7PS in a dataset of 104 cats.
Click for a full description
A scatter plot of Q to 7PS in a dataset of 104 cats, colour coded by the four dataset. It shows an overall positive relationship between Q and 7PS, but the pattern varies depending on dataset. Most of the samples from captive cats and historic cats show high values for both variables whereas samples from the wildliving dead cat and wildliving survey cat datasets are more widely scattered across the plot with few scoring highly for either variable.
Alt text: A scatter plot of Q to 7PS in a dataset of 104 cats, colour coded by the four dataset. It shows an overall positive relationship between Q and 7PS, but the pattern varies depending on dataset. Most of the samples from captive cats and historic cats show high values for both variables whereas samples from the wildliving dead cat and wildliving survey cat datasets are more widely scattered across the plot with few scoring highly for either variable.
The interpretation of pelage scores against genetic data is clearly challenging. There is a significant relationship between Q_35 (logit transformed) and 7PS pelage. However, the shape of this relationship is difficult to determine and may vary by dataset (Senn et al., 2019). There is no reason why we should expect a simple relationship between Q and pelage scores, and it is in fact likely that this relationship will be complex. Phenotypic traits are likely to be under the control of a small number of genes, some of which may exert dominant effects on phenotype and which will likely interact to produce pelage traits in a non-additive manner. As hybridisation proceeds to introgression we expect a halving of average introgressed ancestry per generation of introgression, until a point where hybrids become so common that they mate with each other and complex hybrids are produced. This is clearly the situation within the contemporary wild datasets. Q scores allow for a relatively simplistic tracking of estimated proportion of ancestry, so that backcrosses cannot be distinguished from more complex hybrids, adding further noise to the relationship since pelage traits will be expected to differ, on average, between backcross generations and other complex hybrid groups. More detailed genomic data, including the sequencing of candidate genes for pelage traits, may help to untangle this pattern. But at least in the short term, it is hard to see how whole or dense genome data will be able to be used in the making of rapid management decisions in the field or during quarantine, although they may become relevant within future management of the captive breeding programme. This genomic analysis of the wildcat is currently underway through a PhD studentship between the universities of Bristol and Cardiff, RZSS and NMS supported by NERC (Natural Environment Research Council) and The People’s Trust for Endangered Species (see also Howard-McCombe et al., 2021).
The TNVR management scheme operated within the Priority Areas (see Trap Neuter Vaccinate Return Programme report) and the Captive Breeding Assessment Scheme (see Conservation Breeding report) operated outside of the PAs (Senn and Ogden, 2015). Table 2 clearly illustrates the challenge of making a binary management decision in situations of elevated hybridisation. However, overall the two different approaches have resulted in consistent judgements across the two management schemes for this subset of borderline genetic cats. In other words, the best genetic cats generally have good pelage scores and have been spared from neutering or being taken into the conservation breeding programme. The exception to this is the case of the black cat 407 (WCQ 0635). This cat was already known to have a borderline Q score and to have produced tabby kittens and therefore did not undergo neutering. The cat was shown to be homozygous for the 2bp deletion in the ASIP gene that is found in domestic black cats (pers.com Ian Jackson, MRC). Thus it is likely to have arrived in the wildcat population via hybridisation (although ancestral polymorphism cannot be ruled out). A decision to release this cat was made due to the uncertainty around the origin of the black variant in the wildcat population. It is still possible that we should consider treating black cats with additional caution during TNVR operations, whilst accepting that they are unlikely to make suitable founders for the captive population due to the likelihood that the black variant is of domestic origin.
A bigger longer-term question is whether further management action should be targeted at wild-living borderline cats with high pelage scores (e.g. WCQ 0925, male), since a similar cat has been accepted into the breeding programme and there is a high likelihood that they will continue to meet and mate with domestic cats or hybrids. Possible options could include semen banking (as attempted by Barclay and Senn, 2021), relocation of cats to safe zones (e.g. release sites of other captive cats or a different PA with other higher-scoring cats), or even their temporary or permanent introduction to conservation breeding facilities. These tough questions lie at the very heart of conservation management of the wildcat in Scotland and complex decisions like these should be made by an appropriate multi-stakeholder body such as the SWA Steering Group.
5. Conclusion
5.1 Morphological
When compared with camera-trap data and live trapping of cats, the range of morphological variation seen in this sample of dead wild-living cats is similar. Therefore, there has been a dramatic decline in the number of wildcats (7PS = 19+) since 1960 until their disappearance in the 21st century, with decreased correlation between pelage and skull characters in all wild-living cats, which is probably a result of increased introgression within a hybrid swarm (Figure 16).
5.2 Genetic
The data presented here confirms that hybridisation between wild‐living wildcats and domestic cats in Scotland is extensive (Figure 8). Using a 35‐locus SNP test, whose resultant hybrid scores correlate highly with those generated independently from over >3,000 unbiased loci obtained via ddRAD analysis, Senn et al., (2019) demonstrated that contemporary wild‐living cat populations within Scotland consisted of a genetic continuum between F. silvestris and F. catus and that this was not the historical situation. This is backed up by the addition of further contemporary samples from the period 2016-2019 presented in this report (Table 1).
In summary;
- There is very little morphological or genetic evidence for any wildcats remaining in the wild in Scotland.
- Both morphological and genetic data from wild-living cats show a continuum between domestic cats and the highest-scoring hybrid cats.
- Correlation between morphological characters and between morphology and genetics scores appears to have declined during the late 20th century owing to increasing introgression.
- There is no evidence for viable populations of wildcats in Scotland today, but a few individuals may still occur, which will disappear in the next few years owing to natural mortality and further introgression.
- Future management of wild-living and captive cats in Scotland should, where possible, rely on combined genetic and morphological assessments, owing to high levels of introgression, which creates a difficulty in relying on single characters.
- Overall, TNVR management methods that rely on morphological assessment alone have ensured that the highest-scoring hybrids remain unneutered. However, a more detailed assessment is required as to whether this approach may also be allowing too many genetically-poor individuals to persist in the population, which may compromise the success of releasing captive-bred wildcats for population reinforcement.
- For free-living borderline hybrids with high pelage scores, different management options should be investigated, and an assessment made about how and whether their genetic variation should be preserved. For these options, we will need to consider the availability and quality of captive-bred wildcats for potential reinforcement.
6. References
Barclay, D. and Senn, H. (2021). Scottish Wildcat Action final report: Conservation Breeding, NatureScot, Inverness.
Beaumont, M., Barratt, E.M., Gotelli, D., Kitchener, A.C., Daniels, M.J., Pritchard, J.K. and Bruford, M.W. (2001). Genetic diversity and introgression in the Scottish wildcat. Molecular Ecology, 10: 319–336.
Daniels, M.J., Balharry, D., Hirst, D., Kitchener, A.C. and Aspinall, R.J. (1998). Morphological and pelage characteristics of wild living cats in Scotland: Implications for defining the ‘wildcat’. Journal of Zoology, London 244: 231–247.
Devillard, S., Jombart, T., Léger, F., Pontier, D., Say, L. and Ruette, S. (2014). How reliable are morphological and anatomical characters to distinguish European wildcats, domestic cats and their hybrids in France? Journal of Zoological Systematics and Evolutionary Research, 52(2), pp.154-162.
Driscoll, CA., Yamaguchi, N., O’Brien, SJ. and Macdonald, DW. (2011). A suite of genetic markers useful in assessing wildcat (Felis silvestris ssp.)—domestic cat (Felis silvestris catus) admixture. Journal of Heredity 102(S1): S87-S90.
French, D., Corbett, L.K. and Easterbee, N. (1988). Morphological discriminants of Scottish wildcats (Felis silvestris), domestic cats (F. catus) and their hybrids. Journal of Zoology, London 161: 75–123.
Haltenorth, T. (1957). Die Wildkatze, no. 189. Neue Brehm Bucherei, Wittenberg.
Howard-McCombe, J., Ward, D., Kitchener, A., Lawson, D., Senn, H. and Beaumont, M. (2021). On the use of genome-wide data to model and date the time of anthropogenic hybridisation: an example from the Scottish wildcat. Molecular Ecology. 30(15):3688-3702.
Littlewood, N.A, Campbell, R.D., Dinnie, L., Gilbert, L., Hooper, R., Iason, G., Irvine, J., Kilshaw, K., Kitchener, A., Lackova, P., Newey, S., Ogden, R. and Ross, A. (2014). Survey and Scoping of Wildcat Priority Areas. Scottish Natural Heritage Commissioned Report No. 768
Kitchener, A. C., Yamaguchi, N., Ward, J. M. and Macdonald, D. W. (2005). A diagnosis for the Scottish wildcat (Felis silvestris): A tool for conservation action for a critically-endangered felid. Animal Conservation 8: 223–237.
Kratochvíl, Z. (1973). Schädelkriterien der Wild- und Hauskatze (Felis silvestris silvestris Schreb. 1777 und F. s. f.catus L. 1758). Acta Scientiarum Naturalium - Academiae Scientiarum Bohemoslovacae Brno 7(10): 1–50.
Neaves, L. and Hollingsworth, P. (2013). The Scottish wildcat (Felis silvestris). A review of genetic information and its implications for management
Nussberger, B., Greminger, M.P., Grossen, C., Keller, L.F. and Wandeler, P. (2013). Development of SNP markers identifying European wildcats, domestic cats, and their admixed progeny. Molecular Ecology Resources 13(3): 447-460.
O'Brien, J., Devillard, S., Say, L., Vanthomme, H., Léger, F., Ruette, S. and Pontier, D., (2009). Preserving genetic integrity in a hybridising world. Biodiversity & Conservation 18(9): 2351-2360.
Piechocki, R. (1990) Die Wildkatze. A Ziemsen-Verlag. Wittenberg Lutherstadt.
Pierpaoli, M., Birò, Z. S., Herrmann, M., Hupe, K., Fernandes, Ragni, B., Szemethy, L. and Randi, E. (2003). Genetic distinction wildcat (Felis silvestris) populations in Europe, and hybridisation with domestic cats in Hungary. Molecular Ecology 12: 2585–2598.
Pocock, R.I., 1934. The races of the European wildcat (Felis silvestris). Zoological Journal of the Linnean Society 39(263): 1-14.
Pocock, R.I. (1951). Catalogue of the genus Felis. London: British Museum (Natural History).
Ragni B and Possenti M (1996). Variability of coat-colour and markings system in Felis silvestris. Italian Journal of Zoology 63: 285–292.
Senn, H., Ghazali, M., Kaden, J., Barclay, D., Harrower, B., Campbell, R.D., Macdonald, D.W. and Kitchener, A.C. (2018). Distinguishing the victim from the threat: SNP‐based methods reveal the extent of introgressive hybridisation between wildcats and domestic cats in Scotland and inform future in‐situ and ex‐situ management options for species restoration. Evolutionary Applications. 2018;00:1–16.
Senn H.V. and Ogden R. (2015). Wildcat Hybrid Scoring for Conservation Breeding under the Scottish Wildcat Conservation Action Plan. Royal Zoological Society of Scotland, May 2015
Schauenberg, P. (1969). L’identification du chat forestier d’Europe, Felis s. silvestris Schreber 1777, par une méthode ostéométrique. Revue Suisse de Zoologie, 76, 548–600.
Schauenberg, P. (1977). Longueur de l’intestin du chat forestier (Felis silvestris). Mammalia, 41, 357–360.
Suminski, P. (1962). Les caractères de la forme pure du chat sauvage Felis silvestris Schreber. Archives des Sciences 15: 276-296.
Tetley, H. (1941). On the Scottish wildcat. In Proceedings of the Zoological Society of London (Vol. 111, No. 1‐2, pp. 13-23). Oxford, UK: Blackwell Publishing Ltd.
Yamaguchi, N., Kitchener, AC., Driscoll, CA., Ward, JM. and Macdonald, DW. (2004). Craniological differentiation amongst wild-living cats in Britain and southern Africa: natural variation or the effects of hybridisation? Animal Conservation 7: 339-351.
ANNEXES 1-3
Annex 1: Cat Photography Protocol developed by National Museums Scotland
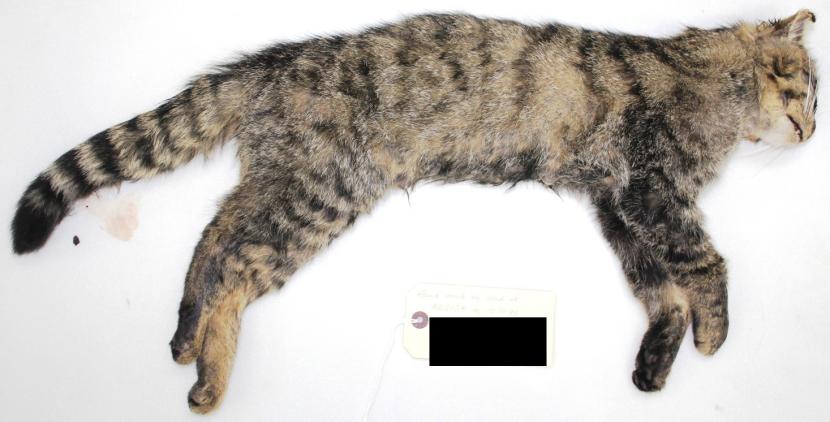
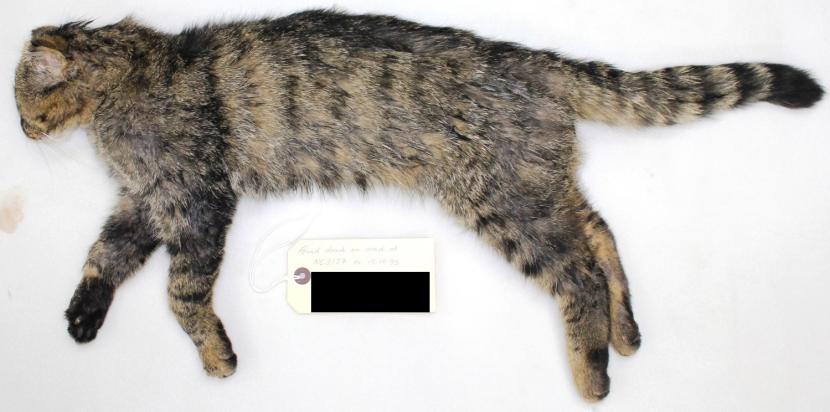
Photographing dead or anaesthetised wild-living cats to record pelage characteristics
Sometimes it is impractical to collect a dead wild-living cat for close examination by experts, or a live cat, which has been anaesthetised for radio-collaring or assessment for captive breeding, needs to be assessed for its pelage characteristics. Therefore, it is essential that a reliable photographic record of the cat is made so that its pelage characteristics can be scored accurately. Below is a guide to the key images that should be taken at as high a resolution as possible, e.g. at least 2-3Mb file images.
Top tips:
- if possible photograph the cat against a white or pale standard background
- if the fur is wet or ruffled, try to dry it using paper towels and smooth the fur flat
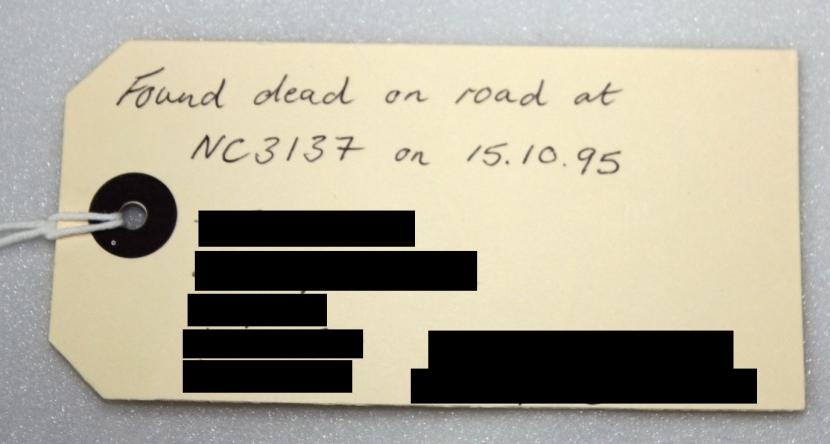
- include the label on as many of the record photos as possible
- if a dead cat is collected for later examination, put a label in a small plastic bag inside a bag with the cat
Essential images:
Label with location and/or grid reference/GPS coordinates, date, collector name and contact details (obscured below):
Dorsal:
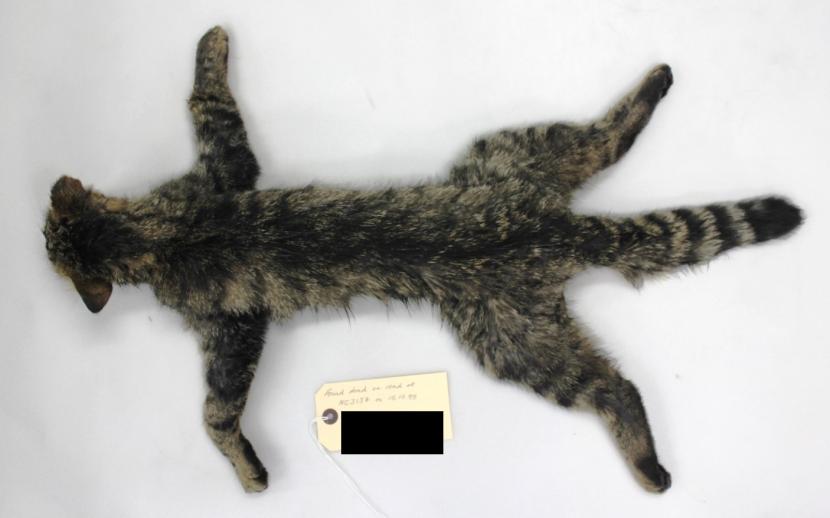
Ventral:
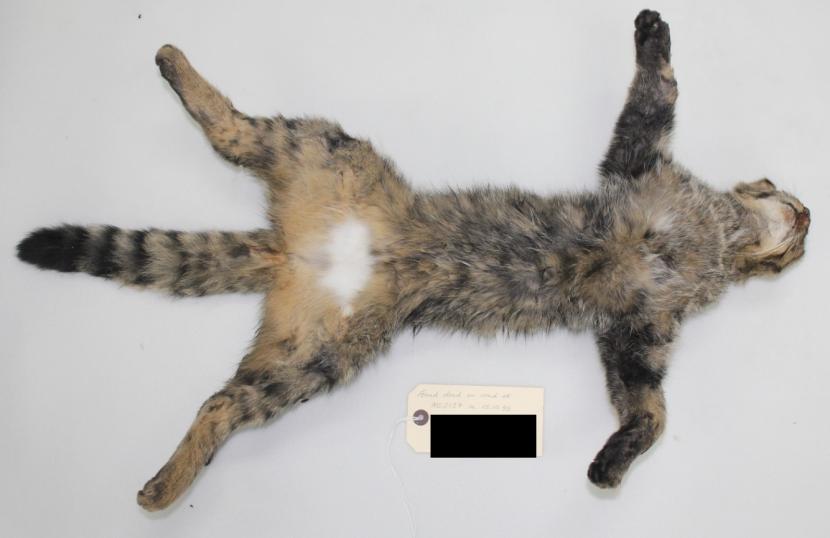
Right lateral:
Left lateral:
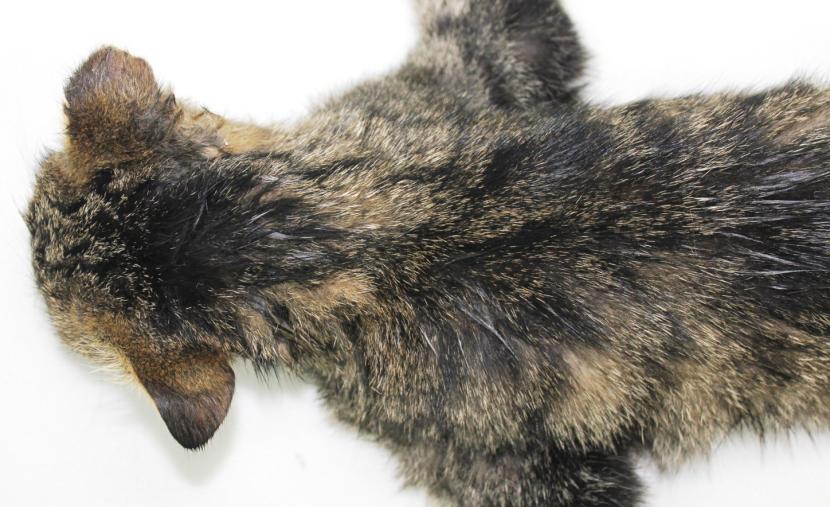
Other images if possible:
Close-up of nape and shoulders:
Close-up of lower back and tail:
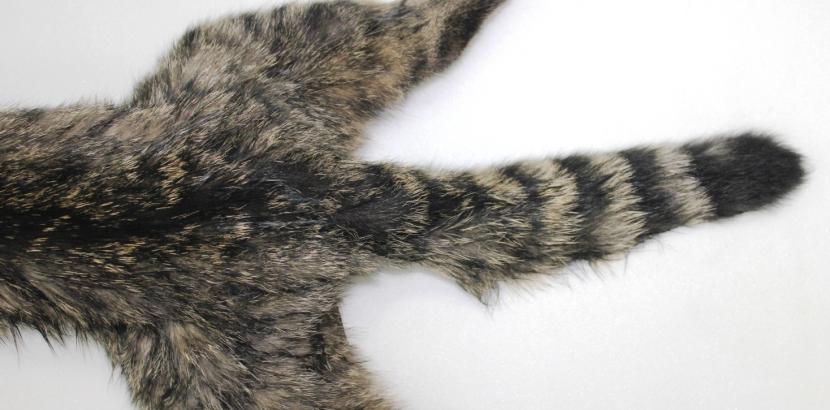
Lower abdomen and underside of tail:
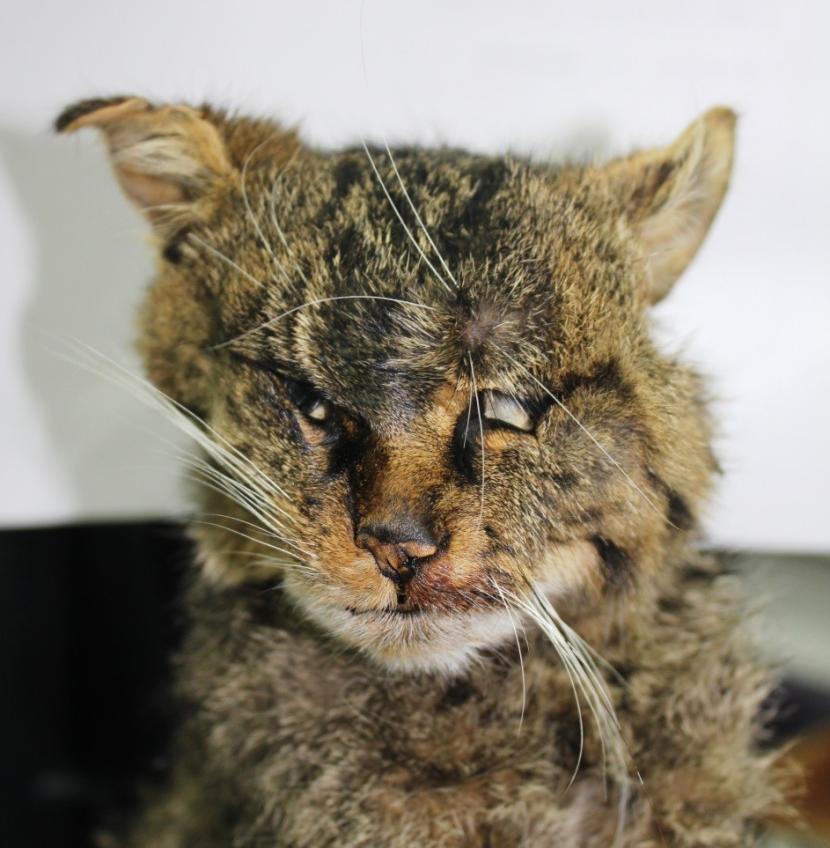
Face:
Please send your images to:
Dr Andrew Kitchener, Principal Curator of Vertebrates, National Museums Scotland
Annex 2: Measurement Protocol developed by National Museums Scotland
Measurements of wild-living cats
For comparison, it is important to take measurements of both dead and anaesthetised wild-living cats. Below is a set of images showing how to take standard field measurements. Please record measurements in millimetres along with details of locality and/or grid reference/GPS coordinates, collector name and contact details.
Total length (ToL)
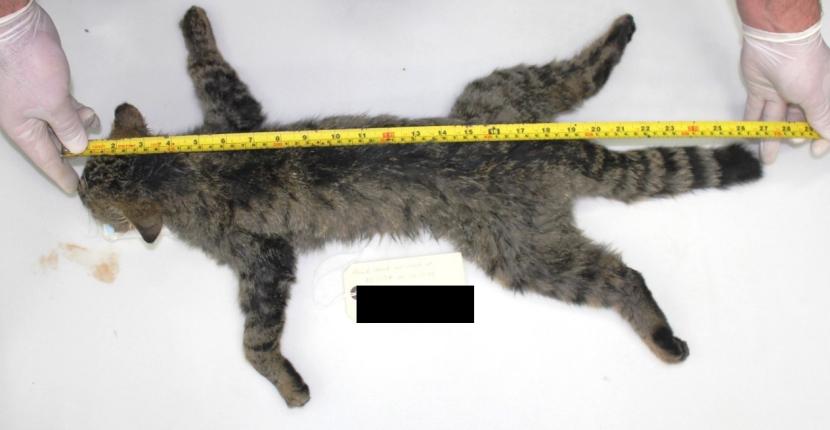
Total length (ToL) – from the tip of the nose to the tip of the skin of the tail, i.e., excluding fur. Make sure to keep the vertebral column and head as straight as possible to avoid measuring over the curves, which could overestimate total length.
Click for a full description
You may find it easier to lay the cat on its back with the tape underneath the body. Feel for the end of the tail under the fur and exclude the fur from the measurement of total length and tail length.
Feel for the end of the tail under the fur and exclude the fur from the measurement of total length and tail length.
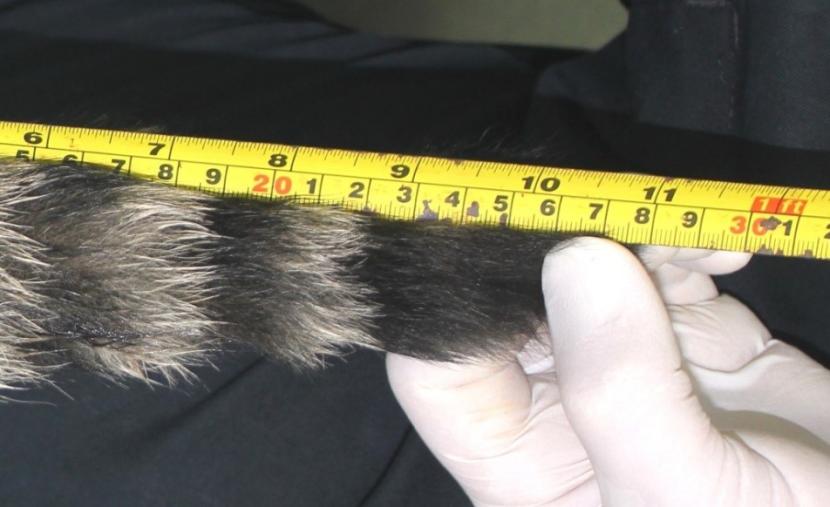
Tail length (T)
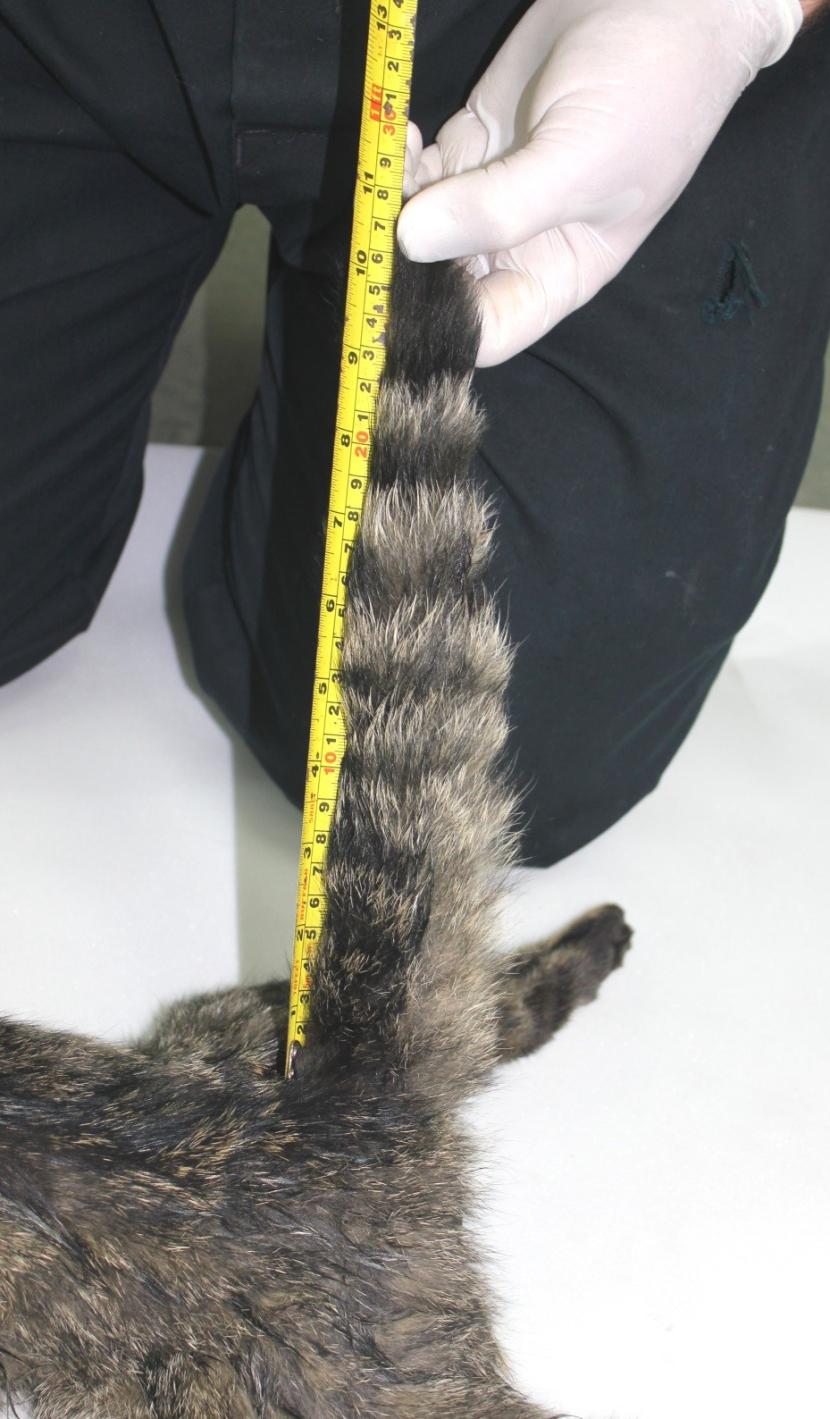
Stretch the tail until it is straight and move it so that it is at an angle to the body. Measure the length in a straight line from the corner of the angle to the tip of the tail (excluding fur – see above).
Hind foot length (HF)
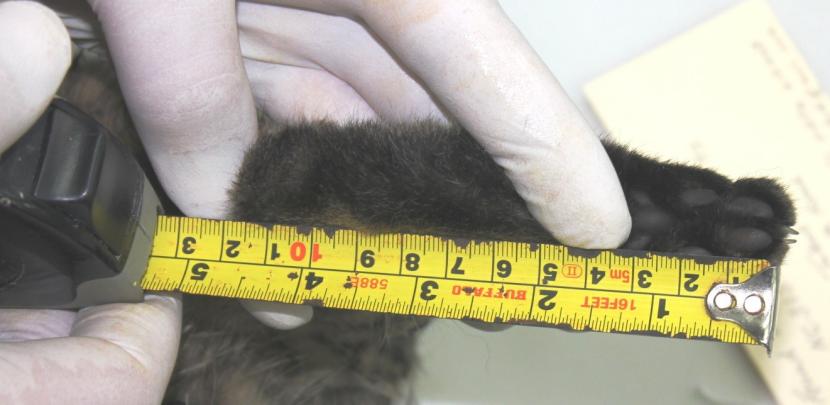
Hind foot length (HF) – measure from the ankle to the longest toe, excluding claws, in a straight line.
Ear length (E)
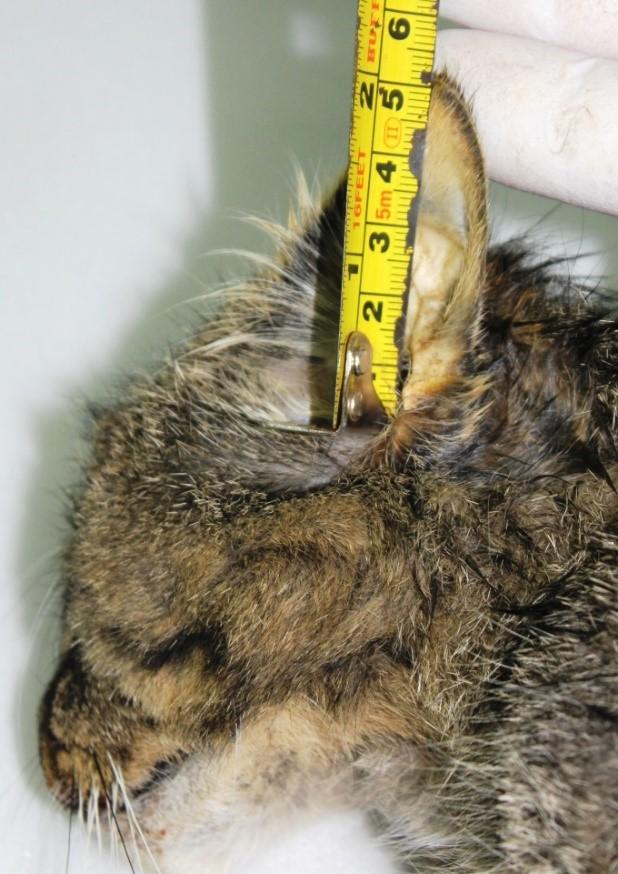
Ear length (E) – measure in a straight line from the notch at the base of the inside of the ear to the tip of the ear, excluding the fur.
Dr Andrew Kitchener, Principal Curator of Vertebrates, National Museums Scotland [email protected] Tel: 0131 247 4240
Annex 3: Filters applied to the SWA project database
|
Step |
Filter applied |
Number of records |
Rationale for exclusion |
|---|---|---|---|
|
0 |
total dataset: “AAm_3_010_V_CatCapt_and_Genes_Full records” extract of SWA_DB_06_Snapshot_20190815 |
284 |
- |
|
1 |
PERCENT_MISSING >40% |
-18 |
Bad quality data excluded as >40% of genotype profile was missing, this mostly relates to non-invasive samples (e.g. hair) |
|
2 |
Scheme=Zoo/Captive |
-5 |
Excluded on the basis that this type of data is reported on in Senn et al., (2019) and re-presented in this report under the dataset “35SNP_captive_cats” |
|
3 |
LIVE=historic |
-3 |
Excluded on the basis that this type of data is reported on in Senn et al., (2019). |
|
4 |
GridRef =UNK |
-7 |
Excluded on the basis that there was no grid ref given for the record. |
|
5 |
In Senn et al 2019 35SNP_wildliving_dead_cats |
-23 |
Excluded on the basis that the data was already published in Senn et al., (2019). Samples relate to the dataset 35SNP_wildliving_dead_cats (i.e. they were road traffic accident victims from 2016 and previously given to NMS) |
|
6 |
Q=NIL |
-6 |
Where no genetic record existed because of failure to amplify from the extracted DNA. This should have been excluded by the PERCENT MISSING filter above, but some records had been incorrectly entered at the time of data extraction as "0" (as opposed to "100" % missing) |
|
7 |
in 35SNP_SWA_Candidate_BreedingProgCats |
-1 |
Excluded to avoid duplicates as sample is reported in the dataset 35SNP_SWA_Candidate_BreedingProgCats below. |
|
- |
Final number of records |
221 |
- |
For further information on this report please contact:
Andrew C Kitchener, National Museums of Scotland
National Museums Scotland, Chambers Street, Edinburgh, EH1 1JF
Tel: +44(0) 131 247 4240
Email: [email protected]
This publication is part of a series of specialist reports on the work of the Scottish Wildcat Action (SWA) project that ran from 2015-2020. The work was led and steered by a partnership of organisations: Cairngorms National Park Authority, Forestry and Land Scotland, National Museums Scotland, Scottish Land & Estates, NatureScot, Scottish Wildlife Trust, The National Trust for Scotland, The Royal (Dick) School of Veterinary Studies (R(D)SVS), The Royal Zoological Society of Scotland, The Scottish Gamekeepers Association, The Scottish Government, Wildlife Conservation Research Unit (WildCRU).
Please note that this series of specialist reports was written in parallel and thus minor discrepancies between the sizes of datasets used in different parts of the reports may occur. This document reports on genetic records generated by the Royal Zoological Society of Scotland (RZSS) during the course of the SWA project, joined to metadata as provided by NatureScot in August 2019 from the database SWA_DB_06_Snapshot_20190815.
The many other partners and funders are listed in the SWA Summary report.
For more information contact Martin Gaywood at NatureScot.
This report, or any part of it, should not be reproduced without the permission of NatureScot or the relevant authors. This permission will not be withheld unreasonably. The views expressed by the author(s) of this report should not be taken as the views and policies of NatureScot. © NatureScot 2023.


