Official Statistics - Scottish Terrestrial Breeding Birds 1994 – 2024
An Official Statistics Publication for Scotland
Brief overview
- This year’s Terrestrial Breeding Birds Official Statistic shows over half the species measured have increased in abundance since 1994.
- The index for all species has remained stable since 2014.
- Woodland birds have had the biggest increase.
- Upland birds have been declining consistently since 1994 and have the most reduced abundance of bird species of all the habitat types.
- Urban birds are increasing in abundance.
- Farmland birds have declined over the past 10 years, with decreases in all farmland habitat types.
- Farmland birds have been less than those recorded in 1994 for the past 4 years and all farmland habitat types (arable, pastoral, wet-farmland, wooded-farmland) have decreased for the past 10 years.
What is Scotland’s Terrestrial Breeding Birds Official Statistic?
What is Scotland’s Terrestrial Breeding Birds Official Statistic?
Every year NatureScot produces the Scottish Terrestrial Breeding Birds Official Statistic. We take information about bird abundance in Scotland gathered by Scotland’s citizens and combine them into a single-community level trend (Fraixedas et al., 2020; Gregory et al., 2005) with which we can assess change in biodiversity across Scotland since 1994.
Why do we produce this statistic?
To keep track of how our biodiversity is changing and the pressures causing change, we need to measure our biodiversity. Scotland’s terrestrial breeding birds occupy a wide range of habitats including farmland, upland, woodland and urban areas. Scotland’s birds are also loved by Scotland’s people, who have been surveying terrestrial breeding birds for over 30 years through the Wetland Bird Survey (WeBS), Breeding Bird Survey (BBS) and more. This wealth of data, along with their high trophic level (birds are often high up in the food chain) and their sensitivity to environmental change, make birds a representative for the health of Scotland’s ecosystems (Gregory et al., 2003, 2008). We can then use this information to inform decision making about resilience management, guidance, and conservation.
How do we produce this statistic?
66 species are included in this survey (56 from the BBS and 10 from species specific specialist surveys) (Harris et al. 2021). Randomly located 1km survey squares are visited twice each breeding season (April to July). These squares are intended to be representative of Scotland’s habitats including farmland, woodland, upland and urban areas.
The Terrestrial Breeding Birds Official Statistic is an Accredited Official Statistic. This means that it meets the standards of Trustworthiness, Quality and Value outlined by the Standards for Official Statistics.
When are the main findings from?
This statistic is representative of the change in bird populations and wider ecosystems. The main causes of population change are often unclear, but we can suggest the likely causes. Our data is only from the past 30 years and therefore does not show the trends in abundance before this time (farmland birds had steep declines in the 1970s and 80s as shown in the Bird Atlases of 1968-71 and 1988-91). When assessing the data we look at the long-term (1994-2024) and medium-term (2014-2024) trends based on the smoothed indices. Like many other species, Scotland’s birds may be impacted by conditions outside of Scotland, along their migration routes, and by short term weather events, for example, a particularly harsh winter. For this reason, short-term trends (2023-2024) should not be used to draw conclusions as they do does not reliably reflect the state of bird abundance. In this Official Statistic we will focus on the medium and long-term trends, although all data (smoothed and unsmoothed) is included in the graphs and data files below. The unsmoothed data should be used for interpreting short term trends as smoothed trends are less reliable at the ends of the series.
Key findings
- Of the 66 species measured 39 species increased and 27 decreased in abundance since 1994
- After major increases from 1994 to mid-2000s, most birds have stabilised or began to decrease in the past 15-20 years.
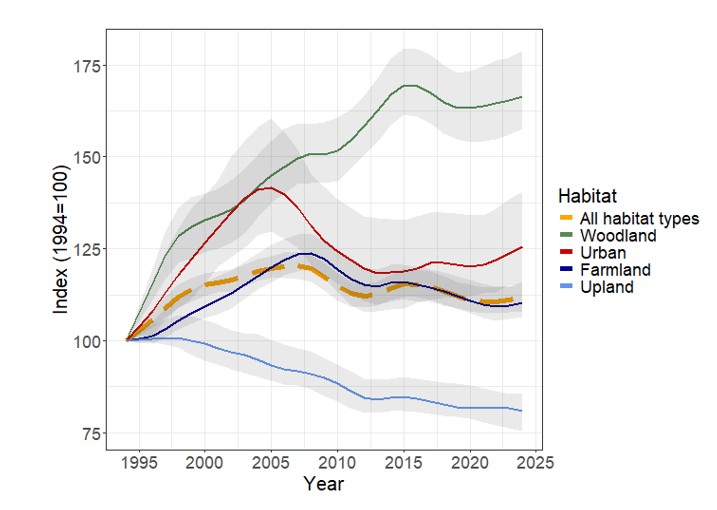
- The index for all species (smoothed) was highest in the mid-2000s. Since then, the index has decreased and over the past 10 years has remained stable (i.e. has not changed more than 5%) at 12% above the 1994 index.
- The woodland bird index has had major increase since 1994 (+66%), but the woodland bird index has remained stable over the past 10 years (i.e. has not changed more than 5% since 2014).
- The urban bird index had a major increase from 1994 to the mid-2000s (+42% in 2005), potentially due to an increase in bird feeders, before decreasing, potentially due to the increased risk of disease associated with bird feeders. Now the urban bird index is still higher than 1994 (+26%) but has increased less rapidly over the past 10 years (+6% since 2014)
- The upland bird index has consistently declined since 1994 (-19%) and has the biggest decline of all the habitat types but has been stable (i.e. not changed more than 5%) since 2014.
- The farmland bird index had a large increase from 1994 to the mid-2000s (+24% in 2008) before decreasing. It is currently 10% above the 1994 index and has decline by 5% since 2014. Pastoral and woodland farmland indices have increased since 1994 (+24% and +7% respectively), but the arable and wet farmland indices are currently below the 1994 index (-12% and -26%, respectively). It is worth noting that all the farmland bird indices have decreased over the past 10 years (arable: -17%, pastoral: -8%, wet-farmland: -21%, wooded-farmland: -12%).
- Climate change and land use change may be having the strongest impact on bird populations (Burns et al. 2021). The unsmoothed indices for all species, woodland and farmland bird indices all have a relationship with Scotland’s annual mean temperature, and the urban bird index is related to Scotland’s annual maximum temperature. The only index with no relationship to temperature is the upland bird index.

Figure 1: Change in Scottish Terrestrial Bird Index of Abundance, 1994 to 2024.
Click for a full description
View a larger version of this graph.
Shaded areas illustrate 95% confidence intervals. The smoothed all-species index increased steadily up to the mid-2000s to 12% above the 1994 index but since then has declined. Over the past 10 years (1994-2023) the all-all species index has declined by 2%. The index for woodland birds steadily rose from 1994 to 2015 before levelling out. Urban and farmland bird indices increased until approximately 2005 before declining, although the urban bird index is rising again. The upland bird index has steadily decreased since 1994.
You can access the data behind Figure 1 by downloading the spreadsheet.
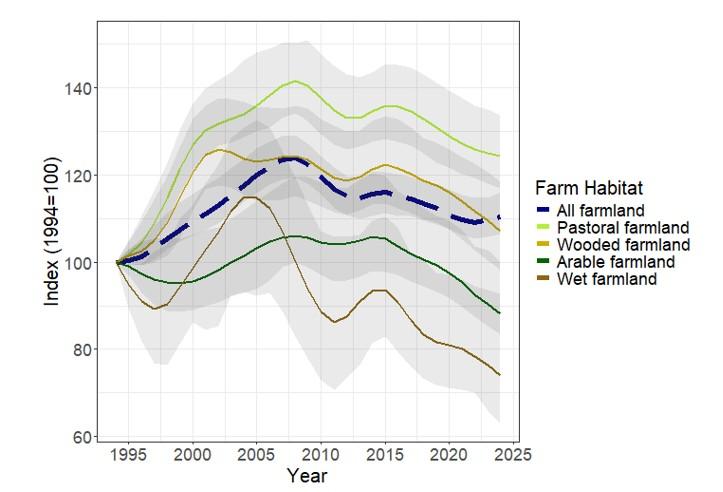
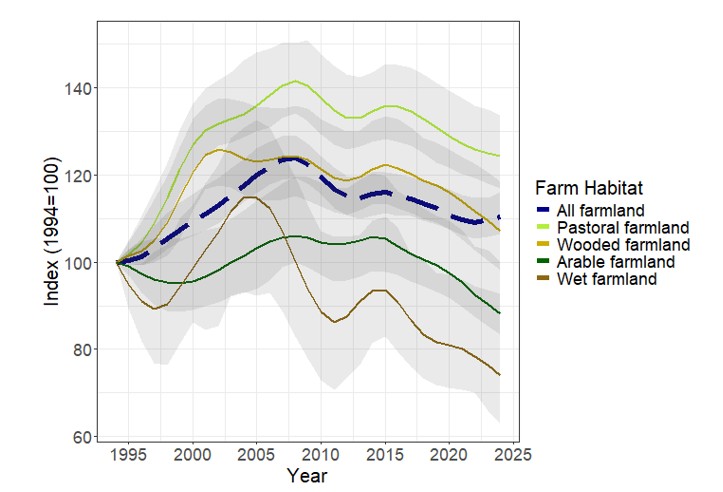
Figure 2. Change in Scottish Bird Index of Abundance for Farmland Habitat Types, 1994 to 2024.
Click for a full description
View a larger version of this graph.
Shaded areas illustrate 95% confidence intervals. The smoothed farmland bird index increased steadily from 1994 to 2008 before beginning to decline. Overall, this trend has increased by 10% since 1994 and has decreased by 5% since 2014. The discrepancy between the all-farmland trend and the individual farmland habitat trends between 2022-2024 is an artifact of the data smoothing process (the smoothed and unsmoothed data can be found in the supporting data).
The pastoral and wooded-farmland indices increased from 1994 to approximately 2003 before gently declining until 2024. The arable farmland index remained fairly stable until 2015 before it began declining. The wet-farmland index has been the most variable, rising and falling every 5 years with peaks in approximately 2005 and 2015, but has continually decreased since this last peak.
You can access the data behind Figure 2 by downloading the spreadsheet.
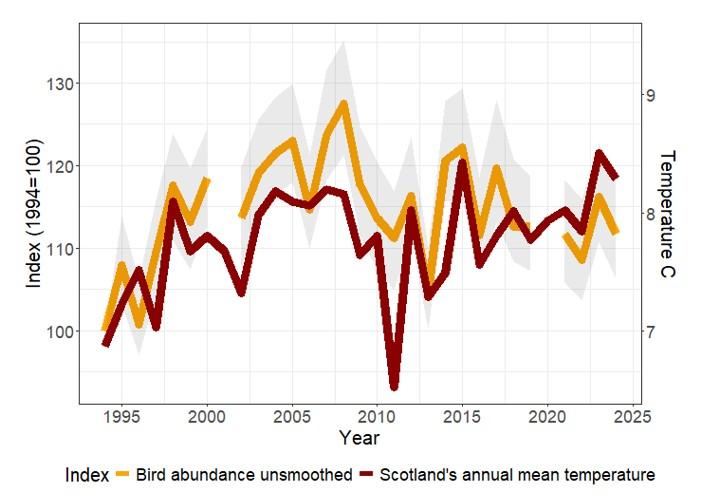
Figure 3: Scottish Terrestrial Bird Index of Abundance for All-Species and the Mean Annual Scottish Temperature.
Click for a full description
View a larger version of this graph.
The unsmoothed all-species bird index (left-hand axis, line with shaded confidence intervals) and mean annual Scottish temperature from June in the previous year to May in the stated year (°C, right-hand axis) from 1994 – 2024 (Met office website). Gaps in the bird abundance index are from years with no or insufficient data.
You can access the data behind Figure 3 by downloading the spreadsheet.
Habitats in-depth
Woodland
23 of the bird species surveyed are associated with the woodlands. These species have increased in abundance by 66% since 1994, a trend which has levelled out since 2014 (has not changed more than 5%). The woodland bird index has a relationship with Scotland’s annual maximum temperature, which is one of many factors that could be contributing to the increase in these birds (Figure 1). A more likely cause of the increase is the major woodland expansion which increased Scotland’s woodlands from 5% of Scotland’s land area in 1990 to 17% by the early 21st century (the impacts of this on bird populations will have been delayed). The Scottish Government’s Draft Climate Change Plan published in November 2025, will build on this through annual woodland creation targets that rise steadily to 18,000 hectares and which would increase woodland cover to 24% by 2040.
An increase in summer rainfall, associated with climate change, may be increasing the number of invertebrates and therefore feeding birds in woodland areas (Eggleton et al., 2009; Martay et al., 2018). The increase in woodland birds in Scotland contrasts with the decrease in woodland bird abundance in England, although some birds in Scotland’s woods, for example the Chaffinch, are declining due to diseases like trichomoniasis (Robinson et al., 2010). Capercaillie declines in Scotland have been linked to a range of factors including death from collisions with fences, loss of woody cover, low productivity due to predation, as well as climate change impacts. However, Capercaillie still have thriving populations across much of Central Europe.
Urban
18 of the bird species surveyed are associated with urban environments. These species have increased in abundance by 26% since 1994 but have increased less rapidly since 2014 (2014-2024, +6%). There’s no evidence that Scotland’s annual mean and minimum temperatures have a relationship with the urban bird index, but the urban bird index may be impacted by Scotland’s annual maximum temperature. Due to the heat island effect, Scottish city birds will be exposed to the highest temperatures in Scotland.
An increase in bird abundance in cities may be due to an increase in garden bird feeding, although this may cause some other species to decline (Plummer et al., 2019) and increase the risk of spreading diseases such as trichomoniasis (Robinson et al., 2010). Other drivers of urban bird decline include loss of green space. Swifts have been declining for many years, which might be due to wetter summers (Finch et al., 2023) and a reduction in nest sites on buildings (Woodward et al., 2018), two threats that coincide for a greater risk. Other threats they experience during migration or on their wintering grounds may also contribute to Swifts decline.
City Slickers
Some species occupy more than one habitat type and therefore contribute to more than one indicator: Blackbirds and Collared Dove populations are declining more in urban habitats than in others. However, Robin, Woodpigeon, Jackdaw and Great Tit populations are doing better in urban populations (Robins and Great Tits can also be found in woodland and Great Tits, Jackdaws and Woodpigeons on farmland). Jackdaws and Great Tits are increasingly using urban areas for feeding or nesting, and this may be exposing Blackbirds and Collard Doves to increase risk through competition and disease, for example, exposure to the Usutu virus.
Upland
17 of the bird species surveyed are associated with the uplands. These species have decreased in abundance by 19% since 1994. Curlew, Lapwing, Oystercatcher along with upland riverine birds such as Dipper, Grey Wagtail and Common Sandpiper are all decreasing in population size. Temperature does not seem to have a relationship with the Scottish upland bird index.
Land-use change, stream management, forest expansion, climate change and increased nest predation are all factors causing declines in upland bird populations (Buchanan et al., 2017). Golden Plovers are also being impacted by climate change, as the increasing temperatures are negatively impacting cranefly populations, an important source of food for Golden Plovers during breeding season (Pearce-Higgins et al., 2010). Peatland restoration in the uplands is creating wetter habitats, and in time this may benefit the cranefly populations and therefore Plovers as well. Conversely, Curlew populations may be benefiting from higher summer rainfall but are still negatively impacted by warmer temperatures, land use change and predation (Douglas et al., 2014; Franks et al., 2017).
Farmland
27 of the bird species surveyed are associated with farmland. These species have increased in abundance by 10% since 1994 and have decreased in abundance by 5% since 2014. The farmland bird index has a relationship with Scotland’s annual mean temperature.
Longterm changes in farmland bird populations in Scotland and across the UK are due to a range of factors including agricultural intensification, reduced diversity of crop types at the within-farm scale and reductions in spring-sown crops (Donald et al., 2001; Bell and Calladine, 2017). Agri-environment schemes have been in place in Scotland for more than two decades, aiming to reverse historical farmland bird population declines by enhancing habitat quality and biodiversity (Gregory et al., 2004; Redhead et al., 2022; Sharps et al., 2023). It is possible that agri-environment schemes may have had a positive / mitigating effect on farmland bird populations (Daskalova et al., 2019), but that in more recent years either the benefits have lessened, or other factors have had greater influence.
Arable farmland
This includes 23 bird species which have decreased in abundance by 12% since 1994 and by 17% since 2014.
This decline in abundance suggests that agri-environment schemes designed for arable land (e.g., wild bird seed mixes, winter stubbles, infield plots) have so far failed to reverse the declines in species occupying these habitats. This may be due to insufficient scale or quality in delivery (Redhead et al., 2022), although increases in some species, such as Skylark and Song Thrush suggest that targeted management may be effective. Farmland specialist, such as Lapwing, and Oystercatcher have experienced continued long-term decline, although this is unlikely related to the agri-environment schemes, which target seed-eating passerine birds.
Pastoral farmland
This includes 26 bird species which have increased in abundance by 24% since 1994 but decreased by 8% since 2014.
Of all the farmland habitats, pastoral farmland shows the strongest long-term increase in bird abundance suggesting genuine ecological improvement. This is demonstrated through increased in Linnet and Reed Bunting populations, although other species, including Lapwing, Skylark and Yellowhammer continue to decline.
Wet-farmland
This includes 11 bird species which have decreased in abundance by 26% since 1994 and by 21% since 2014.
The wet-farmland indicator shows the steepest decline, suggesting that habitat loss and drainage are not being mitigated enough through current conservation measures. There are no species with long-term increases in this habitat.
Wooded-farmland
This includes 23 bird species which have increased in abundance by 7% since 1994 but decreased by 12% since 2014.
This medium-term decline in wooded-farmland bird species is driven by declines in species specialised to this habitat (e.g. Linnet, Yellowhammer) and an increase in more generalist species (e.g. Goldfinch and Great Tit). However, the impact of the pressures to these species are negatively affecting both specialists and generalists.
Methods and Updates
Data for 56 of the 66 species come from the Breeding Bird Survey (BBS) run by British Trust for Ornithology (BTO) on behalf of a partnership that also includes the Joint Nature Conservation Committee (JNCC) and Royal Society for the Protection of Birds (RSPB).
The data for BBS consist of annual counts made over a period of years at a series of sites. Generalised Linear Models were used to generate trends. To prevent short-term population variability and sampling error having an undue influence, trends were smoothed and long-term trends assessed using techniques recommended by Fewster et al. (2000). The smoothed indices were used to assess the significance of long-term changes. Details of the methods used to calculate the indices are available from the BTO website.
Trends for Common Sandpiper and Dipper are derived from the BTO Waterways Bird Survey and the Waterways Breeding Bird Survey. Grey Heron trends are derived from the Heronries Census. Trends for seven species (Golden Eagle, Hen Harrier, Peregrine, Dotterel, Corncrake, Black Grouse and Capercaillie) are estimated from single-species surveys carried out periodically, during the period 1994 to 2021 as part of the SCARABBS (Statutory Conservation Agency/RSPB Annual Breeding Bird Scheme) programme. A further 46 terrestrial species regularly breed in Scotland (being found in at least 100 10km squares in Bird Atlas 2007-11), but insufficient data are available through current monitoring schemes to permit their inclusion in these indicators.
In Scotland, the production of multi-species indicators is limited to a start date in 1994 as this is when BBS was first implemented and achieved broad-scale representative coverage of many terrestrial species in Scotland. Changes reported through these indicators therefore exclude any changes that occurred prior to 1994, which based on UK data show marked declines in many farmland and woodland species. Temperature data was taken from the Met Office and was modelled using stepwise linear regression models for each habitat type.
References
Bell, M.V. & Calladine, J. 2017. The Decline of a Population of Farmland Breeding Waders: a twenty-five year case study. Bird Study 64: 264-273.
Buchanan, G.M., Pearce-Higgins, J.W., Douglas, D.J.T. & Grant, M.C. 2017. Quantifying the importance of multi-scale management and environmental variables on moorland bird abundance. Ibis 159: 744-756
Burns, F., Eaton, M.A., Burfield, I.J., Klvaňová, A., Šilarová, E., Staneva, A. and Gregory, R.D., 2021. Abundance decline in the avifauna of the European Union reveals cross‐continental similarities in biodiversity change. Ecology and evolution, 11(23), pp.16647-16660.
Daskalova, G.N., Phillimore, A.B., Bell, M., Maggs, H.E., Perkins, A.J., 2019. Population responses of farmland bird species to agri-environment schemes and land management options in Northeastern Scotland. Journal of Applied Ecology 56, 640–650.
Donald, P.F., Green, R.E. & Heath, M.F. 2001. Agricultural intensification and the collapse of Europe’s farmland bird populations. Proceedings of the Royal Society B: Biological Sciences 268: 25-29.
Douglas, D.J.T., Bellamy, P.E., Stephen, L.S. Pearce–Higgins, J.W., Wilson, J.D. & Grant, M.C. 2014. Upland land use predicts population decline in a globally near-threatened wader. Journal of Applied Ecology 51: 194-203.
Eggleton, P., Inward, K., Smith, J., Jones, D. T., & Sherlock, E. (2009). A six year study of earthworm (Lumbricidae) populations in pasture woodland in southern England shows their responses to soil temperature and soil moisture. Soil Biology and Biochemistry, 41(9), 1857-1865.
Fewster, R.M., Buckland, S.T., Siriwardena, G.M., Baillie, S.R., Wilson, J.D., 2000. Analysis of Population Trends for Farmland Birds Using Generalized Additive Models. Ecology 81, 1970–1984.
Finch, T., Bell, J.R., Robinson, R.A. and Peach, W.J., 2023. Demography of common swifts (Apus apus) breeding in the UK associated with local weather but not aphid biomass. Ibis, 165(2), pp.420-435.
Franks, S.E., Douglas, D.J., Gillings, S. & Pearce-Higgins, J.W. 2017. Environmental correlates of breeding abundance and population change of Eurasian Curlew Numenius arquata in Britain. Bird Study 64: 393-409.
Fraixedas, S., Lindén, A., Piha, M., Cabeza, M., Gregory, R., Lehikoinen, A., 2020. A state-of-the-art review on birds as indicators of biodiversity: Advances, challenges, and future directions. Ecological Indicators 118, 106728.
Gregory, R.D., G. Noble, D., Custance, J., 2004. The state of play of farmland birds: population trends and conservation status of lowland farmland birds in the United Kingdom. Ibis 146, 1–13.
Gregory, R.D., van Strien, A., Vorisek, P., Gmelig Meyling, A.W., Noble, D.G., Foppen, R.P.B., Gibbons, D.W., 2005. Developing indicators for European birds. Philosophical Transactions of the Royal Society B: Biological Sciences 360, 269–288.
Harris, S.J., Massimino, D., Balmer, D.E., Eaton, M.A., Noble, D.G., Pearce-Higgins, J.W., ... & Gillings, S. 2021. The breeding bird survey 2020. BTO research report, 736.
Martay, B., Noble, D.G., 2022. Scoping the feasibility of developments to the Terrestrial Bird Indicator for Scotland - urban, farmland and wetland indicators | NatureScot (Research No. 1300). NatureScot.
Pearce‐Higgins, J.W., Dennis, P., Whittingham, M.J., & Yalden, D.W. 2010. Impacts of climate on prey abundance account for fluctuations in a population of a northern wader at the southern edge of its range. Global Change Biology 16: 12-23.
Plummer, K.E., Risely, K., Toms, M.P. & Sirawrdena, G. M. 2019. The composition of British bird communities is associated with long-term garden bird feeding. Nature Communications 10: 2088.
Redhead, J.W., Hinsley, S.A., Botham, M.S., Broughton, R.K., Freeman, S.N., Bellamy, P.E., Siriwardena, G., Randle, Z., Nowakowski, M., Heard, M.S., others, 2022. The effects of a decade of agri-environment intervention in a lowland farm landscape on population trends of birds and butterflies. Journal of Applied Ecology 59, 2486–2496.
Robinson, R.A., Lawson, B., Toms, M.P., Peck, K.M., Kirkwood, J.K., Chantrey, J., ... & Cunningham, A.A. 2010. Emerging infectious disease leads to rapid population declines of common British birds. PLoS one 5: e12215.
Sharps, E., Hawkes, R.W., Bladon, A.J., Buckingham, D.L., Border, J., Morris, A.J., Grice, P.V., Peach, W.J., 2023. Reversing declines in farmland birds: How much agri-environment provision is needed at farm and landscape scales? Journal of Applied Ecology 60, 568–580.
Species Specific Data
Table 1 (below): Percentage change in abundance for 66 species of Scottish breeding bird between 1994 – 2024 and 2023 – 2024. Values are given for each species by habitat (all, woodland, farmland, upland, urban) and assessment period (1994 – 2024, 2023 – 2024). Species are listed in the order of overall change (i.e., all habitats) between 1994 and 2024. These are based on smoothed indices. No value indicates that either the species does not show a strong association to the habitat or that insufficient data were available to calculate a habitat-specific trend.
| - | All | All | Farmland | Farmland | Upland | Upland | Urban | Urban | Woodland | Woodland |
|---|---|---|---|---|---|---|---|---|---|---|
| Species | 94-24 | 23-24 | 94-24 | 23-24 | 94-24 | 23-24 | 94-24 | 23-24 | 94-24 | 23-24 |
| Chiffchaff | 1550 | 10 | - | - | - | - | - | - | 1550 | 10 |
| Blackcap | 891 | 14 | - | - | - | - | - | - | 1060 | -2 |
| Great Spotted Woodpecker | 595 | -3 | - | - | - | - | - | - | 595 | -3 |
| Goldfinch | 271 | -11 | 407 | -16 | - | - | 629 | -23 | - | - |
| Stonechat | 179 | -17 | - | - | - | - | - | - | - | - |
| Whitethroat | 172 | 0 | 172 | 0 | - | - | - | - | - | - |
| Magpie | 141 | 14 | 112 | 24 | - | - | 137 | 17 | - | - |
| Tree Pipit | 136 | 31 | - | - | - | - | - | - | 136 | 31 |
| House Martin | 125 | 18 | - | - | - | - | 125 | 18 | - | - |
| Cuckoo | 90 | 6 | - | - | 109 | 1 | - | - | 56 | 14 |
| Bullfinch | 87 | -5 | - | - | - | - | - | - | 87 | -5 |
| Wren | 87 | -5 | - | - | - | - | 117 | -11 | 87 | -5 |
| Raven | 82 | -9 | - | - | 82 | -9 | - | - | - | - |
| Jackdaw | 74 | 12 | 91 | 32 | - | - | 210 | -16 | - | - |
| Great Tit | 69 | -1 | 110 | -8 | - | - | 151 | -8 | 72 | -13 |
| Treecreeper | 63 | 11 | - | - | - | - | - | - | 63 | 11 |
| Siskin | 58 | 11 | - | - | - | - | - | - | 58 | 11 |
| Corncrake | 55 | -12 | 55 | -12 | - | - | - | - | - | - |
| Willow Warbler | 55 | 12 | - | - | - | - | - | - | 55 | 12 |
| Reed Bunting | 54 | -10 | 54 | -10 | - | - | - | - | - | - |
| Song Thrush | 38 | 0 | 64 | 0 | - | - | 28 | -11 | 51 | -4 |
| Dunnock | 32 | -1 | 13 | -13 | - | - | 29 | -6 | 24 | -5 |
| Golden Eagle | 32 | 1 | - | - | 32 | 1 | - | - | - | - |
| Lesser Redpoll | 31 | -5 | - | - | - | - | - | - | 31 | -5 |
| Blackbird | 25 | 0 | 58 | -3 | - | - | -46 | -2 | 22 | -3 |
| Hen Harrier | 20 | 2 | - | - | 20 | 2 | - | - | - | - |
| Snipe | 20 | -20 | - | - | 20 | -20 | - | - | - | - |
| Sedge Warbler | 18 | -20 | 18 | -20 | - | - | - | - | - | - |
| Buzzard | 16 | 1 | 40 | 17 | - | - | - | - | 20 | 10 |
| House Sparrow | 16 | 1 | - | - | - | - | -23 | 13 | - | - |
| Collared Dove | 15 | -1 | - | - | - | - | -39 | -22 | - | - |
| Blue Tit | 11 | -3 | 20 | 2 | - | - | 25 | 27 | 24 | -6 |
| Goldcrest | 10 | -28 | - | - | - | - | - | - | 10 | -28 |
| Woodpigeon | 10 | 11 | -4 | 18 | - | - | 275 | 3 | - | - |
| Coal Tit | 8 | -6 | - | - | - | - | - | - | 8 | -6 |
| Linnet | 6 | 11 | 6 | 11 | - | - | - | - | - | - |
| Robin | 6 | -2 | - | - | - | - | 81 | 35 | 9 | 2 |
| Yellowhammer | 4 | -7 | 4 | -7 | - | - | - | - | - | - |
| Mistle Thrush | 1 | -29 | - | - | - | - | - | - | 1 | -29 |
| Skylark | -2 | -1 | -23 | -5 | 24 | 6 | - | - | - | - |
| Swallow | -5 | -15 | -5 | -15 | - | - | - | - | - | - |
| Carrion Crow | -7 | -19 | 13 | -13 | - | - | -8 | 16 | - | - |
| Grey Heron | -8 | 5 | - | - | - | - | - | - | - | - |
| Chaffinch | -11 | -5 | -8 | -9 | - | - | - | - | -17 | -6 |
| Meadow Pipit | -15 | -13 | - | - | -15 | -13 | - | - | - | - |
| Willow/Red Grouse | -21 | 0 | - | - | -21 | 0 | - | - | - | - |
| Golden Plover | -22 | -30 | - | - | -22 | -30 | - | - | - | - |
| Mallard | -22 | -7 | - | - | - | - | - | - | - | - |
| Peregrine | -22 | -1 | - | - | -22 | -1 | - | - | - | - |
| Wheatear | -25 | -8 | - | - | -25 | -8 | - | - | - | - |
| Grey Wagtail | -26 | 55 | - | - | - | - | - | - | - | - |
| Hooded Crow | -26 | -12 | - | - | -26 | -12 | - | - | - | - |
| Pied Wagtail | -33 | -5 | -33 | -5 | - | - | - | - | - | - |
| Starling | -33 | -25 | -20 | -31 | - | - | -49 | -25 | - | - |
| Common Sandpiper | -35 | 2 | - | - | -35 | 2 | - | - | - | - |
| Rook | -41 | -21 | -40 | -7 | - | - | - | - | - | - |
| Dipper | -42 | -36 | - | - | -42 | -36 | - | - | - | - |
| Oystercatcher | -42 | 0 | -42 | 0 | - | - | - | - | - | - |
| Kestrel | -59 | 14 | -59 | 14 | - | - | - | - | - | - |
| Black Grouse | -64 | -3 | - | - | -64 | -3 | - | - | - | - |
| Lapwing | -64 | -6 | -64 | -6 | - | - | - | - | - | - |
| Curlew | -65 | -15 | - | - | -65 | -15 | - | - | - | - |
| Greenfinch | -68 | -6 | -60 | -7 | - | - | -85 | 1 | - | - |
| Swift | -70 | 6 | - | - | - | - | -70 | 6 | - | - |
| Dotterel | -73 | -5 | - | - | -73 | -5 | - | - | - | - |
| Capercaillie | -81 | -10 | - | - | - | - | - | - | -81 | -10 |
Table 2 (below): Percentage change in abundance for 26 species of Scottish farmland breeding birds between 1994 – 2024 and 2023 – 2024. Values are given for each species by farmland habitat (arable, pastoral, wooded, wet) and assessment period (1994 – 2024, 2022 – 2024). Species are listed in the order of change within arable habitats between 1994 and 2024. No value indicates that either the species does not show a strong association to the habitat or that insufficient data were available to calculate a habitat-specific trend.
| Arable | Arable | Pastoral | Pastoral | Wet | Wet | Wooded | Wooded | |
|---|---|---|---|---|---|---|---|---|
| Species | 94-24 | 23-24 | 94-24 | 23-24 | 94-24 | 23-24 | 94-24 | 23-24 |
| Goldfinch | 177 | 16 | 475 | -23 | 398 | -22 | ||
| Great Tit | 154 | 5 | 85 | -7 | 79 | -6 | ||
| Whitethroat | 140 | -4 | 241 | 0 | 161 | -1 | ||
| Song Thrush | 103 | 5 | 56 | 0 | 77 | -5 | ||
| Blackbird | 48 | 2 | 55 | -4 | 50 | 24 | 50 | -4 |
| Jackdaw | 39 | -8 | 135 | 54 | 118 | 49 | ||
| Blue Tit | 31 | -2 | 10 | -3 | 20 | -4 | ||
| Buzzard | 16 | 24 | 47 | 11 | 31 | 33 | ||
| Yellowhammer | 16 | -8 | 17 | 0 | -7 | -11 | ||
| Skylark | -1 | 2 | -36 | -14 | -55 | -2 | ||
| Dunnock | -6 | -9 | 22 | -10 | -7 | -11 | ||
| Woodpigeon | -15 | 12 | 12 | 14 | -4 | 40 | -5 | 19 |
| Sedge Warbler | -16 | -44 | 80 | -2 | -23 | -32 | 20 | -22 |
| Carrion Crow | -18 | -16 | 19 | -22 | -39 | -21 | 12 | -8 |
| Chaffinch | -20 | -12 | -3 | -7 | -27 | -12 | -21 | -9 |
| Swallow | -20 | -20 | 19 | -21 | -41 | -28 | -5 | -24 |
| Rook | -33 | -9 | -46 | -6 | -26 | -7 | ||
| Linnet | -37 | 34 | 27 | 49 | -33 | -3 | ||
| Starling | -43 | -31 | -22 | -38 | -46 | -34 | ||
| Pied Wagtail | -44 | 11 | -19 | -18 | 1 | -40 | -38 | -5 |
| Oystercatcher | -73 | -20 | -42 | -6 | -35 | -12 | ||
| Greenfinch | -80 | -23 | -64 | -4 | -77 | -11 | ||
| Lapwing | -83 | -42 | -59 | 28 | -63 | -18 | -85 | -46 |
| Corncrake | 55 | -12 | ||||||
| Magpie | 132 | 33 | 99 | 10 | ||||
| Reed Bunting | 147 | 35 | 8 | -12 | 137 | -7 |
Last updated:

