Official Statistics - Scottish Terrestrial Breeding Birds 1994 – 2022
Published 2024
An Official Statistics Publication for Scotland
Scotland’s terrestrial breeding birds occupy a wide range of habitats including farmland, upland, woodland and urban areas. Some species show a strong preference for a particular habitat, for example coal tit is a typical woodland bird. Others use a wider range of habitats. Skylark occupies lowland arable land as well as farmed and semi-natural upland areas. Great tit is a familiar species of woodland but also occupies the woodland and hedgerow components of farmland and gardens. Bird populations can respond relatively quickly to drivers, such as changes in habitat extent or condition, through effects on breeding success, survival and dispersal (moving from one area to another). Since birds are well surveyed in the UK through volunteer-based and professional surveys, and many are widespread and abundant, they are often used as indicators of environmental change.
Evidence
We monitor terrestrial breeding bird populations primarily through the volunteer-led Breeding Bird Survey (Heywood et al., 2023). The majority of the sample is composed of randomly located 1km survey squares that are visited twice each breeding season (April to July). A subset of upland sites are visited only once per season in the Upland Rover initiative to boost coverage of squares in more remote areas. These squares are intended to be representative of Scottish landscapes including farmland, woodland, upland and urban habitats. We examined bird population trends in each of these habitats. Within farmland, we examined bird population trends in four sub-categories: arable, pastoral, woody farmland and wet farmland. Trends for ten of the 66 species were based on the findings of targeted surveys, as these species are either too scarce for reliable trends to be produced through BBS or are better monitored by specialised surveys.
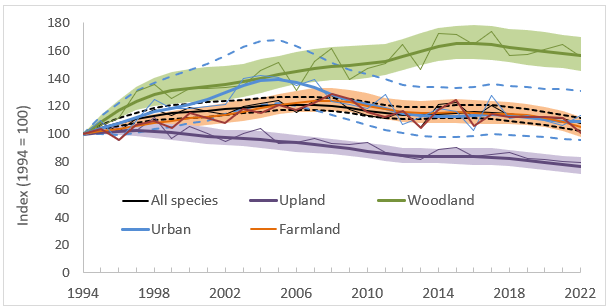
Figure 1. Smoothed Index of Abundance for Scottish Terrestrial Breeding Birds, 1994 to 2022.
Click for a full description
Dashed lines (for all species trend and urban trend) and shaded areas (for other habitat-specific trends) illustrate 95% confidence intervals.
Separate lines are shown for All species; woodland; farmland; upland; and urban bird species with 95% confidence intervals.
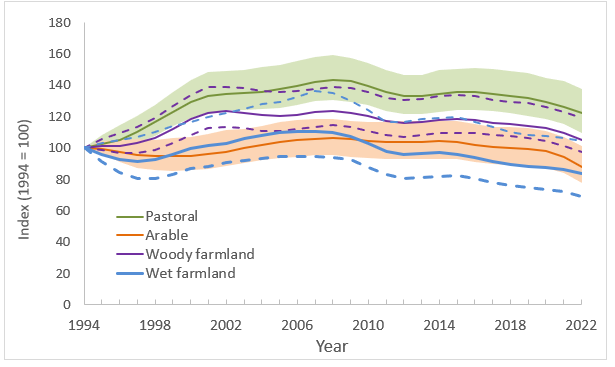
Figure 2. Index of Abundance for Scottish Farmland Breeding Birds, 1994 to 2022.
Click for a full description
Index of Abundance for Scottish Farmland Breeding Birds, 1994 to 2022. Solid lines are smoothed trends. Shaded areas (for arable and pastoral farmland birds) and dashed lines (wet and woody farmland) illustrate 95% confidence intervals.
Assessment
Since the start of the time series in 1994 to the most recent estimate in 2022:
- Of the 66 bird species 32 increased, 30 declined and 4 remained stable (i.e. within 5% of 1994 value) (Table 1).
- The all-species (smoothed) index increased steadily up to the mid-2000s, but subsequently declined, it is currently 7% higher than in 1994 (Fig. 1).
- The smoothed woodland bird index increased significantly, by 56%, although it has been relatively stable since its peak in 2016 (Fig. 1).
- The smoothed farmland bird index increased steadily up to the late-2000s, peaking at around 25% above the 1994 index value. It is currently 5% higher than in 1994. This small increase in the farmland bird index was largely due to an increase in the pastoral bird index, which is currently 22% higher than in 1994 and the woody farmland bird index (5% higher than 1994) (Fig. 2). The arable and wet farmland bird indices have declined by 12% and 16% respectively since 1994.
- The smoothed upland bird index decreased by 23%.
- The smoothed urban bird index increased steadily until the mid-2000s, followed by a steady decline. It is currently 9% higher than in 1994.
- The unsmoothed data show that, in the short-term (between 2021 and 2022), the all-species index, and upland bird index have remained stable (i.e. have not changed more than 5% since last reported). While the all-species index remained stable, more species declined over the last year than increased (17 species increased, 24 declined). The woodland and farmland bird indices decreased between 2021 and 2022 by 9% and 11% respectively, while the urban index increased by 7%.
Understanding the changes
In this commentary, ‘long-term’ refers to the period from 1994 to 2022 while ‘short-term’ refers to changes between 2021 and 2022. Longer-term changes since the 1970s, analogous to those reported for the UK (e.g. DEFRA, 2021; Heywood et al., 2023) are not available for Scotland due to low levels of monitoring coverage prior to the start of the BBS in 1994. The main drivers of population change are often unclear, but information is provided, where available, that may help to explain some of the likely causes. Breeding bird populations in Scotland are, as elsewhere, affected by conditions in all parts of their range; in the non-breeding, as well as the breeding season. For example, a summer migrant to Scotland may be affected by conditions in Scotland, along its migration route, and/or on its wintering grounds. Long-term and short-term changes for individual species are assessed using unsmoothed trends. Due to annual variability in the individual species trends, populations are considered to have increased or decreased only when the change is at least 5%. Individual species trends are shown in Table 1. A further 46 terrestrial species regularly breed in Scotland but are too scarce to be monitored by the BBS effectively and are not covered by species-specific surveys. Among these species are several woodland, farmland and upland specialists of current conservation concern (Eaton et al., 2015) such as wood warbler, spotted flycatcher and whinchat.
The latest results show the smoothed all-species index steadily increased since 1994, peaking in 2006 then becoming more variable after this time (Fig. 1). In 2022, it was 14% below the peak in 2006 and 7% higher than in 1994. The two indicators with notable long-term changes since 1994 were woodland, which increased by 56%, and upland, which declined by 23%. In the short-term, the all-species and upland indicators remained relatively stable while the woodland and farmland indicators declined by 9% and 11% respectively, and the urban indicator increased by 7%.
Much of the increase in Scotland’s birds may have been linked to changes in weather. The all-species indicator correlated positively with the mean annual Scottish temperature (from June in the year preceding monitoring – May in the year of monitoring, Met Office et al., 2018), and the summer rainfall (June – August in the year preceding monitoring). These two variables explained 60% of the variation in the annual bird index (parameter estimate from a linear model of annual index varying with (a) mean annual temperature = 9.87 ± 1.60, t = 6.16, P < 0.001 and (b) summer rainfall = 0.139 ± 0.037, t = 3.76, P < 0.001) (Fig. 3). When the relationship between the all-bird index and temperature and rainfall was accounted for (i.e. the residuals of a model of bird index varying with annual temperature and summer rainfall), the all-species index remained relatively stable until 2021, suggesting that there were probably no other large drivers of change (Fig. 4). Between 2021 and 2022 there was a large decline in the all-species index to 13% lower than 1994 levels, despite a high temperature that year, which may be linked to 2021 having the driest summer in over 25 years in Scotland. Statistical models like the ones used here are often prone to underestimating the impact of extreme weather events such as the 2021 summer drought. It is very likely that the bird index has also been affected, to some extent, by other factors such as land-use change and other aspects of climate.
The woodland and farmland indicators also correlated positively with annual temperature and summer rainfall. The woodland indicator additionally correlated with lagged summer rainfall (June – August two years before monitoring). These models explained 52% and 40% of the annual variation respectively for the woodland and farmland indicators. The urban indicator correlated only with annual temperature, explaining 21% of variation, while upland indicator correlated negatively with both summer rain and lagged summer rain, explaining 32% of variation. When the relationships between these bird indices and weather were accounted for, there was only a 7% rise in the woodland indicator, while the upland, urban and farmland indicators declined by 23%, 13% and 15% respectively, suggesting other drivers such as land-use change may have had a negative impact in these habitats (Fig. 4). For all indices, after accounting for the modelled relationships with weather, there were short-term declines seen in 2022 between 8% and 13%.
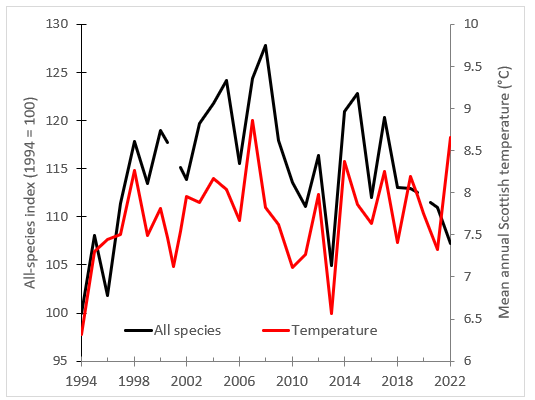
Figure 3. The all-species bird index and mean annual Scottish temperature.
Click for a full description
The all-species bird index and mean annual Scottish temperature.
The all-species bird index (black lines) and mean annual Scottish temperature from June in the previous year to May in the stated year (Degrees Celsius, right-hand axis) from 1994 – 2022. (Met office et al., 2018).
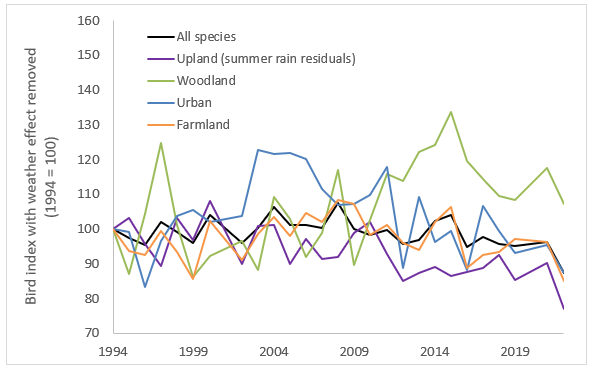
Figure 4. Index of Abundance for Scottish Terrestrial Breeding Birds, 1994 to 2022 with weather effect removed.
Click for a full description
The residuals of linear models of the bird indices varying with mean annual Scottish weather from both years preceding monitoring. The upland bird index was modelled against summer rainfall from both the years preceding monitoring. The residuals of each linear model were subtracted from the 1994 residual value and 100 was added to make the changes comparable to the standard indices.
Woodland
Over the long-term, woodland bird species increased more than those in the other groups, by 56%. Much of this increase may be linked to changes in weather as the woodland index correlated with the annual temperature (24.63 ± 5.11, t = 4.82, P < 0.001), summer rainfall (0.436 ± 0.117, t = 3.74, P = 0.001) and lagged summer temperature (0.255 ± 0.111, t = 2.31, P = 0.031), explaining 52% of variation. Once the relationship between the woodland bird index and weather were accounted for, there was only a 7% increase in the woodland bird index. From 1994 – 2022 the mean annual temperature in Scotland did not significantly increase, while summer rainfall was the only seasonal weather factor to significantly change in Scotland over this time, with rainfall in June-August increasing from an annual average of 237mm of rain during the period from 1993 – 1997 to an average of 363mm during the period from 2016 – 2021. The increase in woodland birds may therefore be linked to increasing rainfall, potentially due to increases in invertebrate availability (Eggleton et al. 2009; Martay et al. 2018), although there has been little research to examine this. This contrasts to the English woodland bird index which declined by 20% over the same period, although it should be noted that there were 15 species in the English woodland bird index that were not included in the Scotland woodland bird index because of limited data (DEFRA 2023). Eighteen of the 23 species in the Scottish woodland indicator have increased since 1994. The biggest increases, of over 500%, are for chiffchaff, blackcap and great spotted woodpecker. Bullfinch, great tit, wren, tree pipit, willow warbler, and song thrush have also increased by more than 50%. The biggest long-term decrease (-76%) is for capercaillie. The only other species to decline in woodland were chaffinch (-16%) and buzzard (-7%). The chaffinch decline is likely to be due to the disease Trichomonas gallinae (Robinson et al., 2010). Capercaillie declines have been linked to death from collisions with fences and potentially a negative effect of rising temperatures (Moss et al., 2001).
Willow warbler and chiffchaff are among Scotland’s most common woodland migrant birds. Increases in these species are likely to be driven by increasing temperatures (Martay et al., 2022). Most of England has now exceeded the optimum breeding season temperature for willow warbler, likely contributing to large declines of willow warbler populations in England. Average Scottish breeding season temperatures (mean of 10.6°C in April – July from 2018 – 2022) are now close to the optimum for willow warbler (11°C) but still well below the optimum temperature for chiffchaff (12.7°C). Parts of southern lowland Scotland may already have temperatures of above 11°C so willow warbler may decline in coming years (Martay et al., 2022). The impact of temperature on these birds may be due to the effect of temperature on their invertebrate prey abundance and phenology, but more research is required to identify the mechanisms The impacts of land-use change and climate change outside of the breeding season for migrants are less well understood.
Over the short-term there has been a mixed pattern of population change among woodland indicator species. Nine species have undergone recent declines, most of these being species that had large increased in the previous year, such as mistle thrush, treecreeper, dunnock and great spotted woodpecker. The greatest short-term increases (>20% increase) were seen in wren, goldcrest and blackcap, all of which declined previously, from 2019-2021.
Farmland
Overall, there has been a long-term increase of 5% among the species trends that contribute to the farmland bird indicator. This increase was largely due to positive population trends in areas dominated by pastoral farmland, where the index increased by 22%. Seventy percent of species that contributed to both the pastoral and arable indicators had more positive trends on pastoral farmland (Table 2). Species that did not fit this pattern, having increased on arable farmland more rapidly than on pastoral farmland, included great tit and whitethroat, while skylark and rook declined on both types of farmland, but at a faster rate on pastoral than arable farmland (Table 2).
The long-term increase in the farmland bird index may be linked to changes in weather: the farmland index was positively correlated with annual temperature and summer rainfall, explaining 40% of variation in the index. When the relationships between the farmland index and weather were accounted for, there was an apparent decline in the farmland bird index by 13% since 1994, largely driven by declines since 2008. Long-term changes in Scottish and UK farmland bird populations have also been contributed to by a range of factors including agricultural intensification, reduced diversity of crop types at the within-farm scale and reductions in spring-sown crops (Donald et al., 2001; Bell and Calladine, 2017). Agri-environment schemes have been in place in Scotland for around two decades, with results varying between different species. Targeted measures can be effective for some species, such as the provision of cover crops which benefits seed eating birds including goldfinch, linnet and yellowhammer (Foster et al. 2013). A recent study in northeast Scotland found positive associations between bird abundance and specific land management options that met species’ ecological requirements. These included higher abundance of reed bunting in fields with water margins, and of yellowhammers in species‐rich grasslands. This highlights the importance of farm‐ and field‐scale targeting of management within AES (Daskalova et al. 2019). In addition, some farmland birds (e.g. goldfinch) may be benefitting from garden feeding (Plummer et al., 2019).
The greatest long-term increases have been for goldfinch (+358%), whitethroat (+128%), great tit (+120%) and magpie (+104%), making these species more than twice as abundant on farmland as they were in 1994. There have been some substantial long-term decreases in other farmland bird populations, however, including declines of more than 50% for kestrel, greenfinch and lapwing, and 25-50% declines for oystercatcher, rook, pied wagtail and skylark. Some farmland species such as grey partridge, corn bunting and tree sparrow do not contribute to this indicator because BBS surveys provided insufficient coverage for these species. The 2007-11 Bird Atlas (Balmer et al., 2013) suggests that in Scotland there have been long-term declines (between 1970 and 2010) for the former two species and substantial increases for the latter during the same period.
Notable short-term changes from 2021 – 2022, that differed from the long-term trends included goldfinch and great tit, which had short-term declines of 8% and 14% respectively, despite a long-term increase of over 100%. However, these declines were well within normal levels of variation.
Upland
The decline of 23% between 1994 and 2021 for upland birds was greater than that experienced by any other group. The upland index was the only index that did not correlate with annual temperature. However, the upland index correlated negatively with both summer rainfall in the year prior to monitoring and two years prior to monitoring, with these two variables explaining 52% of the variation in the upland index. Summer rainfall was the only seasonal weather factor to significantly change in Scotland between 1993 and 2021, with rainfall in June-August increasing from an annual average of 237mm of rain during the period from 1993 – 1997 to an average of 363mm during the period from 2016 – 2021. When the relationship between the upland indicator and summer rain was accounted for the upland index still declined by 13%.
Seventeen species contribute to the upland bird indicator, and of these twelve have experienced significant population declines since 1994. Three species (dotterel, black grouse and curlew) have declined by more than 50% during this time. Long-term changes in upland bird populations have been contributed to by a number of factors including climate change, forest expansion, and changes in site-based management practices such as grazing and predator control (Buchanan et al., 2017). The negative association between increasing summer rainfall and upland bird declines supports the idea that climate change is driving some of the long-term changes in upland bird populations. Changes in numbers of golden plover have been linked to climate change, in part due to the negative impact of increasing temperatures on the abundance of craneflies (an important source of food for these birds during the breeding season; Pearce-Higgins et al., 2010). Likewise, curlew populations may benefit from cooler temperatures and higher summer rainfall (Franks et al., 2017). Our results suggest that upland birds may be affected by climate change in more than one way, as increased summer rainfall would be expected to increase cranefly populations. The negative correlation between summer rainfall and abundance applied to eight of the twelve species for which BBS data contributed to the upland index (golden plover, meadow pipit, curlew, peregrine, black grouse, dipper, common sandpiper and dotterel) and could be due to higher levels of chick mortality due to increased summer rain (Eglington et al., 2010) though determining this would require further investigation.
One of the most impactful findings to emerge from the last Bird Atlas 2007-11 (Balmer et al. 2013) is that many wader species have disappeared from large areas of their former breeding ranges. This is consistent with the declines of these species reported from the Breeding Bird Survey in Scotland and across the UK. Concern about both upland and lowland breeding wader declines has resulted in a wide range of research and conservation initiatives, with many of those in Scotland highlighted on the Working for Waders website. Much research is underway to identify factors affecting the rapidly declining curlew populations, with evidence suggesting interacting effects of climate change, land use change and predation (Douglas et al., 2014; Franks et al., 2017). In contrast, cuckoo, raven, golden eagle and snipe populations increased by 106%, 77%, 29% and 20% respectively, since 1994. The only large short-term increase was seen for hooded crow, despite a long-term decline. Red grouse showed the largest short-term decline of 22%.
Some other upland breeders such as whinchat and ring ouzel do not currently contribute to the upland indicator because insufficient numbers of these species are recorded in BBS surveys. Both of these species are in long-term decline (Balmer et al., 2013; Henderson et al., 2014; Wotton et al., 2016).
Urban
Since 1994, there has been an increase of 9% among the species trends that contribute to the urban bird indicator. This is largely due to an increase until the mid-2000s, which was followed by a slow decline. The greatest long-term increases have been for jackdaw (+246%), magpie (+225%), goldfinch (+142%), woodpigeon (+134%) and great tit (+132%). There have been some substantial long-term decreases in other urban bird populations, however, including declines of more than 50% for greenfinch, swift and collared dove, and 25-50% declines for blackbird and starling.
The urban bird index correlated positively with annual temperature, explaining 21% of variation. After accounting for this relationship between urban birds and temperature, the urban index declined by 13% between 1994 – 2021, with the majority of this decline taking place since the early 2000s. This could indicate that climate change has benefitted urban birds but that other changes have been detrimental. Possible drivers of the decline include changes in bird communities due to increased garden bird feeding (Plummer et al., 2019), loss of green space and the impacts of diseases such as trichomoniasis (Robinson et al. 2010).
The urban bird index increased substantially in the past year, by 9%, a relatively minor increase following a minor decline. This is partly driven by increases of around 40% in carrion crow and jackdaw, two species with long-term increases, and also by an increase in swift by 40%, a declining species, following a large decline from 2019-2021. Swift is experiencing a substantial long-term decline (-60%) which may be related to the reduced availability of suitable nesting sites on buildings (Woodward et al., 2018), though a reduction in availability of flying insects may also play a role (Hallmann et al., 2017). Swifts are long-distance migrants and there may also be factors that influence their survival outside the breeding season during migration or on their wintering grounds. Tracking studies in the UK and elsewhere in Europe have revealed that European swift populations have high migratory connectivity, with swifts breeding at northern latitudes overwintering in different parts of sub-Saharan Africa than those breeding further south (Åkesson et al. 2020).
Source data and updates
Data for 56 of the 66 species come from the Breeding Bird Survey (BBS) run by British Trust for Ornithology (BTO) on behalf of a partnership that also includes the Joint Nature Conservation Committee (JNCC) and Royal Society for the Protection of Birds (RSPB). The BBS started in 1994, and comprises annual counts at randomly selected 1-km squares (Heywood et al. 2023). Trends for common sandpiper and dipper are derived from the BTO Waterways Bird Survey and the Waterways Breeding Bird Survey. Grey heron trends are derived from the Heronries Census. Trends for seven species (golden eagle, hen harrier, peregrine, dotterel, corncrake, black grouse and capercaillie) are estimated from single-species surveys carried out periodically, during the period 1994 to 2022 as part of the SCARABBS (Statutory Conservation Agency/RSPB Annual Breeding Bird Scheme) programme. A further 46 terrestrial species regularly breed in Scotland (being found in at least 100 10km squares in Bird Atlas 2007-11), but insufficient data are available through current monitoring schemes to permit their inclusion in these indicators.
Generalised Linear Models were used to generate trends with annual dataTo prevent short-term population variability and sampling error having an undue influence, trends were smoothed and long-term trends assessed using techniques recommended by Fewster et al. (2000). The smoothed indices were used to assess the significance of long-term changes and the unsmoothed indices were used to assess the significance of short-term changes. Details of the methods used to calculate the indices are available from the BTO Website. In Scotland, multi-species indicators cannot be extended to the period before BBS started in 1994, as monitoring coverage of many terrestrial bird species was poor in Scotland up until this point. Changes reflected by these indicators therefore exclude any influence of changes that occurred prior to 1994. Based on UK data, these included population declines in many farmland and woodland species.
Results for the UK are available on the Scottish Government website: Wild bird populations in the UK.
Official Statistics are produced by professionally independent statistical staff in accordance with the Code of Practice for Statistics.
Table 1. Percentage changes in abundance for the Scottish Terrestrial Breeding Birds, 1994-2022 and 2021-2022, species listed in order of overall change 1994 to 2022. Summarised trends for individual species and their habitat associations from 1994 to 2022, and the most recent year of change. A blank entry denotes that the species did not show a strong association to that habitat, or that insufficient data were available to calculate a habitat-specific trend.
| Species | All species index 1994 – 2022 | All species index 2021 – 2022 | Woodland index 1994 – 2022 | Woodland index 2021 – 2022 | Farmland index 1994 – 2022 | Farmland index 2021 – 2022 | Upland index 1994 – 2022 | Upland index 2021 – 2022 | Urban index 1994 – 2022 | Urban index 2021 – 2022 |
|---|---|---|---|---|---|---|---|---|---|---|
| Chiffchaff | 1277 | 7 | 1277 | 7 | - | - | - | - | - | - |
| Blackcap | 659 | 20 | 635 | 20 | - | - | - | - | - | - |
| Great Spotted Woodpecker | 590 | -8 | 590 | -8 | - | - | - | - | - | - |
| Goldfinch | 250 | -9 | - | - | 358 | -8 | - | - | 142 | -12 |
| Stonechat | 237 | 83 | - | - | - | - | - | - | - | - |
| Magpie | 131 | 8 | - | - | 114 | -5 | - | - | 225 | 27 |
| Whitethroat | 128 | 7 | - | - | 128 | 7 | - | - | - | - |
| House Martin | 104 | 6 | - | - | - | - | - | - | 104 | 6 |
| Bullfinch | 101 | -19 | 101 | -19 | - | - | - | - | - | - |
| Corncrake | 85 | -1 | - | - | 85 | -1 | - | - | - | - |
| Raven | 77 | -11 | - | - | - | - | 77 | -11 | - | - |
| Wren | 77 | 31 | 77 | 31 | - | - | 83 | 18 | ||
| Cuckoo | 74 | -21 | 32 | -29 | - | - | 106 | -13 | ||
| Great Tit | 71 | -2 | 78 | 10 | 120 | -14 | - | - | 132 | 40 |
| Reed Bunting | 70 | 9 | - | - | 70 | 9 | - | - | - | - |
| Tree Pipit | 64 | -7 | 64 | -7 | - | - | - | - | - | - |
| Willow Warbler | 64 | -3 | 64 | -3 | - | - | - | - | - | - |
| Jackdaw | 53 | 7 | - | - | 37 | -9 | - | - | 246 | 43 |
| Lesser Redpoll | 46 | 7 | 46 | 7 | - | - | - | - | ||
| Song Thrush | 40 | 2 | 55 | 8 | 51 | -6 | - | - | -14 | -4 |
| House Sparrow | 30 | -12 | - | - | - | - | - | - | -16 | 1 |
| Goldcrest | 30 | 21 | 30 | 21 | - | - | - | - | - | - |
| Golden Eagle | 29 | 1 | - | - | - | - | 29 | 1 | - | - |
| Treecreeper | 26 | -34 | 26 | -34 | - | - | - | - | - | - |
| Blue Tit | 21 | -7 | 25 | 8 | 25 | -17 | - | - | 40 | 1 |
| Snipe | 20 | -10 | - | - | - | - | 20 | -10 | - | - |
| Blackbird | 15 | -2 | 14 | 1 | 39 | -4 | - | - | -49 | 2 |
| Siskin | 12 | -26 | 12 | -26 | - | - | - | - | - | - |
| Buzzard | 12 | -22 | -7 | -21 | 11 | -31 | - | - | - | - |
| Dunnock | 11 | -17 | 34 | -21 | -3 | -18 | - | - | 17 | -6 |
| Grey Wagtail | 9 | 35 | - | - | - | - | - | - | - | - |
| Sedge Warbler | 7 | 9 | - | - | 7 | 9 | - | - | - | - |
| Coal Tit | 3 | 2 | 3 | 2 | - | - | - | - | - | - |
| Robin | 2 | 1 | 14 | 9 | - | - | - | - | 55 | 2 |
| Mistle Thrush | 1 | -34 | 1 | -34 | - | - | - | - | - | - |
| Yellowhammer | -1 | -20 | - | - | -1 | -20 | - | - | - | - |
| Wheatear | -7 | 3 | - | - | - | - | -7 | 3 | - | - |
| Carrion Crow | -8 | -4 | - | - | 1 | -7 | - | - | 10 | 43 |
| Hen Harrier | -8 | -2 | - | - | - | - | -8 | -2 | - | - |
| Skylark | -9 | -2 | - | - | -26 | -9 | 2 | 1 | - | - |
| Meadow pipit | -9 | 2 | - | - | - | - | -9 | 2 | - | - |
| Woodpigeon | -11 | -3 | - | - | -15 | 3 | - | - | 134 | 5 |
| Linnet | -11 | -32 | - | - | -11 | -32 | - | - | - | - |
| Chaffinch | -13 | -5 | -16 | -4 | -13 | -11 | - | - | - | - |
| Starling | -15 | 11 | - | - | 1 | 7 | - | - | -48 | -13 |
| Collared Dove | -16 | -20 | - | - | - | - | - | - | -53 | -21 |
| Mallard | -21 | -21 | - | - | - | - | - | - | - | - |
| Peregrine | -21 | -1 | - | - | - | - | -21 | -1 | - | - |
| Golden Plover | -21 | 2 | - | - | - | - | -21 | 2 | - | - |
| Swallow | -22 | -1 | - | - | -22 | -1 | - | - | - | - |
| Pied Wagtail | -26 | -12 | - | - | -26 | -12 | - | - | - | - |
| Willow/Red Grouse | -32 | -22 | - | - | - | - | -32 | -22 | - | - |
| Grey Heron | -32 | -9 | - | - | - | - | - | - | - | - |
| Dipper | -35 | 8 | - | - | - | - | -35 | 8 | - | - |
| Rook | -36 | -6 | - | - | -36 | -6 | - | - | - | - |
| Oystercatcher | -37 | 0 | - | - | -37 | 0 | - | - | - | - |
| Common Sandpiper | -41 | 5 | - | - | - | - | -41 | 5 | - | - |
| Hooded Crow | -42 | 23 | - | - | - | - | -42 | 23 | - | - |
| Curlew | -60 | 3 | - | - | - | - | -60 | 3 | - | - |
| Swift | -60 | 39 | - | - | - | - | - | - | -60 | 39 |
| Black Grouse | -62 | -3 | - | - | - | - | -62 | -3 | - | - |
| Lapwing | -65 | 2 | - | - | -65 | 2 | - | - | - | - |
| - | -70 | -5 | - | - | - | - | -70 | -5 | - | - |
| Capercaillie | -76 | 1 | -76 | 1 | - | - | - | - | - | - |
| Greenfinch | -76 | -30 | - | - | -79 | -44 | - | - | -84 | -23 |
| Kestrel | -80 | -30 | - | - | -80 | -30 | - | - | - | - |
Table 2. Percentage changes in abundance for the Scottish Farmland Breeding Birds, 1994-2022 and 2021-2022, species listed in order of overall change 1994 to 2022 in arable farmland. Summarised trends for individual species and their habitat associations from 1994 to 2021, and the most recent year of change. A blank entry denotes that the species did not show a strong association to that habitat, or that insufficient data were available to calculate a habitat-specific trend.
| Species | Arable farmland index 1994 – 2022 | Arable farmland index 2021 – 2022 | Pastoral farmland index 1994 – 2022 | Pastoral farmland index 2021 – 2022 | Woody farmland index 1994 – 2022 | Woody farmland index 2021 – 2022 | Wet farmland index 1994 – 2022 | Wet farmland index 2021 – 2022 |
|---|---|---|---|---|---|---|---|---|
| Goldfinch | 190 | -20 | 386 | -7 | 446 | -3 | ||
| Great Tit | 181 | -23 | 84 | -6 | 95 | -10 | ||
| Whitethroat | 144 | 0 | 128 | 34 | 127 | 21 | ||
| Song Thrush | 77 | 5 | 47 | -13 | 81 | 4 | ||
| Blue Tit | 31 | -13 | 12 | -25 | 25 | -17 | ||
| Blackbird | 25 | -9 | 48 | -5 | 41 | -3 | 17 | -7 |
| Jackdaw | 15 | 11 | 64 | -18 | 76 | -6 | ||
| Yellowhammer | -3 | -24 | 12 | -13 | -6 | -18 | ||
| Buzzard | -5 | -37 | 18 | -29 | 4 | -32 | ||
| Dunnock | -14 | -25 | 9 | -20 | -11 | -16 | ||
| Skylark | -15 | -18 | -42 | -8 | -26 | -9 | ||
| Starling | -18 | -47 | 14 | 35 | 26 | 3 | ||
| Swallow | -24 | 19 | -9 | -2 | -19 | 16 | -50 | -14 |
| Rook | -27 | -12 | -37 | -16 | -21 | -18 | ||
| Carrion Crow | -27 | -17 | 19 | -9 | 6 | 1 | -27 | -47 |
| Chaffinch | -28 | -17 | 0 | -8 | -20 | -12 | -22 | -11 |
| Sedge Warbler | -28 | 8 | 31 | 9 | 0 | 22 | 7 | 15 |
| Woodpigeon | -34 | -11 | 1 | 18 | -27 | 4 | -39 | -38 |
| Pied Wagtail | -46 | -26 | -2 | -11 | -33 | -7 | -24 | -14 |
| Linnet | -49 | -57 | 2 | -22 | -38 | -42 | ||
| Lapwing | -63 | 10 | -64 | -10 | -80 | -24 | -58 | 4 |
| Oystercatcher | -65 | -7 | -34 | -6 | -41 | -2 | ||
| Greenfinch | -89 | -68 | -83 | -49 | -89 | -57 | ||
| Reed Bunting | 265 | 10 | 180 | 17 | 130 | -2 | ||
| Magpie | 108 | 3 | 113 | 1 | ||||
| Corncrake | 85 | -1 |
References
Balmer, D.E., Gillings, S., Caffrey, B.J., Swann, R.L., Downie, I.S., & Fuller, R.J. 2013. Bird Atlas 2007-11: the breeding and wintering birds of Britain and Ireland (Thetford: BTO Books).
Bell, M.V. & Calladine, J. 2017. The Decline of a Population of Farmland Breeding Waders: a twenty-five year case study. Bird Study 64: 264-273.
Buchanan, G.M., Pearce-Higgins, J.W., Douglas, D.J.T. & Grant, M.C. 2017. Quantifying the importance of multi-scale management and environmental variables on moorland bird abundance. Ibis 159: 744-756.
Daskalova G.N., Phillimore A.B., Bell M., Maggs H.E. & Perkins A.J. 2019. Population responses of farmland bird species to agri-environment schemes and land management options in North eastern Scotland. Journal of Applied Ecology 56: 640– 650. https://doi.org/10.1111/1365-2664.13309
DEFRA 2023. Wild Bird Populations in England, 1970 to 2022. National Statistics, 7 November 2023.
Department for Environment, Food and Rural Affairs. 2019. Wild bird populations in the UK, 1970 to 2019 (Updated for Wintering Waterbirds): Annual statistical release. Defra National Statistics, London. https://www.gov.uk/government/statistics/wild-bird-populations-in-the-uk
Donald, P.F., Green, R.E. & Heath, M.F. 2001. Agricultural intensification and the collapse of Europe’s farmland bird populations. Proceedings of the Royal Society B: Biological Sciences 268: 25-29.
Douglas, D.J.T., Bellamy, P.E., Stephen, L.S. Pearce–Higgins, J.W., Wilson, J.D. & Grant, M.C. 2014. Upland land use predicts population decline in a globally near-threatened wader. Journal of Applied Ecology 51: 194-203.
Eaton, M., Aebischer, N., Brown, A., Hearn, R., Lock, L., Musgrove, A., … & Gregory, R. 2015. Birds of Conservation Concern 4: the population status of birds in the UK, Channel Islands and Isle of Man. British Birds 108: 708-746.
Eggleton, P., Inward, K., Smith, J., Jones, D. T., & Sherlock, E. (2009). A six year study of earthworm (Lumbricidae) populations in pasture woodland in southern England shows their responses to soil temperature and soil moisture. Soil Biology and Biochemistry, 41(9), 1857-1865.
Eglington, S.M., Bolton, M., Smart, M.A., Sutherland, W.J., Watkinson, A.R. & Gill, J.A. 2010. Managing water levels on wet grasslands to improve foraging conditions for breeding northern lapwing Vanellus vanellus. Journal of Applied Ecology 47: 451-458.
Fewster, R.M., Buckland, S.T., Siriwardena, G.M., Baillie, S.R. & Wilson, J.D. 2000. Analysis of population trends for farmland birds using generalized additive models. Ecology 81: 1970-1984.
Foster, S., Harrison, P., Buckland, S., Elston, D., Brewer, M., Johnston, A., Pearce‐Higgins, J. & Marrs, S. 2013. Trends of Breeding Farmland Birds in Scotland. Trend Note 022. Scottish Natural Heritage.
Franks, S.E., Douglas, D.J., Gillings, S. & Pearce-Higgins, J.W. 2017. Environmental correlates of breeding abundance and population change of Eurasian Curlew Numenius arquata in Britain. Bird Study 64: 393-409.
Hanmer, H.J., Cunningham, A.A., John, S.K., Magregor, S.K., Robinson, R.A., Seilern-Moy, K., ... & Lawson, B. 2022. Habitat-use influences severe disease-mediated population declines in two of the most common garden bird species in Great Britain. Scientific reports 12: 1-13.
Henderson, I., Calladine, J., Massimino, D., Taylor, J. & Gillings, S. 2014. Evidence for contrasting causes of population change in two closely related, sympatric breeding species the Whinchat Saxicola rubetra and Stonechat Saxicoorquateata in Britain. Bird Study 61: 553-565.
Heywood, J. J. N., Massimino, D., Balmer, D. E., Kelly, L., Noble, D. G., Pearce-Higgins, J. W., ... & Harris, S. J. (2023). The Breeding Bird Survey 2022. BTO Research Report, 756.
Martay, B., & Pearce-Higgins, J. W. (2018). Using data from schools to model variation in soil invertebrates across the UK: The importance of weather, climate, season and habitat. Pedobiologia, 67, 1-9.
Martay, B., Pearce‐Higgins, J.W., Harris, S.J., & Gillings, S. 2022. Breeding ground temperature rises, more than habitat change, are associated with spatially variable population trends in two species of migratory bird. Ibis.
Met Office, Hollis, D., McCarthy, M., Kendon, M., Legg, T. & Simpson, I. 2018. HadUK-Grid gridded and regional average climate observations for the UK. Centre for Environmental Data Analysis, accessed 20/10/2022. http://catalogue.ceda.ac.uk/uuid/4dc8450d889a491ebb20e724debe2dfb
Moss, R., Oswald, J., & Baines, D. 2001. Climate change and breeding success: decline of the capercaillie in Scotland. Journal of Animal Ecology, 2001: 47-61.
Pearce‐Higgins, J.W., Dennis, P., Whittingham, M.J., & Yalden, D.W. 2010. Impacts of climate on prey abundance account for fluctuations in a population of a northern wader at the southern edge of its range. Global Change Biology 16: 12-23.
Plummer, K.E., Risely, K., Toms, M.P. & Sirawrdena, G. M. 2019. The composition of British bird communities is associated with long-term garden bird feeding. Nature Communications 10: 2088.
Robinson, R.A., Lawson, B., Toms, M.P., Peck, K.M., Kirkwood, J.K., Chantrey, J., ... & Cunningham, A.A. 2010. Emerging infectious disease leads to rapid population declines of common British birds. PLoS one 5: e12215.
Tyler, G.A. & Green, R.E. 2004. Effects of weather on the survival and growth of Corncrake Crex crex chicks. Ibis 146: 69-76.
Last updated:


