NatureScot Research Report 1371 - Marine Biodiversity and Climate Change (MarClim): Scotland 2020-2022
Published: 2025
Authors: Michael T. Burrows, Tom Brook, Gail Twigg (Scottish Association for Marine Science, WWF)
Cite as: Burrows, M.T., Brook, T., and Twigg, G. 2025. Marine Biodiversity and Climate Change (MarClim): Scotland 2020-2022. NatureScot Research Report 1371.
Contents
- Keywords
- Background
- Main findings
- Acknowledgements
- Abbreviations
- 1. Introduction
- 2. Surveys
- 3. Results
- 4. Discussion
- 5. Conclusions
- 6. References
- Annex A: MarClim Taxa and their valid identities
- Annex B: Survey site locations
- Annex C: Abundance Category definitions
- Annex D: Site-frequencies of Abundance Category changes by species
- Annex E: Relative fit of non-spatial and spatial models of abundance change for MarClim species in Scotland
- Annex F: Site numbers for PCA analysis (figure 22)
- Annex G: Change in community metrics 2014-2015 to 2020-2022: checking for ‘regression to the mean’
Keywords
rocky coastlines; biodiversity; climate change; community ecology; ecosystem function; environmental drivers; intertidal survey
Background
This report describes a series of surveys of the biodiversity of rocky intertidal seashores around Scotland in September 2020, June to September 2021, and June to September 2022. The work builds on the ongoing MarClim (Marine Biodiversity and Climate Change) programme, started in 2002 and covering the coastlines of Great Britain and Ireland (to 2005) and parts of the Atlantic coasts of mainland Europe. Surveys follow a common protocol aimed at rapid assessment of abundance of over 50 species, supplemented by direct counts of species and photography of each seashore. The data collected was compared to that obtained from surveys of the same locations in 2014-2015 to determine changes. Such changes were assessed relative to expectations for responses to warming among warm-affinity and cold-affinity species.
Main findings
- One hundred and sixty-seven (167) surveys of rocky intertidal sites around Scotland’s coast were made between September 2020 and September 2022. Most of these visits were to locations previously surveyed in 2014-2015 for better detection of changes in abundance of important species.
- Sea surface temperatures were 0.20°C warmer on average in the years preceding surveys in 2020-2022 than those preceding surveys in 2014-2015.
- Changes in abundance of cold water and warm water species resulted in a small shift in dominance towards warm water species between 2014-2015 and 2020-2022, shown by an increase in Community Temperature index of 0.14°C. This change was in line with the small increase in average sea surface temperature between the two periods.
- Warm water species tended to increase in abundance within their west coast geographical ranges, while cold water species showed variable patterns of increases and declines across all regions.
- The approach of repeated surveys at precise locations used here proved to be effective at detecting biodiversity change in these rocky intertidal communities and should give a solid baseline for the detection of future change.
Acknowledgements
The surveys and research reported here were funded by Marine Scotland and NatureScot to the Scottish Association for Marine Science.
Abbreviations
Community Temperature Index (CTI)
Coronavirus disease (COVID)
European Union (EU)
Global Positioning System (GPS)
Marine Biodiversity and Climate Change programme (MarClim)
Marine Environmental Data and Information Network (MEDIN)
Marine Protected Area (MPA)
Moderate Resolution Imaging Spectroradiometer (MODIS) – US satellite sensor
National Biodiversity Network (NBN)
National Oceanic and Atmospheric Administration (NOAA) – US Agency
Optimum Interpolation Sea Surface Temperature - High Resolution (OISSTHR)
Orkney Islands Council Harbour Authority Marine Environment Unit (OICHA-MEU)
Principal Components Analysis (PCA)
Proportional Odds Logistic Regression (POLR)
Scottish Association for Marine Science (SAMS)
Sea Surface Temperature (SST)
Site of Special Scientific Interest (SSSI)
Special Area of Conservation (SAC)
Species Temperature Index (STI)
The MarClim categorical abundance scale (ExSACFOR, Extremely abundant, Superabundant, Abundant, Common, Frequent, Occasional, Rare)
1. Introduction
The Marine Biodiversity and Climate Change Project, MarClim is a UK and Ireland-wide project that periodically monitors and reports on the biogeographical distributions of intertidal species in the context of ongoing climate change.
The original MarClim project ran from 2001 to 2005 and was made up of a consortium of researchers at universities and research laboratories in UK and Ireland (Marine Biological Association (MBA), Plymouth Marine Laboratory, Scottish Association for Marine Science, University of Plymouth and University College Cork), led by Professor Steve Hawkins at the MBA UK Laboratory in Plymouth. The project aimed to re-examine and extend existing datasets on time series and biogeographical distributions of climate-sensitive species around the UK and Ireland, and evaluate any changes observed in the light of ongoing climate change in the region. As well as providing valuable new data on the distribution and abundance of intertidal species, the project was able to demonstrate significant shifts in the distributions of species into areas previously too cold for these warm-water species.
The second Scottish iteration of work under the UK MarClim project took place in 2014 and 2015 and involved 154 short intertidal rocky-shore surveys (Burrows et al., 2017b). These surveys showed that the climate-related changes in distribution that had occurred between the 1960s to 1980s and the early 2000s were still evident a decade later, but that there had not been any obvious further change from the 2000s to the 2010s. Some new large coast-wide changes from the 2000s to the 2010s were seen, however, notably a decline in mussel populations and an increase in the abundance of macroalgae. Similar declines in mussels have been seen in the north-western Atlantic (on Maine coasts) and on Helgoland in the North Sea (Dudgeon and Molis, pers comm), but the likely causes have not been identified. The 2014/2015 surveys also showed a considerable spread of the non-native seaweed known as wireweed, Sargassum muticum, extending further up the west coast from the Clyde Sea to the Inner Hebrides.
The methods refined through the MarClim project have been developed as ‘Good Environmental Status’ indicators for intertidal rock communities under the UK Marine Strategy (Burrows et al., 2014). Indicators of species richness (biodiversity) and community composition combine data from a large number of conspicuous rocky shore species recorded in biogeographic surveys that record categorical abundance measurements (ExSACFOR). These indicators are designed to be sensitive to different pressures related to climate change (temperature) and water quality (turbidity and phytoplankton), as well as other potential pressures. More recently through the UK Healthy and Biologically Diverse Seas Evidence Group, the work was developed into a rocky shore indicator to support assessment and reporting in relation to the UK Marine Strategy. The indicator, known as the Community Temperature Index (CTI), see section 2.5.4, has considerable potential for tracking changes over time and can quantitatively assess the degree of community change relative to any change in sea temperature since 2014/2015 and the earlier surveys in the 2000s.
Through the production of Scotland’s Marine Assessment 2020, it became clear that almost no rocky shore survey work has been done in Scotland since the last work was finished five years ago on the CTI. Both Marine Scotland and NatureScot identified this as a gap and have developed this project as a way of addressing the need for such data for future assessment processes.
1.1 Project outline
The project consisted of two phases. The first phase began in late summer of 2020 following relaxation of Covid 19 travel restrictions and ended in late 2021 having completed a circuit of coastal sites in mainland Scotland, the Inner Hebrides (Mull and Skye) and Outer Hebrides (Barra to Lewis). The second phase took place from June to September 2022 and extended the survey domain to Orkney and Shetland, and the islands of Islay, Coll and Tiree in the Inner Hebrides.
1.2 Project aim
The Marine Biodiversity and Climate Change (MarClim): Scotland 2020-2022 project aimed to detect ongoing change in the biota of intertidal rocky shores around Scotland by conducting biogeographical surveys during 2020, 2021 and 2022. The data collected was intended to:
- Inform reporting under the UK Marine Strategy and Scotland's Marine Assessment for intertidal rocky shore, as well as to inform reporting on the status of MPAs and the intertidal component of the ‘reefs’ feature (to Scottish Parliament, and any future equivalent to Article 17 reporting under the Habitats Regulations following EU Exit).
- Mobilise data collected from previous and forthcoming MarClim surveys to the MEDIN Data Archive Centre Network, and onwards to NBN Atlas, through supply of data in MEDIN Guideline format.
- Produce a commissioned research report that describes and analyses the results from the surveys within the context of previous surveys. From the perspective of understanding rocky shores and climate change, as well as more generally to inform our understanding of the state of rocky shores in Scotland.
1.3 Outcomes
- A revised set of rocky shore survey sites that delivers data to support the Community Temperature Index (CTI), measuring shifts in community composition related to species thermal affinities (Burrows et al., 2020). The sites were revised to ensure good coverage of rocky shores generally around Scotland, and to better reflect MPAs in which intertidal rock is protected as part of the Scottish MPA network. The set of survey sites will be used from now on for reporting on the CTI and by NatureScot to report on the status of relevant features of MPAs.
- An assessment of changes in rocky shore communities in relation to our changing climate.
- An assessment of the status of intertidal rocky shore across Scotland, and within the MPA network. Both assessments are set within the broader time series of rocky shore data that already exist in Scotland.
- Data supporting the CTI and assessments will be in the public domain via the MEDIN Data Archive Centre network and NBN Atlas.
1.4 Programme of work
Field surveys in 2020, 2021 and 2022 were led by Prof Mike Burrows and Dr Gail Twigg from SAMS, with analysis and interpretation of changes done by Prof Burrows at the end of the three-year survey period in late 2022. Field sites were selected from the list of sites previously surveyed in 2014/2015 and earlier MarClim work as well as new sites within Scotland’s MPAs designated for protection of intertidal reefs.
2. Surveys
2.1 MarClim surveys from 2002 to 2019 across Great Britain and Ireland
The original MarClim programme began in 2001 and has continued annually in various forms around the UK every year since. Rocky shores around Scotland were surveyed every year between 2002 and 2010, with the major efforts and widest geographical coverage in 2002 (100 sites), 2003 (92 sites) and 2004 (66 sites). A smaller set of 20-22 sites were surveyed regularly, supplemented by visits to new areas in following years: 2005 (20 core sites), 2006 (20 core plus 19 northwest Scotland sites), 2008 (20 core sites plus 14 in northwest and northeast England), 2009 (31 sites in Arran, Mull, Islay, Colonsay, Coll and Tiree) and 2010 (20 core sites). No further MarClim surveys were made in Scotland until 2014 and 2015 when a full resurvey of previously visited sites in Scotland was completed, with 84 sites surveyed in 2014 and 70 sites in 2015 (Burrows et al., 2017b). Of the 407 surveys between 2002 and 2010, the majority (275) were completed by SAMS personnel (Robin Harvey) with the remainder by visiting teams from the Marine Biological Association in Plymouth (Nova Mieszkowska, Pippa Moore, Rebecca Leaper and Steve Hawkins).
In England and Wales, MarClim surveys continued annually at a core set of 66 sites forming an unbroken series of community assessments that have allowed identification and analysis of trends in community composition related to thermal affinities of component species in relation to changes in annual average temperatures (Burrows et al., 2020) and the frequency of seasonal heatwaves and cold spells (Mieszkowska et al., 2021). Annual surveys allow the discrimination of the time scale of community changes, separating interannual changes from decadal and longer-term trends.
Elements of the MarClim programme have differed among the various participants, notably for the quantification of abundance of indicator species (barnacles, limpets and trochid gastropods). Teams based at the MBA in Plymouth, working in England and Wales with occasional excursions to the north of Scotland, used timed counts for trochids and have measured size distributions of purple topshells (Steromphala umbilicalis) to assess abundance, and used quadrat counts for barnacle abundance. Surveyors from SAMS, largely operating in Scotland, have not made counts of organisms directly on the shore, except in the application of ExSACFOR abundance categories (Table 14). SAMS surveys included digital photographs of 0.25m2 quadrats at fixed shore levels with supplementary photographs of smaller areas (typically 8cm by 5cm) for identification of barnacles (see Section 2.3 for details). Counts of organisms in quadrat photos have been used to validate on-site estimates of abundance categories, with good agreement for classification of higher levels of abundance (Burrows et al., 2008). Randomly placed photo quadrats, however, often miss recording the rarer species that the targeted searches of the ExSACFOR approach do capture.
Abundance for low shore kelp species was recorded on each survey if possible, dependent on sea state, else kelp was noted as ‘Not Recorded’.
2.2 MarClim surveys in 2020, 2021 and 2022
Given the project brief as outlined above, a survey programme was designed that aimed to achieve the above outcomes, shown in Figure 1 and described in full in Annex B, Table 12. Twenty-five sites were surveyed in 2020, 23 in September and two additional surveys included from March of that year. The 2020 surveys were around the coasts of Mull, North Argyll, and the peninsulas of Kintyre and Cowal.
Eighty-nine sites were surveyed in 2021. Over six days in June 2021, surveys progressed anticlockwise around the Ayrshire coast to Galloway and the north of the Solway Firth, across to the Borders and east Lothian (including a single site in England at Berwick on Tweed) and finishing in Fife. Surveys in late July 2021 began in Skye and the Applecross and Loch Torridon area, then crossing over to the Moray coast, Banffshire and Aberdeenshire and southwards to Kincardineshire and Forfarshire. Late August 2021 surveys covered the coasts of northwest and northeast Scotland, starting north of Ullapool in Assynt, moving northwards and eastwards visiting sites along the north coast from Loch Eriboll towards the northeastern tip of the mainland. This was an important area for assessing changes in species nearing their northern geographical limits, where abundance of warm-water types and their distribution ranges might be expected to have increased and expanded (Mieszkowska et al., 2007). The last round of surveys in 2021 traversed the Outer Hebrides from the south of Barra to the north of Lewis via South and North Uist, Benbecula and Harris.
The focus of the 53 surveys in 2022 was on the Inner Hebrides and the Northern Isles. Sites on Coll and Tiree were surveyed on day visits by ferry from Oban in late June and early July 2022, with an additional set of surveys on Islay in mid-July. Changes in ferry timetables and shortage of accommodation precluded surveys on Colonsay to repeat surveys done in July 2014. Orkney locations were surveyed in mid-August, funded by the Orkney Islands Council Harbour Authority as part of the ongoing work of the Marine Environment Unit (OICHA-MEU). The locations in Orkney in August 2021 were chosen from those previously surveyed in August 2015 and to meet the needs of the OICHA-MEU’s own monitoring programme. The 2020-2022 phase of MarClim surveys concluded with 23 surveys in Shetland in early September 2022, mostly repeating survey locations visited in July 2015.
2.2.1 Surveys in Marine Protected Areas
Alignment of MarClim survey locations in 2020-2022 with the Scottish MPA network is shown in Figure 1, with inclusion of sites within and in close proximity to Marine Protected Areas (including SSSIs, SACs and MPAs) listed in Annex A, Table 12 and Table 13. Thirty-three of 167 survey sites were located in or near MPAs: 15 in or near SSSIs, 16 in or near SACs and two in or near MPAs. Twenty sites were visited in 12 protected areas where reefs were a feature either designated as an SAC for ‘reefs’ or an SSSI for ‘rocky reefs’ or ‘tidal rapids’.
Creagan Bridge and Rubha Garbh were surveyed in September 2020 in the Loch Creran SAC, and Cullipool, Ellenabeich, Clachan Sound in the Firth of Lorn SAC.
In 2021 sites in Lochs Duich, Long and Alsh SAC were surveyed at Skye Bridge and Murchison Memorial; Myroch Point in the Luce Bay and Sands SAC; Foindle and Fanagmore in the Loch Laxford SAC; Smeircleit, Eriskay Outer, Acarsaid in the Sound of Barra SAC; Southerness in the Solway Firth SAC.
In 2022 Ness of Melby was surveyed in the Papa Stour SAC, also protected as an SSSI ‘rocky reef’ feature of Sandness Coast SSSI and Bight of Lotheran was surveyed in Sanday SAC also protected as an SSSI ‘rocky reef’ feature of East Sanday Coast SSSI.
SSSIs with designated features surveyed in 2020 were Ulva, Danna and McCormaig Isles SSSI (Taynish), designated for ‘tidal rapids’ and Taynish Woods SSSI (Loch na Cille) designated for ‘rocky reefs’. In 2021 two sites were surveyed in Loch an Duin (Bagh a Chaise Exposed and Loch Amhlasaraidh) designated for ‘tidal rapids’.
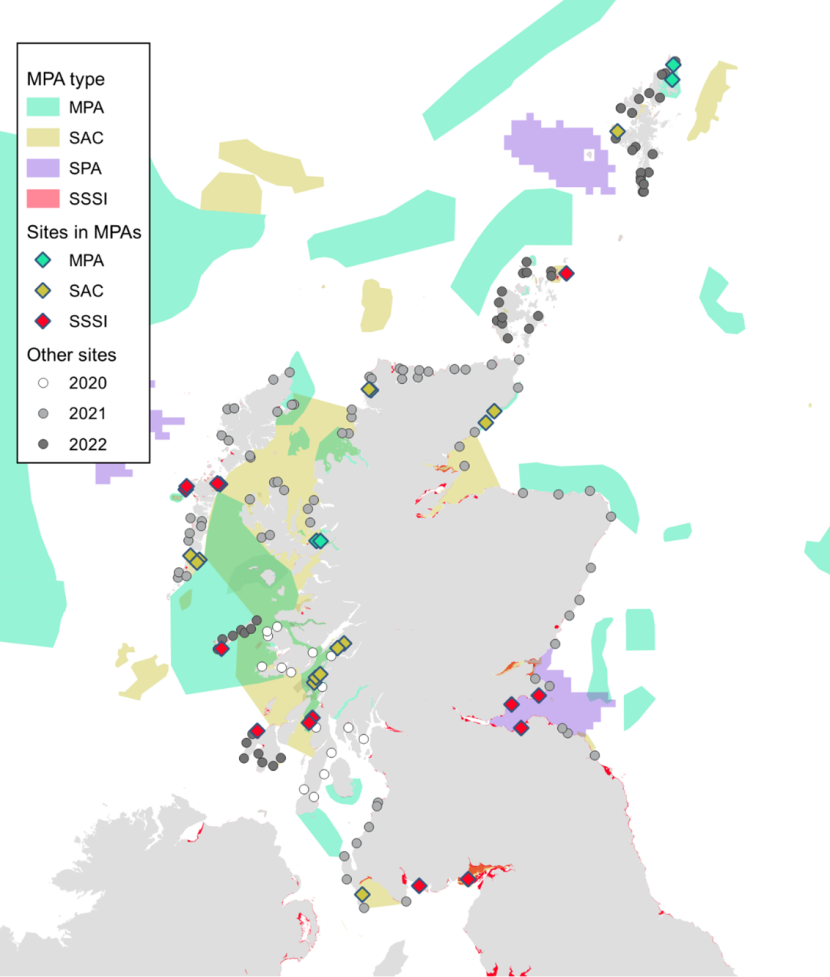
Figure 1. Map of Scotland showing the location of MPAs and the survey sites.
Click for a full description
Map of Scotland showing survey sites for 2020 – 2022. Sites are distributed throughout Scotland’s coast including the Outer Hebrides, Orkney and Shetland. Some sites are within MPAs (including MPAs, SACs, SPAs, and SSSIs). Other sites are found outside MPAs. Sites inside marine protected areas are represented by coloured diamonds. Sites outside MPAs are shown as filled circles with shading indicating the year the site was surveyed. Full details of survey sites are given in Table 7.
2.3 Survey personnel and methods
The survey work used the standard MarClim protocols as used, adapted and extended by the SAMS team and using the same personnel (Mike Burrows (MB), Gail Twigg (GT), with help from John Baxter (JB) in Orkney in August 2022). The methods replicated those from previous MarClim surveys as outlined in Burrows et al. (2008) and in Burrows et al. (2017b), with GPS information and catalogued images of quadrats (0.25m2 and 0.004m2) and whole shore views collected from each survey site. These methods aim to produce standardised estimates (including zeroes) of the abundance of a pre-defined list of species as categories for a larger set of species (>50) and as numerical estimates for a smaller subset of taxa including barnacles, limpets and topshells. The primary goal was to collect data that could detect change relative to the earlier surveys and form the basis for any future reference.
Sites were located by using GPS data previously collected for each site. Location data as latitudes, longitudes and site names were uploaded in advance of surveys to the Android QField mobile phone app, alongside Ordnance Survey Landranger tiles (1:50000, from the Edina Digimap service) and the live OpenStreetMap and Google Maps datalayers where mobile connectivity permitted. This allowed surveys to begin within a few metres of the previous survey site. GPS locations for new sites were recorded either directly as waypoints in the QField app or using other continuous GPS recording apps on mobile phones (usually as Strava activities) subsequently exported as GPX files and used to determine the centre of the surveyed area.
2.4 Abundance estimation
Methods used for abundance estimation follow those used in 2014 and 2015 (Burrows et al., 2017b) and the following text repeats that information. Cross-validation of the ExSACFOR estimation technique by simultaneous surveys of shores by independent surveyors was not done in this round of surveys. The results of the cross-validation exercise in 2014 showed that for two surveyors 66% of estimates were the same, 83% differed by one category or less and 92% within two categories.
Surveyors (GT and MB, and JB and MB in Orkney 2022) made categorical abundance estimates (ExSACFOR – see Annex C) of conspicuous species using a pre-defined checklist of taxa (Table 11 down to Pholis gunnellus) that included climate-sensitive species and recording the abundance of other noteworthy species that may have been unexpectedly abundant, such as invasive or rare species, using ExSACFOR abundance scales (Table 14). The two surveyors split the species list into macroalgae/lichens (GT, JB) and animal species (MB) for the recording period.
One surveyor (usually MB) collected digital images of whole and partial shore views (see e.g. Figure 2, Figure 3, Figure 4), and photographed two different sized areas of substratum at three shore levels. Eight replicate approximately 40cm2 areas (8 x 5cm, 0.04m2) and five 50 x 50cm quadrats (0.25m2) were randomly located at low, mid and high shore levels. Shore levels were defined by reference to the vertical distribution of barnacles (mainly Chthamalus montagui, Chthamalus stellatus and Semibalanus balanoides): high shore being 0.5m below the upper limit of barnacles if the uppermost genus were Chthamalus or 0.2m below the upper limit if Semibalanus; low shore 0.5m above the lower limit of barnacles; and mid shore half way between the high and low levels at approximately mid tide level. Quadrats at two further levels were used for quantitative assessment of attached species under macroalgae: ‘lower’ being 0.5m below mid and ‘upper’ being 0.5m above mid shore. Each of these ‘upper’ and ‘lower’ quadrats were photographed before and after removal of canopy algae (Figure 5).
The two sizes of area sampled were designed to record different taxa. The smaller area (Figure 6) was aimed at producing good images of barnacles, important climate-sensitive species but often difficult to identify in the field. Small coins were used as scale objects: the long axis of the elliptical image of a tilted disc always measures the same as the diameter of scale objects. The larger 0.25m2 quadrat was designed to allow counts of mobile species and estimates of percentage cover of algae and encrusting species with supporting photographic evidence (Figure 5 right, after canopy removal). Images were used for independent confirmation of species records and to aid identification for those species that are not easily recognised in the field, such as barnacles. Quantitative estimates of species abundance from these images have not been made, but the cataloguing and archiving of these images permits future data extraction to contrast with previous sets of images (2002-2010 and 2014-2015) from the same sites to aid detection of change.

Figure 2. Ard Mor, Tiree. Surveyed on the 29th of June 2022.
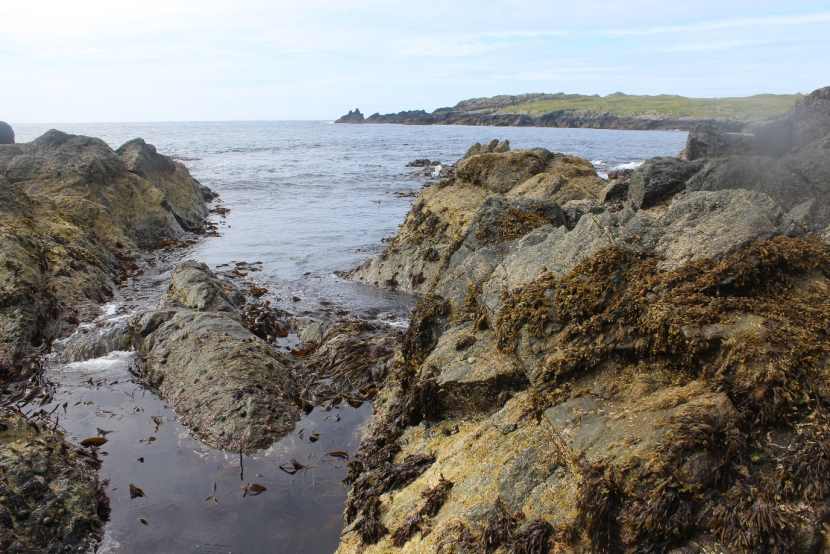
Figure 3. Port Wemyss, Islay. Surveyed on the 16th of July 2022.
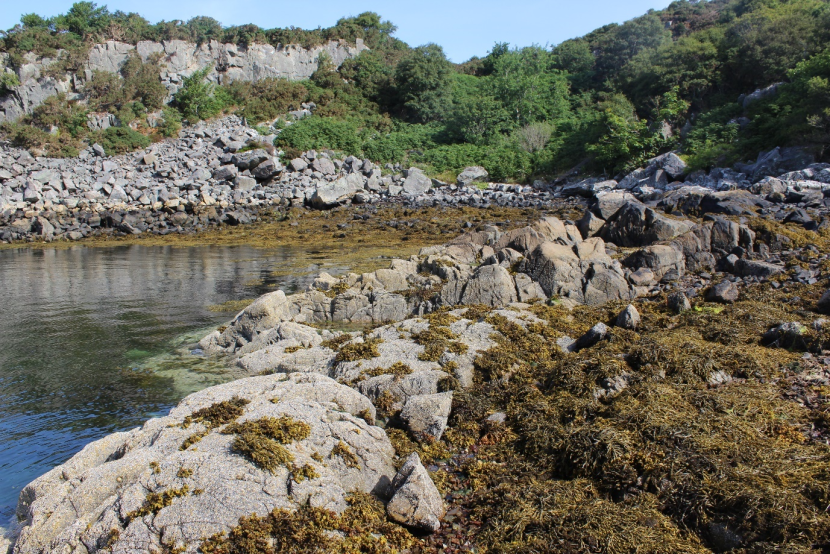
Figure 4. Skye Bridge. Surveyed on the 23rd of July 2021.
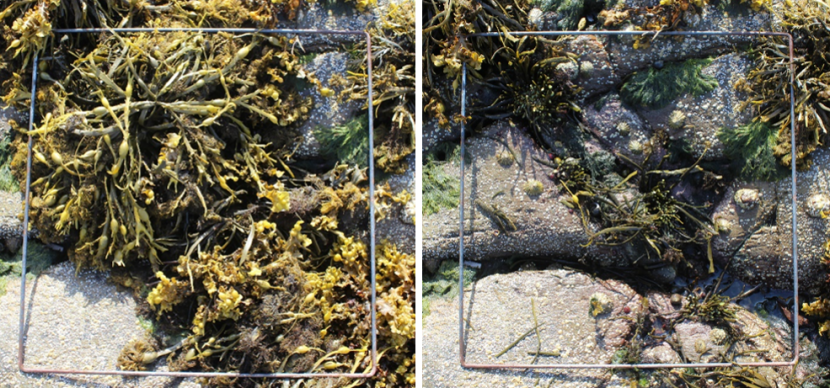
Figure 5. A 0.25m2 photo quadrat (left) before and (right) after canopy removal. Skye Bridge. Surveyed on the 23rd of July 2021.

Figure 6. Small photo quadrat showing high shore barnacles (all Chthamalus montagui) at Gortein Driseach, Loch Scridain, South Mull. Surveyed on the 20th of September 2020. Scale object is an 18mm-diameter 5p coin.
2.5 Statistical analysis of changes
All categorical abundance data were entered into spreadsheets as soon as possible. Analyses were done using the R statistical package (R. Core Team, 2020).
2.5.1 Pairing surveys
The distances between all survey locations in 2014-2015 and those in 2020-2022 were calculated using the geodist function in R (Padgham, 2021). Sites in 2020-2022 were paired with their nearest counterparts in 2014-2015 by subsetting the list of all site-to-site distances to those <200m (181 sites, 160 same locations, 13 0-50m away and 8 >50m away).
2.5.2 Changes in abundance
Because abundance in the MarClim programme is recorded as categories derived from specified class limits (Table 14), changes in species abundance at a particular survey location can be expressed simply as the difference in class ranks between successive surveys (-7 to +7). These data can be reduced further to 3 classes: increasing, decreasing or not changing. Analyses are presented that use frequencies of these classes of change. Such analyses are straightforward to understand but come with limitations that may give rise to misinterpretation. Organisms recorded as Rare (R) or Absent (NS) in the first survey cannot decline further but only stay the same or increase, while those recorded as Super Abundant (S) cannot increase further in abundance, but only stay the same or decline. Thus, the upper and lower bounds of the abundance categories impose limits on the changes that can be detected at either end of the scale. A related issue is the phenomenon of ‘regression to the mean’: the tendency of more-extreme values to be replaced by less-extreme ones in subsequent measurements of the same subjects (here survey sites). Methods to account for this phenomenon (Barnett et al., 2005; Kelly and Price, 2005) were not used for paired comparisons of rank abundance, but were used in analyses of changes in metrics of community structure (2.5.3).
A more rigorous alternative statistical approach to the simple analysis of frequencies of changes in categories is proportional odds logistic regression (POLR and the polr function in R). This method considers the probability that abundance exceeds the thresholds that define the category class boundaries. POLR copes with the issues of fixed extreme limits to abundance scales. Increases in abundance beyond upper limits and declines below lower limits are expressed as changes in the probabilities that these limits are exceeded. The POLR model used here was fitted to only those species recorded as present at >20 sites.
2.5.3 Changes in community structure and biodiversity
Ecological communities at rocky shore survey locations were characterized using principal components analysis (PCA) of abundance scores after conversion to integer equivalents: ExSACFOR scores replaced by the values 7 through to 1 and absence by 0. Taxa that were not recorded during surveys were also assigned 0 to avoid incomplete data across all species and thereby permit the analysis. Species richness was calculated as the number of taxa recorded as present (at least Rare) in each survey. As in publications using the earlier datasets (Burrows et al., 2008), PCA scores for each site represented different aspects of the community such as dominance by particular functional groups (like large brown macroalgae) or species richness.
Correlations were made between the sets of PCA scores and environmental variables for each site including wave fetch, chlorophyll a from satellite ocean colour, August and February sea surface temperatures (SSTs) and the extent of each shore (Figure 7). Wave fetch was extracted from a 200-m resolution model of the coastline (Burrows, 2020, 2012). Chlorophyll a concentration from ocean colour data was obtained from the NASA Giovanni data portal (mean of MODIS Aqua monthly maps for 2002-2010 with interpolated coastal values, see Burrows et al., 2018, for details). Average sea surface temperatures for February and August were those used in Burrows et al., 2014, based on data from 2000-2006. Shore extents were estimated from the intersection of a 100m radius circle around each survey point and the Ordnance Survey OpenData VectorMap product showing the foreshore. For Scotland, foreshore is defined as the tidal water feature that extends to mean low water and mean high water of spring tides (Ordnance Survey, 2016). Shore extent varied considerably among regions (Figure 8), with more extensive shores in areas such as the west coast of South Uist, East Fife and Orkney. Narrow, less extensive shores were more typical of Argyll and Shetland.
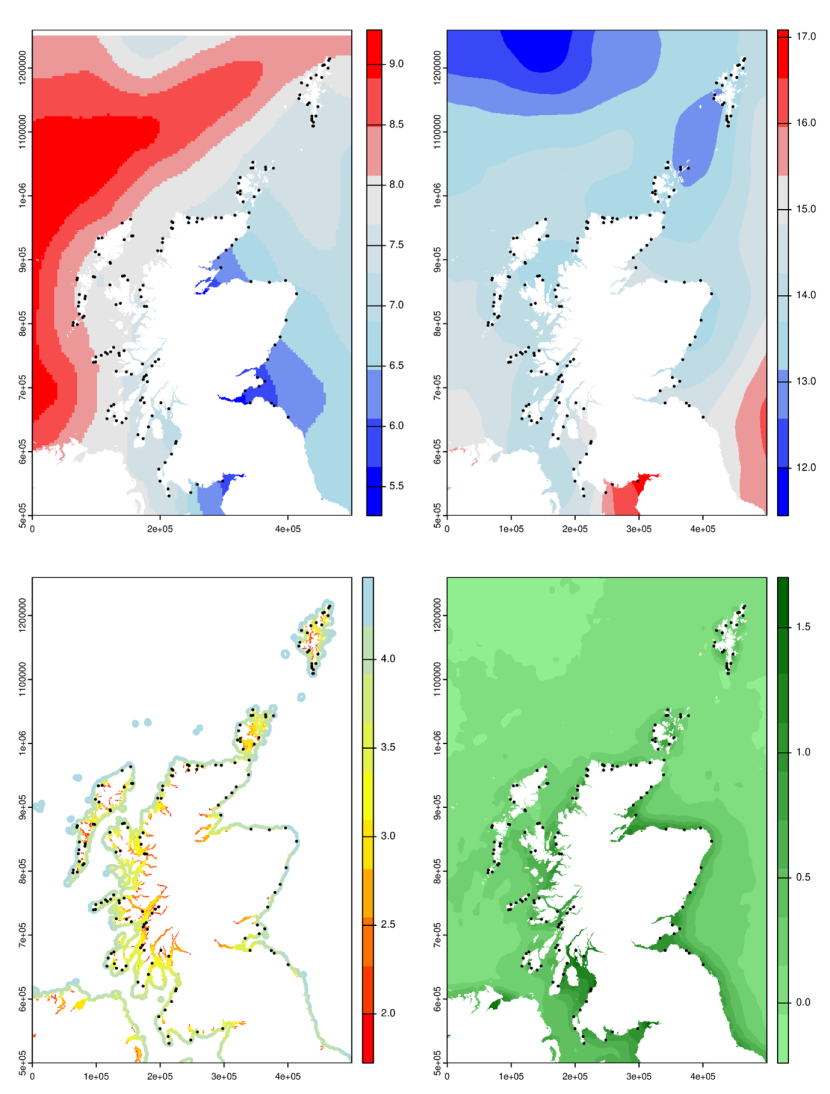
Figure 7. Environmental predictors of rocky intertidal communities in Scotland.
Click for a full description
Four maps of Scotland with dots on each representing MarClim survey locations (2020-2022). Map A shows average February sea surface temperature in degrees Celsius. Temperatures are warmer to the North West of Scotland (~8-9.5 °C), and cooler to the East and South East of Scotland (~5-6.5 °C). Map B shows average August sea surface temperature in degrees Celsius. Temperatures are warmed to the South of Scotland (~15.5-17°C) and cooler to the North of Scotland (~11.5-13°C). Map C shows summed wave fetch in log10 units. Wave fetch increases with distance from shore. Map D shows average satellite-derived chlorophyll a concentration in log10 mg/m3. Chlorophyll concentrations are generally higher close to shore (~1.5 mg/m3 verses 0-0.5 mg/m3).

Figure 8. Shore extent for MarClim survey sites, derived as the area of foreshore within 100m of the central GPS point of each site.
Click for a full description
Map Scotland with dots of survey sites. The size of each dot represents the extent of the shore in m2. Large extents (=> 20000 m2) can be found in the Outer Hebrides, and on the east coast.
Changes in measures of community structure (principal component scores) between 2014-2015 and 2020-2022 at resurveyed locations were analysed relative to positions along environmental gradients. Such analysis addressed issues of context-dependence of changes, such as whether the wave-exposed nature of a community – dominance by large brown macroalgae – changed in either wave sheltered or wave exposed locations. The effects of regression to the mean (Kelly and Price, 2005) were accounted by replacing the observed change (D) to give a change with one adjusted for the effect (D*), thus:

Equation 1
Click for a full description
Where X1 is the measurement in the first period (2014-2015) and X2 the measurement in the second period (2020-2022) and p with an accent is the correlation between measures across the two periods.
2.5.4 Changes in Community Temperature Index (CTI)
Community Temperature Index values for the communities in each survey were calculated using methods outlined in (Burrows et al., 2020). The Community Temperature Index (CTI) is a single value for a community of n species, calculated as the average of all the species’ Species Temperature Index values (STI or Ti), weighted by their abundance (wi) and expressed in degrees Centigrade. Thus:

Equation 2
Click for a full description
Community Temperature Index (CTI) is equal to the average of all the species’ Species Temperature Index values (STI or Ti), weighted by their abundance (wi) and expressed in degrees Centigrade.
Species Temperature Index is defined as the midpoint temperature value of the global geographical range for each of the species. For MarClim data, abundance was expressed as the rank of the abundance category on the ExSACFOR scale, with absence as 0, Rare as 1, Occasional as 2, Frequent as 3, Common as 4, Abundant as 5 and Super Abundant as 6. CTI values were calculated for every individual survey except for those with fewer than 10 species. Declines in abundance of cold-water species (lower Ti values, deborealization) and increases in abundance of warm-water ones (higher Ti, tropicalization) result in an increase in Community Temperature Index, an expected response to climatic warming.
CTI values were calculated for each survey using the abundance of all species with known Ti values.
3. Results
3.1 Physical changes
The MarClim programme has so far spanned a period of relatively stable sea temperatures in the northwest Atlantic around Scotland (Figure 9). There was a small negative trend in sea surface temperature (Figure 9) over the two decades, particularly between 2002 when the surveys began and the early 2010s with the cold winters of 2009/10 and 2011/12. Temperatures rose slightly after this point to levels seen though the mid-2000s and only exceeded those at the start of the survey period after 2020. The temperature trend between 2014-2015 and 2020-2022 was slightly positive in Scotland (Figure 9). Average daily sea surface temperature (SST) anomalies for the year up to September 2014 were 0.34°C (±0.54°C standard deviation) above the 1983-2012 baseline average, with the year up to September 2015 being cooler at 0.05°C (±0.56°C) above the baseline. Average daily temperature anomalies during the 12 months preceding the 2020, 2021 and 2022 September surveys were 0.27°C, 0.34°C and 0.55°C (±0.32°C, ±0.39°C, ±0.31°C respectively). Using this approach, SST anomalies were on average 0.20°C warmer in 2020-2022 than in 2014-2015.
Temperature was highly variable on shorter timescales, with increasing frequency of heatwaves (Mieszkowska et al., 2021) from the 1980s to the 2010s. Temperatures since September 2022 have continued to be above the 90th percentile of temperatures for a 1983-2012 baseline.
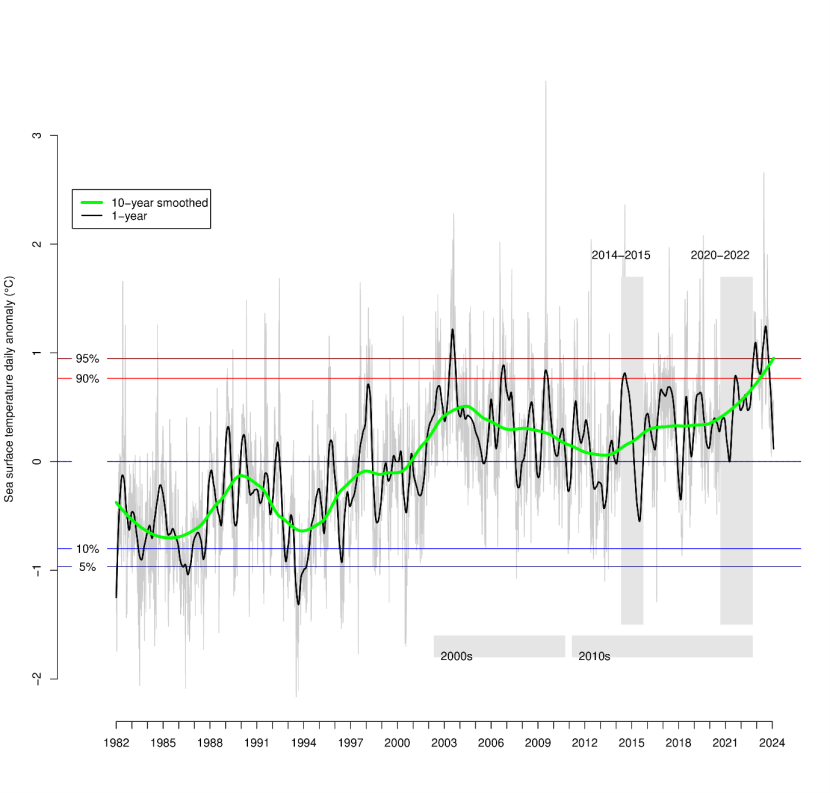
Figure 9. Daily sea surface temperature anomalies for seas around Scotland (55°N-61N, 6W-0W) from NOAA OISSTHR V2 from 1982 to 2022, showing decadal and annual trends in temperature.
Click for a full description
A line graph showing daily sea surface temperature anomalies for seas around Scotland (55°N-61N, 6W-0W) from NOAA OISSTHR V2 from 1982 to 2022, showing decadal and annual trends in temperature. The graph shows an increasing trend in both decadal and annual temperature since the 1990’s. Anomalies are expressed relative average temperatures for each day of the year for a 1983-2012 baseline. Comparison periods for MarClim data are shown as shaded polygons.
3.2 Abundance of rocky shore species
3.2.1 Changes in abundance of individual species from 2014-15 to 2020-22
After matching survey site locations between the two most recent survey periods, species-level changes in categorical abundance from 2014-15 to 2020-22 were analysed for (a) net changes in abundance across the set of paired surveys, and (b) for any spatial patterns evident in changes in abundance.
Raw frequencies of change in abundance categories (Annex C. Table 15) were compiled by species and expressed as the average number of category change, the standard deviation of the average change and its standard error, a measure of the confidence in the average. The t-statistic was used to evaluate the statistical significance of the average as a difference from an expectation of zero change. Since many tests of significance were applied simultaneously, the simple Bonferroni correction was applied by multiplying the probability of the t-statistic by the number of tests (n=72) to give a more conservative estimate of the significance of the overall changes.
The bounded nature of the abundance scale has consequences for the recording and interpretation of changes. Species that were at the lower end of the abundance scale in 2014-2015 (Rare and Occasional) were much more likely to show an increase in abundance category (Table 1, 93% and 80%) than those at the higher end of the abundance scale (Table 1, from A to S and from S to Ex, 33% and 16% respectively). While this is a limitation of the recording scheme, it may also reflect the phenomenon of ‘reversion to the mean’. Species that were unusually abundant in the first period may be expected to be nearer their long-term average value when resurveyed. There was also a slight tendency for species at the more abundant end of the scale to be more likely to remain unchanged than those at the other end of the scale (P(Same)). Less-abundant species were much more likely to be recorded as absent (N, P(Lost)) during the second survey than more-abundant species. Recording rare species as lost on subsequent surveys is a likely consequence of the species being close to the detection limit during the typical 45-minute survey. 19% of records in 2020-2022 were for species not seen during the 2014-2015 survey period (Table 1, P(New)).
Table 1. Frequencies of abundance category transitions between 2014-2015 and 2020-2022 across all sites and species. The occurrence of types of transitions are shown as percentages (P). For each column representing abundance categories in 2014 -2015, P(Lost) is the percentage of transitions that resulted in the disappearance of a species from a site (from Extremely Abundant (Ex) through Rare (R) to Absent (N)). P(Same) is the percentage of records that remained the same in both periods (values are highlighted by bold text). P(New) is the percentage of records of absence in 2014-2015 that were followed by presence in 2020-2022. Changes that involved an increase in abundance were shown by P(Increase), and those that declined by P(Decline). – denotes an empty cell.
- | 2014-2015 | - | - | - | - | - | - | - |
|---|---|---|---|---|---|---|---|---|
- | Absent | Rare | Occasional | Frequent | Common | Abundant | Super- abundant | Extremely Abundant |
| 2020-2022 | - | - | - | - | - | - | - | - |
| Absent | 4166 | 128 | 244 | 245 | 315 | 185 | 91 | 33 |
| Rare | 78 | 9 | 7 | 7 | 13 | 1 | 1 | 0 |
| Occasional | 150 | 21 | 87 | 57 | 79 | 48 | 10 | 7 |
| Frequent | 215 | 23 | 77 | 125 | 122 | 83 | 33 | 9 |
| Common | 277 | 19 | 120 | 152 | 288 | 283 | 120 | 32 |
| Abundant | 189 | 10 | 71 | 109 | 328 | 433 | 294 | 119 |
| Super Abundant | 76 | 3 | 14 | 33 | 147 | 271 | 309 | 157 |
| Extremely Abundant | 16 | 1 | 3 | 2 | 12 | 40 | 72 | 160 |
| Total | 5167 | 214 | 623 | 730 | 1304 | 1344 | 930 | 517 |
| P(Lost) | - | 59.8% | 39.2% | 33.6% | 24.2% | 13.8% | 9.8% | 6.4% |
| P(Same) | 80.6% | 4.2% | 14.0% | 17.1% | 22.1% | 32.2% | 33.2% | 30.9% |
| P(New) | 19.4% | - | - | - | - | - | - | - |
| P(Decline) | 0.0% | 0.0% | 1.1% | 8.8% | 16.4% | 30.9% | 49.2% | 62.7% |
| P(Increase) | 0.0% | 36.0% | 45.7% | 40.5% | 37.3% | 23.1% | 7.7% | 0.0% |
Species’ changes in abundance were quite variable (Figure 10). No species were lost altogether. The median proportion of sites remaining the same was 49%, with a median of 24% of sites where abundance increased and 25% where abundance decreased.
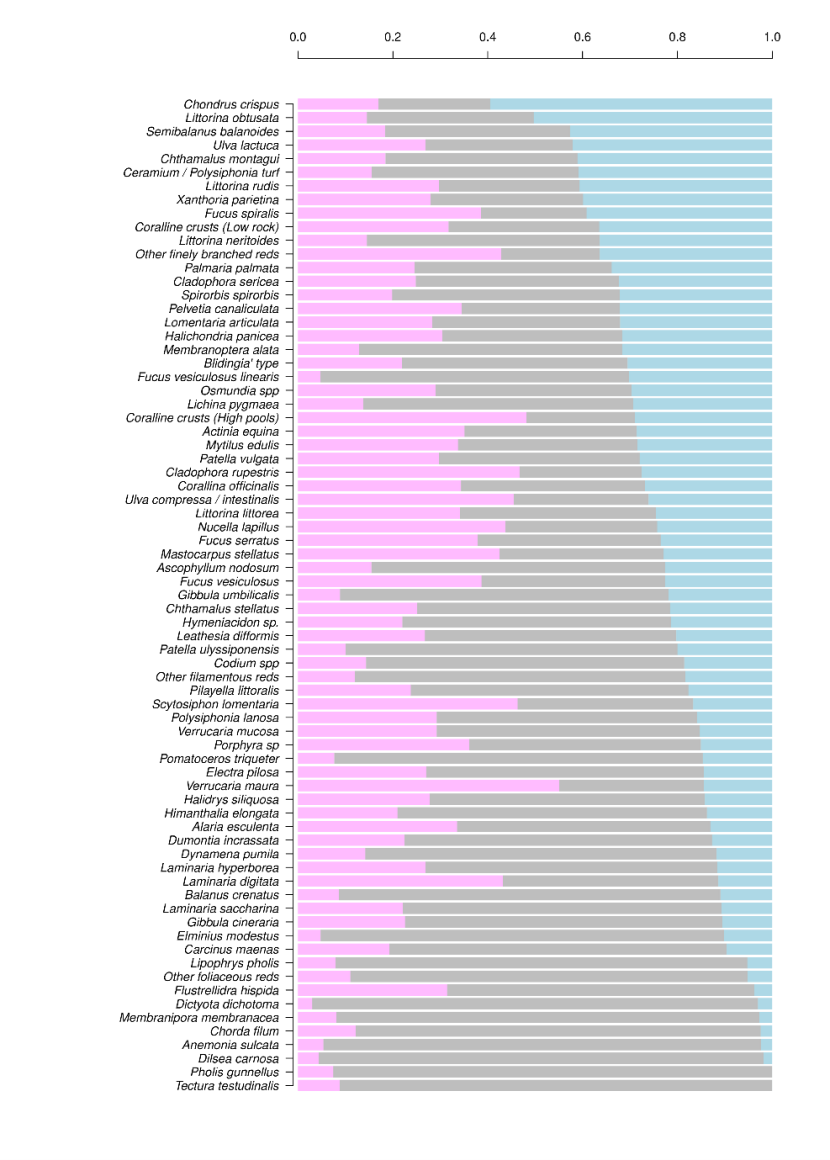
Figure 10. Species abundance changes as the proportion of survey locations where abundance decreased (pink), increased (blue), or did not change (grey) between 2014-2015 and 2020-22. Only species present at more than 30 sites are shown.
Click for a full description
For each the species, the stacked bar chart shows the proportion of sites where abundance has decreased, increased, or did not change. Only species that are present at more than 30 sites are shown in the figure. For some species (such as Tectura testudinalis and Pholis gunnellus) no change was found between years for the majority of the sites, although a decrease in abundance was noted for a few sites. For other species (such as Chondus crispis and Littorina obtusata) an increase was noted for over half of the sites. The change in abundance between years was varied for the majority of species in the study.
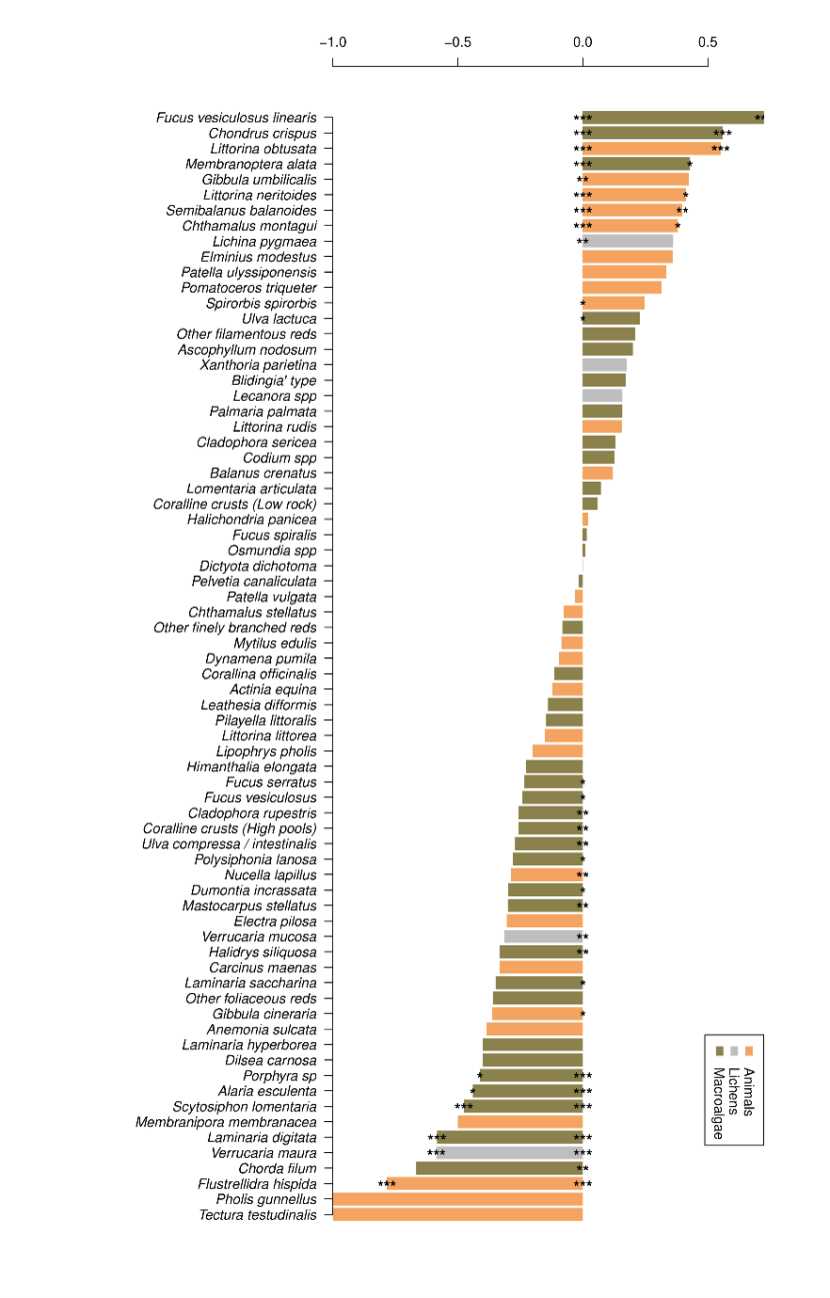
Figure 11. Changes in species abundance from 2014-15 to 2020-2022.
Click for a full description
Changes in species abundance is expressed as the difference in frequencies of locations with positive and negative abundance change as a proportion of the frequency of sites where abundance changed (f(+)-f(-))/(f(+)+f(-)). Asterisks show the statistical significance of observed changes compared with an expectation of equal frequencies of increases and decreases, using p-values with Bonferroni correction for the number of tests (n=72) at the end of bars, and without Bonferroni correction at the base of bars. ***, p<0.001; **, 0.001<p<0.01; *, 0.01<p<0.05.
A variety of animal, lichen and macroalgae species are present in the graph. Observed changes in abundance were statistically significant for some of the species. Species that had a statistically significant increase in abundance were the macroalgae species Fucus vesiculosus linearis, Chondus crispis, Membranoptera alata and Ulva lactuca, the animal species Littorina obtusata, Gibbula umbilicalis, Littorina neritoides, Semibalanus balanoides, Chthamalus montagui, and Spirorbis spirorbis and one lichen species, Lichina pygamaea. Many macroalgae species that had a statistically significant decrease in abundance: Fucus serratus, Fucus vesiculosus, Cladophora rupestris, Coraline crusts (High pools), Ulva compressa/intestinalis, Polysophonia lanosa, Dumontia incrassate, Mastocarpus stellatus, Halidrys siliquosa, Laminaria saccharina, Porpha sp, Alaria esculenta, Scytosiphon lomentaria, Laminaria digitata and Chorda filum. Some animal species also had a significant decrease in abundance including Dumontia incrassata, Gibbula cineraria, and Pholis gunnellus. The lichen species Verrucaria mucosa and V. maura also had a significant decrease in abundance. For the remaining 42 species, no significant difference in abundance was observed.
Differences in overall changes are most easily seen by expression of the relative proportions of frequencies of increases and decreases, omitting sites with no changes (Figure 11 using data from Table 15). The species that increased at most sites overall were Fucus vesiculosus var. linearis, Chondrus crispus and Membranoptera alata, along with Littorina obtusata and Semibalanus balanoides. Greatest declines overall were mostly seen in macroalgae, with proportionally fewer animals in the lower part of the plot (Figure 11).
A solution to the issues of using numbers of changed categories to analyse change outlined above is the use of ordinal logistic regression (Bürkner and Vuorre, 2019). Ordinal logistic regression determines the probabilities that abundance exceeds the thresholds associated with abundance class boundaries. The analysis therefore predicts, for each species and survey, a set of cumulative probabilities for each abundance category (P(abundance ≥ R) – equivalent to presence, P(abundance ≥ O), up to P(abundance ≥ S)). Abundance category data was thereby analysed with the polr function in R (MASS library, (Venables and Ripley, 2002), henceforth POLR models) using the predictor variables of species identity, the census period (2014-2015 versus 2020-2022) and the interaction of these two to give the species-specific changes. This allowed the whole dataset to be included in a single analysis, removing the need to adjust significance levels for using multiple tests.
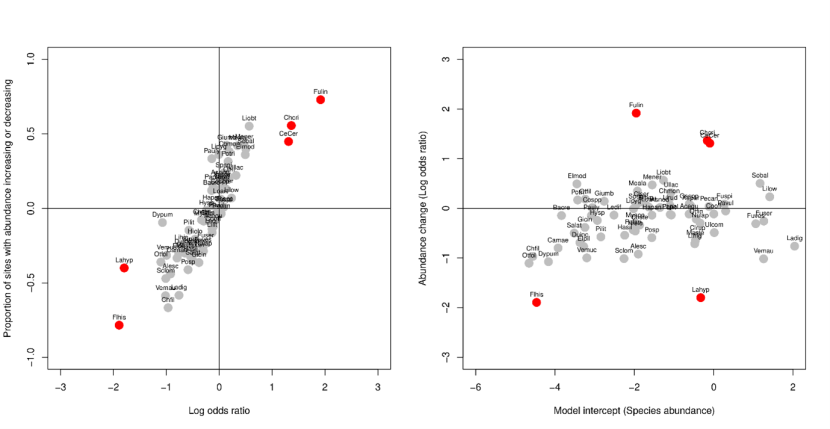
Figure 12. (a) Proportions of increases and decreases across species from Figure 11 (y-axis) plotted against estimates of the magnitude of changes from ordinal logistic regression: the log-odds coefficient for species-by-period interaction term (x-axis).
Click for a full description
Red circles show where parameter estimates from POLR were statistically significantly different from zero (P<0.05). Red circles are for the species Flustrellidra hispida (Flhis), Laminaria hyperborea (Lahyp), Ceramium / Polysiphonia turf (CeCer), Chondrus crispus (Chori), Fucus vesiculosus linearis (Fulin). Other taxon abbreviations are given in Table 11.
The outcome of POLR analysis of changes in abundance (as expressed by the log odds ratio, Figure 12a) was very similar to that obtained from evaluating the proportion of sites where species increased relative to the number sites where species’ abundance changed (Figure 11). Unlike the average change in category rank (Table 15), the log odds ratio is not influenced by the overall abundance of the species (Figure 12b) and can therefore be compared between rare and ubiquitous species. Patterns in all three measures of abundance change (average change in category rank (Table 15), log odds ratio, and proportion of sites where abundance increased) were, however, very similar. Only Chondrus crispus, Ceramium turf and Fucus vesiculosus v. linearis showed overall significant increases in abundance between 2014-2015 and 2020-2022, and only Laminaria hyperborea and Flustrellidra hispida showed significant decreases in abundance (Figure 12).
3.2.2 Site-specific changes from 2014-2015 to 2020-2022 in selected species
Changes in species chosen for monitoring as part of the MarClim programme were anticipated to follow those expected from known responses to climate change. Warm-water species were expected to increase in abundance overall and to expand their geographical ranges if the climate had warmed in the period between surveys. While that warming was not evident between 2014-2015 and 2020-2022 (Figure 9), the warm-water barnacle Chthamalus montagui increased throughout its core range (from Solway to Caithness and Orkney, with occasional individuals on the east coast: Figure 13a) but was no longer evident at sites further south in the North Sea. Chthamalus montagui were found in Shetland in 2022 where none were detected in 2014-2015. The sister barnacle species Chthamalus stellatus, typical of more “blue-water” locations on headlands and islands than Chthamalus montagui (Crisp et al., 1981), both increased and declined between the two periods in different parts of its core range (Figure 13b) but did not show any contraction or expansion of its distribution. A key climatic indicator species, the purple topshell Steromphala (ex Gibbula) umbilicalis generally increased in the core part of its range (west coast to Caithness and the west of Orkney: Figure 13c), but again did not show a range expansion or contraction. Surveys in Orkney in years at sites outside the MarClim set showed well-established populations of Steromphala (ex Gibbula) umbilicalis in the west and north of Mainland at Marwick and the Brough of Birsay, with older individuals suggesting that the species had been there for some time.
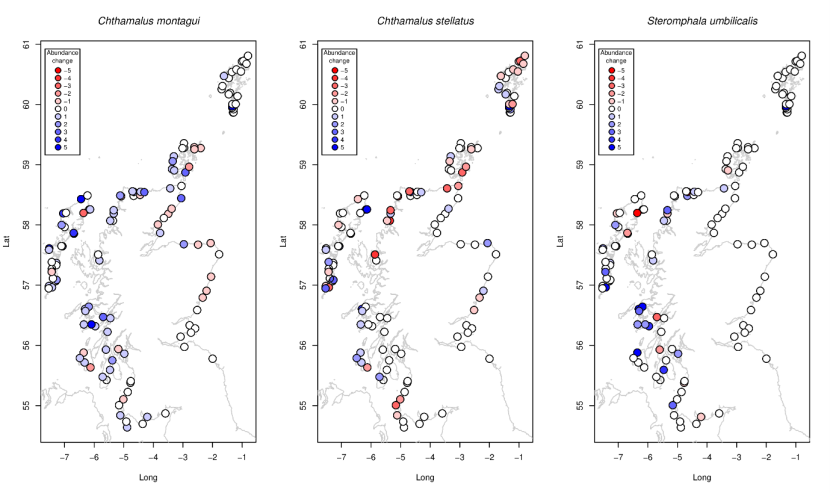
Figure 13. Site-specific changes in abundance between 2014-2015 and 2020-2022 for the warm-water barnacles (a) Chthamalus montagui, and (b) Chthamalus stellatus, and (c) the warm-water topshell Steromphala umbilicalis.
Click for a full description
a) Chthamalus montagui abundances generally increase along the west and north coast and decrease along the east coast. In Orkney, the species increase in abundance to the south coast and decrease to the north. Populations are relatively stable in Shetland; b) Chthamalus stellatus abundances are relatively stable around the mainland, with localised increases in abundance in the Inner and Outer Hebrides. Some decreases in abundance are found in sites in Shetland, Orkney and the north of Scotland; c) Steromphala umbilicalis abundances are relatively stable around Scotland, with some increases to the west coast.
The littorinid gastropod snail Melarhaphe neritoides, present at wave-exposed sites throughout Scotland, increased almost everywhere except in the far south and less consistently in the north (Figure 14a). This organism is very small (4-5mm) and may not be effectively recorded depending on the weather conditions during the survey. Images of small quadrats from the two periods would allow confirmation of this increase.
Austrominius modestus, the non-native Australasian barnacle typical of wave-sheltered locations and those rich in particulates and present across Scotland, including Shetland (Hiscock et al., 1978) showed modest increases in the Firths of Forth, Clyde and Solway (Figure 14c), but again showed no indication of expansion or contraction of its range. Changes in dulse Palmaria palmata were more spatially variable (Figure 14c), showing large increases at some sites and large declines elsewhere.
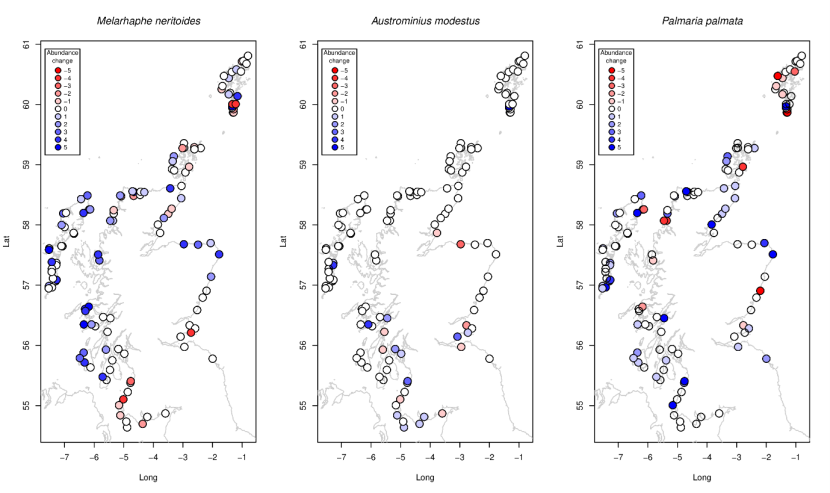
Figure 14. Site-specific changes in abundance between 2014-2015 and 2020-2022 for (a) the warm-water snail Melarhaphe neritoides, (b) the non-native barnacle m, and (c) dulse Palmaria palmata.
Click for a full description
a) Melarhaphe neritoides abundances are generally stable or increasing throughout Scotland, with some declines in sites to the south west of Scotland and the south of Shetland; b) Austrominius modestus abundances are generally stable throughout Scotland, although there are some sites to the south east and south west of Scotland where increases or decreases in abundance are found; c) Palmaria palmata abundances are generally increasing or stable around Scotland, with some decreases, especially around Shetland.
Blue mussels Mytilus edulis showed a very distinctive pattern of large-scale changes (Figure 15a). Intertidal mussels declined along the coasts of Ayrshire and Solway Firth, and uniformly across all east coast sites south of the Moray Firth. Further north and west, changes in abundance of mussels were often positive, especially at open coastal wave exposed sites.
Mastocarpus stellatus and Chondrus crispus, twovery similar looking species inhabiting the same vertical level on similar rocky shores, showed different patterns of change. While Chondrus crispus increased almost everywhere (Figure 16a), Mastocarpus declined in the south and west (Figure 15b) but increased in the east and northwest.
The cold-water barnacle Semibalanus balanoides increased almost everywhere (Figure 16c). Similarly, the smooth periwinkle Littorina obtusata also increased in most locations (see also Figure 11), notably increasing on outer coasts and with only localised declines.
Bladder wrack, Fucus vesiculosus, was the most frequently occurring habitat-forming macroalga across all the shores in Scotland (Figure 17). Overall (Figure 17c), the species remained similar in abundance with some local increases along the northwest coast, along the Solway and on the southeast shores of Fife and the southern flank of the Firth of Forth. The normal growth form of the species, characterised by paired bladders along the length of the plant, decreased almost everywhere, however (Figure 17a) while the bladder-less linearis form increased at locations all around Scotland.
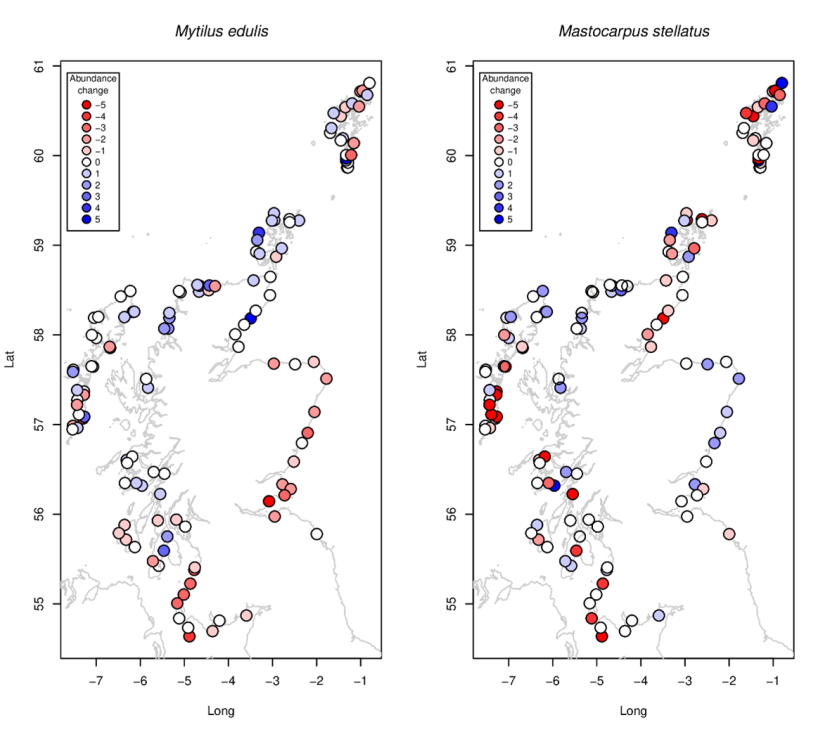
Figure 15. Site-specific changes in abundance between 2014-2015 and 2020-2022 for (a) the blue mussel Mytilus edulis and (b) the red alga Mastocarpus stellatus.
Click for a full description
a) Mytilus edulis abundances generally decrease in the south of Scotland and increase in the north and around Orkney. In Shetland changes in abundance are site specific with some sites increasing and other decreasing; b) Austrominius modestus abundances vary around the coast, with some sites increasing, some decreasing, and other sites stable. Generally, abundances increase around the southeast coast and to the north of the Outer Hebrides and decrease to the south west of Scotland and the south of the Outer Hebrides.
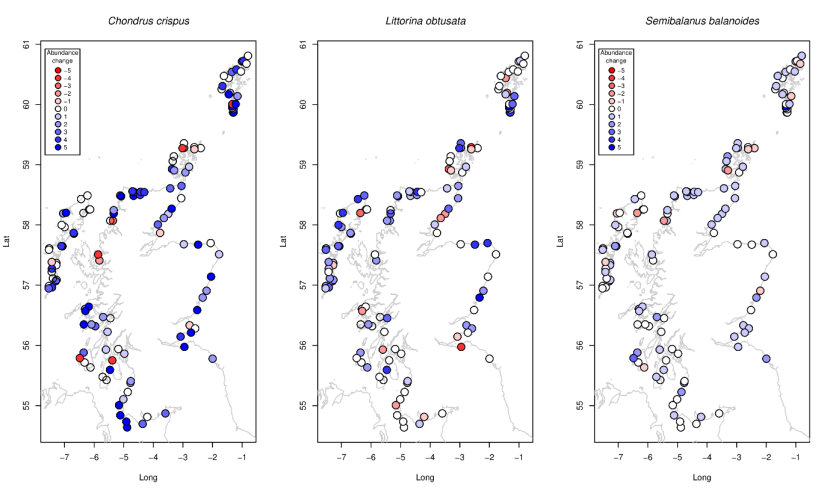
Figure 16. Site-specific changes in abundance between 2014-2015 and 2020-2022 for (a) the red alga Chondrus crispus, (b) the littorinid gastropod Littorina obtusata, and (c) the cold-water barnacle Semibalanus balanoides.
Click for a full description
Abundances are generally stable and increasing for all species with no specific spatial trends. Increases in abundance as the largest in Chondrus crispus and smallest in Semibalanus balanoides.
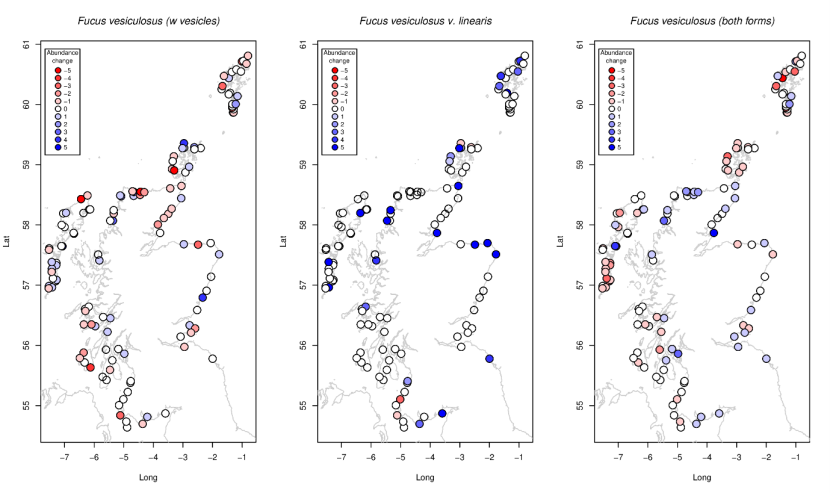
Figure 17. Site-specific changes in abundance between 2014-2015 and 2020-2022 for (a) normal-growth-form Fucus vesiculosus (b) Fucus vesiculosus var linearis, and (c) both forms combined using the maximum abundance of either form.
Click for a full description
a) normal-growth-form Fucus vesiculosus abundances are generally stable or decreasing with increases in some sites to the north b) Fucus vesiculosus var linearis abundances are generally stable or increasing, with increases more prominent in the north c) for both forms, abundance are generally stable with some decreases to the south of the Outer Hebrides, Orkney and the north of Shetland. Some increases in abundance occur in the north of Scotland and the south of Shetland.
3.2.3 Species’ abundance changes relative to their thermal ranges
Responses of species’ populations to climate change are often predictable from their geographical location relative to their warm and cold distribution limits. Changes in abundance of MarClim species in Scotland between 2014-2015 and 2020-2022 were related to the thermal midpoint of each species’ geographical range: the Species Temperature Index (STI) (Burrows et al., 2020). During warming, species in the cold half of their distribution range (i.e. STI > local average temperature) tend to increase in abundance (tropicalization) while those in the warm half of their distribution tend to decline (deborealization, (McLean et al., 2021)).
Despite the slight warming of the seas around Scotland between 2014-2015 and 2020-2022 (Figure 9), there was no evidence of relationships between the thermal affinity of each species or the location in their geographical range and whether they increased or decreased between the two periods (Figure 18). Increases in warm-water species and declines in cold-water ones, expected as a result of warming, have been seen in these communities over longer periods, such as in Shetland since the beginning of the 1980s (Burrows et al., 2020), as well as in many other groups of species such as fishes on the European shelf (Simpson et al., 2011), and across marine taxa generally (Hastings et al., 2020). Some species towards the cold edge of their distribution range, such as the topshell Steromphala(ex Gibbula) umbilicalis (Giumb, Figure 18) and the barnacle (Chthamalus montagui, Chmon) did increase between the two periods, but so did some species from the warm edge of their distributions, such as the barnacle Semibalanus balanoides (Sebal) and the smooth periwinkle Littorina obtusata (Liobt).
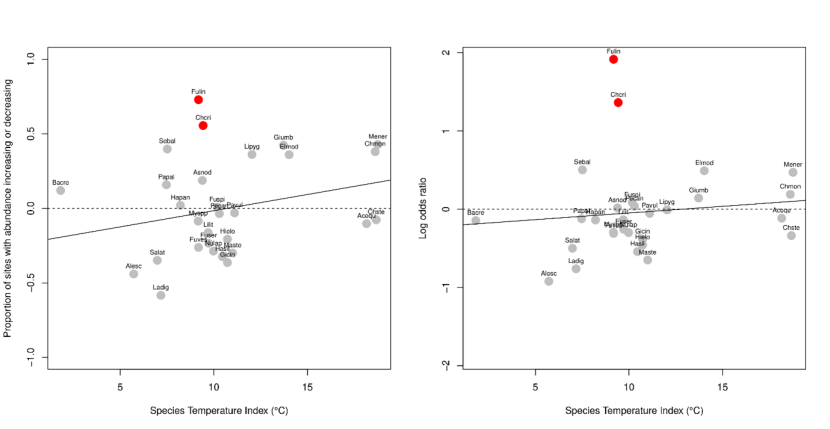
Figure 18a,b. Changes in species’ abundance between 2014-2015 and 2020-2022 related to their thermal affinity.
Click for a full description
(a, b) as expressed by the Species Temperature Index: the median of sea surface temperatures (average annual) across the species’ global distribution, (Burrows et al., 2020). (a) Species changes measured by the difference in relative proportions of increases and decreases as in Figure 11; (b) species changes as the coefficient associated with the species by period interaction in POLR models.
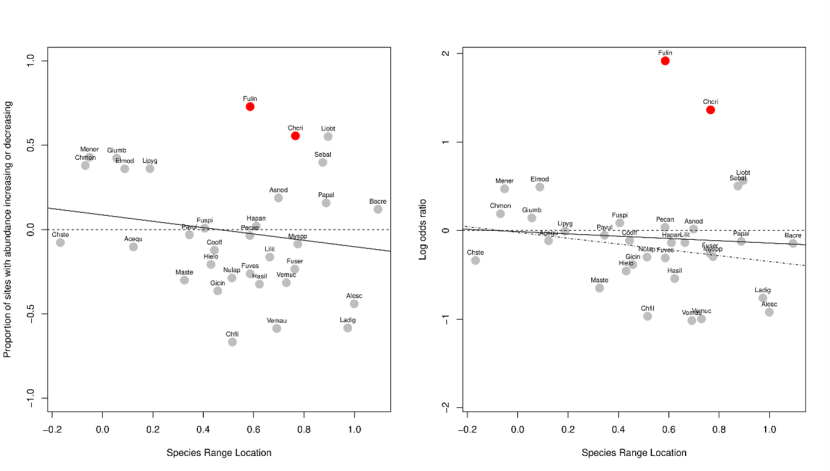
Figure 18c,d. Changes in species’ abundance between 2014-2015 and 2020-2022 related to their thermal affinity.
Click for a full description
(c,d) Effects of location within species geographical range ((Tloc-T10)/(T90-T10)) on changes in abundance; values around zero indicating species at the colder end of their global distributions (warm-water species) and around 1 at the warmer end of their distributions (cold-water species). Solid lines show linear regressions: there was no significant interaction between species range locations and any of the predictor variables (P>0.05), even after excluding Fulin and Chcri (dashed line in (d)).
3.2.4 Species’ abundance changes around Scotland: spatial patterns
Regionalised changes in species abundance were investigated using comparison of spatial POLR models that included (1) latitude and longitude terms but no effect of survey period, (2) latitude and longitude terms and an effect of survey period (2014-2015 versus 2020-2022) to give the effect of non-spatial change, and (3) latitude and longitude and including terms for survey period interacting with latitude and longitude to test for broad location-dependent changes. Models were only fitted to species with sufficient data (N>15 paired sites with changed abundance) to fit credible models.
Predicted abundance from type (3) models using gridded locations around the survey area (0.5-degree latitude/longitude box centres) were used to express spatial patterns of change in each species (Figure 19, Figure 20, Figure 21). The goodness-of-fit of the three models of increasing complexity were expressed using Akaike’s Information Criterion (AIC). Differences in AIC values allowed comparison of the relative influence of overall changes in abundance across the whole survey area and those changes that tended to vary across different parts of Scotland (Annex E, Table 16). The probability of each kind of model being the best of the three (Akaike weights, (Burnham and Anderson, 2002)) was used as a guide to selecting whether the species showed no change (model 1; “s” spatial pattern only), overall change (model 2, “t + s” temporal plus spatial) or change that varied across the survey domain (model 3, “t x s” temporal interacting with spatial pattern). A change in abundance that was evident across all regions (less region-specific) was indicated by higher Akaike weights for model 2, whereas location-specific patterns of change were shown by higher Akaike weights for model 3 rather than model 2 (Table 16).
Of the 4 animal taxa that showed strong evidence of change (Table 16, support for a spatial-only model, AW1<0.1), three taxa were localised (AW3 > 0.8): the bryozoan Flustrellidra hispida declined widely across the north and west; the barnacle Semibalanus balanoides declined most strongly in the south and southeast; while Littorina rudis increased in the west but declined in the east (Figure 19). Littorina obtusata increased across the whole of the country (AW2=0.79) (Figure 19).
A much greater proportion of macroalgae (Kingdoms Chromista and Plantae, Table 16) than animals (Kingdom Animalia) showed evidence of change (Akaike weight for the spatial only mode 1 “s”, AW1 < 0.1) between the two survey periods. Twenty out of 26 taxa showing evidence of change were macroalgae (77%) with only 4 (15%) animals. Macroalgae were thus 40% more likely than animals to have changed between the two survey periods according to this analysis.
Amongst the macroalgae showing evidence of localised change (AW3 > 0.8, Table 16), Scytosiphon lomentaria declined everywhere except the far northwest (Figure 21). Cladophora sericea declined in the northwest and southeast, while Cladophora rupestris only declined in the north (Figure 20). Leathesia difformis decreased in the west and north but increased in the south and east (Figure 21). Pilayella littoralis decreased in the northeast, while Chondrus crispus increased everywhere except in the far southeast and southwest. Palmaria palmata declined everywhere but especially so in the far north, extreme west and southeast (Figure 21). Foliaceous and finely branched red algae declined along the outer coasts of the west and north (Figure 21). Mastocarpus stellatus declined most in the far west and southeast (Figure 21).
The most evident change in macroalgae was the nationwide increase in the bladderless form of Fucus vesiculosus v. linearis (Figure 20), with limited support for a tendency for increases in abundance to be larger to the north and east. This finding supports that of the simpler analysis based on frequencies of shifts in abundance categories for this taxon (Figure 11, Table 15).
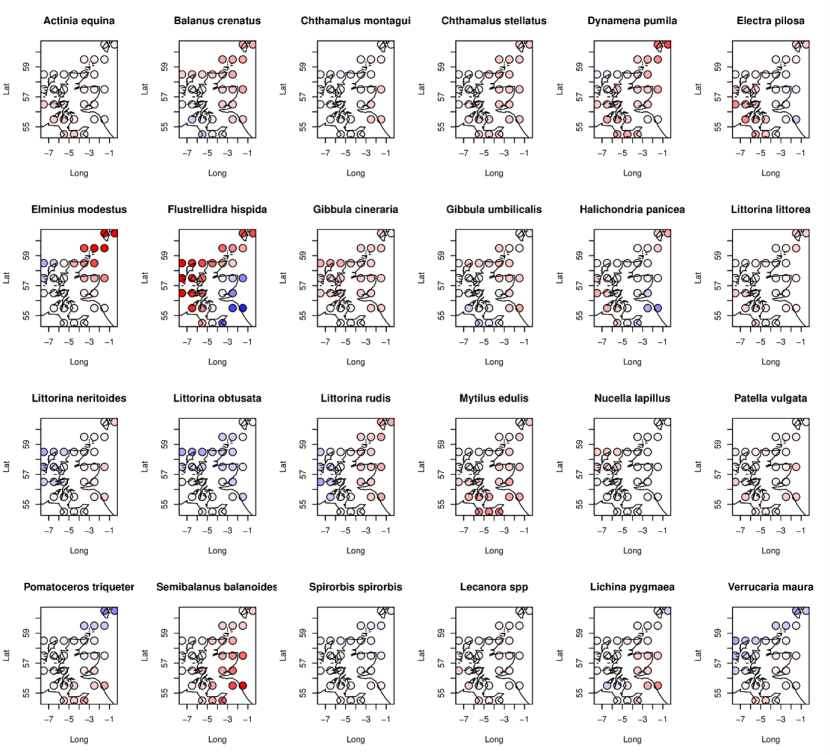
Figure 19. Modelled spatial patterns of changes in species abundance between 2014-2015 and 2020-2022 for 24 MarClim species (22 animals and 2 lichens).
Click for a full description
Symbols show estimated changes in 0.5-degree latitude/longitude cells from a descriptive statistical model, with red indicating declines and blue increases in abundance. Units are log-odds ratios of the ratio of predicted probabilities of abundance exceeding any category (P22, P15) in the two survey periods (thus: loge(P22/P15)).
The legend for this figure can be found in Figure 21b.
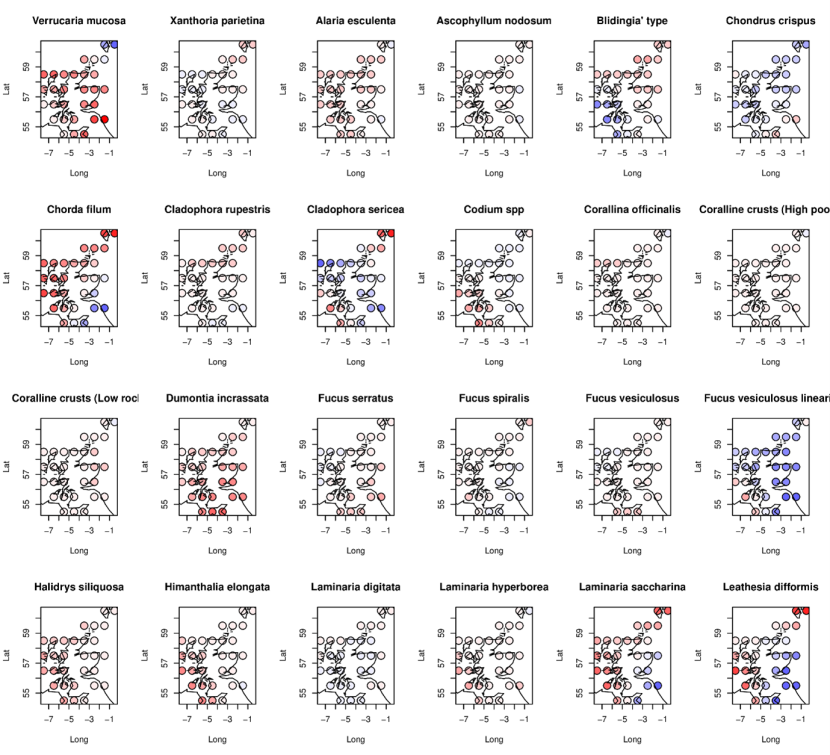
Figure 20. Modelled spatial patterns of changes in species abundance between 2014-2015 and 2020-2022 for 24 MarClim species (21 macroalgae and 3 lichens).
Click for a full description
Symbols show estimated changes in 0.5-degree latitude/longitude cells from a descriptive statistical model, with red indicating declines and blue increases in abundance. Units are log-odds ratios of the ratio of predicted probabilities of abundance exceeding any category (P22, P15) in the two survey periods (thus: loge(P22/P15)).
The legend for this figure can be found in Figure 21b.
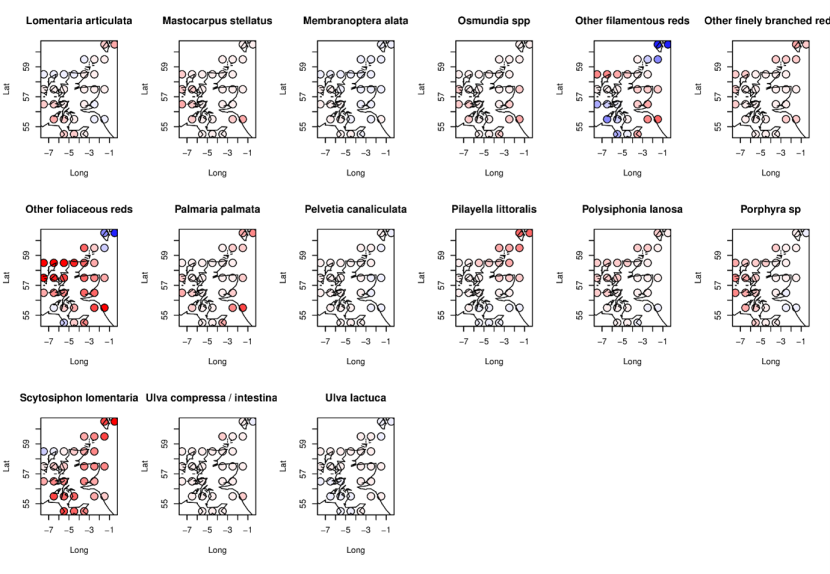
Figure 21a. Modelled spatial patterns of changes in species abundance between 2014-2015 and 2020-2022 for 17 MarClim taxa (all macroalgae).
Click for a full description
Symbols show estimated changes in 0.5-degree latitude/longitude cells from a descriptive statistical model, with red indicating declines and blue increases in abundance. Units are log-odds ratios of the ratio of predicted probabilities of abundance exceeding any category (P22, P15) in the two survey periods (thus: loge(P22/P15)).
The legend for this figure can be found in Figure 21b.

Figure 21b. Legend for figures 19-21.
3.3 Community structure
3.3.1 Spatial patterns in community structure
The main patterns of community structure and their major drivers in rocky shores in Scotland can be seen from the results of the multivariate principal components analysis (PCA) of abundance scores across surveys (Figure 22). The first principal component (PC1, 14% of the variation in community structure) emerged from the differences between communities dominated by large brown algae, characterized by Ascophyllum nodosum and other species from wave sheltered environments (the epiphytic red alga Polysiphonia now Vertebrata lanosa, the tubeworm Spirorbis spirorbis), from those dominated by coralline algae (Corallina officinalis, high shore coralline crusts) and species characteristic of wave-exposed habitats, including the kelp Alaria esculenta, the red alga Porphyra, and the high shore gastropod often found in empty barnacle shells, Melarhaphe neritoides (Figure 22b).
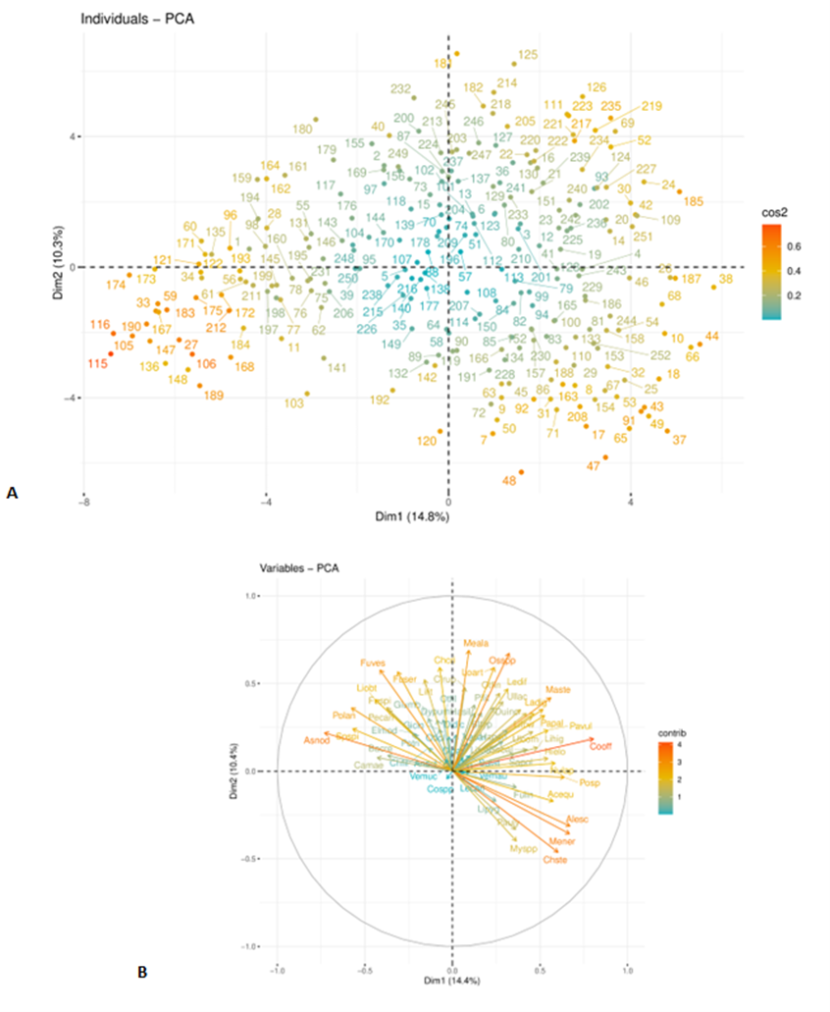
Figure 22. PCA of 66 intertidal taxa at 128 sites in Scotland surveyed twice in 2014-2015 and 2020-2022. (a) Site scores for PC1 and PC2. (b) Species weightings against the first and second PCs.
Click for a full description
Plots from Principal Component Analysis (PCA). The percentage on each axis describes the amount of variance explained by each principal component. a) Numbered symbols denote sites. Sites are coloured by their contribution to PC1 and PC2. The further the sites are from from the origin (x = 0, y = 0), the larger their contribution to PC1 and PC2. b) Arrows denote specific species. Arrows are coloured by their contribute to PC1 and PC2. The further the arrows are from the origin (x = 0, y = 0), the larger their contribution to PC1 and PC2.
Abbreviations for species are given in Table 11. Site names are given in Annex.
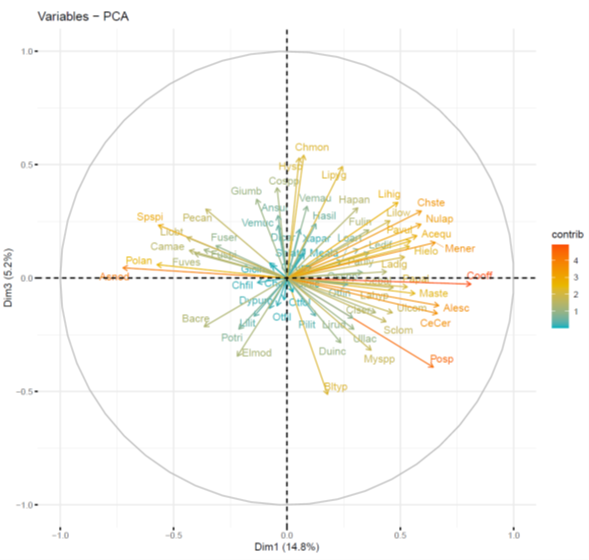
Figure 23. Additional information from the PCA in Figure 22 showing species weightings against the first and third PCs. Abbreviations for species are given in Table 11.
Click for a full description
Arrows denote specific species. Arrows are coloured by their contribute to PC1 and PC3. The further the arrows are from the origin (x = 0, y = 0), the larger their contribution to PC1 and PC3. The percentage on each axis describes the amount of variance explained by each principal component.
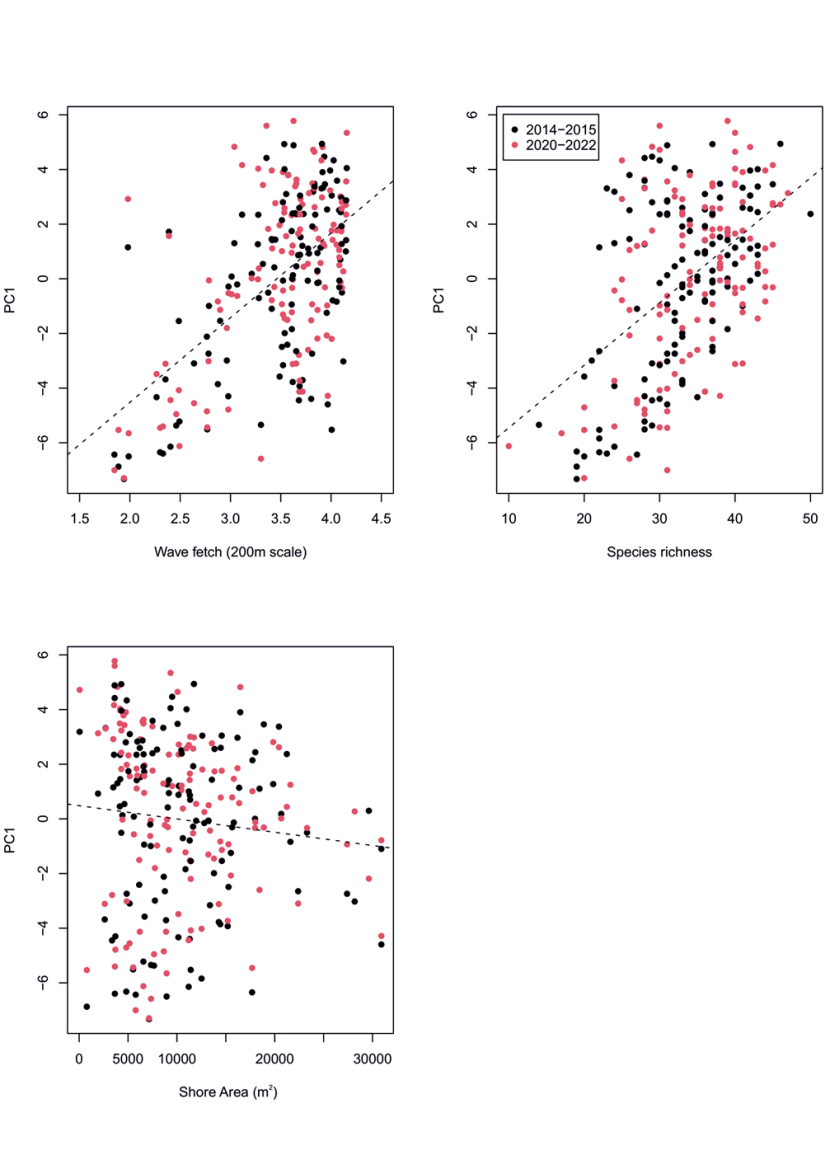
Figure 24. PC1 principal component scores for community data at MarClim sites in 2014-2015 and 2020-2022. PC1 versus (a) wave exposure, (b) species richness, and (c) shore extent (m2).
Click for a full description
Dashed lines show linear regressions between PC1 and the three predictor variables. Dots are coloured by sampling period: 2014-2015 (black) and 2020-2022 (red). There is no clear difference in trend for each sampling period for any of the predictor variables. For figures a) and b) there is a strong positive interaction between PC1 and a) wave exposure, (b) species richness. For figure c) there is a weak negative interaction between PC1 and shore extent.
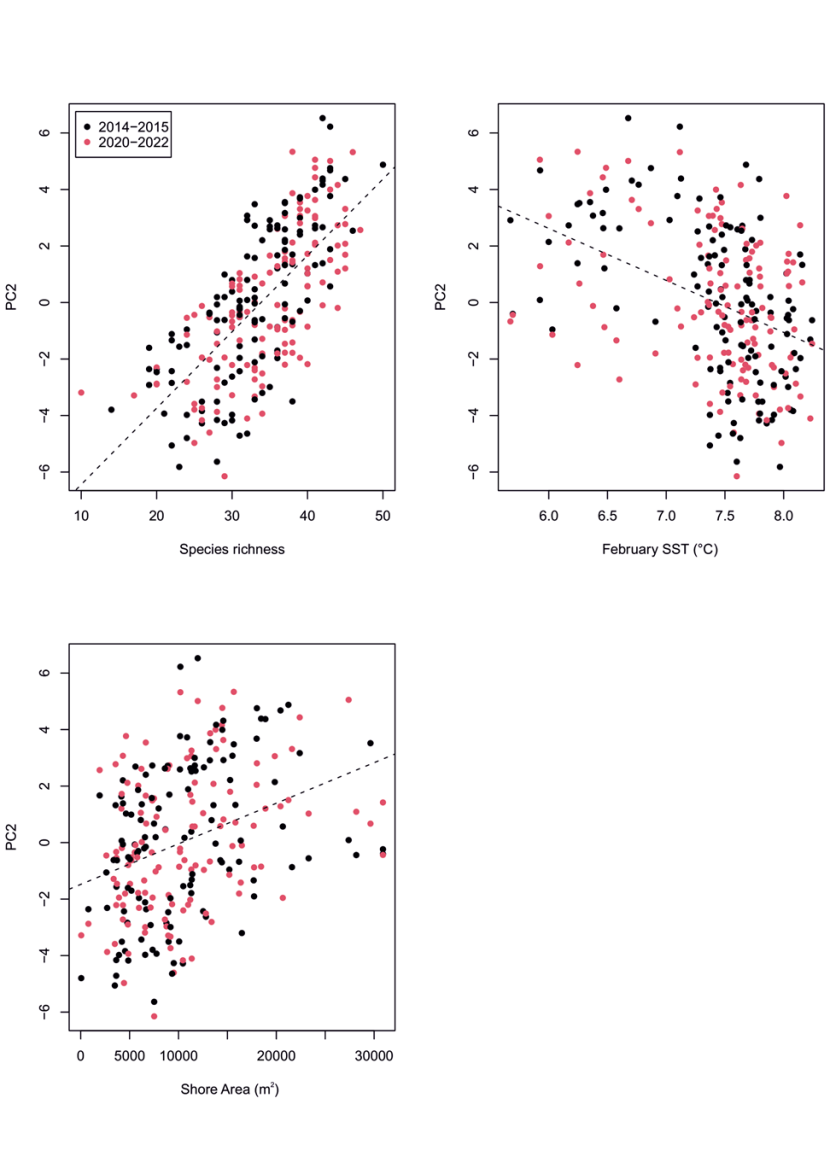
Figure 25. PC2 principal component scores for community data at MarClim sites in 2014-2015 and 2020-2022. PC2 verses (a) species richness, (b) average February Sea Surface Temperature, and (c) shore extent (m2).
Click for a full description
Dashed lines show linear regressions between PC2 and the three predictor variables. Dots are coloured by sampling period: 2014-2015 (black) and 2020-2022 (red). There is no clear difference in trend for each sampling period for any of the predictor variables. For figures a) and c) there is a strong positive interaction between PC2 and a) species richness, c) shore extent. For figure b) there is a negative interaction between PC1 and average February Sea Surface Temperature.
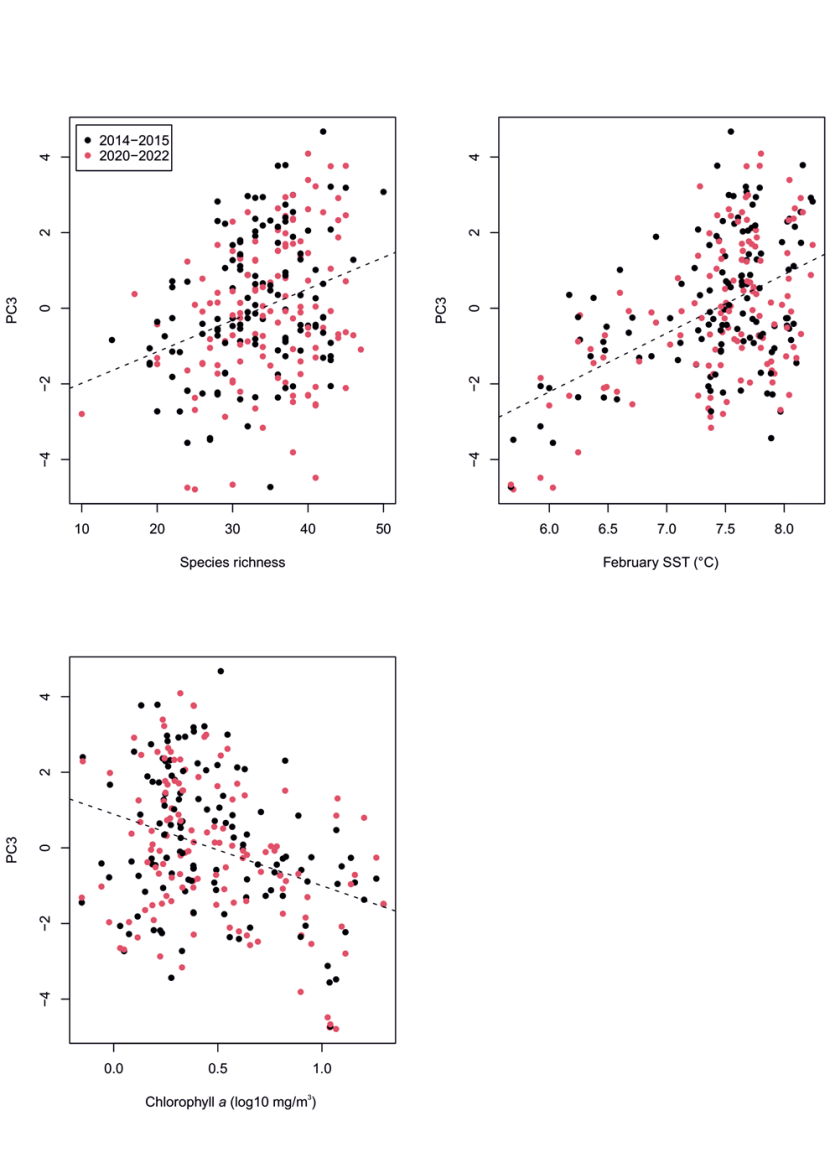
Figure 26. PC3 principal component scores for community data at MarClim sites in 2014-2015 and 2020-2022. PC3 verses a) species richness, (b) average February Sea Surface Temperature, and (c) chlorophyll a (log10 mg/m3).
Click for a full description
Dashed lines show linear regressions between PC3 and the three predictor variables. Dots are coloured by sampling period: 2014-2015 (black) and 2020-2022 (red). There is no clear difference in trend for each sampling period for any of the predictor variables. For figures a) and b) there is a strong positive interaction between PC2 and a) species richness, (b) average February Sea Surface Temperature. For figure c) there is a negative interaction between PC1 and chlorophyll a (log10 mg/m3).
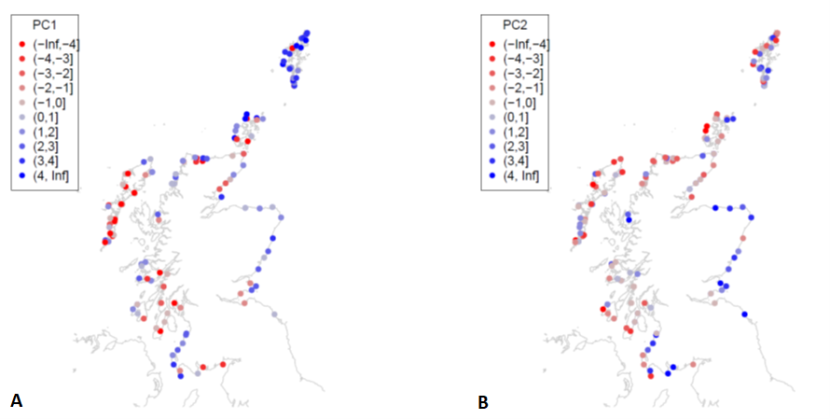
Figure 27. Scores for (a) principal component 1 (PC1) and (b) PC2 for MarClim sites surveyed in 2014-2015 and 2020-2021.
Click for a full description
Symbols are coloured by PC values for each site. The values relate to the PC1 and PC2 values which are displayed on axis in Figure 22. More detail is provided in the text about the spatial patterns displayed in the maps.
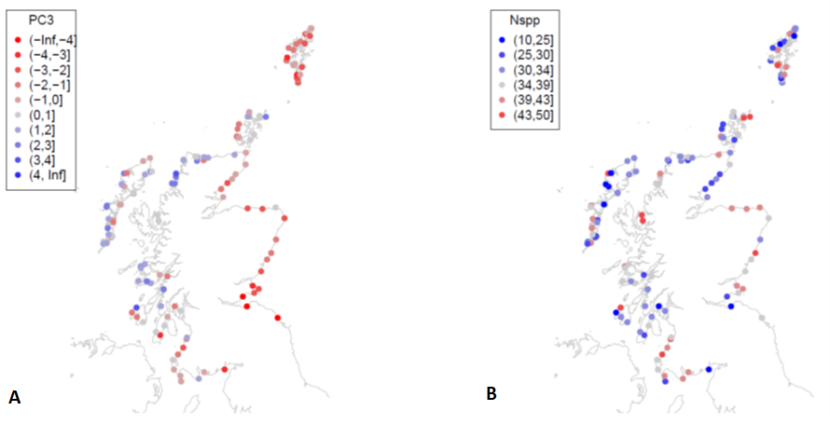
Figure 28. Scores for (a) principal component 3 (PC3) and (b) species richness for MarClim sites surveyed in 2014-2015 and 2020.
Click for a full description
Symbols are coloured by a) PC3 values for each site and b) species richness values. More detail is provided in the text about the spatial patterns displayed in the maps.
The second principal component PC2 reflected species diversity: most species and taxa had positive weights for this PC (Figure 22b). The only species with negative weightings for PC2 were characteristic of wave exposed habitats (Chthamalus stellatus, Melarhaphe neritoides, and Mytilus species).
Principal component scores for each survey location correlated with the environmental predictors, as expected from knowledge of the habitat preference of the species that weighted positively or negatively on each PC (Table 2). PC1 scores were positively related to wave fetch (Figure 24a), as seen in Burrows et al. (2008), and species richness (Figure 24b), but were not related to winter or summer sea surface temperature or shore extent. PC2 scores were overwhelmingly driven by species richness at each survey site (Figure 25a), negatively related to winter temperatures (Figure 25b; more species in cooler winter temperatures), and positively related to shore extent (Figure 25c). PC3 scores were most strongly positively correlated with winter temperatures (February SST, Figure 26b), but were also positively related to species richness (Figure 26a), and negatively related to chlorophyll a (Figure 26c).
Some of these relationships may have emerged from correlations between environmental predictors (Table 2). February SST and chlorophyll a were negatively correlated, with the greatest chlorophyll concentrations found in the coldest winter temperatures in the Firth of Forth, Firth of Clyde and the Moray Firth (Figure 7). Similarly, August SST and chlorophyll a were weakly negatively correlated, with the warmest summer temperatures in Scotland in the Solway Firth. Shore extents were negatively correlated with February SST: generally, more extensive shores were located on the east coast where winter temperatures were cooler.
Spatial patterns of principal component scores (Figure 27, Figure 28) followed the patterns of their primary predictors. PC1 scores were higher on exposed outer coasts (Figure 27) and lower in sheltered firths and lochs. PC2 scores (Figure 27b) and species richness (Figure 28b), were greater on the more extensive shores of the east coast, Solway Firth and west of South Uist. PC3 scores showed an east-west trend with higher values on western coasts (Figure 28a).
Table 2. Pearson correlations of Principal Component scores (PC1-PC3), species richness, and values of environmental predictors at paired sites in 2014-2015 and 2020-2022. Codes are: ShoreAreLT = Shore area within 200m diameter (m²); febsst = February SST (°C); augsst = August SST (°C), wx32 = Wave fetch; lchla = Chlorophyll a; pc1 = Principal Component 1 score (accounting for 14% of the variance in the data); pc2 = Principal Component 2 score (accounting for 10% of the variance in the data); pc3 = Principal Component 3 score (accounting for 5% of the variance in the data); CTI = Communitiy Temperature Index; nspp = Species richness. n=256.
- | ShoreAreLT | febsst | augsst | wx32 | lchla | pc1 | pc2 | pc3 | CTI | nspp |
|---|---|---|---|---|---|---|---|---|---|---|
ShoreAreLT | 1.00 | -0.37 | 0.22 | 0.33 | 0.18 | -0.10 | 0.35 | 0.10 | -0.12 | 0.30 |
febsst | -0.37 | 1.00 | -0.32 | -0.26 | -0.60 | -0.12 | -0.40 | 0.50 | 0.34 | -0.15 |
augsst | 0.22 | -0.32 | 1.00 | 0.13 | 0.52 | -0.16 | 0.22 | -0.19 | -0.09 | 0.02 |
wx32 | 0.33 | -0.26 | 0.13 | 1.00 | 0.07 | 0.57 | 0.12 | 0.06 | 0.31 | 0.43 |
lchla | 0.18 | -0.60 | 0.52 | 0.07 | 1.00 | 0.02 | 0.35 | -0.35 | -0.20 | 0.15 |
pc1 | -0.10 | -0.12 | -0.16 | 0.57 | 0.02 | 1.00 | 0.01 | 0.01 | 0.47 | 0.51 |
pc2 | 0.35 | -0.40 | 0.22 | 0.12 | 0.35 | 0.01 | 1.00 | -0.02 | -0.42 | 0.69 |
pc3 | 0.10 | 0.50 | -0.19 | 0.06 | -0.35 | 0.01 | -0.02 | 1.00 | 0.41 | 0.29 |
CTI | -0.12 | 0.34 | -0.09 | 0.31 | -0.20 | 0.47 | -0.42 | 0.41 | 1.00 | 0.08 |
nspp | 0.30 | -0.15 | 0.02 | 0.43 | 0.15 | 0.51 | 0.69 | 0.29 | 0.08 | 1.00 |
3.3.2 Changes in Community structure and biodiversity from 2014-2015 to 2020-2022, including Community Temperature Index
Surveys in 2020-2022 at the same locations as were surveyed in 2014-2015 allowed comparisons of measures of community structure between the two periods. Averages of differences in community metrics (principal component scores PC1, PC2 and PC3, Community Temperature Index values and species richness) and their variability were calculated (Table 3). Community Temperature Index increased on average by 0.13°C. Species richness declined by 1.8 between 2014-2015 and 2020-2022, and PC3 increased by 0.23.
Table 3. Differences between community metrics between 2014-2015 and 2020-2022 (n=124 sites), showing the average change between surveys at the same sites. Statistical significance of changes was assessed using t-tests, with average changes that were significantly different from zero shown in bold (P<0.05). Codes are: dCTIa = Difference in Community Temperature Index; dpc1 = Difference in PC1; dpc2 = Difference in PC2; dpc3 = Difference in PC3; dnspp = Difference in species richness.
- | T-statistic | p.value | Average change | stderr | Lower CI | Upper CI |
|---|---|---|---|---|---|---|
dCTIa | 3.031 | 0.003 | 0.126 | 0.042 | 0.044 | 0.209 |
dpc1 | -1.636 | 0.104 | -0.261 | 0.160 | -0.577 | 0.055 |
dpc2 | 0.227 | 0.821 | 0.046 | 0.205 | -0.358 | 0.451 |
dpc3 | 2.156 | 0.033 | 0.230 | 0.107 | 0.019 | 0.442 |
dnspp | -3.376 | 0.001 | -1.784 | 0.528 | -2.830 | -0.74 |
Changes in these community metrics showed some evidence of correlations with the environmental drivers of community structure (Table 4). Patterns of changes tended to follow the same patterns and associations as the original metrics. Changes in PC1 and PC2 were strongly positively correlated with changes in species richness (r=0.53 and 0.77 respectively, Table 4). PC3 changes were unrelated to any of the environmental drivers. Community Temperature Index change was correlated with February SST, a greater increase in areas of warmer winter temperatures evident when site level changes were mapped (Figure 29a). Changes in species richness were not strongly related to the environmental drivers, showing a decrease that was spatially consistent overall (Figure 29c).
Table 4. Correlations of differences in community metrics (PC1-PC2, species richness) with environmental variables at paired survey sites between 2014-2015 and 2020-2022 (n=128). Differences between 2014-2015 and 2020-2022 were positive if the measures increased.
Codes are: dpc1 = Difference in PC1; dpc2 = Difference in PC2; dpc3 = Difference in PC3; dnspp = Difference in species richness; dCTIa = Difference in Community Temperature Index; wx32 = Wave fetch; febsst = February SST (°C); augsst = August SST (°C); lchla = Chlorophyll a; ShoreAreLT = Shore area within 200m diameter (m²)
- | dpc1 | dpc2 | dpc3 | dnspp | dCTIa | wx32 | febsst | augsst | lchla | ShoreAreLT |
|---|---|---|---|---|---|---|---|---|---|---|
dpc1 | 1.00 | 0.37 | -0.10 | 0.53 | 0.03 | 0.06 | -0.13 | 0.10 | 0.11 | 0.10 |
dpc2 | 0.37 | 1.00 | -0.02 | 0.77 | -0.30 | 0.03 | -0.22 | 0.26 | 0.21 | 0.06 |
dpc3 | -0.10 | -0.02 | 1.00 | 0.09 | 0.12 | 0.20 | -0.15 | -0.03 | 0.05 | 0.02 |
dnspp | 0.53 | 0.77 | 0.09 | 1.00 | -0.18 | -0.04 | -0.26 | 0.17 | 0.20 | 0.06 |
dCTIa | 0.03 | -0.30 | 0.12 | -0.18 | 1.00 | 0.05 | 0.31 | -0.03 | -0.11 | -0.01 |
wx32 | 0.06 | 0.03 | 0.20 | -0.04 | 0.05 | 1.00 | -0.26 | 0.13 | 0.07 | 0.33 |
febsst | -0.13 | -0.22 | -0.15 | -0.26 | 0.31 | -0.26 | 1.00 | -0.32 | -0.60 | -0.37 |
augsst | 0.10 | 0.26 | -0.03 | 0.17 | -0.03 | 0.13 | -0.32 | 1.00 | 0.52 | 0.22 |
lchla | 0.11 | 0.21 | 0.05 | 0.20 | -0.11 | 0.07 | -0.60 | 0.52 | 1.00 | 0.18 |
ShoreAreLT | 0.10 | 0.06 | 0.02 | 0.06 | -0.01 | 0.33 | -0.37 | 0.22 | 0.18 | 1.00 |

Figure 29. Spatial patterns in changes between 2014-2015 and 2020-2022. (a) Community Temperature Index, (b) Principal Component 3, PC3 score, and (c) species richness.
Click for a full description
Symbols are coloured by (a) Community Temperature Index, (b) Principal Component 3, PC3 score, and (c) species richness. More detail is provided in the text about the spatial patterns displayed in the maps.
In a comparison such as this, the tendency for low values in one survey period to be followed by higher ones in the next period, and vice versa, is termed regression to the mean. There was evidence for this effect for all the community metrics except the Community Temperature Index (Annex G, Figure 35). Adjusting for the potential effect of ‘regression to the mean’ (section 2.5.3) reversed the relationships of changes and environmental predictors (compare Table 5 with Table 4) where these were strong. This suggested that adjusting change metrics for ‘regression to the mean’ effects where such effects were weak (PC1 and CTI) introduces spurious associations between the inferred change and environmental drivers. Where apparent regression to the mean effects were strong (species richness, PC2 and PC3), the changes were likely to have been driven by random processes associated with the survey methodology.
Table 5. Adjustment for ‘regression to the mean’ effects on correlations of differences in community metrics (PC1-PC2, species richness) with environmental variables at paired survey sites between 2014-2015 and 2020-2022 (n=128). Differences between 2014-2015 and 2020-2022 were positive if the measures increased. ‘Regression to the mean’ is the tendency of randomly extreme observations to become closer to the mean on subsequent measurement.
Codes are: dpc1 = Difference in PC1; dpc2 = Difference in PC2; dpc3 = Difference in PC3; dnspp = Difference in species richness; dCTIa = Difference in Community Temperature Index; wx32 = Wave fetch; febsst = February SST (°C); augsst = August SST (°C); lchla = Chlorophyll a; ShoreAreLT = Shore area within 200m diameter (m²)
- | dstarpc1 | dstarpc2 | dstarpc3 | dstarnspp | dstarcti | wx32 | febsst | augsst | lchla | ShoreAreLT |
|---|---|---|---|---|---|---|---|---|---|---|
dstarpc1 | 1.00 | 0.30 | 0.04 | 0.56 | 0.13 | -0.23 | 0.16 | -0.05 | -0.11 | -0.07 |
dstarpc2 | 0.30 | 1.00 | -0.03 | 0.77 | -0.37 | -0.08 | 0.38 | -0.33 | -0.35 | -0.21 |
dstarpc3 | 0.04 | -0.03 | 1.00 | 0.14 | 0.23 | -0.22 | -0.04 | 0.10 | 0.07 | -0.06 |
dstarnspp | 0.56 | 0.77 | 0.14 | 1.00 | -0.11 | -0.18 | 0.30 | -0.17 | -0.26 | -0.20 |
dstarcti | 0.13 | -0.37 | 0.23 | -0.11 | 1.00 | -0.18 | -0.39 | 0.06 | 0.18 | 0.06 |
wx32 | -0.23 | -0.08 | -0.22 | -0.18 | -0.18 | 1.00 | -0.26 | 0.13 | 0.07 | 0.33 |
febsst | 0.16 | 0.38 | -0.04 | 0.30 | -0.39 | -0.26 | 1.00 | -0.32 | -0.60 | -0.37 |
augsst | -0.05 | -0.33 | 0.10 | -0.17 | 0.06 | 0.13 | -0.32 | 1.00 | 0.52 | 0.22 |
lchla | -0.11 | -0.35 | 0.07 | -0.26 | 0.18 | 0.07 | -0.60 | 0.52 | 1.00 | 0.18 |
ShoreAreLT | -0.07 | -0.21 | -0.06 | -0.20 | 0.06 | 0.33 | -0.37 | 0.22 | 0.18 | 1.00 |
4. Discussion
4.1 Survey aims
The survey of Scotland’s rocky intertidal between September 2020 and September 2022 was designed to establish the status of conspicuous and recognisable species, including habitat-forming seaweeds and other important organisms. As part of the MarClim (Marine Biodiversity and Climate Change) programme, species were included that were likely to reveal changes related to climate change by virtue of being near their climatic limits. There has been a slight warming of average sea surface temperatures around Scotland since the last surveys in 2014-2015 (Figure 9), mostly evident in 2022 and continuing after the last surveys, with a severe marine heatwave in spring and summer of 2023. The average Community Temperature Index (CTI), a measure of the balance between cold-water and warm-water species (also known as the Intertidal Community Index (Burrows et al., 2018)), increased by 0.14°C between 2014-2015 and 2020-2022. While the tendency of species to increase or decrease between the successive surveys was not consistently linked to their status as warm-water or cold-water species (see Figure 18), collectively the assemblage did shift significantly towards species from warmer environments, in line with the change in average sea surface temperature in the region between the two sets of surveys (0.20°C, Figure 9). Seven to nine years is a very short timescale to see effects related to climate change. Longer time series of changes in intertidal communities in Scotland, such as the 45-year sequence from monitoring of the Shetland Oil Terminal in Sullom Voe, have shown a steady increase in CTI with warming (Burrows et al., 2020) since the 1980s, driven largely by declines in cold-water species (deborealization, (McLean et al., 2021)). Annual MarClim surveys in southwest England and Wales also showed a decline in CTI from 2002 to 2019, with a shift in community dominance towards cold-water species during a period of slight cooling, with both increases in cold-water species (borealization) and decreases in warm-water ones (detropicalization). The survey methods have proved effective at detecting climate-related shifts, albeit small ones, despite the relative coarseness of the categorical abundance measurements.
4.1.1 Survey contributions to understanding of MPA reef features
For some species, the dynamics of populations and communities are likely to be similar inside marine protected areas to those outside. Many rocky intertidal species show strong synchrony in fluctuations of abundance over wide spatial scales (10s to 100s of km). Recruitment of species with widespread larval dispersal such as barnacles, for example, varies between years in a similar way across whole coastlines (Southward et al., 1995). Other rocky intertidal organisms can have more localised fluctuations in abundance, resulting in a lack of synchrony over smaller spatial scales. Bladder wrack Fucus vesiculosus populations showed quite different patterns of change in abundance at shores around Sullom Voe in the 1980s and 1990s (Burrows et al., 2002) suggesting that changes in such species over time are more likely to be driven by localised factors. The dogwhelk Nucella lapillus was an example of such a localised driver in the same study of Sullom Voe rocky shores. Dogwhelks are vulnerable to the effects of tributyltin used in antifouling paints in the 1970s to the 1990s. Populations of the species went extinct at sites close to the Shetland Oild Terminal in Sullom Voe in the 1980s and only recovered after a ban on the use of tributyltin in the 1990s (Harding et al., 1997). Classification of species for which changes are likely to be synchronised across coastlines and those whose changes are likely to be locally driven would help identify where surveys for features need to be more site specific and where surveys outside the area of interest would still provide valuable information.
Twenty sites were visited in 12 protected areas where reefs were a feature, listed in table 8. No visible differences could be discerned between such areas and similar shores outside the protected areas. Surveys inside and outside the protected areas had similar levels of species richness, and the small differences were not statistically significantly different.
The main function of this programme of surveys to the understanding of MPAs is as an indicator of any change in condition of the feature. Beyond the general contribution to our understanding of ongoing changes across the whole of Scotland, the data from within MPAs will form an important baseline for the detection of future change. If survey frequency were increased to annual or biannual events, it may become possible to identify any observed changes as either ongoing long-term trends or as responses to short-term events, such as climatic extremes (Burrows et al., 2020; Mieszkowska et al., 2021).
4.2 Survey contributions to understanding of MPA reef features
For some species, the dynamics of populations and communities are likely to be similar inside marine protected areas to those outside. Many rocky intertidal species show strong synchrony in fluctuations of abundance over wide spatial scales (10s to 100s of km). Recruitment of species with widespread larval dispersal such as barnacles, for example, varies between years in a similar way across whole coastlines (Southward et al., 1995). Other rocky intertidal organisms can have more localised fluctuations in abundance, resulting in a lack of synchrony over smaller spatial scales. Bladder wrack Fucus vesiculosus populations showed quite different patterns of change in abundance at shores around Sullom Voe in the 1980s and 1990s (Burrows et al., 2002) suggesting that changes in such species over time are more likely to be driven by localised factors. The dogwhelk Nucella lapillus was an example of such a localised driver in the same study of Sullom Voe rocky shores. Dogwhelks are vulnerable to the effects of tributyltin used in antifouling paints in the 1970s to the 1990s. Populations of the species went extinct at sites close to the Shetland Oild Terminal in Sullom Voe in the 1980s and only recovered after a ban on the use of tributyltin in the 1990s (Harding et al., 1997). Classification of species for which changes are likely to be synchronised across coastlines and those whose changes are likely to be locally driven would help identify where surveys for features need to be more site specific and where surveys outside the area of interest would still provide valuable information.
Twenty sites were visited in 12 protected areas where reefs were a feature, listed in table 8. No visible differences could be discerned between such areas and similar shores outside the protected areas. Surveys inside and outside the protected areas had similar levels of species richness, and the small differences were not statistically significantly different.
The main function of this programme of surveys to the understanding of MPAs is as an indicator of any change in condition of the feature. Beyond the general contribution to our understanding of ongoing changes across the whole of Scotland, the data from within MPAs will form an important baseline for the detection of future change. If survey frequency were increased to annual or biannual events, it may become possible to identify any observed changes as either ongoing long-term trends or as responses to short-term events, such as climatic extremes (Burrows et al., 2020; Mieszkowska et al., 2021).
4.3 Changes in climate indicator species
Overall shifts in dominance between warm and cold-water species are revealed by changes in average thermal affinity across the communities over all the survey sites using the changes in Community Temperature Index (Burrows et al., 2020, 2017a). While the overall shift was slightly towards warm-water species (Figure 29), the changes across Scotland were not uniform, and those among climate indicator species were not wholly consistent with expectations from warming. The shift in community composition towards warmer water species between 2014-2015 and 2020-2022 was more evident at outer west coast sites (Figure 29a), with an opposite shift towards cold-water species along the east coast. Such small changes are consistent with being due to localised effects of warming or cooling and would be worth investigating further to establish the mechanisms that link such small-scale shifts to climate change.
Indicator species in the MarClim programme in Scotland are warm-water species that are towards their global northern cold limit in the UK and cold-water species near their global warm limit. Those warm-water species that did increase between 2014-2015, the barnacle Chthamalus montagui, the exposed shore snail Melarhaphe neritoides, the purple topshell Steromphala umbilicalis and the non-native barnacle Austrominius modestus, did so in their core distribution ranges on the west coast (Figure 13, Figure 14). The notable exception among warm-water species was the barnacle Chthamalus stellatus which showed both declines and increases within its west coast range.
Changes in cold-water species near the warm end of their distribution in Scotland were inconsistent, with notable changes entirely contrary to expectations from warming. The cold-water barnacle Semibalanus balanoides increased everywhere. In southwest Britain close to its extreme limit, this species has been shown to be very sensitive to interannual changes in temperature (Mieszkowska et al., 2014). Further from its warm limit, around Scotland Semibalanus balanoides may be less sensitive to changes in temperature, but may rather be driven by factors affecting recruitment such as the timing of the spring phytoplankton bloom (Barnes, 1956) and other factors influencing the successful development of larvae, such as food supply (Gimenez et al., 2017). Similarly, the cold-water littorinid gastropod Littorina obtusata increased all along the coastlines too. Littorina obtusata lives on large brown habitat-forming macroalgae and, being relatively inconspicuous, can be difficult to record consistently.
The relative influence of increases in warm-water species and declines in cold-water ones therefore varied regionally: increases in warm-water species (tropicalization) that are limited to the west coast, but increases and declines in cold-water species (borealization and de-borealization, (McLean et al., 2021)) along both east and west coasts mean that a warming signal prevailed in the west and a slight decline in the east.
4.4 Changes in habitat-forming species
Changes were seen in habitat-forming species that were not initially considered sensitive to climate change in Scotland’s coastal waters. Intertidal mussel beds (Mytilus edulis) continued to decline from the levels of abundance in Scotland seen at the start of the MarClim programme (2002-2006, (Burrows et al., 2017b)). A review of the status of blue mussel beds in Scotland (West et al., in prep) has assessed possible causes of their decline in Scotland. Intertidal Mytilus edulis have declined in many other locations in the Northern Hemisphere. Declines in Norway have been attributed to increasing predators, including fishes (wrasse) and crabs (Christie et al., 2020). In France, mass mortality events of mussels have occurred during heatwaves (Seuront et al., 2019), especially following repeated exposures to high temperatures. Mussels have declined by >60% over the last 40 years in the Gulf of Maine, another rapidly warming region (Sorte et al., 2017). Intertidal mussels have long been known to vary in abundance over decadal timescales, from the English Channel in the 1920s (Fischer-Piette, 1935) to across the eastern Pacific in the 1990s and 2000s (Gouhier et al., 2010). Predation by dogwhelks Nucella lapillus was implicated in the elimination of mussel beds in France in the 1920s (Fischer-Piette, 1935), with an increase in predators following a strong spatfall producing a decline in mussel beds. In the Pacific, changes in Mytilus californianus populations were related to interannual changes in upwelling and associated productivity of phytoplankton. Declines in mussel production have also been seen in the European mussel aquaculture industry (Avdelas et al., 2021), where algal blooms have prevented the sale of mussels, and climate change and ocean acidification have been suggested as causes for declines. Ocean acidification may affect shell strength in mussels, but the effects of temperature increases may be greater (Mackenzie et al., 2014).
The bladderless variant Fucus vesiculosus var linearis of the habitat-forming macroalga, the bladder wrack Fucus vesiculosus, emerged as one of the most changed taxa between 2014-2015 and 2020-2022. When both this form and the normal variant of Fucus vesiculosus were considered together, however, their overall abundance did not change. This strongly suggests that the emergence of var linearis in survey data was essentially due to the greater recording of this taxon, rather than a fundamental change in abundance of the species. This contrasts with the changes observed in the two similar mid shore red algae, Chondrus crispus (carrageenan or Irish moss) and Mastocarpus stellatus (false Irish moss). Despite their similarity, the two species are sufficiently distinguishable to be confident that the increase in Chondrus and decline in Mastocarpus between 2014-2015 and 2020-2022 was not due to issues of identification. A negative relationship between these species may result from competition (Dudgeon et al., 1999), with Chondrus crispus being faster growing and the dominant competitor. Storms remove Chondrus plants, allowing Mastocarpus to coexist lower on the shore; while competition in the mid shore favours Mastocarpus because of the slower growth of its competitor at that shore level (Dudgeon et al., 1999). Observed increases in Chondrus and declines in Mastocarpus may therefore be associated with the replacement of the latter by the former as a result of competition after a period of reduced storm frequency.
4.5 Environmental determinism versus species interactions
The approach used here to understanding drivers of change de-emphasises the role of interactions among species in favour of that of direct responses of single species’ populations to changes in their local environment, including those environmental changes associated with climate change and other stressors, with major emphasis on the direct effects of environmental change on single species (‘environmental determinism’). Evidence from long-term studies, such as the temperature-related fluctuations in barnacles in southwest Britain (Mieszkowska et al., 2014), suggests that much of the observed change may be as a result of direct response of critical processes to the changed environments. For Semibalanus balanoides in southwest Britain, the critical process is the survival of post-settlement spat in late spring, being much reduced in years of higher spring temperatures. Even in this case however, species interactions may be important: the weaker competitor species Chthamalus montagui and Chthamalus stellatus increase in abundance following such a warm spring, as a result of reduced competition from Semibalanus (Connell, 1961; Poloczanska et al., 2008). A counter example, where species interactions are the main drivers of change following an environmental disturbance, is that of the recovery of rocky shores in Cornwall following the Torrey Canyon oil spill in the 1960s (Southward and Southward, 1978). Widespread use of toxic dispersants killed off the important grazing limpet Patella species, with a consequential increase in large brown macroalgae (Fucus species). The increase in macroalgae was then followed by a subsequent recovery of the grazers and inhibition of further growth of macroalgae, in a cyclic way for several years afterwards. Such cycles of abundance of macroalgae and limpet grazers are thought to be typical of moderately exposed rocky seashores in Britain (Hartnoll and Hawkins, 1985), and have been seen in long-term studies of similar shores; notably in the Isle of Man (Burrows and Hawkins, 1998) and Loch Hyne in Ireland (Little et al., 2017). Future consideration of the drivers of change in these systems may be able to include the indirect effects of changes in other species, using joint species distribution models (Tobler et al., 2019) or similar approaches.
5. Conclusions
Resurveys of the biodiversity of the rocky intertidal in 2020-2022, six to eight years after a complete survey in 2014-2015, have revealed changes in species abundance and community composition across Scotland. Such differences have been relatively minor but have revealed changes that are consistent with a small degree of warming between the two assessments with an element of regional variation. The average thermal affinity measure (CTI) showed that communities shifted towards greater dominance by warm water species. Warm water species generally increased in abundance in their west coast ranges while cold water ones were split between those that increased and those that decreased over the whole of Scotland. The ongoing decline in intertidal mussels since the early 2000s has continued, being without known causes but more evident along southwestern and southeastern coasts.
Repeating surveys in the same geographical locations has added considerable power to the detection of change by the MarClim programme in Scotland. While annual surveys of a smaller set of these sites would reveal the true timescales of observed changes and add confidence to inference of climate-related drivers, this spatially comprehensive survey gives a strong baseline for the detection of future change in the biodiversity of Scotland’s rocky intertidal seashores.
6. References
Åberg, P. 1992. A demographic study of two populations of the seaweed Ascophyllum nodosum. Ecology, 73: 1473–1487.
Avdelas, L., Avdic-Mravlje, E., Borges Marques, A.C., Cano, S., Capelle, J.J., Carvalho, N., Cozzolino, M., Dennis, J., Ellis, T., Fernández Polanco, J.M., Guillen, J., Lasner, T., Le Bihan, V., Llorente, I., Mol, A., Nicheva, S., Nielsen, R., van Oostenbrugge, H., Villasante, S., Visnic, S., Zhelev, K., and Asche, F. 2021. The decline of mussel aquaculture in the European Union: causes, economic impacts and opportunities Reviews in Aquaculture, 13, 91–118.
Barnes, H., 1956. Balanus balanoides (L.) in the Firth of Clyde: the development and annual variation of the larval population and causative factors Journal of Animal Ecology, 25: 72–84.
Barnett, A.G., van der Pols, J.C., and Dobson, A.J. 2005. Regression to the mean: what it is and how to deal with it International Journal of Epidemiology, 34: 215–220.
Bürkner, P.-C., and Vuorre, M. 2019. Ordinal Regression Models in Psychology: A Tutorial Advances in Methods and Practices in Psychological Science, 2: 77–101.
Burnham, K.P., and Anderson, D.R. 2002. Model Selection and Multimodel Inference: A Practical Information Theoretic Approach. Springer Verlag, New York, USA.
Burrows, M. 2020. Wave fetch GIS layers for the UK and Ireland at 200m scale
Burrows, M.T. 2012. Influences of wave fetch, tidal flow and ocean colour on subtidal rocky communities Marine Ecology Progress Series, 445: 193–207.
Burrows, M.T., Fox, C.J., Moore, P., Smale, D., Sotheran, I., Benson, A., Greenhill, L., Martino, S., Parker, A., Thompson, E., and Allen, C.J. 2018. Wild seaweed harvesting as a diversification opportunity for fishermen, A report by SRSL for HIE. Scottish Association for Marine Science, Oban, UK.
Burrows, M.T., Harvey, R., and Robb, L. 2008. Wave exposure indices from digital coastlines and the prediction of rocky shore community structure Marine Ecology Progress Series, 353, 1–12.
Burrows, M.T., and Hawkins, S.J. 1998. Modelling patch dynamics on rocky shores using deterministic cellular automata. Marine Ecology Progress Series, 167: 1–13.
Burrows, M.T., Hawkins, S.J., Moore, J.J., Adams, L., Sugden, H., Firth, L., and Mieszkowska, N. 2020. Global-scale species distributions predict temperature-related changes in species composition of rocky shore communities in Britain Global Change Biology, 26: 2093–2105.
Burrows, M. T., Mieszkowska, N., Baxter, J., Vina-Herbon, C., Singleton, G., Robison, K., and Young, M. 2018. Intertidal community index (MarClim) [WWW Document]. Marine online assessment tool
Burrows, M.T., Mieszkowska, N., Hawkins, S.J. 2017a. Development of an MSFD intertidal rocky shore indicator for climate change response and an interim assessment of UK. Scottish Natural Heritage unpublished report. Scottish Association for Marine Science.
Burrows, M.T., Mieszkowska, N., Hawkins, S.J., 2014. Marine Strategy Framework Directive Indicators for UK Rocky Shores, JNCC Report 522 (No. 522), JNCC Report. Joint Nature Conservation Committee, Peterborough, UK.
Burrows, M.T., Moore, J.J., James, B., 2002. Spatial synchrony of population changes in rocky shore communities in Shetland Marine Ecology Progress Series, 240, 39–48.
Burrows, M.T., Twigg, G., Mieszkowska, N., and Harvey, R. 2017b. Marine Biodiversity and Climate Change (MarClim) Scotland 2014/15: Final Report (No. Scottish Natural Heritage Commissioned Report No. 939), Scottish Natural Heritage Commissioned Report No. 939. Scottish Association for Marine Science.
Christie, H., Kraufvelin, P., Kraufvelin, L., Niemi, N., and Rinde, E. 2020. Disappearing Blue Mussels – Can Mesopredators Be Blamed? Frontiers in Marine Science, 7: 550.
Connell, J.H. 1961. The influence of interspecific competition and other factors on the distribution of the barnacle Chthamalus stellatus. Ecology, 42: 710–723.
Crisp, D.J., Southward, A.J., and Southward, E.C. 1981. On the distribution of the intertidal barnacles Chthamalus stellatus, Chthamalus montagui and Euraphia depressa. Journal of the Marine Biological Association of the United Kingdom, 61: 359–380.
Dudgeon, S.R., Steneck, R.S., Davison, I.R., and Vadas, R.L. 1999. Coexistence of Similar Species in a Space-Limited Intertidal Zone Ecological Monographs, 69: 331–352.
Fischer-Piette, E. 1935. Histoire d’une moulière. Observations sur une phase de déséquilibre faunique. Bulletin Biologique de la France et de la Belgique, 5: 153–177.
Gimenez, L., Torres, G., Pettersen, A., Burrows, M.T., Estevez, A., and Jenkins, S. 2017. Scale-dependent natural variation in larval nutritional reserves in a marine invertebrate: implications for recruitment and cross-ecosystem coupling Marine Ecology Progress Series, 570: 141–155.
Gouhier, T.C., Guichard, F., and Menge, B.A. 2010. Ecological processes can synchronize marine population dynamics over continental scales Proceedings of the National Academy of Sciences, 107(18): 8281-8286.
Harding, M.J.C., Rodger, G.K., Davies, I.M., and Moore, J.J. 1997. Partial recovery of the dogwhelk (Nucella lapillus) in Sullom Voe, Shetland from tributyltin contamination Marine Environmental Research, 44: 285–304.
Hartnoll, R.G., and Hawkins, S.J. 1985. Patchiness and fluctuations on moderately exposed rocky shores. Ophelia, 24: 53–63.
Hastings, R.A., Rutterford, L.A., Freer, J.J., Collins, R.A., Simpson, S.D., and Genner, M.J. 2020. Climate Change Drives Poleward Increases and Equatorward Declines in Marine Species Current Biology, 30: 1572-1577.e2.
Hiscock, K., Hiscock, S., and Baker, J.M. 1978. The occurrence of the barnacle Elminius modestus in Shetland. Journal of the Marine Biological Association of the United Kingdom, 58: 627–629.
Kelly, C., and Price, T.D. 2005. Correcting for Regression to the Mean in Behavior and Ecology The American Naturalist, 166: 700–707.
Little, C., Trowbridge, C.D., Pilling, G.M., Stirling, P., Morritt, D., and Williams, G.A. 2017. Long-term fluctuations in intertidal communities in an Irish sea-lough: Limpet-fucoid cycles Estuarine, Coastal and Shelf Science, 196: 70–82.
Mackenzie, C.L., Ormondroyd, G.A., Curling, S.F., Ball, R.J., Whiteley, N.M., and Malham, S.K. 2014. Ocean Warming, More than Acidification, Reduces Shell Strength in a Commercial Shellfish Species during Food Limitation PLOS ONE, 9: e86764.
McLean, M., Mouillot, D., Maureaud, A.A., Hattab, T., MacNeil, M.A., Goberville, E., Lindegren, M., Engelhard, G., Pinsky, M., and Auber, A. 2021. Disentangling tropicalization and deborealization in marine ecosystems under climate change Current Biology, 31: 4817-4823.e5.
Mieszkowska, N., Burrows, M.T., Hawkins, S.J., and Sugden, H. 2021. Impacts of Pervasive Climate Change and Extreme Events on Rocky Intertidal Communities: Evidence From Long-Term Data Frontiers in Marine Science, 8: 642764.
Mieszkowska, N., Burrows, M.T., Pannacciulli, F.G., and Hawkins, S.J. 2014. Multidecadal signals within co-occuring intertidal barnacles Semibalanus balanoides and Chthamalus spp. linked to the Atlantic Multidecadal Oscillation Journal of Marine Systems, 133: 70–76.
Mieszkowska, N., Hawkins, S.J., Burrows, M.T., and Kendall, M.A. 2007. Long-term changes in the geographic distribution and population structures of Osilinus lineatus (Gastropoda : Trochidae) in Britain and Ireland Journal of the Marine Biological Association of the United Kingdom, 87: 537–545.
Ordnance Survey, 2016. OS Open Map - Local - Product guide. Ordnance Survey Ltd, Southampton, UK.
Padgham, M., 2021. geodist: Fast, Dependency-Free Geodesic Distance Calculations. Version 0.1.0.
Poloczanska, E.S., Hawkins, S.J., Southward, A.J., and Burrows, M.T. 2008. Modelling the response of populations of competing species to climate change Ecology, 89: 3138–3149.
R. Core Team, 2020. R: A Language and Environment for Statistical Computing
Seuront, L., Nicastro, K.R., Zardi, G.I., and Goberville, E. 2019. Decreased thermal tolerance under recurrent heat stress conditions explains summer mass mortality of the blue mussel Mytilus edulis Scientific Reports, 9: 17498.
Simpson, S.D., Jennings, S., Johnson, M.P., Blanchard, J.L., Schön, P.-J., Sims, D.W., and Genner, M.J. 2011. Continental shelf-wide response of a fish assemblage to rapid warming of the sea Current Biology, 21: 1565–1570.
Sorte, C.J.B., Davidson, V.E., Franklin, M.C., Benes, K.M., Doellman, M.M., Etter, R.J., Hannigan, R.E., Lubchenco, J., and Menge, B.A. 2017. Long-term declines in an intertidal foundation species parallel shifts in community composition Global Change Biology, 23: 341–352.
Southward, A.J., Hawkins, S.J., and Burrows, M.T. 1995. Seventy years’ observations of changes in distribution and abundance of zooplankton and intertidal organisms in the western English Channel in relation to rising sea temFperature. Journal of Thermal Biology, 20: 127–155.
Southward, A.J., and Southward, E. 1978. Recolonization of rocky shores in Cornwall after use of toxic dispersants to clean up the Torrey Canyon spill. Journal of the Fisheries Research Board of Canada, 35: 682–706.
Tobler, M.W., Kéry, M., Hui, F.K.C., Guillera‐Arroita, G., Knaus, P., and Sattler, T. 2019. Joint species distribution models with species correlations and imperfect detection Ecology, 100(8): e02754.
Venables, W.N., and Ripley, B.D., 2002. Modern Applied Statistics with S. Fourth Edition. Springer, New York.
West, V., McGregor, K, Baker, M., Ward, G., and Frost, N. in prep. Review of status and subsequent surveys of blue mussel beds in Scotland. NatureScot Research Report 1352.
Annex A: MarClim Taxa and their valid identities
Table 11. Taxa recorded during MarClim surveys in 2020, 2021 and 2022. Taxonomic information was obtained from the World Register of Marine Species (WORMS) using an R script. A complete version of this table is available as a supplementary data file, including links to the entries for each taxon in WORMS. Valid AlphaIDs are used for entries in the archived dataset, using the first of the entries for each taxon below. Abbreviations: abbr, abbreviated taxon name. Taxon names used during surveys (MCtaxon) were maintained for continuity with earlier surveys.
| MCtaxon | abbr | AphiaID | status | rank | Valid AphiaID | Valid name | Valid authority | Kingdom | Phylum | Class | Order | family |
|---|---|---|---|---|---|---|---|---|---|---|---|---|
| Lecanora spp | Lecan | 147715 | accepted | Genus | 147715 | Lecanora | Ach., 1809 | Fungi | Ascomycota | Lecanoromycetes | Lecanorales | Lecanoraceae |
| Lichina pygmaea | Lipyg | 147720 | accepted | Species | 147720 | Lichina pygmaea | (Lightf.) C. Agardh, 1817 | Fungi | Ascomycota | Lichinomycetes | Lichinales | Lichinaceae |
| Verrucaria maura | Vemau | 147758 | junior objective synonym | Species | 1609738 | Hydropunctaria maura | (Wahlenb. ex Ach.) C. Keller, Gueidan & Thüs, 2009 | Fungi | Ascomycota | Eurotiomycetes | Verrucariales | Verrucariaceae |
| Verrucaria mucosa | Vemuc | 147760 | junior objective synonym | Species | 1607307 | Wahlenbergiella mucosa | (Wahlenb. ex Ach.) Gueidan & Thüs, 2009 | Fungi | Ascomycota | Eurotiomycetes | Verrucariales | Verrucariaceae |
| Xanthoria parietina | Xapar | 147709 | accepted | Species | 147709 | Xanthoria parietina | (L.) Beltr., 1858 | Fungi | Ascomycota | Lecanoromycetes | Teloschistales | Teloschistaceae |
| Cladophora rupestris | Clrup | 145064 | accepted | Species | 145064 | Cladophora rupestris | (Linnaeus) Kützing, 1843 | Plantae | Chlorophyta | Ulvophyceae | Cladophorales | Cladophoraceae |
| Cladophora sericea | Clser | 145065 | accepted | Species | 145065 | Cladophora sericea | (Hudson) Kützing, 1843 | Plantae | Chlorophyta | Ulvophyceae | Cladophorales | Cladophoraceae |
| Codium spp | Cospp | 143999 | accepted | Genus | 143999 | Codium | Stackhouse, 1797 | Plantae | Chlorophyta | Ulvophyceae | Bryopsidales | Codiaceae |
| Ulva compressa / intestinalis | Ulcom | 234462 | accepted | Species | 234462 | Ulva compressa | Linnaeus, 1753 | Plantae | Chlorophyta | Ulvophyceae | Ulvales | Ulvaceae |
| Ulva lactuca | Ullac | 145984 | accepted | Species | 145984 | Ulva lactuca | Linnaeus, 1753 | Plantae | Chlorophyta | Ulvophyceae | Ulvales | Ulvaceae |
| Alaria esculenta | Alesc | 145716 | accepted | Species | 145716 | Alaria esculenta | (Linnaeus) Greville, 1830 | Chromista | Ochrophyta | Phaeophyceae | Laminariales | Alariaceae |
| Ascophyllum nodosum | Asnod | 145541 | accepted | Species | 145541 | Ascophyllum nodosum | (Linnaeus) Le Jolis, 1863 | Chromista | Ochrophyta | Phaeophyceae | Fucales | Fucaceae |
| Chorda filum | Chfil | 145722 | accepted | Species | 145722 | Chorda filum | (Linnaeus) Stackhouse, 1797 | Chromista | Ochrophyta | Phaeophyceae | Chordales | Chordaceae |
| Dictyota dichotoma | Didic | 145367 | accepted | Species | 145367 | Dictyota dichotoma | (Hudson) J.V.Lamouroux, 1809 | Chromista | Ochrophyta | Phaeophyceae | Dictyotales | Dictyotaceae |
| Fucus serratus | Fuser | 145546 | accepted | Species | 145546 | Fucus serratus | Linnaeus, 1753 | Chromista | Ochrophyta | Phaeophyceae | Fucales | Fucaceae |
| Fucus spiralis | Fuspi | 145547 | accepted | Species | 145547 | Fucus spiralis | Linnaeus, 1753 | Chromista | Ochrophyta | Phaeophyceae | Fucales | Fucaceae |
| Fucus vesiculosus | Fuves | 145548 | accepted | Species | 145548 | Fucus vesiculosus | Linnaeus, 1753 | Chromista | Ochrophyta | Phaeophyceae | Fucales | Fucaceae |
| Fucus vesiculosus linearis | Fulin | 162548 | accepted | Variety | 162548 | Fucus vesiculosus var. linearis | (Hudson) Kützing, 1849 | Chromista | Ochrophyta | Phaeophyceae | Fucales | Fucaceae |
| Halidrys siliquosa | Hasil | 145540 | accepted | Species | 145540 | Halidrys siliquosa | (Linnaeus) Lyngbye, 1819 | Chromista | Ochrophyta | Phaeophyceae | Fucales | Sargassaceae |
| Himanthalia elongata | Hielo | 145551 | accepted | Species | 145551 | Himanthalia elongata | (Linnaeus) S.F.Gray, 1821 | Chromista | Ochrophyta | Phaeophyceae | Fucales | Himanthaliaceae |
| Laminaria digitata | Ladig | 145724 | accepted | Species | 145724 | Laminaria digitata | (Hudson) J.V.Lamouroux, 1813 | Chromista | Ochrophyta | Phaeophyceae | Laminariales | Laminariaceae |
| Laminaria hyperborea | Lahyp | 145725 | accepted | Species | 145725 | Laminaria hyperborea | (Gunnerus) Foslie, 1884 | Chromista | Ochrophyta | Phaeophyceae | Laminariales | Laminariaceae |
| Laminaria saccharina | Salat | 145730 | unaccepted | Species | 234483 | Saccharina latissima | (Linnaeus) C.E.Lane, C.Mayes, Druehl & G.W.Saunders, 2006 | Chromista | Ochrophyta | Phaeophyceae | Laminariales | Laminariaceae |
| Leathesia difformis | Ledif | 144953 | unaccepted | Species | 494940 | Leathesia marina | (Lyngbye) Decaisne, 1842 | Chromista | Ochrophyta | Phaeophyceae | Ectocarpales | Chordariaceae |
| Pelvetia canaliculata | Pecan | 145550 | accepted | Species | 145550 | Pelvetia canaliculata | (Linnaeus) Decaisne & Thuret, 1845 | Chromista | Ochrophyta | Phaeophyceae | Fucales | Fucaceae |
| Pilayella littoralis | Pilit | 145482 | unaccepted | Species | 157188 | Pylaiella littoralis | (Linnaeus) Kjellman, 1872 | Chromista | Ochrophyta | Phaeophyceae | Ectocarpales | Pilayellaceae |
| Scytosiphon lomentaria | Sclom | 145869 | accepted | Species | 145869 | Scytosiphon lomentaria | (Lyngbye) Link, 1833 | Chromista | Ochrophyta | Phaeophyceae | Ectocarpales | Scytosiphonaceae |
| Ceramium / Polysiphonia turf | CeCer | 143834 | accepted | Genus | 143834 | Ceramium | Roth, 1797 | Plantae | Rhodophyta | Florideophyceae | Ceramiales | Ceramiaceae |
| Ceramium / Polysiphonia turf | CeCer | 1359839 | unaccepted | Genus | 144217 | Palmaria | Stackhouse, 1802 | Plantae | Rhodophyta | Florideophyceae | Palmariales | Palmariaceae |
| Chondrus crispus | Chcri | 145625 | accepted | Species | 145625 | Chondrus crispus | Stackhouse, 1797 | Plantae | Rhodophyta | Florideophyceae | Gigartinales | Gigartinaceae |
| Corallina officinalis | Cooff | 145108 | accepted | Species | 145108 | Corallina officinalis | Linnaeus, 1758 | Plantae | Rhodophyta | Florideophyceae | Corallinales | Corallinaceae |
| Dilsea carnosa | Dicar | 145222 | accepted | Species | 145222 | Dilsea carnosa | (Schmidel) Kuntze, 1898 | Plantae | Rhodophyta | Florideophyceae | Gigartinales | Dumontiaceae |
| Dumontia incrassata | Duinc | 157352 | unaccepted | Species | 145228 | Dumontia contorta | (S.G.Gmelin) Ruprecht, 1850 | Plantae | Rhodophyta | Florideophyceae | Gigartinales | Dumontiaceae |
| Lomentaria articulata | Loart | 145821 | accepted | Species | 145821 | Lomentaria articulata | (Hudson) Lyngbye, 1819 | Plantae | Rhodophyta | Florideophyceae | Rhodymeniales | Lomentariaceae |
| Mastocarpus stellatus | Maste | 145650 | accepted | Species | 145650 | Mastocarpus stellatus | (Stackhouse) Guiry, 1984 | Plantae | Rhodophyta | Florideophyceae | Gigartinales | Phyllophoraceae |
| Membranoptera alata | Meala | 144758 | accepted | Species | 144758 | Membranoptera alata | (Hudson) Stackhouse, 1809 | Plantae | Rhodophyta | Florideophyceae | Ceramiales | Delesseriaceae |
| Osmundia spp | Osspp | 143921 | accepted | Genus | 143921 | Osmundea | Stackhouse, 1809 | Plantae | Rhodophyta | Florideophyceae | Ceramiales | Rhodomelaceae |
| Osmundia spp | Osspp | 143920 | accepted | Genus | 143920 | Osmundaria | J.V.Lamouroux, 1813 | Plantae | Rhodophyta | Florideophyceae | Ceramiales | Rhodomelaceae |
| Palmaria palmata | Papal | 145771 | accepted | Species | 145771 | Palmaria palmata | (Linnaeus) F.Weber & D.Mohr, 1805 | Plantae | Rhodophyta | Florideophyceae | Palmariales | Palmariaceae |
| Polysiphonia lanosa | Polan | 144647 | unaccepted | Species | 475211 | Vertebrata lanosa | (Linnaeus) T.A.Christensen, 1967 | Plantae | Rhodophyta | Florideophyceae | Ceramiales | Rhodomelaceae |
| Porphyra sp | Posp | 143808 | accepted | Genus | 143808 | Porphyra | C.Agardh, 1824 | Plantae | Rhodophyta | Bangiophyceae | Bangiales | Bangiaceae |
| Halichondria panicea | Hapan | 132627 | alternate representation | Species | 165853 | Halichondria (Halichondria) panicea | (Pallas, 1766) | Animalia | Porifera | Demospongiae | Suberitida | Halichondriidae |
| Hymeniacidon sp. | Hysp | 131808 | accepted | Genus | 131808 | Hymeniacidon | Bowerbank, 1858 | Animalia | Porifera | Demospongiae | Suberitida | Halichondriidae |
| Actinia equina | Acequ | 100803 | accepted | Species | 100803 | Actinia equina | (Linnaeus, 1758) | Animalia | Cnidaria | Anthozoa | Actiniaria | Actiniidae |
| Anemonia sulcata | Ansul | 231858 | accepted | Species | 231858 | Anemonia sulcata | (Pennant, 1777) | Animalia | Cnidaria | Anthozoa | Actiniaria | Actiniidae |
| Dynamena pumila | Dypum | 117888 | accepted | Species | 117888 | Dynamena pumila | (Linnaeus, 1758) | Animalia | Cnidaria | Hydrozoa | Leptothecata | Sertulariidae |
| Pomatoceros triqueter | Potri | 131027 | unaccepted | Species | 555935 | Spirobranchus triqueter | (Linnaeus, 1758) | Animalia | Annelida | Polychaeta | Sabellida | Serpulidae |
| Spirorbis spirorbis | Spspi | 131237 | alternate repr. | Species | 334842 | Spirorbis (Spirorbis) spirorbis | (Linnaeus, 1758) | Animalia | Annelida | Polychaeta | Sabellida | Serpulidae |
| Balanus crenatus | Bacre | 106215 | accepted | Species | 106215 | Balanus crenatus | Bruguière, 1789 | Animalia | Arthropoda | Thecostraca | Balanomorpha | Balanidae |
| Carcinus maenas | Camae | 107381 | accepted | Species | 107381 | Carcinus maenas | (Linnaeus, 1758) | Animalia | Arthropoda | Malacostraca | Decapoda | Carcinidae |
| Chthamalus montagui | Chmon | 106230 | accepted | Species | 106230 | Chthamalus montagui | Southward, 1976 | Animalia | Arthropoda | Thecostraca | Balanomorpha | Chthamalidae |
| Chthamalus stellatus | Chste | 106231 | accepted | Species | 106231 | Chthamalus stellatus | (Poli, 1791) | Animalia | Arthropoda | Thecostraca | Balanomorpha | Chthamalidae |
| Elminius modestus | Elmod | 106209 | unaccepted | Species | 712167 | Austrominius modestus | (Darwin, 1854) | Animalia | Arthropoda | Thecostraca | Balanomorpha | Elminiidae |
| Semibalanus balanoides | Sebal | 106210 | accepted | Species | 106210 | Semibalanus balanoides | (Linnaeus, 1767) | Animalia | Arthropoda | Thecostraca | Balanomorpha | Balanidae |
| Gibbula cineraria | Gicin | 141782 | unaccepted | Species | 1039839 | Steromphala cineraria | (Linnaeus, 1758) | Animalia | Mollusca | Gastropoda | Trochida | Trochidae |
| Gibbula umbilicalis | Giumb | 141801 | unaccepted | Species | 1039850 | Steromphala umbilicalis | (da Costa, 1778) | Animalia | Mollusca | Gastropoda | Trochida | Trochidae |
| Littorina littorea | Lilit | 140262 | accepted | Species | 140262 | Littorina littorea | (Linnaeus, 1758) | Animalia | Mollusca | Gastropoda | Littorinimorpha | Littorinidae |
| Littorina neritoides | Mener | 151586 | unaccepted | Species | 140266 | Melarhaphe neritoides | (Linnaeus, 1758) | Animalia | Mollusca | Gastropoda | Littorinimorpha | Littorinidae |
| Littorina obtusata | Liobt | 140263 | accepted | Species | 140263 | Littorina obtusata | (Linnaeus, 1758) | Animalia | Mollusca | Gastropoda | Littorinimorpha | Littorinidae |
| Littorina rudis | Lirud | 151580 | unaccepted | Species | 140264 | Littorina saxatilis | (Olivi, 1792) | Animalia | Mollusca | Gastropoda | Littorinimorpha | Littorinidae |
| Mytilus edulis | Myspp | 140480 | accepted | Species | 140480 | Mytilus edulis | Linnaeus, 1758 | Animalia | Mollusca | Bivalvia | Mytilida | Mytilidae |
| Nucella lapillus | Nulap | 140403 | accepted | Species | 140403 | Nucella lapillus | (Linnaeus, 1758) | Animalia | Mollusca | Gastropoda | Neogastropoda | Muricidae |
| Patella ulyssiponensis | Pauly | 140684 | accepted | Species | 140684 | Patella ulyssiponensis | Gmelin, 1791 | Animalia | Mollusca | Gastropoda | NA | Patellidae |
| Patella vulgata | Pavul | 140685 | accepted | Species | 140685 | Patella vulgata | Linnaeus, 1758 | Animalia | Mollusca | Gastropoda | NA | Patellidae |
| Tectura testudinalis | Tetes | 140276 | unaccepted | Species | 234208 | Testudinalia testudinalis | (O. F. Müller, 1776) | Animalia | Mollusca | Gastropoda | NA | Lottiidae |
| Electra pilosa | Elpil | 111355 | accepted | Species | 111355 | Electra pilosa | (Linnaeus, 1767) | Animalia | Bryozoa | Gymnolaemata | Cheilostomatida | Electridae |
| Flustrellidra hispida | Flhis | 111621 | accepted | Species | 111621 | Flustrellidra hispida | (Fabricius, 1780) | Animalia | Bryozoa | Gymnolaemata | Ctenostomatida | Flustrellidridae |
| Membranipora membranacea | Memem | 111411 | accepted | Species | 111411 | Membranipora membranacea | (Linnaeus, 1767) | Animalia | Bryozoa | Gymnolaemata | Cheilostomatida | Membraniporidae |
| Lipophrys pholis | Lipho | 126768 | accepted | Species | 126768 | Lipophrys pholis | (Linnaeus, 1758) | Animalia | Chordata | Teleostei | Blenniiformes | Blenniidae |
| Pholis gunnellus | Phgun | 126996 | accepted | Species | 126996 | Pholis gunnellus | (Linnaeus, 1758) | Animalia | Chordata | Teleostei | Perciformes | Pholidae |
| Calliostoma zizyphynum | Caziz | 141767 | accepted | Species | 141767 | Calliostoma zizyphinum | (Linnaeus, 1758) | Animalia | Mollusca | Gastropoda | Trochida | Calliostomatidae |
| Asterias rubens | Asrub | 123776 | accepted | Species | 123776 | Asterias rubens | Linnaeus, 1758 | Animalia | Echinodermata | Asteroidea | Forcipulatida | Asteriidae |
| Porcellana | Porce | 106838 | accepted | Genus | 106838 | Porcellana | Lamarck, 1801 | Animalia | Arthropoda | Malacostraca | Decapoda | Porcellanidae |
| Porcellana | Porce | 465291 | unaccepted | Genus | 138166 | Marginella | Lamarck, 1799 | Animalia | Mollusca | Gastropoda | Neogastropoda | Marginellidae |
| Leptasterias | Lepta | 123222 | accepted | Genus | 123222 | Leptasterias | Verrill, 1866 | Animalia | Echinodermata | Asteroidea | Forcipulatida | Asteriidae |
| Prasiola spp. | Prspp | 144234 | accepted | Genus | 144234 | Prasiola | Meneghini, 1838 | Plantae | Chlorophyta | Trebouxiophyceae | Prasiolales | Prasiolaceae |
| Ramalina spp. | Raspp | 147712 | accepted | Genus | 147712 | Ramalina | Ach., 1809 | Fungi | Ascomycota | Lecanoromycetes | Lecanorales | Ramalinaceae |
| Ocenebra erinaceus | Oceri | 140405 | accepted | Species | 140405 | Ocenebra erinaceus | (Linnaeus, 1758) | Animalia | Mollusca | Gastropoda | Neogastropoda | Muricidae |
| Psammechinus miliaris | Psmil | 124319 | accepted | Species | 124319 | Psammechinus miliaris | (P.L.S. Müller, 1771) | Animalia | Echinodermata | Echinoidea | Camarodonta | Parechinidae |
| Zostera | Zoste | 144233 | accepted | Genus | 144233 | Zostera | L. | Plantae | Tracheophyta | Magnoliopsida | Alismatales | Zosteraceae |
| Audouinella floridula | Auflo | 146528 | unaccepted | Species | 145777 | Rhodothamniella floridula | (Dillwyn) Feldmann, 1978 | Plantae | Rhodophyta | Florideophyceae | Acrochaetiales | Audouinellaceae |
| Cystodeira nodicaulis (in upper pool) | Cynod | 145526 | unaccepted | Species | 1465502 | Treptacantha nodicaulis | (Withering) Orellana & Sansón, 2019 | Chromista | Ochrophyta | Phaeophyceae | Fucales | Sargassaceae |
| Colpomenia peregrina | Coper | 145856 | accepted | Species | 145856 | Colpomenia peregrina | Sauvageau, 1927 | Chromista | Ochrophyta | Phaeophyceae | Ectocarpales | Scytosiphonaceae |
| Furcellaria lumbricalis | Fulum | 145620 | accepted | Species | 145620 | Furcellaria lumbricalis | (Hudson) J.V.Lamouroux, 1813 | Plantae | Rhodophyta | Florideophyceae | Gigartinales | Furcellariaceae |
| Plumaria plumosa | Plplu | 144603 | accepted | Species | 144603 | Plumaria plumosa | (Hudson) Kuntze, 1891 | Plantae | Rhodophyta | Florideophyceae | Ceramiales | Wrangeliaceae |
| Sargassum muticum | Samut | 494791 | accepted | Species | 494791 | Sargassum muticum | (Yendo) Fensholt, 1955 | Chromista | Ochrophyta | Phaeophyceae | Fucales | Sargassaceae |
| Sabellaria alveolata | Saalv | 130866 | accepted | Species | 130866 | Sabellaria alveolata | (Linnaeus, 1767) | Animalia | Annelida | Polychaeta | NA | Sabellariidae |
| Fucus ceranoides | Fucer | 145542 | accepted | Species | 145542 | Fucus ceranoides | Linnaeus, 1753 | Chromista | Ochrophyta | Phaeophyceae | Fucales | Fucaceae |
| Aplysia | Aplys | 137654 | accepted | Genus | 137654 | Aplysia | Linnaeus, 1767 | Animalia | Mollusca | Gastropoda | Aplysiida | Aplysiidae |
| Aplysia | Aplys | 828531 | unaccepted | Genus | 131975 | Aplysina | Nardo, 1834 | Animalia | Porifera | Demospongiae | Verongiida | Aplysinidae |
| Urticina | Urtic | 100706 | accepted | Genus | 100706 | Urticina | Ehrenberg, 1834 | Animalia | Cnidaria | Anthozoa | Actiniaria | Actiniidae |
Annex B: Survey site locations
Table 12. Sites surveyed in 2020, 2021 and 2022, showing planned times of arrival and departure and actual times of arrival. NA in actual time of arrival column denotes the planned site was not surveyed, while missing planned times show sites that were not included in the original plan. Expected height and time of low water are given for the nearest tidal reference location. ‘Order’ denotes the sequence of photography (H, high; U, upper; M, mid; W, lower; L, low) with asterisks showing where shore levels were not photographed or were unusually inaccessible. If the site is within a MPA, the name of the MPA is given. Otherwise, this is left blank. – denotes a blank cell.
| Site | Date | Area | Lat | Long | MPA | Time Arrived | Time LW | Height LW (m) | Order | Weather | Weather – wind and visibility |
|---|---|---|---|---|---|---|---|---|---|---|---|
| Clachan Sound | Friday 13/03/2020 | North Argyll | 56.31693768 | -5.58347322 | - | 14:00 | 14:05 | 0.37 | No quadrats | Sun | L breeze |
| Ellenabeich | Friday 13/03/2020 | North Argyll | 56.29082089 | -5.63589357 | - | 15:00 | 14:05 | 0.37 | No quadrats | Sun | L breeze |
| Creagan Bridge | Wednesday 16/09/2020 | North Argyll | 56.54791059 | -5.29203321 | Loch Creran SAC | 10:30 | 11:51 | 0.82 | HMLUW | Overcast | - |
| Dunbeg NW | Wednesday 16/09/2020 | Oban | 56.451531 | -5.451773 | - | 12:00 | 12:21 | 0.91 | LMHUW | Overcast | - |
| Rubha Garbh | Wednesday 16/09/2020 | North Argyll | 56.51259437 | -5.37304819 | Loch Creran SAC | 12:50 | 12:21 | 0.91 | LMHWU | Overcast | - |
| Columba's Cave | Thursday 17/09/2020 | Mid Argyll | 55.92903094 | -5.60064395 | - | 09:45 | 11:42 | 0.21 | HMUWL | Overcast | Hazy sun, calm |
| Taynish | Thursday 17/09/2020 | Mid Argyll | 55.99797841 | -5.65332652 | Ulva, Danna and the McCormaig Isles SSSI | 11:10 | 11:42 | 0.21 | HMLUW | Overcast | Hazy sun, calm |
| Loch na Cille | Thursday 17/09/2020 | Mid Argyll | 55.96054209 | -5.6954834 | Taynish Woods SSSI | 11:50 | 11:42 | 0.21 | LMHWU | Overcast | Hazy sun, calm |
| Melfort | Thursday 17/09/2020 | Mid Argyll | 56.22455698 | -5.54764593 | - | 13:40 | 11:53 | 0.47 | LMHU | Hazy sun | L breeze |
| Glengorm | Friday 18/09/2020 | North Mull | 56.64230492 | -6.18185098 | - | 10:15 | 13:34 | 0.36 | HMU | Sunny | Calm |
| Lainne Sgeir | Friday 18/09/2020 | North Mull | 56.57105598 | -6.29534799 | - | 12:30 | 13:34 | 0.36 | LMHWU | Sun | - |
| Caillich | Friday 18/09/2020 | North Mull | 56.60399593 | -6.30901694 | - | 13:45 | 13:34 | 0.36 | LMHWU | Sun | - |
| Cullipool | Saturday 19/09/2020 | North Argyll | 56.25355134 | -5.65558924 | Firth of Lorn SAC | 11:05 | 12:35 | 0.13 | HMUWL | Sunny | - |
| Ellenabeich | Saturday 19/09/2020 | North Argyll | 56.29082089 | -5.63589357 | Firth of Lorn SAC | 12:45 | 12:35 | 0.13 | LMHWU | Sun | - |
| Clachan Sound | Saturday 19/09/2020 | North Argyll | 56.31693768 | -5.58347322 | Firth of Lorn SAC | 13:40 | 12:35 | 0.13 | LMHWU | Sunny | L breeze |
| Kintra | Sunday 20/09/2020 | South Mull | 56.3473268 | -6.34763313 | - | 11:10 | 14:18 | 0.1 | HUMW | Sunny | L breeze |
| Gortein Driseach | Sunday 20/09/2020 | South Mull | 56.34805595 | -6.09024793 | - | 12:50 | 14:27 | 0.13 | HMLUW | Sunny | Breeze |
| Carsaig Bay | Sunday 20/09/2020 | South Mull | 56.31846598 | -5.96339696 | - | 14:15 | 14:08 | 0.13 | LMHWU | Hazy sun | L breeze |
| Craignure | Sunday 20/09/2020 | South Mull | 56.47051522 | -5.69572172 | - | 15:50 | 14:08 | 0.13 | LMHWU | Hazy sun | L breeze |
| Claonaig | Tuesday 22/09/2020 | Kintyre | 55.75122798 | -5.38578099 | - | 07:50 | 09:54 | 0.37 | HMUW | Overcast | Strong breeze |
| Carradale | Tuesday 22/09/2020 | Kintyre | 55.59275796 | -5.46525895 | - | 09:05 | 09:54 | 0.37 | LMHWU | Overcast | Windy |
| Campbeltown | Tuesday 22/09/2020 | Kintyre | 55.42461296 | -5.58156397 | - | 10:00 | 09:51 | 0.25 | LMHWU | Overcast | - |
| Machrihanish | Tuesday 22/09/2020 | Kintyre | 55.47643499 | -5.71333696 | - | 12:30 | 10:15 | 0.09 | MHU | Hazy sun | L breeze. Swell |
| Toward | Wednesday 23/09/2020 | Cowal | 55.86129595 | -4.97949799 | - | 08:20 | 10:43 | 0.6 | HMUW | Sunny | Calm |
| Fearnoch | Wednesday 23/09/2020 | Cowal | 55.93925695 | -5.18300397 | - | 09:50 | 10:43 | 0.6 | HMUWL | Sunny | Calm |
| Dunure Castle | Tuesday 22/06/2021 | South Ayshire | 55.405724 | -4.762685 | - | 13:50 | 16:17 | 0.31 | HMLUW | Sunny | L breeze |
| Croy | Tuesday 22/06/2021 | South Ayshire | 55.378926 | -4.773821 | - | 15:00 | 16:17 | 0.31 | HMLWU | Sunny | L breeze |
| Girvan | Tuesday 22/06/2021 | South Ayshire | 55.225663 | -4.864164 | - | 16:40 | 16:18 | 0.22 | LMHWU | Sun, Hazy | L breeze |
| Ballantrae | Tuesday 22/06/2021 | South Ayshire | 55.10412598 | -5.01282215 | - | 17:50 | 16:18 | 0.22 | LMHWU | Hazysun | L breeze |
| Corsewall Lighthouse | Wednesday 23/06/2021 | Galloway | 55.006201 | -5.160496 | - | 14:30 | 17:03 | 0.43 | HMLUW | Misty | Light air |
| Mull of Galloway | Wednesday 23/06/2021 | Galloway | 54.637623 | -4.884701 | - | 16:40 | 17:03 | 0.43 | LMHWU | Cloudy | Light breeze |
| Myroch Point | Wednesday 23/06/2021 | Galloway | 54.734262 | -4.913407 | Luce Bay and Sands SAC | 17:50 | 17:03 | 0.43 | LMHWU | Cloudy | Breeze |
| Portpatrick | Wednesday 23/06/2021 | Galloway | 54.838719 | -5.116885 | - | 19:00 | 17:03 | 0.43 | LMHWU | Cloudy | - |
| Isle of Whithorn | Thursday 24/06/2021 | Solway | 54.69569433 | -4.36058052 | - | 15:30 | 18:26 | 0.76 | HMLUW | Rain | - |
| Corseyard | Thursday 24/06/2021 | Solway | 54.81264962 | -4.203951 | Borgue Coast SSSI | 17:45 | 18:26 | 0.76 | LMHWU | Rain | - |
| Southerness | Friday 25/06/2021 | Solway | 54.870205 | -3.591841 | Solway Firth SAC, Upper Solway Flats and Marshes SSSI | 07:30 | 07:02 | 0.8 | LMHWU | Fine rain | Strong wind |
| Berwick on Tweed | Saturday 26/06/2021 | Borders/East Lothian | 55.77855617 | -1.99626365 | - | 08:30 | 10:39 | 1.03 | HMLUW | Cloudy | Windy |
| Cove | Saturday 26/06/2021 | Borders/East Lothian | 55.93940676 | -2.3456534 | - | 10:20 | 10:31 | 0.64 | LMHWU | Cloud | Wind, rain |
| Chapel Point | Saturday 26/06/2021 | Borders/East Lothian | 55.97542764 | -2.41744051 | - | 11:30 | 10:31 | 0.64 | LMHWU | Cloud | Wind, rain |
| Cockenzie | Saturday 26/06/2021 | Borders/East Lothian | 55.97432306 | -2.95029664 | Firth of Forth SSSI | 13:15 | 10:31 | 0.64 | MH | Cloudy | Windy |
| West Wemyss | Sunday 27/06/2021 | Fife | 56.144266 | -3.07885 | Firth of Forth SSSI | 09:40 | 11:17 | 0.53 | HMLUW | Hazy sun | - |
| Pittenweem | Sunday 27/06/2021 | Fife | 56.21133453 | -2.72631207 | Firth of Forth SSSI | 11:15 | 11:17 | 0.53 | LMHWU | Calm | Sunny |
| Fife Ness | Sunday 27/06/2021 | Fife | 56.28091849 | -2.58734071 | - | 12:20 | 11:31 | 0.89 | LMHWU | Sun | - |
| East Sands | Sunday 27/06/2021 | Fife | 56.33299283 | -2.77445706 | - | 13:30 | 11:31 | 0.89 | LMHWU | Hazy sun | - |
| Skye Bridge | Friday 23/07/2021 | Skye | 57.28031771 | -5.72612345 | Lochs Duich, Long and Alsh SAC | 10:20 | 13:19 | 1.03 | HMUW | Hazy | Warm |
| Murchison Memorial | Friday 23/07/2021 | Skye | 57.28079989 | -5.67199474 | Lochs Duich, Long and Alsh SAC | 11:30 | 13:19 | 1.03 | HMLUW | Sunny | Warm |
| Carbost | Friday 23/07/2021 | Skye | 57.30287122 | -6.3536098 | - | 13:15 | 12:56 | 1.17 | LMHWU | Sunny | Very warm |
| Talisker Bay | Friday 23/07/2021 | Skye | 57.28086273 | -6.46237694 | - | 14:45 | 12:56 | 1.17 | LMWU | Sunny | Very hot |
| Trumpan | Saturday 24/07/2021 | Skye | 57.55136139 | -6.65481112 | - | 11:50 | 13:55 | 0.96 | HMLUW | Sunny | Warm |
| Duntulm | Saturday 24/07/2021 | Skye | 57.68560619 | -6.34328033 | - | 14:05 | 14:10 | 0.92 | LMHWU | Sunny | Hot |
| Balmaquien | Saturday 24/07/2021 | Skye | 57.69190907 | -6.29529914 | - | 15:00 | 14:10 | 0.92 | LMHWU | Sunny | Hot |
| Staffin Slipway | Saturday 24/07/2021 | Skye | 57.63449187 | -6.20067615 | - | 16:00 | 14:10 | 0.92 | LMHWU | Sunny | Warm |
| Camusteel | Sunday 25/07/2021 | Applecross and Torridon | 57.41097967 | -5.82448754 | - | 12:10 | 14:53 | 0.98 | HMUW | Sunny intervals | Low cloud and mist |
| Lonbain | Sunday 25/07/2021 | Applecross and Torridon | 57.50844033 | -5.86568718 | - | 13:40 | 14:53 | 0.98 | HMLUW | Overcast | Breeze |
| Fearnbeg West | Sunday 25/07/2021 | Applecross and Torridon | 57.57444039 | -5.79182236 | - | 14:45 | 14:53 | 0.98 | LMHWU | Sunny | - |
| Buckie | Monday 26/07/2021 | Moray/North Aberdeenshire | 57.67932362 | -2.96993863 | - | 07:00 | 09:20 | 0.57 | HMLWU | Misty | - |
| Macduff | Monday 26/07/2021 | Moray/North Aberdeenshire | 57.67240042 | -2.48811423 | - | 08:10 | 08:57 | 0.7 | HMLWU | Overcast | - |
| Sandhaven | Monday 26/07/2021 | Moray/North Aberdeenshire | 57.69895479 | -2.06353672 | - | 09:40 | 08:32 | 0.7 | LMHWU | Misty | - |
| Roanhead | Monday 26/07/2021 | Moray/North Aberdeenshire | 57.51201857 | -1.77699524 | - | 11:00 | 09:08 | 0.58 | LMHWU | Overcast | - |
| Girdle Ness | Tuesday 27/07/2021 | South Aberdeenshire/Angus | 57.140603 | -2.048824 | - | 07:40 | 10:29 | 0.53 | HMUW | Misty | Overcast |
| Crawton | Tuesday 27/07/2021 | South Aberdeenshire/Angus | 56.906722 | -2.201132 | - | 09:10 | 10:29 | 0.53 | HMLWU | Thunder | Lightning |
| Johnshaven | Tuesday 27/07/2021 | South Aberdeenshire/Angus | 56.79326248 | -2.33228588 | - | 10:20 | 10:09 | 0.48 | LMHWU | Overcast | - |
| Auchmithie | Tuesday 27/07/2021 | South Aberdeenshire/Angus | 56.586399 | -2.516998 | Whiting Ness - Ethie Haven SSSI | 12:00 | 10:09 | 0.48 | - | - | - |
| Reiff | Saturday 21/08/2021 | Assynt | 58.070486 | -5.45574741 | - | 09:30 | 13:20 | 1.30 | HMUW | Overcast | Warm, drizzle |
| Achnahaird | Saturday 21/08/2021 | Assynt | 58.07026782 | -5.36499864 | - | 11:40 | 13:20 | 1.30 | HMLUW | Hazy sun | - |
| Clachtoll | Saturday 21/08/2021 | Assynt | 58.18930711 | -5.33946125 | - | 12:50 | 13:20 | 1.30 | LMHWU | Sunny | L breeze |
| Culkein | Saturday 21/08/2021 | Assynt | 58.24465717 | -5.34062407 | - | 14:10 | 13:20 | 1.30 | LMHWU | Overcast | L breeze |
| Sheigra | Sunday 22/08/2021 | NW | 58.48845941 | -5.12053851 | - | 11:20 | 14:20 | 1.00 | HMUW | Sunny | - |
| Oldshoremore South | Sunday 22/08/2021 | NW | 58.47543141 | -5.08765009 | - | 13:15 | 14:20 | 1.00 | HMLUW | Hazy sun | Breeze |
| Foindle | Sunday 22/08/2021 | NW | 58.39176491 | -5.09075813 | Loch Laxford SAC | 14:20 | 14:20 | 1.00 | LMHWU | Hazy sun | Breeze |
| Fanagmore | Sunday 22/08/2021 | NW | 58.398613 | -5.11912259 | Loch Laxford SAC | 15:20 | 14:20 | 1.00 | LMHWU | Hazy sun | - |
| Sangobeg | Monday 23/08/2021 | Loch Eriboll | 58.55755001 | -4.7039135 | - | 12:20 | 15:24 | 0.86 | HMUW | Sunny | No breeze |
| Rispond Outer | Monday 23/08/2021 | Loch Eriboll | 58.54832095 | -4.65832198 | - | 13:20 | 15:24 | 0.86 | HMUW | Sunny | Light airs |
| Rispond Inner | Monday 23/08/2021 | Loch Eriboll | 58.5479954 | -4.66070739 | - | 14:10 | 15:24 | 0.86 | LMHWU | Overcast | L breeze |
| An-t Sron | Monday 23/08/2021 | Loch Eriboll | 58.48247021 | -4.66674613 | - | 15:35 | 15:24 | 0.86 | Sunny | Light airs | |
| Causeway | Tuesday 24/08/2021 | Tongue | 58.49857695 | -4.44858598 | - | 13:30 | 16:19 | 1.32 | HMUW | Sunny | Breeze |
| Port Vasgo | Tuesday 24/08/2021 | Tongue | 58.55088397 | -4.43246196 | - | 14:45 | 16:19 | 1.32 | HMLWU | Sunny | - |
| Skerray | Tuesday 24/08/2021 | Tongue | 58.54337865 | -4.30544134 | - | 16:20 | 16:19 | 1.32 | LMHWU | Sunny | L breeze |
| Portskerra | Tuesday 24/08/2021 | Tongue | 58.56739799 | -3.94437594 | - | 18:00 | 16:19 | 1.32 | LMHWU | Sunny | L breeze |
| Fresgoe | Wednesday 25/08/2021 | N Coast | 58.56692492 | -3.79130898 | - | 14:40 | 17:19 | 1.29 | HMLUW | Overcast | Mist |
| Murkle Bay West | Wednesday 25/08/2021 | N Coast | 58.60720374 | -3.42999162 | - | 16:30 | 17:19 | 1.29 | LMHWU | Overcast | Drizzle, breeze |
| Ness of Duncansby | Wednesday 25/08/2021 | N Coast | 58.6474854 | -3.04925591 | - | 18:00 | 17:47 | 1.24 | LMH | Overcast | Breezy |
| Wick (North Head) | Thursday 26/08/2021 | Caithness | 58.44273998 | -3.05763387 | - | 06:30 | 08:19 | 0.62 | HMLUW | Overcast | Breeze |
| Latheronwheel | Thursday 26/08/2021 | Caithness | 58.26930131 | -3.38089186 | East Caithness Cliffs SAC | 08:10 | 08:49 | 0.50 | LMHWU | Overcast | Light airs |
| Berriedale | Thursday 26/08/2021 | Caithness | 58.18435642 | -3.49376072 | East Caithness Cliffs SAC | 09:20 | 08:49 | 0.50 | LMHWU | Hazy sun | L breeze |
| Helmsdale | Friday 27/08/2021 | Sutherland and S | 58.11416334 | -3.64319321 | - | 08:00 | 09:21 | 0.72 | HMUW | Overcast | Slight breeze |
| Brora | Friday 27/08/2021 | Sutherland and S | 58.0063346 | -3.84529104 | - | 09:20 | 09:21 | 0.72 | HMLUW | Hazy sun | No breeze |
| Tarbat Ness | Friday 27/08/2021 | Sutherland and S | 57.8672329 | -3.77121094 | - | 11:00 | 09:49 | 1.03 | LMHWU | Sunny | Breezy |
| Port Nis | Sunday 19/09/2021 | Lewis | 58.48918495 | -6.22553235 | - | 09:55 | 12:39 | 1.13 | HMLUW | Overcast | Light breeze, rain |
| Borve Melbost | Sunday 19/09/2021 | Lewis | 58.42911696 | -6.44363056 | - | 11:15 | 12:22 | 1.13 | HMLWU | Sunny | Breezy |
| Tiumpan Head | Sunday 19/09/2021 | Lewis | 58.25820962 | -6.13700311 | - | 12:50 | 13:03 | 1.26 | LMHWU | Sunny | Windy |
| Port Nan Giuran | Sunday 19/09/2021 | Lewis | 58.25589823 | -6.16757526 | - | 13:40 | 13:03 | 1.26 | LMHWU | Showers | - |
| Mealasta | Monday 20/09/2021 | Harris N | 58.1982366 | -6.36052215 | - | 10:55 | 13:13 | 0.96 | HMU | Wet | Windy |
| Crowlista | Monday 20/09/2021 | Harris N | 58.19124861 | -7.04606485 | - | 12:15 | 13:13 | 0.96 | HMLWU | Overcast | Windy, occasional rain |
| Miavaig Pier | Monday 20/09/2021 | Harris N | 58.20131888 | -6.95277879 | - | 13:25 | 13:13 | 0.96 | LMHWU | Overcast, Sunny | Light breeze |
| Caolas an Scarp | Tuesday 21/09/2021 | Harris S | 57.99912726 | -7.09906857 | - | 10:45 | 13:30 | 0.82 | HM | Overcast | Windy, big swell |
| Abhainn Suidhe | Tuesday 21/09/2021 | Harris S | 57.96533134 | -6.99935812 | - | 11:50 | 13:30 | 0.82 | HMLUW | Overcast | Light wind |
| Aird Adhanais | Tuesday 21/09/2021 | Harris S | 57.85417649 | -6.68294362 | - | 13:40 | 14:04 | 1.00 | LMHWU | Rain | Wind |
| Scalpay Village | Tuesday 21/09/2021 | Harris S | 57.86746147 | -6.69406842 | - | 14:45 | 14:04 | 1.00 | LMHWU | Strong wind | Occasional rain |
| Rubha na Port Scolpaig | Wednesday 22/09/2021 | N Uist | 57.58772082 | -7.52643985 | Balranald Bog and Loch nam Feithean SSSI | 12:00 | 14:10 | 0.80 | HMLUW | Sunny, partly cloudy | Strong breeze |
| Hougharry | Wednesday 22/09/2021 | N Uist | 57.61113575 | -7.51839071 | Balranald Bog and Loch nam Feithean SSSI | 13:15 | 14:10 | 0.80 | LMHWU | Sun | Light wind |
| Bagh a Chaise Exposed | Wednesday 22/09/2021 | N Uist | 57.64558093 | -7.07049399 | Loch an Duin SSSI | 14:50 | 14:33 | 0.85 | LMHWU | Overcast, patchy cloud | Light wind |
| Loch Amhlasaraidh | Wednesday 22/09/2021 | N Uist | 57.64957541 | -7.10600283 | Loch an Duin SSSI | 15:40 | 14:33 | 0.85 | LMHU/W | Sun | Windy |
| Rubha Aird na Machrach | Thursday 23/09/2021 | South Uist N | 57.38401626 | -7.43103552 | - | 12:00 | 14:51 | 0.68 | HMLWU | Overcast | Light breeze |
| Loch Carnan | Thursday 23/09/2021 | South Uist N | 57.36811671 | -7.27546463 | - | 13:20 | 15:01 | 0.83 | HMLWU | Overcast | Light breeze |
| Loch Sgioport | Thursday 23/09/2021 | South Uist N | 57.33187873 | -7.27990318 | - | 14:40 | 14:58 | 0.71 | LMHWU | Overcast | Breeze |
| Rubha Aird Mhicheal | Thursday 23/09/2021 | South Uist N | 57.2746735 | -7.42674608 | - | 16:10 | 14:51 | 0.68 | LMHWU | Overcast | Windy, occasional rain |
| Trolaisgeir | Friday 24/09/2021 | South Uist S | 57.22035952 | -7.4346332 | - | 12:45 | 15:24 | 0.8 | HMLUW | Overcast | Windy |
| Smeircleit | Friday 24/09/2021 | South Uist S | 57.11220506 | -7.39186982 | Sound of Barra SAC | 14:15 | 15:24 | 0.8 | HMLWU | Overcast | Wind |
| Eriskay Outer | Friday 24/09/2021 | South Uist S | 57.08716915 | -7.27004732 | Sound of Barra SAC | 15:40 | 15:21 | 0.96 | LMHWU | Overcast | - |
| Acarsaid | Friday 24/09/2021 | South Uist S | 57.06722039 | -7.29855166 | Sound of Barra SAC | 17:10 | 15:21 | 0.96 | no quadrats | Overcast | - |
| Vatersay Causeway West | Saturday 25/09/2021 | Barra | 56.94618864 | -7.53417442 | - | 14:25 | 15:41 | 1.12 | HMLWU | Overcast, hazy sun | Light breeze |
| Borve Point Outer | Saturday 25/09/2021 | Barra | 56.98531151 | -7.5279936 | - | 15:30 | 15:41 | 1.12 | LHWU | Hazy sun | Windy |
| Leinis | Saturday 25/09/2021 | Barra | 56.96234342 | -7.42469972 | - | 16:55 | 15:52 | 1.17 | LHWU | Overcast | Breezy |
| Mannal | Wednesday 29/06/2022 | Tiree | 56.45725639 | -6.89102973 | Sleibhtean agus Cladach Thiriodh SSSI | 11:40 | 13:02 | 1.08 | HMLUW | Overcast | - |
| Balephuil | Wednesday 29/06/2022 | Tiree | 56.45120222 | -6.93966572 | - | 12:35 | 13:02 | 1.08 | HMLWU | Sunny | Breezy |
| Ard Mor | Wednesday 29/06/2022 | Tiree | 56.52604214 | -6.8881948 | - | 13:50 | 13:02 | 1.08 | LMHWU | Sunny | Breezy |
| Urvaig | Wednesday 29/06/2022 | Tiree | 56.55648395 | -6.75503779 | - | 15:20 | 13:02 | 1.08 | MHWU | Sunny | Breezy |
| Ben Feall | Saturday 02/07/2022 | Coll | 56.60180155 | -6.65185932 | - | 11:50 | 14:50 | 1.10 | HMUW | Overcast | Breeze |
| Gortan | Saturday 02/07/2022 | Coll | 56.58319138 | -6.60404669 | - | 13:40 | 14:50 | 1.10 | HMLWU | Hazy sun | - |
| Sorisdale | Saturday 02/07/2022 | Coll | 56.67931069 | -6.45435696 | - | 15:40 | 14:50 | 1.10 | LMHWU | Sunny | Breezy |
| Arinagour | Saturday 02/07/2022 | Coll | 56.61517664 | -6.5229294 | - | 16:40 | 14:50 | 1.10 | LMHWU | Hazy sun | - |
| Aros Bay | Friday 15/07/2022 | Islay | 55.694022 | -6.031524 | - | 10:20 | 12:56 | 0.00 | HMUW | Hazy sun | Light breeze |
| Dunyvaig Castle | Friday 15/07/2022 | Islay | 55.63352502 | -6.12340397 | - | 11:50 | 13:18 | 0.37 | HMLWU | Sunny | Breeze |
| Kintra Islay | Friday 15/07/2022 | Islay | 55.65451158 | -6.2667977 | - | 13:00 | 13:18 | 0.37 | LMHWU | Sunny | Windy |
| Laggan Point | Friday 15/07/2022 | Islay | 55.71558293 | -6.32328395 | - | 14:25 | 13:57 | 0.45 | LMHWU | Sun | Breezy |
| Port Wemyss | Saturday 16/07/2022 | Islay | 55.67457075 | -6.50392578 | - | 11:10 | 14:28 | 0.56 | LMHWU | Hazy sun | Light breeze |
| Coul Point | Saturday 16/07/2022 | Islay | 55.78884142 | -6.48499159 | - | 12:45 | 14:28 | 0.56 | HMWU | Overcast | Breeze |
| Sanaigmore | Saturday 16/07/2022 | Islay | 55.85469657 | -6.41715609 | - | 14:00 | 14:28 | 0.56 | LMHWU | Hazy sun | Breeze |
| Ardnave | Saturday 16/07/2022 | Islay | 55.88017182 | -6.35582744 | Gruinart Flats SSSI | 15:40 | 14:28 | 0.56 | LMHWU | Overcast | Breeze |
| Quoyness | Thursday 11/08/2022 | Orkney Hoy | 58.905607 | -3.294563 | - | 12:30 | 15:30 | 0.89 | HMUW | Overcast | Still |
| Muckle Head | Thursday 11/08/2022 | Orkney Hoy | 58.92689896 | -3.37041831 | - | 14:00 | 15:30 | 0.89 | HMLWU | Drizzle | Calm |
| Longhope | Thursday 11/08/2022 | Orkney Hoy | 58.79913712 | -3.21308684 | - | 15:30 | 15:45 | 0.65 | HML | Overcast | - |
| Bight of Lotheran | Friday 12/08/2022 | Orkney Sanday | 59.27562 | -2.399223 | Sanday SAC, East Sanday Coast SSSI | 14:50 | 17:54 | 1.00 | HMLWU | Drizzle | Breeze |
| Muckle Kiln | Friday 12/08/2022 | Orkney Sanday | 59.29023622 | -2.61591577 | - | 16:20 | 17:54 | 1.00 | HMLUW | Rain | Light breeze |
| Noust of Ayre | Friday 12/08/2022 | Orkney Sanday | 59.25642802 | -2.6115598 | - | 17:45 | 17:54 | 1.00 | LMHWU | Drizzle | - |
| Banks | Saturday 13/08/2022 | Orkney Mainland west | 59.139143 | -3.307499 | - | 14:30 | 16:55 | 0.74 | HMLUW | Overcast | L breeze |
| Bay of Skaill (North) | Saturday 13/08/2022 | Orkney Mainland west | 59.0578 | -3.3457 | - | 15:45 | 16:55 | 0.74 | HMLWU | Overcast | - |
| Point of Ness | Saturday 13/08/2022 | Orkney Mainland west | 58.950688 | -3.295876 | - | 17:10 | 16:55 | 0.74 | ExLLMHWU | Overcast | L breeze |
| Churchill Barrier No. 3 | Sunday 14/08/2022 | Orkney Mainland east | 58.87163544 | -2.91731787 | - | 06:15 | 07:48 | 0.65 | ExLLMHWU | Overcast | L breeze |
| Long Geo | Sunday 14/08/2022 | Orkney Mainland east | 58.96555667 | -2.79135464 | - | 08:25 | 07:48 | 0.65 | LHWU | Overcast | - |
| Tuquoy | Sunday 14/08/2022 | Orkney Westray | 59.27906418 | -2.95984721 | - | 18:10 | 17:15 | 0.65 | LMHWU | Overcast | Breeze |
| Bow Head | Monday 15/08/2022 | Orkney Westray | 59.356118 | -2.966279 | - | 06:00 | 06:31 | 0.16 | HMLWU | Overcast | L breeze |
| Kirbist | Monday 15/08/2022 | Orkney Westray | 59.274216 | -3.013626 | - | 07:30 | 06:31 | 0.16 | LMHWU | Overcast | - |
| Spiggie Bay N | Thursday 08/09/2022 | Shetland south | 59.945838 | -1.331263 | - | 13:10 | 13:28 | 0.57 | HMLUW | Sun | Breeze |
| Inner Tumble Wick | Thursday 08/09/2022 | Shetland south | 59.866999 | -1.305752 | - | 14:05 | 15:20 | 0.62 | HMLWU | Overcast | Windy |
| Jarlshof | Thursday 08/09/2022 | Shetland south | 59.867408 | -1.288631 | - | 15:00 | 15:20 | 0.62 | HMLWU | Overcast | Breeze |
| Northvoe | Thursday 08/09/2022 | Shetland south | 59.920601 | -1.289428 | - | 15:50 | 15:20 | 0.62 | LMHWU | Overcast | V windy, drizzle |
| Claver W | Friday 09/09/2022 | Shetland south | 60.005468 | -1.330105 | - | 11:40 | 14:12 | 0.54 | HMU | Sunny | Breeze |
| Bigton | Friday 09/09/2022 | Shetland south | 59.968642 | -1.33173 | - | 12:45 | 14:12 | 0.54 | HMUW | Sunny | Breeze |
| Sand Lodge | Friday 09/09/2022 | Shetland south | 60.006454 | -1.217015 | - | 14:30 | 16:01 | 0.68 | HMLUW | Sunny with clouds | Breeze |
| Skarfa Skerry | Friday 09/09/2022 | Shetland south | 60.138147 | -1.155839 | - | 15:50 | 16:01 | 0.68 | LMHWU | Overcast | Windy |
| Clett | Saturday 10/09/2022 | Shetland west | 60.253707 | -1.692432 | - | 12:30 | 14:52 | 0.52 | HMLUW | Sunny | L breeze |
| Ness of Melby | Saturday 10/09/2022 | Shetland west | 60.305839 | -1.663681 | Sandness Coast SSSI, Papa Stour SAC | 13:55 | 14:52 | 0.52 | LMHWU | Sunny | Breeze |
| Roesound Skerry | Saturday 10/09/2022 | Shetland west | 60.192562 | -1.403945 | - | 15:20 | 14:52 | 0.52 | LMHWU | Hazy sun | - |
| South of Badni Taing | Saturday 10/09/2022 | Shetland west | 60.168852 | -1.451085 | - | 16:15 | 14:52 | 0.52 | LMHWU | Hazy sun | L breeze |
| Utstabi Inner | Sunday 11/09/2022 | Shetland west | 60.47478136 | -1.61554962 | - | 12:45 | 15:21 | 0.41 | HMUW | Sunny | Breeze |
| Utstabi Stenness | Sunday 11/09/2022 | Shetland west | 60.473293 | -1.612378 | - | 14:00 | 15:21 | 0.41 | HMUW | Sunny | Breezy |
| Nibon | Sunday 11/09/2022 | Shetland west | 60.43885 | -1.4503 | - | 15:00 | 15:21 | 0.41 | Sunny | Breezy | |
| Voe of the Brig | Sunday 11/09/2022 | Shetland west | 60.539333 | -1.346994 | - | 16:10 | 15:42 | 0.34 | LMHWU | Sun | Breezy |
| West Sandwick Bay | Monday 12/09/2022 | Shetland Yell | 60.581209 | -1.194351 | - | 14:40 | 16:41 | 0.40 | HMLUW | Overcast | Drizzle, strong wind |
| White Wife | Monday 12/09/2022 | Shetland Yell | 60.547482 | -1.037353 | - | 15:55 | 17:31 | 0.60 | HMWU | Very windy | Rain |
| Papil Bay | Monday 12/09/2022 | Shetland Yell | 60.715174 | -1.004662 | - | 17:20 | 17:14 | 0.50 | HML | Very wet | Windy |
| Point of Coppister | Tuesday 13/09/2022 | Shetland Unst | 60.723308 | -0.955969 | - | 15:00 | 16:41 | 0.56 | HMLUW | Overcast | Windy |
| Ramnageo | Tuesday 13/09/2022 | Shetland Unst | 60.676449 | -0.852504 | Fetlar to Haroldswick MPA | 16:00 | 17:51 | 0.56 | HLLUW | Sunny | L breeze |
| The Taing | Tuesday 13/09/2022 | Shetland Unst | 60.809065 | -0.800894 | - | 17:15 | 17:51 | 0.56 | HMLUW | Sun | L breeze |
| Haroldswick | Tuesday 13/09/2022 | Shetland Yell | 60.78451 | -0.83137 | Fetlar to Haroldswick MPA | 18:00 | 17:51 | 0.56 | HMLWU | Overcast | Dry |
Table 13. MPA sites with completed MarClim surveys during 2020, 2021 and 2022. Designation for reef features is indicated in the ‘Reef’ column (SACs - Annex I - ‘Reefs’ & ‘Large shallow inlets and bays’; SSSI - ‘Rocky shore’ & ‘Tidal rapids’).
| Site | Date | Area | MPA type | Reef | MPA/Comment |
|---|---|---|---|---|---|
| Creagan Bridge | September 2020 | North Argyll | SAC | Yes | Loch Creran SAC |
| Rubha Garbh | September 2020 | North Argyll | SAC | Yes | Loch Creran SAC |
| Taynish | September 2020 | Mid Argyll | SSSI | Yes | Ulva, Danna and the McCormaig Isles SSSI |
| Loch na Cille | September 2020 | Mid Argyll | SSSI | Yes | Taynish Woods SSSI |
| Cullipool | September 2020 | North Argyll | SAC | Yes | Firth of Lorn SAC |
| Ellenabeich | September 2020 | North Argyll | SAC | Yes | Firth of Lorn SAC |
| Clachan Sound | September 2020 | North Argyll | SAC | Yes | Firth of Lorn SAC |
| Myroch Point | June 2021 | Galloway | SAC | Yes | Luce Bay and Sands SAC |
| Corseyard | June 2021 | Solway | SSSI | No | Borgue Coast SSSI |
| Southerness | June 2021 | Solway | SAC/SSSI | Yes (SAC) | Solway Firth SAC, Upper Solway Flats and Marshes SSSI |
| Cockenzie | June 2021 | Borders/East Lothian | SSSI | No | Firth of Forth SSSI |
| West Wemyss | June 2021 | Fife | SSSI | No | Firth of Forth SSSI |
| Pittenweem | June 2021 | Fife | SSSI | No | Firth of Forth SSSI |
| Skye Bridge | July 2021 | Skye | SAC | Yes | Lochs Duich, Long and Alsh SAC |
| Murchison Memorial | July 2021 | Skye | SAC | Yes | Lochs Duich, Long and Alsh SAC |
| Auchmithie | July 2021 | South Aberdeenshire/ angus | SSSI | No | Whiting Ness - Ethie Haven SSSI |
| Foindle | August 2021 | NW | SAC | Yes | Loch Laxford SAC |
| Fanagmore | August 2021 | NW | SAC | Yes | Loch Laxford SAC |
| Latheronwheel | August 2021 | Caithness | (NC) MPA | No | East Caithness Cliffs MPA |
| Berriedale | August 2021 | Caithness | (NC) MPA | No | East Caithness Cliffs MPA |
| Rubha na Port Scolpaig | September 2021 | North Uist | SAC/SSSI | No | Balranald Bog and Loch nam Feithean SSSI, North Uist Machair SAC |
| Hougharry | September 2021 | North Uist | SSSI | No | Balranald Bog and Loch nam Feithean SSSI |
| Bagh a Chaise Exposed | September 2021 | North Uist | SSSI | Yes | Loch an Duin SSSI |
| Loch Amhlasaraidh | September 2021 | North Uist | SSSI | Yes | Loch an Duin SSSI |
| Smeircleit | September 2021 | South Uist | SAC | Yes | Sound of Barra SAC |
| Eriskay Outer | September 2021 | South Uist | SAC | Yes | Sound of Barra SAC |
| Acarsaid | September 2021 | South Uist | SAC | Yes | Sound of Barra SAC |
| Mannal | June 2022 | Tiree | SSSI | No | Sleibhtean agus Cladach Thiriodh SSSI, |
| Ard Mor | June 2022 | Tiree | SSSI | No | Sleibhtean agus Cladach Thiriodh SSSI |
| Urvaig | June 2022 | Tiree | SSSI | No | Sleibhtean agus Cladach Thiriodh SSSI |
| Ardnave | July 2022 | Islay | SSSI | No | Gruinart Flats SSSI |
| Bight of Lotheran | August 2022 | Orkney Sanday | SAC/SSSI | Yes (both) | Sanday SAC, East Sanday Coast SSSI |
| Ness of Melby | September 2022 | Shetland west | SAC/SSSI | Yes (both) | Sandness Coast SSSI, Papa Stour SAC |
| Ramnageo | September 2022 | Shetland Unst | MPA | No | Fetlar to Haroldswick MPA |
| Haroldswick | September 2022 | Shetland Yell | MPA | No | Fetlar to Haroldswick MPA |
Annex C: Abundance Category definitions
Table 14: Abundance scales used for intertidal organisms, after Crisp and Southward (1958) modified by Hiscock (1981). Abbreviations: Ex, Extremely abundant; S, Super abundant; A, Abundant; C, Common; F, Frequent; O, Occasional; R, Rare. Organisms not seen during a site visit despite searching recorded as N, Absent.
| Abundance scales | - | - |
|---|---|---|
1. Barnacles, Ex: >500 per 10×10 cm, 5+ per cm2 | 2. Patella spp. 10 mm+, Ex: 200 or more per m2 | 3. Littorina ‘saxatilis’, Ex: 500 or more per m2 |
5. Nucella lapillus (>3 mm), Gibbula spp., Actinia Ex: 100 or more per m2 | 6. Mytilus edulis Ex: 80% or more cover | 7. Pomatoceros sp. A: 50 or more tubes per 10×10 cm |
8. Spirorbinidae A: 5 or more per cm2 on appropriate substrata; more than 100 per 10×10 cm generally | 9. Sponges, hydroids, bryozoa A: Present on 20% or more of suitable surfaces. | 10. Lichens, lithothamnia Ex: More than 80% cover |
11. Algae Ex: More than 90% cover | - | - |
Annex D: Site-frequencies of Abundance Category changes by species
Table 15. Frequencies of site-specific changes in categorical abundance scores between 2014-2015 and 2020-22. ExSACFORN values were expressed as integers from 7 to 0, and changes in categories are shown by numbers in the column headings on the left side of the table. Ncomps is the number of sites where abundance values were estimated for the same place in each period. Average change is the frequency-weighted average change in class, with SD change and SE change the standard deviation and standard error respectively. T is the average change divided by its standard error, with P(T) the p-value associated with the T statistic.
| Species | Abbr | -7 | -6 | -5 | -4 | -3 | -2 | -1 | 0 | 1 | 2 | 3 | 4 | 5 | 6 | 7 | N comps | Average Change | SD Change | SE Change | T | P(T) | P(T) Bonferroni |
|---|---|---|---|---|---|---|---|---|---|---|---|---|---|---|---|---|---|---|---|---|---|---|---|
| Chondrus crispus | Chcri | 0 | 1 | 0 | 10 | 2 | 6 | 7 | 35 | 14 | 17 | 14 | 19 | 18 | 10 | 0 | 153 | 1.601 | 2.780 | 0.225 | 7.125 | 0.0000 | *** |
| Fucus vesiculosus linearis | Fulin | 0 | 1 | 0 | 1 | 2 | 0 | 4 | 111 | 1 | 2 | 5 | 4 | 15 | 19 | 4 | 169 | 1.379 | 2.589 | 0.199 | 6.9238 | 0.0000 | *** |
| Littorina obtusata | Liobt | 0 | 0 | 0 | 2 | 4 | 10 | 8 | 58 | 27 | 30 | 12 | 13 | 1 | 0 | 0 | 165 | 0.800 | 1.743 | 0.136 | 5.895 | 0.0000 | *** |
| Littorina neritoides | Mener | 0 | 0 | 0 | 6 | 1 | 6 | 12 | 80 | 15 | 13 | 10 | 16 | 6 | 0 | 0 | 165 | 0.691 | 1.953 | 0.152 | 4.545 | 0.0000 | *** |
| Membranoptera alata | Meala | 0 | 0 | 4 | 7 | 6 | 2 | 1 | 85 | 13 | 6 | 7 | 11 | 9 | 4 | 0 | 155 | 0.568 | 2.377 | 0.191 | 2.974 | 0.0017 | - |
| Chthamalus montagui | Chmon | 0 | 0 | 1 | 0 | 2 | 4 | 24 | 68 | 45 | 11 | 4 | 4 | 4 | 1 | 0 | 168 | 0.464 | 1.492 | 0.115 | 4.033 | 0.0000 | ** |
| Ulva lactuca | Ullac | 0 | 1 | 2 | 7 | 6 | 14 | 14 | 50 | 28 | 10 | 14 | 9 | 9 | 0 | 0 | 164 | 0.409 | 2.294 | 0.179 | 2.2809 | 0.0119 | - |
| Gibbula umbilicalis | Giumb | 0 | 0 | 2 | 0 | 4 | 3 | 6 | 117 | 6 | 14 | 9 | 2 | 6 | 0 | 0 | 169 | 0.385 | 1.551 | 0.119 | 3.224 | 0.0008 | - |
| Blidingia' type | Bltyp | 0 | 2 | 1 | 5 | 11 | 11 | 6 | 77 | 8 | 8 | 18 | 11 | 5 | 1 | 0 | 164 | 0.335 | 2.279 | 0.178 | 1.8845 | 0.0306 | - |
| Sargassum muticum | Samut | 0 | 0 | 0 | 0 | 0 | 0 | 1 | 1 | 0 | 1 | 0 | 0 | 0 | 0 | 0 | 3 | 0.333 | 1.528 | 0.882 | 0.378 | 0.3709 | - |
| Fucus spiralis | Fuspi | 0 | 0 | 2 | 3 | 7 | 14 | 38 | 36 | 29 | 10 | 9 | 9 | 6 | 1 | 2 | 166 | 0.319 | 2.224 | 0.173 | 1.8497 | 0.0331 | - |
| Cladophora sericea | Clser | 0 | 0 | 9 | 12 | 6 | 6 | 7 | 69 | 4 | 11 | 8 | 15 | 13 | 1 | 0 | 161 | 0.317 | 2.746 | 0.216 | 1.4635 | 0.0726 | - |
| Semibalanus balanoides | Sebal | 0 | 0 | 0 | 0 | 0 | 5 | 26 | 66 | 58 | 12 | 2 | 0 | 0 | 0 | 0 | 169 | 0.308 | 0.957 | 0.074 | 4.178 | 0.0000 | ** |
| Other filamentous reds | Otfil | 1 | 4 | 5 | 3 | 2 | 3 | 1 | 110 | 0 | 2 | 2 | 12 | 9 | 4 | 0 | 158 | 0.291 | 2.486 | 0.198 | 1.472 | 0.0715 | - |
| Lichina pygmaea | Lipyg | 0 | 0 | 4 | 2 | 4 | 11 | 2 | 95 | 13 | 21 | 9 | 5 | 0 | 1 | 0 | 167 | 0.263 | 1.729 | 0.134 | 1.9689 | 0.0253 | - |
| Littorina rudis | Lirud | 0 | 1 | 3 | 3 | 10 | 16 | 16 | 49 | 26 | 13 | 14 | 12 | 2 | 0 | 0 | 165 | 0.248 | 2.160 | 0.168 | 1.478 | 0.0707 | - |
| Pomatoceros triqueter | Potri | 0 | 0 | 1 | 0 | 2 | 3 | 6 | 122 | 4 | 8 | 7 | 2 | 2 | 0 | 0 | 157 | 0.229 | 1.224 | 0.098 | 2.347 | 0.0101 | - |
| Xanthoria parietina | Xapar | 0 | 0 | 0 | 6 | 5 | 11 | 25 | 54 | 27 | 30 | 8 | 2 | 0 | 0 | 0 | 168 | 0.196 | 1.650 | 0.127 | 1.5433 | 0.0623 | - |
| Lecanora spp | Lecan | 0 | 0 | 2 | 3 | 2 | 13 | 28 | 54 | 36 | 19 | 7 | 2 | 1 | 1 | 0 | 168 | 0.190 | 1.656 | 0.128 | 1.491 | 0.0689 | - |
| Spirorbis spirorbis | Spspi | 0 | 0 | 2 | 10 | 3 | 6 | 8 | 69 | 22 | 8 | 9 | 5 | 4 | 0 | 0 | 146 | 0.178 | 1.999 | 0.165 | 1.076 | 0.1418 | - |
| Patella ulyssiponensis | Pauly | 0 | 0 | 2 | 0 | 1 | 1 | 0 | 27 | 3 | 1 | 1 | 2 | 1 | 0 | 0 | 39 | 0.154 | 1.885 | 0.302 | 0.510 | 0.3066 | - |
| Lomentaria articulata | Loart | 0 | 1 | 7 | 10 | 7 | 9 | 11 | 62 | 16 | 7 | 7 | 10 | 10 | 2 | 0 | 159 | 0.138 | 2.599 | 0.206 | 0.671 | 0.2515 | - |
| Elminius modestus | Elmod | 0 | 0 | 0 | 0 | 1 | 1 | 6 | 142 | 10 | 2 | 2 | 3 | 0 | 0 | 0 | 167 | 0.126 | 0.778 | 0.060 | 2.090 | 0.0191 | - |
| Ascophyllum nodosum | Asnod | 1 | 2 | 1 | 2 | 3 | 8 | 9 | 103 | 15 | 13 | 4 | 2 | 4 | 1 | 0 | 168 | 0.125 | 1.755 | 0.135 | 0.9232 | 0.1786 | - |
| Balanus crenatus | Bacre | 0 | 0 | 0 | 4 | 2 | 3 | 2 | 103 | 2 | 3 | 2 | 5 | 2 | 0 | 0 | 128 | 0.109 | 1.421 | 0.126 | 0.871 | 0.1928 | - |
| Codium spp | Cospp | 0 | 0 | 1 | 3 | 1 | 5 | 14 | 112 | 18 | 5 | 7 | 1 | 0 | 0 | 0 | 167 | 0.054 | 1.184 | 0.092 | 0.5885 | 0.2785 | - |
| Pelvetia canaliculata | Pecan | 0 | 0 | 0 | 4 | 4 | 15 | 34 | 56 | 26 | 17 | 9 | 2 | 1 | 0 | 0 | 168 | 0.048 | 1.596 | 0.123 | 0.387 | 0.3498 | - |
| Dictyota dichotoma | Didic | 0 | 0 | 0 | 1 | 1 | 3 | 0 | 156 | 2 | 0 | 1 | 2 | 0 | 0 | 0 | 166 | 0.000 | 0.696 | 0.054 | 0 | 0.5000 | - |
| Patella vulgata | Pavul | 0 | 0 | 0 | 0 | 1 | 14 | 35 | 71 | 35 | 8 | 3 | 0 | 1 | 0 | 0 | 168 | -0.006 | 1.145 | 0.088 | -0.067 | 0.4732 | - |
| Dilsea carnosa | Dicar | 0 | 0 | 0 | 0 | 1 | 0 | 6 | 149 | 0 | 2 | 0 | 1 | 0 | 0 | 0 | 159 | -0.006 | 0.497 | 0.039 | -0.160 | 0.4367 | - |
| Anemonia sulcata | Ansul | 0 | 0 | 0 | 1 | 1 | 2 | 5 | 155 | 0 | 2 | 2 | 0 | 0 | 0 | 0 | 168 | -0.036 | 0.618 | 0.048 | -0.749 | 0.2274 | - |
| Lipophrys pholis | Lipho | 0 | 0 | 0 | 0 | 0 | 4 | 2 | 66 | 2 | 2 | 0 | 0 | 0 | 0 | 0 | 76 | -0.053 | 0.609 | 0.070 | -0.754 | 0.2267 | - |
| Dynamena pumila | Dypum | 0 | 0 | 2 | 9 | 9 | 1 | 2 | 120 | 3 | 2 | 1 | 8 | 5 | 0 | 0 | 162 | -0.062 | 1.854 | 0.146 | -0.424 | 0.3361 | - |
| Pholis gunnellus | Phgun | 0 | 0 | 0 | 0 | 0 | 0 | 5 | 62 | 0 | 0 | 0 | 0 | 0 | 0 | 0 | 67 | -0.075 | 0.265 | 0.032 | -2.307 | 0.0121 | - |
| Halichondria panicea | Hapan | 0 | 0 | 6 | 10 | 8 | 10 | 15 | 62 | 18 | 15 | 9 | 4 | 5 | 0 | 0 | 162 | -0.080 | 2.207 | 0.173 | -0.463 | 0.3220 | - |
| Osmundia spp | Osspp | 0 | 4 | 4 | 12 | 5 | 5 | 17 | 67 | 20 | 10 | 5 | 4 | 5 | 4 | 0 | 162 | -0.086 | 2.435 | 0.191 | -0.452 | 0.3261 | - |
| Chthamalus stellatus | Chste | 0 | 0 | 0 | 6 | 8 | 7 | 21 | 89 | 18 | 10 | 5 | 2 | 1 | 0 | 0 | 167 | -0.102 | 1.504 | 0.116 | -0.875 | 0.1914 | - |
| Palmaria palmata | Papal | 0 | 9 | 5 | 5 | 2 | 3 | 8 | 54 | 22 | 7 | 4 | 2 | 5 | 4 | 0 | 130 | -0.108 | 2.717 | 0.238 | -0.452 | 0.3261 | - |
| Membranipora membranacea | Memem | 0 | 0 | 0 | 1 | 3 | 0 | 2 | 66 | 0 | 0 | 1 | 1 | 0 | 0 | 0 | 74 | -0.108 | 0.973 | 0.113 | -0.956 | 0.1712 | - |
| Leathesia difformis | Ledif | 0 | 1 | 4 | 9 | 15 | 9 | 7 | 89 | 7 | 5 | 3 | 11 | 8 | 0 | 0 | 168 | -0.131 | 2.302 | 0.178 | -0.737 | 0.2310 | - |
| Littorina littorea | Lilit | 1 | 2 | 2 | 2 | 6 | 16 | 28 | 68 | 20 | 8 | 1 | 12 | 0 | 1 | 0 | 167 | -0.132 | 1.956 | 0.151 | -0.870 | 0.1927 | - |
| Coralline crusts (Low rock) | Lilow | 1 | 3 | 6 | 3 | 9 | 8 | 18 | 47 | 27 | 16 | 4 | 2 | 2 | 3 | 0 | 149 | -0.141 | 2.325 | 0.190 | -0.740 | 0.2303 | - |
| Carcinus maenas | Camae | 0 | 0 | 0 | 2 | 1 | 11 | 12 | 96 | 3 | 10 | 0 | 0 | 0 | 0 | 0 | 135 | -0.163 | 1.009 | 0.087 | -1.877 | 0.0314 | - |
| Other foliaceous reds | Otfol | 0 | 1 | 1 | 3 | 4 | 7 | 1 | 129 | 3 | 1 | 1 | 2 | 1 | 0 | 0 | 154 | -0.188 | 1.256 | 0.101 | -1.860 | 0.0324 | - |
| Corallina officinalis | Cooff | 0 | 1 | 0 | 5 | 9 | 13 | 26 | 63 | 23 | 13 | 5 | 1 | 1 | 0 | 0 | 160 | -0.200 | 1.644 | 0.130 | -1.539 | 0.0629 | - |
| Gibbula cineraria | Gicin | 0 | 0 | 0 | 2 | 5 | 14 | 9 | 89 | 4 | 3 | 5 | 2 | 0 | 0 | 0 | 133 | -0.203 | 1.319 | 0.114 | -1.775 | 0.0391 | - |
| Tectura testudinalis | Tetes | 0 | 0 | 0 | 1 | 0 | 1 | 1 | 31 | 0 | 0 | 0 | 0 | 0 | 0 | 0 | 34 | -0.206 | 0.770 | 0.132 | -1.559 | 0.0642 | - |
| Electra pilosa | Elpil | 0 | 0 | 0 | 6 | 8 | 9 | 7 | 65 | 3 | 4 | 4 | 2 | 3 | 0 | 0 | 111 | -0.243 | 1.825 | 0.173 | -1.404 | 0.0816 | - |
| Fucus serratus | Fuser | 4 | 1 | 1 | 1 | 2 | 21 | 28 | 59 | 20 | 3 | 6 | 3 | 0 | 3 | 1 | 153 | -0.248 | 2.122 | 0.172 | -1.4476 | 0.0749 | - |
| Chorda filum | Chfil | 0 | 1 | 0 | 3 | 6 | 6 | 4 | 140 | 0 | 2 | 1 | 1 | 0 | 0 | 0 | 164 | -0.250 | 1.076 | 0.084 | -2.9752 | 0.0017 | - |
| Mytilus edulis | Myspp | 0 | 0 | 3 | 3 | 9 | 22 | 20 | 64 | 31 | 10 | 5 | 1 | 1 | 0 | 0 | 169 | -0.254 | 1.651 | 0.127 | -2.003 | 0.0234 | - |
| Nucella lapillus | Nulap | 0 | 0 | 1 | 0 | 9 | 20 | 44 | 54 | 21 | 15 | 2 | 2 | 0 | 1 | 0 | 169 | -0.266 | 1.514 | 0.116 | -2.287 | 0.0117 | - |
| Actinia equina | Acequ | 0 | 0 | 6 | 3 | 7 | 14 | 30 | 61 | 30 | 8 | 7 | 2 | 0 | 0 | 0 | 168 | -0.274 | 1.715 | 0.132 | -2.069 | 0.0200 | - |
| Dumontia incrassata | Duinc | 0 | 0 | 0 | 9 | 14 | 6 | 8 | 108 | 4 | 6 | 7 | 2 | 1 | 0 | 0 | 165 | -0.291 | 1.631 | 0.127 | -2.292 | 0.0116 | - |
| Polysiphonia lanosa | Polan | 1 | 2 | 0 | 5 | 8 | 16 | 16 | 89 | 11 | 6 | 3 | 4 | 3 | 0 | 0 | 164 | -0.293 | 1.820 | 0.142 | -2.059 | 0.0205 | - |
| Fucus vesiculosus | Fuves | 1 | 5 | 4 | 1 | 5 | 11 | 37 | 65 | 25 | 3 | 2 | 3 | 1 | 4 | 1 | 168 | -0.298 | 2.157 | 0.166 | -1.7883 | 0.0378 | - |
| Himanthalia elongata | Hielo | 1 | 4 | 1 | 5 | 1 | 5 | 18 | 110 | 12 | 7 | 3 | 0 | 0 | 0 | 0 | 167 | -0.311 | 1.544 | 0.119 | -2.6059 | 0.0050 | - |
| Laminaria saccharina | Salat | 1 | 1 | 2 | 4 | 8 | 7 | 6 | 88 | 6 | 0 | 3 | 3 | 0 | 2 | 0 | 131 | -0.336 | 1.846 | 0.161 | -2.082 | 0.0197 | - |
| Laminaria hyperborea | Lahyp | 5 | 0 | 0 | 0 | 0 | 0 | 9 | 32 | 2 | 1 | 0 | 0 | 0 | 0 | 3 | 52 | -0.365 | 2.801 | 0.388 | -0.941 | 0.1756 | - |
| Pilayella littoralis | Pilit | 1 | 3 | 4 | 15 | 7 | 6 | 3 | 96 | 4 | 6 | 12 | 6 | 1 | 0 | 0 | 164 | -0.366 | 2.246 | 0.175 | -2.086 | 0.0193 | - |
| Other finely branched reds | Otfin | 0 | 3 | 10 | 7 | 8 | 15 | 23 | 32 | 26 | 15 | 6 | 6 | 2 | 0 | 1 | 154 | -0.377 | 2.476 | 0.200 | -1.887 | 0.0305 | - |
| Ulva compressa / intestinalis | Ulcom | 0 | 0 | 1 | 3 | 8 | 22 | 41 | 47 | 27 | 13 | 2 | 1 | 0 | 0 | 0 | 165 | -0.382 | 1.488 | 0.116 | -3.2969 | 0.0006 | * |
| Verrucaria maura | Vemau | 1 | 1 | 0 | 0 | 3 | 24 | 63 | 51 | 12 | 4 | 1 | 4 | 1 | 1 | 1 | 167 | -0.455 | 1.642 | 0.127 | -3.5822 | 0.0002 | * |
| Halidrys siliquosa | Hasil | 0 | 5 | 5 | 9 | 8 | 8 | 13 | 97 | 5 | 5 | 5 | 8 | 1 | 0 | 0 | 169 | -0.456 | 2.118 | 0.163 | -2.796 | 0.0029 | - |
| Cladophora rupestris | Clrup | 0 | 3 | 10 | 5 | 11 | 17 | 32 | 43 | 22 | 11 | 4 | 8 | 1 | 0 | 0 | 167 | -0.563 | 2.248 | 0.174 | -3.2353 | 0.0007 | - |
| Laminaria digitata | Ladig | 5 | 2 | 4 | 2 | 2 | 11 | 31 | 60 | 4 | 2 | 1 | 0 | 3 | 4 | 1 | 132 | -0.583 | 2.450 | 0.213 | -2.7359 | 0.0035 | - |
| Verrucaria mucosa | Vemuc | 1 | 4 | 8 | 13 | 7 | 13 | 2 | 91 | 4 | 9 | 4 | 3 | 4 | 0 | 1 | 164 | -0.604 | 2.390 | 0.187 | -3.2343 | 0.0007 | - |
| Porphyra sp | Posp | 0 | 5 | 11 | 8 | 5 | 14 | 17 | 81 | 7 | 7 | 0 | 5 | 4 | 2 | 0 | 166 | -0.627 | 2.365 | 0.184 | -3.413 | 0.0004 | * |
| Coralline crusts (High pools) | Lihig | 2 | 1 | 9 | 9 | 13 | 25 | 19 | 38 | 13 | 20 | 8 | 3 | 2 | 0 | 0 | 162 | -0.679 | 2.400 | 0.189 | -3.601 | 0.0002 | * |
| Alaria esculenta | Alesc | 2 | 7 | 10 | 7 | 4 | 10 | 14 | 86 | 9 | 4 | 3 | 1 | 1 | 2 | 1 | 161 | -0.783 | 2.395 | 0.189 | -4.1471 | 0.0000 | ** |
| Flustrellidra hispida | Flhis | 0 | 0 | 1 | 15 | 12 | 4 | 1 | 68 | 0 | 0 | 2 | 1 | 1 | 0 | 0 | 105 | -0.905 | 1.868 | 0.182 | -4.962 | 0.0000 | *** |
| Scytosiphon lomentaria | Sclom | 1 | 2 | 6 | 18 | 15 | 25 | 9 | 59 | 12 | 7 | 7 | 0 | 1 | 0 | 0 | 162 | -1.068 | 2.153 | 0.169 | -6.313 | 0.0000 | *** |
| Mastocarpus stellatus | Maste | 3 | 7 | 17 | 9 | 5 | 7 | 17 | 53 | 16 | 13 | 2 | 2 | 2 | 0 | 0 | 153 | -1.072 | 2.629 | 0.213 | -5.044 | 0.0000 | *** |
Annex E: Relative fit of non-spatial and spatial models of abundance change for MarClim species in Scotland
Table 16. Akaike Information Criterion values for proportional-odd logistic regression (POLR) models of change in frequencies of abundance categories. Three models were fitted for each species using data from surveys of paired sites: (s) a spatial model with latitude and longitude terms; (t + s) a spatial model with latitude and longitude plus an additive term for survey period; and (t x s) a spatial model with latitude and longitude and including terms for survey period interacting with latitude and longitude to test for location-dependent changes. Differences between models gives the importance of (1) ΔAIC [(t+s)-s] : change across the entire set of surveys, (2) ΔAIC [(t+s)-s] additional location-dependent changes, and (3) overall plus location-dependent changes. Akaike weights (Burnham and Anderson, 2002) are the probability of each model being the best of the three considered given the data, such that AW1 is the probability of the spatial-only model (s), AW2 the probability of the spatial-plus-overall-change model (t + s) and AW3 spatial-pattern-plus-localised-change. Species are sorted by AW1 within Kingdoms such that species showing most localised change appear at the top of the table.
| Species/taxon name | AICs | AICt+s | AICt x s | ΔAIC [(t+s)-s] | ΔAIC [(t+s)-(t x s)] | ΔAIC [s-(t x s)] | AW1 | AW2 | AW3 | Kingdom |
|---|---|---|---|---|---|---|---|---|---|---|
| Flustrellidra hispida | 329.87 | 314.78 | 309.34 | -15.09 | -5.44 | -20.53 | 0.00 | 0.06 | 0.94 | Animalia |
| Semibalanus balanoides | 689.00 | 677.13 | 673.21 | -11.88 | -3.92 | -15.80 | 0.00 | 0.12 | 0.88 | Animalia |
| Littorina obtusata | 873.24 | 859.24 | 861.85 | -14.00 | 2.61 | -11.39 | 0.00 | 0.79 | 0.21 | Animalia |
| Littorina rudis | 982.59 | 984.24 | 972.15 | 1.65 | -12.09 | -10.44 | 0.01 | 0.00 | 0.99 | Animalia |
| Littorina neritoides | 752.25 | 751.02 | 750.18 | -1.23 | -0.84 | -2.07 | 0.18 | 0.33 | 0.50 | Animalia |
| Chthamalus montagui | 832.48 | 830.47 | 832.77 | -2.01 | 2.30 | 0.29 | 0.22 | 0.59 | 0.19 | Animalia |
| Nucella lapillus | 1011.27 | 1009.48 | 1013.64 | -1.78 | 4.15 | 2.37 | 0.27 | 0.65 | 0.08 | Animalia |
| Patella ulyssiponensis | 242.24 | 244.20 | 240.59 | 1.96 | -3.62 | -1.65 | 0.27 | 0.10 | 0.62 | Animalia |
| Dynamena pumila | 344.61 | 343.03 | 346.37 | -1.58 | 3.34 | 1.76 | 0.28 | 0.61 | 0.11 | Animalia |
| Gibbula cineraria | 477.88 | 477.09 | 482.78 | -0.79 | 5.69 | 4.90 | 0.39 | 0.58 | 0.03 | Animalia |
| Mytilus edulis | 909.65 | 908.90 | 909.32 | -0.75 | 0.42 | -0.34 | 0.27 | 0.40 | 0.33 | Animalia |
| Halichondria panicea | 838.80 | 840.12 | 838.21 | 1.31 | -1.90 | -0.59 | 0.35 | 0.18 | 0.47 | Animalia |
| Littorina littorea | 897.69 | 897.39 | 903.05 | -0.30 | 5.66 | 5.36 | 0.45 | 0.52 | 0.03 | Animalia |
| Chthamalus stellatus | 786.00 | 786.00 | 791.85 | -0.01 | 5.86 | 5.85 | 0.49 | 0.49 | 0.03 | Animalia |
| Patella vulgata | 799.64 | 801.64 | 801.60 | 2.00 | -0.04 | 1.96 | 0.57 | 0.21 | 0.22 | Animalia |
| Electra pilosa | 459.64 | 459.91 | 463.48 | 0.27 | 3.56 | 3.83 | 0.49 | 0.43 | 0.07 | Animalia |
| Pomatoceros triqueter | 342.17 | 343.58 | 346.99 | 1.41 | 3.40 | 4.82 | 0.63 | 0.31 | 0.06 | Animalia |
| Gibbula umbilicalis | 499.16 | 500.78 | 504.64 | 1.62 | 3.86 | 5.49 | 0.66 | 0.29 | 0.04 | Animalia |
| Balanus crenatus | 279.00 | 280.94 | 285.23 | 1.94 | 4.30 | 6.23 | 0.70 | 0.27 | 0.03 | Animalia |
| Actinia equina | 992.43 | 993.03 | 998.73 | 0.60 | 5.69 | 6.29 | 0.56 | 0.42 | 0.02 | Animalia |
| Spirorbis spirorbis | 730.07 | 731.00 | 736.65 | 0.93 | 5.65 | 6.59 | 0.60 | 0.38 | 0.02 | Animalia |
| Elminius modestus | 255.62 | 257.23 | 262.72 | 1.61 | 5.49 | 7.10 | 0.68 | 0.30 | 0.02 | Animalia |
| Scytosiphon lomentaria | 845.87 | 810.36 | 795.03 | -35.51 | -15.33 | -50.85 | 0.00 | 0.00 | 1.00 | Chromista |
| Fucus vesiculosus linearis | 472.30 | 443.84 | 443.89 | -28.45 | 0.05 | -28.40 | 0.00 | 0.51 | 0.49 | Chromista |
| Leathesia difformis | 676.54 | 678.11 | 653.59 | 1.57 | -24.52 | -22.94 | 0.00 | 0.00 | 1.00 | Chromista |
| Alaria esculenta | 831.71 | 817.97 | 819.04 | -13.74 | 1.07 | -12.67 | 0.00 | 0.63 | 0.37 | Chromista |
| Pilayella littoralis | 565.30 | 562.40 | 556.99 | -2.90 | -5.41 | -8.31 | 0.01 | 0.06 | 0.92 | Chromista |
| Chorda filum | 263.61 | 258.29 | 260.67 | -5.33 | 2.38 | -2.95 | 0.05 | 0.73 | 0.22 | Chromista |
| Laminaria digitata | 647.87 | 643.71 | 649.05 | -4.16 | 5.33 | 1.18 | 0.10 | 0.84 | 0.06 | Chromista |
| Halidrys siliquosa | 715.78 | 711.77 | 715.64 | -4.00 | 3.86 | -0.14 | 0.11 | 0.78 | 0.11 | Chromista |
| Laminaria saccharina | 425.48 | 422.05 | 422.88 | -3.43 | 0.83 | -2.59 | 0.10 | 0.54 | 0.36 | Chromista |
| Fucus serratus | 869.76 | 870.46 | 867.48 | 0.71 | -2.98 | -2.27 | 0.21 | 0.15 | 0.65 | Chromista |
| Himanthalia elongata | 709.48 | 707.92 | 710.44 | -1.56 | 2.52 | 0.96 | 0.26 | 0.57 | 0.16 | Chromista |
| Laminaria hyperborea | 317.57 | 316.98 | 319.63 | -0.59 | 2.65 | 2.06 | 0.37 | 0.50 | 0.13 | Chromista |
| Fucus vesiculosus | 867.42 | 867.40 | 870.26 | -0.02 | 2.86 | 2.84 | 0.44 | 0.45 | 0.11 | Chromista |
| Fucus spiralis | 965.91 | 967.61 | 966.75 | 1.70 | -0.86 | 0.84 | 0.48 | 0.21 | 0.32 | Chromista |
| Pelvetia canaliculata | 908.43 | 910.42 | 910.27 | 1.99 | -0.15 | 1.84 | 0.57 | 0.21 | 0.23 | Chromista |
| Ascophyllum nodosum | 842.13 | 843.71 | 849.37 | 1.58 | 5.66 | 7.24 | 0.68 | 0.31 | 0.02 | Chromista |
| Verrucaria maura | 781.51 | 759.79 | 752.95 | -21.72 | -6.84 | -28.56 | 0.00 | 0.03 | 0.97 | Fungi |
| Verrucaria mucosa | 599.84 | 590.55 | 590.59 | -9.29 | 0.05 | -9.25 | 0.00 | 0.50 | 0.49 | Fungi |
| Xanthoria parietina | 1012.70 | 1013.87 | 1010.38 | 1.17 | -3.49 | -2.32 | 0.21 | 0.12 | 0.67 | Fungi |
| Lichina pygmaea | 709.35 | 711.18 | 714.16 | 1.83 | 2.97 | 4.81 | 0.67 | 0.27 | 0.06 | Fungi |
| Lecanora spp | 969.26 | 970.09 | 976.62 | 0.83 | 6.53 | 7.36 | 0.59 | 0.39 | 0.01 | Fungi |
| Chondrus crispus | 832.63 | 791.21 | 789.59 | -41.41 | -1.62 | -43.04 | 0.00 | 0.31 | 0.69 | Plantae |
| Cladophora sericea | 654.15 | 656.02 | 622.85 | 1.87 | -33.17 | -31.30 | 0.00 | 0.00 | 1.00 | Plantae |
| Other finely branched reds | 940.15 | 940.61 | 919.99 | 0.46 | -20.62 | -20.16 | 0.00 | 0.00 | 1.00 | Plantae |
| Cladophora rupestris | 932.07 | 925.73 | 915.96 | -6.34 | -9.77 | -16.12 | 0.00 | 0.01 | 0.99 | Plantae |
| Coralline crusts (High pools) | 1077.62 | 1071.02 | 1063.65 | -6.60 | -7.37 | -13.98 | 0.00 | 0.02 | 0.97 | Plantae |
| Mastocarpus stellatus | 876.93 | 867.72 | 863.28 | -9.21 | -4.44 | -13.65 | 0.00 | 0.10 | 0.90 | Plantae |
| Porphyra sp | 826.85 | 818.30 | 814.42 | -8.56 | -3.87 | -12.43 | 0.00 | 0.13 | 0.87 | Plantae |
| Palmaria palmata | 742.05 | 742.99 | 729.66 | 0.94 | -13.33 | -12.39 | 0.00 | 0.00 | 1.00 | Plantae |
| Ulva compressa / intestinalis | 914.90 | 908.62 | 904.55 | -6.28 | -4.07 | -10.35 | 0.00 | 0.11 | 0.88 | Plantae |
| Blidingia' type | 676.13 | 678.10 | 668.13 | 1.97 | -9.98 | -8.01 | 0.02 | 0.01 | 0.98 | Plantae |
| Other foliaceous reds | 268.87 | 267.00 | 260.93 | -1.87 | -6.07 | -7.94 | 0.02 | 0.05 | 0.94 | Plantae |
| Other filamentous reds | 367.12 | 368.32 | 361.45 | 1.20 | -6.88 | -5.68 | 0.05 | 0.03 | 0.92 | Plantae |
| Dumontia incrassata | 463.01 | 458.34 | 460.25 | -4.67 | 1.91 | -2.76 | 0.07 | 0.67 | 0.26 | Plantae |
| Membranoptera alata | 653.42 | 652.45 | 656.57 | -0.97 | 4.12 | 3.15 | 0.35 | 0.57 | 0.07 | Plantae |
| Ulva lactuca | 913.72 | 913.17 | 918.34 | -0.55 | 5.17 | 4.62 | 0.41 | 0.54 | 0.04 | Plantae |
| Coralline crusts (Low rock) | 907.86 | 909.15 | 907.52 | 1.29 | -1.64 | -0.34 | 0.37 | 0.19 | 0.44 | Plantae |
| Corallina officinalis | 892.03 | 893.38 | 894.93 | 1.35 | 1.55 | 2.90 | 0.57 | 0.29 | 0.13 | Plantae |
| Lomentaria articulata | 763.84 | 765.82 | 767.62 | 1.98 | 1.80 | 3.77 | 0.66 | 0.24 | 0.10 | Plantae |
| Osmundia spp | 867.86 | 869.80 | 871.92 | 1.93 | 2.13 | 4.06 | 0.66 | 0.25 | 0.09 | Plantae |
| Polysiphonia lanosa | 786.18 | 786.26 | 790.77 | 0.08 | 4.51 | 4.59 | 0.48 | 0.47 | 0.05 | Plantae |
| Codium spp | 487.50 | 489.47 | 493.05 | 1.97 | 3.57 | 5.54 | 0.70 | 0.26 | 0.04 | Plantae |
Annex F: Site numbers for PCA analysis (figure 22)
Multiple sites indicate where multiple surveys were conducted.
| Number | Site | Number | Site | Number | Site | Number | Site |
|---|---|---|---|---|---|---|---|
| 1 | Inner Tumble Wick | 31 | Utstabi Stenness | 61 | Dunyvaig Castle | 91 | Tiumpan Head |
| 2 | Inner Tumble Wick | 32 | Utstabi Stenness | 62 | Dunyvaig Castle | 92 | Tiumpan Head |
| 3 | Jarlshof | 33 | Voe of the Brig | 63 | Laggan Point | 93 | Carsaig Bay |
| 4 | Jarlshof | 34 | Voe of the Brig | 64 | Laggan Point | 94 | Carsaig Bay |
| 5 | Northvoe | 35 | Bight of Lotheran | 65 | Bow Head | 95 | Craignure |
| 6 | Northvoe | 36 | Bight of Lotheran | 66 | Bow Head | 96 | Craignure |
| 7 | Spiggie Bay N | 37 | Muckle Kiln | 67 | Kirbist | 97 | Gortein Driseach |
| 8 | Spiggie Bay N | 38 | Muckle Kiln | 68 | Kirbist | 98 | Gortein Driseach |
| 9 | Bigton | 39 | Noust of Ayre | 69 | Ardnave | 99 | Kintra |
| 10 | Bigton | 40 | Noust of Ayre | 70 | Ardnave | 100 | Kintra |
| 11 | Claver W | 41 | Papil Bay | 71 | Coul Point | 101 | Crowlista |
| 12 | Claver W | 42 | Papil Bay | 72 | Coul Point | 102 | Crowlista |
| 13 | Sand Lodge | 43 | West Sandwick Bay | 73 | Dunbeg NW | 103 | Mealasta |
| 14 | Sand Lodge | 44 | West Sandwick Bay | 74 | Dunbeg NW | 104 | Mealasta |
| 15 | Skarfa Skerry | 45 | White Wife | 75 | Columba's Cave | 105 | Miavaig Pier |
| 16 | Skarfa Skerry | 46 | White Wife | 76 | Columba's Cave | 106 | Miavaig Pier |
| 17 | Clett | 47 | Banks | 77 | Melfort | 107 | Achnahaird |
| 18 | Clett | 48 | Banks | 78 | Melfort | 108 | Achnahaird |
| 19 | Ness of Melby | 49 | Bay of Skaill (North) | 79 | Caillich | 109 | Clachtoll |
| 20 | Ness of Melby | 50 | Bay of Skaill (North) | 80 | Caillich | 110 | Clachtoll |
| 21 | Roesound Skerry | 51 | Point of Coppister | 81 | Glengorm | 111 | Culkein |
| 22 | Roesound Skerry | 52 | Point of Coppister | 82 | Glengorm | 112 | Culkein |
| 23 | South of Badni Taing | 53 | The Taing | 83 | Lainne Sgeir | 113 | Reiff |
| 24 | South of Badni Taing | 54 | The Taing | 84 | Lainne Sgeir | 114 | Reiff |
| 25 | Muckle Head | 55 | Churchill Barrier No. 3 | 85 | Borve Melbost | 115 | Abhainn Suidhe |
| 26 | Muckle Head | 56 | Churchill Barrier No. 3 | 86 | Borve Melbost | 116 | Abhainn Suidhe |
| 27 | Quoyness | 57 | Long Geo | 87 | Port Nan Giuran | 117 | Aird Adhanais |
| 28 | Quoyness | 58 | Long Geo | 88 | Port Nan Giuran | 118 | Aird Adhanais |
| 29 | Nibon | 59 | Tuquoy | 89 | Port Nis | 119 | Caolas an Scarp |
| 30 | Nibon | 60 | Tuquoy | 90 | Port Nis | 120 | Caolas an Scarp |
| 121 | Scalpay Village | 154 | Mull of Galloway | 187 | Skerray | 220 | Macduff |
| 122 | Scalpay Village | 155 | Myroch Point | 188 | Skerray | 221 | Roanhead |
| 123 | Ballantrae | 156 | Myroch Point | 189 | Acarsaid | 222 | Roanhead |
| 124 | Ballantrae | 157 | Portpatrick | 190 | Acarsaid | 223 | Sandhaven |
| 125 | Croy | 158 | Portpatrick | 191 | Eriskay Outer | 224 | Sandhaven |
| 126 | Croy | 159 | An-t Sron | 192 | Eriskay Outer | 225 | Berriedale |
| 127 | Dunure Castle | 160 | An-t Sron | 193 | Smeircleit | 226 | Berriedale |
| 128 | Dunure Castle | 161 | Rispond Inner | 194 | Smeircleit | 227 | Latheronwheel |
| 129 | Girvan | 162 | Rispond Inner | 195 | Trolaisgeir | 228 | Latheronwheel |
| 130 | Girvan | 163 | Rispond Outer | 196 | Trolaisgeir | 229 | Wick (North Head) |
| 131 | Oldshoremore South | 164 | Rispond Outer | 197 | Southerness | 230 | Wick (North Head) |
| 132 | Oldshoremore South | 165 | Sangobeg | 198 | Southerness | 231 | East Sands |
| 133 | Sheigra | 166 | Sangobeg | 199 | Camusteel | 232 | East Sands |
| 134 | Sheigra | 167 | Fearnoch | 200 | Camusteel | 233 | Fife Ness |
| 135 | Campbeltown | 168 | Fearnoch | 201 | Lonbain | 234 | Fife Ness |
| 136 | Campbeltown | 169 | Toward | 202 | Lonbain | 235 | Pittenweem |
| 137 | Carradale | 170 | Toward | 203 | Murkle Bay West | 236 | Pittenweem |
| 138 | Carradale | 171 | Loch Carnan | 204 | Murkle Bay West | 237 | West Wemyss |
| 139 | Claonaig | 172 | Loch Carnan | 205 | Ness of Duncansby | 238 | West Wemyss |
| 140 | Claonaig | 173 | Loch Sgioport | 206 | Ness of Duncansby | 239 | Auchmithie |
| 141 | Machrihanish | 174 | Loch Sgioport | 207 | Borve Point Outer | 240 | Auchmithie |
| 142 | Machrihanish | 175 | Rubha Aird Mhicheal | 208 | Borve Point Outer | 241 | Crawton |
| 143 | Bagh a Chaise Exposed | 176 | Rubha Aird Mhicheal | 209 | Leinis | 242 | Crawton |
| 144 | Bagh a Chaise Exposed | 177 | Rubha Aird na Machrach | 210 | Leinis | 243 | Girdle Ness |
| 145 | Hougharry | 178 | Rubha Aird na Machrach | 211 | Vatersay Causeway West | 244 | Girdle Ness |
| 146 | Hougharry | 179 | Corseyard | 212 | Vatersay Causeway West | 245 | Johnshaven |
| 147 | Loch Amhlasaraidh | 180 | Corseyard | 213 | Berwick on Tweed | 246 | Johnshaven |
| 148 | Quoyness | 181 | Isle of Whithorn | 214 | Berwick on Tweed | 247 | Brora |
| 149 | Nibon | 182 | Isle of Whithorn | 215 | Cockenzie | 248 | Brora |
| 150 | Nibon | 183 | Causeway | 216 | Cockenzie | 249 | Helmsdale |
| 151 | Corsewall Lighthouse | 184 | Causeway | 217 | Buckie | 251 | Helmsdale |
| 152 | Corsewall Lighthouse | 185 | Port Vasgo | 218 | Buckie | 252 | Tarbat Ness |
| 153 | Mull of Galloway | 186 | Port Vasgo | 219 | Macduff | - | - |
Annex G: Change in community metrics 2014-2015 to 2020-2022: checking for ‘regression to the mean’
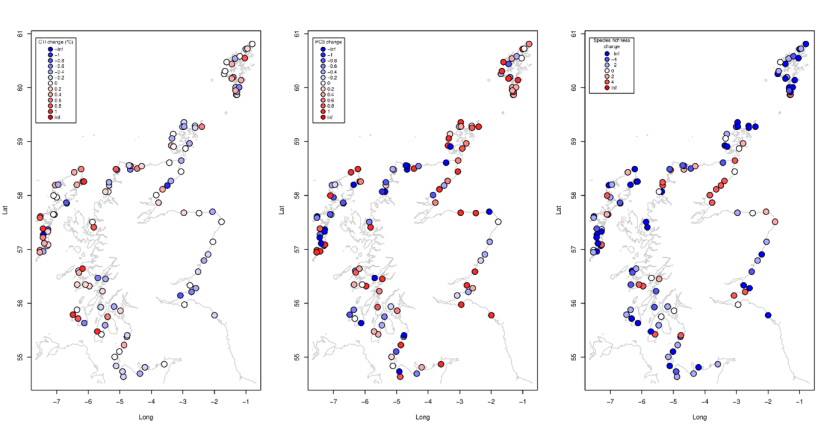
Figure 30. Change in location-specific species richness, PC values, and Community Temperature Index from 2014-2015 to 2020-2022.
Click for a full description
Change in location-specific species richness (nspp), PC1, PC2, PC3, and Community Temperature Index from 2014-2015 to 2020-2022. Left plots show differences related to initial 2014-2015 values, and right plots show differences adjusted for regression to the mean (D*). Solid lines show linear regressions.