NatureScot Research Report 1359 - Natural capital assessments of urban nature-based solutions in Scotland
Year of publication: 2024
Authors: Milagros Saloma Pacheco (NatureScot Graduate Placement, 2021-2022)
Cite as: Saloma-Pacheco, M. 2024. Natural capital assessments of urban nature-based solutions in Scotland. NatureScot Research Report 1359.
Contents
- Keywords
- Acknowledgements
- Background
- Main findings
- 1. Introduction
- 2. Background
-
3. Methodology
- 3.1 Literature review
- 3.2 Discussions with different groups
- 3.3 Application of NCA tools in 3 case studies
- 4. Results
- 5. Discussion
- 6. Conclusion
Keywords
Natural Capital Assessment, Natural Capital approaches, urban nature-based solutions, green infrastructure, Ecosystem Services, biodiversity net gain
Acknowledgements
Many thanks to all the colleagues and practitioners involved in the study
| Name | Organisation |
|---|---|
| Ivan Clark | NatureScot |
| Pete Rawcliffe | NatureScot |
| Mary Christie | NatureScot |
| Swaantje Ridegh | NatureScot |
| Mareike Moeller-Holtkamp | NatureScot |
| Martin Faulkner | NatureScot |
| Tarun Kumar | NatureScot |
| Oliver Hoelzinger | WSP - NATURE Tool |
| Andrew Thompson | EBN Tool |
| Ali MacDonald | PHS |
| Neil Chalmers | PHS |
| Ian McKenzie | NHS Lothian |
| Kerry Waylen | The James Hutton Institute |
| Nicola Melville | SEPA |
| Dom McBennett | Scottish Water |
| Evonne Llewellyn | NHS Grampian |
| Rory McLeod | GCV green network |
| Mark Brand | East Renfrewshire Council |
| Zoe Webb | ARUP- NC consultants |
| Abigail Barker | NatCap research tool |
Background
The concept of Natural Capital (NC) recognizes that nature provides the resources for the production of goods and services and the conditions for human welfare. Many tools have been developed in recent years to facilitate the assessment of NC. Natural Capital Assessment (NCA) tools have their limitations and the extent to which they can support good decision-making is still being tested. This study explores the extent to which NCA tools can support the development of green infrastructure/ nature-based solutions projects in Scotland intended to deliver a range of Ecosystem Services (ES).
NCA can be applied at various scales (national, regional, local, and site). To date, NatureScot have applied NCA to various aspects of its work, but largely with a focus on the national and landscape scale and the rural context. However, there are few examples to date of applying NCA within the urban context. Moreover, in Scotland, there is no agreed standardised NCA methodology or a clear ‘route map’ for applying existing NCA tools in urban site-scale projects.
Discussions with different practitioners from NatureScot, the public sector and NC experts confirmed a rising interest in NC. However, they pointed out the following as possible barriers to implementing NC approaches:
- A perception that NCA is a very complex task, mainly due to the large amount of NC information in the literature and in practice (frameworks, theories, methods and tools).
- A perception that the application of NCA is resource intensive.
- The difficulty of capturing the delivery of ES quantitatively, particularly with respect to cultural ecosystem services such as recreation or health.
To review the applicability of NCA tools in Scotland, a study was carried out at three urban Nature-based Solution (NbS) projects in Dundee (St Mary drainage strategy), Aberdeen (Foresterhill campus), and East Renfrewshire (Levern River regeneration). The methodology included applying three NC tools to analyse the likely changes in ES as a result of the planned interventions. The Biodiversity Metric 3.1 tool was used to assess Biodiversity Net Gain, while EBN and NATURE 1.1 tools were used to assess ecosystem services (e.g. carbon storage, recreation, flood regulation). The assessment process also allowed us to explore and compare the pros and cons of different NC tools applied to different practical, real-life scenarios.
Main findings
- The results suggest that the three tools are applicable in Scotland. The case studies’ results were mostly aligned with the priority ES that the stakeholders were seeking to deliver. Additionally, the outputs were largely consistent with the habitat and land-surface changes set out in the proposals. However, considerations mainly related to the data sources and habitat classifications must be accounted for when applying the tools in Scotland.
- The study highlighted some key differences between EBN and NATURE, leading to apparently conflicting results in some ES outputs.
- The study also revealed NC tools' limitations, such as not being sensitive to topographic changes and not integrating some aspects of biodiversity within their calculations.
- NCA outputs are necessarily indicative and intended to support decision-making, rather than provide a definitive ‘answer’ to a dilemma. They should therefore be interpreted with ecological expertise and common sense. In most projects, a range of other assessments (e.g. flood risk modelling) will be needed to support project planning and evaluation.
- The study also demonstrates the relevance of comparing different tools when developing a scheme, both in terms of informing future projects and refining the tools themselves given that, at the moment, some of the Tools are in Beta version (EBN and NATURE). It helps to test the assumptions behind the tools in a real-world scenario and highlight the benefits and limitations of different approaches.
- A set of recommendations to facilitate NCA was included in the study.
- NatureScot is seeking to establish Natural Capital as an integral part of public and private business planning and investment decisions at national, landscape and landholding/business scales. It is therefore recommended that a route map and guidance is developed help to embed NCA in decisions related to urban NbS. Finally, collaboration with other organisations with NCA initiatives and the NC tool developers is also encouraged.
1. Introduction
NatureScot’s corporate plan 2022-26, “A nature-rich future for all”, presents “Valuing Nature” as one of the main tasks for the organisation (NatureScot, 2022). It envisages a new focus on mainstreaming natural capital approaches/accounting in decision-making. NatureScot’s success will be measured by the extent to which it can provide evidence and tools to enable Scottish Government to embed a natural capital approach in policy and investment decisions.
Natural Capital Assessments (NCA) can be applied at various scales (national, regional, local, and site). NatureScot has been working with partners to help embed NCA in decision making, but largely focusing on the national and landscape scale and the rural context.There are few examples to date of applying NCA within the urban context.
NatureScot currently supports a range of urban Nature-based Solutions (NbS) projects through funding and advice. Integrating NCA into interventions related to urban NbS would potentially help demonstrate the range of benefits in such projects. However, in Scotland, there is no agreed standardised NCA methodology or a clear ‘route map’ for applying existing NCA tools to site-scale projects.
This research project aims to identify and test NCA tools for urban NbS projects in Scotland. The study employed mixed methods, qualitative and quantitative. It takes a case study research approach based on three urban NbS projects in Scotland. It focuses on three NCA tools: Biodiversity Metric 3.1, Environmental benefits from Nature (EBN) and NATURE 1.1. These were selected on the basis of a literature review and discussions with experts in the field.
The report includes a comparison between the outputs from the three tools to better understand the key differences. It also contains recommendations for the application of the respective tools and some general recommendations relating to the further promotion of NCA in Scotland.
1.1 Report layout
Chapter 1 presents an introduction to the project, framing the context, aims, and methodology followed.
Chapter 2 presents general concepts covered by the report such as Natural Capital, Ecosystem Services and Biodiversity Net Gain. Additionally, it gives an overview of the current state of Natural Capital Assessments and Natural Capital tools.
Chapter 3 presents the methodology and breaks down the different steps developed during the project. It also presents the case studies and the Natural Capital tools used for the study.
Chapter 4 provides a summary of the results obtained in the case studies.
Chapter 5 discusses the applicability in Scotland of the NC tools applied in the study, the main differences between them and their main limitations identified in the study.
Chapter 6 covers the conclusions and recommendations to facilitate the further development of NCA.
2. Background
2.1 Natural Capital and Ecosystem Services
The concept of Natural Capital (NC) has gained interest in recent years. Classical economics identify land, labour and human-made capital as the different types of capital stocks (Smith, 1998); however, Ekins et al., 2003 defined four capitals: manufactured capital, human capital, social & organisational capital and NC. NC acknowledges nature for providing the resources for production and the conditions for human welfare (Costanza and Daly, 1992).
NC refers to the stock of renewable and non-renewable natural resources (e.g., plants, animals, air, water, soils, minerals) that combine to yield a flow of benefits or "services" to people (Figure 1) (Natural capital coalition, 2016). NC therefore includes Ecosystem Services (ES) (benefits to people from ecosystems), and Abiotic Services which arise from geological processes (e.g. supply of minerals or geothermal heat). Before the development of the NC concept, classical economic theory considered ES to be "free" based on a widely held assumption that they were effectively limitless or at least abundant (Barbier, 2011).
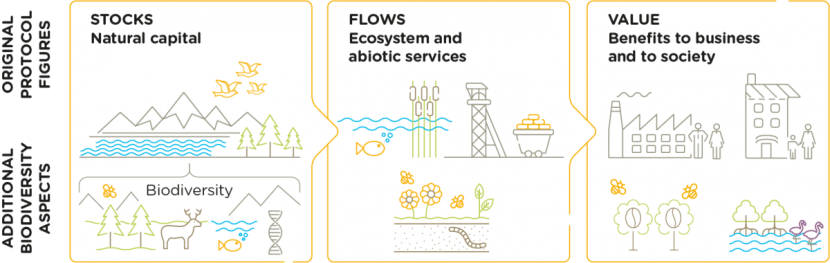
Figure 1. Natural capital stocks, flows and values. Source: Natural Capital Coalition, 2016
Click for a full description
A diagram showing three connected images: no 1, of a landscape to symbolise natural capital stocks with biodiversity as the foundation, which leads to no 2, a lake with a fish and mineral extraction tower to symbolise flows of ecosystem services, which again points to no 3, a factory and a building symbolising the value to business and society.
Figure 2 presents a list of commonly recognised ES, which are typically divided into four groups:
- Provisional– these are tangible goods that people can harvest from the environment, such as food, wood and fibre, water and fuel.
- Regulating– these are regulating services that occur in the ecosystem that lead to benefits such as climate regulation, flood management, and water filtration.
- Cultural– these include ways in which nature impacts people's health and wellbeing through recreational and educational benefits, improving mental health, and building spiritual connections.
- Supporting – ecosystems could not function without support services, such as the nutrient cycle, soil formation and habitat provision for biodiversity, forming the basis for the other three types of services. (NatureScot, 2022)
Biodiversity is considered a part of NC assets and underpins all ES. It is critical to the health and stability of NC as it provides resilience to shocks like floods and droughts and supports fundamental processes such as the carbon and water cycles as well as soil formation (Natural capital coalition, 2016).
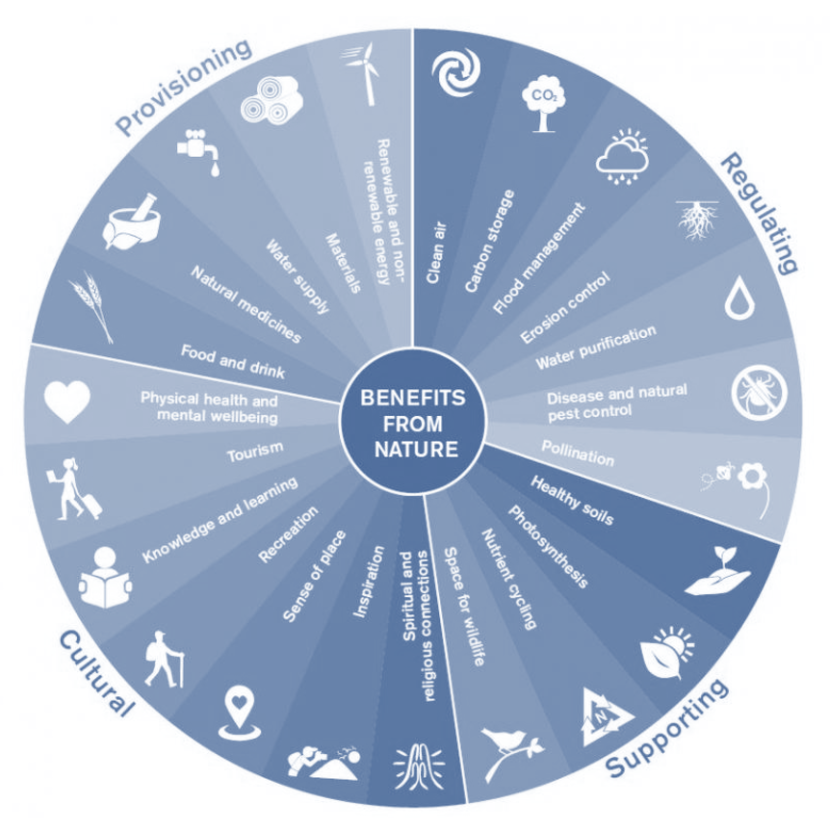
Figure 2. Ecosystem services. Source: NatureScot, 2022
Click for a full description
A diagram consisting of a wheel divided into 23 different ecosystem services with a symbol each, such as a hiker for “recreation”, and a leaf with sunshine for “photosynthesis”. The wheel is divided into the 4 groups of supporting, regulating, provisioning and cultural services.
2.2 Why develop NCA?
The Enabling Natural Capital Approach (ENCA) (Defra, 2021a) explains nature as an asset or set of assets which benefit people. Their quality, quantity and location determine the ability of natural assets to provide goods and services. These can be affected by background pressures, management practices and drivers of demand, as illustrated in figure 3.
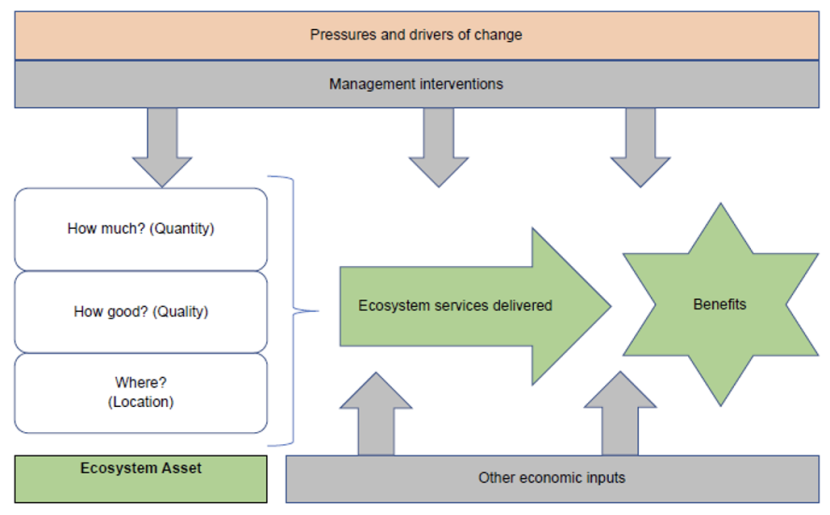
Figure 3. The Natural Capital Framework. Source: Defra, 2021
Click for a full description
A diagram showing the relationship between quality, quantity and location of ecosystem assets, represented by boxes to the left of the graphic, determining the ability of natural assets to provide goods and services. A green arrow labelled ecosystem services links the ecosystem assets with a star shape, labelled benefits. Arrows from above and below illustrate how the ecosystems service and benefits can be affected by background pressures, management practices and drivers of demand.
There are no legal obligations to use Natural Capital Assessments (NCA) in the UK, but Defra (2021) recommend using them to provide a more strategic nature-positive approach, to identify dependencies on natural assets and translate this into relevant information for decision-making. In the last five years, the use of NCA has grown rapidly in public and private sectors (Eftec, 2021).
NCA is still considered ‘experimental’; therefore, no single NCA method or model has yet been adopted as a ‘standard’ for site-scale intervention projects. Instead, various approaches are often combined based on the objectives of that particular development (ONS, 2017).
NCA are helpful as an instrument when developing a project. They can support the decision-makers by providing data for planning and investment decisions. The following are the main reasons to apply NCA throughout a project:
- Compare NC assets and flow between baseline and proposal, thus demonstrating what value your project adds
- Understand and communicate Ecosystem Services provided by your project
- Examine how schemes can deliver biodiversity and environmental net gain
- Deepen your knowledge about the natural capital impact of your project
- Convince your stakeholders through evidence of the benefits that your project will deliver
2.3 NCA Tools
A 'tool' in the NC context is a generic term for various methods that users can interact with to provide tailored information and analysis (Defra, 2021a). These can be divided into three categories: mapping natural capital stocks, quantifying ecosystem services flows and opportunity mapping (Table 1). In selecting an appropriate tool practitioners should consider, amongst other things, the scope of the assessment, the availability of data and the objectives of the particular intervention they are testing. The increasing interest in NC is likely to encourage the development of more tools for a broader range of applications.
| Mapping natural capital stocks | Quantifying ecosystem service flows | Opportunity mapping |
|---|---|---|
|
|
|
The increasing interest in NC from a policy perspective has encouraged the development of many NC tools that can be difficult for practitioners to navigate (Defra, 2021a). Defra presented a list of recommendations to facilitate their use and selection in Figure 5.

Figure 4. Recommendations when selecting a NC Tool. Source: Defra, 2021a
Click for a full description
A diagram consisting of 7 boxes:
- Define the Purpose in using the tool
- Check the quality of evidence
- Analyse if the results are easy to interpret and communicate
- Identify the Limitations of the tool
- Transparency in the methods/ methodologies used
- Review evidence of prior use
- Compare results with other tools
Additionally, there are valuable databases of NCA tools:
- Tool Assessor – Ecosystems Knowledge Network (n.d.)
- Shift Platform – MIT, Natural Capita Protocol and Natural Capital Coalition (Shift, n.d)
- ENCA featured tools for NC and environmental valuation – Defra (2021b)
2.4 Biodiversity Net Gain
Biodiversity net gain (BNG) is an approach to development or land management that aims to leave the natural environment in a measurably better state than before.
In England, the Environment Act 2021 (Legislation.gov.uk, 2021) proposes that BNG become mandatory, requiring all relevant developments to achieve a minimum 10% net gain. Biodiversity Metric 3.1 tool (Natural England, 2021) was developed to support BNG policy in England. In Scotland, national planning policy (National Planning Policy Framework 4) requires developments to have a ‘positive effects on biodiversity’, but there is no mandatory quantifiable target associated with the policy.
3. Methodology
The project aims to identify and test NCA tools for urban NbS projects in Scotland. The study employed mixed methods, qualitative and quantitative. Additionally, it takes a case study research approach based on three urban NbS projects in Scotland.
3.1 Literature review
A Literature Review was carried out at the beginning of the study. It looked at the following topics:
- Essential terms: Natural Capital, Ecosystem Services, Natural Capital Accounting, Natural capital assessments.
- Urban context: Nature-based solutions, Green Infrastructure.
- NC tools: existing NC tools for different scales (international and national), site-scale NC tools.
- Assessments of Health and wellbeing in NC tools
3.2 Discussions with different groups
Discussions with different practitioners took place throughout the study. The meetings were set individually or in groups. The practitioner groups can be divided into three, as shown in Figure 5.
Firstly, a range of teams within NatureScot participated in the discussion. The main objective was to identify how the urban NbS projects which the organization is involved with were developed and whether NCA was being applied. The discussions also helped to identify possible case studies.
Secondly, there were discussions with NC experts in other organisations including individuals in the process of developing and refining NC tools. The participants shared their knowledge about NCA and existing tools and provided valuable advice in terms of applying the tools in the case studies and interpreting the results. They were also interested in the results of the studies and the comparison with other tools.
Third, during the development of the case studies, different public sector organizations participated as stakeholders. All the parties were interested to learn how NCA tools worked and were keen to identify the ES and biodiversity impacts their projects were delivering. They also shared relevant information to support the assessments. Meetings were also organised to present the outputs and collect feedback.
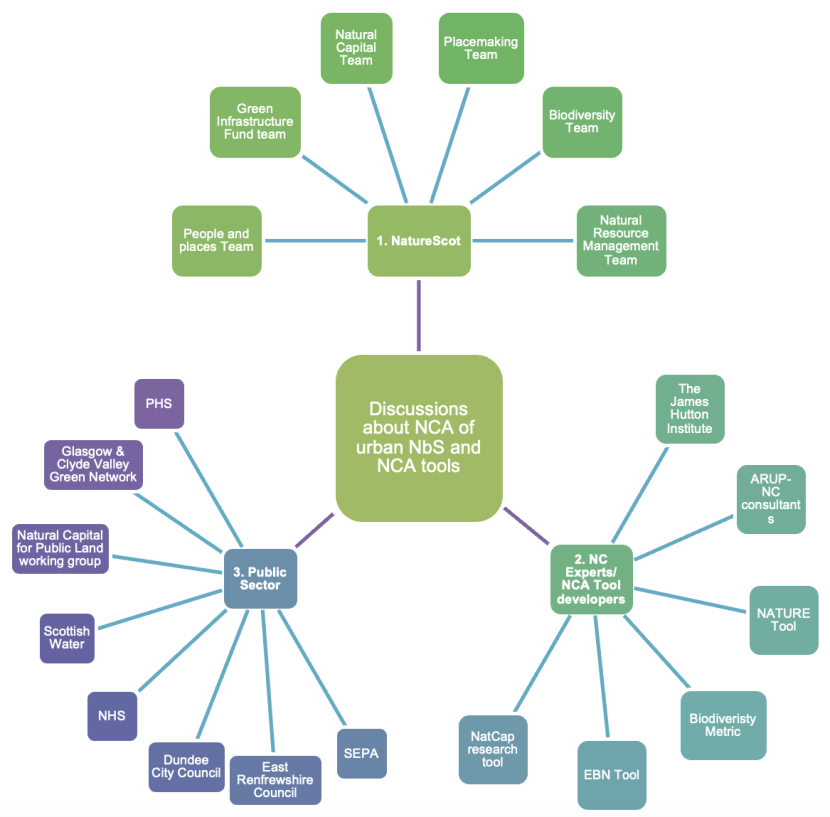
Figure 5. Discussions about NCA of urban NbS and NCA tools
Click for a full description
A diagram showing the three different parties partaking in the discussion about NCA and urban NbS (NatureScot, NC experts and the public sector) represented by three different boxes, and NC experts and NCA tool developers represented by a box in the middle that is connected to the three boxes by lines. Each party has lines radiating from it showing more boxes representing what they constitute of, e.g. the Biodiversity Team and Green Infrastructure Team for NatureScot. Scottish Water, Dundee City Council and the NHS for the public sector, and the James Hutton Institute and the Biodiversity Metric for NC experts and NCA tool developers. The parties consist of:
- NatureScot
- People and Places Team
- Green Infrastructure Fund Team
- Natural Capital Team
- Placemaking Team
- Biodiversity Team
- Natural Resource Management Team
- NC Experts/NCA Tool Developers
- The James Hutton Institute
- ARUP-NC Consultants
- NATURE Tool
- Biodiversity Metric
- EBN Tool
- NatCap Research Tool
- Public Sector
- SEPA
- East Renfrewshire Council
- Dundee City Council
- NHS
- Scottish Water
- Natural Capital for Public Land Working Group
- Glasgow & Clyde Valley Green Network
- PHS
Many of the participants were already engaged in projects where NCA was being applied. Furthermore, there was already an established connection between different organizations and experts. NHS Lothian and Natural Capital Solutions conducted a Biodiversity and Climate change assessment of their estate using a bespoke tool (Holt, A.R et al., 2021). Meanwhile, Scottish Water commissioned Nat Cap Research to develop a customized NC tool to assess their estate. SEPA and Scottish Water developed the One Planet Choices method, a future-focussed approach to decision-making for systems, which takes account of climate change, gives sustainable and resilient outcomes and gives expression of broader value. The OPC method encourages the use of NCA tools, especially B£ST - CIRIA’s tool and guidance. B£ST (Benefits EStimation Tool – valuing the benefits of blue-green infrastructure) assesses the benefits of blue-green infrastructure projects. It is a structured way to estimate the value of the multiple benefits of blue-green projects. It provides a method to assign monetary value to a range of benefits that are not normally quantified.
The Principles for NCA on Public Land in Scotland expressed the importance of standardizing the NCA methods but also acknowledged the importance of experimenting and sharing experiences.
Overall, discussions revealed a high general interest in NCA and a willingness to test NCA at a site-scale. Some stakeholders questioned the usefulness of valuing nature in monetary terms, but most were open to exploring using physical accounts. The public sector group and NatureScot teams mentioned the following as possible barriers to implementing NC approaches:
- A perception that NC is a very complex concept, mainly due to the vast amount of NC information in the literature and in practice (frameworks, theories, methods and tools)
- The perception that the application of NCA is resource intensive
- The difficulty of capturing the delivery of ES quantitatively, particularly with respect to cultural ecosystem services such as recreation or health.
3.3 Application of NCA tools in 3 case studies
3.3.1 Case Studies
The case studies selected were illustrative of a range of positive interventions in urban areas that include NbS as a key component. Projects were in different areas of Scotland and involved a range of different public sector organisations.
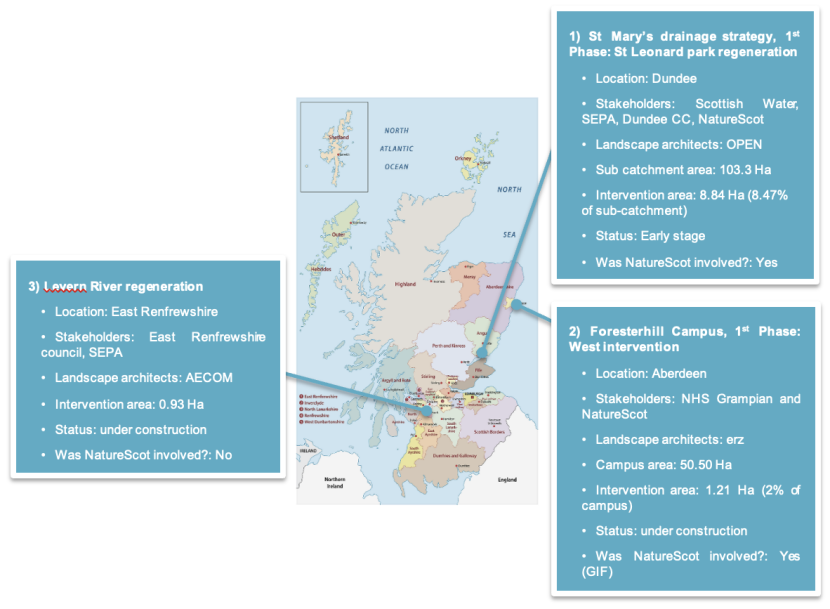
Figure 6. Location of case studies
Click for a full description
Map of Scotland showing different Local Authorities, and the location of the three case studies.
- St Mary’s drainage strategy, 1st Phase: St Leonard’s park regeneration
- Location: Dundee
- Stakeholders: Scottish Water, SEPA, Dundee CC, Nature Scot
- Landscape architects: OPEN
- Sub catchment area: 103.3 Ha
- Intervention area: 8.84 Ha (8.47% of sub-catchment)
- Status: Early stage
- Was NatureScot involved?: Yes
- Foresterhill Campus, 1st Phase: West Intervention
- Location: Aberdeen
- Stakeholders: NHS Grampian and NatureScot
- Landscape architects: erz
- Campus area: 50.50 Ha
- Intervention area: 1.21 Ha (2% of campus)
- Status: under construction
- Was NatureScot involved?: Yes (GIF)
- Levern River regeneration
- Location: East Renfrewshire
- Stakeholders: East Renfrewshire Council, SEPA
- Landscape architects: AECOM
- Intervention area: 0.93 Ha
- Status: under construction
- Was NatureScot involved?: No
3.3.1.1 St Mary’s Drainage Strategy Case Study
St Mary’s is an area in the north-west of Dundee that experiences regular surface water flooding events. These events are expected to increase in frequency and severity due to climate change (Figure 7). One of the reasons for the floods is that the area is serviced by a combined sewer for rainwater and foul water, and there is not enough capacity in the sewer at times of high rainfall.
St. Leonard Park is the main open space in the area and is the focus of Phase 1 of the St Mary’s Drainage strategy led by Scottish Water, Dundee City Council, SEPA and NatureScot (Figure 8). The park consists of predominantly amenity grassland with a small retention pond and some formal play spaces with play equipment.
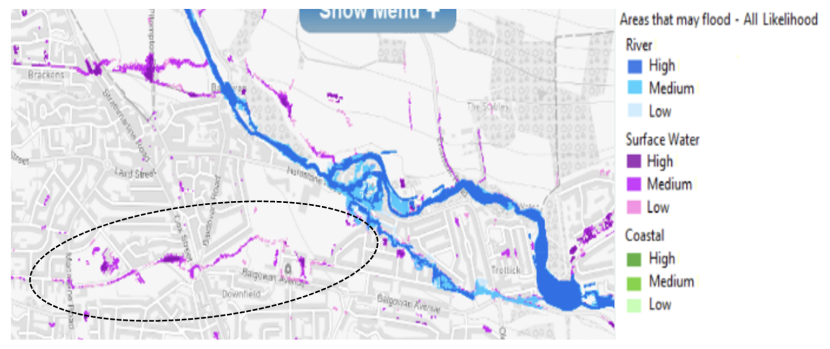
Figure 7. St Mary's Flooding map SEPA 2022
Click for a full description
A map of a part of Dundee displaying flood likelihood by the categories river, coast surface water, with the St Mary’s area demarcated as a dotted ellipse. The big map shows various strips and clusters of shades of blue to the North and East of the ellipse, indicating high and medium river flood risk outside St Mary’s, and all three shades of pink inside the ellipse, indicating different likelihoods of surface water flooding within the St Mary’s area.
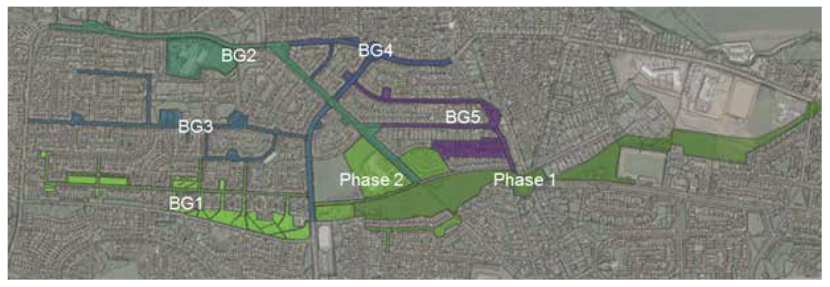
Figure 8. St Mary's Drainage Strategy. Source: OPEN, 2021
Click for a full description
An aerial map showing various, largely linear, connected polygons in the rough St Mary’s area, with the largest and widest connected area labelled as “Phase1”.
Figure 9 presents the proposal for Phase 1, designed by OPEN architects. It provides retrofitting sustainable drainage by de-culverting a burn that currently runs underneath the park, manipulating the landform, as well as introducing more habitats. It aims to bring multiple benefits to the surrounding community, including flood mitigation, recreation opportunities, biodiversity enhancement, active travel opportunities, a better sense of place, and health and wellbeing. The project is still at a relatively early stage. The concept design was approved on August 2021, and its construction is programmed for summer 2023.
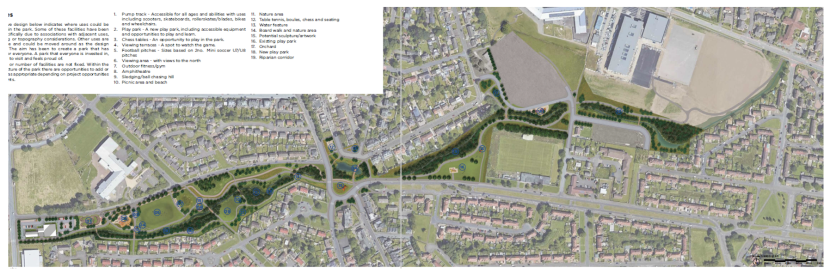
Figure 9. St Mary's Proposal Plan. Source: OPEN, 2021
Click for a full description
An aerial map of the St Mary’s area showing existing houses and roads, and with proposed trees and footpaths illustrated. Various other proposals such as viewing platforms, an outdoor gym and picnic areas are demarcated as numbers.
3.3.1.2 Foresterhill Campus (Aberdeen Royal Infirmary)
Aberdeen Royal Infirmary is the largest hospital in the Grampian area, located on the Foresterhill site in Aberdeen, Scotland. The intervention involved a 1.21ha site within the 50.50ha campus. The purpose of the intervention was to create a clear network of on-street and off-street public realm and green routes focused on pedestrian movement, which also connect into wider active travel routes. This included a series of ‘destination’ greenspaces, for patients, staff, visitors and the surrounding communities. There was also a water management system to accommodate necessary attenuation associated with future planned development.
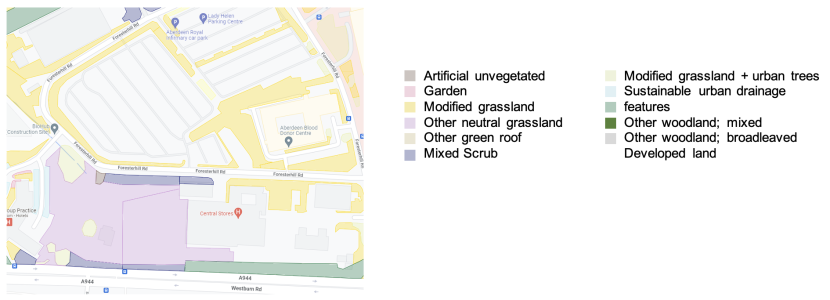
Figure 10. Foresterhill Habitat survey (existing)
Click for a full description
A map showing the various types of habitat on the Forresterhill site, made up of mainly a large area neutral grassland with some trees on the southern part of the site, a small sustainable urban drainage feature along a burn, and modified grassland fringing the car park to the north and buildings to the east.
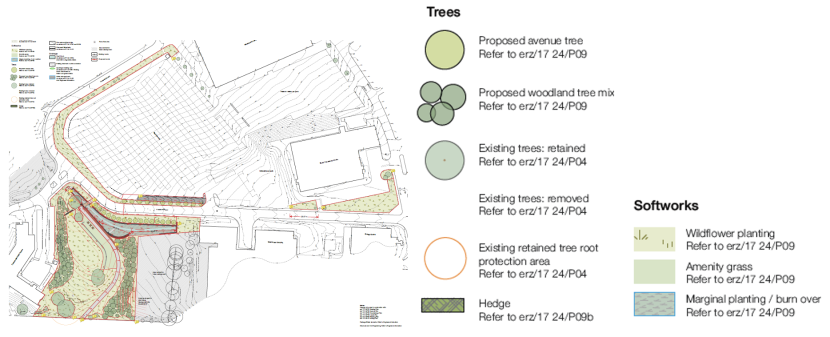
Figure 11. Foresterhill Proposals
Click for a full description
A landscape architectural drawing showing the proposed habitat alterations, primarily some woodland on the existing neutral grassland, and wildflower planting around the car park.
3.3.1.3 Levern River Regeneration
This 1ha former warehouse site is located on Walton Street in Barrhead, East Renfrewshire close to the town centre and had been empty for 20 years. The site was covered with hardstanding and building foundations with some scrub and grassland developing through the cracks. The Levern Water River crosses the site, and the Kirkton Burn watercourse, currently culverted, discharges into the river within the site. This stretch of the Levern Water was straight and canalised with an artificial bed and bank materials (AECOM, 2021) with barriers to fish passage.
The project at the time of the assessment (see Figure 12) was predicted to deliver:
- Re-alignment and re-naturalisation of the Levern Water (with natural bed and bank materials and natural meanders)
- Creation of Lowland Meadow and wet meadow, and addition of "urban pollinator' seed mixes along the new footpaths.
- New amenity grassland areas, particularly on the north side of the re-naturalised river
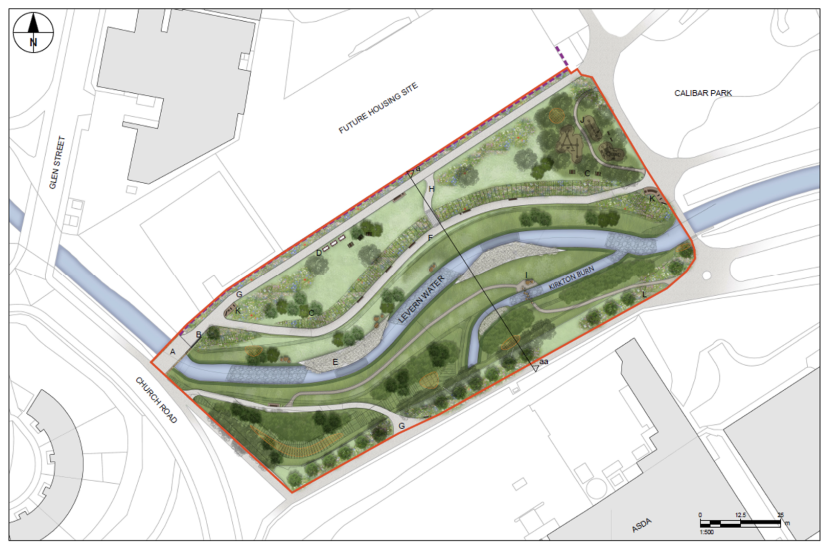
Figure 12. Levern River Proposals
Click for a full description
This diagram shows the proposed habitat improvements in blue and green, showing the realigned Levern Water, new trees and amenity grassland (individual habitats are not labelled, but show up in different colours and shapes).
3.3.2 General methodology for the case studies
Figure 13 presents the methodology applied in all the case studies. There was constant communication with stakeholders, especially at the outset. There were also interim meetings to present initial results and obtain feedback. Additionally, the NC tool developers were also involved in providing guidance and advice, including help to interpret the outputs and welcoming comments on the differences between the tools.
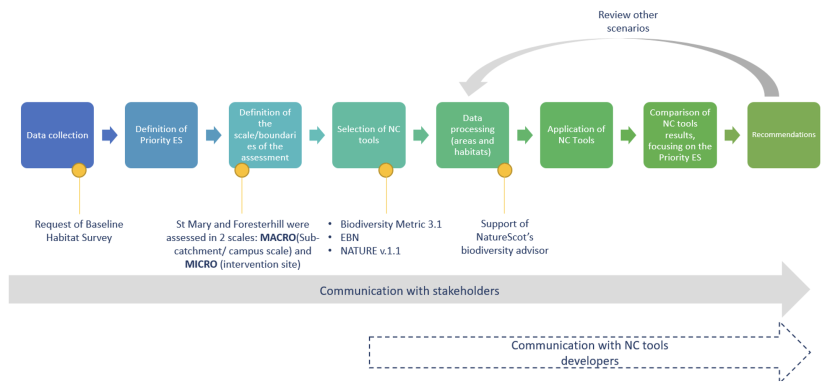
Figure 13. Methodology for case studies
Click for a full description
This diagram shows a timeline of the methodology applied in evaluating the case studies using various natural capital tools. It starts with data collection on the very left, moving on to a definition of priority ecosystem services and the scale of the assessment to the selection of natural capital tools such as the Biodiversity Metric (version 3.1) and NATURE (version 1.1). Further to the right, there’s data processing of areas and habitats, the application of natural capital tools and the comparison of results, with recommendations completing the timeline on the far right. Communication with stakeholders is represented by an arrow running all the way along the bottom from left to right.
3.3.3 Data collection, the definition of ES and assessment boundaries
The primary information required to develop the assessments was the existing areas of habitat pre-intervention (the baseline) and post-development. Levern River already had baseline data available. In St Mary, a habitat survey was commissioned, and in Foresterhill, a rapid survey was carried out to fill the data gap.
The next step was to identify which were the key ES each project was aiming to deliver. For this purpose, an Excel spreadsheet was shared with the stakeholders in which they should mark and comment on the Priority ES (Appendix I).
Another critical step was to define the geographic boundaries for the assessments. It the case of St Mary and Foresterhill, the interventions were part of a bigger project, and the stakeholders were interested in understanding the impact of the intervention in the broader context. Therefore, these projects had two assessments: sub-catchment and campus scale (that we termed ‘macro’) and site scale (that we termed ‘micro’). The Levern River was a ‘self- contained’ project and needed only one evaluation.
3.3.4 Selection of NCA tools
The selection of tools was based on the literature review developed as part of the project and the discussions with the practitioners. During the first case study at St Marys, other tools were considered too, but they were found not to be applicable to the development phase of the project (B£ST required detailed information) or the size and context of the project (NatCap map tool assessed minimum 40ha and the version was developed for rural sites. It is an online tool developed by NATCAP Research uses a database of open-sourced data to generate a NC map of a user –specified area of land. The user traces a polygon of the assessment area on an interactive map, and a report is generated presenting the baseline data of NC assets, e.g. land cover, topography, soil type, and the ES flow, e.g. carbon storage, flood risk reduction, pollination. Results are given in tables and maps). The tools applied during the assessments were therefore as follows:
Biodiversity Metric 3.1
The UK Biodiversity Metric was developed to support policies in England’s National Planning Policy Framework that aimed to minimise impacts on, and provide a net gain for, biodiversity (Ministry of Housing, Communities & Local Government, 2012) through development and other land use change. The Environment Act 2021 (Legislation.gov.uk, 2021) proposes that biodiversity net gain becomes mandatory by 2023, requiring at least 10% net gain in biodiversity units. The Excel-based tool, managed by Natural England, calculates how development or a change in land management will affect the biodiversity value of a site, demonstrating the BNG or losses in a consistent way. It uses habitat as a proxy for broader biodiversity, with different habitat types scored according to their distinctiveness. Distinctiveness is based on the type of habitat and its distinguishing features including consideration of species richness, rarity (at local, regional, national and international scales), the extent to which it is protected by designations and the degree to which a habitat supports species rarely found in other habitats (Panks et al., 2022). This value is then adjusted, depending on the condition and location of the habitat, to calculate ‘biodiversity units’ for that specific project or development (Panks et al., 2022).
Environmental Benefits from Nature (EBN)
EBN, developed by Natural England, is an Excel-based tool designed to be used in conjunction with Biodiversity Metric (Smith, et al. 2021). While the latter calculates BNG, EBN identifies opportunities to enhance ES provision and to avoid or minimise adverse impacts by comparing the baseline with new proposals. It is based on scores (on a scale of 0-10) for the ability of different land cover types to deliver 18 ecosystem services. The approach mirrors the Biodiversity Metric’s methodology by applying a matrix of scores for various habitats and ecosystem services which are modified by factors reflecting habitat condition, spatial location, delivery risk, and time for new habitats to reach maturity. The tool focuses on England and Wales and complements the data sources available for those areas. Benefits are assessed in 1, 10 and 30 years. This study applied equivalent data relevant to Scotland (Appendix IV).
NATURE Tool 1.1
The tool development is led by WSP and the Ecosystem Knowledge Network (EKN). The NATURE Tool allows the assessment of up to 17 ecosystem services, physical and mental health benefits, and the abated carbon emissions from photovoltaic (solar) installations (abiotic service) through a scoring system, indicating both the direction and magnitude of project impacts (Hölzinger et al., 2022). These scores are aggregated based on policy priorities, which can be selected between England, Wales, Scotland and North Ireland and can also be adjusted according to the user’s preferences. The newest version (1.1) also assesses the Carbon impacts (vegetation, soils, and abated through photovoltaic) in terms of tonnes of carbon dioxide equivalent (t CO2e) and monetary terms following HM Treasury Green Book guidance (2022). The NATURE Tool can be applied to schemes anywhere in the UK. It is designed to accommodate data likely to be available in each nation. The user can define the timeframe for assessing benefits, but the guidance recommendation is at least 30 years.
More information about the tools is provided in Appendix V. For all the tools, the user guidance stresses that whilst the outputs help to inform plans and support decision-making, the results always need to be interpreted with ecological expertise and common sense. The guidance encourgaes the iterative use of the appraisals alongside project development, highlighting that there are likely to be more significant benefits from using them at an early stage to optimise opportunities to deliver more NC through a planned intervention.
3.3.5 Data processing
At St Mary and Foresterhill, the tool was applied at a macro scale (the intervention site plus the sub-catchment and hospital campus respectively) and the micro scale (evaluating the intervention sites in and of themselves) to understand the scheme's impact in different contexts. Data processing included splitting the habitat data in terms of habitat type, extent and condition. It was also necessary to divide the data between the habitats that were going to be enhanced, retained and created. The baseline data were obtained from the Habitat Survey reports, while the ‘proposal’ data was based on ‘habitat creation’ maps developed by landscape architects. Excel was used to process the area data.
The three tools do not use the same habitat classification as ‘inputs’. Biodiversity Metric and EBN use an adapted version of UK Habitat Classification - a new, free-to-use, unified and comprehensive approach to classifying habitats, while NATURE uses PHASE 1 - a standardised system for classifying and mapping wildlife habitats in all parts of Great Britain, including urban areas. An additional difficulty in evaluating ‘before and after’ was that the habitat surveys and landscape plans available that were associated with the project-plans used different nomenclature to the established classifications. To address this, the landscape plan habitat categories had to be ‘mapped across’ to identify equivalent categories in the established classifications with the guidance of NatureScot’s biodiversity advisor.
3.3.6 Application of NCA tools
Several ‘runs’ of the data were made before obtaining the final outputs. The support of the tool developers was vital in this stage. Discussions with the stakeholders also helped get more relevant data. Stakeholder interest in the NC assessments increased once the drafts were presented and at St Mary and Foresterhill, stakeholders requested additional analysis of other potential planning scenarios. For example in St Mary an assessment was made based on an assumption that that the city council’s housing in the sub-catchment would have rain gardens installed.
During the application of the tools, the following assumptions were made:
St Mary
- The biodiversity of the amenity grassland/modified grassland is enhanced c.f. the existing park.
- Some existing neutral grassland will be changed into other habitats.
- Most of the existing urban trees were enhanced, and a minimum was lost.
- The future park will host occasional educational visits.
- At the baseline, existing urban trees are considered to be in moderate condition, while other habitats are in poor condition. All habitats in the intervention site will reach good condition.
- Pavements, playgrounds, cycle lanes, and roads were considered sealed surfaces.
Foresterhill
- An appropriate management programme for the intervention site would be in place, especially for the new lowland meadow areas.
- Educational or cultural events are programmed every month.
- All habitats in the intervention site will reach good condition.
3.3.7 Comparison of results and dissemination
Finally, the results of the three tools were compared. A comparison table presents the results of the Priority ES initially identified. Additionally, other ES shown in EBN and Nature help to find additional benefits delivered by the projects. For each project, the assessments helped to generate a list of recommendations in terms of possible design modifications.
Biodiversity Metric is the only tool that measures BNG, while EBN and NATURE present some ES in common. Where outputs from different tools relating to the same ES appeared to contradict each other, the respective data and methodologies were analysed in more detail to explore the reasons behind those differences. Each case study has a separate report analysing the process and the outputs in more detail. In this summary report, the main focus is understanding the differences between the results of the tools and their applicability in Scotland.
4. Results
4.1 Priority Ecosystem Services (ES)
The three case studies each have their own set of priorities in terms of ES. Appendix IV presents the definitions of each ES given by the tools. Levern River included a longer list of priority ES. The ES that were common to all cases were biodiversity, flood regulation and recreation, although biodiversity is not generally regarded as an ecosystem service in and of itself. All the schemes include NbS designed to reduce flooding events in the area. Additionally, improving public accessibility (directly related to recreation) in all the locations is a central purpose of all the schemes.
| St Mary | Foresterhill | Levern River |
|---|---|---|
|
|
|
4.2 Baseline and post-development habitats
All the tools are habitat-based and require baseline data on the extent of each habitat pre- and post-intervention. St Mary and Foresterhill were analysed as small interventions in a much larger ‘sub-catchment/campus area (macro) in addition to being analysed as sites in and of themselves (micro) (Figures 14 and 15). The interventions represented 8% and 2% of the macro ‘sub-catchment/campus area respectively. Results at a macro-scale, therefore show small percentage changes in habitats.
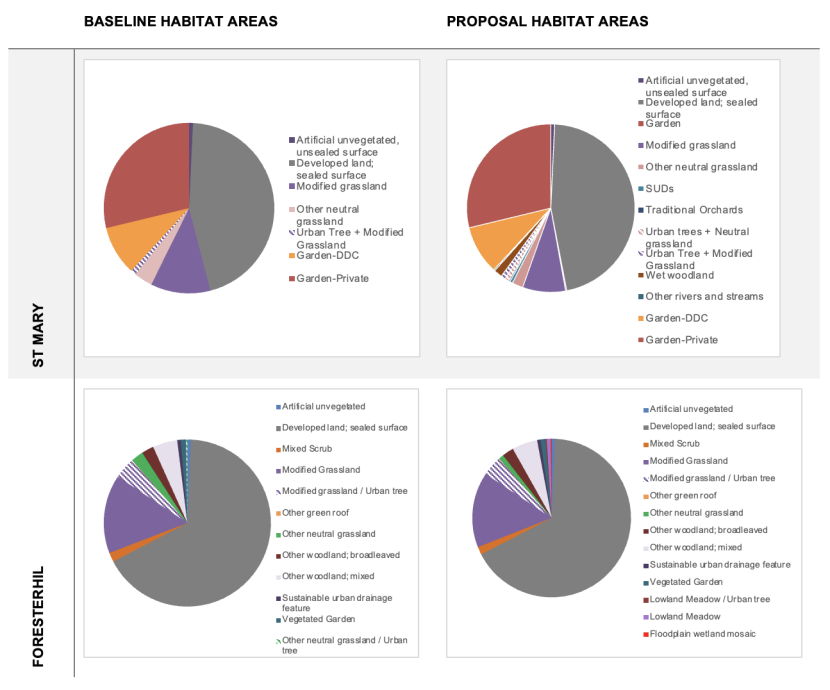
Figure 14. Macro analysis habitat areas
Click for a full description
This shows four pie charts, of the baseline and proposed habitats at St Mary’s and Foresterhill respectively, at the macro-scale. Habitats such as green roofs, neutral grassland and mixed scrub occupy rather thin wedges of the pie, while sealed surface occupies almost half of the pie at St Mary’s, and almost three quarters at Foresterhill, the next biggest slice being modified grassland. The proportion of habitat changes are marginal and hardly noticeable at the macro-scale.
Figure 15 presents the results of the ‘micro-scale’ analysis, in other words, analysis of the interventions as sites in and of themselves, rather than as part of a larger sub-catchment/ campus area. At St Mary, ‘modified grassland’ was the main pre-intervention habitat, whereas ‘post intervention’, ‘developed land’ becomes the most predominant surface (paths, gym, parking lot and playground). The proposals involve the establishment of wet woodland, traditional orchards, gardens, SUDs features, more urban trees and neutral grassland. A key element of the proposal is a de-culverted burn.
At Foresterhill, neutral grasslands were the primary pre-intervention habitat, largely then replaced by mixed woodland and lowland meadow. The extent of mixed shrub was reduced significantly. The conditions of the neutral grassland ‘pre-intervention’ were considered good, and its removal is likely to result in a decrease in biodiversity units as measured by the biodiversity metric. Floodplain wetlands and sealed surfaces (paths) were part of the proposals.
At the Levern River site, the area of broadleaved woodland was significantly reduced during the re-profiling/ re-meandering of the river and much of this was replaced by lowland meadow. Other new habitats including mixed shrubs, modified grassland, inland rock/scree and developed land (pathways).
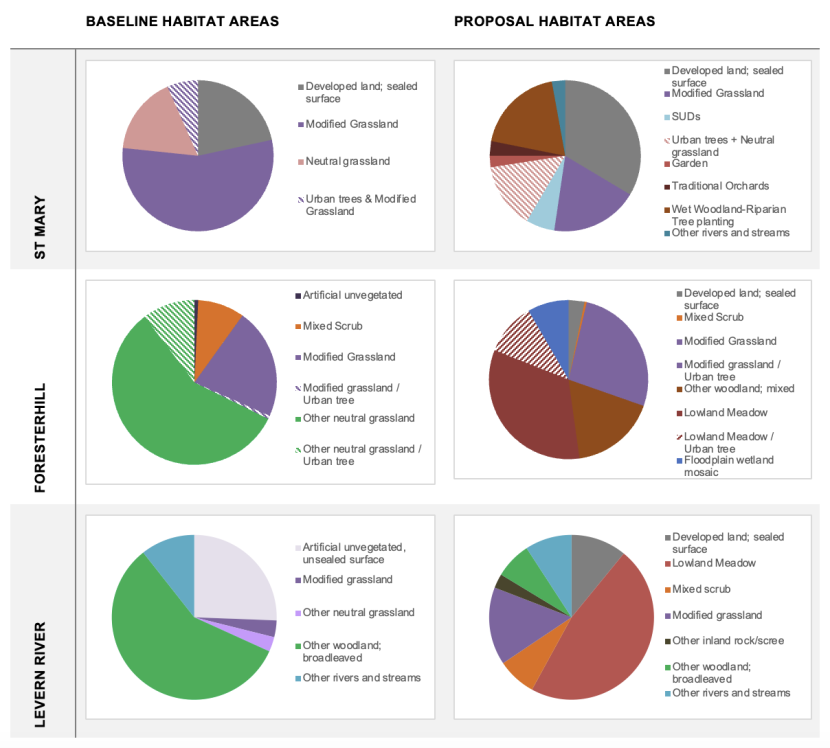
Figure 15. Micro-analysis habitat areas
Click for a full description
This shows 6 pie charts of the baseline and proposed habitats at St Mary’s, Foresterhill and Levern River respectively, at the micro-scale. For St Mary’s, the major wedges in the “baseline” pie on the left are modified and neutral grassland, and developed surface. The “after” pie on the right shows the addition of a few smaller wedges labelled “other rivers and streams”, “traditional orchards” and “garden”, an increase in sealed surface, and a decrease in neutral and modified grassland.
For Foresterhill, the major wedges in the “baseline” pie on the left are “other neutral grassland”, “other neutral grassland and urban trees” and “modified grassland”. In the “after” pie on the right, these biggest wedges are replaced by “lowland meadow” and “lowland meadow and trees” and “other woodland - mixed”. The “mixed scrub” slice is smaller than in the chart on the left hand side, and there is also a new slice labelled “floodplain wetland mosaic”.
Lastly, for the Levern River, the pie on the left hand side has one major slice taking up more than half of the pie labelled “other woodland – broadleaved”, and a quarter is “artificial unvegetated surface”. This changes in the pie on the right, with the largest slice being “lowland meadow”, and other slices (including “developed land”, “mixed scrub”, “modified grassland”, “other woodland, broadleaved”, and “other rivers and streams” all put together taking up just over half of the pie.
4.3 NCA outcomes
Table 3 summarises the results obtained with the three NCA tools.
4.3.1 Expression of results: Units vs. percentages, a note of caution
In Table 3, results are presented variously as an increase in Biodiversity Units (Biodiversity Metric), an increase in ecosystem points as expressed by ‘arrows’ (EBN) and as percentage change (change in biodiversity units and ecosystem points). Care should be taken in interpreting percentage changes resulting from NCA tools. This is because in many cases an intervention will result in an entirely new habitat being created that wasn’t there before and sometimes an entirely new ecosystem service being delivered, particularly if a project involves e.g. de-culverting a burn. In these cases (although included in the table) it is not meaningful to express this as a “100% increase”, since there was no habitat at all to start with. Therefore where habitats or ecosystem services are not present ‘pre-intervention’ they are best expressed as units or points only.
4.3.2 Results at each site
St Mary and Levern River achieved positive BNG. The former is predicted to increase by 65%, which is a significant improvement considering that in England, the statutory minimum requirement is 10%. Meanwhile, Levern River biodiversity is predicted to increase by 9.70%. In both cases the results are due to the creation of high or medium-distinctiveness habitats and the improvement of the conditions in all the habitats. However, Foresterhill shows a predicted reduction of biodiversity units. The EBN guide mentions that a project must confirm +10% BNG before applying the tool, however, in this case, for the purpose of the study, the evaluation continued. The EBN team supported the decision. Despite the proposal creating high and medium distinctiveness habitats, the main reason for this is the loss of existing neutral grassland that had good biodiversity scores already.
Biodiversity metric also measures the change in river biodiversity units. River biodiversity units are the units of measurement for rivers and streams. This is to differentiate the river values from the biodiversity units representing area habitats and other linear habitats. Its calculation includes distinctiveness of the water flow, condition and extent. In the three case studies, the proposals include a change to the watercourses or standing water on the sites by de-culverting, re-shaping or improving the conditions. Although St Mary’s shows a ‘100%’ change (c.f >200% for River Levern) in delivers a larger increase in river biodiversity units than the other projects. This is because there was no water at all at St Mary’s pre-intervention. The Biodiversity Metric 3.1 guidance mentions that when a habitat has no baseline unit value and new habitat is created, the percentage increase is displayed as 100% net change. In these scenarios, check for locally defined unit targets, which should be considered in addition to these percentage increases (Panks et al, 2022)
The micro-scale assessments show significant variations at each site. The St Mary’s project is likely to deliver more, recreation, flood regulation, water quality regulation and carbon storage (the detailed review showed that in this case, the yellow arrow for carbon storage represented a minor positive change) services. Meanwhile, in Foresterhill, mental and physical health, recreation, flood regulation and sense of place ‘ecosystem services’ are predicted to improve.
Table 3. NCA outcomes summary
| ES Priorities | Biodiversity Metric | EBN (Whole area) | NATURE (50years) | Biodiversity Metric | EBN (Whole area) | NATURE (50years) |
|---|---|---|---|---|---|---|
| Biodiversity | Habitat units change River units change Trading rules? | - | - | Habitat units change River units change Trading rules? | - | - |
| Recreation | - | → | +100% | - | ↗ | +64% |
| Carbon Storage | - | → | +7% | - | → | +8% |
| Flood regulation | - | → | +5% | - | ↗ | +20% |
| Water quality regulation | - | ↗ | +1% | - | ↗ | +5% |
| ES Priorities | Biodiversity Metric | EBN (Whole area) | NATURE (50years) | Biodiversity Metric | EBN (Whole area) | NATURE (50years) |
|---|---|---|---|---|---|---|
| Biodiversity | Habitat units change River units change Trading rules? | - | - | Habitat units change River units change Trading rules? | - | - |
| Mental health | - | - | +3% | - | - | +64% |
| Physical health | - | - | +2% | - | - | +65% |
| Recreation | - | → | +4% | - | ↗ | +100% |
| Sense of place | - | → | -1% | - | ↗ | +1% |
| Flood regulation | - | → | +3% | - | ↗ | +63% |
| ES Priorities | Biodiversity Metric | EBN (Whole area) | NATURE (50years) | Biodiversity Metric | EBN (Whole area) | NATURE (50years) |
|---|---|---|---|---|---|---|
| Biodiversity | - | - | - | Habitat units change River units change Trading rules? | - | - |
| Mental health | - | - | - | - | - | >100% |
| Physical health | - | - | - | - | - | >100% |
| Aesthetic value | - | - | - | - | ↗ | >100% |
| Education | - | - | - | - | ↑ | >100% |
| Interaction with nature | - | - | - | - | ↗ | >100% |
| Recreation | - | - | - | - | ↑ | >100% |
| Sense of place | - | - | - | - | ↗ | +44% |
| Flood regulation | - | - | - | - | ↘ | -43% |
| Water quality regulation | - | - | - | - | ↘ | -39% |
| Pollination | - | - | - | - | ↗ | 0% |
| Description | Direction of arrow |
|---|---|
| Large decrease (more than -2.5 points out of 10) | ↓ |
| Decrease (-0.25 to -2.5 out of 10) | ↘ |
| Minor change (-0.25 to 0.25 points out of 10) | → |
| Increase (0.25 to 2.5 points out of 10) | ↗ |
| Large increase (more than 2.5 points out of 10) | ↑ |
Levern River predicted positive outcomes in terms of physical and mental health, aesthetic value, education, interaction with nature, recreation and sense of place. Pollination services (not considered an ES Priority for the other sites) showed a zero increase using the NATURE tool, but an increase using the EBN tool. This was because EBN tool requires the user to input an ‘index’ based on an estimate of the number of flowering plants in each habitat, while NATURE automatically gives a score based on the habitat type.
Notably, Levern River had negative scores for the flood regulation and water quality ecosystem services. Given these were key reasons for the intervention, this was something of a surprise. The results are explained by:
- The amount of trees and scrub removed prior to the re-profiling and re-meandering of the river. Trees and scrub are better at slowing down surface water run-off than grassland.
- The tool only measures flood regulation in relation to the site itself, based on assumptions about the habitats. It does not take into account the topography of the site or the topographic profile of the watercourses.
- The categorisation of the pre-intervention habitat as ‘broadleaved woodland’ is questionable since the majority of the woodland had established through crack in what was primarily an impermeable surface.
A full flood risk assessment of the project (which considers the whole catchment and includes factors including flows/river profiles/ upstream inputs and impacts downstream) had already been carried out before the NCA. This calculated that the project would help prevent flooding in the immediate surroundings of the intervention. Therefore where NCA tools are being used to assess impacts on flooding, they should be interpreted carefully alongside more detailed flood risk assessments that use standard tried and tested methodologies.
Many of the increases in ecosystem services predicted by the tools at the Levern site are cultural services. These include Mental Health, Physical Health, Aesthetic value, Education, Interaction with Nature, Sense of Place and Recreation. The Mental and Physical health measures are based on an index using the Aesthetic value, Interaction with Nature, Sense of Place ‘outputs’ as ‘inputs’. The positive impacts are largely down to the fact that prior to the intervention there was no public access to the site. The following lists (Table 4) show the complete ES predicted to be delivered by the projects using the NCA tools.
| St Mary | Foresterhill | Levern River |
|---|---|---|
|
|
|
5. Discussion
5.1 Applicability of tools in Scotland
The results from the case studies mostly support the expectation that the Priority ES, considered when designing the interventions, are likely to be delivered in practice. Overall, there is consistency and cohesiveness between the NC tools’ results and what we might expect given habitat and surface changes within the proposals.
The three NC tools are applicable in Scotland and indeed are already being used.
The following issues should be taken into account when using the tools:
Biodiversity Metric
- The tool was developed for England. Distinctiveness values must be reviewed to see if they align with Scotland’s habitat priorities.
- The tool uses an adapted version of the UK Hab classification, which is not commonly used in Scotland or NatureScot. If intending to use a NCA tool, consider requesting ‘UK Hab’ habitat surveys of the site and ask project planners to express landscape plans in ‘UK Hab’ categories.
EBN
- The tool requires data inputs and provides data sources where some of the data might be found. However, all references are limited to England. A list of Scotland sources was developed to facilitate its application in the case studies (Appendix II).
- If a source cannot be found, the field can be left as "don't know" (NK). This does not mean a study can’t be completed, but, the results are likely to be less reliable.
- Users can enter habitat types using UKHab, Phase 1 or Biodiversity Metric habitat units.
NATURE
- The tool has been developed for the whole of the UK. The tool asks for the project's location as one of the inputs so the data sources can be selected accordingly.
In order to make the tools more applicable to the Scottish context, it is recommended that NatureScot and other relevant organisations actively participate in developing subsequent versions of the tools.
5.2 Main differences between EBN and NATURE
The following table (Table 5) summarizes the main reasons EBN and NATURE presented different results in some ES.
| - | EBN | Nature |
|---|---|---|
| BNG | Requires confirmation that the project reaches BNG +10%. BNG is not included in the calculations of ES. | Biodiversity is optional for the assessment. BNG is not included in the calculations of ES. |
| ES (Appendix IV) |
|
|
| Habitat Classification used | UK hab, Phase 1 and Biodiversity Metric | Phase 1 |
| Presentation of results | Arrows - Change in average score per Ha In EBN the yellow arrow represents ‘minor change’, which can be positive or negative. | % - Percentage change between post-development and construction against baseline in every ES. NATURE uses percentages which shows the direction and magnitude of project impacts. Carbon impacts (vegetation, soils, and abated through photovoltaic) in tonnes of carbon dioxide equivalent (t CO2e) and monetary terms (£) |
| Evaluation period | 1, 10 and 30 years | The user sets the assessment time frame. The guidance recommends at least 30 years. |
| Trees’ maturity | Time factors are aligned with Biodiversity Metric, which considers that after 30+ years, trees reach maturity (target condition to deliver ES). | Trees reach maturity after 40-50 years. For woodland, carbon stock (changes) are based on the Woodland Carbon Code (WCC) calculation tool (version 2.1). |
| Different Multipliers to calculate ES (Appendix IV) | E.g. The Recreation Score is based on a habitat base score, as well as the following multipliers:
| E.g. The Recreation Score is based on a habitat base score, as well as the following multipliers:
|
| Different inputs | E.g. For pollination, EBN asks if the habitats have/will have flowers and insects | E.g. For pollination, NATURE assigns scores for each habitat based on different data sources. |
| Additional Comments |
|
|
5.3 NC Tools’ Limitations
The primary limitations identified across the tools in this study are the following:
- NCA results always need to be considered indicative. They need to be interpreted with ecological expertise and common sense. Further assessments (e.g. flood risk modelling) are recommended to double-check the results.
- Tools used during the study do not capture aspects like changes in the topography of a site, depth of soil or substrate or the profile of a watercourse, which can significantly impact the range of ES delivered by a project in practice.
- EBN and NATURE do not include Biodiversity Metric results in their calculations for assessing ES. Biodiversity is not an ES in and of itself, but there is a strong connection between them and as a very general rule, bigger, more connected, more biodiverse sites are likely to deliver a wider range of ecosystem services. EBN and Nature include different indicators to evaluate the condition of each of the habitats, which are included in their calculations.
6. Conclusion
- The three case studies showed that the three tools could be applied in Scotland.
- The NC assessments helped confirm that the projects will deliver most of their priority ES and identified some additional ES.
- NC assessments generate interesting discussions between the designers, planners and ecologists. E.g. In Foresterhill, after the results obtained in this study, NatureScot are supporting the development of a management plan to improve biodiversity on the campus.
- NC results must always be considered indicative, project planners will usually require additional environmental surveys to check the results, especially with respect to flood risks and water quality.
- EBN and NATURE produce different outputs/ values, for particular ES. This supports the importance of comparing results between tools to have a better understanding of the project, but also of the tools. The results always need to be interpreted with ecological expertise and common sense. It is essential to highlight that NCA tools are still in a development phase at the moment.
6.1 Top-tips in preparing and carrying out a NCA
- Identify Priority ES with stakeholders at the beginning of the assessment/ project (use Appendix I or similar). Assessments and data gathering can focus on the selected ES.
- Carry out Habitat Surveys from the beginning of a project (baseline) before any interventions. It is essential to have a detailed baseline assessment to identify the improvements of the intervention. This can also it can support the long term monitoring of the site.
- Request the surveyor or the designer, or develop a surface chart using the same classification as the tools you intend to use for the baseline and for any post-intervention assessment. This will avoid confusion in the selection of habitats.
- Consult with the designers and stakeholders about which habitats will be enhanced, retained, lost and created. Also, request the current and target conditions of the habitats. Process your data to show these considerations clearly.
- Use NCA as an iterative process throughout the project. The assessments can support decision-making, especially in the selection of habitats. Update the assessments as more detailed designs emerge.
- If needed, use NC tools to assess different scales and phases of a project. This can help review other opportunities to improve the whole area.
- Consider the outputs as indicative. Use more than one tool to compare and cross-check the results. Develop further analysis, especially in priority ES
- Understand the “science” behind each tool. Please read the guidance of the tools cautiously, but most importantly, use them! Experiment with the tools in projects you know and review if the scores you are obtaining are logical. If not, double-check your inputs and check the scores given to the habitats in your project. (Consult Appendix V for valuable tips and considerations when applying Biodiversity Metric, EBN or NATURE.)
- Maintain fluent communication with the stakeholders, designers, and biologists/ecologists. All the parties’ inputs are essential when developing the assessments.
7. Bibliography
Barbier, E., 2011. Capitalising on Nature. Cambridge: Cambridge University Press.
Costanza, R. and Daly, H., 1992. Natural Capital and Sustainable Development. Conservation Biology, 6(1), 37-46.
Defra, 2021a. Enabling a Natural Capital Approach guidance
Defra, 2021b. ENCA featured tools for assessing natural capital and environmental valuation
Ecosystems Knowledge Network, n.d. Welcome to Tool Assessor
Eftec, 2021. Natural Capital Accounting Practices in the UK. A briefing note in partnership with COWI
Ekins, P., Simon, S., Deutsch, L., Folke, C. and De Groot, R., 2003. A framework for the practical application of the concepts of critical natural capital and strong sustainability. Ecological Economics, 44(2-3), 65-185
Holt, A.R., Dempsey, N., Henneberry, J.M., Ashby, M. and Lush, C. (2021) Biodiversity and climate change assessment for the NHS Lothian estate. Report to the NHS Lothian, Natural Capital Solutions Ltd, February 2021
Hölzinger, O., Morris, J., Kirby, M and Chavan, R. , 2022. Introduction, User Guide & Methods for NATURE Tool Version 1.1 BETA. WSP, p. 214
HM Treasury, 2022. The green book (2022)
Legislation.gov.uk, 2021. Environment Act 2021
Ministry of Housing, Communities & Local Government, 2012. National Planning Policy Framework
NatureScot, 2022. Ecosystem services - nature's benefits
NatureScot, 2022. Corporate plan 2022-2026 - a nature-rich future for all
Natural Capital Coalition. 2016. Natural Capital Protocol
Natural England, 2021. The biodiversity metric 3.1 - JP039, Natural England - Access to Evidence
ONS, 2017. Principles of Natural Capital Accounting. Office for National Statistics.
Panks, S., White, N., Newsome, A., Potter, J., Heydon, M., Mayhew, E., Alvarez, M., Russell, T., Scott, S., Heaver, M., Scott, S., Stone, D., Treweek, J. and Butcher, B., 2022. Biodiversity metric 3.1: Auditing and accounting for biodiversity – User Guide.
Scottish Government, 2022. Biodiversity strategy to 2045: Tackling the nature emergency.
Smith, A., 1998. An inquiry into the nature and causes of the wealth of nations. [Milano]: Cofide.
Smith, A., Baker, J., Berry, P., Butterworth, T., Chapman, A., Harle, T., Heaver, M., Hölzinger, O., Howard, B., Norton, L., Rice, P., Scott, A., Thompson, A., Warburton, C. and Webb, J., 2021. Environmental Benefits from Nature (EBN) Tool – User Guide (Beta Version, July 2021). Natural England.
UK Hab, 2022. ukhab – UK Habitat Classification