NatureScot Research Report 1300 - Scoping the feasibility of developments to the Terrestrial Bird Indicator for Scotland - urban, farmland and wetland indicators
Year of publication: 2022
Authors: Martay, B. and Noble, D. (British Trust for Ornithology)
Cite as: Martay, B. and Noble, D. 2022. Scoping the feasibility of developments to the Terrestrial Bird Indicator for Scotland – urban, farmland and wetland indicators. NatureScot Research Report 1300.
Keywords
urban birds, farmland birds, wetland birds, indicators, trends
Background
Biodiversity indicators provide a useful and accessible measure for helping understand changes in the state of our environment. Being relatively well studied, bird indicators provide a robust measure to assess changes to Scotland’s biodiversity. The terrestrial breeding bird indicator has been updated annually for Scotland since 2005 covering a period starting from 1994. The current indicator comprises four categories: all species; farmland; woodland; and upland. Changes in these categories are useful for identifying where conservation action may be required and helping to inform policy and strategies at a Scotland scale.
This report assesses the feasibility of creating new categories within the terrestrial breeding bird indicator, focussing: on urban; wetland; and adaptions to the existing farmland indicator (to include three sub-categories).
Main Findings
- Sufficient data were available to produce a reliable urban indicator for Scotland. Fourteen species were included in this, representing 21% of the species in the All-species indicator. The Urban indicator showed an increase in Urban birds between 1994 and 2005 (all 1994 indices = 100, 2005 index = 139 (95% confidence intervals = 121, 161)), followed by a decline (2019 index = 119 (104, 138)), resulting in a small but significant increase overall between 1994 and 2019 (similar to that seen in the All-species indicator). Several species showed different trends in urban habitats, compared with other habitats. The greatest winner in Scottish urban habitats compared with other habitats was the woodpigeon. It increased across all of Scotland by 6% between 1995 and 2019, while in urban habitats it increased by 188%. House sparrows, song thrushes and blackbirds all declined in urban habitats but increased across other habitats. There are a number of possible drivers for their urban declines, including lower invertebrate food quality for chicks, increased disease and increased predation in urban environments.
- For Farmland, it was possible to produce indicators for Arable (23 species with habitat-specific trends), Pastoral (26 species with habitat-specific trends and additional data for Corncrake), Woody farmland (23 species with habitat-specific trends) and Wet farmland (six species with habitat-specific trends and farmland-specific trends for an additional three to five species).
- The key pattern evident in the four disaggregated farmland indices was the positive trend on pastoral farmland (2019 index = 131 (118, 150)), particularly compared to arable (2019 index = 97 (85, 111)) and wet farmland (2019 index = 84 (70, 105)). The positive trends on pastoral farmland compared to arable farmland was found across most species: 70% of species that contributed to both the pastoral and arable indicators had more positive trends on pastoral farmland.
- It was possible to produce a general Wetland bird indicator from 14 species (using all BBS data for these species, and potentially eight species with additional data from the Waterways Breeding Bird Survey (WBBS) data). We also produced a Fast-flowing water indicator with three species, and a Wet grassland indicator with five species (in both cases using all BBS data for these species). There were insufficient data to produce meaningful indicators for breeding birds of Reedbeds (only two species had sufficient data to produce trends) or for Slow-moving and standing water (only one species had sufficient data to produce trends).
- The wetland indicators all showed declines among wetland species (2019 index = 81 (72, 92)). The declines were generally in wader species, such as common sandpiper, curlew, lapwing, oystercatcher and redshank. Lapwing and curlew breed on wet grassland and upland habitats and are experiencing declines across all types of farmland, wetland and upland habitats in Scotland (and more widely in the UK). Species showing large population increases include sand martin, reed bunting and mute swan. Sand martins and reed buntings are showing greater increases in Scotland than in England, possibly due to climate change.
Acknowledgments
Most data for this report comes from the BTO/JNCC/RSPB Breeding Bird Survey and is jointly funded by the BTO, RSPB and JNCC. Field work for the BBS is conducted by volunteers and we are very grateful to them, and volunteers in other surveys that contributed to this work. We would also like to thank Simon Foster (NatureScot) and Jen Smart (NatureScot – Scientific Advisory Committee Expert Panel) for their helpful comments on this report.
Abbreviations
British Trust for Ornithology (BTO)
Breeding Bird Survey (BBS)
Joint Nature Conservation Committee (JNCC)
Royal Society for the Protection of Birds (RSPB)
Wetland Breeding Bird Survey (WBBS)
Introduction
Terrestrial breeding bird indicators have been produced by the British Trust for Ornithology (BTO) for NatureScot for more than 15 years. The indicators are designed to indicate environmental change within specific habitats, based on population trends of common bird species in Scotland. They are updated annually using the latest results from national bird monitoring programmes and surveys. They are also Official Statistics, comprising one of the Scottish Government’s measures of the state of the natural environment, pressure or responses (Index of abundance Scottish terrestrial breeding birds 1994 - 2019).
The indicator currently comprises four categories: ‘all species’ (the overall bird indicator); farmland; woodland; upland. The data mainly come from the BTO/JNCC/RSPB Breeding Bird Survey (BBS), which began in 1994. Species were selected for inclusion in these indicators based on a measure of their habitat preferences and whether there was sufficient BBS data to calculate a trend. Additional information for selected species comes from periodic national surveys. These surveys use bespoke methods and provide more robust measures of change, albeit over longer intervals, for some scarcer species than BBS results typically would. There are eight species for which other data sources are used (capercaillie, corncrake, golden eagle, peregrine, hen harrier, black grouse, grey heron, dotterel) which are surveyed about every 12 years. However, because most of the data come from the BBS, the indicators only cover the period of its operation from 1994 to the present. More information on the production of indicators is available online: A Brief Introduction to the Wild Birds Populations Indicator.
The farmland, woodland and upland indicators are constructed from the aggregated trends of constituent species, including information from species strongly associated with each habitat (specialists) and species widely found in the habitat but which do show a preference for it (generalists). Species habitat preferences were assigned during the original development of these indicators based on calculations of Jacobs’ Preference Index using Scottish BBS data (Jacobs, 1974). For all three indicators, farmland, woodland and upland transect sections identified based on combinations of the BBS habitat classification codes input by the surveyors. This is possible because in each 1-km BBS square, habitat codes and bird counts are recorded in each of ten 200m transect sections (see BBS Habitat Recording).
For the generalists, habitat-specific trends were created from BBS data extracted from individual transect sections of the habitat in question within each square. In contrast, for the specialist species, trends were created from all BBS data (effectively the same species population trend as reported annually in the BBS report). This allows rarer specialist species to be included in the indicators where they may not be enough data available to create habitat-specific trends. Importantly this means that ‘generalist’ species may contribute to more than one sub-indicator but do not completely overlap in the BBS data used. The habitat-specific trends of generalists and country-wide trends of specialists are combined (giving each species an equal weighting) to show how bird populations in farmland, woodland and upland habitats are changing over time.
See Table 1 for more information on the data used for each of the current sub-indicators.
Farmland and woodland make up a large portion of Scottish BBS transect sections, making the sample sizes of most species with a preference for these habitats high enough to produce reliable trends. The standard cut-off for producing region- or habitat-specific BBS trends is for a species to be recorded in at least 20 BBS squares/ year on average.
One limitation of the current Scottish Terrestrial Breeding Bird Indicator is that it currently includes sub-indicators solely for farmland, woodland and uplands. Given that BBS habitat codes encompass a range of other habitats including human habitats, semi-natural habitats, coastal and wetlands, there is potential for indicators of other habitats of interest to be produced. However, for less common habitat types, there may not be enough BBS data available to produce habitat-specific trends for many species, and there may be fewer sufficiently widespread specialist species for which trends can be calculated. In this report we explore the possibility of producing additional habitat-specific indicators, and scope possibilities for disaggregating the farmland indicator to different components of farmland.
Specifically, we tested whether we could:
- create a new urban indicator, using firstly, a broad definition of urban which included rural, suburban and urban habitats, and secondly, a more narrow definition of urban indicator (i.e., excluding ‘rural’ sites).
- disaggregate farmland into components such as arable and pastoral farmland, woody farmland and wet farmland.
- produce wetland indicators using as a starting point the wetland species identified in the development of UK wetland indicators: all wetland birds associated with either fast flowing water, slow and standing water, reedbeds, or wet grasslands.
Methods
Given the aims, our approach was to identify the species whose population status should ideally contribute to an indicator in each habitat type. We then tested the capacity of existing data for species populations occupying that habitat to produce trends. Finally, we assessed the new indicators for representativeness and their usefulness for understanding of bird populations in Scotland.
BBS methods
The Scottish bird indicators use BBS data to indicate environmental change based on bird population trends. The data used to calculate bird trends comes from the BBS, in which volunteers count birds twice annually in the breeding season in randomly selected 1-km squares across the UK (Gregory, 2000). Coverage has increased from 250 Scottish 1-km squares monitored in 1994 to over 600 Scottish 1-km squares monitored in 2019 (over 4000 across the UK) (Harris et al., 2020). In this study we used BBS data from 1994 – 2019. Data from 2001 and 2020 were not included because most monitoring could not be carried out due to the foot-and-mouth outbreak and the COVID19 pandemic respectively.
Bird counts are recorded along two parallel 1-km transects within the 1-km square, divided into 200m transect section (Fig. 1). The volunteers also collect standardised habitat data for each of these transect sections and although not compulsory, habitat has been recorded on 92% of squares (Crick et al., 1992, see BBS Habitat Recording). Habitat is recorded as one of 10 habitat types (e.g. woodland, farmland, human sites), and more detailed options within each major habitat type can be recorded. Two types of habitat per transect section can be recorded (Fig. 1)
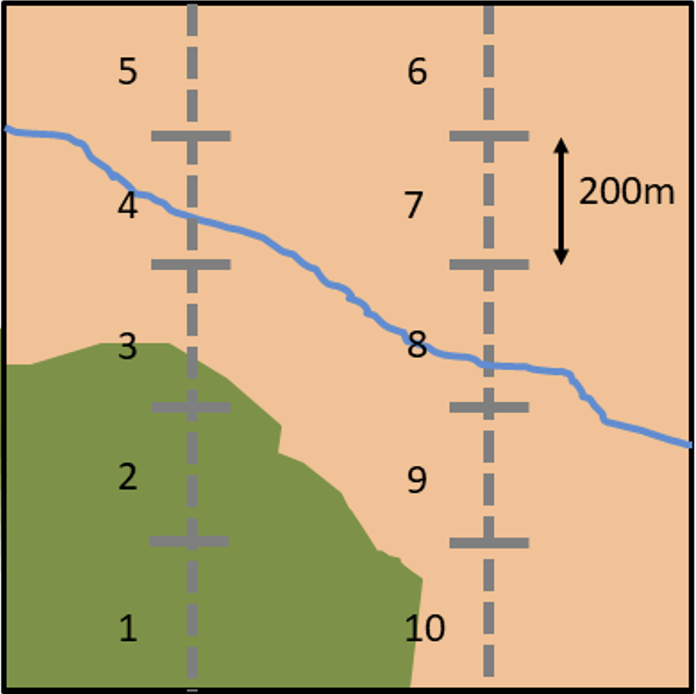
Example map of a 1-km BBS square with two parallel 1-km transects (dashed grey lines) divided into numbered 200m transect sections. Bird counts and habitat is recorded for each transect section. In this example transects 1 and 2 would be recorded as woodland (green areas) while transect 3 would be classified as both farmland (brown areas) and woodland and transect 4 as farmland and waterbodies (blue line representing a river).
Urban indicators
We identified two possible definitions of urban habitats to create an urban indicator: firstly, using the main BBS habitat divisions, and therefore defining “urban” as all BBS habitats identified as “Human sites”. Within “Human sites”, BBS transect sections are subdivided into “rural”, “suburban” and “urban” habitats. Rural transect sections currently contribute to the farmland indicator so secondly, we defined “urban” habitats as all BBS transect sections that were classified as “suburban” or “urban”. The second definition of urban habitats more closely represents true urban habitats and is more useful from a policy perspective, but the sample sizes are smaller if rural habitats are excluded, so many indicative species may not currently have adequate data to be included in an urban indicator if the narrower definition is used.
For each version of the two potential urban indicators, we examined the suitability of all species currently included in the ‘All Birds’ Scottish indicator and all species that have Scottish BBS or WBBS trends produced. We used the following steps to identify which species could be included in an indicator, ideally with habitat-specific trends:
- We identified which species could potentially be included in the indicator based on habitat preference. Species were included as potential generalist or specialist indicator species if:
(Counts within habitat / all counts) > (transect section within habitat/ all transect sections) (i.e. Jacobs’ preference index > 0). We present these metrics (transformed to ‘% of counts within the habitat in question’ and ‘% of transects within the habitat in question’ respectively) instead of the Jacobs preference index used in the original assignation of species to indicators because it is more informative to see the absolute percentages (Table 1 for table of species’ preferences).
- We determined whether the potential indicator species were common enough in the habitat in question to include habitat-specific trends in an indicator. This was defined as being present in ≥ 20 BBS squares/year including only transect sections that were of the habitat in question (Table 1 for table of species’ frequency in habitats).
- Finally, we identified whether there were specialist species within the habitat to create habitat-specific trends, which could be included in the indicator using trends from all habitats. We classified specialists as any species with ≥ 70% of counts found in the habitat or one of the three species showing most preference for the habitat. In addition to identifying specialists from current BBS data, we also identified four species as particular urban specialists from literature: House martin, swift, collared dove and house sparrow, based on the classifications in the second British Breeding Bird Atlas (Gibbons et al., 1993). For any of these habitat specialists that were not common enough to be included in the indicator with habitat-specific trends, we checked whether they could be included by (a) relaxing the cut-off criterion to include species present in ≥ 18 BBS squares/year or (b) including counts from all habitats for that species.
Farmland indicators
Here we examined whether each species currently in the Scottish Farmland Birds indicator could be included in indicators of more specific farmland habitats. We carried out a similar analysis to that described for the urban indicator for four potential indicators of different types of farmland that different species found on farmland (and currently in the farmland indicator) would be likely to be found in: arable, pastoral, woody farmland and wet farmland. As for the current farmland indicator we used only counts from farmland as defined by transect sections with primary or secondary habitat recorded as farmland (Crick et al., 1992 for BBS habitat recording methods). In addition to this, we used the following definitions:
- Arable farmland: a farmland transect section (primary or secondary) which was also recorded as tilled land or mixed tilled and grassland.
- Pastoral farmland: a farmland transect section which was also recorded as improved or unimproved grassland or mixed tilled and grassland.
- Woody farmland: a farmland transect section which also had woodland or scrubland as a primary or secondary habitat or a farmland transect which had a hedgerow, treeline or an isolated group of trees.
- Wet farmland: a farmland transect section which also had a primary or secondary habitat recorded as a waterbody.
For each type of farmland indicator we used the same three steps as outlined in the Urban indicators methods section to identify which species could be included in an indicator, ideally with habitat-specific trends if there were adequate data. For farmland birds in each of the sub-habitats (e.g. arable farmland) we did not classify any species as specialist as farmland bird habitat preferences were well identified from the data.
As there was so much species overlap between the Arable, Pastoral and Woody Farmland indicators, we created alternative indicators for each of these habitats using the species present in all three sub-indicators. These indicators differed only slightly from those based on the original selection but have the advantage of directly addressing differences in drivers between habitats without being influences by differences, albeit small, in species composition.
Wetland indicators
For this, we tested whether we could produce wetland indicators for Scottish data in the same categories identified for wetland birds (Everard and Noble, 2008) and used in the UK and England wetland bird indicators:
- fast flowing water birds,
- slow and standing water birds,
- reedbed birds,
- wet grassland birds, and
- all wetland species.
All species in these indicators are considered to be specialists as recording frequency was generally low and most are only found on or near wetlands. We therefore used trends created from all data, rather than habitat-specific trends, as has been the approach for species in the UK wetland indicators. We looked at sample sizes of all species currently used to produce the UK wetland indicators to determine if they are common enough in Scotland to create Scottish wetland indicators. Species recorded on ≥20 BBS squares/year were common enough for inclusion.
Results
Urban indicator
Urban transect sections were present (primary or secondary habitat), respectively for our two definitions of “urban”, in 11% and 6% of Scottish BBS transect sections (Table 1). There are 44 species that were commonly found in urban transect sections using our broader definition of urban (>11% of Scottish counts were on these transect sections) and 31 species commonly found on urban transect sections when using the second, narrower, definition of urban (Table 1). Of these species, 28 and 14 species, respectively, were common enough in urban habitats for inclusion in an indicator with habitat-specific trends (counted in ≥20 BBS squares/year, within the transect sections of the habitat in question) (Table 1).
House sparrow, collared dove and magpie were identified as urban specialist species, based on their occurrence percentage within Urban transect sections, irrespective of which definition of urban we used. We identified two additional species as specialists from literature: house martin and swift (Gibbons et al., 1993). The five urban specialists were all common enough to have habitat-specific trends included if the broader definition of urban was used, but only house sparrow was common enough to have habitat-specific trends included in an Urban indicator if rural transect sections were excluded. However, with a lower cut-off for specialists (counted in ≥18 urban squares /year), collared dove and magpie could also be included in an Urban indicator with habitat-specific data. House martin and swift could be included in the Urban indicator using data from all habitats.
Table 1. Bird species preferences for urban habitats.
| Species | In Scottish indicator | % of counts in ‘rural’, ‘suburban’ and ‘urban’ transect sections | % of counts in ‘suburban’ and ‘urban’ transect sections | Sqs/year in all BBS squares | Sqs/year in ‘rural’, ‘suburban’ and ‘urban’ transect sections | Sqs/year in ‘suburban’ and ‘urban’ transect sections | Recommendation |
|---|---|---|---|---|---|---|---|
|
All transect sections |
- |
11 |
6 |
335 |
106 |
34 |
- |
|
House sparrow |
yes |
71 |
46 |
115 |
66 |
28 |
Urban only |
|
Collared dove |
yes |
66 |
43 |
61 |
33 |
18 |
Urban only |
|
Magpie |
yes |
54 |
44 |
63 |
28 |
18 |
Urban only |
|
Coot |
no |
48 |
24 |
10 |
5 |
3 |
- |
|
Swift |
yes |
47 |
39 |
55 |
22 |
16 |
All |
|
Greenfinch |
yes |
47 |
23 |
105 |
49 |
21 |
Urban only |
|
Great crested grebe |
no |
46 |
0 |
2 |
1 |
0 |
- |
|
House martin |
yes |
43 |
17 |
79 |
34 |
14 |
All |
|
Blackbird |
yes |
40 |
25 |
230 |
86 |
32 |
Urban only |
|
Starling |
yes |
40 |
25 |
164 |
70 |
29 |
Urban only |
|
Moorhen |
no |
36 |
21 |
15 |
5 |
2 |
- |
|
Dunnock |
yes |
36 |
20 |
160 |
56 |
24 |
Urban only |
|
Goldfinch |
yes |
36 |
15 |
119 |
49 |
20 |
Urban only |
|
Mute swan |
no |
35 |
27 |
21 |
5 |
3 |
- |
|
Blue Tit |
yes |
31 |
19 |
190 |
69 |
29 |
Urban only |
|
Jackdaw |
yes |
31 |
15 |
138 |
56 |
23 |
Urban only |
|
Tufted duck |
no |
28 |
17 |
14 |
4 |
2 |
- |
|
Swallow |
yes |
27 |
7 |
205 |
71 |
19 |
- |
|
Little grebe |
no |
24 |
13 |
6 |
1 |
1 |
- |
|
Pied/White wagtail |
yes |
23 |
6 |
151 |
44 |
11 |
- |
|
Carrion crow |
yes |
22 |
12 |
227 |
74 |
30 |
Urban only |
|
Great Tit |
yes |
22 |
12 |
182 |
56 |
23 |
Urban only |
|
Blackcap |
yes |
22 |
11 |
83 |
25 |
11 |
- |
|
Bullfinch |
yes |
21 |
10 |
50 |
11 |
5 |
- |
|
Woodpigeon |
yes |
20 |
12 |
243 |
81 |
31 |
Urban only |
|
Whitethroat |
yes |
20 |
5 |
96 |
26 |
7 |
- |
|
Mallard |
yes |
19 |
13 |
117 |
19 |
10 |
- |
|
Chiffchaff |
yes |
19 |
11 |
77 |
20 |
10 |
- |
|
Song Thrush |
yes |
19 |
8 |
208 |
54 |
21 |
Urban only |
|
Linnet |
yes |
19 |
4 |
98 |
26 |
6 |
- |
|
Robin |
yes |
18 |
10 |
230 |
63 |
25 |
Urban only |
|
Reed warbler |
no |
15 |
15 |
0 |
0 |
0 |
- |
|
Kingfisher |
no |
15 |
13 |
1 |
0 |
0 |
- |
|
Grey wagtail |
yes |
15 |
8 |
34 |
4 |
2 |
- |
|
Chaffinch |
yes |
15 |
6 |
278 |
89 |
31 |
- |
|
Yellowhammer |
yes |
15 |
2 |
122 |
35 |
6 |
- |
|
Wren |
yes |
14 |
7 |
263 |
72 |
26 |
Urban only |
|
Rook |
yes |
14 |
4 |
122 |
39 |
15 |
- |
|
Grey heron |
yes |
12 |
6 |
56 |
8 |
4 |
- |
|
Oystercatcher |
yes |
12 |
5 |
141 |
32 |
12 |
- |
|
Great spotted woodpecker |
yes |
12 |
4 |
65 |
9 |
3 |
- |
|
Kestrel |
yes |
12 |
4 |
40 |
5 |
2 |
- |
|
Sedge warbler |
yes |
12 |
3 |
61 |
12 |
3 |
- |
|
Sand martin |
no |
12 |
3 |
36 |
5 |
2 |
- |
Farmland indicator
Farmland was present in 41% of BBS transect sections (Table 2). There are currently 27 species that contribute to the farmland indicator, all of which showed a habitat preference for farmland (calculated during the earlier development of the Scottish farmland bird indicator). We currently use habitat-specific trends for 14 species and use all available data for 13 species (Table 2). All these species have enough BBS data available to include only habitat-specific trends for all farmland except kestrel, which is only present on 18 farmland squares/year (Table 2) and corncrake, for which trends are based on a different source of data (annual counts).
Arable, Pastoral and Woody Farmland: Arable, pastoral and woody farmland transect sections were present in, respectively, 17%, 28% and 26% of BBS transect sections (Table 2). All species currently in the farmland indicator showed enough preference for each farmland habitat type, and were common enough in each habitat type, for habitat-specific trends to be included in each indicator, with the following exceptions.
The exceptions were as follows, on:
- arable farmland, kestrel, magpie, corncrake (all due to a low preference and low frequency) and reed bunting (due to low frequency) would be excluded.
- pastoral farmland, kestrel (due to low frequency) would be excluded.
- woody farmland, oystercatcher, skylark, corncrake (all due to low preference) and kestrel (due to low frequency) would be excluded.
None of these exceptions were identified as specialist species except for corncrakes on pastoral farmland. However, separate data are currently used to include corncrakes which could also be used for a pastoral farmland indicator.
There was much species overlap in the indicators based on the original selection but they did differ slightly in species composition. In the alternative indicators for arable, pastoral and woody farmland, in which we used habitat-specific trends from the same subset of species, we included all farmland species in each indicator except kestrel, magpie, corncrake and reed bunting. Oystercatcher and skylark were only just below the habitat-preference threshold for woody farmland (25% of these species were found on woody farmland transects compared to 26% of transects that were of woody farmland, Table 2) so these species were included in the alternative indicator for woody farmland. Thus, the alternative arable indicator was identical to the original but the alternative pastoral and woody farmland indicators were slightly altered.
Wet farmland: Only 3% of transect sections were identified as wet farmland and although all but three of the current farmland indicator species showed a higher preference for wet farmland than this, there were only six widespread species that were frequent enough on wet farmland to produce habitat-specific trends: swallow, carrion crow, woodpigeon, blackbird, chaffinch and skylark (Table 2. The three species showing most preference for wet farmland were sedge warbler (15% on wet farmland), oystercatcher (11%) and reed bunting (11%). These are frequent enough that trends based on all data, or all farmland transect sections could be included in an indicator. All-habitat or farmland trends could also be included for lapwing (10% on wet farmland) and pied wagtail (9% on wet farmland).
Table 2. Bird species preferences for farmland habitats.
| Species | Scottish farmland indicator | % of counts in Farmland | % of counts in Arable | % of counts in Pastoral | % of counts in Woody farmland | % of counts in Wet farmland | Sqs/year in all transects | Sqs/year in Farmland | Sqs/year in Arable | Sqs/year in Pastoral | Sqs/year in Woody farmland | Sqs/year in Wet farmland |
|---|---|---|---|---|---|---|---|---|---|---|---|---|
|
All transects |
- |
41 |
17 |
28 |
26 |
3 |
335 |
196 |
110 |
179 |
164 |
45 |
|
Yellowhammer |
All |
91 |
58 |
51 |
67 |
8 |
122 |
108 |
73 |
84 |
94 |
17 |
|
Rook |
All |
86 |
41 |
64 |
51 |
6 |
122 |
97 |
56 |
80 |
77 |
15 |
|
Linnet |
All |
79 |
39 |
51 |
47 |
5 |
98 |
76 |
43 |
56 |
53 |
10 |
|
Swallow |
All |
78 |
32 |
57 |
52 |
8 |
205 |
146 |
76 |
121 |
113 |
24 |
|
Lapwing |
All |
75 |
28 |
61 |
28 |
10 |
88 |
65 |
33 |
53 |
38 |
9 |
|
Whitethroat |
All |
75 |
42 |
43 |
57 |
7 |
96 |
70 |
42 |
47 |
58 |
9 |
|
Oystercatcher |
All |
73 |
22 |
61 |
25 |
11 |
141 |
96 |
50 |
76 |
62 |
17 |
|
Jackdaw |
Hab-spec |
73 |
33 |
53 |
52 |
6 |
138 |
107 |
59 |
87 |
86 |
16 |
|
Pied/White wagtail |
All |
71 |
25 |
56 |
39 |
9 |
151 |
103 |
46 |
83 |
68 |
16 |
|
Goldfinch |
All |
71 |
35 |
47 |
54 |
6 |
119 |
87 |
47 |
65 |
71 |
11 |
|
Sedge warbler |
All |
68 |
32 |
45 |
39 |
15 |
61 |
45 |
23 |
32 |
29 |
10 |
|
Carrion crow |
Hab-spec |
67 |
30 |
48 |
45 |
5 |
227 |
155 |
88 |
133 |
131 |
27 |
|
Woodpigeon |
Hab-spec |
67 |
35 |
43 |
51 |
4 |
243 |
167 |
95 |
145 |
146 |
28 |
|
Corncrake |
All |
64 |
9 |
64 |
3 |
2 |
3 |
2 |
0 |
2 |
0 |
0 |
|
Greenfinch |
All |
63 |
31 |
42 |
48 |
4 |
105 |
74 |
40 |
54 |
60 |
7 |
|
Starling |
Hab-spec |
62 |
20 |
50 |
33 |
5 |
164 |
128 |
64 |
106 |
92 |
18 |
|
Reed bunting |
All |
60 |
25 |
42 |
30 |
11 |
71 |
44 |
18 |
33 |
26 |
9 |
|
Buzzard |
Hab-spec |
58 |
24 |
42 |
43 |
5 |
167 |
93 |
42 |
72 |
72 |
9 |
|
Dunnock |
Hab-spec |
56 |
27 |
37 |
45 |
4 |
160 |
102 |
55 |
77 |
87 |
12 |
|
Blue Tit |
Hab-spec |
55 |
26 |
36 |
47 |
5 |
190 |
128 |
68 |
101 |
115 |
18 |
|
Skylark |
Hab-spec |
55 |
30 |
34 |
25 |
4 |
240 |
135 |
79 |
109 |
94 |
20 |
|
Great Tit |
Hab-spec |
54 |
22 |
37 |
47 |
4 |
182 |
113 |
56 |
89 |
102 |
14 |
|
Blackbird |
Hab-spec |
54 |
24 |
37 |
43 |
4 |
230 |
158 |
88 |
134 |
136 |
26 |
|
Song thrush |
Hab-spec |
50 |
20 |
37 |
41 |
4 |
208 |
120 |
56 |
96 |
101 |
14 |
|
Chaffinch |
Hab-spec |
49 |
20 |
36 |
41 |
4 |
278 |
172 |
96 |
150 |
154 |
33 |
|
Kestrel |
All |
48 |
17 |
34 |
31 |
3 |
40 |
18 |
7 |
14 |
12 |
1 |
|
Magpie |
Hab-spec |
43 |
15 |
32 |
33 |
3 |
63 |
42 |
17 |
33 |
35 |
3 |
Development of the provisional Wetland Breeding Bird Indicator
Four species contribute to the fast-flowing water indicator: common sandpiper, dipper, grey wagtail and goosander (Table 3). All but goosander are common enough to produce trends for, based on Scottish BBS data or WBBS data. Alternative methods for calculating trends for goosander might be explored, including combining BBS and WBBS data, or using new sawbill monitoring methods currently being trialled.
Four species contribute to the reedbed indicators used elsewhere, but Cetti’s warbler and reed warbler are rarely present in Scotland. A Scottish reedbed indicator would therefore include only reed bunting and sedge warbler.
Of the six species that contribute to the UK slow and standing water indicator, only mallard is recorded frequently enough in BBS or WBBS squares to include in an indicator. There are insufficient data for species such as coot, moorhen, tufted duck or any of the grebes.
Eight species contribute to the UK wet grassland indicator: curlew, lapwing, snipe, little egret, mute swan, redshank, teal and yellow wagtail. Of these, curlew, lapwing, snipe, mute swan and redshank had sufficient BBS data (but not WBBS sites) to create trends for an indicator.
There are a further four species included in the breeding wetland bird indicators used elsewhere, but which were not assessed as being sufficiently associated with any of the four wetland types above to be included in them. These are grey heron, oystercatcher, kingfisher and sand martin. Of these, there are enough Scottish BBS data to produce trends for all but kingfisher. If considered sufficiently important, oystercatcher trends could be supplemented with WBBS data and WBBS data and Heronries Census data could be used for grey heron.
Table 3. Sample sizes for species to be included in Scottish wetland indicators.
| Species | In Scottish indicator | Wetland type | No. BBS squares/year | WBBS sqs/year | Recommendation |
|---|---|---|---|---|---|
|
Common sandpiper |
yes |
Fast flowing |
37 |
30 |
BBS (& WBBS) |
|
Dipper |
yes |
Fast flowing |
21 |
29 |
BBS (& WBBS) |
|
Grey wagtail |
yes |
Fast flowing |
34 |
26 |
BBS (& WBBS) |
|
Goosander |
no |
Fast flowing |
12 |
14 |
Potentially BBS + WBBS |
|
Reed bunting |
yes |
Reedbeds |
71 |
12 |
BBS |
|
Sedge warbler |
yes |
Reedbeds |
61 |
10 |
BBS |
|
Cetti's warbler |
no |
Reedbeds |
0 |
0 |
- |
|
Reed warbler |
no |
Reedbeds |
0 |
0 |
- |
|
Mallard |
yes |
Slow and standing |
117 |
31 |
BBS (& WBBS) |
|
Coot |
no |
Slow and standing |
10 |
1 |
- |
|
Great crested grebe |
no |
Slow and standing |
2 |
0 |
- |
|
Little grebe |
no |
Slow and standing |
6 |
1 |
- |
|
Moorhen |
no |
Slow and standing |
15 |
2 |
- |
|
Tufted duck |
no |
Slow and standing |
14 |
1 |
- |
|
Curlew |
yes |
wet grassland |
133 |
17 |
BBS |
|
Lapwing |
yes |
wet grassland |
88 |
13 |
BBS |
|
Snipe |
yes |
wet grassland |
67 |
11 |
BBS |
|
Little egret |
no |
wet grassland |
0 |
0 |
- |
|
Mute swan |
no |
wet grassland |
21 |
5 |
BBS |
|
Redshank |
no |
wet grassland |
21 |
3 |
BBS |
|
Teal |
no |
wet grassland |
10 |
5 |
- |
|
Yellow wagtail |
no |
wet grassland |
1 |
0 |
- |
|
Grey heron |
yes |
others |
56 |
21 |
BBS & additional data |
|
Oystercatcher |
yes |
others |
141 |
27 |
BBS (& WBBS) |
|
Kingfisher |
no |
others |
1 |
2 |
- |
|
Sand martin |
no |
others |
36 |
17 |
BBS |
Presentation of provisional indicators and key recommendations
This work has demonstrated that we can create indicators for birds of urban habitats, indicators for up to four different farmland habitat types (a disaggregation of the current farmland bird indicator), and wetland breeding bird indicators. We also found that these provisional indicators identified patterns that differed from the existing indicators and could therefore have important policy implications. For example, as agricultural policies and subsidies are revised, the impact of these changes could differ between arable and pastoral farmland. A disaggregation of the current farmland indicator would facilitate the use of these indicators to monitor the impact of policy changes and inform future agricultural policy decisions and conservation action. Monitoring population change in urban and wetland birds could help understand whether policy change is required to reduce declines in broader environmental health in these habitats.
In this report, we examined the feasibility of creating new indicators, and identified which species would be included in each indicator. It was outside the scope of this report to assess the power of these indicators to detect change. However, we did find that these indicators identified significant trends and differences between habitats, suggesting that they will be useful for monitoring change. For example, we identified a significant increase in urban birds from 1994-2005, followed by a decline, and we found that bird populations increased on pastoral farmland more than on arable farmland. The wetland indicator indicated a decline in wetland birds compared to other birds. The power of the disaggregated wetland indicators to identify change in different types of wetland was less clear: few species contribute to each of the indicators, and data for these species was often limited. This is discussed further below and future work into incorporating data from alternative surveys such as WBBS into the wetland indicators would be beneficial.
Urban Indicator
We would recommend including only urban and suburban habitats in the Urban birds indicator and excluding rural habitats, as we found that there was generally adequate data available for this. This narrower definition of urban habitats also avoids an overlap with the farmland indicator which includes rural habitats. We found that there was adequate data available to create trends for 16 species using just counts from urban or suburban habitats, and trends from all habitats for two specialist species could also be included (Table1). The confidence intervals on the Urban indicator were relatively large (Fig. 2a). We attempted to increase the precision of the Urban indicator by using all data, instead of habitat-specific data, for two specialist species (magpie and collared dove), but this had little effect on the precision so we would not recommend this change (Fig. 2b).
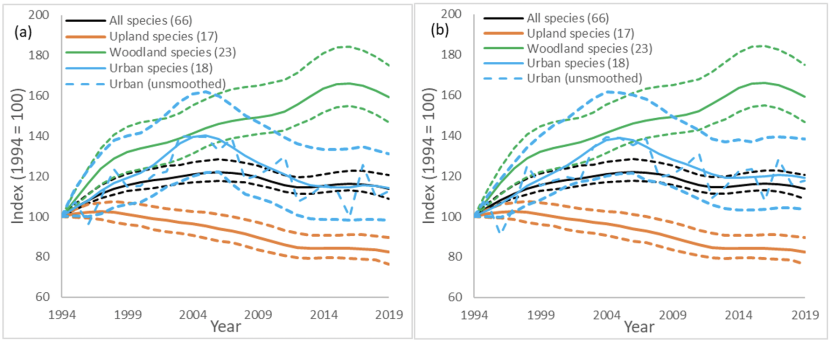
(a) Smoothed indicators for four categories, all species, urban, woodland and upland. Dotted lines show the 95% confidence levels for each category. All species, woodland and urban show an increasing trend, upland shows a declining trend. The x axis denotes year and the y axis is the index value 1994 = 100
(b) Smoothed indicators for four categories, all species, urban, woodland and upland. Dotted lines show the 95% confidence levels for each category. All species, woodland and urban show an increasing trend, upland shows a declining trend. Urban indicator all data for Collared dove and Magpie are used, instead of just counts from urban transect sections, to avoid any sample sizes of <20 BBS squares/year. The x axis denotes year and the y axis is the index value 1994 = 100
Farmland indicators
It was possible to produce indicators for Arable (comprised of 23 habitat-specific trends), Pastoral (26 species with habitat-specific trends and additional data for corncrake) and Woody farmland (23 species with habitat-specific trends) (Table 2; Fig. 3). These indicators showed significantly different trends among those types of habitat. However, it is not clear (without further inspection of species-specific trends) whether the divergent trends were driven by differences in which species are included in each indicator (albeit only a few differences), or by differences in habitat-specific trends of species that are in all indicators. The alternative farmland indicators, which were created from habitat-specific trends of species found in all three farmland habitats (i.e. the 23 species in the Arable indicator), allows for better comparison of change in these three farmland habitats (Fig. 3d & e). We would therefore recommend that the alternative Pastoral and Woody farmland indicators are used for purposes of comparison of trends among those habitats.
A wet farmland indicator would consist of habitat-specific trends for six species and farmland-specific trends for an additional three to five species (depending on agreed threshold for inclusion). We recommend producing this indicator, with all eleven potential species, as the species in this indicator differ enough from the bespoke wetland bird indicators to give useful additional information, and identifies a habitat-specific pattern within the existing farmland bird indicator. It was not possible to produce a comparable alternative indicator for this farmland habitat as there was insufficient overlap in species composition.
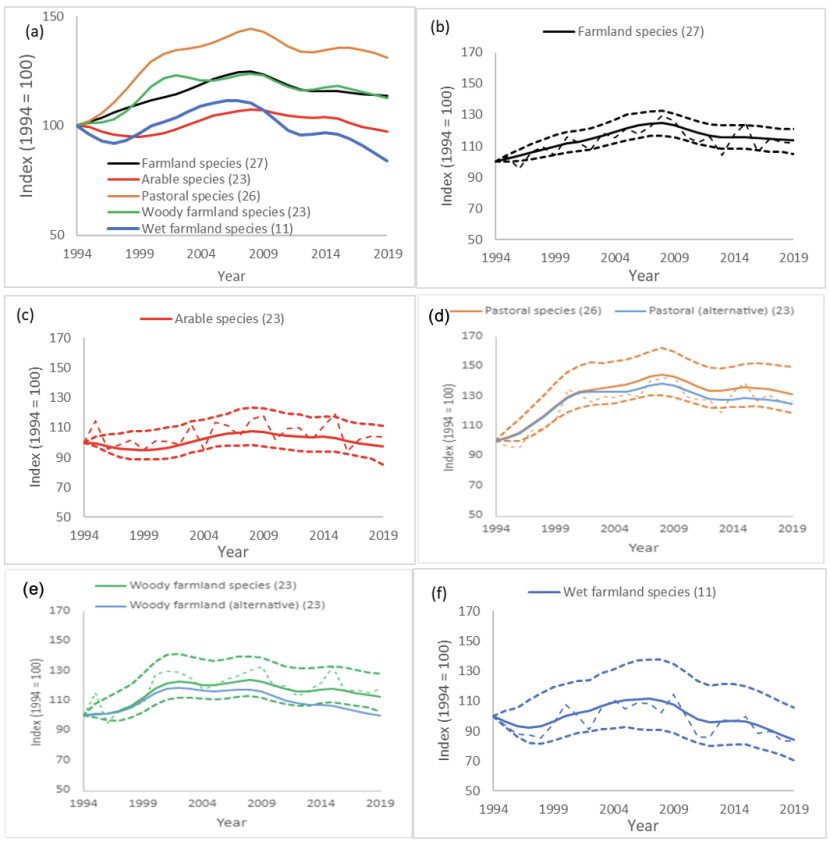
The smoothed Scottish farmland bird indictor with four provisional smoothed sub-indicators produced by disaggregating the Scottish farmland bird indicator. Additional plots show the smoothed indicators (solid lines) with 95% confidence intervals (heavy dashes) and unsmoothed indicators (light dashes) of bird populations associated with (b) all farmland (c) arable farmland, (d) pastoral farmland, (e) woody elements of farmland, and (f) wet areas on farmland. The “alternative” lines (blue) on (d) Pastoral and (e) Woody farmland plots show the smoothed indicator using only the species present in the Arable indicator, to make Arable, Pastoral and Woody farmland indicators directly comparable. The x axis denotes year and the y axis is the index value 1994 = 100
Wetland indicators
We could produce a general wetland bird indicator from 14 species (all BBS data and potentially eight species with additional WBBS data). We could also produce a fast-flowing water indicator with three species, and a wet grassland indicator with five species although with so few species, their representativeness of wider environmental change may be limited so they would need to be used cautiously. Sub-indicators with similarly small numbers of species are part of the UK and England breeding wetland bird indicator suite (e.g. the reedbed indicator). There were however, insufficient data in Scotland to produce meaningful indicators for breeding birds of reedbeds or for slow-moving and standing water (Table 3). Three species in the wetland indicator, two of which are in the wet grassland indicator, are not currently present in the Scottish All-species indicator: mute swan (included in the general Wetland indicator and the Wet grassland indicator), redshank (general Wetland indicator and Wet grassland) and sand martin (general Wetland indicator). As the confidence intervals for the Wetland indicators were fairly large (Fig. 4 c-d), we attempted to increase the precision of the Wetland indicators by recreating the indicators with these three species removed (Fig. 4 e & f). Note that including species with few data substantially increased the uncertainty around the wetland indicator trends.
WBBS data was not used for these wetland indicators as combining BBS and WBBS data would be a substantial additional area of work, not previously done separately for Scotland due to the smaller number of sites compared with the UK overall and the relatively low occupancy rates on these sites of the target species. Trends for goosander (which would contribute to the all-species Wetland indicator and the Fast-flowing wetland indicator) were therefore not able to be produced.
We would recommend that wetland indicators are developed, for summarising the pattern in wetlands and water bodies overall, as well as demonstrating the pattern of population change among species characteristic of particular wetland habitats such as species of fast-flowing water and species of wet grassland. We would recommend including mute swan, redshank and sand martin, as the level of BBS monitoring is increasing and hence the current uncertainty in the robustness of these species’ trends will decrease over time. We would also recommend assessing the feasibility of including WBBS and any other sources of wetland species data in the future, to improve the robustness of the trends presented here.
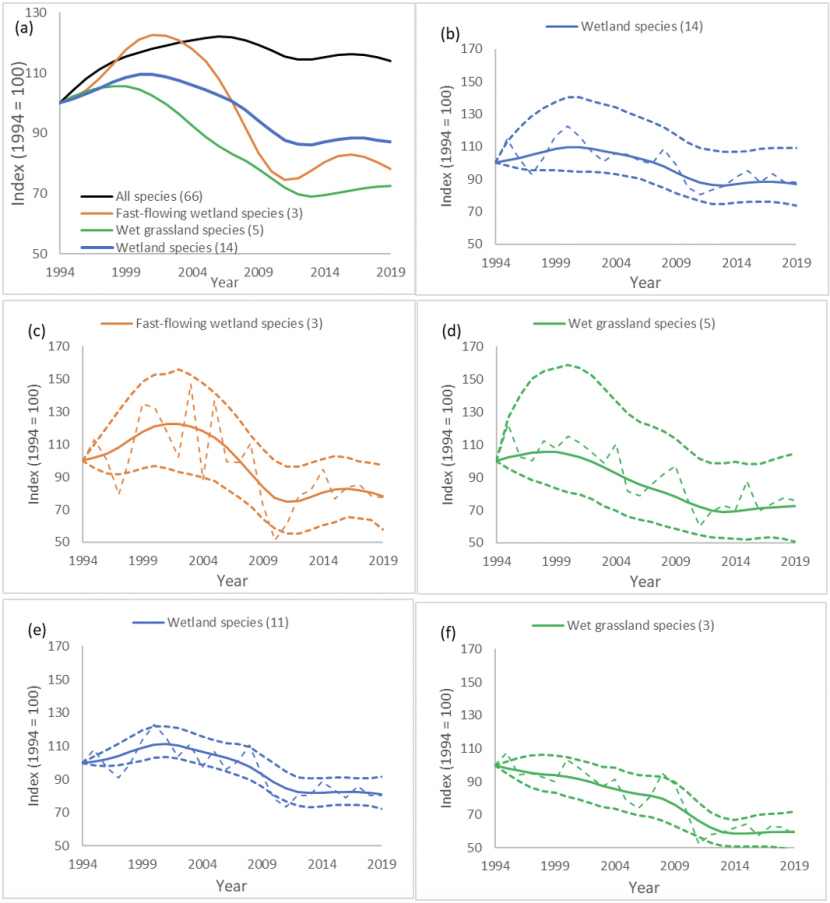
The smoothed Scottish wetland indictors (and all species for comparison) (a) created using only the data and species currently obtainable by analysing BBS data. Additional plots show the smoothed indicators (solid lines) with 95% confidence intervals (heavy dashes) and unsmoothed indicators (light dashes) of bird populations associated with (b) all wetland (c) fast flowing wetland, (d) grassy wetland. (e & f) Wetland indicator and Wet grassland indicator created using only the species currently used in the Scottish indicators, therefore removing Mute swan, Redshank and Sand martin. The x axis denotes year and the y axis is the index value 1994 = 100.
Interpreting the new indicators
The Urban indicator showed an increase in Urban birds between 1994 and 2005, followed by a decline, resulting in a small increase between 1994 and 2019, similar to that seen in the All-species indicator (Fig. 2a). There were several species that showed different trends in urban habitats, compared to other habitats (Table 4). The greatest winner in Scottish urban habitats compared to other habitats were woodpigeons (Fig. 6e). They increased across all of Scotland by 7% between 1995 and 2019, while in urban habitats they increased by 188% (Table 4). Similar increases, particularly in urban habitats are seen across the UK (Massimino et al., 2019), and across Europe (Tomiałojć, 2021). This urban increase could be due to lower densities of nest predators in urban habitats but this is not conclusive (Bogliani et al., 1992; Tomiałojć, 2021). Carrion crows and magpies, the most common woodpigeon nest predators, only had marginally lower trends in urban habitats than other habitats (Fig. 6h & i; Table 4). We hypothesise that competition with declining urban collared doves (-46% Fig. 5f) may also benefit woodpigeons but there is no research to test this hypothesis.
Other species with positive trends across all habitats but with more rapid increases in urban habitats were typical bird-feeder birds such as blue tits, great tits and goldfinches (Fig. 6b). However, these three species showed even higher population increases on farmland, so it is difficult to attribute their urban increases to bird feeders alone.
House sparrows, song thrushes and blackbirds (Fig. 6a, d & g) all declined in urban habitats but increased across other habitats. Urban house sparrow declines have been noted across Europe (Seress et al., 2012). There are a number of possible drivers for their urban declines, including lower invertebrate food quality for chicks, increased disease or increased predation in urban environments. Urban house sparrow chicks’ diets consist of lower quality invertebrate prey than for more rural chicks (Seress et al., 2012). Furthermore, song thrushes and blackbirds were the two species found to most correspond to earthworm abundance in urban settings (Martay & Pearce-Higgins, 2020), adding to the evidence that urban declines could be linked to declining invertebrates. However, supplementary feeding demonstrated that a lack of invertebrate prey is unlikely to have a population-level effect on house sparrows (Peach et al., 2018), and urban invertebrate trends are unknown. Alternatively, increased urban parasitism, specifically Avian Malaria (Plasmodium relictum), may be responsible for urban house sparrow declines (Dadam et al., 2019). In addition, blackbirds have been found to have lower loads of ticks and Avian Malaria in urban habitats than in rural habitats (Evans et al., 2009). Another hypothesised driver of urban house sparrow decline is an increase in predation by sparrowhawks (Mohring et al., 2021) or cats (Baker et al., 2008). The evidence for the effect of cats is mixed as urban house sparrow population density positively correlates with cat densities (Sims et al., 2008). Cat predation has been hypothesised as a possible driver of urban blackbird and song thrush declines but also for robins (Fig. 6j), which have more positive population trends in urban habitats than other habitats (Baker et al., 2008; Sims et al., 2008).
The key pattern evident in the four disaggregated farmland indices was the positive trend on pastoral farmland, particularly compared to arable and wet farmland. This pattern was apparent whether the indicators were created from marginally different sets of species, or from the same 23 species as for the alternative farmland sub-indicators. The more positive trends on pastoral farmland compared to arable farmland was found across most species: 70% of species that contributed to both the pastoral and arable indicators had more positive trends on pastoral farmland. All three species associated with pastoral farmland that were not on arable farmland (corncrake, magpie and reed bunting) had positive trends. Species that did not fit this pattern and were increasing on arable farmland more rapidly than on pastoral farmland included great tit and song thrush (Fig. 6d).
The wetland indicators all showed declines among wetland species. The declines were generally in wader species, such as common sandpiper, curlew, lapwing, oystercatcher and redshank. Lapwing and curlew breed on wet grassland and upland habitats and are experiencing declines across farmland, wetland and upland habitats in Scotland (Table 4) and across the UK (Massimino et al., 2019). Their declines are driven by low productivity and thought to be due to habitat loss, land drainage, potential increases in predation pressure and possible declines in invertebrate prey (Buchanan et al., 2006; Eglington et al., 2010; Roodbergen et al., 2012; Franks et al., 2017; Plard et al., 2020). Wetland species that are showing large population increases include sand martin, reed bunting and mute swan. Sand martins and reed buntings are showing greater increases in Scotland than in England (Harris et al., 2020). Sand martin population trends correlate positively with rainfall in their wintering grounds but negatively with breeding ground rainfall (Cowley & Siriwardena, 2005). The divergence between Scottish and English trends may therefore be due to reduced summer rainfall having more positive impacts in Scotland, although this is likely to be negative for many other species. The effect of increasing temperatures on sand martin populations could also vary between Scotland and England because of the differing baseline temperatures (Martay et al. in press). Reed bunting populations are thought to be associated more with UK agricultural practices with determine winter food availability (Peach et al., 1999). Mute swan increases are fairly consistent across all of the UK (Balmer et al., 2013) and are thought to be due at least partly to the regulation of lead fishing weights in the late 1980s (Wood et al., 2019).
There were a few species that showed particularly marked population increases or declines across multiple habitats (Table 4, Fig. 5). Greenfinch was the most rapid declining species across all habitats, and specifically in urban, arable and pastoral habitats (Table 4; Fig. 6c). It is well established that their decline is primarily driven by the pathogen Trichomonas gallinae (Lawson et al., 2012), which may also be responsible for the urban decline of collared dove (Lennon et al., 2013) (Fig. 6f).
Chiffchaffs and goldfinches (Fig. 6b) are undergoing large increases across many different habitats. Chiffchaffs are increasing across all of the UK but at a greater rate in Scotland than in England (Massimino et al., 2019). The increase may be largely driven by environmental factors outside of their UK breeding grounds but the divergence in trends across the UK is likely to be largely due to climate change having a more beneficial impact in Scotland compared to England for this species (Martay et al. in press). Goldfinches were increasing across all habitats in Scotland (Fig. 6), similar to UK population increases (except in the far north-west of Scotland where they are still absent) (Balmer et al., 2013; Massimino et al., 2019). Goldfinch increases were very high in pastoral (+428%), woody farmland (+388%) and urban habitats (+334%) compared to arable farmland (+226%) and all habitats (+269%) (Table 4). Their increase may be due to increased winter food sources, particularly from bird feeders, but evidence for this is limited (Massimino et al., 2019).
The aim of this work was to assess the feasibility of producing new sub-indicators (i.e. for urban/built-up habitats and for wetlands) to be included with the farmland, woodland and upland sub-indicators that currently comprise the Terrestrial Breeding Bird Indicator for Scotland. This work demonstrates that sufficient relevant data are available to produce new indicators for both of those habitat types, and that these new provisional indicators highlight patterns that differ from the other sub-indicators. It was beyond the scope of this report to examine the power of these indicators to detect change. However, we did identify significant trends in the urban indicator and clear differences in trajectory between the disaggregated farmland indicators, suggesting that these new indicators are effective at indicating environmental change in these habitats. For the urban indicator in particular, evidence of a decline since the early 2000s is supported at the species level, for some species, by greater rates of decline in this habitat than in other habitats such as woodland. Species differed in the trajectories of change and further work would be needed to establish the drivers of these patterns and to the extent that different habitats operate as population sinks or sources. Although there is no immediate plan to change the current farmland indicator, this work showed that it is possible to disaggregate the farmland indicator to demonstrate the differences in population trajectories in different farmland habitat types such as the overall less negative trends among pastoral populations compared to those on arable land or on wet habitats on farmland. Periodic production and publication of these additional breakdowns of the farmland indicator, especially if improved by additional data and evidence, will enhance understanding of the impact of agricultural pressures and of conservation actions on farmland birds and hence inform sustainable farmland management.
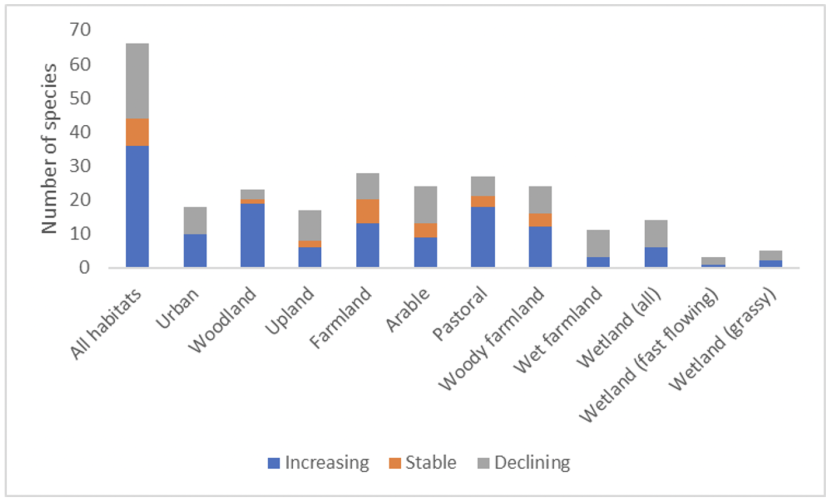
Graph showing the number of increasing, stable and declining species (x axis) contributing to each indicator category (y axis) (All habitats, Urban, Woodland, Upland, Farmland, Arable, Pastoral, Woody Farmland, Wet Farmland, Wetland, Wetland fast flowing and Wetland Grassy).
Table 4. Number of species with increasing, stable (population change between 1994 and 2019 <5%) or decreasing population trends within habitats in Scotland between 1995 and 2019
| Indicator | Increasing | Stable | Declining | Max increase | Max decline |
|---|---|---|---|---|---|
|
All habitats |
36 |
8 |
22 |
Chiffchaff |
Greenfinch |
|
Urban |
10 |
0 |
8 |
Goldfinch |
Greenfinch |
|
Woodland |
19 |
1 |
3 |
Chiffchaff |
Capercaillie |
|
Upland |
6 |
2 |
9 |
Raven |
Dotterel |
|
Farmland |
13 |
7 |
8 |
Goldfinch |
Kestrel |
|
Arable |
9 |
4 |
11 |
Goldfinch |
Greenfinch |
|
Pastoral |
18 |
3 |
6 |
Goldfinch |
Greenfinch |
|
Woody farmland |
12 |
4 |
8 |
Goldfinch |
Lapwing |
|
Wet farmland |
3 |
0 |
8 |
Reed bunting |
Lapwing |
|
Wetland (all) |
6 |
0 |
8 |
Reed bunting |
Curlew |
|
Wetland (fast flowing) |
1 |
0 |
2 |
Grey wagtail |
Dipper |
|
Wetland (grassy) |
2 |
0 |
3 |
Mute swan |
Curlew |
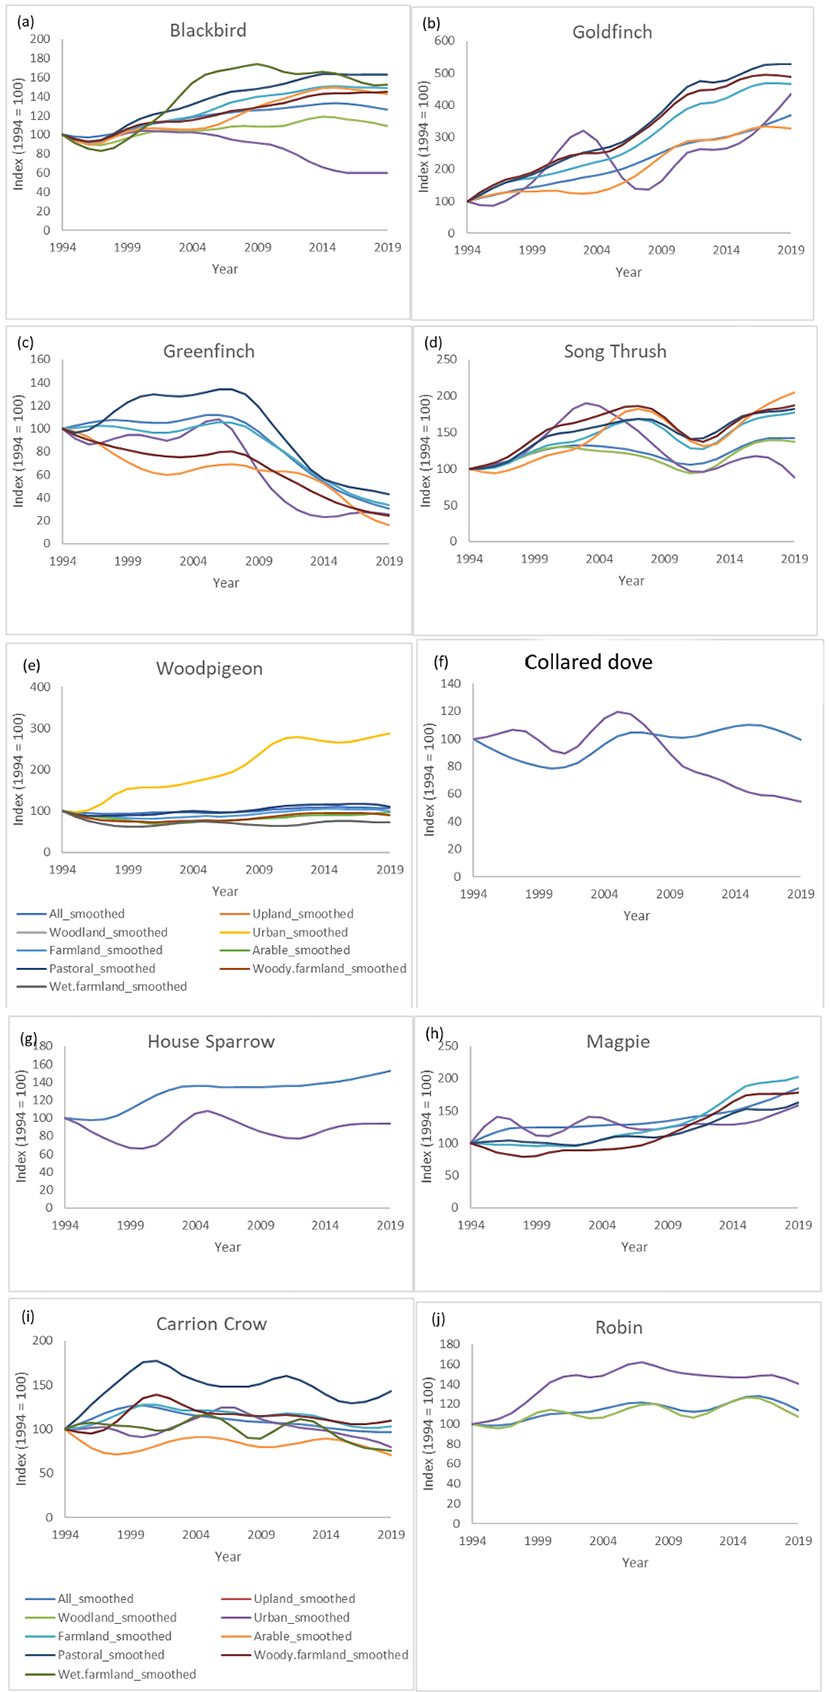
Population indices for a for carrion crow, robin, magpie, house sparrow, blackbird, goldfinch, greenfinch, song thrush, wood pigeon and collared dove Showing indices using data from all habitats (labelled ‘All_smoothed’) and using data solely from broad habitat categories based on the BBS habitat codes at the point of recording. x axis denoted year and y axis shows the index (1994 = 100).
References
Baker, P. J., Molony, S. E., Stone, E., Cuthill, I. C., & Harris, S. 2008. Cats about town: is predation by free‐ranging pet cats Felis catus likely to affect urban bird populations? Ibis, 150, 86-99.
Balmer, D. E., Gillings, S., Caffrey, B. J., Swann, R. L., Downie, I. S., & Fuller, R. J. 2013. Bird Atlas 2007-11: the breeding and wintering birds of Britain and Ireland. Thetford: BTO.
Bogliani, G., Tiso, E., & Barbieri F. 1992. Nesting association between the Woodpigeon (Columba palumbus) and the Hobby (Falco subbuteo). Journal of Raptor Research, 26, 263-265.
Buchanan, G. M., Grant, M. C., Sanderson, R. A., & Pearce‐Higgins, J. W. 2006. The contribution of invertebrate taxa to moorland bird diets and the potential implications of land‐use management. Ibis, 148(4), 615-628.
Cowley, E., & Siriwardena, G. M. 2005. Long-term variation in survival rates of Sand Martins Riparia riparia: dependence on breeding and wintering ground weather, age and sex, and their population consequences. Bird Study, 52(3), 237-251.
Crick, H.Q.P. 1992. A bird-habitat coding system for use in Britain and Ireland incorporating aspects of land-management and human activity. Bird Study, 39, 1-12.
Dadam, D., Robinson, R. A., Clements, A., Peach, W. J., Bennett, M., Rowcliffe, J. M., & Cunningham, A. A. 2019. Avian malaria-mediated population decline of a widespread iconic bird species. Royal Society open science, 6(7), 182-197.
Eglington, S. M., Bolton, M., Smart, M. A., Sutherland, W. J., Watkinson, A. R., & Gill, J. A. 2010. Managing water levels on wet grasslands to improve foraging conditions for breeding northern lapwing Vanellus vanellus. Journal of Applied Ecology, 47(2), 451-458.
Evans, K. L., Gaston, K. J., Sharp, S. P., McGowan, A., Simeoni, M., & Hatchwell, B. J. 2009. Effects of urbanisation on disease prevalence and age structure in blackbird Turdus merula populations. Oikos, 118(5), 774-782.
Franks, S. E., Douglas, D. J., Gillings, S., & Pearce-Higgins, J. W. 2017. Environmental correlates of breeding abundance and population change of Eurasian Curlew Numenius arquata in Britain. Bird Study, 64(3), 393-409.
Gibbons, D. W., Reid, J. B., & Chapman, R.A. 1993. The New Atlas of Breeding Birds in Britain and Ireland: 1988-1991. T. & A.D. Poyser.
Gregory R. D., 2000. Development of breeding bird monitoring in the United Kingdom and adopting its principles elsewhere. Ring 22, 2, 35-44.
Harris, S.J., Massimino, D., Balmer, D.E., Eaton, M.A., Noble, D.G., Pearce-Higgins, J.W., Woodcock, P. & Gillings, S. 2020. The Breeding Bird Survey 2019. BTO Research Report 726. British Trust for Ornithology, Thetford.
Jacobs, J. 1974. Quantitative measurements of food selection. Oecologia, 14, 413-417.
Lawson, B., Robinson, R. A., Colvile, K. M., Peck, K. M., Chantrey, J., Pennycott, T. W. & Cunningham, A. A. 2012. The emergence and spread of finch trichomonosis in the British Isles. Philosophical Transactions of the Royal Society B: Biological Sciences, 367(1604), 2852-2863.
Lennon, R. J., Dunn, J. C., Stockdale, J. E., Goodman, S. J., Morris, A. J., & Hamer, K. C. 2013. Trichomonad parasite infection in four species of Columbidae in the UK. Parasitology, 140(11), 1368-1376.
Martay, B., & Pearce-Higgins, J. W. 2020. Opening a can of worms: Can the availability of soil invertebrates be indicated by birds? Ecological Indicators, 113, 106222.
Massimino, D., Woodward, I. D., Hammond, M. J., Harris, S. J., Leech, D. I., Noble, D. G., Walker, R. H., Barimore, C., Dadam, D., Eglington, S. M., Marchant, J. H., Sullivan, M. J. P., Baillie, S. R. & Robinson, R. A. 2019. BirdTrends 2019: trends in numbers, breeding success and survival for UK breeding birds. BTO Research Report 722. BTO, Thetford.
Mohring, B., Henry, P. Y., Jiguet, F. Malher, F. & Angelier, F. 2021. Investigating temporal and spatial correlates of the sharp decline of an urban exploiter bird in a large European city. Urban Ecosystems 24, 501-513.
Peach, W.J., Mallord, J.W., Ockendon, N., Orsman, C.J. & Haines, W.G. 2018. Depleted suburban house sparrow Passer domesticus population not limited by food availability. Urban Ecosystems 21, 1053-1065.
Peach, W. J., Siriwardena, G. M., & Gregory, R. D. 1999. Long‐term changes in over‐winter survival rates explain the decline of reed buntings Emberiza schoeniclus in Britain. Journal of Applied Ecology, 36(5), 798-811.
Plard, F., Bruns, H. A., Cimiotti, D. V., Helmecke, A., Hötker, H., Jeromin, H. & Schaub, M. 2020. Low productivity and unsuitable management drive the decline of central European lapwing populations. Animal Conservation, 23(3), 286-296.
Roodbergen, M., van der Werf, B., & Hötker, H. 2012. Revealing the contributions of reproduction and survival to the Europe-wide decline in meadow birds: review and meta-analysis. Journal of Ornithology, 153(1), 53-74.
Seress, G., Bókony, V., Pipoly, I., Szép, T., Nagy, K. and Liker, A. 2012. Urbanization, nestling growth and reproductive success in a moderately declining house sparrow population. Journal of Avian Biology, 43: 403-414.
Sims, V., Evans, K. L., Newson, S. E., Tratalos, J. A., & Gaston, K. J. 2008. Avian assemblage structure and domestic cat densities in urban environments. Diversity and Distributions, 14(2), 387-399.
Tomiałojć, L. 2021. Impact of nest predators on migratory Woodpigeons Columba palumbus in Central Europe—breeding densities and nesting success in urban versus natural habitats. Acta Ornithologica, 55(2), 139-154.
Wood, K. A., Brown, M. J., Cromie, R. L., Hilton, G. M., Mackenzie, C., Newth, J. L., Pain, D. J., Perrins, C. M. & Rees, E. C. 2019. Regulation of lead fishing weights results in mute swan population recovery. Biological Conservation, 230, 67-74.
