SPANS Scotland's People and Nature Survey 2017/18 - Summary report - Participation in outdoor recreation
1. Background
This summary report on participation in outdoor recreation is one of a series describing how people in Scotland use, value and enjoy the natural environment. It uses data from Scotland’s People and Nature Survey (SPANS), conducted in 2013/14 and 2017/18, and historical data from the Scottish Recreation Survey (ScRS), conducted annually between 2003 and 2012.
The research methodology used for SPANS is identical to that used for the ScRS meaning that data from both surveys are directly comparable. As the survey findings are based on interviews conducted with a representative sample of adults living in Scotland, all estimates are subject to a margin of sampling error, see SPANS Technical Report.
2. Definitions
In SPANS and the ScRS the term ‘outdoors’ includes mountains, moorland, farmland, forests, woods, rivers, lochs and reservoirs, beaches and the coast and open spaces in towns and cities. ‘Visits to the outdoors’ refers to leisure trips taken from home or while away from home on holiday, provided the holiday was in Scotland. ‘Outdoor recreation’ is defined as any non-motorised activity carried out for leisure purposes. It can include informal everyday activities (e.g. walking the dog, family outings) as well as a range of other types of activities such as cycling, hill walking or watersports.
3. Why are outdoor visits important?
Enjoyment of the outdoors, including greenspaces in towns and cities, the countryside around urban areas and more remote and wild areas of land and water, can provide many social, environmental and economic benefits. These include better health and well-being, an improved quality of life, greater empathy with the natural world, wider use of sustainable forms of transport such as walking and cycling, and economic benefits derived from expenditure incurred by outdoor visitors. Increasing the proportion of adults visiting the outdoors at least once a week and ensuring that the benefits are shared by everyone in Scotland is a key target of the Scottish Government which measures progress via its National Performance Framework.
4. How frequently do people in Scotland visit the outdoors for recreation?
Most people in Scotland visit the outdoors for leisure and recreation with just over half visiting on a regular weekly basis.
The proportion of adults visiting the outdoors in 2017/18 (82%) is the same as the proportion reported in the 2013/14 survey; the proportion of adults visiting the outdoors on a regular weekly basis has, however, increased significantly since 2013/14 (up from 50% to 57% in 2017/18) as has the total number of visits taken (up from 396 million to 546 million in 2017/18).
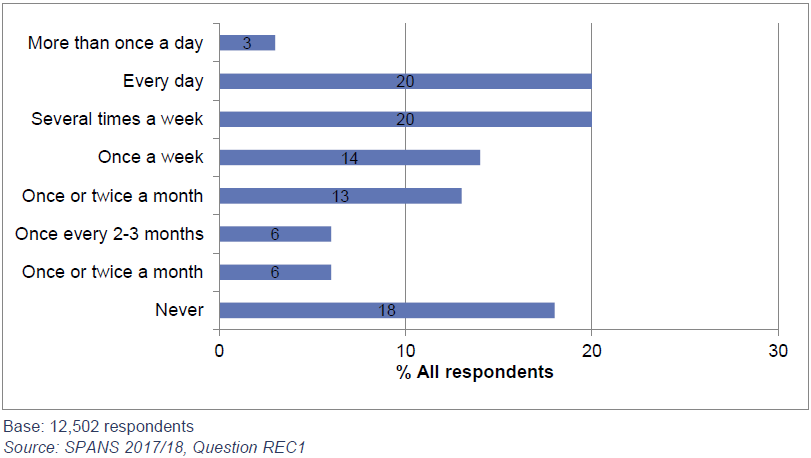
Between May 2017 and April 2018, 82% of adults in Scotland visited the outdoors, taking an estimated 546 million outdoor visits. More than half of all adults visited the outdoors at least once a week during this period (57%), including 23% who visited every day. A quarter of adults visited less frequently than once a week (25%) and almost a fifth didn’t visit the outdoors at all (18%).
5. What are the main barriers to visiting the outdoors?
In 2013/14 (this question was not included in SPANS in 2018/19) ’lack of time’ (mentioned by 36% respondents) and ‘poor health’ (mentioned by 23%) were the main reasons given by respondents who rarely or never participated in outdoor recreation. Those more likely to mention ‘lack of time’ included younger people (aged under 55), people working full-time and those with children in their household. Those more likely to mention ‘poor health’ included older people (aged 55 and over), people in the DE social grade and those who are retired or not working. Social grade is a household classification system based on the occupation of the Chief Income Earner in the household: AB - higher and intermediate managerial, administrative and professional; C1 - supervisory, clerical and junior managerial, administrative and professional; C2 - skilled manual workers; DE - semi-skilled and unskilled manual workers, casual and lowest grade workers, state pensioners and others who depend on the state for their income.
There has been relatively little variation over the last ten years or so in the proportions of respondents mentioning each of the barriers shown in Table 1, below.
| - | All adults who never or rarely visit the outdoors for recreation | Adults who never visit | Adults who rarely visit |
|---|---|---|---|
|
Reason given |
% |
% |
% |
|
Lack of time |
36 |
31 |
42 |
|
Poor health |
23 |
33 |
12 |
|
Poor weather |
14 |
9 |
20 |
|
No particular reason |
11 |
12 |
10 |
|
Old age |
8 |
12 |
3 |
|
Not interested |
5 |
7 |
2 |
|
Can’t afford it |
4 |
2 |
6 |
| Base: | 833 respondents | 481 respondents | 352 respondents |
Source: SPANS 2013/14, Question REC2
6. What motivates people to visit the outdoors?
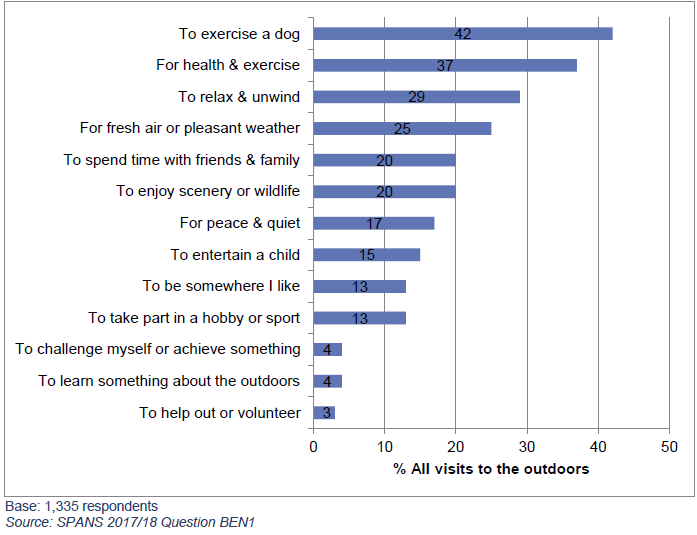
People in Scotland visit the outdoors for a variety of reasons but ‘every day’ reasons like ‘dog walking’ (42% of outdoor visits) and ‘health and exercise’ (37% of outdoor visits) are mentioned most frequently. These findings are very similar to those reported in the 2013/14 survey.
7. What benefits do people feel they get from their outdoor visits?
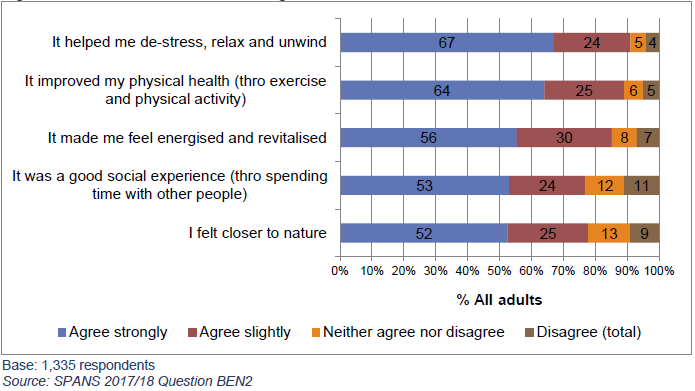
As in the 2013/14 survey, most people agree, when prompted, that they benefit from their outdoor visits, with around 9 in 10 visitors reporting improvements to their mental and physical health and an increase in their energy levels.
8. Are some population groups more likely to visit the outdoors than others?
People’s propensity to visit the outdoors is influenced by a variety of demographic and other factors, with age, social grade, where you live, employment status, health and ethnicity all playing a role. Younger and more affluent adults along with people living in rural areas (Scottish Government Urban Rural Classification) see are more likely than average to visit the outdoors on a regular basis; those with a long-term illness or disability and those who describe their general health as ‘bad’ are less likely than average to do so; and people from minority ethnic groups are less likely than those of white ethnicity to be regular outdoor visitors.
|
Population group |
Visit the outdoors at all |
Visit the outdoors at least once a week |
|---|---|---|
|
- |
% all respondents |
% all respondents |
|
All adults |
82 |
57 |
|
Age: 34 or under |
90 |
60 |
|
Age: 35 - 54 |
85 |
61 |
|
Age: 55 or over |
73 |
52 |
|
Social grade: AB |
92 |
67 |
|
Social grade: C1 |
87 |
62 |
|
Social grade: C2 |
82 |
58 |
|
Social grade: DE |
68 |
44 |
|
Residency: Urban |
81 |
56 |
|
Residency: Rural |
87 |
66 |
|
Residency - SIMD: 15% most deprived areas |
73 |
44 |
|
Residency – SIMD: Other areas |
84 |
60 |
|
Employment status: In paid employment |
90 |
63 |
|
Employment status: Not in paid employment |
74 |
52 |
|
Have long-term illness or disability: Yes |
63 |
40 |
|
Have long-term illness or disability: No |
88 |
62 |
|
Self-reported general health: Good |
88 |
62 |
|
Self-reported general health: Fair |
73 |
46 |
|
Self-reported general health: Bad |
47 |
27 |
|
Ethnic origin: White |
82 |
58 |
|
Ethnic origin: BME (black and minority ethnicity) |
84 |
47 |
Source: SPANS 2017/18 Questions CLASSIF1, CLASSIF2 and CLASSIF3
9. Where do people go on their outdoor visits?
We know from the Scottish Recreation Survey that 95% of the outdoor visits taken by adults in Scotland start directly from home with the remainder taken while away from home, for example, while on holiday elsewhere in Scotland.
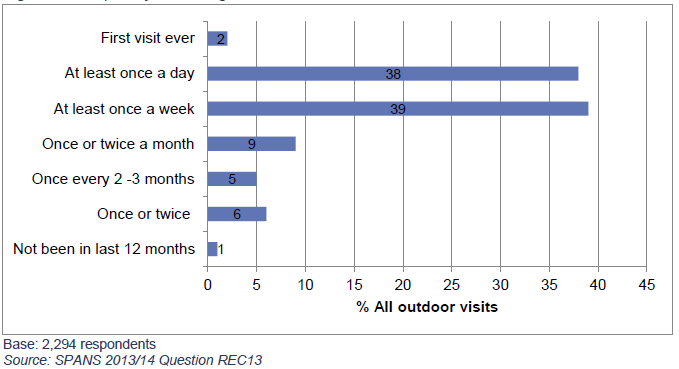
In 2013/14* SPANS estimated that almost all visits to the outdoors were ‘repeat visits’ to familiar places (98%). As many as three quarters were taken to places which are visited at least once a week (77%), perhaps underlining the ‘every day’ nature of many outdoor visits.
* This question was not included in SPANS in 2017/18
In terms of the type of environment visited, trips to the countryside account for around half of all visits to the outdoors (49%); trips made to or within urban areas account for 40% of visits; and trips to the seaside account for the remaining 11% of visits.
Over the last ten years or so the proportion of visits being made to countryside locations has declined slightly (down from 56% of all visits in 2004 to 49% in 2017/18) while the proportion of visits made in urban areas has increased (up from 30% in 2004 to 40% in 2017/18).
| Location | No. visits | % visits |
|---|---|---|
|
Town/city |
216 million |
40 |
|
Countryside |
269 million |
49 |
|
Seaside |
61 million |
11 |
|
Total |
546 million |
100 |
Base: 4,113 respondents
Source: SPANS 2017/18 Question REC5
Parks are a particularly important resource for people living in Scotland’s more deprived areas (accounting for 62% of outdoor visits taken by people living in the 15% most deprived areas of Scotland), as well as for people in the BME population (61% of outdoor visits) and people living in urban areas (52% of outdoor visits).
While there has been some year-on-year fluctuation, the relative popularity of each of the destination types shown in Figure 5 has remained fairly stable over time.
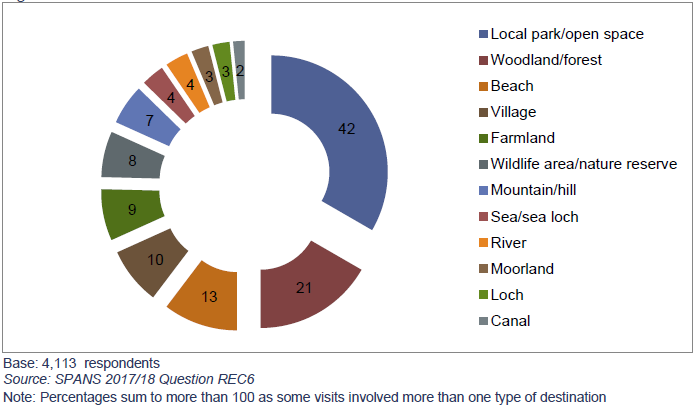
In terms of the specific destinations visited, local parks and other open spaces remain most popular, accounting for 42% of all outdoor visits. After parks, woodlands and forests (21% of all visits) and beaches (13% of all visits) are most popular.
10. Outdoor visits – distance travelled, duration of visits and transport used
Most outdoor visits are relatively short, both in terms of their duration and the distance people travel to and from the destination. In 2017/18 the average distance travelled to and from the destination on visits to the outdoors was 8.4 miles.
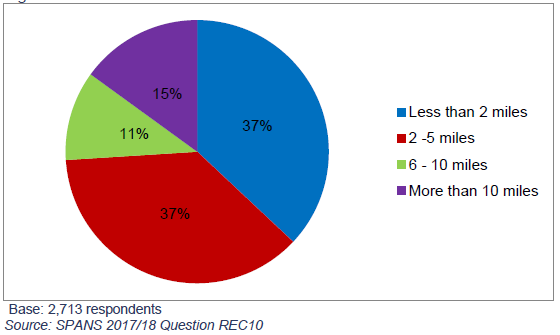
Eighty five per cent of visits involve a travel distance to and from the destination of ten miles or less, with more than a third of visits taken within 2 miles of home (37%)
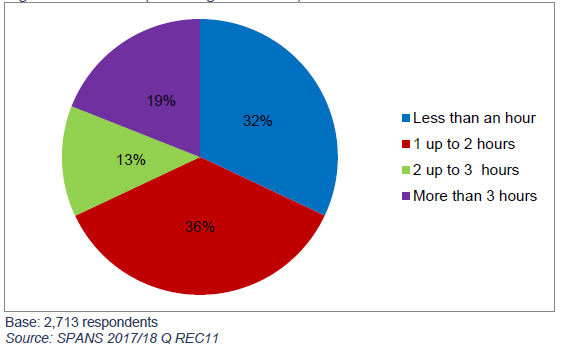
Most outdoor visits last for three hours or less, including any travelling time (81%), with around a third lasting for less than an hour (32%). In 2017/18, the average duration (including travelling time) of visits to the outdoors was just over 2 hours.
The last ten years or so has seen an increase in the proportion of shorter duration visits and visits taken close to home, suggesting that more people are finding opportunities to enjoy the nature on their doorstep.
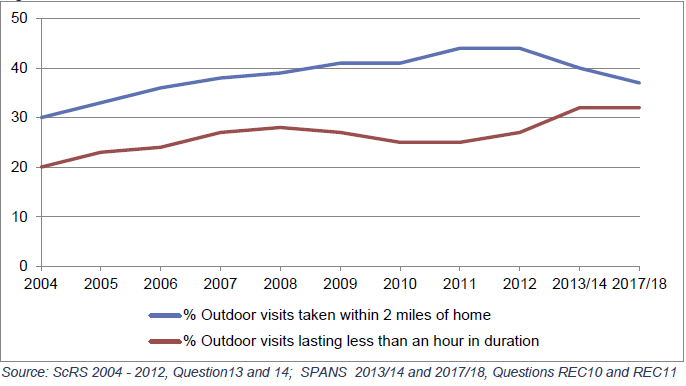
The proportion of visits taken within 2 miles of home increased from 30% in 2004 to 37% in 2017/18, with the average distance travelled on outdoor visits falling from 16 miles to just over 8 miles over the same period. At the same time, the proportion of visits lasting for less than an hour in duration increased from 20% to 32%.
The increase in the proportion of shorter duration visits being taken closer to home is reflected in an increase in the proportion of visits being made entirely on foot and a corresponding decrease in the proportion involving the use of a car. Between 2004 and 2017/18, the proportion of outdoor visits where walking was the main method of transport used increased from 50% to 69% while the proportion involving travel by car decreased from 43% to 23%.
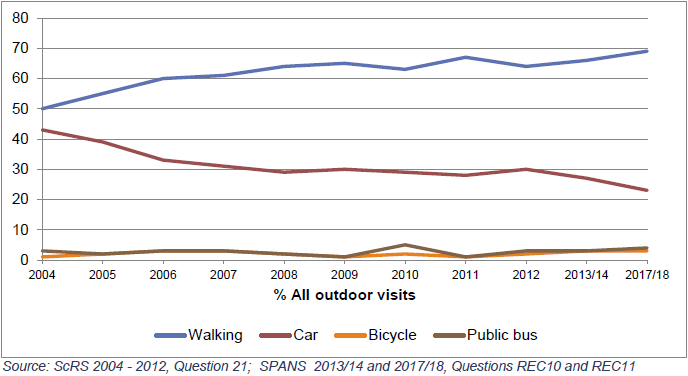
Walking is the main mode of transport used to reach the destination on most visits to the outdoors (69% of the total). In comparison, cars are used on 23% of visits and public buses and bikes are used on 3% and 4% of visits, respectively.
11. The use of paths on outdoor visits
In 2013/14 (this question was not included in SPANS in 2017/18) SPANS estimated that around three quarters of outdoor visits involved the use of a path or path network (76%) and more than half involved the use of paths with signposting or waymarking (58%). The proportions of visits involving the use of paths, and specifically signposted or waymarked paths, was significantly higher in 2013/14 than in the early years of the Scottish Recreation Survey (e.g. 66% and 49% respectively in 2004).
12. Who do people visit the outdoors with?
The proportion of visits taken alone has increased over the last 10 years or so (up from 41% in 2004) and this may be linked to the increase (highlighted previously) in the proportion of shorter duration visits being taken close to home. The average party size on visits to the outdoors in 2013/14 was 2.6 people.
The proportion of visits accompanied by a dog has increased over the last 10 years or so, up from 41% in 2004 to 48% in 2013/14.
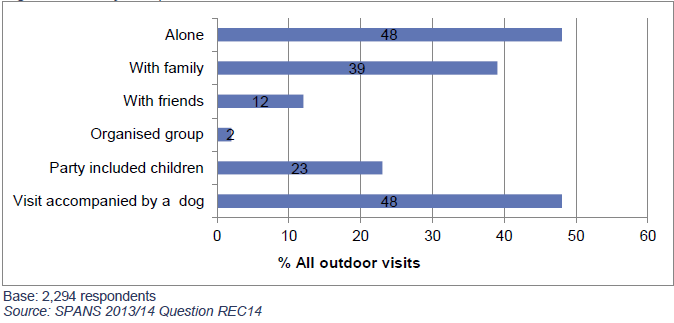
In 2013/14* SPANS estimated that almost half of visits to the outdoors were taken alone (48%), with the next greatest proportion taken in the company of family members (39%). Children were included in the party on 23% of all visits to the outdoors in 2013/14 and on 44% of visits which weren’t taken alone.
* Questions on party composition were not included in SPANS in 2017/18
13. What do people do on outdoor visits?
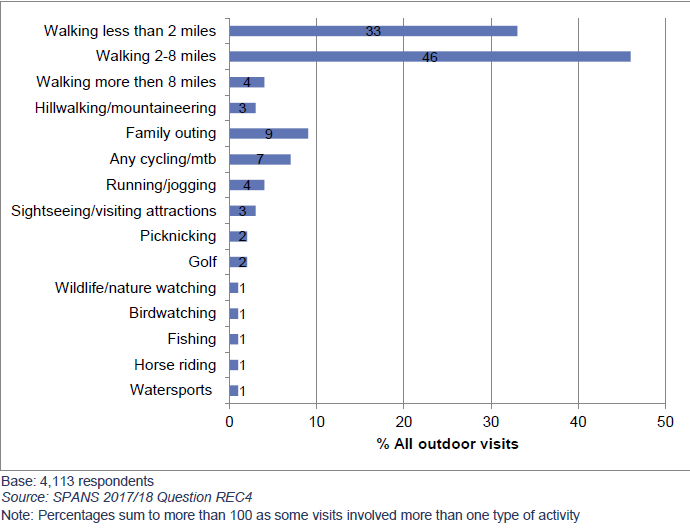
Most visits to the outdoors involve a walk (84%), typically a short walk of up to 2 miles (33% of visits) or a walk of between 2 and 8 miles (46% of visits). Nine per cent of visits are described as family outings and 7% include cycling or mountain biking.
14. What proportion of outdoor visitors experience access problems or witness irresponsible behaviour?
When prompted, a minority of visitors say they have experienced access problems or witnessed irresponsible behaviour on their outdoor visits (31%). Litter, vandalism or graffiti are mentioned most frequently (encountered on 18% of visits).
|
- |
% outdoor visits on which problem encountered |
|---|---|
|
Any problem experienced |
31 |
|
No problem experienced |
69 |
|
Type of problem experienced |
% outdoor visits on which problem encountered |
|
Litter, vandalism, graffiti |
18 |
|
Well used or promoted path in poorer condition than expected (e.g. wet, muddy, overgrown) |
4 |
|
Well used or promoted path was difficult to use (e.g. uneven surface or gradient that caused me problems) |
4 |
|
Other people behaving inconsiderately or irresponsibly (e.g. cyclists failing to consider the needs of walkers) |
4 |
|
A dog annoying me or my party |
3 |
|
Well used or promoted path had insufficient resting/sitting places for my needs |
2 |
|
A sign that made me feel unwelcome or /unsure about what route to take (e.g. ‘Private’, No entry’, ‘Keep out’). |
2 |
|
A man-made obstruction intended to prevent me from taking my planned route (e.g. locked gate on a well-used path or track, barbed wire across a stile) |
2 |
|
A gate or stile which I had difficulty opening or crossing |
2 |
|
I experienced another type of problem |
4 |
Base: 1,337
Source: SPANS 2017/18 Question REC18
Further information about SPANS and other surveys commissioned by NatureScot is available on the NatureScot website.
Published: 2018
