NatureScot Research Report 1337 - Stable isotope analysis of feathers taken from greylag geese on Orkney
Year of publication: 2023
Authors: Jason Newton, Adrian M. I. Roberts, Megan Towers
Cite as: Newton, J., Roberts, A.M.I. and Towers, M. 2023. Stable isotope analysis of feathers taken from greylag geese on Orkney. NatureScot Research Report 1337.
Keywords
greylag goose; stable isotopes; migration; conservation
Background
The purpose of this contract is to estimate the proportion of resident and Icelandic greylag geese that are shot on Orkney while both populations are present during the winter months.
During the winter we cannot distinguish these two groups by visual inspection, but we could expect to be able to differentiate them by assessing their feathers using stable isotope analysis. Feathers are ideal because they are grown in known locations, and are expected to have isotopic signatures related to these locations. Both migrants and residents moult and grow new wing feathers each summer; Icelandic birds grow their wing feathers on Iceland and Orkney birds grow their wing feathers on Orkney.
Orkney holds approximately 20,000 resident greylag geese that breed there each summer. During the autumn, a further 40,000 to 50,000 migratory greylag geese arrive from Iceland to overwinter on Orkney.
Greylag geese are shot on Orkney during the open season, as a quarry species, between September and February.
NatureScot supports an adaptive management pilot on Orkney which aims to reduce the resident greylag goose population in order to reduce agricultural damage. Bag limits to achieve this population reduction are estimated annually using a simple population model. To date, NatureScot has assumed that birds from both the resident and migratory populations are equally likely to be shot during the open season and therefore the sport shooting bag comprises approximately one resident bird to three migratory birds. The purpose of this contract is to test this assumption by establishing the origins of geese shot during the open season and therefore the proportion of resident and migratory birds shot during the winter. We will use this information to update the model and to inform shooting effort on Orkney.
Main findings
- The current training set (sample) of feathers of known origin (i.e. Iceland and Orkney) for isotope analysis is insufficient to inform samples of unknown origin.
- Results so far suggest that hydrogen, carbon and nitrogen isotopes are likely to be the most important for discriminating between the two locations.
- Results so far suggest that sulphur isotopes are possibly of minor use.
- Adults appear to give better separation than juveniles.
- Suggestion to add to the training set in future and to run hydrogen, carbon, and nitrogen isotope analysis only on adult only feathers. This will also cut costs. Statistical modelling could be carried out to assess the size of training set required to produce suitable levels of precision.
Acknowledgements
We would like to thank the hunters who provided carcasses, and Arnor Sigfusson and Helen Aiton for extracting the feathers for analysis.
1. Introduction
1.1. Which isotope systems are likely to be important and what confounding effects are we likely to encounter?
There are several elements which have the potential to be useful to us to discriminate between feather growth on Iceland versus Orkney. All of these are largely untested with respect to these two specific locations but the generalities described below (see also Hobson and Wassenaar, 2008; Newton, 2010) should apply. A second consideration is cost – for instance though it is likely that strontium isotope composition may well distinguish Icelandic feathers from Orcadian ones simply because of the differing geology (mid-ocean ridge basalt compared with Devonian sandstones), the very high cost precludes the use of Strontium isotopes and so will not be discussed further.
Carbon, nitrogen and sulphur isotope analysis can be carried out concurrently on the same samples so these will be discussed first.
Carbon isotopes in the terrestrial environment largely map the proportion of plants which photosynthesise using either the C3 or C4 pathway; this is unlikely to be different between the two locations where C3 photosynthesis predominates both in the environment and as Greylag nutrition. Secondarily there are minor differences which are related to humidity, latitude and altitude (e.g. Körner et al., 1991) which may be more relevant here. One confounding issue is that if the geese forage on marine plants or algae then this will affect carbon (and nitrogen) isotopes.
Nitrogen isotopes in animal tissues largely reflect trophic level (DeNiro and Epstein, 1981), so given that the study species is herbivorous, this is unlikely to be important. More likely, differences in nitrogen isotope composition could be caused by local effects of plant fertilisation, either anthropogenic (e.g. sewage, Constanzo et al., 1991, or agricultural) or natural (e.g. guano, Cross et al., 2014).
Sulphur isotopes are largely conservative with trophic level in food webs, and tend to be indicative largely of the underlying geology. In this respect we envisaged that δ34S would help in discriminating Orkney from Iceland because of their different geological terrains. Again, the likely confounding issue is proximity to the coast: marine-derived sulphate-containing aerosols (i.e. seaspray) may mean that coastal plants appear to have a marine δ34S signature.
Hydrogen isotopes will be measured separately to the aforementioned isotope analyses as it requires a method which is devoid of oxygen. In terms of cost, δ2H is approximately the same as NCS run together on the same sample. However, potentially, hydrogen isotope analysis could be the most interesting, but as with the other elements, the main confounding issue will be the proximity of the ocean. This aside, globally the hydrogen isotope composition of rainwater (and thus all other items in the water cycle and food webs) is ultimately controlled by temperature – given the large latitudinal difference between Orkney and Iceland there is a potential for hydrogen isotopes to be important. Some isotope studies of migratory birds have concluded that δ34S can be used to subtract any effects of marine influence on δ2H (e.g. Lott et al., 2003).
2. Methods
2.1. The feather sample
Isotope measurements were made on feather samples taken from 30 geese each from Iceland and Orkney during the breeding season. Their site was recorded as was their life-stage (adult or juvenile). Here this data set is called the training set. A further set of isotope measurements were to be made on 150 geese shot during autumn/winter 2016. This is labelled the prediction set.
The aim is to estimate the proportion of the geese that are shot during the winter/autumn that were from Iceland based on the isotope data.
The Iceland training set was taken from seven locations around the outer rim of Iceland. The Orkney set comes from three locations, two of which are quite close together on the main island.
2.2. Sample preparation
Samples were rinsed in warm tapwater with 10% concentration Ecover detergent to remove blood and dirt from the feathers. These were dried at 60°C overnight.
Feathers were then briefly agitated in a 2:1 mixture of analytical grade chloroform:methanol. This solvent mixture is a common feature of the isotope analysis of feathers (Paritte and Kelly, 2009), and is designed to remove surface oils and ensure that only keratin is analysed, as opposed to lipid-containing body oils which can have very different isotope compositions.
In what follows, only feather barbs were analysed, not the rachis, again to avoid any non-keratinous compounds.
2.3. NCS isotope analysis
A small section was clipped from the distal end of each feather and weighed (1.3 ± 0.1 mg) into a 5mm (depth) by 3 mm (diameter) tin capsule.
Stable isotope analyses of nitrogen, carbon, and sulphur were performed by continuous flow isotope ratio mass spectrometry, using an Elementar (Hanau, Germany) Pyrocube elemental analyser (EA) interfaced with an Isoprime (Stockport, UK) stable isotope ratio mass spectrometer (IRMS). This system has been set up to measure δ15N, δ13C and δ34S successively in a single sample. The purge and trap technology (Fourel et al., 2014) employed in the EA offers an advantage over conventional EAs in that there is less chance of sulphur isotope “memory” between successive samples. Although perhaps not relevant for a set of pure keratin samples, the general requirement for accurate and precise stable isotope measurements of three elements which may differ greatly in abundance among samples requires a large set of standards which are described as follows.
Three internal laboratory standards are used to normalize raw isotope ratio data, each of which has been designed with the following attributes: soluble in water, to enable easy dispensing into tin capsules, elemental concentrations that match as closely as possible most samples that are measured in the laboratory, and a range of isotope ratios that encompass most samples that are measured in the laboratory. MSAG2 is a mixture of methanesulfonamide and gelatin, and is used to correct “linearity” or the correlation between raw isotope ratio and sample size, as well as “drift” (see Werner and Brand 2001 for full explanation). M2 is a mixture of methionine and gelatin which has been spiked with 15N-enriched alanine. SAAG2 is a mixture of sulfanilamide and gelatin which has been spiked with 13C-enriched alanine.
δ15N and δ13C are calibrated elsewhere against USGS40 (glutamic acid, Qi et al., 2003) international standards. δ34S is anchored to the V-CDT international scale using three silver sulfide standards IAEA-S1, S2 and S3 (Krouse et al., 1997) run in triplicate during the run. MSAG2 run 21 times in the current run has s.d.s of 0.21‰ and 0.13‰ and 0.36‰ for δ15N, δ13C and δ34S respectively.
2.4. Hydrogen isotope analysis
A small section was clipped from the distal end of each feather and weighed (0.12 ± 0.01 mg) into a 5mm (depth) by 3 mm (diameter) silver capsule.
Stable isotope analyses of hydrogen were performed by continuous flow isotope ratio mass spectrometry, using a thermal conversion elemental analyser (TC/EA, Thermo Fisher Scientific, Bremen, Germany) interfaced with a Thermo Fisher Scientific Delta V IRMS.
Since H-N, H-O and H-S bonds can readily exchange hydrogen with ambient water vapour (unlike C-H bonds – Schimmelmann et al., 1999), the standardization of δ2H measurements requires that the samples are accompanied by standards with the same level of hydrogen “exchangeability” (Wassenaar and Hobson, 2000, 2003). In this respect, the standards used are CFS and BWBII (Wassenaar and Hobson, 2003), ISB and WG (Fox et al., 2007). Mineral oil IA-R002 provided by IsoAnalytical Ltd. provides a calibration for the effects of linearity and drift (Werner and Brand, 2001).
Hydrogen isotope analysis was performed after the initial results for nitrogen, carbon, and sulphur did not show sufficient separation (see results).
2.5. Statistical analysis
To test if the apparent separation is enough, several related statistical discrimination methods were used on the training set to assess if the isotopes can be used to discriminate between the geese from Orkney and Iceland. This was with a view to predict the origins of the geese in the prediction set. Details of the methods used are given in Annex 1.
3. Results
3.1. Initial view of the training set
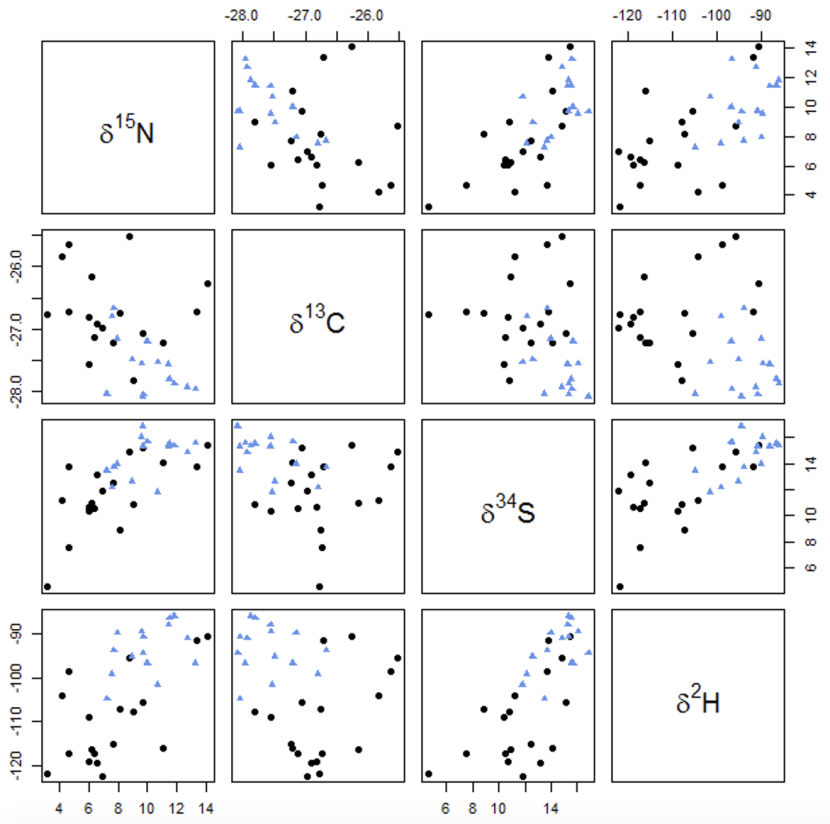
The raw data is given in Annex 2. As expected, the two locations show least overlap when viewed in terms of the hydrogen and carbon isotope ratios (Figure 1) particularly for the adult only feathers (Figure 2), whereas the nitrogen and sulphur isotope ratios appear to be less useful (Figures 1 and 2).
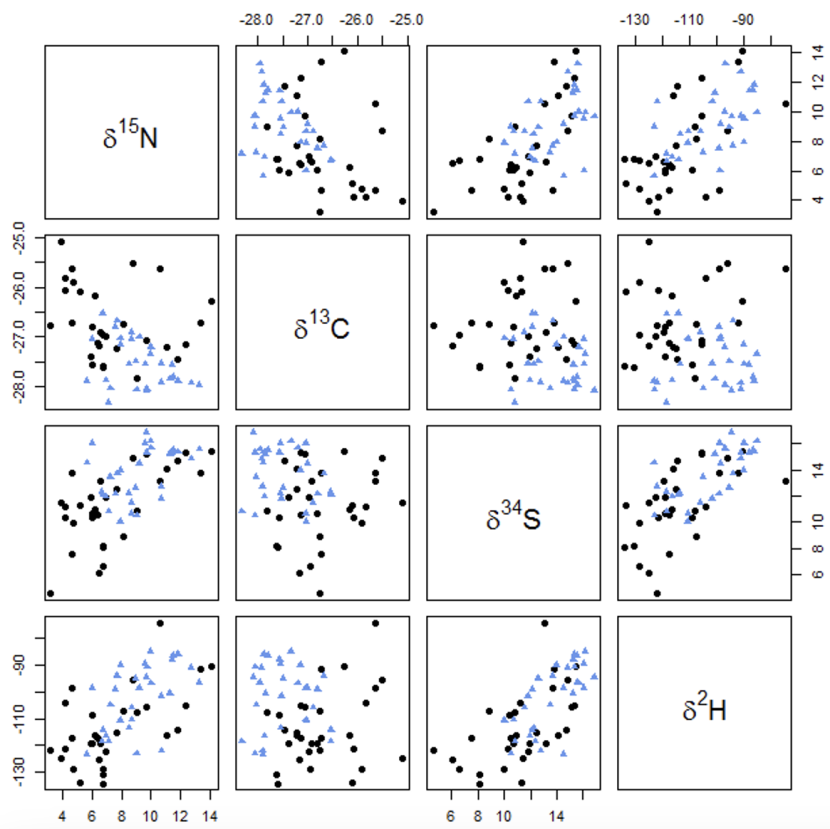
Scatter plots showing isotope ratios of nitrogen (δ15N), carbon (δ13C), sulphur (δ34S), and hydrogen (δ2H) in greylag goose feathers. Icelandic samples are represented by black circles, while Orcadian samples are denoted by blue triangles. The data encompasses both adult and juvenile feathers, and illustrates how similar or different Icelandic and Orcadian geese are.
The first row of graphs shows results for isotopic ratios of (δ15N). The second row of graphs shows results for the isotopic ratios of carbon (δ13C). The third row of graphs shows results for isotopic ratios of (δ34S), and the fourth row shows results for hydrogen (δ2H).
Scatter plots showing isotope ratios of nitrogen (δ15N), carbon (δ13C), sulphur (δ34S), and hydrogen (δ2H) in greylag goose feathers. Icelandic samples are represented by black circles, while Orcadian samples are denoted by blue triangles. The data are taken from adult birds, and illustrate how similar or different the adult Icelandic and Orcadian geese are.
The first row of graphs shows results for isotopic ratios of (δ15N). The second row of graphs shows results for the isotopic ratios of carbon (δ13C). The third row of graphs shows results for isotopic ratios of (δ34S), and the fourth row shows results for hydrogen (δ2H).
3.2. Discrimination analysis on the training set – nitrogen, carbon, and sulphur only
Table 1 shows the cross-validated success rates for the training set for the original analysis using nitrogen, carbon, and sulphur only. Quadratic discrimination offered no benefit over logistic regression or linear discrimination, which have similar success rates. These methods were also used to try to classify individual locations within countries but this did not improve classification on a country-basis. Consequently, once the hydrogen isotope data were available, analysis proceeded using the logistic regression approach and not using the site within country information.
Table 2 shows the cross validated success rates for the training set for the combinations of all feathers or adults only, and all isotopes or nitrogen, carbon and hydrogen only. The logistic regression method was used here and showed that the inclusion / removal of the sulphur isotope had no effect, but using the feathers from adults improved the classification success rates slightly (i.e. the proportion correctly classified as either originating from Iceland or Orkney).
Table 1. Proportion correctly classified in the training set using leave-one-out cross-validation for different methods – nitrogen, carbon, and sulphur only
|
Method |
Iceland |
Orkney |
|---|---|---|
|
Logistic regression |
70.0% |
73.3% |
|
Linear discriminant |
70.0% |
73.3% |
|
Quadratic discriminant |
66.7% |
70.0% |
Although the nitrogen isotope does not have clear separation on its own in figure 2, the results from the leave-one-out logistic regression classifications suggests that the inclusion of nitrogen improves the classification (results not shown) and so the analyses proceeded with the inclusion of nitrogen.
Table 2. Proportion correctly classified in the training set using leave-one-out cross-validation for different groups of feathers and isotopes – using the logistic regression method. N=nitrogen, C=carbon, H=hydrogen, S=sulphur.
|
Age class |
Isotopes used |
Iceland |
Orkney |
Overall |
|---|---|---|---|---|
|
Adults and juveniles |
N, C, and H |
86.7% |
80.0% |
83.3% |
|
Adults and juveniles |
N, C, H and S |
86.7% |
80.0% |
83.3% |
|
Adults only* |
N, C, and H* |
88.9% |
86.7% |
87.9% |
|
Adults only* |
N, C, H and S* |
88.9% |
86.7% |
87.9% |
* This combination produced warnings that were due to the perfect discrimination for some feathers.
3.3. Using logistic regression to predict the proportion of geese from Iceland in simulated prediction sets – nitrogen, carbon, sulphur and hydrogen
The initial leave-one-out cross-validation success rates suggested that adult only feathers gave slightly better discrimination than using all the feathers, but caution must be applied as the resulting data set was very small (33 feathers). This initial analysis also suggested that sulphur didn’t help the discrimination. To test both of these, the following analyses were performed on both adults and all feathers, with and without sulphur.
In the simulated prediction sets, the proportion of birds actually from Iceland (termed ‘assumed proportion’ here) was set to 50%, 70%, 80% or 90%. There are 16 combinations of all of these factors:
- No sulphur; adults and juveniles; 50% from Iceland
- No sulphur; adults and juveniles; 70% from Iceland
- No sulphur; adults and juveniles; 80% from Iceland
- No sulphur; adults and juveniles; 90% from Iceland
- No sulphur; adults only; 50% from Iceland
- No sulphur; adults only; 70% from Iceland
- No sulphur; adults only; 80% from Iceland
- No sulphur; adults only; 90% from Iceland
- All isotopes; adults and juveniles; 50% from Iceland
- All isotopes; adults and juveniles; 70% from Iceland
- All isotopes; adults and juveniles; 80% from Iceland
- All isotopes; adults and juveniles; 90% from Iceland
- All isotopes; adults only; 50% from Iceland
- All isotopes; adults only; 70% from Iceland
- All isotopes; adults only; 80% from Iceland
- All isotopes; adults only; 90% from Iceland
Estimated probabilities for 3 sets of bootstrap samples for each combination (simulating prediction sets of size 150) are shown in figure 3.
Simulations of the adults only set for all isotopes resulted in appalling predictions (combinations 13-16). All estimated proportions were over 97% from Iceland, regardless of the assumed proportions.
Other than for combination 13, when the ‘assumed proportion’ was 50% both age classes and isotope combinations (combinations 1, 5, and 9) produced reasonable results.
For ‘assumed proportions’ of 70% and over, the adult only set always over-estimated the proportion from Iceland (combinations 6-8 and 14-16), which could be related to the perfect classification that was seen from the leave-one-out linear discrimination.
Also for ‘assumed proportion’ of 70% and over, the adult and juvenile set (combinations 2-4 and 10-12), produced reasonable estimates.
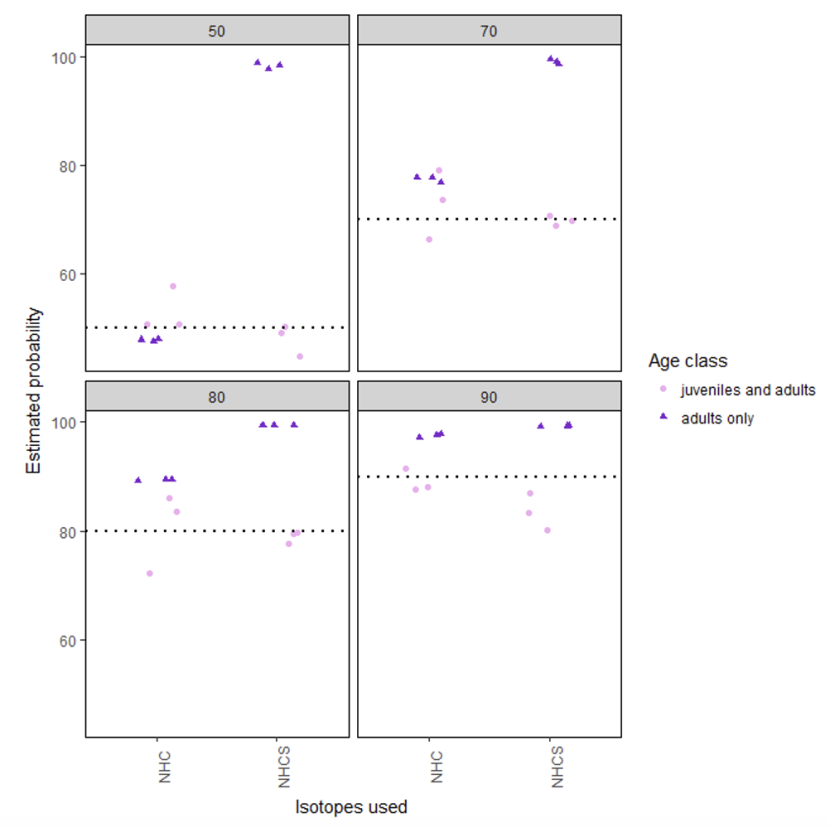
These graphs show estimated probabilities for samples being from Iceland from the various simulations (details given in tables 3-6). Strip titles give the assumed proportions which are also shown graphically as the black dotted lines on the y axis. Predicted probability for samples containing both juvenile and adult birds are shown as pink circles. Predicted probability for samples of adult only birds are shown as purple triangles. Points have been jittered horizontally to allow all points to be seen more clearly. On the x axis NHC = nitrogen, hydrogen, and carbon and NHCS = nitrogen, hydrogen, carbon and sulphur.
Three bootstrap samples are used to estimate the probability of samples being from Iceland for each combination of all feathers or adult feathers only, for nitrogen, carbon and hydrogen samples with and without sulphur, and for an assumed proportion of 50%, 70%, 80% and 90% of the sample coming from Iceland.
4. Conclusions
Adult feathers seemed to give a slightly better classification rates from the leave-one-out logistic regressions. However, the adult only set performed poorly in the simulations. The level of performance would result in inaccurate estimates of the proportion of geese shot in the winter from Iceland or Orkney. This could be in part due to the small size of this set. Analysing a larger set of adult only feathers would help to confirm this or rule it out as a possibility. It is possible that further simulation work may also help to illuminate the reasons for poor levels of precision.
From the initial leave-one-out classification, it appeared that the inclusion of carbon, hydrogen, and nitrogen increased the classification success rates, whereas the inclusion of sulphur had no effect. This was also reflected in the simulation results. It is possible that the sulphur isotopes are quite variable between sites within Iceland as some sites would be more affected by sea spray than others.
For the juveniles and adults set, the results were reasonable in terms of the bias but the prediction intervals are wide.
The leave-one-out analysis suggests that an adult only set might have a more promising separation, but this was not reflected in the simulations, which could be due to the perfect discrimination seen for some feathers, or it may be that the resulting relatively small size of the adult only set had better results by chance. A better idea of the range of isotopes in an adult only set could enable us to better understand this and might produce a training set with more a promising discrimination. Further statistical analysis could estimate what sample size would be needed for both the training and prediction sets.
5. References
Costanzo S.D., O'Donohue M.J., Dennison W.C., Loneragan N.R. and Thomas M. 2001. A new approach for detecting and mapping sewage impacts. Marine Pollution Bulletin, 42, 149–156. doi: 10.1016/S0025-326X(00)00125-9.
DeNiro M.J. and Epstein S. 1981. Influence of diet on the distribution of nitrogen isotopes in animals. Geochimica et Cosmochimica Acta, 45, 341–351.
Do K. and McLachlan G.J. 1984. Estimation of Mixing Proportions: A Case Study. Applied Statistics, 33, 134–140.
Cross A.D.P., Hentati-Sundberg J., Österblom H., McGill R.A.R. and Furness R.W. 2014. Isotopic analysis of island House Martins Delichon urbica indicates marine provenance of nutrients. The Ibis, 156(3), 676-681. doi: 10.1111/ibi.12150.
Fourel, F., Martineau, F., Seris, M. and Lécuyer, C. 2014. Simultaneous N, C, S stable isotope analyses using a new purge and trap elemental analyzer and an isotope ratio mass spectrometer. Rapid Commun. Mass Spectrom, 28, 2587–2594. doi: 10.1002/rcm.7048.
Fox T. (A.D.), Christensen T.K., Bearhop S. and Newton J. 2007. Using stable isotope analysis of multiple feather tracts to identify moulting provenance of vagrant birds: a case study of Baikal Teal Anas formosa in Denmark. Ibis, 149, 622–625. doi: 10.1111/j.1474-919X.2007.00672.x.
Hobson K.A. and Wassenaar L.I. 2008. Tracking Animal Migration with Stable Isotopes. Terrestrial Ecology, 2, 1–144, Elsevier. ISBN: 978-0-12-373867-7.
Körner, C., Farquhar, G.D. and Wong, S.C. 1991. Carbon isotope discrimination by plants follows latitudinal and altitudinal trends. Oecologia 88, 30–40. doi: 10.1007/BF00328400.
Krouse, H.R. and Coplen, T.B. 1997. Reporting of Relative Sulfur Isotope-Ratio Data; Pure and Applied Chemistry, 69(2), 293–295.
Lott, C., Meehan, T. and Julie A. Heath. 2003. Estimating the Latitudinal Origins of Migratory Birds Using Hydrogen and Sulfur Stable Isotopes in Feathers: Influence of Marine Prey Base. Oecologia, 134(4), 505–510. doi: 10.1007/s00442-002-1153-8.
Newton, J. 2016. Stable isotopes as tools in ecological research. In: eLS: Encylopedia of Life Sciences. Wiley, 1–8. ISBN 9780470015902.
Paritte, J.M. and Kelly, J.F. 2009. Effect of cleaning regime on stable-isotope ratios of feathers in Japanese quail (Coturnix japonica). Auk, 126, 165–174
Qi, H., Coplen, T.B., Geilmann, H., Brand, W.A. and Böhlke, J.K. 2003. Two new organic reference materials for δ13C and δ15N measurements and a new value for the δ13C of NBS 22 oil. Rapid Communications in Mass Spectrometry, 17, 2483–2487. doi: 10.1002/rcm.1219.
Schimmelmann A., Lewan M. D. and Wintsch R. P. 1999. D/H isotope ratios of kerogen, bitumen, oil, and water in hydrous pyrolysis of source rocks containing kerogen types I, II, IIS, and III. Geochimica et Cosmochimica Acta, 63, 3751–3766.
Wassenaar L.I. and Hobson K.A. 2003. Comparative equilibration and online technique for determination of non-exchangeable hydrogen of keratins for use in animal migration studies. Isotopes in Environmental and Health Studies, 39, 211–217. doi: 10.1080/1025601031000096781.
Wassenaar L.I. and Hobson K.A. 2000. Improved method for determining the stable-hydrogen isotopic composition (δD) of complex organic materials of environmental interest. Environmental Science and Technology, 34, 2354–2360.
Werner, R.A. and Brand, W.A. 2001. Referencing strategies and techniques in stable isotope ratio analysis. Rapid Communications in Mass Spectrometry, 15, 501–519. doi: 10.1002/rcm.25.
Annex 1. Statistical Discrimination methods
The discrimination methods used were: linear discrimination, logistic regression and quadratic discrimination.
Leave-one-out cross-validation provides an unbiased estimate of success rates for classifying Icelandic and Orkney geese, used for the bias correction (see below).
Subsequent to this, logistic regression was selected to provide predictions for the geese shot in winter/autumn of unknown origins. A Bayesian framework was used to calculate prediction intervals for the proportion of geese from Iceland. Prediction intervals give a range of likely values for the proportion, with the width of this interval reflecting the precision of the process used.
Computer simulations were carried out to evaluate how well the method would work, given the quality of relationship between the isotopes and the origin of the geese as well as the sample sizes.
Further detail:
- A Bayesian calibration and prediction model was set up in JAGS using logistic regression. Logistic regression is simpler to set up in such a framework and gave as good cross-validation results in the training set as the other discrimination methods assessed (see results). A Bayesian framework was used because it is more straightforward to allow for different sources of error. The prediction model has the following elements:
- Estimation of the proportion of birds from Iceland is based on the proportion of birds classified as from Iceland
- The estimate of the proportion is biased. This is relatively easy to show and is due to the imperfect classification seen in the training set (Do & McLachlan, 1984). The worse the classification the worse the bias towards a 50% proportion.
- This bias is corrected using the estimated classification success rates, incorporating sampling error.
- A beta(1,1) distribution provides an uninformative prior for the proportion of birds from Iceland.
- The MCMC simulation in JAGS used a burn-in of 10,000 iterations followed by a further 1,000,000 iterations.
To assess the ability of the four given isotopes to predict the proportion of geese from Iceland in the prediction set (which was not available at the time), bootstrap samples of size 150 were generated from the training set with different proportions of geese from Iceland set. There is a technical issue here of using the training set to simulate a prediction set, which may be the cause of some of the problems, but the number of feathers from known origin is not large enough to split into training and prediction sets.
Annex 2. Stable isotope composition of training set
|
Site |
Location |
Coordinates |
Adult/Juv |
d15N |
d13C |
d34S |
d2H |
|---|---|---|---|---|---|---|---|
|
Dalsmynni |
Iceland |
64°50.661'N,22°25.061'W |
a |
14.11 |
-26.27 |
15.39 |
-90.53 |
|
Dalsmynni |
Iceland |
64°50.661'N,22°25.061'W |
a |
13.39 |
-26.72 |
13.80 |
-91.66 |
|
Dalsmynni |
Iceland |
64°50.661'N,22°25.061'W |
j |
11.78 |
-27.46 |
14.70 |
-114.37 |
|
Dalsmynni |
Iceland |
64°50.661'N,22°25.061'W |
j |
12.32 |
-27.14 |
15.31 |
-105.21 |
|
Saudholt |
Iceland |
63°52.247'N,20°40.494'W |
j |
4.18 |
-26.07 |
10.30 |
-121.45 |
|
Saudholt |
Iceland |
63°52.247'N,20°40.494'W |
j |
4.72 |
-25.91 |
9.95 |
-128.79 |
|
Saudholt |
Iceland |
63°52.247'N,20°40.494'W |
j |
5.91 |
-27.39 |
11.94 |
-119.20 |
|
Saudholt |
Iceland |
63°52.247'N,20°40.494'W |
a |
4.22 |
-25.83 |
11.17 |
-104.16 |
|
Vorsabaer, Ölfus |
Iceland |
63°58.880'N,21°10.264'W |
j |
6.79 |
-27.62 |
8.15 |
-130.87 |
|
Vorsabaer, Ölfus |
Iceland |
63°58.880'N,21°10.264'W |
j |
6.79 |
-27.60 |
8.10 |
-134.29 |
|
Vorsabaer, Ölfus |
Iceland |
63°58.880'N,21°10.264'W |
a |
8.16 |
-26.75 |
8.89 |
-107.28 |
|
Vorsabaer, Ölfus |
Iceland |
63°58.880'N,21°10.264'W |
a |
9.00 |
-27.82 |
10.84 |
-107.86 |
|
Grenstangi, Landeyjar |
Iceland |
63°37.931'N,20°6.304'W |
j |
6.71 |
-26.95 |
6.57 |
-128.70 |
|
Grenstangi, Landeyjar |
Iceland |
63°37.931'N,20°6.304'W |
j |
6.50 |
-27.17 |
6.06 |
-125.19 |
|
Grenstangi, Landeyjar |
Iceland |
63°37.931'N,20°6.304'W |
a |
6.06 |
-27.56 |
10.37 |
-108.89 |
|
Grenstangi, Landeyjar |
Iceland |
63°37.931'N,20°6.304'W |
a |
4.68 |
-26.73 |
7.50 |
-117.31 |
|
Grenstangi, Landeyjar |
Iceland |
63°37.931'N,20°6.304'W |
a |
3.20 |
-26.77 |
4.57 |
-121.94 |
|
Breidavad, Egilsstadir |
Iceland |
65°19.861'N,14°22.849'W |
j |
3.93 |
-25.09 |
11.43 |
-124.96 |
|
Breidavad, Egilsstadir |
Iceland |
65°19.861'N,14°22.849'W |
j |
5.15 |
-26.10 |
11.28 |
-133.85 |
|
Breidavad, Egilsstadir |
Iceland |
65°19.861'N,14°22.849'W |
a |
6.40 |
-27.13 |
10.52 |
-117.37 |
|
Breidavad, Egilsstadir |
Iceland |
65°19.861'N,14°22.849'W |
a |
6.03 |
-26.81 |
10.65 |
-119.05 |
|
Vallholmi, Skagafjördur |
Iceland |
65°34.141'N,19°25.992'W |
a |
6.96 |
-26.98 |
11.88 |
-122.34 |
|
Vallholmi, Skagafjördur |
Iceland |
65°34.141'N,19°25.992'W |
j |
10.57 |
-25.64 |
13.08 |
-74.35 |
|
Vallholmi, Skagafjördur |
Iceland |
65°34.141'N,19°25.992'W |
a |
6.21 |
-26.16 |
10.94 |
-116.41 |
|
Vallholmi, Skagafjördur |
Iceland |
65°34.141'N,19°25.992'W |
a |
6.57 |
-26.91 |
13.18 |
-119.47 |
|
Vallholmi, Skagafjördur |
Iceland |
65°34.141'N,19°25.992'W |
a |
7.69 |
-27.23 |
12.46 |
-115.17 |
|
Runna, Berufjördur |
Iceland |
64°43.246'N,14°19.909'W |
a |
4.65 |
-25.64 |
13.71 |
-98.72 |
|
Runna, Berufjördur |
Iceland |
64°43.246'N,14°19.909'W |
a |
9.73 |
-27.06 |
15.17 |
-105.46 |
|
Runna, Berufjördur |
Iceland |
64°43.246'N,14°19.909'W |
a |
11.10 |
-27.21 |
14.09 |
-116.07 |
|
Runna, Berufjördur |
Iceland |
64°43.246'N,14°19.909'W |
a |
8.75 |
-25.52 |
14.85 |
-95.64 |
|
Stronsay |
Orkney |
- |
j |
8.66 |
-26.90 |
11.51 |
-105.84 |
|
Stronsay |
Orkney |
- |
j |
9.19 |
-27.00 |
14.50 |
-98.42 |
|
Stronsay |
Orkney |
- |
j |
5.99 |
-27.04 |
16.04 |
-98.68 |
|
Stronsay |
Orkney |
- |
j |
11.28 |
-27.84 |
15.23 |
-100.56 |
|
Stronsay |
Orkney |
- |
j |
9.98 |
-27.34 |
16.19 |
-85.04 |
|
Stronsay |
Orkney |
- |
a |
12.73 |
-27.93 |
14.82 |
-91.07 |
|
Stronsay |
Orkney |
- |
a |
11.48 |
-27.80 |
15.52 |
-86.45 |
|
Stronsay |
Orkney |
- |
a |
11.83 |
-27.88 |
15.36 |
-86.04 |
|
Stronsay |
Orkney |
- |
a |
7.70 |
-26.67 |
13.71 |
-93.87 |
|
Stronsay |
Orkney |
- |
a |
7.95 |
-27.15 |
13.95 |
-89.85 |
|
Swartland |
Orkney |
- |
a |
9.70 |
-28.08 |
16.84 |
-94.40 |
|
Swartland |
Orkney |
- |
a |
7.55 |
-26.80 |
12.14 |
-99.10 |
|
Swartland |
Orkney |
- |
a |
8.94 |
-27.49 |
12.60 |
-95.14 |
|
Swartland |
Orkney |
- |
a |
10.70 |
-27.53 |
11.78 |
-101.57 |
|
Swartland |
Orkney |
- |
a |
9.57 |
-27.55 |
16.04 |
-89.59 |
|
Swartland |
Orkney |
- |
j |
6.76 |
-26.53 |
12.12 |
-114.25 |
|
Swartland |
Orkney |
- |
j |
6.64 |
-26.54 |
12.32 |
-118.56 |
|
Swartland |
Orkney |
- |
j |
6.91 |
-27.87 |
11.93 |
-116.46 |
|
Swartland |
Orkney |
- |
j |
7.91 |
-27.03 |
10.02 |
-110.67 |
|
Swartland |
Orkney |
- |
j |
8.67 |
-27.04 |
10.67 |
-110.38 |
|
Moan |
Orkney |
- |
a |
7.25 |
-28.04 |
13.47 |
-104.85 |
|
Moan |
Orkney |
- |
a |
13.25 |
-27.96 |
15.58 |
-96.64 |
|
Moan |
Orkney |
- |
a |
9.72 |
-28.05 |
15.32 |
-90.74 |
|
Moan |
Orkney |
- |
a |
11.42 |
-27.56 |
15.28 |
-87.95 |
|
Moan |
Orkney |
- |
a |
10.00 |
-27.20 |
15.69 |
-96.75 |
|
Moan |
Orkney |
- |
j |
5.63 |
-27.89 |
14.51 |
-123.33 |
|
Moan |
Orkney |
- |
j |
7.14 |
-28.32 |
10.80 |
-118.42 |
|
Moan |
Orkney |
- |
j |
9.00 |
-28.06 |
10.48 |
-123.13 |
|
Moan |
Orkney |
- |
j |
10.70 |
-27.91 |
12.75 |
-122.12 |
|
Moan |
Orkney |
- |
j |
8.51 |
-27.55 |
12.20 |
-113.36 |
Annex 3. Bayesian prediction intervals for all bootstrapped samples
Table 3. Prediction intervals for bootstrap samples (proportions from Iceland) – no sulphur isotope (nitrogen, carbon, and hydrogen) – all feathers
|
Bootstrap sample |
Assumed proportion |
Estimated proportion |
95% prediction interval - Lower limit |
95% prediction interval - Upper limit |
|---|---|---|---|---|
|
(i) |
50% |
50.6% |
21.8% |
73.1% |
|
(ii) |
50% |
50.6% |
24.4% |
73.4% |
|
(iii) |
50% |
57.8% |
32.0% |
80.5% |
|
(iv) |
70% |
66.3% |
42.5% |
89.1% |
|
(v) |
70% |
79.1% |
55.7% |
99.5% |
|
(vi) |
70% |
73.5% |
45.8% |
98.4% |
|
(vii) |
80% |
72.2% |
50.3% |
99.5% |
|
(viii) |
80% |
83.4% |
56.9% |
99.8% |
|
(ix) |
80% |
86.0% |
60.6% |
99.9% |
|
(x) |
90% |
91.4% |
66.1% |
100% |
|
(xi) |
90% |
88.2% |
65.7% |
99.9% |
|
(xii) |
90% |
87.5% |
57.4% |
99.9% |
Table 4. Prediction intervals for bootstrap samples (proportions from Iceland) – all isotopes (nitrogen, carbon, sulphur and hydrogen) – all feathers
|
Bootstrap sample |
Assumed proportion |
Estimated proportion |
95% prediction interval - Lower limit |
95% prediction interval - Upper limit |
|---|---|---|---|---|
|
(i) |
50% |
44.7% |
22.4% |
65.6% |
|
(ii) |
50% |
50.3% |
27.3% |
72.6% |
|
(iii) |
50% |
49.2% |
25.4% |
71.7% |
|
(iv) |
70% |
70.7% |
45.9% |
96.7% |
|
(v) |
70% |
68.8% |
46.6% |
91.7% |
|
(vi) |
70% |
69.6% |
41.9% |
97.8% |
|
(vii) |
80% |
77.6% |
54.1% |
99.5% |
|
(viii) |
80% |
79.5% |
55.7% |
99.6% |
|
(ix) |
80% |
79.7% |
54.7% |
99.7% |
|
(x) |
90% |
87.0% |
62.7% |
99.9% |
|
(xi) |
90% |
80.2% |
52.8% |
99.8% |
|
(xii) |
90% |
83.4% |
55.8% |
99.9% |
Table 5. Prediction intervals for bootstrap samples (proportions from Iceland) – no sulphur isotope (nitrogen, carbon, and hydrogen) – adult feathers only
|
Bootstrap sample |
Assumed proportion |
Estimated proportion |
95% prediction interval - Lower limit |
95% prediction interval - Upper limit |
|---|---|---|---|---|
|
(i) |
50% |
48.0% |
23.3% |
70.3% |
|
(ii) |
50% |
47.8% |
23.0% |
69.7% |
|
(iii) |
50% |
47.5% |
22.3% |
69.6% |
|
(iv) |
70% |
76.8% |
56.8% |
99.5% |
|
(v) |
70% |
77.7% |
58.3% |
99.6% |
|
(vi) |
70% |
77.6% |
58.1% |
99.6% |
|
(vii) |
80% |
89.1% |
71.8% |
99.9% |
|
(viii) |
80% |
89.5% |
72.6% |
99.9% |
|
(ix) |
80% |
89.5% |
73.0% |
99.9% |
|
(x) |
90% |
97.5% |
86.9% |
100% |
|
(xi) |
90% |
97.1% |
84.0% |
100% |
|
(xii) |
90% |
97.8% |
88.6% |
100% |
Table 6. Prediction intervals for bootstrap samples (proportions from Iceland) – all isotopes (nitrogen, carbon, sulphur and hydrogen) – adult feathers only
|
Bootstrap sample |
Assumed proportion |
Estimated proportion |
95% prediction interval - Lower limit |
95% prediction interval - Upper limit |
|---|---|---|---|---|
|
(i) |
50% |
98.4% |
90.6% |
100% |
|
(ii) |
50% |
98.7% |
92.0% |
100% |
|
(iii) |
50% |
97.5% |
86.7% |
100% |
|
(iv) |
70% |
98.9% |
94.2% |
100% |
|
(v) |
70% |
99.3% |
97.3% |
100% |
|
(vi) |
70% |
98.5% |
90.9% |
100% |
|
(vii) |
80% |
99.3% |
97.4% |
100% |
|
(viii) |
80% |
99.3% |
97.5% |
100% |
|
(ix) |
80% |
99.3% |
97.0% |
100% |
|
(x) |
90% |
99.2% |
96.4% |
100% |
|
(xi) |
90% |
99.3% |
97.4% |
100% |
|
(xii) |
90% |
99.3% |
97.3% |
99.8% |
